EC4100: Global Imbalances Philip R. Lane, TCD April 2010 Philip R. Lane, TCD () EC4100: Global Imbalances April 2010 1/9

Welcome message from author
This document is posted to help you gain knowledge. Please leave a comment to let me know what you think about it! Share it to your friends and learn new things together.
Transcript
EC4100: Global Imbalances
Philip R. Lane, TCD
April 2010
Philip R. Lane, TCD () EC4100: Global Imbalances April 2010 1 / 9

Global Imbalances
Increased dispersion in current account balances
Increased persistence in current account balances
Analytical issues
Policy issues
Philip R. Lane, TCD () EC4100: Global Imbalances April 2010 2 / 9

Narrative History
1996-2000: Di¤erences in perceived pro�tability
2001-2004: Declining US Saving
2005-2008: Asset Booms and Busts; Commodity price boom
2009-2010: contraction in CA positions
2011- : projected widening in imbalances
Philip R. Lane, TCD () EC4100: Global Imbalances April 2010 3 / 9

24
Figure 1. Global Imbalances, 1996-2008
Note: Current account balances (in percent of world GDP). Source: World Economic Outlook, October 2009. The composition of country groups is as follows: EUR surplus: Austria, Belgium, Denmark, Finland, Germany, Luxembourg, Netherlands, Sweden, Switzerland. EUR deficit: Greece, Ireland, Italy, Portugal, Spain, United Kingdom, Bulgaria, Czech Republic, Estonia, Hungary, Latvia, Lithuania, Poland, Romania, Slovak Republic, Turkey, Ukraine. Emerging Asia: Hong Kong S.A.R. of China, Indonesia, Korea, Malaysia, Philippines, Singapore, Taiwan province of China, Thailand. Oil exporters: Algeria, Angola, Azerbaijan, Bahrain, Republic of Congo, Ecuador, Equatorial Guinea, Gabon, Iran, Kazakhstan, Kuwait, Libya, Nigeria, Norway, Oman, Qatar, Russia, Saudi Arabia, Sudan, Syria, Trinidad and Tobago, United Arab Emirates, Venezuela, Yemen. Rest of the world: remaining countries.
Global Imbalances(percent of world GDP)
-3
-2
-1
0
1
2
3
4
1996 1997 1998 1999 2000 2001 2002 2003 2004 2005 2006 2007 2008
US JPN Eur surplus CHN EMA OIL ROW Eur deficit Discrepancy
7
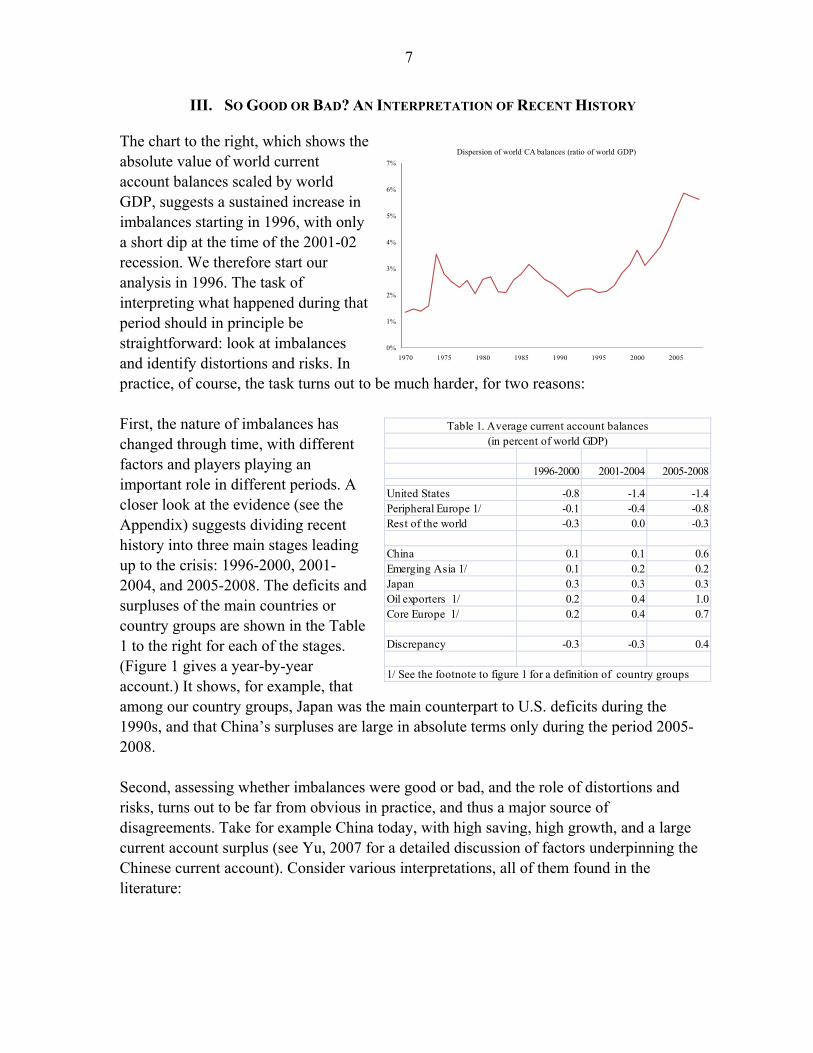
III. SO GOOD OR BAD? A ITERPRETATIO OF RECET HISTORY
The chart to the right, which shows the absolute value of world current account balances scaled by world GDP, suggests a sustained increase in imbalances starting in 1996, with only a short dip at the time of the 2001-02 recession. We therefore start our analysis in 1996. The task of interpreting what happened during that period should in principle be straightforward: look at imbalances and identify distortions and risks. In practice, of course, the task turns out to be much harder, for two reasons: First, the nature of imbalances has changed through time, with different factors and players playing an important role in different periods. A closer look at the evidence (see the Appendix) suggests dividing recent history into three main stages leading up to the crisis: 1996-2000, 2001-2004, and 2005-2008. The deficits and surpluses of the main countries or country groups are shown in the Table 1 to the right for each of the stages. (Figure 1 gives a year-by-year account.) It shows, for example, that among our country groups, Japan was the main counterpart to U.S. deficits during the 1990s, and that China�’s surpluses are large in absolute terms only during the period 2005-2008. Second, assessing whether imbalances were good or bad, and the role of distortions and risks, turns out to be far from obvious in practice, and thus a major source of disagreements. Take for example China today, with high saving, high growth, and a large current account surplus (see Yu, 2007 for a detailed discussion of factors underpinning the Chinese current account). Consider various interpretations, all of them found in the literature:
0%
1%
2%
3%
4%
5%
6%
7%
1970 1975 1980 1985 1990 1995 2000 2005
Dispersion of world CA balances (ratio of world GDP)
1996-2000 2001-2004 2005-2008
United States -0.8 -1.4 -1.4Peripheral Europe 1/ -0.1 -0.4 -0.8Rest of the world -0.3 0.0 -0.3
China 0.1 0.1 0.6Emerging Asia 1/ 0.1 0.2 0.2Japan 0.3 0.3 0.3Oil exporters 1/ 0.2 0.4 1.0Core Europe 1/ 0.2 0.4 0.7
Discrepancy -0.3 -0.3 0.4
1/ See the footnote to figure 1 for a definition of country groups
Table 1. Average current account balances(in percent of world GDP)
29
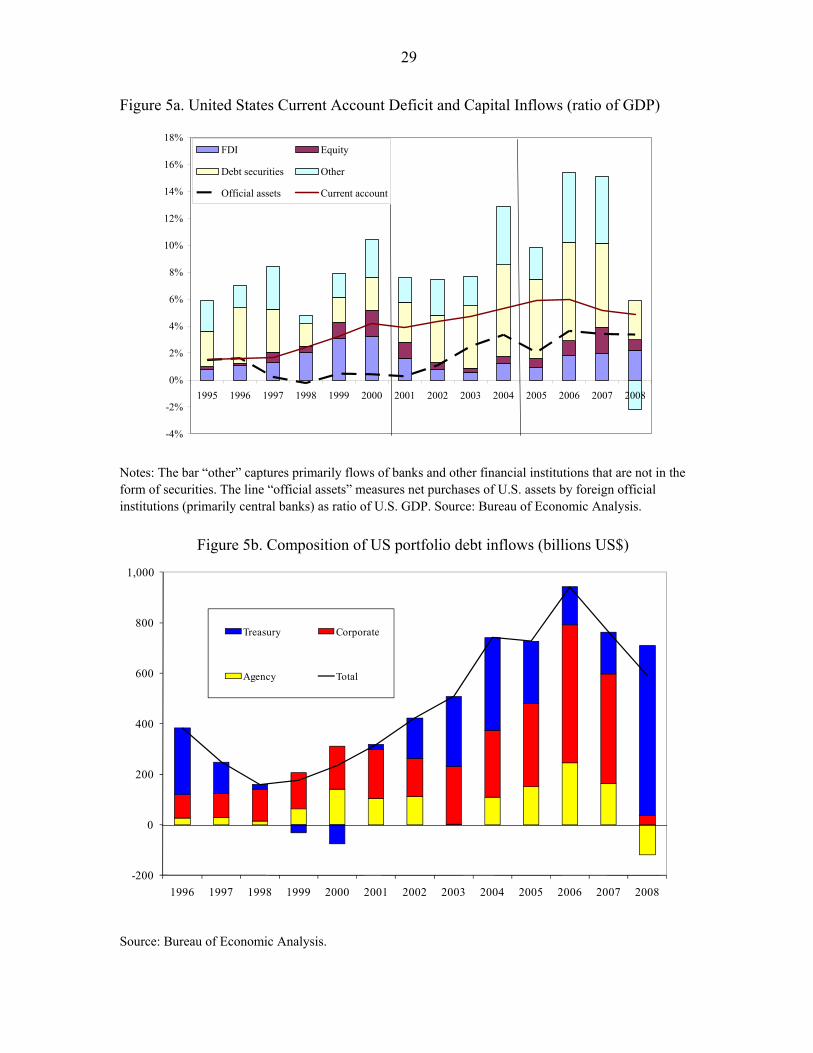
Figure 5a. United States Current Account Deficit and Capital Inflows (ratio of GDP)
Notes: The bar �“other�” captures primarily flows of banks and other financial institutions that are not in the form of securities. The line �“official assets�” measures net purchases of U.S. assets by foreign official institutions (primarily central banks) as ratio of U.S. GDP. Source: Bureau of Economic Analysis.
Figure 5b. Composition of US portfolio debt inflows (billions US$)
Source: Bureau of Economic Analysis.
-4%
-2%
0%
2%
4%
6%
8%
10%
12%
14%
16%
18%
1995 1996 1997 1998 1999 2000 2001 2002 2003 2004 2005 2006 2007 2008
FDI Equity
Debt securities Other
Official assets Current account
-200
0
200
400
600
800
1,000
1996 1997 1998 1999 2000 2001 2002 2003 2004 2005 2006 2007 2008
Treasury Corporate
Agency Total

The Crisis that Did Not Happen (Yet)
Until 2007, fear was run on the dollar
During 2008, dollar appreciated
shift out of sub-prime, agency, ABS bondsbig demand for treasury bills
The next crisis?
Philip R. Lane, TCD () EC4100: Global Imbalances April 2010 4 / 9

A Model of Saving and Investment in the World Economy
Two-country world economy
World real interest rate rW
S and S� independent of rw ; I and I � negative in rW
CA(rW ) = S � I (rW )CA�(rW ) = S� � I �(rW )
Adding-up condition
CA(rW ) + CA�(rW ) = 0
S + S� = I (rW ) + I �(rW )
SW = IW (rW )
Philip R. Lane, TCD () EC4100: Global Imbalances April 2010 5 / 9

Comparative Statics
Positive shock to S�
Positive shock to I
Common shock to I , I � or S ,S�
Philip R. Lane, TCD () EC4100: Global Imbalances April 2010 6 / 9

Figure 22.9 Saving and Investment Feenstra and Taylor: International Economics, First Edition Copyright © 2008 by Worth Publishers

Figure 22.10 Saving and Investment in a Two-Country Model Feenstra and Taylor: International Economics, First Edition Copyright © 2008 by Worth Publishers

Figure 22.11 Increase in Foreign Savings Feenstra and Taylor: International Economics, First Edition Copyright © 2008 by Worth Publishers

Figure 22.12 Increase in Home Investment Feenstra and Taylor: International Economics, First Edition Copyright © 2008 by Worth Publishers

The Savings Glut
Decline in rW
Decline in global S , I
Implication: negative shift in global investment
Philip R. Lane, TCD () EC4100: Global Imbalances April 2010 7 / 11

Debtors, Creditors and the Long-Run Budget Constraint
Sequence of CA surpluses �! accumulation of positive externalwealth
Sequence of CA de�cits �! accumulation of negative externalwealth
[Exception - if valuation e¤ects move in o¤setting direction]
In a steady stateCA = 0) TB = �rWW
Creditors run TB de�cits; Debtors run TB surpluses
Philip R. Lane, TCD () EC4100: Global Imbalances April 2010 7 / 10

The Transfer Problem
Improvement in trade balance: RER depreciation required?
�Immaculate transfer� - no RER change
In general, RER depreciation
NT sectorhome bias in spending on tradablespricing to market and level of domestic spendingscale of RER adjustment bigger for larger economiesNER versus relative in�ation in RER adjustment�Sudden stop�versus �soft landing�adjustment paths
Philip R. Lane, TCD () EC4100: Global Imbalances April 2010 7 / 9

Figure 22.16 Real Exchange Rates and the Trade Balance Feenstra and Taylor: International Economics, First Edition Copyright © 2008 by Worth Publishers

Policy Issues
Increased domestic spending in surplus countries
service-sector reform in Germany/Japandomestic safety net, corporate governance reform in Chinashift in mix of production towards nontradables
Reduced domestic spending in de�cit countries
Increased private-sector savingsImprovement in �scal balance
Philip R. Lane, TCD () EC4100: Global Imbalances April 2010 8 / 9

Global Policy Coordination
2004-2005 �multilateral surveillance�project
2010 G20 �mutual assessment programme�
Limited scope for cooperation
Philip R. Lane, TCD () EC4100: Global Imbalances April 2010 9 / 9
Related Documents