Ebullitive methane emissions from oxygenated wetland streams JOHN T. CRAWFORD 1,2 , EMILY H. STANLEY 2 , SETH A. SPAWN 3 , JACQUES C. FINLAY 4 , LUKE C. LOKEN 1 andROBERT G. STRIEGL 1 1 U.S. Geological Survey, National Research Program, Boulder, CO 80303, USA, 2 Center for Limnology, University of Wisconsin-Madison, 680 N. Park St., Madison, WI 53706, USA, 3 St. Olaf College, Northfield, MN 55057, USA, 4 Department of Ecology, Evolution and Behavior, University of Minnesota, St. Paul, MN 55108, USA Abstract Stream and river carbon dioxide emissions are an important component of the global carbon cycle. Methane emis- sions from streams could also contribute to regional or global greenhouse gas cycling, but there are relatively few data regarding stream and river methane emissions. Furthermore, the available data do not typically include the ebullitive (bubble-mediated) pathway, instead focusing on emission of dissolved methane by diffusion or convection. Here, we show the importance of ebullitive methane emissions from small streams in the regional greenhouse gas balance of a lake and wetland-dominated landscape in temperate North America and identify the origin of the meth- ane emitted from these well-oxygenated streams. Stream methane flux densities from this landscape tended to exceed those of nearby wetland diffusive fluxes as well as average global wetland ebullitive fluxes. Total stream ebullitive methane flux at the regional scale (103 Mg C yr 1 ; over 6400 km 2 ) was of the same magnitude as diffusive methane flux previously documented at the same scale. Organic-rich stream sediments had the highest rates of bubble release and higher enrichment of methane in bubbles, but glacial sand sediments also exhibited high bubble emissions rela- tive to other studied environments. Our results from a database of groundwater chemistry support the hypothesis that methane in bubbles is produced in anoxic near-stream sediment porewaters, and not in deeper, oxygenated groundwaters. Methane interacts with other key elemental cycles such as nitrogen, oxygen, and sulfur, which has implications for ecosystem changes such as drought and increased nutrient loading. Our results support the conten- tion that streams, particularly those draining wetland landscapes of the northern hemisphere, are an important com- ponent of the global methane cycle. Keywords: carbon dioxide, ebullition, methane, rivers, upscaling, wetlands Received 30 October 2013 and accepted 8 April 2014 Introduction Stream and river carbon dioxide (CO 2 ) emissions are recognized as an important component of the global carbon (C) cycle (Cole et al., 2007; Butman & Raymond, 2011; Raymond et al., 2013). There is also evidence that streams and other freshwaters could be important natu- ral sources of atmospheric methane (CH 4 ) (Bastviken et al., 2011), but there remains large uncertainty due to a paucity of studies reporting CH 4 fluxes, and a lack of data for many parts of the globe. Although a significant freshwater CH 4 source is possible, wetlands are the dominant natural global source of atmospheric CH 4 (Walter et al., 2001; Dlugokencky et al., 2011). The glo- bal atmospheric CH 4 budget is reasonably well con- strained (Dlugokencky et al., 2011), yet large discrepancies have been shown between bottom-up (field scale) and top-down (atmospheric inverse technique) estimates of emissions, particularly in wet- lands, with a potential ‘missing’ wetland CH 4 source of ~87 Tg C yr 1 (Walter et al., 2001). However, a more recent assessment revealed potential overestimates from bottom-up approaches (Kirshcke et al., 2013), highlighting the continued uncertainty of the global CH 4 budget. One potential explanation for the large discrepancies between budgeting approaches, particu- larly for the earlier bottom-up underestimates, is that additional CH 4 sources such as freshwater ecosystems, and/or source pathways such as ebullition (bubble- mediated), are not accounted for. Recent inventories of freshwater CH 4 emissions may even require a reduc- tion in top-down wetland emission estimates globally (Bridgham et al., 2013). Despite a general omission of aquatic accounting in the global CH 4 budget, recent work suggests that global lake CH 4 emissions (includ- ing both diffusive and ebullitive pathways) range from 8 to 48 Tg C yr 1 (Bastviken et al., 2004), with a poten- tial additional source of 3.8 Tg C yr 1 from permafrost thaw lakes in North Siberia alone (Walter et al., 2006). Correspondence: John T. Crawford, tel. 608 262 3014, fax 608 265 2340, e-mail: [email protected] 1 © 2014 John Wiley & Sons Ltd Global Change Biology (2014), doi: 10.1111/gcb.12614 Global Change Biology

Welcome message from author
This document is posted to help you gain knowledge. Please leave a comment to let me know what you think about it! Share it to your friends and learn new things together.
Transcript
Ebullitive methane emissions from oxygenated wetlandstreamsJ OHN T . CRAWFORD1 , 2 , EM ILY H . S TANLEY 2 , S ETH A . S PAWN3 , JACQUES C . F INLAY 4 ,
LUKE C . LOKEN1 and ROBERT G. STRIEGL1
1U.S. Geological Survey, National Research Program, Boulder, CO 80303, USA, 2Center for Limnology, University of
Wisconsin-Madison, 680 N. Park St., Madison, WI 53706, USA, 3St. Olaf College, Northfield, MN 55057, USA,4Department of Ecology, Evolution and Behavior, University of Minnesota, St. Paul, MN 55108, USA
Abstract
Stream and river carbon dioxide emissions are an important component of the global carbon cycle. Methane emis-
sions from streams could also contribute to regional or global greenhouse gas cycling, but there are relatively few
data regarding stream and river methane emissions. Furthermore, the available data do not typically include the
ebullitive (bubble-mediated) pathway, instead focusing on emission of dissolved methane by diffusion or convection.
Here, we show the importance of ebullitive methane emissions from small streams in the regional greenhouse gas
balance of a lake and wetland-dominated landscape in temperate North America and identify the origin of the meth-
ane emitted from these well-oxygenated streams. Stream methane flux densities from this landscape tended to exceed
those of nearby wetland diffusive fluxes as well as average global wetland ebullitive fluxes. Total stream ebullitive
methane flux at the regional scale (103 Mg C yr�1; over 6400 km2) was of the same magnitude as diffusive methane
flux previously documented at the same scale. Organic-rich stream sediments had the highest rates of bubble release
and higher enrichment of methane in bubbles, but glacial sand sediments also exhibited high bubble emissions rela-
tive to other studied environments. Our results from a database of groundwater chemistry support the hypothesis
that methane in bubbles is produced in anoxic near-stream sediment porewaters, and not in deeper, oxygenated
groundwaters. Methane interacts with other key elemental cycles such as nitrogen, oxygen, and sulfur, which has
implications for ecosystem changes such as drought and increased nutrient loading. Our results support the conten-
tion that streams, particularly those draining wetland landscapes of the northern hemisphere, are an important com-
ponent of the global methane cycle.
Keywords: carbon dioxide, ebullition, methane, rivers, upscaling, wetlands
Received 30 October 2013 and accepted 8 April 2014
Introduction
Stream and river carbon dioxide (CO2) emissions are
recognized as an important component of the global
carbon (C) cycle (Cole et al., 2007; Butman & Raymond,
2011; Raymond et al., 2013). There is also evidence that
streams and other freshwaters could be important natu-
ral sources of atmospheric methane (CH4) (Bastviken
et al., 2011), but there remains large uncertainty due to
a paucity of studies reporting CH4 fluxes, and a lack of
data for many parts of the globe. Although a significant
freshwater CH4 source is possible, wetlands are the
dominant natural global source of atmospheric CH4
(Walter et al., 2001; Dlugokencky et al., 2011). The glo-
bal atmospheric CH4 budget is reasonably well con-
strained (Dlugokencky et al., 2011), yet large
discrepancies have been shown between bottom-up
(field scale) and top-down (atmospheric inverse
technique) estimates of emissions, particularly in wet-
lands, with a potential ‘missing’ wetland CH4 source of
~87 Tg C yr�1 (Walter et al., 2001). However, a more
recent assessment revealed potential overestimates
from bottom-up approaches (Kirshcke et al., 2013),
highlighting the continued uncertainty of the global
CH4 budget. One potential explanation for the large
discrepancies between budgeting approaches, particu-
larly for the earlier bottom-up underestimates, is that
additional CH4 sources such as freshwater ecosystems,
and/or source pathways such as ebullition (bubble-
mediated), are not accounted for. Recent inventories of
freshwater CH4 emissions may even require a reduc-
tion in top-down wetland emission estimates globally
(Bridgham et al., 2013). Despite a general omission of
aquatic accounting in the global CH4 budget, recent
work suggests that global lake CH4 emissions (includ-
ing both diffusive and ebullitive pathways) range from
8 to 48 Tg C yr�1 (Bastviken et al., 2004), with a poten-
tial additional source of 3.8 Tg C yr�1 from permafrost
thaw lakes in North Siberia alone (Walter et al., 2006).Correspondence: John T. Crawford, tel. 608 262 3014,
fax 608 265 2340, e-mail: [email protected]
1© 2014 John Wiley & Sons Ltd
Global Change Biology (2014), doi: 10.1111/gcb.12614
Global Change Biology
Many wetlands are dissected or drained by streams
and rivers. Although these streams are small in relation
to other landscape components, they could play an out-
sized role in greenhouse gas budgets as they can be
‘hot spots’ of biogeochemical cycling. Other stream
types not draining wetlands could also be CH4 sources.
Although aquatic CH4 emissions have been shown to
be locally or regionally significant to greenhouse gas
budgets (Bastviken et al., 2004; Walter et al., 2006; Stri-
egl et al., 2012; Crawford et al., 2013), freshwaters have
not been fully considered in formulations of the global
CH4 budget, with rivers and streams being the least
studied components.
Stream and river CH4 emissions have been described
by some authors (e.g. Jones & Mulholland, 1998; Striegl
et al., 2012; Crawford et al., 2013) but nearly all of the
efforts to quantify CH4 fluxes have focused on the dif-
fusive transport pathway. CH4 ebullition, an important
transport mode in wetlands and lakes (Bastviken et al.,
2004; Stamp et al., 2013), has only been studied in two
agricultural stream ecosystems (Wilcock & Sorrell,
2008; Baulch et al., 2011). Ebullition is a plausible mode
of aquatic CH4 emissions because of the low solubility
of CH4, and because CH4 production in near-stream
environments can be stimulated by C-rich substrates
and anoxic conditions (Hope et al., 2001). Characteriz-
ing diffusive fluxes to the atmosphere poses a signifi-
cant challenge due to the potential variability in
dissolved CH4 and the gas transfer velocity, but con-
straining the magnitude of ebullition is arguably an
even more difficult challenge because: (1) of the docu-
mented high variability in space (Varadharajan & He-
mond, 2012); (2) a lack of straight-forward sampling
techniques, and (3) ebullition may be episodic or con-
stant depending on geophysical conditions (i.e. Walter
et al. (2006)). Therefore, longer sampling periods
(months), higher sampling frequencies (days to hours),
and larger spatial sampling are needed to accurately
describe the magnitude, distribution, and underlying
processes of ebullitive emissions.
After we observed pervasive bubbling from stream
sediments at many stream locations in a wetland and
lake-dominated region of northern Wisconsin, we
hypothesized that (1) ebullition from stream sediments
could represent a significant component of the land-
scape CH4 budget and that (2) CH4 from anoxic pore-
waters and other CH4-rich groundwaters were the
main sources for CH4 bubble formation. To test our
hypotheses, we analyzed both ebullitive and diffusive
emission rates at daily and weekly time intervals,
respectively, in stream reaches having two distinct sedi-
ment types (organic-rich peat and ‘muck’, and glacial
sands) that represent the vast majority of benthic sub-
strates in the low-gradient, pitted glacial outwash
region of northern Wisconsin and upper Michigan,
United States. We also used an extensive dataset of
groundwater chemistry to assess potential sources of
bubble CH4. Use of high spatial replication and high
frequency of measurements allowed us to analyze pat-
terns of landscape ebullition and to upscale fluxes to
the broader study region.
Materials and methods
Site description
We studied a 2 km reach of Allequash Creek, and three addi-
tional wetland streams in the Northern Highlands Lake Dis-
trict (NHLD) of Wisconsin, U.S.A. (area ~6400 km2). The
studied streams are part of the U.S. Geological Survey’s
Water, Energy and Biogeochemical Budgets (WEBB) Program
which has focused on the long-term hydrogeology and bio-
geochemistry of streams and groundwater. The study sites are
also affiliated with the North Temperate Lakes Long Term
Ecological Research Program (LTER) which has focused on
the ecology and long-term function of the region’s numerous
lakes. The NHLD has thousands of kettle lakes formed from
the last glacial period, but streams are also present and cover
approximately 0.5% of the total surface area (lakes cover 13%)
(Buffam et al., 2011). The geology of the NHLD is distinct rela-
tive to other glacial drift lake districts of the Midwest and
Canada (Walker et al., 2003). There is 30–50 m of unconsoli-
dated sand and gravel overlying Precambrian igneous bed-
rock (Okwueze, 1983; Attig, 1985). Our focal stream,
Allequash Creek, connects a headwater spring pond to Alle-
quash Lake and dissects a peat-filled basin that formed
approximately 10 000 ybp (Watters & Stanley, 2007). Stream
discharge is dominated by strong groundwater upwelling in
the upper portion of the study area, transitioning to weak
downwelling (recharge) at the lower end of the 2 km transect
(Walker et al., 2003; Lowry et al., 2007, 2009). Stream sedi-
ments consist primarily of meters-thick glacial sand (and a
minor fraction of gravel) in the upper and lower reaches of Al-
lequash Creek (Lowry et al., 2009), and organic-rich muck and
peat sediments in the wetland reach. The surrounding wet-
land is dominated by sedges and encroaching woody vegeta-
tion (e.g. Larix laricina, Picea mariana) with a Sphagnum
understory (peat depths typically >6 m), whereas the sandy
reaches interface with upland forest (Pinus and Quercus spp.)
and wet riparian species such as Alnus rugosa.
Rate of bubble release
We deployed 30 inverted funnel-style bubble traps (Molon-
goski & Klug, 1980; Baulch et al., 2011) on Allequash Creek
(Fig. 1) on 31 May 2013 to measure volumetric bubble release
rates. Fifteen traps were placed in two sandy sediment sec-
tions (# 1–7 and 23–30; Fig. 1) and 15 were placed in muck
sediments in the wetland portion of the creek (#8–22), which
sits in-between the two sandy sections. Site 1 was the most
downstream sampling site (water flows from East to West).
© 2014 John Wiley & Sons Ltd, Global Change Biology, doi: 10.1111/gcb.12614
2 J . T . CRAWFORD et al.

Traps were sampled approximately every other day after 1
June 2013 until 31 October 2013 (we omitted the first samples
collected 24 h following trap installation; total of 65 sample
events per trap). Our sampling design allowed us to assess
both the spatial and temporal variability in ebullition along
Allequash Creek and how ebullition related to potential con-
trolling factors such as sediment composition, atmospheric
pressure, groundwater CH4, and organic matter content
(discussed further below). To characterize our ebullition time
series from Allequash Creek in the larger context of the
NHLD, we installed an additional 12 traps on three addi-
tional creeks (Mann Creek, Stevenson Creek, and North
Creek in the Trout Lake drainage; three per site in an even
mix of sand and muck sediments) and the headwater spring
ponds that drain into Allequash Creek on 23 June 2013 which
we sampled approximately every week for the remainder of
the study.
Bubble traps had a bottom surface area of ~503 cm2 which
narrowed at the top into a graduated (1 mL resolution)
syringe and 3-way stopcock. Traps were attached to steel
poles that were pounded into the substrate. Traps were almost
completely submerged and contained no headspace at deploy-
ment. Water depth below traps averaged 55.7 cm, but we
were unable to place traps in locations where water depth was
shallower than 15 cm. Water velocity during baseflow at the
traps averaged 0.06 m s�1 (range = 0.003–0.23 m s�1). We
sampled traps by carefully approaching them either by boat
(muck sites) or by wading (sandy sites) to avoid induced
ebullition. Volume of accumulated gas in the trap was based
on the graduated syringe, and volumes <1 mL were recorded
as zero. Traps were reset between sampling events by refilling
them completely with water to eliminate all headspace. To
assess the hypothesis that declines in atmospheric pressure
are related to increased bubble release (Mattson & Likens,
1990; Comas et al., 2011), we compared a 15 min resolution
atmospheric pressure time series recorded using a Vaisala
BAROCAP barometer deployed near trap #7 with a subset of
the bubble release time series.
Bubble composition
We examined the composition of intact bubbles approximately
every other week (n = 10 sites per event) by disturbing shal-
low sediments adjacent to our traps and collecting erupting
bubbles using a smaller version of the funnel-style traps. We
chose to analyze intact bubbles rather than those caught in
traps because of the potential for diffusion of component gases
out of the traps, therefore we do not have bubble composition
data for each trap volume measurement. Although bubbles
may undergo equilibration with the water column as they rise
to the surface (McGinnis et al., 2006), we assumed that the
effect would be minimal given the observed rapid rates of rise
Fig. 1 Map of bubble trap locations along Allequash Creek; stream flow is from East to West.
© 2014 John Wiley & Sons Ltd, Global Change Biology, doi: 10.1111/gcb.12614
STREAM METHANE BUBBLING 3

and the short distance a bubble travels (<1 m) before releasing
to the atmosphere. Therefore, bubble composition from intact
samples should be representative of the bubbles emitted from
the stream during the study. Collected bubbles were trans-
ferred into vacuum-evacuated serum bottles sealed with butyl
rubber stoppers and analyzed on a Shimadzu GC-2014 gas
chromatograph equipped with a methanizer and a flame ioni-
zation detector to quantify the mole fraction (% by volume) of
CH4 and CO2 (the remainder of the gas was not quantified).
Sediment temperature, composition, and oxygenconcentrations
We measured the temperature of stream sediments along the
transect (at 15 cm depth) approximately every other week
until mid-September using a Fluke 50 series II digital thermo-
couple. We used these data to assess whether there were tem-
poral patterns in sediment temperature and whether sediment
temperature was related to bubble composition. Stream sedi-
ments were also sampled for bulk density and percent loss on
ignition (as a proxy for organic matter content) during early
June at each trap location on Allequash Creek using a 9 cm
diameter polycarbonate coring tube depressed 20 cm into the
substrate. Bulk density was assessed gravimetrically. A sub-
sample of each dried, homogenized core was analyzed for loss
on ignition (%) gravimetrically following 4.5 h in a muffle fur-
nace set to 550 °C.To characterize sediment oxygen conditions, we measured
porewater oxygen profiles from intact 15 cm sediment cores
collected at every other bubble trap along the transect on 14
September 2013. To obtain cores, a 2.54 cm diameter, 30 cm
length, stainless steel corer with an internal polycarbonate
tube was attached to a one-way flow valve and a PVC exten-
sion. The corer was depressed ~15 cm into the substrate, fill-
ing the core tube approximately equal with sediment and
overlying water. Cores were lifted vertically, capped before
removal from the stream, and stored at 4 °C. Dissolved oxy-
gen concentrations were measured within 12 h of collection
using a Uni-sense microelectrode calibrated in air-saturated
water and then anoxic water following the methods described
in Li et al. (2012) and Small et al. (2013). The oxygen probe
was mounted on a micromanipulator and driven into the sedi-
ment core at 250 lm intervals.
Ebullitive and diffusive emissions and upscaling
We estimated the daily mass fluxes of CH4 and CO2 via bub-
bling by multiplying the bubble flux rate (n, moles gas day�1)
according to the ideal gas law (Eqn 1), by bubble composition
(mole fraction, % by volume)
n ¼ Pv=RT ð1Þ
where n is the number of moles of total gas, P is the pressure
(atm), v is the measured volume (L), R is the gas constant (L
atm mole�1 Kelvin�1; R = 0.0821) and T is the temperature of
the gas (Kelvin). We assumed that T was equal to the stream
water temperature at the time of sampling and that P was
equal to the barometric pressure at the surface of the water.
We also assessed the magnitude of diffusive emissions of
CO2 and CH4 for a limited portion of the 2013 open water sea-
son by directly measuring fluxes at the air–water interface
using a suspended chamber technique (Crawford et al., 2013)
at the stream gage location (trap #7) from June to August 2013.
We also compared 2013 diffusive fluxes to a larger number of
air–water diffusion measurements from 2012 made at the
same location (Crawford et al., 2014).
As a first, coarse approximation of regional stream ebull-
itive CH4 and CO2 flux, we used a Monte Carlo simulation
technique (Baulch et al., 2011; Crawford et al., 2013) to
upscale to the entire NHLD. The final flux was calculated by
randomly combining estimates of stream surface area [prod-
uct of stream lengths derived from a geographic information
system and widths measured during a random survey of
NHLD streams (Lottig, 2009)] with the distribution of CH4
ebullition from our five locations (distributions resampled
10 000 times). Error is presented as the 95% confidence inter-
val using the function quantile in R. We assessed the repre-
sentativeness of our sampling sites by comparing sediment
types from our study with the random stream survey sedi-
ment data. Upscaled ebullitive emissions were then com-
pared with an upscaled regional estimate of diffusive fluxes
given by Crawford et al. (2014).
Source of bubble CH4
To evaluate the hypothesis that CH4 production in anoxic
porewaters or other groundwaters was the source of CH4 to
bubbles, we analyzed an unpublished WEBB groundwater
chemistry dataset from the Allequash Creek catchment
collected across a full year from 2001 to 2002. By calculating
the expected free-gas phase equilibrium CH4 composition
(bubble CH4%) from aqueous CH4 concentrations (groundwa-
ter or porewater concentrations) using the Henry’s Law con-
stant of CH4 corrected for temperature (empirical values from
Wilhelm et al. (1977)), we were able to rule out particular
sources as fueling CH4 bubbles. Groundwaters from a series of
wells along a pair of hillslope transects at the Allequash site
were sampled at 4–6 week intervals during the year. Dissolved
CH4 samples were collected from bubble-free water and ana-
lyzed using headspace equilibration (Kling et al., 1992; Finlay,
2003) on a Shimadzu 14A GC equipped with a flame ionization
detector. Water temperature, dissolved oxygen concentrations
(assessed by Winkler titrations), as well as other solute concen-
trations were also collected with these gas samples and were
analyzed using standard methods in the North Temperate
Lakes LTER protocol (http://lter.limnology.wisc.edu). The
groundwater sources and flowpaths for these wells were pre-
viously elucidated by Walker et al. (2003) and Pint et al. (2003),
and water origins were confirmed here by comparing d 18O-
H2O to these published studies. Groundwater sources
included lake and precipitation recharge along hillslope flow-
paths (depths between +0.75 and �6 m, relative to stream sur-
face datum), precipitation sources in riparian areas (depths
between 0 and �4 m) and a mixture of lake and precipitation
derived water in the peat wetland (depths of 0 to �1 m).
Depths and relative locations of wells are shown in Figure S1.
© 2014 John Wiley & Sons Ltd, Global Change Biology, doi: 10.1111/gcb.12614
4 J . T . CRAWFORD et al.

Results
Rate of bubble release
Volumetric bubble release rates were highly variable
among the two sediment classes on Allequash Creek
(Fig. 2) and statistically different (P < 0.001, one-way
nested ANOVA, n = 1830) with an average of 71.3
(SD = 140) and 173.8 (SD = 257) mL m�2 day�1 for
sand and muck sediments, respectively. Bubble rates
were also highly right skewed and strongly peaked
(skewness = 2.83, kurtosis = 10.72; peak is among the
low values, with extreme values to the right of the
distribution). Bubble rates for a subset of correlated
traps were compared with a continuous time series of
atmospheric pressure in (Fig. S2). Our data did not
indicate a clear relationship between atmospheric pres-
sure and bubbling rates, as periods of elevated ebulli-
tion coincided with periods of both rising and falling
atmospheric pressure. Bubbling rates between traps
were not all significantly correlated (Fig. S3), with some
traps showing high correlation with many others (e.g.
trap 30), and others showing independent patterns with
little or no correlation with other traps (e.g. trap 28).
There were no apparent spatial patterns of correlation,
as traps nearest one another were not more correlated
relative to traps further away. Average bubble release
rates at the additional 12 sites elsewhere in the region
(mean = 258 mL m�2 day�1, n = 153; SD = 278; data
not shown) were greater than rates documented in
Allequash Creek (P < 0.01, one-way nested ANOVA), but
generally fell within the range of values at Allequash
Creek. We could not adequately assess the timing of
ebullition within and among these sites due to the less
frequent sampling interval.
Bubble composition and sediment temperatures
Bubbles from stream sediments were highly enriched
in CH4 in both the sand and muck reaches of Allequash
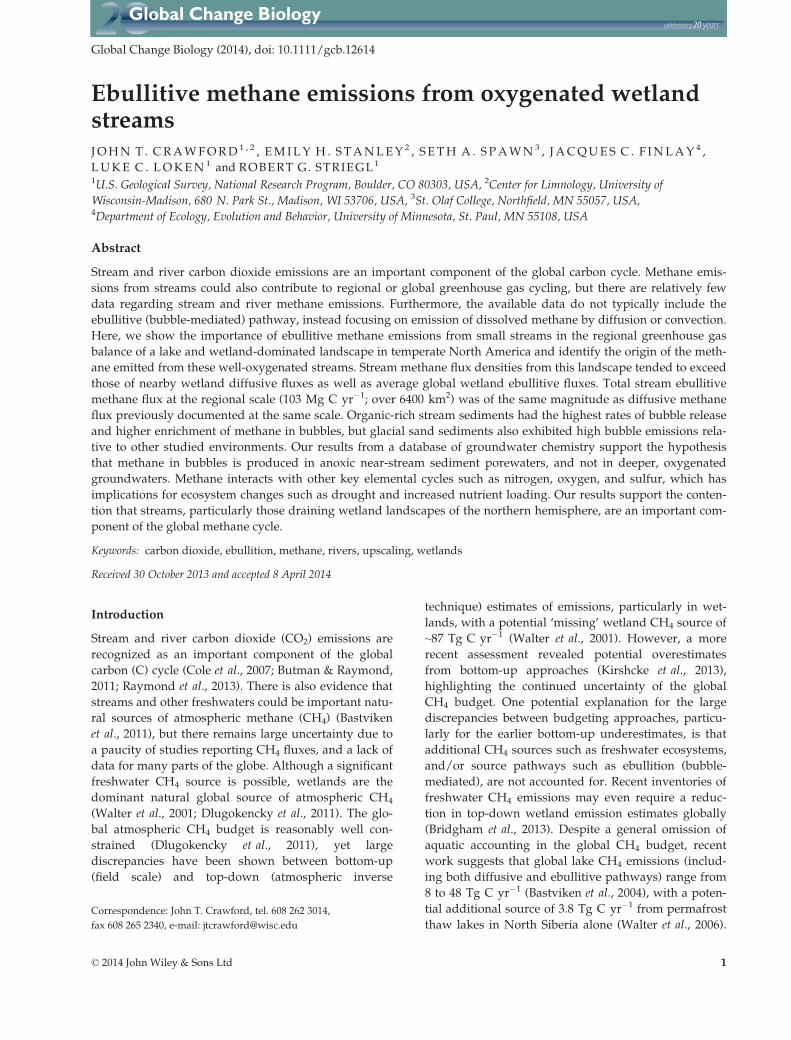
Creek. CH4 composition ranged from <1 to 94% (Fig. 3)
with a significantly different average composition of
17.2% and 26.5% in sand and muck sediments, respec-
tively (P < 0.05, one-way nested ANOVA). CO2 typically
comprised less than 0.63% of bubble composition, and
reached a maximum of 2.1%. We did not quantify the
remaining composition of the bubbles. We did not
detect a significant trend in bubble CH4 content over
time (least squares regression of log-transformed data,
P > 0.1). Sediment temperature at 15 cm depth did not
change significantly over the course of the study period
(P < 0.05; mean = 15.6 °C), but there was significant
spatial variability in sediment temperature (~10 °C)along the transect on any given sampling date. We did
not detect a significant relationship between sediment
temperature and bubble CH4 composition (least
squares regression of log-transformed data, P > 0.1).
Sediment composition and oxygen concentrations
Stream sediments were distinctly different between the
sand and muck reaches of Allequash Creek (Fig. 4),
with the two sand reaches having significantly greater
bulk density (P < 0.05), and much less organic matter
Jun Jul Aug Sep Oct Nov
020
060
010
00
1 2 3 4 5 6 7
Jun Jul Aug Sep Oct Nov
020
060
010
00
23 24 25 26 27 28 29 30
Jun Jul Aug Sep Oct Nov
020
040
060
0
8 9 10 11 12 13
Bub
ble
rele
ase
rate
(mL
m−2
d−1
)
Jun Jul Aug Sep Oct Nov
050
015
0025
00
14 15 16 17 18 19 20 21 22
Date
Fig. 2 Time series of bubble release rates from sand and muck sediments in Allequash Creek; upper panels are from sand sediments,
lower panels are from muck sediments.
© 2014 John Wiley & Sons Ltd, Global Change Biology, doi: 10.1111/gcb.12614
STREAM METHANE BUBBLING 5
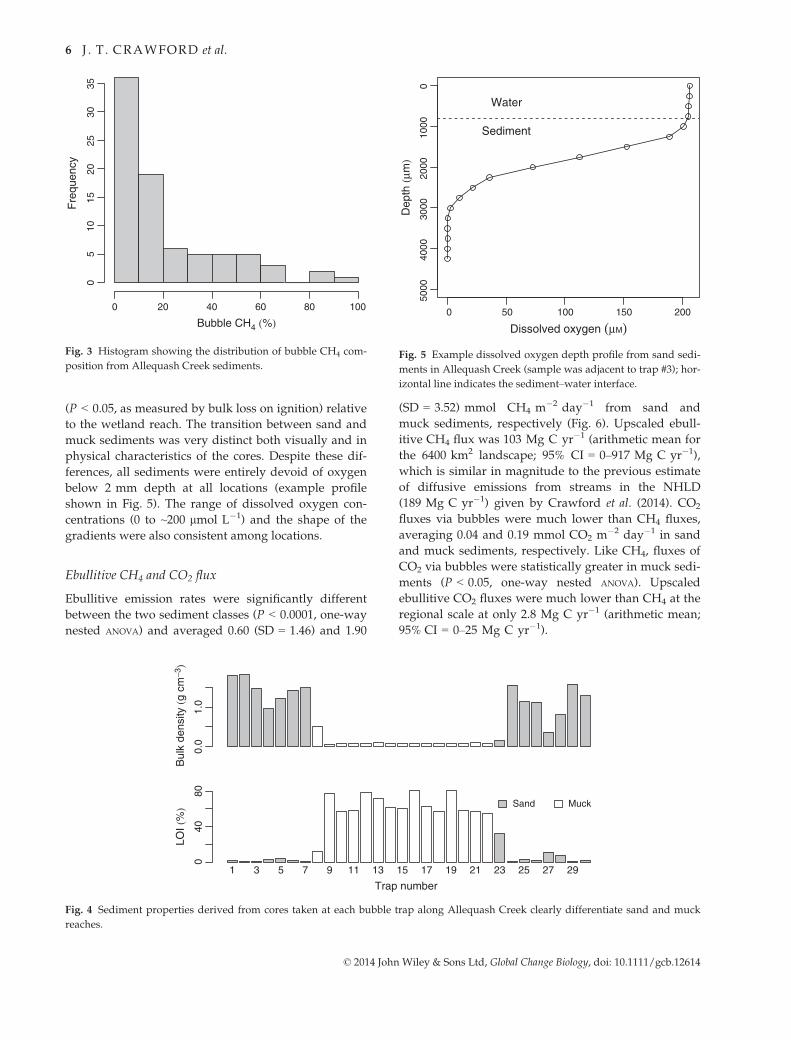
(P < 0.05, as measured by bulk loss on ignition) relative
to the wetland reach. The transition between sand and
muck sediments was very distinct both visually and in
physical characteristics of the cores. Despite these dif-
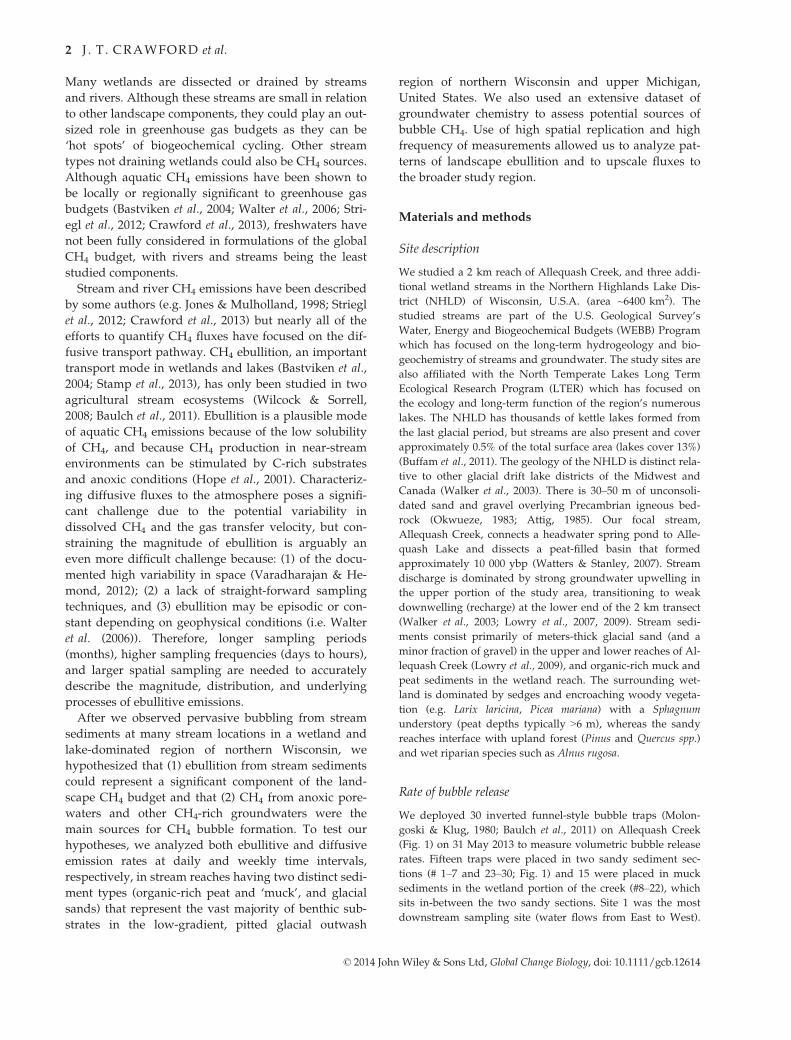
ferences, all sediments were entirely devoid of oxygen
below 2 mm depth at all locations (example profile
shown in Fig. 5). The range of dissolved oxygen con-
centrations (0 to ~200 lmol L�1) and the shape of the
gradients were also consistent among locations.
Ebullitive CH4 and CO2 flux
Ebullitive emission rates were significantly different
between the two sediment classes (P < 0.0001, one-way
nested ANOVA) and averaged 0.60 (SD = 1.46) and 1.90
(SD = 3.52) mmol CH4 m�2 day�1 from sand and
muck sediments, respectively (Fig. 6). Upscaled ebull-
itive CH4 flux was 103 Mg C yr�1 (arithmetic mean for
the 6400 km2 landscape; 95% CI = 0–917 Mg C yr�1),
which is similar in magnitude to the previous estimate
of diffusive emissions from streams in the NHLD
(189 Mg C yr�1) given by Crawford et al. (2014). CO2
fluxes via bubbles were much lower than CH4 fluxes,
averaging 0.04 and 0.19 mmol CO2 m�2 day�1 in sand
and muck sediments, respectively. Like CH4, fluxes of
CO2 via bubbles were statistically greater in muck sedi-
ments (P < 0.05, one-way nested ANOVA). Upscaled
ebullitive CO2 fluxes were much lower than CH4 at the
regional scale at only 2.8 Mg C yr�1 (arithmetic mean;
95% CI = 0–25 Mg C yr�1).
0.0
1.0
Bul
k de
nsity
(g c
m−3
)
1 3 5 7 9 11 13 15 17 19 21 23 25 27 29
040
80
Sand Muck
LOI (
%)
Trap number
Fig. 4 Sediment properties derived from cores taken at each bubble trap along Allequash Creek clearly differentiate sand and muck
reaches.
0 20 40 60 80 100
05
1015
2025
3035
Bubble CH4 (%)
Fre
quen
cy
Fig. 3 Histogram showing the distribution of bubble CH4 com-
position from Allequash Creek sediments.
0 50 100 150 200
5000
4000
3000
2000
1000
0
Dissolved oxygen (µM)
Dep
th (µ
m)
Water
Sediment
Fig. 5 Example dissolved oxygen depth profile from sand sedi-
ments in Allequash Creek (sample was adjacent to trap #3); hor-
izontal line indicates the sediment–water interface.
© 2014 John Wiley & Sons Ltd, Global Change Biology, doi: 10.1111/gcb.12614
6 J . T . CRAWFORD et al.

Diffusive CH4 and CO2 fluxes
Allequash Creek was a significant source of atmo-
spheric CH4 and CO2 via diffusive emissions in 2013.
Average diffusive CH4 flux in 2013 was 14.23 mmol
CH4 m�2 day�1 (SD = 14.84), which was slightly lower
on average than fluxes measured in 2012 at the same
location (mean = 18.62 mmol CH4 m�2 day�1, SD =5.57; Crawford et al., 2014). Similarly, 2013 diffusive
CO2 fluxes were slightly lower than 2012 at 0.69 mol
CO2 m�2 day�1 (SD = 0.51) and 0.89 mol CO2
m�2 day�1 (SD = 0.54), respectively.
Source of bubble CH4
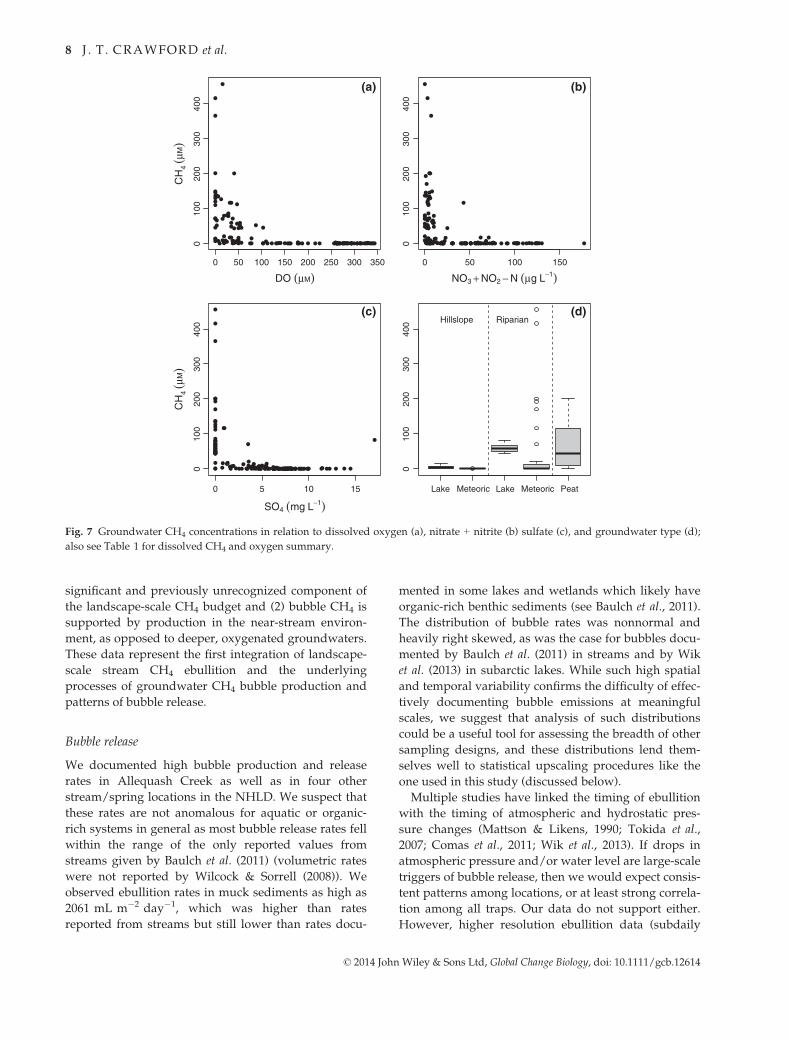
Dissolved CH4 varied from below detection to
456 lmol L�1 in groundwaters and porewaters
approaching Allequash Creek. The greatest CH4 con-
centrations corresponded to small or undetectable oxy-
gen concentrations, whereas lesser CH4 concentrations
were found in oxygenated regions and under greatest
sulfate and nitrate concentrations (Fig. 7). There were
consistent patterns among groundwater classes; the
greatest CH4 concentrations occurred in riparian and
peat environments and least concentrations were found
in deeper flowpaths along hillslopes derived from both
meteoric and lake recharge (Table 1; Fig. 7d). From the
oxygen data from these various groundwater sources,
we were partially able to rule out particular areas as
supporting methanogenesis. Only the near-stream
riparian (mean = 45 lM oxygen; SD = 55), peat porewa-
ters (mean = 35 lM oxygen; SD = 48) and deep lake
recharge sources (mean = 41 lM oxygen; SD = 32)
experienced suboxic to anoxic conditions throughout
the year. In contrast, hillslope meteoric groundwaters
were sufficiently oxygenated (mean = 197 lM oxygen;
SD = 124) to inhibit CH4 production. Although the deep
groundwater sources had anoxic to hypoxic oxygen
concentrations that could potentially support methano-
genesis, these locations had minimum concentrations of
dissolved CH4 (mean = 4.76 lM; SD = 4.46).
By calculating the theoretical equilibrium CH4 com-
position (mole fraction; % CH4) of bubbles in contact
with different groundwater sources using measured
dissolved CH4 conentration and Henry’s Law coeffi-
cient corrected for temperature of the sampled water
(Table 1), and then comparing those values with actual
measured bubble composition (Fig. 3), we further ruled
out potential groundwater sources as fueling CH4 bub-
ble formation. For shallow, near-stream riparian and
peat porewaters, we found that average CH4 concentra-
tions could support formation of bubbles containing
2.7–3.7% CH4 (Table 1), which is lower than the mean
composition we documented in fresh bubbles (22.6%
CH4). However, the maximum CH4 concentrations doc-
umented in these water sources could produce bubbles
containing up to 25% CH4 (Table 1), which is still less
than the greatest composition we documented in 2012
(97%). Stream hyporheic porewaters documented by
Schindler & Krabbenhoft (1998), sampled at approxi-
mately trap #7, could also produce CH4 bubbles, but
with much lower equilibrium CH4 content (3.3% CH4).
On the other hand, deep groundwaters along hillslopes,
and beneath the stream, derived from lake and terres-
trial recharge are not plausible sources of bubble CH4
because CH4 concentrations were too low to support
documented bubble CH4, and because they were oxic
environments (Table 1). Although the CH4 concentra-
tions in these deeper groundwaters could support some
CH4 bubble formation (0.1–0.7% CH4), these values are
much lower than the average CH4 in bubbles. Our data
support the hypothesis that CH4 produced in anoxic
near-stream environments along groundwater flow-
paths fuels CH4 bubble formation and release in stream
sediments, but we are not yet able to account for the
highest observed CH4 content of bubbles from stream
sediments. Muck sediments had the highest average
bubble CH4 composition, but we were unable to extract
water from these locations.
Discussion
Our data support our two overarching hypotheses
that: (1) stream ebullitive CH4 emissions represent a
1 3 5 7 9 11 14 17 20 23 26 29
05
1015
2025
30
Sand Muck
Trap number
CH
4 ebu
llitio
n ra
te (m
mol
m−2
d−1
)
Fig. 6 Variability in CH4 ebullition rates from 30 traps placed
along Allequash Creek (n = 65 samples per trap); vertical lines
separate sand and muck sediments; black line in boxes is the
median, boxes show upper and lower quartiles, fences are 1.59
interquartile range, circles represent outliers.
© 2014 John Wiley & Sons Ltd, Global Change Biology, doi: 10.1111/gcb.12614
STREAM METHANE BUBBLING 7
significant and previously unrecognized component of
the landscape-scale CH4 budget and (2) bubble CH4 is
supported by production in the near-stream environ-
ment, as opposed to deeper, oxygenated groundwaters.
These data represent the first integration of landscape-
scale stream CH4 ebullition and the underlying
processes of groundwater CH4 bubble production and
patterns of bubble release.
Bubble release
We documented high bubble production and release
rates in Allequash Creek as well as in four other
stream/spring locations in the NHLD. We suspect that
these rates are not anomalous for aquatic or organic-
rich systems in general as most bubble release rates fell
within the range of the only reported values from
streams given by Baulch et al. (2011) (volumetric rates
were not reported by Wilcock & Sorrell (2008)). We
observed ebullition rates in muck sediments as high as
2061 mL m�2 day�1, which was higher than rates
reported from streams but still lower than rates docu-
mented in some lakes and wetlands which likely have
organic-rich benthic sediments (see Baulch et al., 2011).
The distribution of bubble rates was nonnormal and
heavily right skewed, as was the case for bubbles docu-
mented by Baulch et al. (2011) in streams and by Wik
et al. (2013) in subarctic lakes. While such high spatial
and temporal variability confirms the difficulty of effec-
tively documenting bubble emissions at meaningful
scales, we suggest that analysis of such distributions
could be a useful tool for assessing the breadth of other
sampling designs, and these distributions lend them-
selves well to statistical upscaling procedures like the
one used in this study (discussed below).
Multiple studies have linked the timing of ebullition
with the timing of atmospheric and hydrostatic pres-
sure changes (Mattson & Likens, 1990; Tokida et al.,
2007; Comas et al., 2011; Wik et al., 2013). If drops in
atmospheric pressure and/or water level are large-scale
triggers of bubble release, then we would expect consis-
tent patterns among locations, or at least strong correla-
tion among all traps. Our data do not support either.
However, higher resolution ebullition data (subdaily
0 50 100 150 200 250 300 350
010
020
030
040
0
DO (µM)
CH
4 (µM)
CH
4 (µM)
0 50 100 150
010
020
030
040
0
NO3 + NO2 − N (µg L−1)
0 5 10 15
010
020
030
040
0
SO4 (mg L−1)
010
020
030
040
0 Hillslope Riparian
Lake Meteoric Lake Meteoric Peat
(a) (b)
(c) (d)
Fig. 7 Groundwater CH4 concentrations in relation to dissolved oxygen (a), nitrate + nitrite (b) sulfate (c), and groundwater type (d);
also see Table 1 for dissolved CH4 and oxygen summary.
© 2014 John Wiley & Sons Ltd, Global Change Biology, doi: 10.1111/gcb.12614
8 J . T . CRAWFORD et al.
scale) could help determine the timing of events and
could be used to test the pressure hypothesis more for-
mally (i.e. Varadharajan & Hemond, 2012). In addition,
there were no clear spatial patterns of bubble release
rates across the Allequash Creek transect. We suspect
that sediment characteristics could be more important
for bubble release than changes in overlying pressure.
To rise, bubbles must overcome the resisting forces of
both the overlying pressure (barometric + hydrostatic)
and the forces presented by the mechanics of the sedi-
ments (Boudreau, 2012). Even if there are some
instances of pressure triggering (which we could not
detect with our data resolution), sediment mechanics
likely play a role in the timing of release, as has been
shown in temperate lakes (Varadharajan & Hemond,
2012). Small changes in barometric pressure (~15 mBar)
and small changes in hydrostatic pressure (yearly maxi-
mum of 20 mBar due to water level fluctuations in Al-
lequash Creek) could be less effective as triggers due to
the dynamic resisting forces of sediments. Further,
growth and release of bubbles could be limited by the
supply or rate of diffusing gas. Bubbles do not form
instantly; rather, they are thought to form in the period
of a few days (Boudreau, 2012). Therefore, the time lag
associated with subsequent bubble formation following
previous releases will likely eliminate a direct correla-
tion with overlying pressure, as there may not be suffi-
cient bubble volume in the sediment reservoir at any
given time to support eruption even if the pressure
drops significantly (cf., Varadharajan & Hemond,
2012). To our knowledge, no direct observations of bub-
ble formation exist for freshwater sediments, therefore
our conclusions remain somewhat speculative.
Bubble composition and sediment temperatures
CH4 content of bubbles (<1–97% by volume) spanned
the range of values reported from other aquatic ecosys-
tems (Table 2, also see Baulch et al., 2011). Bubbles in
muck sediments, on average, had the highest CH4 con-
tent. Although we were unable to account for the bulk
of bubble composition for many of our samples, other
workers have found that N2 composed the majority of
bubble gas in river sediments (Higgins et al., 2008), and
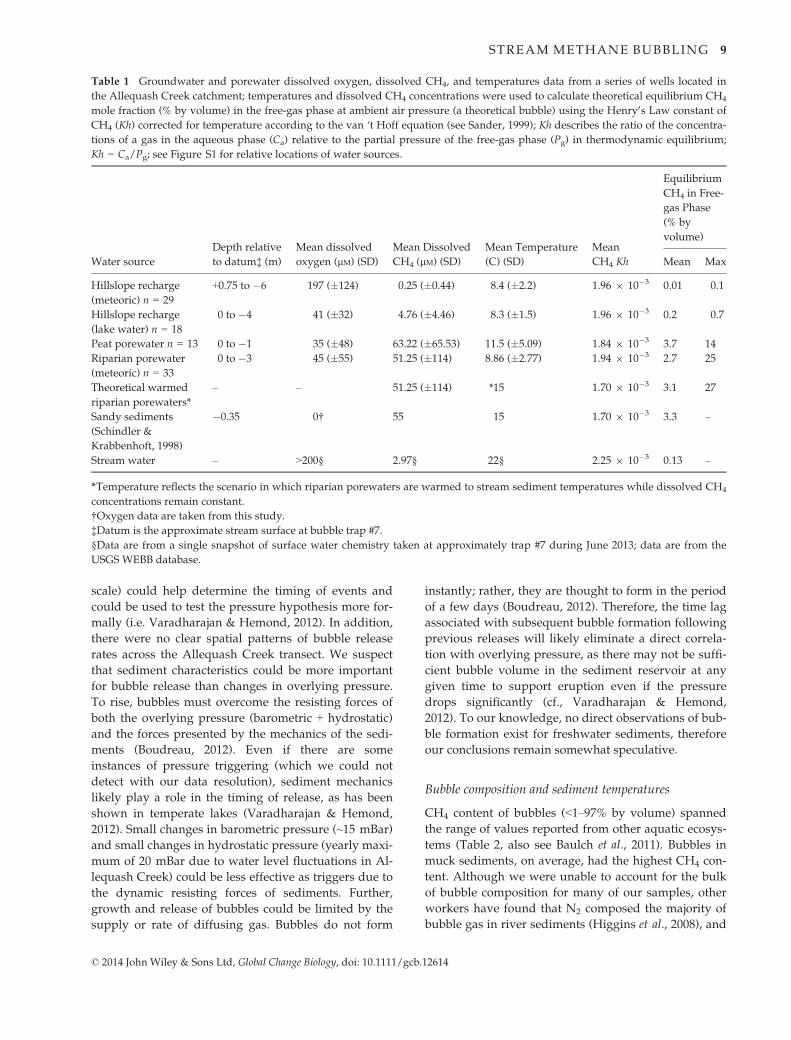
Table 1 Groundwater and porewater dissolved oxygen, dissolved CH4, and temperatures data from a series of wells located in
the Allequash Creek catchment; temperatures and dissolved CH4 concentrations were used to calculate theoretical equilibrium CH4
mole fraction (% by volume) in the free-gas phase at ambient air pressure (a theoretical bubble) using the Henry’s Law constant of
CH4 (Kh) corrected for temperature according to the van ‘t Hoff equation (see Sander, 1999); Kh describes the ratio of the concentra-
tions of a gas in the aqueous phase (Ca) relative to the partial pressure of the free-gas phase (Pg) in thermodynamic equilibrium;
Kh = Ca/Pg; see Figure S1 for relative locations of water sources.
Water source
Depth relative
to datum‡ (m)
Mean dissolved
oxygen (lM) (SD)
Mean Dissolved
CH4 (lM) (SD)
Mean Temperature
(C) (SD)
Mean
CH4 Kh
Equilibrium
CH4 in Free-
gas Phase
(% by
volume)
Mean Max
Hillslope recharge
(meteoric) n = 29
+0.75 to �6 197 (�124) 0.25 (�0.44) 8.4 (�2.2) 1.96 9 10�3 0.01 0.1
Hillslope recharge
(lake water) n = 18
0 to �4 41 (�32) 4.76 (�4.46) 8.3 (�1.5) 1.96 9 10�3 0.2 0.7
Peat porewater n = 13 0 to �1 35 (�48) 63.22 (�65.53) 11.5 (�5.09) 1.84 9 10�3 3.7 14
Riparian porewater
(meteoric) n = 33
0 to �3 45 (�55) 51.25 (�114) 8.86 (�2.77) 1.94 9 10�3 2.7 25
Theoretical warmed
riparian porewaters*
– – 51.25 (�114) *15 1.70 9 10�3 3.1 27
Sandy sediments
(Schindler &
Krabbenhoft, 1998)
�0.35 0† 55 15 1.70 9 10�3 3.3 –
Stream water – >200§ 2.97§ 22§ 2.25 9 10�3 0.13 –
*Temperature reflects the scenario in which riparian porewaters are warmed to stream sediment temperatures while dissolved CH4
concentrations remain constant.
†Oxygen data are taken from this study.
‡Datum is the approximate stream surface at bubble trap #7.
§Data are from a single snapshot of surface water chemistry taken at approximately trap #7 during June 2013; data are from the
USGS WEBB database.
© 2014 John Wiley & Sons Ltd, Global Change Biology, doi: 10.1111/gcb.12614
STREAM METHANE BUBBLING 9

we suspect that this is also the case in Allequash Creek.
We did not observe a pattern of increasing or decreas-
ing bubble CH4 content over time, and we did not
observe a significant relationship between sediment
temperature at 15 cm depth and bubble CH4 composi-
tion. Although methanogenesis and C processing rates
in general are very sensitive to changes in temperature
in freshwater sediments (Kelly & Chynoweth, 1981;
Table 2 Comparison of ebullitive and diffusive CH4 fluxes from diverse aquatic ecosystems
Location
CH4 flux (mmol m�2 day�1) Bubble composition
Ebullitive Diffusive % Ebullitive % CH4
Streams and rivers
This study 0–31 (mean 1.25) 8.46 12.8 0–50.4
North Temperate Streams, Ontario,
Canada (Baulch et al., 2011)
0.1–5 19–35
Agricultural Streams, New Zealand
(Wilcock & Sorrell, 2008)
1.46–2.73 20–60 20.7–69.9
Saar River, Germany (Maeck et al., 2013) 0.02 0.04 33
Lakes
Hamilton Harbour, Ontario, Canada (Chau et al., 1977) 0.14
North Temperate Lakes, Wisconsin and
Michigan, U.S. (Bastviken et al., 2004)
0.02–3.71
Lake Wingra, Wisconsin, U.S. (Barber & Ensign, 1979) 0.5–24
Lake Wintergreen, Michigan, U.S. (Strayer & Tiedje, 1978) 20.9
Postilampi and Kevaton Lakes, Finland
(Huttunen et al., 2003)
0.22–1.53
Priest Pot Lake, Northern England (Casper et al., 2000) 12.4 0.34 97.3
Mirror Lake, New Hampshire, U.S.
(Mattson & Likens, 1990, 1993)
0.05–4.26 70
Lake Loiza, Puerto Rico (Joyce & Jewell, 2003) 0.49–1.49
Subarctic Lakes, Northern Sweden (Wik et al., 2013) 0.83
Lake Gat�un, Panama (Keller & Stallard, 1994) 0.62–124 67–77
Thaw Lakes, Siberia (Walter et al., 2006) 0.1–8 95
Lago Calado, Amazon Floodplain,
Brazil (Crill et al., 1988)
1.68 70
Searsville Lake (Miller & Oremland, 1988) 6.09 61
Reservoirs
Lake Gat�un, Panama (Joyce & Jewell, 2003) 0.31–67.8
Hydropower Reservoir, Switzerland
(DelSontro et al., 2010)
5.36 0.74 87
Tropical Hydropower Reservoirs, Brazil
(dos Santos et al., 2006)
0.04–22.7 0.47–19.4 10–86
Tropical Reservoir, Zambia and Zimbabwe
(DelSontro et al., 2011)
0.03–90.3 0.18–131
Saar River impoundment, Germany (Maeck et al., 2013) 9.6 0.25 97 71–90
Other locations
Orinoco River Floodplain, Venezuela (Smith et al., 2000) 4.61 3.19 65
Amazon River Floodplain (open water),
Brazil (Bartlett et al., 1988)
1.08 49
Beaver Pond, Ontario, Canada (Wehenmeyer, 1999) 1.41 65
Coastal Wetland, North Carolina, U.S.
(Chanton et al., 1989)
~3.56 ~3.56 50 12.6–89.7
Newport News Swamp, Virginia, U.S.
(Wilson et al., 1989)
2.83 8.3 34
Subtropical Peatland, Florida Everglades,
U.S. (Comas & Wright, 2012)
0.18–4.23
Billabong, River Murray, Australia (Sorrell & Boon, 1992) 3.6–6.8 ~60Raised Bog, West Wales, UK (Stamp et al., 2013) 0.42–0.72 0–51
© 2014 John Wiley & Sons Ltd, Global Change Biology, doi: 10.1111/gcb.12614
10 J . T . CRAWFORD et al.
Gudasz et al., 2010), bubble composition is not a direct
measure of methanogenesis rates. Therefore, a lack of a
relationship between temperature and bubble composi-
tion should not be surprising.
Ebullitive CH4 rates
Allequash Creek ebullition rates (range = 0–31 mmol
CH4 m�2 day�1) were within the range of other envi-
ronments where ebullitive CH4 flux has been reported
(Table 2), including important hot spots such as North
Siberia permafrost thaw lakes (0.62–126 mmol
CH4 m�2 day�1) and tropical reservoirs, such as Lake
Gat�un in Panama (0.03–90.3 mmol CH4 m�2 day�1;
Joyce & Jewell, 2003). Yet, CH4 ebullition from streams
exceeded rates in many wetland and lake environments
worldwide including representative sites in the temper-
ate, tropical, and boreal zones; and our fluxes were gen-
erally higher than the only previously documented
ebullition rates from streams [0.1–5 mmol
CH4 m�2 day�1 in Ontario streams (Baulch et al., 2011);
and 1.41 mmol CH4 m�2 day�1 in New Zealand
streams (Wilcock & Sorrell, 2008)]. This comparison
suggests that streams could be important contributors
to the atmospheric CH4 balance, especially in wetland
regions. However, given that the only other reports of
bubble fluxes from flowing waters are from agricultural
catchments, we are currently unable to adequately
assess the potential contribution of stream ebullition to
the global atmospheric CH4 balance.
Our estimates of bubble emissions support the con-
tention that streams are, at least, hot spots of CH4 emis-
sions regionally. While we do not have direct
measurements of CH4 fluxes from adjacent, nonstream
wetland environments, we can compare these rates
with extensive measurements from other nearby wet-
lands. Stream ebullitive CH4 fluxes were within the
range of diffusive rates documented in subboreal wet-
lands in the region. For example, Pypker et al. (2013)
documented emissions of 3.96 mmol CH4 m�2 day�1
in a poor fen in Northern Michigan. In contrast, John-
son et al. (2013) measured rates between 0.13 and
0.74 mmol CH4 m�2 day�1 in a peatland along Lake
Superior, which is much lower than ebullitive rates
from Allequash Creek. These comparisons indicate that
full C budgets (or at least greenhouse gas budgets) in
this landscape need to incorporate flowing waters, but
rates need to be scaled by total surface area to reach a
clear conclusion with respect to stream importance.
Upscaled ebullitive CH4 flux
Our preliminary upscaled flux calculation illustrates
the potential contribution to the landscape CH4 budget
and supports the hypothesis (1) that streams are a sig-
nificant, yet unacknowledged source of atmospheric
CH4 via bubbling, in addition to diffusion. At the scale
of the NHLD (~6400 km2), streams likely contribute, on
average, 103 Mg C yr�1 as CH4 via bubbles alone
(across a total stream area of 35.03 km2). Ebullition
increases the estimate of total stream CH4 emissions
calculated by Crawford et al. (2014) of 189 Mg C yr�1
via the diffusive pathway to a total of 292 Mg C yr�1
as CH4. Normalized to the equivalent warming poten-
tial of CO2 (25 times warming potential of 1 kg CH4 rel-
ative to 1 kg CO2 on a 100 year time horizon; Forster
et al., 2007), bubble CH4 emissions add another 4.73
Gg-CO2 (eq) yr�1 to the atmosphere. This contribution
is still less than the diffusive CO2 contribution from
streams (~23 Gg C yr�1, Crawford et al., 2014). In con-
trast, bubbling was not a significant pathway of CO2
release from streams. CO2 emissions via bubbles were
four orders of magnitude lower than the stream diffu-
sive CO2 flux and 35 times less than stream CH4 ebull-
itive flux, with respect to C. Low CO2 flux via bubbles
should not be surprising given the high solubility of
CO2 in water. On the basis of this comparison, we
would expect higher relative fluxes via bubbles for
gases with low solubility (e.g. N2, CH4), and higher dif-
fusive fluxes for more soluble gases (e.g. N2O, CO2)
from aquatic ecosystems in general.
Although the upscaled flux estimate presented here
is based on a limited number of locations, we are
confident that our sites represent the general geomor-
phic (muck and sand sediments) and hydrologic
(high groundwater discharge) conditions within the
NHLD. However, these results must still be viewed
with some caution and more work is necessary to
constrain the uncertainty in our model. On the basis
of extensive observations of sediment bubbling made
over many years across the NHLD by us and our
colleagues at the Trout Lake Research Station, we are
confident that our upscaling procedure does not egre-
giously misrepresent the bubbling rates across the
NHLD. The random stream survey dataset (Lottig,
2009) showed that stream sediments in the NHLD
were composed predominantly of muck and sand,
accounting for 33% (�13%) and 37% (�13%) of
stream coverage, respectively, with the remainder of
benthic types consisting of a mixture of sand and
gravel (20%, �11%), and a small fraction of cobble
reaches (10%, �8%), thus supporting the general rep-
resentativeness of our sites. Furthermore, the stream
survey also showed ubiquitous CH4 supersaturation
in surface waters, which suggests a reasonable proba-
bility of bubble formation. Our assumption that
groundwater data from Allequash Creek are gener-
ally representative of the region is supported by
© 2014 John Wiley & Sons Ltd, Global Change Biology, doi: 10.1111/gcb.12614
STREAM METHANE BUBBLING 11
previous studies of regional hydrogeology and
groundwater recharge rates in the region (e.g. Hunt
et al., 1998).
CH4 sources
Our results indicate that organic-rich stream sediments
are hot spots of CH4 bubble emissions to the atmo-
sphere. However, sandy sediments were also found to
have high bubble CH4 composition and ebullition rates,
even though they had lower organic matter content
(Fig. 4). This pattern of greater CH4 release from
organic sediments has also been shown for lakes in the
region (Michmerhuizen et al., 1996). In addition, other
workers have shown positive correlations between sed-
iment organic composition and CH4 content of bubbles
in streams and rivers (Higgins et al., 2008; Baulch et al.,
2011), but our results from sandy sediments may not be
anomalous as CH4 bubbles have also been detected in
other sandy environments (Boudreau, 2012).
Two lines of evidence support our second hypothesis
that CH4 in bubbles is derived exclusively from stream
sediments and near-stream environments. First, suffi-
cient CH4 to support bubble CH4 composition was only
found in discrete groundwater and porewater environ-
ments (Table 1). Supersaturated conditions near the
stream were also in agreement with previous work in
Allequash Creek (Schindler & Krabbenhoft, 1998), and
a detailed study of hyporheic sediments in another
Wisconsin stream (Werner et al., 2012). In the Allequash
catchment, both peat porewaters and riparian water
sources had the potential to generate average CH4 bub-
ble composition documented in 2013 but not the great-
est values. As the predicted bubble compositions given
in Table 1 are based on ambient groundwater or pore-
water temperatures from these various sources, these
equilibrium calculations will be in error if bubbles are
formed as these supersaturated groundwater sources
approach warmer stream sediments. In this scenario, a
theoretical bubble will become more enriched in CH4
(change from 25% to 27% CH4) due to decreased gas
solubility as temperature increases from cold ground-
water conditions (~8 °C) to warmer sediment condi-
tions (~15 °C). This mechanism of warming during
transport to the stream can account for only a small
increase in bubble CH4 composition due to solubility
changes. In contrast to the near-stream water sources,
groundwaters on hillslopes were not plausible CH4
sources to bubbles because they never contained suffi-
cient dissolved CH4 concentrations.
The second line of evidence supporting CH4 produc-
tion in near-stream environments comes from our data-
set of groundwater and porewater oxygen
concentrations (Table 1). Overlying stream water is
well oxygenated year-round (>150 lM; data retrieved
from USGS NWIS), which precludes methanogenesis in
the water column. Within stream sediments, however,
dissolved oxygen was entirely absent 2 mm below the
sediment–water interface (Fig. 5). This pattern of shal-
low anoxia in stream sediments was documented at
every location along the Allequash Creek transect. At
greater sediment depths however, geochemical condi-
tions were reflective of regional lake- and meteoric-
derived groundwater, which cannot support CH4
production due to the presence of oxygen. Dis-
solved oxygen in deeper groundwater along hillslopes
approaching Allequash Creek was also sufficiently high
to prevent methanogenesis. Taken together, these dis-
solved oxygen data allow us to infer that a relatively
narrow band (~1 m thick) of anoxia exists in the transi-
tion zone between surface waters and groundwaters
(the hyporheic zone), with oxic conditions on either
side. The anoxic band in the sediments is located 2 mm
below the sediment–water interface and above an oxy-
genated aquifer that is approximately 1 m beneath the
sediment–water interface. This anoxic band also
extends laterally into riparian soils and peat soils in the
wetland reach, separating these locations (in terms of
redox conditions) from hillslope waters. The anoxic
band surrounding streams also has likely consequences
for other biogeochemical cycles beyond CH4 (discussed
later).
Shortcomings of the CH4 equilibration model
While the oxygen and CH4 data strongly support our
second hypothesis, there are shortcomings with our
model of CH4 equilibration between a surrounding
fluid (porewater or groundwater) and a bubble. The
model is simple and makes key assumptions regarding
bubble physics and the mechanics of growth and
release. We do not know the mechanism by which pri-
mary bubble nuclei are formed in the sediments [bub-
bles require a nucleus and cannot form due to
supersaturation alone (Boudreau, 2012)]. Because there
are no observations of nuclei or bubble growth in simi-
lar sediments, we can only speculate that at least one of
the two theorized bubble nuclei must be present; either
(1) a trapped-gas nucleus on a solid particle or (2) a pre-
formed stable bubble (Boudreau, 2012). We assume that
bubble nuclei set the boundary condition for diffusion
of supersaturated CH4 from the surrounding fluid into
a bubble until the concentration in the fluid and the
CH4 composition of the bubble are in thermodynamic
equilibrium. We also treated model bubbles as being
isobaric at a nominal depth (15 cm) in the sediments;
even though bubble pressure is not static during
growth, as it alternates in a distinct ‘sawtooth’ pattern
© 2014 John Wiley & Sons Ltd, Global Change Biology, doi: 10.1111/gcb.12614
12 J . T . CRAWFORD et al.

(Algar, 2009). It is typically understood that bubbles
will release from sediments when their total pressure
overcomes the overlying pressure and the resisting
forces of the overlying sediments (i.e. the fracture resis-
tance; Boudreau (2012), this point is also described as
the ‘critical size’ of a nonspheroid bubble. However,
bubbles may also rise through sediments via pseudo-
buoyancy (i.e. Weertman, 1971; Boudreau, 2012), a phe-
nomenon in which a pressure gradient exists across the
length of a bubble allowing for vertical transport. While
our analysis does not incorporate these complex
mechanics, our comparison of component gas (CH4)
partitioning between porewaters and bubbles using a
temperature-specific thermodynamic equilibrium
model has precedent (e.g. Baulch et al., 2011), and sup-
ports our hypothesis that CH4 in near-stream environ-
ments fuels bubble CH4 emissions. Clearly, data on
bubble formation and growth in shallow freshwater
environments are needed to fully examine these pat-
terns.
Connections to other chemical cycles and global change
Our data indicate that stream bubble composition is not
driven by sediment substrate and anoxia alone. Other
elemental cycles besides C and oxygen, including nitro-
gen and sulfur, interact to constrain methanogenesis.
Large dissolved CH4 concentrations (only in the near-
stream environment) were associated with least concen-
trations of oxidized nitrogen and sulfur (Fig. 7) likely
due to thermodynamic constraints which should favor
reactions such as sulfate reduction and nitrate reduc-
tion (denitrification) over methanogenesis. We predict
that a strong redox gradient in stream sediments and
along lateral riparian flowpaths (the anoxic band)
selects for discrete locations of methanogenesis where
more favorable terminal electron acceptors have been
depleted.
The observed connections between CH4 in porewa-
ters and groundwaters raise important questions
regarding future CH4 emissions in this region given
potential changes in atmospheric deposition or changes
following drought, which are both known to impact
dissolved elemental pools in regional surface waters
(Webster et al., 2000). Methanogenesis followed
expected patterns of thermodynamics where more
favorable terminal electron acceptors (oxygen, sulfate,
nitrate) limit CH4 build up in groundwaters. Therefore,
changes in nitrogen cycling or sulfur cycling in these
catchments could alter the patterns of groundwater bio-
geochemistry and CH4 emissions (e.g. Vile et al., 2003).
These patterns may also have implications for other
aquatic ecosystems that are impacted by anthropogenic
fluxes of nitrogen and sulfur, such as regions of high
atmospheric deposition or in agricultural regions
receiving high nitrogen and/or sulfur loads for crop
fertilization and soil management (e.g. Mulholland
et al., 2008; Hinckley & Matson, 2011). Even in the
absence of chemical changes to surface waters, altera-
tions to aquatic benthic/riparian ecosystems could lead
to changes in anoxia and methanogenesis. One example
would be sedimentation and organic matter deposition
to streams which could inhibit oxygen exchange and
promote CH4 production. Indeed, agriculturally driven
sedimentation of chalk streams in the United Kingdom
has been shown to enhance methanogenesis (100-fold
increase in porewater CH4) and CH4 evasion to the
atmosphere, with rates similar to peatlands (Sanders
et al., 2007).
Conclusions
CH4 ebullition from stream sediments represents an
important and mostly unrecognized mechanism of CH4
cycling in oxygenated aquatic landscapes – in addition
to diffusive fluxes. High CH4 fluxes from oxygenated
freshwater ecosystems like those reported here need to
be incorporated into global CH4 budgets. Our results
may also have implications for large-scale landscape
evolution and feedbacks on greenhouse gas balances.
Peat accumulation in former glacial lake basins in the
NHLD (e.g. Kratz & DeWitt, 1986; Ireland et al., 2013)
and subsequent stream development within these peat-
lands may alter the CH4 dynamics of these water and
carbon-rich northern landscapes by amplifying CH4
efflux via bubbles. However, a full comparison of lake,
wetland, and stream CH4 fluxes from this landscape is
needed to begin to evaluate this hypothesis. Other
workers have found high concentrations of CH4 in bub-
bles in organic-rich benthic environments (Higgins
et al., 2008; Baulch et al., 2011) and we have demon-
strated the capacity for near-stream groundwaters and
porewaters to support CH4 bubble formation and
release. But sandy, organic-poor sediments also yielded
high bubble CH4 fluxes indicating that many types of
alluvial stream environments could be sources of bub-
ble CH4. Clearly, more measurements of stream CH4
ebullition and diffusive fluxes, particularly in wetland
environments, are needed to accurately describe the
functional role of small streams in the global CH4
budget.
Acknowledgements
We thank Nick Gubbins and Brian Theisen for valuable assis-tance in the field and laboratory. Krista Hood and Brent Olsonhelped maintain field instrumentation and stream gages. Wethank Kimberly Wickland and two anonymous reviewers forthoughtful comments that helped to improve the manuscript.
© 2014 John Wiley & Sons Ltd, Global Change Biology, doi: 10.1111/gcb.12614
STREAM METHANE BUBBLING 13
This material is based upon work supported by the NationalScience Foundation under Cooperative Agreement #DEB-0822700, NTL LTER. Additional funding was provided by theU.S. Geological Survey Water, Energy and Biogeochemical Bud-gets Program. Any use of trade or product names is for descrip-tive purposes only and does not imply endorsement by the U.S.Government.
References
Algar CK (2009) Bubble growth and rise in soft fine-grained Sediments. PhD thesis,
Dalhousie University, Halifax, Nova Scotia.
Attig JW (1985) Pleistocene geology of Vilas County, Wisconsin. Wisconsin Geological
and Natural History Survey Information Circular, 50, 1–32.
Barber LE, Ensign JC (1979) Methane formation and release in a small Wisconsin lake.
Geomicrobiology Journal, 1, 341–353.
Bartlett KB, Crill PM, Sebacher DI, Harriss RC, Wilson JO, Melack JM (1988) Methane
flux from the central Amazon floodplain. Journal of Geophysical Research, 93, 1571–
1582.
Bastviken D, Cole J, Pace M, Tranvik L (2004) Methane emissions from lakes: depen-
dence of lake characteristics, two regional assessments, and a global estimate. Glo-
bal Biogeochemical Cycles, 18, 1–12.
Bastviken D, Tranvik LJ, Downing JA, Crill PM, Enrich-Prast A (2011) Freshwater
methane emissions offset the continental carbon sink. Science, 331, 50.
Baulch HM, Dillon PJ, Maranger R, Schiff SL (2011) Diffusive and ebullitive transport
of methane and nitrous oxide from streams: are bubble-mediated fluxes impor-
tant? Journal of Geophysical Research, 116, 1–15.
Boudreau BP (2012) The physics of bubbles in surficial, soft, cohesive sediments. Mar-
ine and Petroleum Geology, 38, 1–18.
Bridgham SD, Cadillo-Quiroz H, Keller JK, Zhuang Q (2013) Methane emissions from
wetlands: biogeochemical, microbial and modeling perspectives from local to glo-
bal scales. Global Change Biology, 19, 1323–1346.
Buffam I, Turner MG, Desai AR et al. (2011) Integrating aquatic and terrestrial com-
ponents to construct a complete carbon budget for a north temperate lake district.
Global Change Biology, 17, 1193–1211.
Butman D, Raymond PA (2011) Significant efflux of carbon dioxide from streams and
rivers in the United States. Nature Geoscience, 4, 839–842.
Casper P, Maberly SC, Hall GH, Finlay BJ (2000) Fluxes of methane and carbon diox-
ide from a small productive lake to the atmosphere. Biogeochemistry, 49, 1–19.
Chanton JP, Martens CS, Kelley CA (1989) Gas transport from methane-saturated,
tidal freshwater and wetland sediments. Limnology and Oceanography, 34,
807–819.
Chau YK, Snodgrass WJ, Wong PTS (1977) A sampler for collecting evolved gases
from sediment. Water Research, 11, 807–809.
Cole JJ, Prairie YT, Caraco NF et al. (2007) Plumbing the global carbon cycle: integrat-
ing inland waters into the terrestrial carbon budget. Ecosystems, 10, 171–184.
Comas X, Slater L, Reeve AS (2011) Atmospheric pressure drives changes in the verti-
cal distribution of biogenic free-phase gas in a northern peatland. Journal of Geo-
physical Research, 116.
Comas X, Wright W (2012) Heterogeneity of biogenic gas ebullition in subtropical
peat soils is revealed using time-lapse cameras. Water Resources Research, 48, 1–6.
Crawford JT, Striegl RG, Wickland KP, Dornblaser MM, Stanley EH (2013) Emissions
of carbon dioxide and methane from a headwater stream network of interior
Alaska. Journal of Geophysical Research, 118, 482–494.
Crawford JT, Lottig NR, Stanley EH, Walker JF, Hanson PC, Finlay JC, Striegl RG
(2014) CO2 and CH4 emissions from streams in a lake-rich landscape: patterns,
controls and regional significance. Global Biogeochemical Cycles, 28, 197–210.
Crill PM, Bartlett KB, Wilson JO et al. (1988) Tropospheric methane from an Amazo-
nian floodplain lake. Journal of Geophysical Research, 93, 1564–1570.
DelSontro T, McGinnis DF, Sobek S, Ostrovsky I, Wehrli B (2010) Extreme methane
emissions from a Swiss hydropower reservoir: contribution form bubbling sedi-
ments. Environmental Science and Technology, 44, 2419–2425.
DelSontro T, Kunz MJ, Kempter T, W€uest A, Wehrli B, Senn DB (2011) Spatial hetero-
geneity of methane ebullition in a large tropical reservoir. Environmental Science
and Technology, 45, 9866–9873.
Dlugokencky EJ, Nisbet EG, Fisher R, Lowry D (2011) Global atmospheric methane:
budget, changes and dangers. Philosophical Transactions of the Royal Society A, 369,
2058–2072.
Finlay JC (2003) Controls of streamwater dissolved inorganic carbon dynamics in a
forested watershed. Biogeochemistry, 62, 231–252.
Forster P, Ramaswamy V, Artaxo P et al. (2007) Changes in atmospheric constitu-
ents and in radiative forcing. In: Climate Change 2007: The Physical Science Basis.
Contribution of Working Group I to the Fourth Assessment Report of the Intergovern-
mental Panel on Climate Change (eds Soloman S, Qin D, Manning M, Chen Z,
Marquis M, Averyt KB, Tignor M, Miller HL), pp. 129–234. Cambridge Univer-
sity Press, Cambridge, UK.
Gudasz C, Bastviken D, Steger K, Premke K, Sobek S, Tranvik LJ (2010) Temperature-
controlled organic carbon mineralization rates in lakes. Nature, 466, 478–481.
Higgins TM, McCutchan JH, Lewis WM (2008) Nitrogen ebullition in a Colorado
plains river. Biogeochemistry, 89 , 367–377.
Hinckley ES, Matson PA (2011) Transformations, transport, and potential unintended
consequences of high sulfur inputs to Napa Valley vineyards. PNAS, 108,
14005–14010.
Hope D, Palmer S, Billett MF, Dawson JJC (2001) Carbon dioxide and methane
evasion from a temperate peatland stream. Limnology and Oceanography, 46,
847–857.
Hunt RJ, Anderson MP, Kelson VA (1998) Improving a complex finite-difference
groundwater flow model through the use of an analytic element screening model.
Ground Water, 36, 1011–1017.
Huttunen JT, Alm J, Liikanen A et al. (2003) Fluxes of methane, carbon dioxide and
nitrous oxide in boreal lakes and potential anthropogenic effects on the aquatic
greenhouse gas emissions. Chemosphere, 52, 609–621.
Ireland AW, Booth RK, Hotchkiss SC, Schmitz JE (2013) A comparative study of
within-basin and regional peatland development: implications for peatland carbon
dynamics. Quaternary Science Reviews, 61, 85–95.
Johnson CP, Pypker TG, Hribljan JA, Chimner RA (2013) Open top chambers and
infrared lamps: a comparison of heating efficacy and CO2/CH4 dynamics in a
northern Michigan peatland. Ecosystems, 16, 736–748.
Jones JB, Mulholland PJ (1998) Influence of drainage basin topography and elevation
on carbon dioxide and methane supersaturation of stream water. Biogeochemistry,
40, 57–72.
Joyce J, Jewell PW (2003) Physical controls on methane ebullition from reservoirs and
lakes. Environmental & Engineering Geoscience, 9, 167–178.
Keller M, Stallard RF (1994) Methane emission by bubbling from Gatun Lake, Pan-
ama. Journal of Geophysical Research, 99, 8307–8319.
Kelly CA, Chynoweth DP (1981) The contributions of temperature and of the input of
organic matter in controlling rates of sediment methanogenesis. Limnology and
Oceanography, 26, 891–897.
Kirshcke S, Bousquet P, Ciais P et al. (2013) Three decades of global methane sources
and sinks. Nature Geoscience, 6, 813–823.
Kling GW, Kipphut GW, Miller MC (1992) The flux of CO2 and CH4 from lakes and
rivers in arctic Alaska. Hydrobiologia, 240, 23–36.
Kratz TK, DeWitt CB (1986) Internal factors controlling peatland-lake ecosystem
development. Ecology, 67, 100–107.
Li J, Crowe SA, Miklesh D, Kistner M, Canfield DE, Katsev S (2012) Carbon minerali-
zation and oxygen dynamics in sediments with deep oxygen penetration, Lake
Superior. Limnology and Oceanography, 57, 1634–1650.
Lottig N (2009) Regional Aquatic Biogeochemistry of the Northern Highlands Lakes
District. PhD thesis, University of Wisconsin-Madison.
Lowry CS, Walker JF, Hunt RJ, Anderson MP (2007) Identifying spatial variability of
groundwater discharge in a wetland stream using a distributed temperature sen-
sor. Water Resources Research, 43, doi:10.1029/2007WR006145.
Lowry CS, Fratta D, Anderson MP (2009) Ground penetrating radar to identify mech-
anisms controlling spring flow in a peat dominated wetland. Journal of Hydrology,
373, 68–79.
Maeck A, DelSontro T, McGinnis DF et al. (2013) Sediment trapping by dams creates
methane emission hot spots. Environmental Science and Technology, 47, 8130–8137.
Mattson MD, Likens GE (1990) Air pressure and methane fluxes. Nature, 347,
718–719.
Mattson MD, Likens GE (1993) Redox reactions of organic matter decomposition in a
soft water lake. Biogeochemistry, 19, 149–172.
McGinnis DF, Greinert J, Artemov Y, Beaubien SE, W€uest A (2006) Fate of rising
methane bubbles in stratified waters: how much methane reaches the atmosphere?
Journal of Geophysical Research, 111, 1–15.
Michmerhuizen CM, Striegl RG, McDonald ME (1996) Potential methane emission
from north-temperate lakes following ice melt. Limnology and Oceanography, 41,
985–991.
Miller LG, Oremland RS (1988) Methane efflux form the pelagic regions of four lakes.
Global Biogeochemical Cycles, 2, 269–277.
Molongoski JJ, Klug MJ (1980) Anaerobic metabolism of particulate organic matter in
the sediments of a hypereutrophic lake. Freshwater Biology, 10, 507–518.
© 2014 John Wiley & Sons Ltd, Global Change Biology, doi: 10.1111/gcb.12614
14 J . T . CRAWFORD et al.
Mulholland PJ, Helton AM, Poole GC et al. (2008) Stream denitrification across bio-
mes and its response to anthropogenic nitrate loading. Nature, 452, 202–205.
Okwueze E (1983) Geophysical investigation of the bedrock and groundwater-lake
flow system in the Trout Lake region of Vilas County, northern Wisconsin. PhD
dissertation, Department of Geology and Geophysics, University of Wisconsin-
Madison.
Pint CD, Hunt RJ, Anderson MP (2003) Flowpath delineation and groundwater ages,
Allequash Basin, Wisconsin. Groundwater, 41, 895–902.
Pypker TG, Moore PA, Waddington JM, Hribljan JA, Chimner RC (2013) Shifting
environmental controls on CH4 fluxes in a sub-boreal peatland. Biogeosciences Dis-
cussions, 10, 11757–11784.
Raymond PA, Hartmann J, Lauerwald R et al. (2013) Global carbon dioxide emissions
from inland waters. Nature, 503, 355–359.
Sander R (1999) Compilation of Henry’s Law Constants for Inorganic and Organic
Species of Potential Importance in Environmental Chemistry. Available at: http://
www.henrys-law.org/henry.pdf (accessed 15 January 2014).
Sanders IA, Heppell CM, Cotton JA, Wharton G, Hildrew AG, Flowers EJ, Trimmer
M (2007) Emission of methane from chalk streams has potential implications for
agricultural practices. Freshwater Biology, 52, 1176–1186.
dos Santos MA, Rosa LP, Sikar B, Sikar E, dos Santos EO (2006) Gross greenhouse gas
fluxes from hydro-power reservoir compared to thermo-power plants. Energy Pol-
icy, 34, 481–488.
Schindler JE, Krabbenhoft DP (1998) The hyporheic zone as a source of dissolved
organic carbon and carbon gases to a temperate forested stream. Biogeochemistry,
43, 157–174.
Small GE, Cotner JB, Finlay JC, Stark RA, Sterner RW (2013) Nitrogen transformations
at the sediment–water interface across redox gradients in the Laurentian Great
Lakes. Hydrobiologia, 731, 95–108.
Smith LK, Lewis WM Jr, Chanton JP, Cronin G, Hamilton SK (2000) Methane emis-
sions from the Orinoco River floodplain, Venezuela. Biogeochemistry, 51, 113–140.
Sorrell BK, Boon PI (1992) Biogeochemistry of billabong sediments. II. Seasonal varia-
tions in methane production. Freshwater Biology, 27, 435–445.
Stamp I, Baird AJ, Heppell CM (2013) The importance of ebullition as a mechanism of
methane (CH4) loss to the atmosphere in a northern peatland. Geophysical Research
Letters, 40, 1–4.
Strayer RG, Tiedje JM (1978) In situ methane production in a small, hypereutrophic,
hardwater lake: loss of methane from sediments by vertical diffusion and ebulli-
tion. Limnology and Oceanography, 23, 1201–1206.
Striegl RG, Dornblaser MM, McDonald CP, Rover JR, Stets EG (2012) Carbon dioxide
and methane emissions from the Yukon River system. Global Biogeochemical Cycles,
26, 1–11.
Tokida T, Miyazaki T, Mizoguchi M, Nagata O, Takakai F, Kagemoto A, Hatano R
(2007) Falling atmospheric pressure as a trigger for methane ebullition peatland.
Global Biogeochemical Cycles, 21, 1–8.
Varadharajan C, Hemond HF (2012) Time-series analysis of high-resolution ebullition
fluxes from a stratified, freshwater lake. Journal of Geophysical Research, 117, 1–15.
Vile MA, Bridgham SD, Wieder R.K.m and Nov�ak M. (2003) Atmospheric sulfur
deposition alters pathways of gaseous carbon production in peatlands. Global Bio-
geochemical Cycles, 17, 1–7.
Walker JF, Hunt RJ, Bullen TD, Krabbenhoft DP, Kendall C (2003) Variability of iso-
tope and major ion chemistry in the Allequash Basin, Wisconsin. Ground Water, 41,
883–894.
Walter BP, Heimann M, Matthews E (2001) Modeling modern methane emissions
from natural wetlands 2. Interannual variations 1982-1993. Journal of Geophysical
Research, 106, 34189–34206.
Walter KM, Zimov SA, Chanton JP, Verbyla D, Chapin FS III (2006) Methane bub-
bling from Siberian thaw lakes as a positive feedback to climate warming. Nature,
443, 71–75.
Watters JR, Stanley EH (2007) Stream channels in peatlands: the role of biological pro-
cesses in controlling channel form. Geomorphology, 89, 97–110.
Webster KE, Soranno PA, Baines SB et al. (2000) Structuring features of lake districts:
landscape controls on lake chemical responses to drought. Freshwater Biology, 43,
499–515.
Weertman J (1971) Theory of water-filled crevasses in glaciers applied to vertical
magma transport beneath oceanic ridges. Journal of Geophysical Research, 76,
1171–1183.
Wehenmeyer CE (1999) Methane emissions from beaver ponds: rates, patterns, and
transport mechanisms. Global Biogeochemical Cycles, 13, 1079–1090.
Werner SF, Browne BA, Driscoll CT (2012) Three-dimensional spatial patterns of trace
gas concentrations in baseflow-dominated agricultural streams: implications for
surface-ground water interactions and biogeochemistry. Biogeochemistry, 107,
319–338.
Wik M, Crill PM, Varner RK, Bastviken D (2013) Multiyear measurements of ebull-
itive methane flux from three subarctic lakes. Journal of Geophysical Research, 118,
1307–1321.
Wilcock RJ, Sorrell BK (2008) Emissions of greenhouse gases CH4 and N2O from low-
gradient streams in agriculturally developed catchments. Water Air and Soil Pollu-
tion, 188, 155–170.
Wilhelm E, Battino R, Wilcock RJ (1977) Low-pressure solubility of gases in liquid
water. Chemical Reviews, 77, 219–262.
Wilson JO, Crill PM, Bartlett KB, Sebacher DI, Harriss RC, Sass RL (1989) Seasonal
variation of methane emissions form a temperate swamp. Biogeochemistry, 8,
55–71.
Supporting Information
Additional Supporting Information may be found in theonline version of this article:
Figure S1. Cross-section of groundwater sampling locations;dissolved oxygen, and CH4 concentrations for each class aregiven in Table 1; see Walker et al. (2003) and Pint et al.(2003) for a thorough description of groundwater flowpathsin this catchment.Figure S2. Time series subset of ebullition rates from threetraps compared to atmospheric pressure (AtmP, gray line).Figure S3. Correlogram for all 30 bubble traps (in ascendingorder) from the Allequash Creek transect; lower left panel:the blue color indicates significant positive correlationbetween traps with darker shading indicating greater corre-lation coefficients; upper right panel: a secondary visualiza-tion of the correlations, blue color also indicates positivecorrelation, and the correlation coefficient corresponds tothe area of the filled pie.
© 2014 John Wiley & Sons Ltd, Global Change Biology, doi: 10.1111/gcb.12614
STREAM METHANE BUBBLING 15
Related Documents