National Compensation Survey: Employee Benefits in Private Industry in the United States, March 2004 S ixty-nine percent of workers in private industry had access to medical care, and 53 percent participated in medical care plans in March of 2004. Fifty-nine per- cent had access to retirement benefits, and 50 percent par- ticipated in a retirement plan of at least one type. Fifty-three percent of workers had access to defined contribution plans, and 42 participated. For the first time, new data on access to and participation in selected employee benefits were pub- lished simultaneously under the National Compensation Survey (NCS). This summary presents NCS benefits data for • Worker characteristics • Establishment characteristics • Geographic areas The difference between access to employee benefit pro- grams and participation in those programs, as these con- cepts are used in the survey, are as follows: • Access to a benefit plan: Employees are considered as having access to a benefit plan if it is available for their use. For example, if an employee is permitted to partici- pate in a medical care plan offered by the employer, but the employee declines to do so, he or she is placed in a category with those having access to medical care. • Participation in a benefit plan: Employees in contri- butory plans are considered as participating in an insur- ance or a retirement plan if they have paid required contributions and fulfilled any applicable service require- ments. Employees in noncontributory plans are counted as participating regardless of whether they have ful- filled their service requirements. Note that term incidence can refer to either rates of access or participation in a benefit plan. In addition to presenting data on access to benefit plans, the tables in this release include data on days of paid vaca- tions and holidays, provisions of life insurance plans, and employee contributions to costs of medical care premiums, and the share of costs between employees and employers. Corrected nonproduction bonus data are available at www.bls.gov/ncs/ebs/nonproductionbonus.htm U.S. Department of Labor, Bureau of Labor Statistics November 2004 Summary 04-04 Major findings • Three-fifths of private establishments offered health insurance to employees in March 2004, and about half of establishments offered retirement plans. 1 (See table 3.) • Paid leave was the most commonly provided employee benefit in the private sector: paid vacations and holi- days were available to 77 percent of employees. Paid jury duty leave was also common, available to 70 per- cent of workers. Half of the workers had paid military leave benefits. (See table 8.) • Most employees covered by medical care plans were in plans requiring employee contributions for both single coverage and family coverage. Employee contri- butions to medical care premiums averaged $264.59 per month for family coverage; for single coverage, em- ployee contributions averaged $67.57 per month. (See table 4.) • Twenty-one percent of employees were in defined bene- fit plans, and 42 percent were covered by defined con- tribution plans. (Some employees participate in both types.) The overall coverage of retirement plans has held relatively steady for the last few years. • Fifty-one percent of workers had access to life insur- ance, and nearly as many, 48 percent, participated. Short- and long-term disability benefits were available to 39 and 30 percent of workers, respectively, and nearly all participated. Access and participation compared Eighty-five percent of workers with access to retirement plans of some type participated in defined benefit or defined con- tribution plans, or in both types of plans. Virtually all work- 1 Almost all of NCS benefits data are expressed in terms of percent- ages of employees covered by a benefit or a provision. Data on the proportion of establishments offering employee benefits were pro- duced for the first time in 2003.

Welcome message from author
This document is posted to help you gain knowledge. Please leave a comment to let me know what you think about it! Share it to your friends and learn new things together.
Transcript

1
National Compensation Survey:Employee Benefits in Private Industryin the United States, March 2004
Sixty-nine percent of workers in private industry hadaccess to medical care, and 53 percent participated inmedical care plans in March of 2004. Fifty-nine per-
cent had access to retirement benefits, and 50 percent par-ticipated in a retirement plan of at least one type. Fifty-threepercent of workers had access to defined contribution plans,and 42 participated. For the first time, new data on access toand participation in selected employee benefits were pub-lished simultaneously under the National CompensationSurvey (NCS). This summary presents NCS benefits data for
• Worker characteristics• Establishment characteristics• Geographic areas
The difference between access to employee benefit pro-grams and participation in those programs, as these con-cepts are used in the survey, are as follows:
• Access to a benefit plan: Employees are considered ashaving access to a benefit plan if it is available for theiruse. For example, if an employee is permitted to partici-pate in a medical care plan offered by the employer, butthe employee declines to do so, he or she is placed ina category with those having access to medical care.
• Participation in a benefit plan: Employees in contri-butory plans are considered as participating in an insur-ance or a retirement plan if they have paid requiredcontributions and fulfilled any applicable service require-ments. Employees in noncontributory plans are countedas participating regardless of whether they have ful-filled their service requirements.
Note that term incidence can refer to either rates of accessor participation in a benefit plan.
In addition to presenting data on access to benefit plans,the tables in this release include data on days of paid vaca-tions and holidays, provisions of life insurance plans, andemployee contributions to costs of medical care premiums,and the share of costs between employees and employers.
Corrected nonproduction bonus data are available at www.bls.gov/ncs/ebs/nonproductionbonus.htm U.S. Department of Labor, Bureau of Labor StatisticsNovember 2004
Summary 04-04
Major findings
• Three-fifths of private establishments offered healthinsurance to employees in March 2004, and about halfof establishments offered retirement plans.1 (See table3.)
• Paid leave was the most commonly provided employeebenefit in the private sector: paid vacations and holi-days were available to 77 percent of employees. Paidjury duty leave was also common, available to 70 per-cent of workers. Half of the workers had paid militaryleave benefits. (See table 8.)
• Most employees covered by medical care plans werein plans requiring employee contributions for bothsingle coverage and family coverage. Employee contri-butions to medical care premiums averaged $264.59per month for family coverage; for single coverage, em-ployee contributions averaged $67.57 per month. (Seetable 4.)
• Twenty-one percent of employees were in defined bene-fit plans, and 42 percent were covered by defined con-tribution plans. (Some employees participate in bothtypes.) The overall coverage of retirement plans hasheld relatively steady for the last few years.
• Fifty-one percent of workers had access to life insur-ance, and nearly as many, 48 percent, participated. Short-and long-term disability benefits were available to 39and 30 percent of workers, respectively, and nearly allparticipated.
Access and participation comparedEighty-five percent of workers with access to retirement plansof some type participated in defined benefit or defined con-tribution plans, or in both types of plans. Virtually all work-
1 Almost all of NCS benefits data are expressed in terms of percent-ages of employees covered by a benefit or a provision. Data on theproportion of establishments offering employee benefits were pro-duced for the first time in 2003.
2
ers with access to defined benefit plans participated in them,while only 79 percent of those with access to defined contri-bution plans participated. The ratios of participation to ac-cess were closer for life insurance and disability benefit plans,which are usually paid for entirely by the employer, thanmedical and defined contribution benefit plans, which oftenrequire employees to contribute toward coverage.
Variations in ratios of participation to access were ob-served across employee groups. For example, while 78 per-cent of white-collar workers with access to medical care par-ticipated in a medical plan, only 57 percent of service work-ers with such access participated. Those in occupations av-eraging $15 an hour or more chose to participate in definedcontribution plans in greater proportions than those in oc-cupations averaging under $15 an hour; the rates were 87and 73 percent, respectively.
Worker characteristicsAccess to and participation in benefit plans varied by occu-pational group, full- and part-time work schedule, union sta-tus, and earnings. For example, workers in white-collar occu-pations were more likely to participate in defined contribu-tion plans than were service workers. Union workers hadhigher rates of coverage for most benefits. Paid leave ben-efits (vacations, holidays, etc.) were commonly available tomany workers, but were reported much less frequently forpart-time workers and more frequently for white-collar work-ers than for service workers. Paid sick leave and vacationswere particularly less common among part-time workers.
Those in jobs averaging $15 an hour or more were farmore likely to be covered by all benefits. The difference wasparticularly striking in the incidence of long-term disabilityinsurance: only 17 percent of those earning under $15 hadaccess to such coverage, compared with 48 percent of thosein the higher earnings category.
Thirty-nine percent of all workers had access to short-term disability benefits, other than paid sick leave, while 30percent had access to long-term disability benefits. (See table12.) The incidence of employee benefits varied considerablyby the full- and part-time status of employees. Access to lifeinsurance, in particular, was 6 times greater for full-time work-ers. Access to other major benefits was also several timesgreater for full- than for part-time workers.
Union workers generally enjoyed greater access to ben-efits. The rate of access to defined benefit plans was 4 timeshigher among union than among nonunion workers. Accessto defined contribution plans and long-term disability plansdid not follow this pattern, however.
Establishment characteristicsThe incidence of benefits varied by industry, establishmentsize, and location. Benefits were more commonly offered toworkers in goods-producing than to those in service-pro-ducing industries. Workers in medium and large private sec-tor establishments (those employing 100 employees or more)were more likely to have access to a variety of benefits. The
differences were more pronounced in coverage for retire-ment and insurance benefits than for paid leave benefits.
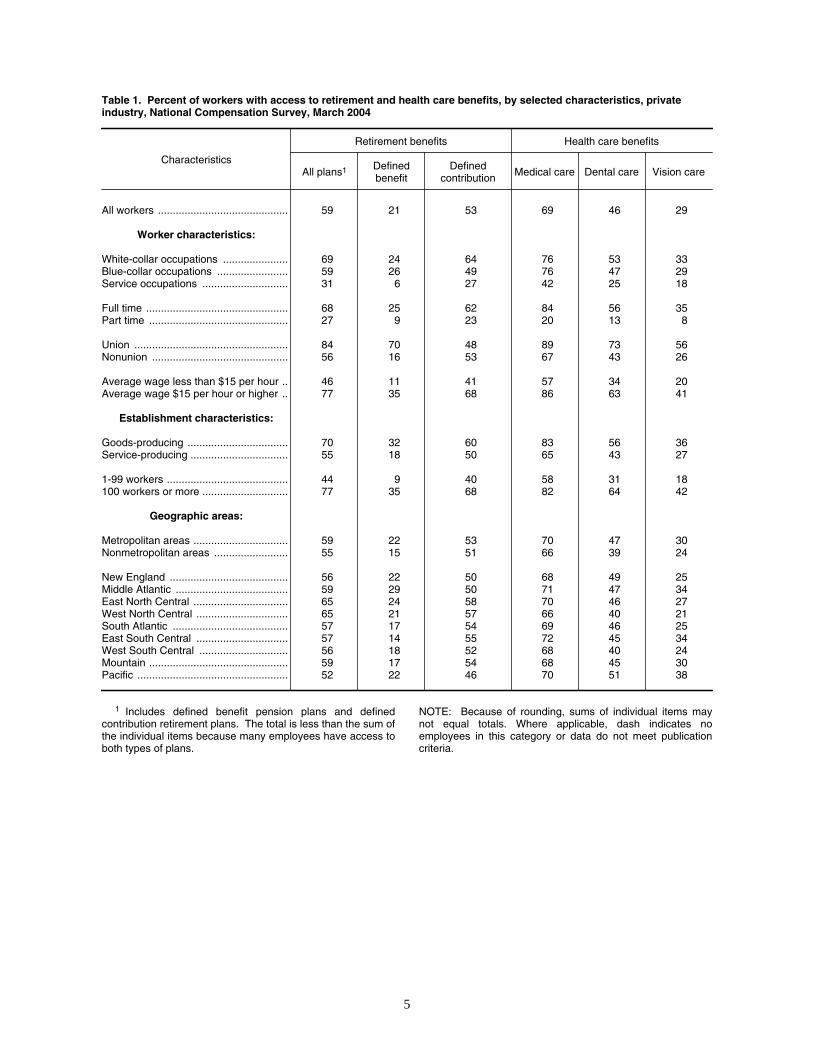
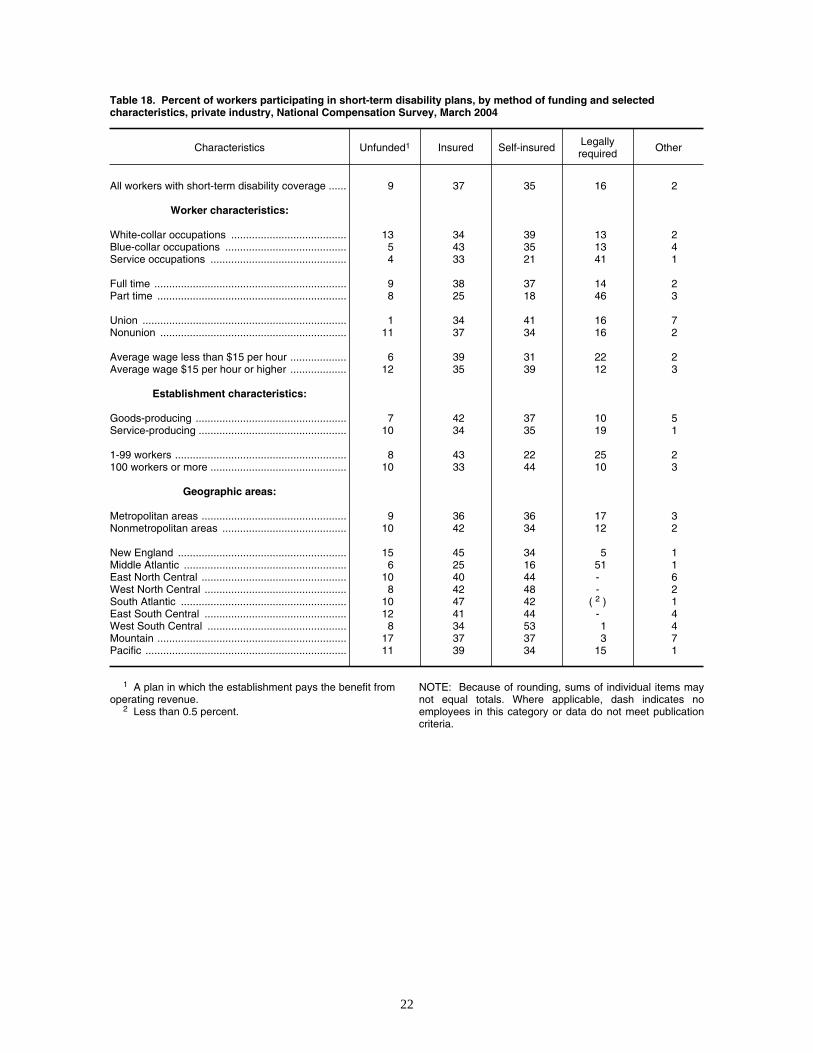
Data on the incidence of benefits by census division havebeen produced since 2003. Of the nine census divisions, theEast South Central region showed higher rates of access tomany benefits. While generally the incidence of benefits didnot vary by census region as much as by other characteris-tics, retirement benefits were significantly less common inthe Pacific region, where 52 percent of workers had access tothem, than in the East South Central- and the West SouthCentral regions, where 65 percent enjoyed such access. Short-term disability benefits were at least twice as prevalent amongworkers in the Middle Atlantic region as they were in almostall other regions, the result of State mandates to providethese benefits to employees in New York and New Jersey.
Defined contribution retirement and life insurance werethe only benefits to which access was similar in both metro-politan and nonmetropolitan areas. Access to all other ben-efits was higher for workers in metropolitan areas.
Workers in goods-producing industries enjoyed higherrates of access to retirement, health care, life insurance, andshort-term disability benefits than did workers in service-producing industries. Workers in medium and large privateestablishments (those with 100 employees or more) enjoyedhigher rates of access to retirement and health benefits thandid their counterparts in small establishments.
There were sharp differences in the availability of majoremployee benefits between larger and smaller establishments.Nearly all larger establishments (those employing 100 work-ers or more) offered health care benefits, compared with three-fifths of the smaller establishments. Larger establishmentswere nearly twice as likely as smaller establishments to offerretirement plans. The data show that the provision of healthcare benefits to retirees is fairly rare, except for establish-ments of 100 workers or more. Some significant variations bycensus regions were observed in the availability of retire-ment and health benefits. Nearly twice as many establish-ments offered defined benefit plans in the East North Centralregion as in the East South Central. The proportion of em-ployers offering health care benefits ranged from a low of 53percent in the Mountain region to a high of 78 percent in theEast North Central region. (See table 3.)
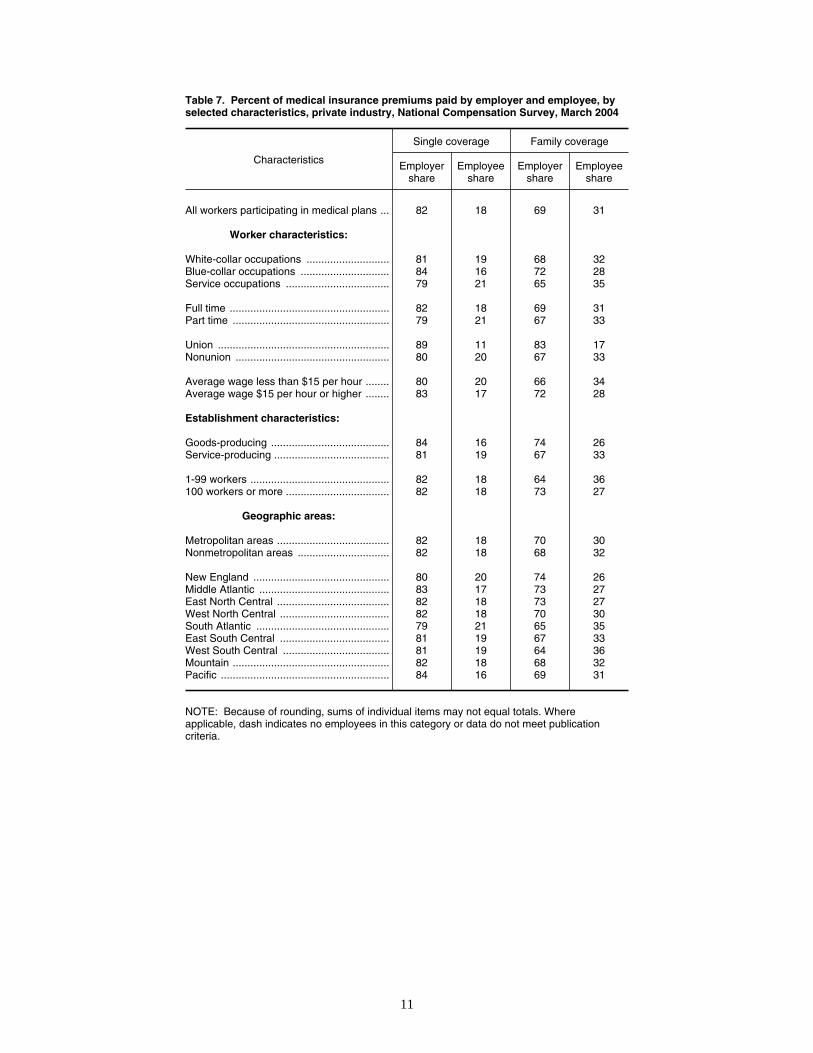
Contributions to medical careOn average, employees paid 18 percent of the medical carepremium for single coverage and 31 percent of the premiumfor family coverage. (See the Technical Note for further de-tails.) Union workers paid 11 percent, while their nonunioncounterparts paid 20 percent of medical premiums.
The share of employee premiums for family coverage wasalso higher for nonunion workers: 33 percent compared with17 percent. (See table 7.) The employee share of family cov-erage premiums was higher for workers in service-producingindustries than for those in goods-producing industries andwas also higher for workers in small establishments (thosewith fewer than 100 employees).
3
Available days of paid holidays and vacationsThe number of days of paid vacations typically increasesthe longer workers remain on the job. After 1 year of service,workers were eligible for 8.9 days of paid vacations, on aver-age; after 25 years, this number increased to 19.2. (See table10.) Days of paid vacations available to workers also variedby worker, establishment, and geographic characteristics.For example, at 1 year of service, union and nonunion work-ers were eligible for almost the same number of days, whereasafter 25 years of service, union workers enjoyed 5 more paidvacation days than did nonunion workers. Those in occupa-tions with hourly pay averaging under $15 were granted lessgenerous vacation benefits at all levels of service.
Workers in service-producing industries, workers in met-ropolitan areas, and those in medium and large establish-ments also earned more vacation days at all levels of service.
Variation was observed across occupational groups: af-ter 1 year, a 5-day yearly paid vacation was the most commonamong blue-collar workers. For white-collar workers, it was a10-day vacation, but among service occupations, a 10-daypaid vacation was not common until the 3-year service markwas reached. Longer vacations, such as those lasting morethan 20 days, were offered to 40 percent of white-collar work-ers after 25 years of service, while only 27 percent of blue-collar workers and 26 percent of service workers were eli-gible for so many days after 25 years on the job.
Workers in private industry were eligible for 8 paid holi-days per year, on average. Service, part-time, and nonunionworkers, as well as those in occupations with hourly payaveraging under $15, tended to be eligible for fewer daysthan were workers in other categories. (See table 9.)
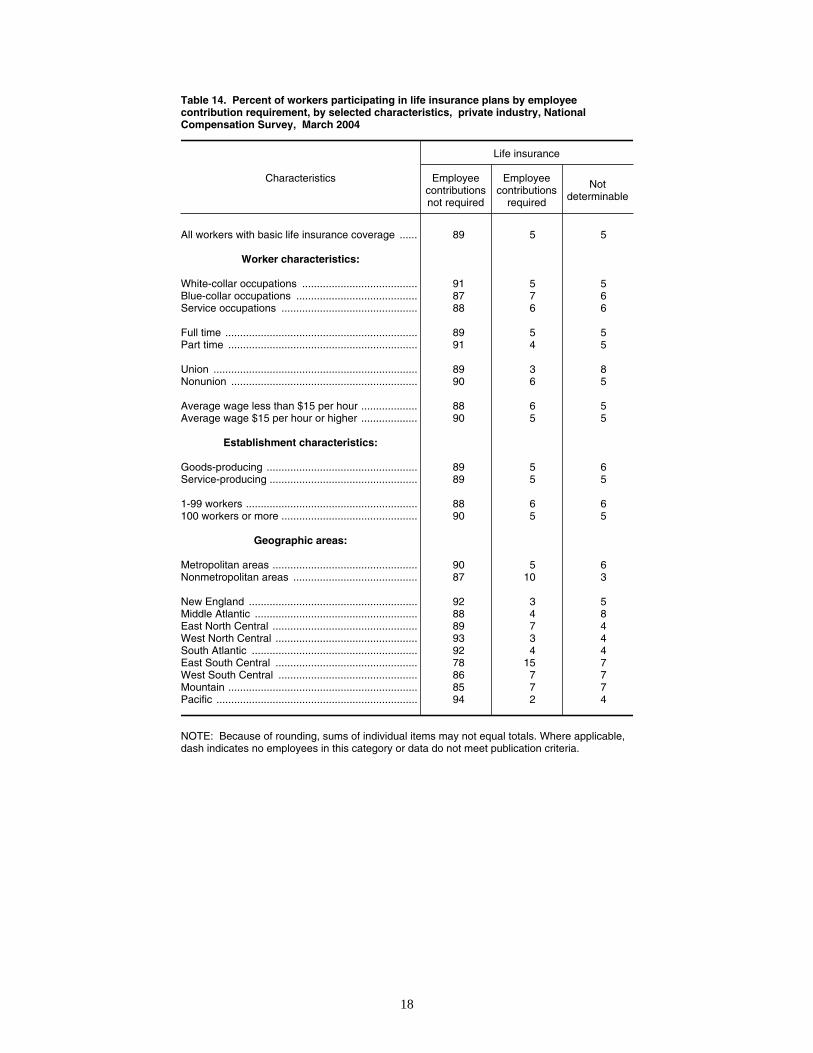
Details of provisions of life insurance plansEmployee contributions toward life insurance benefits typi-cally were not required. Eighty-nine percent of workers withlife insurance did not have to contribute toward this benefit.(See table 14.) The “fixed multiple of earnings” formula usedin calculating life insurance benefits was the most common:fifty-three percent of workers were in plans using this for-mula. The other common formula was the “flat dollar amount”formula (covering 35 percent of workers). However, varia-tions among worker groups were significant. White-collarworkers were more commonly enrolled in fixed multiple ofearnings plans than in the other types of plans, while blue-collar workers were more often covered by plans using flat
dollar amount formulas. Part-time workers participating inlife insurance plans were more commonly offered flat dollaramount formulas than were their full-time counterparts. Flatdollar amount plans also were more commonly offered tounion than to nonunion workers. (See table 17.)
When multiple of earnings formulas were applied, white-collar workers were almost twice as likely as service workersto have the amount of their benefit calculated by multiplyingearnings by the factor of 2. (See table 16.) The majority ofworkers in service occupations (69 percent) were in plansthat paid a benefit amount equal to 1 year’s worth of salary(that is, salary multiplied by 1). Seventy-one percent of unionworkers also had their benefit calculated based on the factorof 1. When the life insurance benefit was a flat dollar amount,employee characteristics and geographic regions tended toplay the biggest role in determining the payment amounts.(See table 17.)
Workers in occupations averaging hourly pay under $15were more likely to be in plans with payments under $15,000and significantly less likely to be in plans offering paymentsof $30,000 or more than were workers in occupations withaverage pay of $15 or more per hour.
Service workers also were more likely to participate inplans with lower payments than were the other two occupa-tional groups. Workers in goods-producing establishmentstended to have slightly higher payouts than did those inservice-producing industries.
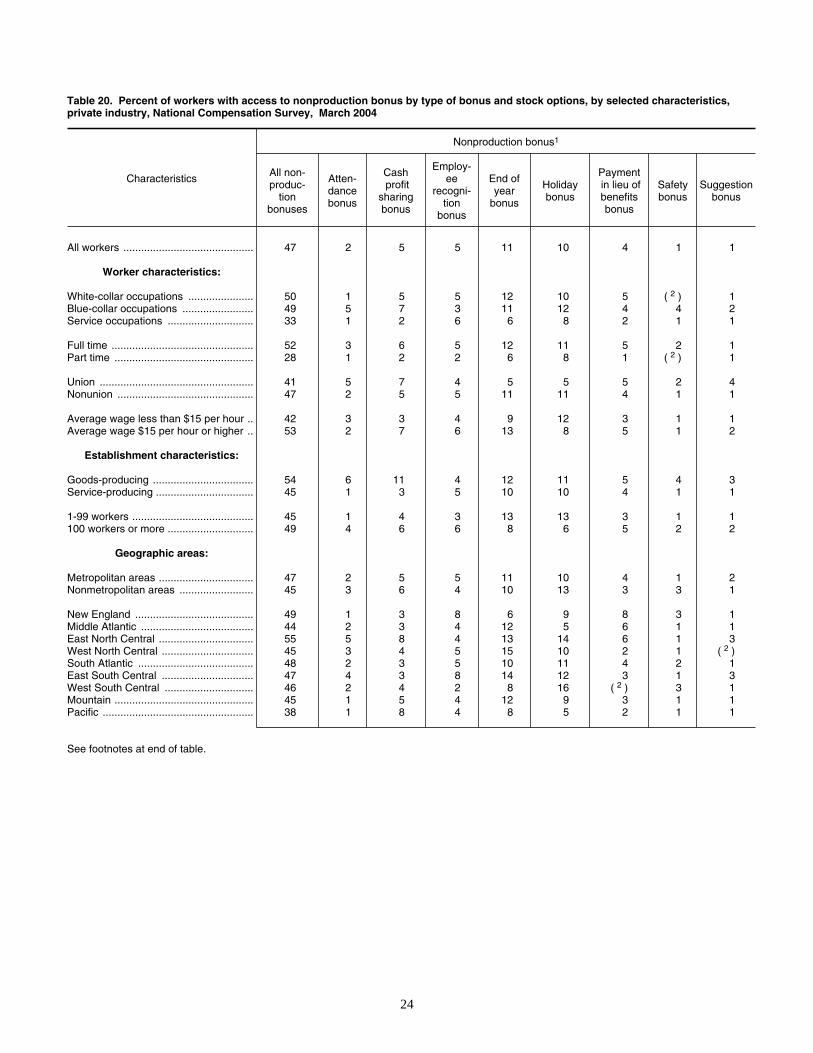
Other findingsData also were produced on methods of funding of short-term disability plans. (See table 18.) Most of the workers withshort-term disability coverage were in self-insured and in-sured plans. The incidence of legally required plans washighest in the Middle Atlantic division, where the benefit isrequired by the States of New Jersey and New York. Workersin white-collar occupations had greater access to stock op-tions than did workers in the other two occupational groups.Twelve percent of white-collar workers had access to thisbenefit, compared with 6 percent of blue-collar workers andonly 2 percent of workers in service occupations. Full-timeworkers were twice as likely as part-time workers to haveaccess to stock options. Full-time workers had greater ac-cess to bonuses of all types than part-time workers had.Nonunion workers had greater access to bonuses of all typesand to stock options than union workers had.

4
Note on Health Care Benefits
The estimates for March 2004 of the percent of workers with access to and participating in health insurancebenefits (medical care, dental care, and vision care) are not comparable to the estimates published for March 2003.As part of the process for developing the March 2004 estimates, BLS implemented a data imputation technique toaccount for missing information on type of health plan. The 2003 data for access and participation in healthinsurance benefits have been recalculated using this technique. Tables showing the recalculated data, with addi-tional information about the change in method, can be found on the BLS Web site at http://www.bls.gov/ncs/ebs/notice112004.htm. The recalculated 2003 data and the 2004 data are comparable with health benefits data pub-lished by BLS for earlier years.
5
Table 1. Percent of workers with access to retirement and health care benefits, by selected characteristics, privateindustry, National Compensation Survey, March 2004
Characteristics
Retirement benefits Health care benefits
All plans1 Definedbenefit
Definedcontribution Medical care Dental care Vision care
All workers ............................................ 59 21 53 69 46 29
Worker characteristics:
White-collar occupations ...................... 69 24 64 76 53 33Blue-collar occupations ........................ 59 26 49 76 47 29Service occupations ............................. 31 6 27 42 25 18
Full time ................................................ 68 25 62 84 56 35Part time ............................................... 27 9 23 20 13 8
Union .................................................... 84 70 48 89 73 56Nonunion .............................................. 56 16 53 67 43 26
Average wage less than $15 per hour .. 46 11 41 57 34 20Average wage $15 per hour or higher .. 77 35 68 86 63 41
Establishment characteristics:
Goods-producing .................................. 70 32 60 83 56 36Service-producing ................................. 55 18 50 65 43 27
1-99 workers ......................................... 44 9 40 58 31 18100 workers or more ............................. 77 35 68 82 64 42
Geographic areas:
Metropolitan areas ................................ 59 22 53 70 47 30Nonmetropolitan areas ......................... 55 15 51 66 39 24
New England ........................................ 56 22 50 68 49 25Middle Atlantic ...................................... 59 29 50 71 47 34East North Central ................................ 65 24 58 70 46 27West North Central ............................... 65 21 57 66 40 21South Atlantic ....................................... 57 17 54 69 46 25East South Central ............................... 57 14 55 72 45 34West South Central .............................. 56 18 52 68 40 24Mountain ............................................... 59 17 54 68 45 30Pacific ................................................... 52 22 46 70 51 38
1 Includes defined benefit pension plans and definedcontribution retirement plans. The total is less than the sum ofthe individual items because many employees have access toboth types of plans.
NOTE: Because of rounding, sums of individual items maynot equal totals. Where applicable, dash indicates noemployees in this category or data do not meet publicationcriteria.

6
Table 2. Percent of workers participating in health care and retirement benefits, by selected characteristics, privateindustry, National Compensation Survey, March 2004
Characteristics
Retirement benefits Health care benefits
All plans1 Definedbenefit
Definedcontribution Medical care Dental care Vision care
All workers ............................................ 50 21 42 53 37 22
Worker characteristics:
White-collar occupations ...................... 61 24 53 59 43 25Blue-collar occupations ........................ 50 25 38 60 40 25Service occupations ............................. 22 6 18 24 16 11
Full time ................................................ 60 24 50 66 46 27Part time ............................................... 20 9 14 11 8 6
Union .................................................... 81 69 42 81 68 50Nonunion .............................................. 47 15 42 50 33 19
Average wage less than $15 per hour .. 36 11 30 40 26 15Average wage $15 per hour or higher .. 71 35 59 71 53 33
Establishment characteristics:
Goods-producing .................................. 63 31 49 69 49 30Service-producing ................................. 47 18 40 48 33 20
1-99 workers ......................................... 37 9 32 43 24 14100 workers or more ............................. 67 34 53 64 52 32
Geographic areas:
Metropolitan areas ................................ 51 22 42 54 38 23Nonmetropolitan areas ......................... 45 15 39 48 31 18
New England ........................................ 50 22 42 49 38 17Middle Atlantic ...................................... 54 29 42 53 38 24East North Central ................................ 57 23 48 54 39 22West North Central ............................... 55 21 45 51 32 17South Atlantic ....................................... 47 16 41 52 35 19East South Central ............................... 46 13 42 52 36 25West South Central .............................. 46 17 39 54 33 20Mountain ............................................... 46 17 39 51 38 23Pacific ................................................... 46 22 36 55 41 30
1 Includes defined benefit pension plans and definedcontribution retirement plans. The total is less than the sum ofthe individual items because many employees participated inboth types of plans.
NOTE: Because of rounding, sums of individual items maynot equal totals. Where applicable, dash indicates noemployees in this category or data do not meet publicationcriteria.

7
Table 3. Percent of establishments offering health and retirement benefits, and retiree health benefits, by establishmentcharacteristics, private industry, National Compensation Survey, March 2004
Characteristics
Retirement benefits Health care benefits2
All plans1 Definedbenefit
Definedcontribution
For currentworkers
For retireesunder age 65
For retireesage 65 and
older
All establishments ................................. 48 10 46 61 5 4
Establishment characteristics:
Goods-producing .................................. 49 12 45 64 3 3Service-producing ................................. 48 10 46 61 5 4
1-99 workers ......................................... 46 9 44 60 4 3100 workers or more ............................. 89 29 85 96 13 12
Geographic areas:
Metropolitan areas ................................ 50 10 48 62 4 4Nonmetropolitan areas ......................... 39 11 38 57 5 4
New England ........................................ 54 11 53 64 2 2Middle Atlantic ...................................... 50 14 46 65 7 6East North Central ................................ 60 13 57 78 5 4West North Central ............................... 49 12 47 45 3 2South Atlantic ....................................... 52 5 51 56 3 3East South Central ............................... 31 4 30 59 4 4West South Central .............................. 42 9 41 59 6 5Mountain ............................................... 37 9 35 53 3 3Pacific ................................................... 41 13 40 63 6 6
1 Includes defined benefit pension plans and definedcontribution retirement plans. The total is less than the sum ofthe individual items because many employers offer both typesof plans.
2 Health care may include a medical plan, or a separatedental, vision, or prescription drug plan.
NOTE: Because of rounding, sums of individual items maynot equal totals. Where applicable, dash indicates noemployees in this category or data do not meet publicationcriteria.

8
Table 4. Percent of medical insurance participants required to contribute and average employee contribution forsingle and family coverage, by selected characteristics, private industry, National Compensation Survey, March2004
Characteristics
Single coverage Family coverage
Employeecontribu-tions notrequired
Employeecontribu-
tionsrequired
Average flatmonthly
contributionin dollars1
Employeecontribu-tions notrequired
Employeecontribu-
tionsrequired
Average flatmonthly
contributionin dollars1
Total ...................................................... 24 76 $67.57 11 89 $264.59
Worker characteristics:
White-collar occupations ...................... 22 78 69.07 9 91 271.60Blue-collar occupations ........................ 30 70 63.15 16 84 242.81Service occupations ............................. 19 81 72.40 9 91 294.58
Full time ................................................ 24 76 67.05 11 89 263.65Part time ............................................... 29 71 78.61 17 83 284.66
Union .................................................... 43 57 56.53 33 67 195.12Nonunion .............................................. 21 79 68.98 7 93 273.51
Average wage less than $15 per hour .. 21 79 70.27 8 92 275.81Average wage $15 per hour or higher .. 27 73 65.22 14 86 255.05
Establishment characteristics:
Goods-producing .................................. 26 74 59.89 15 85 221.25Service-producing ................................. 23 77 70.63 10 90 281.44
1-99 workers ......................................... 33 67 74.02 13 87 307.78100 workers or more ............................. 17 83 63.33 10 90 231.23
Geographic areas:
Metropolitan areas ................................ 24 76 67.56 11 89 262.99Nonmetropolitan areas ......................... 24 76 67.62 10 90 274.02
New England ........................................ 16 84 69.37 9 91 224.98Middle Atlantic ...................................... 27 73 67.43 16 84 246.61East North Central ................................ 24 76 67.73 16 84 252.62West North Central ............................... 23 77 66.60 14 86 258.23South Atlantic ....................................... 21 79 72.02 5 95 293.72East South Central ............................... 21 79 64.16 6 94 247.83West South Central .............................. 19 81 66.49 3 97 288.84Mountain ............................................... 21 79 64.04 11 89 269.86Pacific ................................................... 35 65 65.19 15 85 260.51
1 The average employee contribution does not includeplans where the employer pays the full cost.NOTE: Because of rounding, sums of individual items
may not equal totals. Where applicable, dash indicates noemployees in this category or data do not meet publicationcriteria.
9
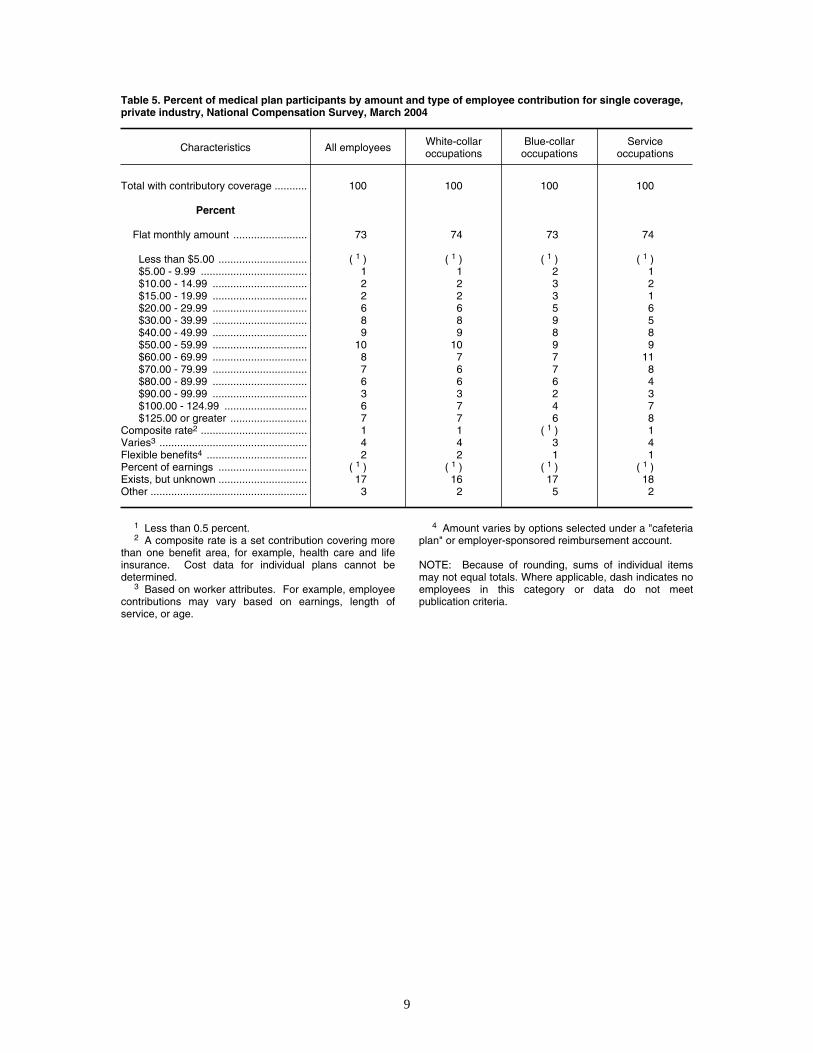
Table 5. Percent of medical plan participants by amount and type of employee contribution for single coverage, private industry, National Compensation Survey, March 2004
Characteristics All employees White-collaroccupations
Blue-collaroccupations
Serviceoccupations
Total with contributory coverage ........... 100 100 100 100
Percent
Flat monthly amount ......................... 73 74 73 74
Less than $5.00 .............................. 1( ) 1( ) 1( ) 1( ) $5.00 - 9.99 .................................... 1 1 2 1 $10.00 - 14.99 ................................ 2 2 3 2 $15.00 - 19.99 ................................ 2 2 3 1 $20.00 - 29.99 ................................ 6 6 5 6 $30.00 - 39.99 ................................ 8 8 9 5 $40.00 - 49.99 ................................ 9 9 8 8 $50.00 - 59.99 ................................ 10 10 9 9 $60.00 - 69.99 ................................ 8 7 7 11 $70.00 - 79.99 ................................ 7 6 7 8 $80.00 - 89.99 ................................ 6 6 6 4 $90.00 - 99.99 ................................ 3 3 2 3 $100.00 - 124.99 ............................ 6 7 4 7 $125.00 or greater .......................... 7 7 6 8
Composite rate2 .................................... 1 1 1( ) 1Varies3 .................................................. 4 4 3 4Flexible benefits4 .................................. 2 2 1 1Percent of earnings .............................. 1( ) 1( ) 1( ) 1( )Exists, but unknown .............................. 17 16 17 18Other ..................................................... 3 2 5 2
1 Less than 0.5 percent.2 A composite rate is a set contribution covering more
than one benefit area, for example, health care and lifeinsurance. Cost data for individual plans cannot bedetermined.
3 Based on worker attributes. For example, employeecontributions may vary based on earnings, length ofservice, or age.
4 Amount varies by options selected under a "cafeteriaplan" or employer-sponsored reimbursement account.
NOTE: Because of rounding, sums of individual itemsmay not equal totals. Where applicable, dash indicates noemployees in this category or data do not meetpublication criteria.

10
Table 6. Percent of medical plan participants by amount and type of employee contribution for family coverage,private industry, National Compensation Survey, March 2004
Characteristics All employees White-collaroccupations
Blue-collaroccupations
Serviceoccupations
Total with contributory coverage ........... 100 100 100 100
Percent
Flat monthly amount ......................... 74 73 76 73
Less than $25.00 ............................ 1 1 2 1( ) $25.00 - 49.99 ................................ 2 1 5 1 $50.00 - 74.99 ................................ 3 3 4 2 $75.00 - 99.99 ................................ 3 3 4 2 $100.00 - 124.99 ............................ 5 4 7 4 $125.00 - 149.99 ............................ 5 6 5 2 $150.00 - 174.99 ............................ 6 6 6 5 $175.00 - 199.99 ............................ 6 5 6 5 $200.00 - 224.99 ............................ 5 5 6 7 $225.00 - 249.99 ............................ 5 4 5 4 $250.00 - 274.99 ............................ 4 5 3 2 $275.00 - 299.99 ............................ 3 3 3 5 $300.00 - 324.99 ............................ 3 3 4 2 $325.00 - 349.99 ............................ 3 2 1 11 $350.00 - 374.99 ............................ 2 3 1 3 $375.00 - 399.99 ............................ 2 2 2 3 $400.00 - 424.99 ............................ 3 3 2 2 $425.00 - 449.99 ............................ 2 2 2 2 $450.00 - 474.99 ............................ 2 2 2 1 $475.00 - 499.99 ............................ 1 1 1 1 $500.00 or greater .......................... 8 8 7 10
Composite rate2 .................................... 1 1 1( ) 1Varies3 .................................................. 3 3 2 3Flexible benefits4 .................................. 1 2 1 1Percent of earnings .............................. 1( ) 1( ) 1( ) 1( )Exists, but unknown .............................. 18 19 16 20Other ..................................................... 3 2 4 3
1 Less than 0.5 percent.2 A composite rate is a set contribution covering more
than one benefit area, for example, health care and lifeinsurance. Cost data for individual plans cannot bedetermined.
3 Based on worker attributes. For example, employeecontributions may vary based on earnings, length ofservice, or age.
4 Amount varies by options selected under a "cafeteriaplan" or employer-sponsored reimbursement account.
NOTE: Because of rounding, sums of individual itemsmay not equal totals. Where applicable, dash indicates noemployees in this category or data do not meetpublication criteria.
11
Table 7. Percent of medical insurance premiums paid by employer and employee, byselected characteristics, private industry, National Compensation Survey, March 2004
Characteristics
Single coverage Family coverage
Employershare
Employeeshare
Employershare
Employeeshare
All workers participating in medical plans ... 82 18 69 31
Worker characteristics:
White-collar occupations ............................ 81 19 68 32Blue-collar occupations .............................. 84 16 72 28Service occupations ................................... 79 21 65 35
Full time ...................................................... 82 18 69 31Part time ..................................................... 79 21 67 33
Union .......................................................... 89 11 83 17Nonunion .................................................... 80 20 67 33
Average wage less than $15 per hour ........ 80 20 66 34Average wage $15 per hour or higher ........ 83 17 72 28
Establishment characteristics:
Goods-producing ........................................ 84 16 74 26Service-producing ....................................... 81 19 67 33
1-99 workers ............................................... 82 18 64 36100 workers or more ................................... 82 18 73 27
Geographic areas:
Metropolitan areas ...................................... 82 18 70 30Nonmetropolitan areas ............................... 82 18 68 32
New England .............................................. 80 20 74 26Middle Atlantic ............................................ 83 17 73 27East North Central ...................................... 82 18 73 27West North Central ..................................... 82 18 70 30South Atlantic ............................................. 79 21 65 35East South Central ..................................... 81 19 67 33West South Central .................................... 81 19 64 36Mountain ..................................................... 82 18 68 32Pacific ......................................................... 84 16 69 31
NOTE: Because of rounding, sums of individual items may not equal totals. Whereapplicable, dash indicates no employees in this category or data do not meet publicationcriteria.

12
Table 8. Percent of workers with access to selected leave benefits, by selected characteristics, private industry,National Compensation Survey, March 2004
Characteristics Paid holidays Paid sick leave Paid vacations Paid jury dutyleave
Paid militaryleave
All workers ............................................ 77 59 77 70 49
Worker characteristics:
White-collar occupations ...................... 85 74 83 80 58Blue-collar occupations ........................ 81 47 80 66 43Service occupations ............................. 48 37 58 47 33
Full time ................................................ 89 70 90 77 54Part time ............................................... 37 24 35 44 31
Union .................................................... 84 59 85 83 56Nonunion .............................................. 76 59 77 68 48
Average wage less than $15 per hour .. 68 48 70 60 41Average wage $15 per hour or higher .. 88 75 88 83 61
Establishment characteristics:
Goods-producing .................................. 85 49 85 73 53Service-producing ................................. 74 62 75 69 48
1-99 workers ......................................... 69 50 71 57 37100 workers or more ............................. 86 69 86 84 63
Geographic areas:
Metropolitan areas ................................ 77 60 77 71 50Nonmetropolitan areas ......................... 74 52 77 63 42
New England ........................................ 79 66 75 78 59Middle Atlantic ...................................... 80 62 82 77 54East North Central ................................ 78 59 78 71 51West North Central ............................... 73 59 72 65 46South Atlantic ....................................... 77 56 79 71 50East South Central ............................... 76 55 77 69 43West South Central .............................. 77 55 77 67 48Mountain ............................................... 71 58 74 66 47Pacific ................................................... 74 61 76 61 41
NOTE: Because of rounding, sums of individual items may not equal totals. Where applicable, dash indicates no employees inthis category or data do not meet publication criteria.

13
Table 9. Percent of workers by number of paid holidays provided and average number of paid days per year, by selected characteristics,private industry, National Compensation Survey, March 2004
Characteristics
Averagenumberof paid
holidays
Paid holidays1
Fewerthan 5days
5 days 6 days 7 days 8 days 9 days 10 days 11 days 12 daysMore
than 12days
All workers with paid holidays ............... 8 6 4 23 11 13 10 15 8 5 5
Worker characteristics:
White-collar occupations ...................... 8 3 2 23 10 14 10 18 9 5 5Blue-collar occupations ........................ 8 6 6 23 12 13 10 12 9 5 5Service occupations ............................. 7 18 6 23 13 12 9 6 7 3 2
Full time ................................................ 8 4 4 22 12 14 10 15 9 5 5Part time ............................................... 6 21 5 35 8 10 6 8 2 3 3
Union .................................................... 10 2 1 11 7 11 11 16 13 11 17Nonunion .............................................. 8 6 4 25 12 14 10 15 8 4 4
Average wage less than $15 per hour .. 7 9 6 30 13 13 9 10 6 3 2Average wage $15 per hour or higher .. 9 2 2 16 10 14 11 20 11 7 8
Establishment characteristics:
Goods-producing .................................. 9 4 4 14 10 13 11 16 13 5 9Service-producing ................................. 8 6 3 26 12 13 9 14 7 4 4
1-99 workers ......................................... 7 8 5 26 14 13 10 12 6 3 2100 workers or more ............................. 9 3 2 20 9 13 9 18 11 7 8
Geographic areas:
Metropolitan areas ................................ 8 5 4 22 12 14 10 15 8 5 6Nonmetropolitan areas ......................... 7 9 4 32 10 11 7 14 9 2 2
New England ........................................ 9 8 1 12 3 12 7 19 19 9 9Middle Atlantic ...................................... 9 6 2 14 12 13 11 14 12 9 7East North Central ................................ 9 2 1 27 15 14 9 13 7 4 8West North Central ............................... 8 4 2 34 9 15 7 12 10 2 4South Atlantic ....................................... 8 6 9 26 9 11 10 16 7 4 3East South Central ............................... 7 8 9 24 14 16 7 8 6 3 4West South Central .............................. 8 8 3 22 16 15 10 14 5 3 4Mountain ............................................... 8 10 1 26 13 15 10 16 4 3 2Pacific ................................................... 8 7 3 22 9 13 13 18 8 5 3
1 Fractional holiday amounts were rounded to the nearest full numberof days.
NOTE: Because of rounding, sums of individual items may not equaltotals. Where applicable, dash indicates no employees in this categoryor data do not meet publication criteria.

14
Table 10. Average number of paid vacation days, by minimum length of service requirement forselected characteristics, private industry, National Compensation Survey, March 2004
Characteristic
Length of service1
After 1year
After 3years
After 5years
After 10years
After 15years
After 20years
After 25years
All workers with paid vacations2 ............. 8.9 11.0 13.6 16.2 17.7 18.5 19.2
Worker characteristics:
White-collar occupations ........................ 10.1 12.0 14.6 17.3 19.1 19.8 20.6Blue-collar occupations .......................... 7.1 9.6 11.7 14.4 15.9 17.0 17.7Service occupations ............................... 7.9 10.5 13.6 15.7 16.4 16.8 17.1
Full time .................................................. 9.0 11.2 13.7 16.4 18.0 18.8 19.5Part time ................................................. 7.3 9.4 12.4 14.2 15.4 16.0 16.7
Union ...................................................... 8.8 11.4 13.8 17.5 20.0 22.3 24.2Nonunion ................................................ 8.9 11.0 13.6 16.1 17.5 18.1 18.6
Average wage less than $15 per hour .... 7.6 10.1 12.6 15.1 16.4 17.0 17.4Average wage $15 per hour or higher .... 10.3 12.1 14.7 17.5 19.2 20.3 21.3
Establishment characteristics:
Goods-producing .................................... 7.5 9.9 12.1 15.0 16.6 18.0 18.7Service-producing ................................... 9.3 11.4 14.1 16.6 18.1 18.7 19.4
1-99 workers ........................................... 7.6 9.9 12.2 14.4 15.4 15.9 16.3100 workers or more ............................... 10.2 12.2 15.0 18.1 20.1 21.2 22.2
Geographic areas:
Metropolitan areas .................................. 9.0 11.1 13.7 16.3 17.8 18.6 19.3Nonmetropolitan areas ........................... 8.1 10.6 12.9 15.6 17.0 17.9 18.5
New England .......................................... 11.1 12.9 15.5 17.5 19.0 19.5 20.1Middle Atlantic ........................................ 9.2 10.9 13.7 16.0 17.3 18.0 18.8East North Central .................................. 8.3 10.7 13.2 16.1 18.3 19.3 20.4West North Central ................................. 10.0 11.8 14.3 17.1 18.7 19.7 20.4South Atlantic ......................................... 8.5 10.5 13.1 15.7 17.3 18.1 18.6East South Central ................................. 7.5 10.4 13.3 16.3 17.6 18.5 18.8West South Central ................................ 8.2 10.4 12.6 15.2 16.5 17.2 17.8Mountain ................................................. 9.2 11.4 13.9 16.5 17.8 18.4 19.0Pacific ..................................................... 9.3 11.6 14.4 16.9 18.0 18.7 19.2
1 Employees receiving no vacation days areincluded as receiving 0 days.
2 Employees either are granted a specific numberof days after completion of the indicated length ofservice or accrue days during the next 12-monthperiod. The total number of days is assumed
available for use immediately upon completion of theservice interval.
NOTE: Where applicable, dash indicates noemployees in this category or data do not meetpublication criteria.

15
Table 11. Percent of workers with paid vacations by number of paid vacation days provided for selected periods ofservice,1 private industry by occupational group, National Compensation Survey, March 2004
Vacation policy
Percent with paid vacation days by length of service2
Under 5days 5 days
Over 5but
under10 days
10 days
Over 10but
under15 days
15 days
Over 15but
under20 days
20 days Over 20days
All workersAfter 1 year ................................... 4 40 1 36 4 6 3 2 4After 3 years ................................. 1 12 2 60 4 9 4 3 4After 5 years ................................. 1 8 1 35 3 35 3 6 9After 10 years ............................... 3( ) 7 1 13 1 42 4 18 14After 15 years ............................... 3( ) 7 3( ) 12 1 23 2 38 16After 20 years ............................... 3( ) 7 3( ) 12 1 18 1 37 24After 25 years ............................... 3( ) 7 3( ) 12 1 18 1 27 34
White-collar occupationsAfter 1 year ................................... 4 27 1 43 4 9 4 4 5After 3 years ................................. 1 6 2 58 4 13 5 5 6After 5 years ................................. 1 4 1 28 4 40 4 8 11After 10 years ............................... 3( ) 3 1 10 1 41 4 23 17After 15 years ............................... 3( ) 3 3( ) 9 1 19 2 44 21After 20 years ............................... 3( ) 3 3( ) 9 1 16 1 42 29After 25 years ............................... 3( ) 3 3( ) 9 1 15 1 31 40
Blue-collar occupationsAfter 1 year ................................... 4 58 2 30 3 3 1 3( ) 3( )After 3 years ................................. 1 18 2 67 4 4 2 1 1After 5 years ................................. 1 11 2 47 4 30 2 3 2After 10 years ............................... 1 9 3( ) 17 1 51 4 12 5After 15 years ............................... 3( ) 9 3( ) 15 1 30 3 35 7After 20 years ............................... 3( ) 9 3( ) 15 1 22 1 34 17After 25 years ............................... 3( ) 9 3( ) 15 1 21 1 26 27
Service occupationsAfter 1 year ................................... 8 50 2 23 4 3 5 1 4After 3 years ................................. 2 21 4 50 4 6 7 2 5After 5 years ................................. 3( ) 16 3 32 2 27 5 3 13After 10 years ............................... 3( ) 15 2 19 1 30 2 14 17After 15 years ............................... 3( ) 15 2 18 1 21 2 22 19After 20 years ............................... 3( ) 15 2 18 1 19 1 21 23After 25 years ............................... 3( ) 15 2 18 3( ) 19 2 18 26
1 Employees either are granted a specific number of daysafter completion of the indicated length of service or accruedays during the next 12-month period. The total number ofdays is assumed available for use immediately uponcompletion of the service interval.
2 Employees receiving no vacation days are included asreceiving under 5 days.
3 Less than 0.5 percent.
NOTE: Because of rounding, sums of individual items maynot equal totals. Where applicable, dash indicates noemployees in this category or data do not meet publicationcriteria.

16
Table 12. Percent of workers with access to life and disability insurancebenefits, by selected characteristics, private industry, NationalCompensation Survey, March 2004
Characteristics Lifeinsurance
Disability benefits
Short-termdisability
Long-termdisability
All workers ............................................ 51 39 30
Worker characteristics:
White-collar occupations ...................... 58 43 41Blue-collar occupations ........................ 54 45 22Service occupations ............................. 27 23 12
Full time ................................................ 63 47 38Part time ............................................... 10 14 5
Union .................................................... 63 67 30Nonunion .............................................. 49 36 30
Average wage less than $15 per hour .. 40 29 17Average wage $15 per hour or higher .. 66 54 48
Establishment characteristics:
Goods-producing .................................. 62 54 31Service-producing ................................. 47 35 30
1-99 workers ......................................... 36 28 19100 workers or more ............................. 68 53 44
Geographic areas:
Metropolitan areas ................................ 51 40 32Nonmetropolitan areas ......................... 52 35 20
New England ........................................ 47 40 35Middle Atlantic ...................................... 45 77 26East North Central ................................ 57 42 33West North Central ............................... 55 37 30South Atlantic ....................................... 53 33 31East South Central ............................... 55 34 27West South Central .............................. 51 30 30Mountain ............................................... 49 24 29Pacific ................................................... 44 27 28
NOTE: Because of rounding, sums of individual items may not equal totals. Where applicable, dash indicates no employees in this category or data donot meet publication criteria.
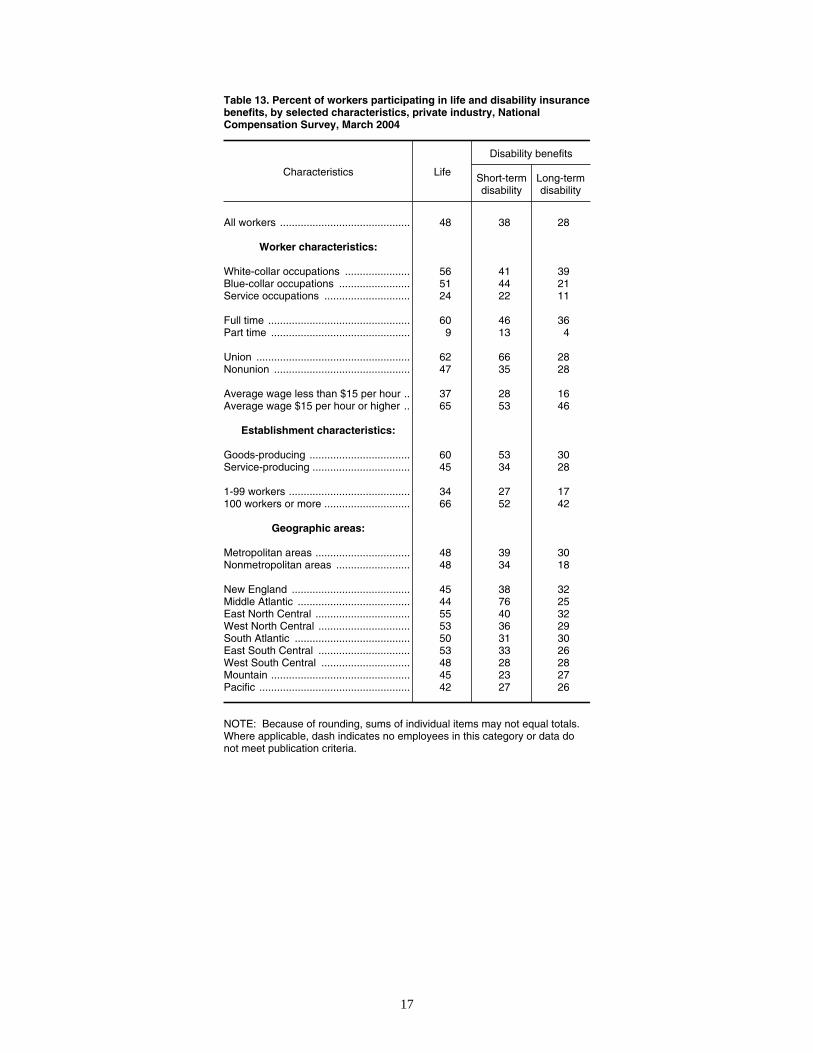
17
Table 13. Percent of workers participating in life and disability insurancebenefits, by selected characteristics, private industry, NationalCompensation Survey, March 2004
Characteristics Life
Disability benefits
Short-termdisability
Long-termdisability
All workers ............................................ 48 38 28
Worker characteristics:
White-collar occupations ...................... 56 41 39Blue-collar occupations ........................ 51 44 21Service occupations ............................. 24 22 11
Full time ................................................ 60 46 36Part time ............................................... 9 13 4
Union .................................................... 62 66 28Nonunion .............................................. 47 35 28
Average wage less than $15 per hour .. 37 28 16Average wage $15 per hour or higher .. 65 53 46
Establishment characteristics:
Goods-producing .................................. 60 53 30Service-producing ................................. 45 34 28
1-99 workers ......................................... 34 27 17100 workers or more ............................. 66 52 42
Geographic areas:
Metropolitan areas ................................ 48 39 30Nonmetropolitan areas ......................... 48 34 18
New England ........................................ 45 38 32Middle Atlantic ...................................... 44 76 25East North Central ................................ 55 40 32West North Central ............................... 53 36 29South Atlantic ....................................... 50 31 30East South Central ............................... 53 33 26West South Central .............................. 48 28 28Mountain ............................................... 45 23 27Pacific ................................................... 42 27 26
NOTE: Because of rounding, sums of individual items may not equal totals.Where applicable, dash indicates no employees in this category or data donot meet publication criteria.
18
Table 14. Percent of workers participating in life insurance plans by employeecontribution requirement, by selected characteristics, private industry, NationalCompensation Survey, March 2004
Characteristics
Life insurance
Employeecontributionsnot required
Employeecontributions
required
Notdeterminable
All workers with basic life insurance coverage ...... 89 5 5
Worker characteristics:
White-collar occupations ....................................... 91 5 5Blue-collar occupations ......................................... 87 7 6Service occupations .............................................. 88 6 6
Full time ................................................................. 89 5 5Part time ................................................................ 91 4 5
Union ..................................................................... 89 3 8Nonunion ............................................................... 90 6 5
Average wage less than $15 per hour ................... 88 6 5Average wage $15 per hour or higher ................... 90 5 5
Establishment characteristics:
Goods-producing ................................................... 89 5 6Service-producing .................................................. 89 5 5
1-99 workers .......................................................... 88 6 6100 workers or more .............................................. 90 5 5
Geographic areas:
Metropolitan areas ................................................. 90 5 6Nonmetropolitan areas .......................................... 87 10 3
New England ......................................................... 92 3 5Middle Atlantic ....................................................... 88 4 8East North Central ................................................. 89 7 4West North Central ................................................ 93 3 4South Atlantic ........................................................ 92 4 4East South Central ................................................ 78 15 7West South Central ............................................... 86 7 7Mountain ................................................................ 85 7 7Pacific .................................................................... 94 2 4
NOTE: Because of rounding, sums of individual items may not equal totals. Where applicable,dash indicates no employees in this category or data do not meet publication criteria.

19
Table 15. Percent of workers participating in life insurance benefits, by method of payment and selectedcharacteristics, private industry, National Compensation Survey, March 2004
Characteristics
Basic life insurance method of payment
Fixedmultiple ofearnings
Variablemultiple
ofearnings
Flat dollaramount
Variabledollar
amountOther Not determin-
able
All workers with basic life insurance coverage ...... 53 4 35 4 1 4
Worker characteristics:
White-collar occupations ....................................... 62 4 26 2 2 4Blue-collar occupations ......................................... 36 3 50 6 1 4Service occupations .............................................. 48 1 44 4 1( ) 2
Full time ................................................................. 53 4 34 4 1 4Part time ................................................................ 40 1 48 3 2 6
Union ..................................................................... 32 3 48 10 1 6Nonunion ............................................................... 56 4 33 3 1 4
Average wage less than $15 per hour ................... 48 3 42 3 1 4Average wage $15 per hour or higher ................... 57 5 29 4 2 4
Establishment characteristics:
Goods-producing ................................................... 41 4 45 6 1 3Service-producing .................................................. 57 4 31 3 1 4
1-99 workers .......................................................... 41 3 48 3 1 5100 workers or more .............................................. 60 4 27 4 1 3
Geographic areas:
Metropolitan areas ................................................. 53 4 34 3 1 4Nonmetropolitan areas .......................................... 48 3 42 5 1 1
New England ......................................................... 69 4 20 2 1 3Middle Atlantic ....................................................... 58 4 28 6 1 4East North Central ................................................. 48 4 40 4 1 3West North Central ................................................ 50 4 42 2 1 2South Atlantic ........................................................ 52 5 36 4 1 2East South Central ................................................ 43 4 41 7 1 4West South Central ............................................... 54 5 32 2 1 7Mountain ................................................................ 51 2 35 1 1 9Pacific .................................................................... 56 1 34 3 2 5
1 Less than 0.5 percent.
NOTE: Because of rounding, sums of individual items may
not equal totals. Where applicable, dash indicates noemployees in this category or data do not meet publicationcriteria.

20
Table 16. Percent of workers participating in life insurance plans with multiple of earnings benefitformulas, by selected characteristics, private industry, National Compensation Survey, March 2004
Characteristics
Multiple of earnings amounts1
Less than1.0 timesearnings
1.0 timesearnings
Over 1.0and under2.0 timesearnings
2.0 timesearnings
Over 2.0times
earnings
All workers with a multiple of earnings formula ..... 1 58 12 25 4
Worker characteristics:
White-collar occupations ....................................... 1 56 11 27 4Blue-collar occupations ......................................... 2 59 13 22 5Service occupations .............................................. 2( ) 69 16 14 1
Full time ................................................................. 1 57 12 25 4Part time ................................................................ - - - - -
Union ..................................................................... 3 71 7 17 3Nonunion ............................................................... 1 57 13 26 4
Average wage less than $15 per hour ................... 1 64 13 19 3Average wage $15 per hour or higher ................... 1 54 12 29 5
Establishment characteristics:
Goods-producing ................................................... 3 47 17 28 6Service-producing .................................................. 1 61 11 24 4
1-99 workers .......................................................... 2( ) 56 10 29 4100 workers or more .............................................. 1 59 13 23 4
Geographic areas:
Metropolitan areas ................................................. 1 58 11 26 4Nonmetropolitan areas .......................................... 2 56 17 19 6
New England ......................................................... 3 61 10 22 4Middle Atlantic ....................................................... 2 57 12 28 2East North Central ................................................. 2 54 17 24 3West North Central ................................................ 2( ) 55 15 25 5South Atlantic ........................................................ 2( ) 64 9 24 3East South Central ................................................ - 46 27 17 10West South Central ............................................... - 58 11 29 2Mountain ................................................................ - 64 7 26 3Pacific .................................................................... 1 58 7 25 9
1 Includes participants in plans in which insuranceequaled a multiple of earnings, plus or minus aspecified amount.
2 Less than 0.5 percent.
NOTE: Because of rounding, sums of individual itemsmay not equal totals. Where applicable, dashindicates no employees in this category or data do notmeet publication criteria.

21
Table 17. Percent of workers participating in life insurance plans with flat dollar benefit formulas, byselected characteristics, private industry, National Compensation Survey, March 2004
Characteristics
Flat dollar amounts
Lessthan
$10,000
$10,000and
under$15,000
$15,000and
under$20,000
$20,000 andunder
$25,000
$25,000and
under$30,000
$30,000or more
All workers with a flat dollar benefit formula ... 11 28 18 14 13 16
Worker characteristics:
White-collar occupations ................................ 10 22 19 15 15 19Blue-collar occupations .................................. 9 31 18 15 13 15Service occupations ....................................... 21 41 12 8 5 12
Full time .......................................................... 9 28 18 14 14 17Part time ......................................................... 36 23 13 24 1 3
Union .............................................................. 20 23 9 18 11 19Nonunion ........................................................ 9 29 20 14 13 16
Average wage less than $15 per hour ............ 12 34 18 16 10 10Average wage $15 per hour or higher ............ 9 21 18 12 16 24
Establishment characteristics:
Goods-producing ............................................ 8 27 18 15 14 18Service-producing .......................................... 12 28 18 14 12 16
1-99 workers ................................................... 9 26 25 10 12 17100 workers or more ...................................... 12 30 10 19 13 15
Geographic areas:
Metropolitan areas .......................................... 11 27 17 15 14 16Nonmetropolitan areas ................................... 7 32 24 12 8 18
New England .................................................. - - - - - -Middle Atlantic ................................................ 17 32 5 19 11 16East North Central .......................................... 8 16 26 13 17 20West North Central ......................................... 5 30 18 10 16 22South Atlantic ................................................. 14 33 15 15 10 12East South Central ......................................... 4 48 27 11 4 6West South Central ........................................ 3 25 19 22 19 11Mountain ......................................................... - - - - - -Pacific ............................................................. 21 27 14 9 10 19
NOTE: Because of rounding, sums of individual items may not equal totals. Where applicable, dash indicatesno employees in this category or data do not meet publication criteria.
22
Table 18. Percent of workers participating in short-term disability plans, by method of funding and selectedcharacteristics, private industry, National Compensation Survey, March 2004
Characteristics Unfunded1 Insured Self-insured Legallyrequired Other
All workers with short-term disability coverage ...... 9 37 35 16 2
Worker characteristics:
White-collar occupations ....................................... 13 34 39 13 2Blue-collar occupations ......................................... 5 43 35 13 4Service occupations .............................................. 4 33 21 41 1
Full time ................................................................. 9 38 37 14 2Part time ................................................................ 8 25 18 46 3
Union ..................................................................... 1 34 41 16 7Nonunion ............................................................... 11 37 34 16 2
Average wage less than $15 per hour ................... 6 39 31 22 2Average wage $15 per hour or higher ................... 12 35 39 12 3
Establishment characteristics:
Goods-producing ................................................... 7 42 37 10 5Service-producing .................................................. 10 34 35 19 1
1-99 workers .......................................................... 8 43 22 25 2100 workers or more .............................................. 10 33 44 10 3
Geographic areas:
Metropolitan areas ................................................. 9 36 36 17 3Nonmetropolitan areas .......................................... 10 42 34 12 2
New England ......................................................... 15 45 34 5 1Middle Atlantic ....................................................... 6 25 16 51 1East North Central ................................................. 10 40 44 - 6West North Central ................................................ 8 42 48 - 2South Atlantic ........................................................ 10 47 42 2( ) 1East South Central ................................................ 12 41 44 - 4West South Central ............................................... 8 34 53 1 4Mountain ................................................................ 17 37 37 3 7Pacific .................................................................... 11 39 34 15 1
1 A plan in which the establishment pays the benefit fromoperating revenue.
2 Less than 0.5 percent.
NOTE: Because of rounding, sums of individual items maynot equal totals. Where applicable, dash indicates noemployees in this category or data do not meet publicationcriteria.

23
Table 19. Percent of workers with access to selected benefits, by selected characteristics, private industry, National Compensation Survey,March 2004
Characteristics
Employer assistance for child care
Adoptionassistance
Long-termcare
insurance
Flexibleworkplace
Employer-providedhome PC
SubsidizedcommutingTotal1
Employer-provided
funds
On-siteand
off-sitechildcare
Childcare
resourceand
referralservices
All workers ............................................ 14 3 5 10 9 11 4 3 5
Worker characteristics:
White-collar occupations ...................... 19 4 7 14 13 17 7 4 7Blue-collar occupations ........................ 8 2 2 6 6 6 1 1 3Service occupations ............................. 9 2 4 4 2 4 1 1 2
Full time ................................................ 16 4 6 11 11 13 5 3 6Part time ............................................... 8 1 3 5 4 5 2 1 2
Union .................................................... 16 3 6 15 12 13 2 2 6Nonunion .............................................. 13 3 5 9 9 11 5 3 5
Average wage less than $15 per hour .. 8 2 3 5 5 6 2 1 2Average wage $15 per hour or higher .. 22 5 8 16 15 18 8 5 8
Establishment characteristics:
Goods-producing .................................. 12 3 3 10 9 10 3 3 4Service-producing ................................. 14 3 6 10 9 12 5 2 5
1-99 workers ......................................... 4 1 2 3 3 4 4 1 2100 workers or more ............................. 25 5 9 18 16 20 5 4 8
Geographic areas:
Metropolitan areas ................................ 15 3 5 11 10 13 5 3 6Nonmetropolitan areas ......................... 8 2 4 3 3 5 1 1 1
New England ........................................ 17 2 9 14 14 14 4 3 11Middle Atlantic ...................................... 16 4 5 11 12 13 6 4 7East North Central ................................ 15 3 6 11 10 12 5 3 2West North Central ............................... 16 2 9 7 7 6 2 2 4South Atlantic ....................................... 11 4 4 8 9 11 3 2 2East South Central ............................... 9 3 4 5 4 7 4 2 3West South Central .............................. 14 2 4 10 9 13 5 3 4Mountain ............................................... 16 3 3 13 8 10 5 2 6Pacific ................................................... 11 3 3 9 7 13 4 2 8
1 The total is less than the sum of individual child care provisionsbecause many employees have access to more than one of thebenefits.
NOTE: Because of rounding, sums of individual items may not equaltotals. Where applicable, dash indicates no employees in this categoryor data do not meet publication criteria.
24
Table 20. Percent of workers with access to nonproduction bonus by type of bonus and stock options, by selected characteristics,private industry, National Compensation Survey, March 2004
Characteristics
Nonproduction bonus1
All non-produc-
tionbonuses
Atten-dancebonus
Cash profit
sharingbonus
Employ-ee
recogni-tion
bonus
End ofyear
bonus
Holidaybonus
Payment in lieu ofbenefitsbonus
Safetybonus
Suggestionbonus
All workers ............................................ 47 2 5 5 11 10 4 1 1
Worker characteristics:
White-collar occupations ...................... 50 1 5 5 12 10 5 2( ) 1Blue-collar occupations ........................ 49 5 7 3 11 12 4 4 2Service occupations ............................. 33 1 2 6 6 8 2 1 1
Full time ................................................ 52 3 6 5 12 11 5 2 1Part time ............................................... 28 1 2 2 6 8 1 2( ) 1
Union .................................................... 41 5 7 4 5 5 5 2 4Nonunion .............................................. 47 2 5 5 11 11 4 1 1
Average wage less than $15 per hour .. 42 3 3 4 9 12 3 1 1Average wage $15 per hour or higher .. 53 2 7 6 13 8 5 1 2
Establishment characteristics:
Goods-producing .................................. 54 6 11 4 12 11 5 4 3Service-producing ................................. 45 1 3 5 10 10 4 1 1
1-99 workers ......................................... 45 1 4 3 13 13 3 1 1100 workers or more ............................. 49 4 6 6 8 6 5 2 2
Geographic areas:
Metropolitan areas ................................ 47 2 5 5 11 10 4 1 2Nonmetropolitan areas ......................... 45 3 6 4 10 13 3 3 1
New England ........................................ 49 1 3 8 6 9 8 3 1Middle Atlantic ...................................... 44 2 3 4 12 5 6 1 1East North Central ................................ 55 5 8 4 13 14 6 1 3West North Central ............................... 45 3 4 5 15 10 2 1 2( )South Atlantic ....................................... 48 2 3 5 10 11 4 2 1East South Central ............................... 47 4 3 8 14 12 3 1 3West South Central .............................. 46 2 4 2 8 16 2( ) 3 1Mountain ............................................... 45 1 5 4 12 9 3 1 1Pacific ................................................... 38 1 8 4 8 5 2 1 1
See footnotes at end of table.

25
Table 20. Percent of workers with access to nonproduction bonus by type of bonus and stock options, by selected characteristics,private industry, National Compensation Survey, March 2004 — Continued
Characteristics
Nonproduction bonus1
Stockoption1Hiring
bonusLongevity
bonusReferralbonus
Retentionbonus
Union-related bonus
Manage-ment
incentivebonus
Otherbonus
All workers ............................................ 2 2 8 1 1 1 5 8
Worker characteristics:
White-collar occupations ...................... 2 1 9 1 2( ) 2 7 12Blue-collar occupations ........................ 1 2 5 2( ) 2 1 4 6Service occupations ............................. 2 1 8 2( ) 2( ) 1 3 2
Full time ................................................ 2 2 8 1 1 2 6 10Part time ............................................... 1 1 6 1 - 2( ) 2 4
Union .................................................... 1 1 3 1 6 3 5 7Nonunion .............................................. 2 2 8 1 - 1 5 9
Average wage less than $15 per hour .. 1 2 7 2( ) 2( ) 1 4 5Average wage $15 per hour or higher .. 3 1 8 1 1 3 8 13
Establishment characteristics:
Goods-producing .................................. 1 2 6 1 2 2 7 9Service-producing ................................. 2 1 8 1 2( ) 1 5 8
1-99 workers ......................................... 1 1 4 2( ) 2( ) 1 4 4100 workers or more ............................. 3 2 12 1 1 2 7 14
Geographic areas:
Metropolitan areas ................................ 2 2 8 1 1 2 6 9Nonmetropolitan areas ......................... 1 1 5 2( ) 2( ) 1 3 4
New England ........................................ 2 2 9 2 - 3 4 10Middle Atlantic ...................................... 1 2 8 1 1 1 6 7East North Central ................................ 2 2 10 2( ) 1 1 9 8West North Central ............................... 2 1 5 1 1 1 2 3South Atlantic ....................................... 3 2 10 2( ) 2( ) 1 5 10East South Central ............................... 2 1 8 - 2( ) 2 5 6West South Central .............................. 3 1 7 2( ) 2( ) 1 5 9Mountain ............................................... 1 1 9 1 2( ) 3 4 6Pacific ................................................... 1 1 3 1 2( ) 2 4 12
1 See the Technical Note for definitions.2 Less than 0.5 percent.
NOTE: Because of rounding, sums of individual items may not equaltotals. Where applicable, dash indicates no employees in this categoryor data do not meet publication criteria.

26
Technical Note
The data in this release are from the National Compensa-tion Survey (NCS), conducted by the Bureau of Labor
Statistics (BLS), U.S. Department of Labor. The release con-tains 2004 data on all workers in private industry. Expandeddata covering additional detailed provisions of selected ben-efit plans are forthcoming.
Under the NCS, information on the incidence and provi-sion of benefits is being published in two separate publica-tions. The first, this summary, provides data on the inci-dence of (access to and participation in) selected benefitsand detailed provisions of paid holidays and vacations, lifeinsurance plans, and other selected benefit programs. Dataon percentages of establishments offering major employeebenefits and on the employer and employee shares of contri-butions to medical care premiums also are presented. Thesecond publication, a bulletin, will contain detailed informa-tion on the characteristics of health and retirement plans.The data collection period for compiling this information wasDecember 2002 through January 2004. The provisions datacontained in the bulletin will have a 2003 reference date. Dataon incidence and detailed provisions are expected to be pro-duced every year.
The estimates provided are for private nonagriculturalindustries. In the past, State and local governments alsohave been surveyed. For the next several years, however,incidence and provision estimates will exclude governmentsbecause of other commitments in the NCS program.
Calculation detailsAverages for occupations within an establishment were usedto produce estimates for worker groups averaging hourlypay below $15 and for those averaging $15 and above. Indi-vidual workers can fall into an earnings category differentfrom the average for an occupation and establishment intowhich they are classified.
The tables on employer and employee medical premiums(tables 4–7) include all medical plan participants in calcula-tions for both single and family coverage. The calculationsare not based on actual selections made by employees to-ward their medical coverage within the occupations. For ex-ample, in an occupation in which 5 single employees and 5married employees are participating in a medical plan, thecalculations for this table use all 10 employees in both single-and family-coverage computations; the calculations do notattribute the 5 single employees to single coverage or the 5married employees to family coverage. Thus, the premiumcalculations are based on the assumption that all 10 employ-ees have identical coverage.
Definitions of nonproduction bonuses and stockoptions
Cash profit sharing. Payment to employees in recognition
of their contribution to company profitability. Payments mayvary by length of service.
Employee recognition bonus. A payment to employees thatrewards performance or significant accomplishments, suchas an employee-of-the-month award.
Payment in lieu of benefits. A payment to employees in lieuof the employer’s providing a benefit, such as health care. Insome cases, the employer offers cash to employees whowaive employer-sponsored benefits, such as cashed-in sickleave. When this occurs, the employer passes the savingsfrom the waived benefit to the employee.
Hiring bonus. A payment made by an employer to induce anindividual to accept employment with the company.
Longevity bonus. A bonus or a lump-sum payment of somekind (for example, a government savings bond or an add-onto severance pay) paid to employees based upon their lengthof service.
Referral bonus. A payment given to employees for recom-mending a qualified applicant who is hired by the establish-ment.
Retention bonus. A payment made by an employer to anincumbent employee to retain that individual with the estab-lishment.
Management incentive bonus. A payment to managers orsupervisors rewarding them for their ability to direct the per-formance of a group of employees in their charge in the at-tainment of a specified goal. For example, a manager receivesa bonus for having the highest sales.
Stock options. Plans allowing establishment employees theright to buy company stock at a fixed price by a fixed time.
For a listing of additional benefit definitions, see Glos-sary of Compensation Terms, Report 923 (Bureau of LaborStatistics, August 1998), available on the Internet at http://www.bls.gov/ncs/ebs/ebsgloss.htm.
Survey scopeThe 2004 NCS benefits survey obtained data from 4,703 pri-vate industry establishments representing nearly 102.3 mil-lion workers; of this number, nearly 78 million were full-timeworkers and the remainder—slightly more than 24 million—were part-time workers. The NCS uses the establishment’sdefinition of full- and part-time status to classify workers.For purposes of this survey, an establishment is an eco-nomic unit that produces goods or services, a central admin-

27
istrative office, or an auxiliary unit providing support ser-vices to a company. For private industries, the establishmentis usually at a single physical location.
The nine Census divisions are defined as follows: NewEngland—Connecticut, Maine, Massachusetts, New Hamp-shire, Rhode Island, and Vermont; Middle Atlantic—NewJersey, New York, and Pennsylvania; East North Central—Illinois, Indiana, Michigan, Ohio, and Wisconsin; West NorthCentral—Iowa, Kansas, Minnesota, Missouri, Nebraska,North Dakota, and South Dakota; South Atlantic—Delaware,District of Columbia, Florida, Georgia, Maryland, North Caro-lina, South Carolina, Virginia, and West Virginia; East SouthCentral—Alabama, Kentucky, Mississippi, and Tennessee;West South Central—Arkansas, Louisiana, Oklahoma, andTexas; Mountain—Arizona, Colorado, Idaho, Montana, Ne-vada, New Mexico, Utah, and Wyoming; and Pacific—Alaska, California, Hawaii, Oregon, and Washington.
Sample design and data collectionThe sample for this survey was selected by using a three-stage design. The first stage involved the selection of areas.The NCS sample consists of 154 metropolitan areas andnonmetropolitan areas that represent the Nation’s 326 met-ropolitan statistical areas and the remaining portions of the50 States. Metropolitan areas are defined as either Metro-politan Statistical Areas (MSAs) or Consolidated Metropoli-tan Statistical Areas (CMSAs), as defined by the U.S. Officeof Management and Budget in 1994. Nonmetropolitan areasare counties that do not fit the metropolitan area definition.
In the second stage, the sample of establishments wasdrawn by first stratifying the sampling frame by industry andestablishment size. The number of sample establishmentsallocated to each stratum is approximately proportional tothe employment in the stratum. Each sampled establishmentwas selected within a stratum with a probability proportionalto its employment. The use of this technique means that thelarger an establishment’s employment, the greater is itschance of selection. Weights were applied to each establish-ment when the data were tabulated so that each establish-
ment represents similar (in terms of industry and employ-ment size) units in the economy that were not selected forcollection.
The third stage of sample selection was the drawing of aprobability sample of occupations within a sampled estab-lishment. Identification of the occupations for which datawere to be collected was a four-step process:
1. Probability-proportional-to-size selection of establish-ment jobs.
2. Classification of jobs into occupations based on theCensus of Population system.
3. Characterization of jobs as full versus part time, unionversus nonunion, and time versus incentive.
4. Determination of the level of work of each job.
For research articles on the latest in employee benefits,see the Monthly Labor Review, August 2004 at http://www.bls.gov/opub/mlr/mlrhome.htm. For more detailed in-formation on occupational selection and classification un-der the NCS, see National Compensation Survey: Occupa-tional Wages in the United States, July 2003, Bulletin 2568(Bureau of Labor Statistics, September 2004). For an onlineversion of the bulletin, see http://www.bls.gov/ncs/ocs/sp/ncbl0658.pdf.
Additional information about the NCS may be obtainedby calling (202) 691-6199. You may also write to the Bureau ofLabor Statistics at Division of Compensation Data Analysisand Planning, 2 Massachusetts Ave., NE, Room 4175, Wash-ington, DC 20212-0001, or send e-mail to [email protected] data contained in this summary are also available on theBLS Internet site: http://www.bls.gov/ncs. Users may accessbenefits data from previous surveys through a variety oftools available on the same page. Material in this summary isin the public domain and, with appropriate credit, may bereproduced without permission. This information will be madeavailable to sensory-impaired individuals upon request. Voicetelephone: (202) 691-5200; Federal Relay Service: 1-800- 877-8339.
Related Documents