Eastern Mediterranean Health Journal La Revue de Santé de la Méditerranée orientale Volume 19 / No. 2 February / Février 2013 2 د / عد علتاسعجلد ا ااير شباط / فVolume 19 Number 2 February 2013 Mothers and children in the Region Addressing the health of mothers and children is at the heart of the Millennium Development Goals (MDGs). With only 2 years to go to reach the targets set down in MDG 4 and 5, WHO, together with UNICEF AND UNFPA, recently held a high-level meeting to consider strategies to accelerate progress towards achieving MDGs 4 and 5 in all countries of the Region.

Welcome message from author
This document is posted to help you gain knowledge. Please leave a comment to let me know what you think about it! Share it to your friends and learn new things together.
Transcript
Contents
Eastern MediterraneanHealth Journal
La Revue de Santé dela Méditerranée orientale
Volume 19 / No. 2February / Février 2013 املجلد التاسع عرش / عدد 2
شباط / فرباير
Volum
e 19 Num
ber 2 February 2013
Mothers and children in the Region Addressing the health of mothers and children is at the heart of the Millennium Development Goals (MDGs). With only 2 years to go to reach the targets set down in MDG 4 and 5, WHO, together with UNICEF AND UNFPA, recently held a high-level meeting to consider strategies to accelerate progress towards achieving MDGs 4 and 5 in all countries of the Region.
Acknowledgement of the work of Dr Mohammad Haytham Khayat ...........................................................................103
Editorial
Child mortality in the Eastern Mediterranean Region: challenges and opportunities ..........................................104
Research articles
Factors affecting defaulting from DOTS therapy under the national programme of tuberculosis control in Alexandria, Egypt ......................................................................................................................................107
Factors associated with patient delay in accessing pulmonary tuberculosis care, Gezira State, Sudan, 2009 .....114
Mycobacterium tuberculosis spoligotypes circulating in the Lebanese population: a retrospective study ........... 119
Health education and peer leaders’ role in improving low vaccination coverage in Akre district, Kurdistan region, Iraq ................................................................................................................................................ 125
High incidence of hepatitis B infection after treatment for paediatric cancer at a teaching hospital in Baghdad ...................................................................................................................................................130
Risk factors for human brucellosis in northern Jordan ............................................................................................ 135
Public awareness of and support for smoke-free legislation in Turkey: a national survey using the lot quality sampling technique ............................................................................................................................141
Blood lead level among Palestinian schoolchildren: a pilot study ..........................................................................151
Birth weight and risk of childhood acute leukaemia ...............................................................................................156
External cephalic version for breech presentation at term: predictors of success, and impact on the rate of caesarean section ....................................................................................................................................162
Depression among a group of elders in Alexandria, Egypt .....................................................................................167
Frequency of impaired glucose tolerance and diabetes mellitus in subjects with fasting blood glucose below 6.1 mmol/L (110 mg/dL) ................................................................................................................................. 175
Interleukins 12 and 13 levels among beta-thalassaemia major patients .................................................................. 181
Reviews
Médicaments et allaitement maternel : évaluation du risque médicamenteux chez le nourrisson ....................186
Diagnostic et évaluation de l’hépatite virale C chez l’hémodialysé .......................................................................192
Report
Evaluation of national tuberculosis surveillance system in Afghanistan ................................................................200
Cover 19-2.indd 1 2/20/2013 2:31:21 PM
Subscriptions and Distribution Enquiries regarding subscriptions and distribution of the print edition of EMHJ should
be addressed to: Printing and Marketing of Publications at: email: [email protected]; tel: (+202) 2276 5000; fax: (+202) 2670 2492 or 2670 2494
Permissions Requests for permission to reproduce or translate articles, whether for sale or
non-commercial distribution should be addressed to EMHJ at: [email protected]
Correspondence
Editor-in-chiefEMHJ
WHO Regional Office for the Eastern MediterraneanP.O. Box 7608
Nasr City, Cairo 11371 Egypt
Tel: (+202) 2276 5000 Fax: (+202) 2670 2492/(+202) 2670 2494
Email: [email protected]/[email protected]
EASTERN MEDITERRANEAN HEALTH JOURNALIS the official health journal published by the Eastern Mediterranean Regional Office of the World Health Organization. It is a forum for the presentation and promotion of new policies and initiatives in health services; and for the exchange of ideas, con‑cepts, epidemiological data, research findings and other information, with special reference to the Eastern Mediterranean Region. It addresses all members of the health profession, medical and other health educational institutes, interested NGOs, WHO Col‑laborating Centres and individuals within and outside the Region.
LA REVUE DE SANTÉ DE LA MÉDITERRANÉE ORIENTALEEST une revue de santé officielle publiée par le Bureau régional de l’Organisation mondiale de la Santé pour la Méditerranée orientale. Elle offre une tribune pour la présentation et la promotion de nouvelles politiques et initiatives dans le domaine des ser‑vices de santé ainsi qu’à l’échange d’idées, de concepts, de données épidémiologiques, de résultats de recherches et d’autres informations, se rapportant plus particulièrement à la Région de la Méditerranée orientale. Elle s’adresse à tous les professionnels de la santé, aux membres des instituts médicaux et autres instituts de formation médico‑sanitaire, aux ONG, Centres collabora‑teurs de l’OMS et personnes concernés au sein et hors de la Région.
EMHJ is a trilingual, peer reviewed, open access journal and the full contents are freely available at its website: http://www/emro.who.int/emhj.htm
EMHJ is abstracted/indexed in the Index Medicus and MEDLINE (Medical Literature Analysis and Retrieval Systems on Line) and the ExtraMed‑Full text on CD‑ROM, the Cumulative Index to Nursing and Allied Health Literature (CINAHL), CAB International, Lexis Nexis, Scopus and the Index Medicus for the WHO Eastern Mediterranean Region (IMEMR).
©World Health Organization 2013 All rights reserved
Disclaimer The designations employed and the presentation of the material in this publication do not imply the expression of any opinion whatsoever on the part of the World Health Organization concerning the legal status of any country, territory, city or area or of its authorities, or concerning the delimitation of its frontiers or boundaries. Dotted lines on maps represent approximate border lines for which there may not yet be full agreement. The mention of specific companies or of certain manufacturers’ products does not imply that they are endorsed or recommended by the World Health Organization in preference to others of a similar nature that are not mentioned. All reasonable precautions have been taken by the World Health Organization to verify the information contained in this publication. However, the published material is being distributed without warranty of any kind, either express or implied. The responsibility for the interpretation and use of the material lies with the reader. In no event shall the World Health Organization be liable for damages arising from its use. The named authors alone are responsible for the views expressed in this publication.
ISSN 1020‑3397
Cover designed by Diana Tawadros Internal layout designed by Emad Marji and Diana Tawadros
Printed by WHO Regional Office for the Eastern Mediterranean
هى املجلة الرسمية التى تصدر عن املكتب اإلقليمى لرشق املتوسط بمنظمة الصحة العاملية. وهى منرب لتقديم الوبائية واملعطيات واملفاهيم اآلراء ولتبادل هلا، والرتويج الصحية اخلدمات اجلديدة ىف واملبادرات السياسات املتوسط. وهى موجهة إىل كل بإقليم رشق يتعلق منها ما املعلومات، وخاصة ونتائج األبحاث وغري ذلك من واملراكز املعنية، احلكومية املنظامت غري التعليمية، وكذا املعاهد الطبية وسائر والكليات الصحية، املهن أعضاء
املتعاونة مع منظمة الصحة العاملية واألفراد املهتمني بالصحة ىف اإلقليم وخارجه.
املجلة الصحية لرشق املتوسط
البلدان أعضاء اللجنة اإلقليمية ملنظمة الصحة العاملية لرشق املتوسط
األردن . أفغانستان . اإلمارات العربية املتحدة . باكستان . البحرين . تونس . ليبيا . مجهورية إيران اإلسالمية اجلمهورية العربية السورية . اليمن . جنوب السودان . جيبويت . السودان . الصومال . العراق . عامن . فلسطني . قطر . الكويت . لبنان . مرص
املغرب . اململكة العربية السعودية
Members of the WHO Regional Committee for the Eastern Mediterranean
Afghanistan . Bahrain . Djibouti . Egypt . Islamic Republic of Iran . Iraq . Jordan . Kuwait . Lebanon Libya . Morocco . Oman . Pakistan . Palestine . Qatar . Saudi Arabia . Somalia . South Sudan
Sudan . Syrian Arab Republic . Tunisia . United Arab Emirates . Yemen
Membres du Comité régional de l’OMS pour la Méditerranée orientale
Afghanistan . Arabie saoudite . Bahreïn . Djibouti . Égypte . Émirats arabes unis . République islamique d’Iran Iraq . Libye . Jordanie . Koweït . Liban . Maroc . Oman . Pakistan . Palestine . Qatar . République arabe syrienne
Somalie . Soudan . Soudan du Sud . Tunisie . Yémen
Cover 19-2.indd 2 2/20/2013 2:31:21 PM
Contents
La Revue de Santé dela Méditerranée orientale
Eastern MediterraneanHealth Journal
Vol. 19 No. 2 •املجلد التاسع عرش عدد 2 2013 •
Acknowledgement of the work of Dr Mohammad Haytham Khayat ............................................................................................................................................................103Editorial
Child mortality in the Eastern Mediterranean Region: challenges and opportunitiesZulfiqar A. Bhutta, MBBS, PhD, FRCP, FRCPCH, FCPS, FAAP ..........................................................................................................................................................................................104
Research articlesFactors affecting defaulting from DOTS therapy under the national programme of tuberculosis control in Alexandria, EgyptM. Nour El-Din, T. Elhoseeny and A.M.M.A. Mohsen ..................................................................................................................................................................................................................107Factors associated with patient delay in accessing pulmonary tuberculosis care, Gezira State, Sudan, 2009E.Y. Mohamed, S.M. Abdalla, A.A. Khamis, A. Abdelbadea and M.A. Abdelgadir .............................................................................................................................................................114Mycobacterium tuberculosis spoligotypes circulating in the Lebanese population: a retrospective studyN. Bedrossian, M. Hamze, A.K. Rahmo, A. Jurjus, J. Saliba, F. Dabboussi and W. Karam ................................................................................................................................................119Health education and peer leaders’ role in improving low vaccination coverage in Akre district, Kurdistan region, IraqM.A. Abdul Rahman, S.A. Al-Dabbagh and Q.S. Al-Habeeb .....................................................................................................................................................................................................125High incidence of hepatitis B infection after treatment for paediatric cancer at a teaching hospital in BaghdadM.F. Al-Jadiry, M. Al-Khafagi, A.F. Al-Darraji, R .M. Al-Saeed, S.F. Al-Badri and S.A. Al-Hadad ................................................................................................................................130Risk factors for human brucellosis in northern JordanM.N. Abo-Shehada and M. Abu-Halaweh .........................................................................................................................................................................................................................................135Public awareness of and support for smoke-free legislation in Turkey: a national survey using the lot quality sampling techniqueB. Cakir, T. Buzgan, S. Com, H. Irmak, E. Aydin and C. Arpad .................................................................................................................................................................................................141Blood lead level among Palestinian schoolchildren: a pilot studyA.F. Sawalha, R .O. Wright, D.C. Bellinger, C. Amarasiriwardean, A.S. Abu-Taha and W.M. Sweileh ...........................................................................................................................151Birth weight and risk of childhood acute leukaemiaA. Gholami, S. Salarilak, S. Hejazi and H.R. Khalkhali ...............................................................................................................................................................................................................156External cephalic version for breech presentation at term: predictors of success, and impact on the rate of caesarean sectionO.A. Hussin, M.A. Mahmoud and M.M. Abdel-Fattah ................................................................................................................................................................................................................162Depression among a group of elders in Alexandria, EgyptH.M. El Kady and H.K. Ibrahim ...........................................................................................................................................................................................................................................................167Frequency of impaired glucose tolerance and diabetes mellitus in subjects with fasting blood glucose below 6.1 mmol/L (110 mg/dL)S.H. Khan, A. Ijaz, S.A. Raza Bokhari, M.S. Hanif and N. Azam ............................................................................................................................................................................................175Interleukins 12 and 13 levels among beta-thalassaemia major patientsR.A. Hashad, N.A. Hamed, M.M. El Gharabawy, H.A. El Metwally and M.G. Morsi .....................................................................................................................................................181
ReviewsMédicaments et allaitement maternel : évaluation du risque médicamenteux chez le nourrissonY. Khabbal, S. Zaoui et Y. Cherrah .........................................................................................................................................................................................................................................................186Diagnostic et évaluation de l’hépatite virale C chez l’hémodialyséA. Bahadi, O. Maoujoud, Y. Zejjari, A. Alayoud, K. Hassani, D. Elkabbaj et M. Benyahia ...............................................................................................................................................192
ReportEvaluation of national tuberculosis surveillance system in AfghanistanK.M.I. Saeed, R . Bano and R .J. Asghar ................................................................................................................................................................................................................................................200
Book 19-2.indb 103 2/21/2013 11:39:15 AM
Dr Ala Alwan, Editor-in-chief
Editorial Board Professor Zulfiqar Bhutta Professor Mahmoud Fahmy Fathalla Professor Rita Giacaman Dr Ziad MemishDr Sameen SiddiqiProfessor Huda Zurayk
Editors Fiona Curlet, Guy Penet Eva Abdin, Alison Bichard, Marie-France Roux
Graphics Suhaib Al Asbahi, Hany Mahrous, Diana Tawadros
Administration Nadia Abu-Saleh, Yasmine El Sakhawy, Yasmeen Sedky, Heba ElBayoumi
Book 19-2.indb 720 2/21/2013 11:39:15 AM
املجلد التاسع عرشاملجلة الصحية لرشق املتوسطالعدد الثاين
103
Acknowledgement of the work of Dr Mohammad Haytham Khayat
Following the appointment of a new editorial board and advisory panel for the Eastern Mediterranean Health Journal, I would like to pay tribute to Dr Mohammad Haytham Khayat, who served as Editor-in Chief for 19 years. Dr Khayat played a key role in creation of EMHJ in 1995 as a new peer-reviewed journal for the Eastern Mediterranean Region, through the amalgamation of two journals, the Health Services Journal and the EMRO Epidemiological Bulletin. Under his leadership, EMHJ has developed from just two issues a year, to 12 issues a year, with submissions increasing from just a few to over 700. It has evolved to become a leading journal in the Region, growing both in popular-ity and reputation, and becoming a flagship publication of the Regional Office. In recent years the journal has also been published online and is now one of the most frequently visited sections of the Regional Office web site. As of Volume 19, 2013, EMHJ has been included in Thomson Reuters’ Science Citation Index Expanded, the Social Science Citation Index, online at the Web of Knowledge. This will lead to the journal having an impact factor by 2015. All this could not have been achieved without Dr Khayat’s guidance and steadfast support.
Dr Khayat is well known within and outside the World Health Organization Regional Office for the Eastern Mediterranean for his long and valuable contribution to public health in the Region, for his dedicated promotion of the use of Arabic and the dissemination of pub-lic health information in both English and Arabic. In the latter regard, supported by Dr Hussein A. Gezairy, former Regional Director, he founded the Regional Arabic Programme, which subsequently became the WHO Arabic Programme. He was a key figure in the incep-tion and production of many Regional Office publications in his 30-year career with the Organization. These include The unified medical dictionary, now in its 4th edition, which aims to make basic medical terms accessible to Arabic-speaking doctors, dentists and other medical and scientific professionals, and the educational series The right path to health: health education through religion which, in a region where religion plays such an important role in people’s lives, aimed to draw on religion to help promote healthy lifestyles and practices.
I would like to take this opportunity to thank Dr Khayat for his dedication to EMHJ in his 19 years as Editor-in-Chief. It is, and will continue to be, sincerely valued and appreciated.
Dr Ala Alwan WHO Regional Director for the Eastern Mediterranean
م بخالص الشكر والتقدير للدكتور حممد هيثم اخلياط الذي البد يل بعد تعيني جملس جديد للتحرير وهيئة استشارية جديدة للمجلة الصحية لرشق املتوسط، أن أتقدمة بمراجعة الزمالء، بعد شغل رئاسة حترير املجلة 19 عاما، وقد كان له دور رئييس يف إنشاء هذه املجلة عام 1995 لتكون جملة جديدة يف إقليم رشق املتوسط حمكدمج جملتني مها جملة اخلدمات الصحية والنرشة الوبائية للمكتب اإلقليمي لرشق املتوسط. وقد شهدت املجلة حتت قيادة األستاذ الدكتور اخلياط تطورا كبريا، فبعد رت م للنرش فيها من بضع آحاد لتزيد عن 700، ومالبث أن تطو أن كان يصدر منها عددان سنويا، أصبح يصدر منها 12 عددا سنويا، كام زاد عدد األوراق التي تقدأكثر لتصبح املجلة الرئيسية يف اإلقليم، فزادت شعبيتها وسمعتها، وأضحت من املطبوعات الذائعة الصيت يف املكتب اإلقليمي. ثم ما أن بدأ النرش اإللكرتوين فإن املجلة 2013 العام 19 يف هذا املواقع استقطابا للزوار ملوقع املكتب اإلقليمي. ومع صدور املجلد للمجلة عىل صفحات اإلنرتنت، حتى أصبحت من أكثر ع لتوماس رويرت، وفهرس االقتباسات العلمية االجتامعية، واملعارف املنشورة عىل صفحات اإلنرتنت؛ وسيؤدي ستدرج ضمن فهرس االقتباسات العلمية املوس
ذلك إىل أن يسجل للمجلة عامل التأثري بحلول عام 2015، ومل يكن ألي من ذلك أن يتم لوال اجلهد الدؤوب واإلرشاد احلكيم لألستاذ الدكتور اخلياط.
والدكتور حممد هيثم اخلياط معروف ضمن املكتب اإلقليمي ملنظمة الصحة العاملية لرشق املتوسط وخارجه، ملا عرف عنه من إسهام قيم ومديد يف الصحة العمومية يف اإلقليم، وإلخالصه العميق يف تعزيز استخدام اللغة العربية ونرش املعلومات يف جمال الصحة العمومية بكل من اللغتني العربية واإلنكليزية. س األستاذ الدكتور اخلياط، بدعم من الدكتور حسني عبد الرزاق اجلزائري، املدير اإلقليمي السابق، الربنامج العريب اإلقليمي الذي ويف هذا املجال، فقد أسل إىل الربنامج العريب ملنظمة الصحة العاملية. ولقد كان األستاذ الدكتور اخلياط الشخصية األكثر متيزا يف إعداد وإنتاج الكثري من املنشورات رسعان ما حتود الذي وصل واملطبوعات التي صدرت عن املكتب اإلقليمي خالل فرتة حياته املهنية يف املنظمة التي استمرت ثالثني عاما؛ ونذكر منها املعجم الطبي املوحاآلن إىل طبعته الرابعة، والذي يستهدف إتاحة املصطلحات الطبية والصحية األساسية لألطباء وألطباء األسنان ولغريهم من أرباب املهن الطبية والعلمية باللغة العربية، كام نذكر منها السلسلة التثقيفية اهلدي الصحي: التثقيف الصحي من خالل تعاليم الدين، وقد استهدفت هذه السلسلة االعتامد عىل الدين
لتعزيز أنامط احلياة الصحية واملامرسات الصحية يف هذا اإلقليم الذي يؤدي فيه الدين دورا هاما يف حياة الناس.
م إىل األستاذ الدكتور اخلياط بالشكر واالمتنان عىل تفانيه يف خدمة املجلة الصحية لرشق املتوسط طيلة 19 عاما من خدمته وأود أن أغتنم هذه املناسبة ألتقدهلا رئيسا للتحرير؛ فذلك اجلهد جدير حقا بالتقدير واالحرتام، وسيبقى كذلك عىل الدوام.
الدكتور عالء الدين العلواناملدير اإلقليمي ملنظمة الصحة العاملية لرشق املتوسط
شكر وتقدير لعمل الدكتور محمد هيثم الخياط
Book 19-2.indb 103 2/26/2013 8:41:28 AM
EMHJ • Vol. 19 No. 2 • 2013 Eastern Mediterranean Health JournalLa Revue de Santé de la Méditerranée orientale
104
Editorial
Child mortality in the Eastern Mediterranean Region: challenges and opportunitiesZulfiqar A. Bhutta, MBBS, PhD, FRCP, FRCPCH, FCPS, FAAP 1
1Noordin Noormahomed Sharieff Professor & Founding Chair, Division of Women & Child Health, The Aga Khan University, Karachi 74800, Pakistan.
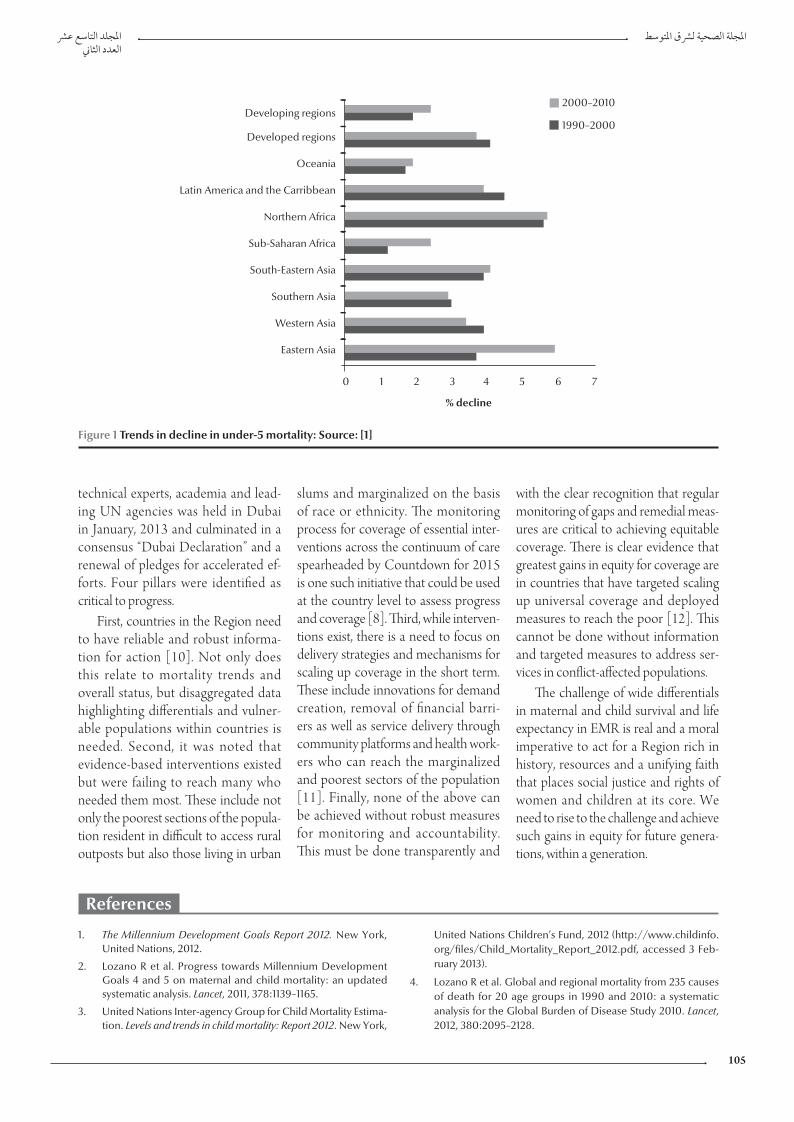
In the year 2000, 189 heads of state signed the United Nations (UN) Millennium Declaration consisting of eight Millennium Development Goals (MDGs) with a focus on an integrated global agenda for poverty reduction, health, education and hu-man development [1]. Although many countries have made progress, corre-sponding gains in targets for child sur-vival (MDG4) and maternal survival (MDG5) are slow. It is estimated that to achieve MDG4 targets, the annual rate of decline in child mortality should be around 4.4%, but the corresponding rate of decline since 1990 has only aver-aged 1.5% with wide variations between regions (Figure 1). Similarly, to achieve MDG5, the annual rate of maternal mortality decline needed to be 5.5% but global figures since 1990 indicate a decline of only 1.9% [2,3].
Around 39 000 women of child-bearing age still die every year in the World Health Organization Eastern Mediterranean Region (EMR) as a result of pregnancy-related complica-tions (sepsis, haemorrhage, eclampsia, obstructed labour and unsafe abor-tions) [4]. Mortality rates are particu-larly high among pregnant adolescents who account for a significant propor-tion of first births. Overall the maternal mortality ratio (MMR) in EMR fell by 53% between 1990 and 2010, and six countries have already achieved MMR beyond MDG5 targets and seven more are on track. Over 90% of the burden of maternal deaths in the Region is shared
by seven countries: Afghanistan, Iraq, Morocco, Pakistan, Somalia, Sudan and Yemen. In terms of MDG5, five countries are not on track to achieve its targets: Djibouti, Iraq, Pakistan, Soma-lia and Tunisia [5].
In EMR 12.2% of the population comprises children under 5 years of age, while 20% are women of child-bearing age. An estimated 923 000 children under 5 years die every year in the Region and under-five mortality has decreased by only 41% since 1990, from 99 deaths per 1000 live births to 58 per 1000 live births in 2011. EMR ranks fifth among the six WHO regions in terms of progress in reducing the under‐five mortality, ahead only of the African Region [5].
Progress across the Region for child survival remains uneven. Six countries (Oman, United Arab Emirates, Bah-rain, Lebanon, Qatar and Saudi Arabia) in EMR have already achieved reduc-tions in the under-five mortality rate well beyond the targets of MDG4. The highest decrease in under‐five mortal-ity in the world (72%) between 1990 and 2010 did occur in the Northern African countries of the Region. Of the total under-five deaths in EMR, 82% occur in six countries (Afghanistan, Pakistan, Somalia, South Sudan, Sudan and Yemen). Of these, three countries, Sudan, Afghanistan and Pakistan, are among the 10 countries with highest child mortality in the world, a fact that has been recognized for almost a dec-ade [6]. It is largely because of the high
under‐five population and mortality rates in these countries, which represent over half (54%) of the total population in the Region, that EMR is unlikely to achieve MDG4.
We also know a fair bit about the major causes of child mortality in the Region and its determinants. Neonatal deaths represent a substantial propor-tion (43%) of under‐five mortality in the Region and are clearly linked to the poor status of maternal health among the poorest sections of the population [7]. In four countries, namely Afghani-stan, Pakistan, Somalia and Yemen, less than 50% of deliveries were attended by skilled health personnel in 2010 [8]. Across the Region, only 31% of mar-ried women use modern contracep-tives and 35% of women and newborns are delivered without a skilled attendant at childbirth. Beyond the neonatal pe-riod, four disorders – diarrhoea, pneu-monia, malaria and measles – are the major causes of post-neonatal death [9].
These findings reinforce the im-perative for action. Without intensive and accelerated action, especially in those countries contributing to the bulk of under-five deaths, the Region will not join the rank of developed coun-tries and those that have climbed the development ladder. In recent months, commendable progress has been made in raising awareness in the Re-gion and building the case for relevant evidence-based actions for change. A high-level meeting of health ministers,
Book 19-2.indb 104 2/21/2013 11:39:16 AM
املجلد التاسع عرشاملجلة الصحية لرشق املتوسطالعدد الثاين
105
technical experts, academia and lead-ing UN agencies was held in Dubai in January, 2013 and culminated in a consensus “Dubai Declaration” and a renewal of pledges for accelerated ef-forts. Four pillars were identified as critical to progress.
First, countries in the Region need to have reliable and robust informa-tion for action [10]. Not only does this relate to mortality trends and overall status, but disaggregated data highlighting differentials and vulner-able populations within countries is needed. Second, it was noted that evidence-based interventions existed but were failing to reach many who needed them most. These include not only the poorest sections of the popula-tion resident in difficult to access rural outposts but also those living in urban
slums and marginalized on the basis of race or ethnicity. The monitoring process for coverage of essential inter-ventions across the continuum of care spearheaded by Countdown for 2015 is one such initiative that could be used at the country level to assess progress and coverage [8]. Third, while interven-tions exist, there is a need to focus on delivery strategies and mechanisms for scaling up coverage in the short term. These include innovations for demand creation, removal of financial barri-ers as well as service delivery through community platforms and health work-ers who can reach the marginalized and poorest sectors of the population [11]. Finally, none of the above can be achieved without robust measures for monitoring and accountability. This must be done transparently and
with the clear recognition that regular monitoring of gaps and remedial meas-ures are critical to achieving equitable coverage. There is clear evidence that greatest gains in equity for coverage are in countries that have targeted scaling up universal coverage and deployed measures to reach the poor [12]. This cannot be done without information and targeted measures to address ser-vices in conflict-affected populations.
The challenge of wide differentials in maternal and child survival and life expectancy in EMR is real and a moral imperative to act for a Region rich in history, resources and a unifying faith that places social justice and rights of women and children at its core. We need to rise to the challenge and achieve such gains in equity for future genera-tions, within a generation.
Developing regions
Developed regions
Oceania
Latin America and the Carribbean
Northern Africa
Sub-Saharan Africa
South-Eastern Asia
Southern Asia
Western Asia
Eastern Asia
2000–2010
1990–2000
0 1 2 3 4 5 6 7
% decline
% decline
Figure 1 Trends in decline in under-5 mortality: Source: [1]
1. The Millennium Development Goals Report 2012. New York, United Nations, 2012.
2. Lozano R et al. Progress towards Millennium Development Goals 4 and 5 on maternal and child mortality: an updated systematic analysis. Lancet, 2011, 378:1139–1165.
3. United Nations Inter-agency Group for Child Mortality Estima-tion. Levels and trends in child mortality: Report 2012. New York,
United Nations Children’s Fund, 2012 (http://www.childinfo.org/files/Child_Mortality_Report_2012.pdf, accessed 3 Feb-ruary 2013).
4. Lozano R et al. Global and regional mortality from 235 causes of death for 20 age groups in 1990 and 2010: a systematic analysis for the Global Burden of Disease Study 2010. Lancet, 2012, 380:2095–2128.
References
Book 19-2.indb 105 2/21/2013 11:39:17 AM
EMHJ • Vol. 19 No. 2 • 2013 Eastern Mediterranean Health JournalLa Revue de Santé de la Méditerranée orientale
106
5. Saving the lives of mothers and children: rising to the challenge. Background document for the High Level Meeting on Saving the Lives of Mothers and Children: Accelerating Progress To-wards Achieving MDGs 4 and 5 in the Region, Dubai, United Arab Emirates, 29–30 January 2013 (http://applications.emro.who.int/docs/High_Level_Exp_Reg_doc_2013_EN_14811.pdf, accessed 3 February 2013).
6. Bhutta ZA et al. Child health and survival in the Eastern Medi-terranean region. British Medical Journal, 2006, 333:839–842.
7. Liu L et al. Global, regional, and national causes of child mor-tality: an updated systematic analysis for 2010 with time trends since 2000. Lancet, 2012, 379:2151–2161.
8. Countdown to 2012 Maternal, Newborn and Child Survival. Build-ing a future for women and children. The 2012 Report. Geneva, World Health Organization and UNICEF, 2010.
9. Fischer-Walker C et al. Global burden of childhood diarrhoea and pneumonia: leading causes of child mortality. Lancet, 2013 (in press).
10. Every woman, every child: from commitments to action: the first report of the independent Expert Review Group (iERG) on Infor-mation and Accountability for Women’s and Children’s Health. Geneva, World Health Organization, 2012.
11. Lassi ZS, Haider BA, Bhutta ZA. Community-based intervention packages for reducing maternal and neonatal morbidity and mortality and improving neonatal outcomes. Cochrane Data-base of Systematic Reviews, 2010, (11):CD007754.
12. Victora CG et al. How changes in coverage affect equity in maternal and child health interventions in 35 Countdown to 2015 countries: an analysis of national surveys. Lancet, 2012, 380:1149–1156.
Book 19-2.indb 106 2/21/2013 11:39:17 AM
املجلد التاسع عرشاملجلة الصحية لرشق املتوسطالعدد الثاين
107
Factors affecting defaulting from DOTS therapy under the national programme of tuberculosis control in Alexandria, EgyptM. Nour El-Din,1 T. Elhoseeny 2 and A.M.M.A. Mohsen 3
ABSTRACT This unmatched case–control study aimed to identify factors affecting default from therapy under the national programme of TB control in Alexandria, Egypt. Record reviews and structured interviews were made with 57defaulters and 187 randomly selected controls. Univariate analysis showed 13 out of 54 factors investigated were significantly associated with defaulting and, after stepwise logistic regression, 5 factors remained in the model: younger age (adjusted OR= 0.16), rural area of residence (OR = 12.9), long waiting times (OR = 5.81), poor physician–patient communication (OR = 3.06) and fear of information leakage (OR = 3.62). Reasons cited by defaulters included long distance to the clinic, unsuitable clinic times and long waiting times. The main factors associated with defaulting from the national programme of TB control in Alexandria, Egypt were service-related factors, which are amenable to improvement.
1e-School of Health and Environmental Studies, Hamdan Bin Mohammed e-University, Dubai, United Arab Emirates.2Hospital Administration Division, Department of Health Administration and Behavioural Sciences, High Institute of Public Health, Alexandria, Egypt.3National Programme of Tuberculosis Control, Egyptian Ministry of Health, Cairo, Egypt.
Received: 01/10/11; accepted: 21/02/12
يف السل ملكافحة الوطني الربنامج ضمن )دوتس( املبارش اإلرشاف حتت األمد القصرية املعاجلة إخفاق عىل املؤثرة العوامل اإلسكندرية، مرص
مصطفى نور الدين حسن، تغاريد عباس احلسيني، عبد املحسن حممد عبد املحسن
الوطني الربنامج املعاجلة ضمن املؤثرة يف اإلخفاق يف العوامل ف عىل التعر إىل املتوافقة والشواهد غري للحاالت الدراسة اخلالصـة: هتدف هذه ملكافحة السل يف اإلسكندرية، مرص، وقد أجرى الباحثون مراجعات للسجالت ومقابالت منظمة مع 53 من الذين أخفقت معاجلتهم، ومع 187 من الشواهد الذين اختاروهم عشوائيا. وأوضح التحليل الوحيد املتغري أن 13 عامال من بني 54 عامال استقصاها الباحثون قد ترابطت ترابطا يعتد به إحصائيا مع اإلخفاق، وبعد إجراء التحوف اللوجستي التدرجيي، بقيت مخسة عوامل يف النموذج، وهي: العمر األصغر )معدل األرجحية 0.16(، واإلقامة يف منطقة ريفية )معدل األرجحية 12.9(، وأوقات االنتظار الطويلة )معدل األرجحية 5.81(، وسوء التواصل بني املريض والطبيب )معدل ب املعلومات )معدل األرجحية 3.62(. أما األسباب التي ذكرها الذين أخفقت معاجلتهم فتشمل املسافة الطويلة األرجحية 3.06(، واخلوف من ترسللوصول إىل العيادة، وعدم مالءمة أوقات العيادات، وأوقات االنتظار الطويلة. أما العوامل الرئيسية لإلخفاق يف الربنامج الوطني ملكافحة السل يف
اإلسكندرية، مرص فقد كانت عوامل تتعلق باخلدمة، وهي عوامل يمكن تصحيحها وحتسينها.
Facteurs liés à l'abandon du traitement DOTS dans le cadre du programme national de lutte antituberculeuse à Alexandrie (Égypte)
RÉSUMÉ La présente étude cas-témoins non appariés visait à identifier les facteurs influant sur l'abandon du traitement dans le cadre du programme national de lutte antituberculeuse à Alexandrie (Égypte). Les dossiers médicaux de 57 patients ayant abandonné le traitement et de 187 témoins sélectionnés aléatoirement ont été examinés puis des entretiens structurés ont été menés. Une analyse univariée a démontré que 13 facteurs étudiés sur 54 étaient significativement associés à un abandon et, après une analyse de régression logistique par étapes, cinq facteurs ont été dégagés à partir du modèle : un âge plus jeune (OR ajusté = 0,16), un lieu de résidence en milieu rural (OR = 12,9), un long temps d'attente (OR = 5,81), une mauvaise communication entre le médecin et le patient (OR = 3,06) et la crainte de la divulgation d'informations (OR = 3,62). Une longue distance pour atteindre l'établissement de soins, des horaires d'ouverture peu pratiques et de longs temps d'attente comptaient parmi les raisons citées par les patients ayant abandonné le traitement. Les principaux facteurs associés à un abandon du traitement dans le cadre du programme national de lutte antituberculeuse à Alexandrie (Égypte) relevaient du domaine des services se prêtant aux améliorations.
Book 19-2.indb 107 2/21/2013 11:39:17 AM
EMHJ • Vol. 19 No. 2 • 2013 Eastern Mediterranean Health JournalLa Revue de Santé de la Méditerranée orientale
108
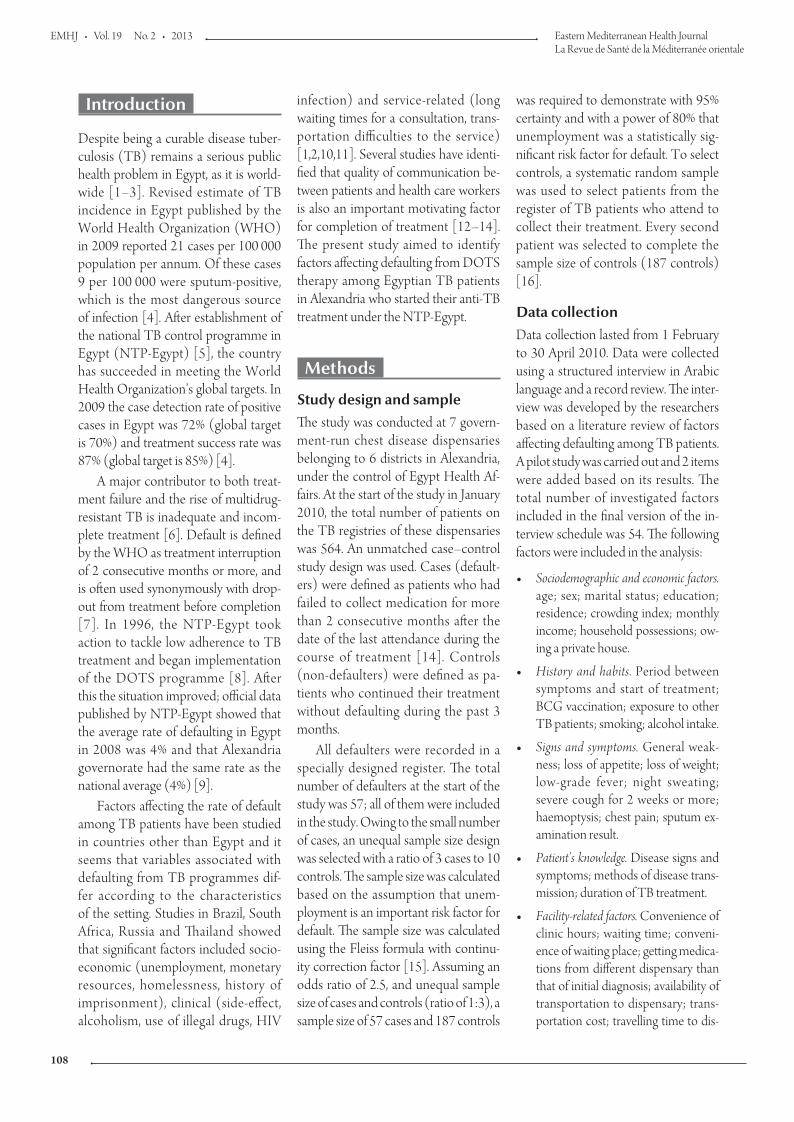
Introduction
Despite being a curable disease tuber-culosis (TB) remains a serious public health problem in Egypt, as it is world-wide [1–3]. Revised estimate of TB incidence in Egypt published by the World Health Organization (WHO) in 2009 reported 21 cases per 100 000 population per annum. Of these cases 9 per 100 000 were sputum-positive, which is the most dangerous source of infection [4]. After establishment of the national TB control programme in Egypt (NTP-Egypt) [5], the country has succeeded in meeting the World Health Organization’s global targets. In 2009 the case detection rate of positive cases in Egypt was 72% (global target is 70%) and treatment success rate was 87% (global target is 85%) [4].
A major contributor to both treat-ment failure and the rise of multidrug- resistant TB is inadequate and incom-plete treatment [6]. Default is defined by the WHO as treatment interruption of 2 consecutive months or more, and is often used synonymously with drop-out from treatment before completion [7]. In 1996, the NTP-Egypt took action to tackle low adherence to TB treatment and began implementation of the DOTS programme [8]. After this the situation improved; official data published by NTP-Egypt showed that the average rate of defaulting in Egypt in 2008 was 4% and that Alexandria governorate had the same rate as the national average (4%) [9].
Factors affecting the rate of default among TB patients have been studied in countries other than Egypt and it seems that variables associated with defaulting from TB programmes dif-fer according to the characteristics of the setting. Studies in Brazil, South Africa, Russia and Thailand showed that significant factors included socio-economic (unemployment, monetary resources, homelessness, history of imprisonment), clinical (side-effect, alcoholism, use of illegal drugs, HIV
infection) and service-related (long waiting times for a consultation, trans-portation difficulties to the service) [1,2,10,11]. Several studies have identi-fied that quality of communication be-tween patients and health care workers is also an important motivating factor for completion of treatment [12–14]. The present study aimed to identify factors affecting defaulting from DOTS therapy among Egyptian TB patients in Alexandria who started their anti-TB treatment under the NTP-Egypt.
Methods
Study design and sampleThe study was conducted at 7 govern-ment-run chest disease dispensaries belonging to 6 districts in Alexandria, under the control of Egypt Health Af-fairs. At the start of the study in January 2010, the total number of patients on the TB registries of these dispensaries was 564. An unmatched case–control study design was used. Cases (default-ers) were defined as patients who had failed to collect medication for more than 2 consecutive months after the date of the last attendance during the course of treatment [14]. Controls (non-defaulters) were defined as pa-tients who continued their treatment without defaulting during the past 3 months.
All defaulters were recorded in a specially designed register. The total number of defaulters at the start of the study was 57; all of them were included in the study. Owing to the small number of cases, an unequal sample size design was selected with a ratio of 3 cases to 10 controls. The sample size was calculated based on the assumption that unem-ployment is an important risk factor for default. The sample size was calculated using the Fleiss formula with continu-ity correction factor [15]. Assuming an odds ratio of 2.5, and unequal sample size of cases and controls (ratio of 1:3), a sample size of 57 cases and 187 controls
was required to demonstrate with 95% certainty and with a power of 80% that unemployment was a statistically sig-nificant risk factor for default. To select controls, a systematic random sample was used to select patients from the register of TB patients who attend to collect their treatment. Every second patient was selected to complete the sample size of controls (187 controls) [16].
Data collectionData collection lasted from 1 February to 30 April 2010. Data were collected using a structured interview in Arabic language and a record review. The inter-view was developed by the researchers based on a literature review of factors affecting defaulting among TB patients. A pilot study was carried out and 2 items were added based on its results. The total number of investigated factors included in the final version of the in-terview schedule was 54. The following factors were included in the analysis:
• Sociodemographic and economic factors. age; sex; marital status; education; residence; crowding index; monthly income; household possessions; ow-ing a private house.
• History and habits. Period between symptoms and start of treatment; BCG vaccination; exposure to other TB patients; smoking; alcohol intake.
• Signs and symptoms. General weak-ness; loss of appetite; loss of weight; low-grade fever; night sweating; severe cough for 2 weeks or more; haemoptysis; chest pain; sputum ex-amination result.
• Patient’s knowledge. Disease signs and symptoms; methods of disease trans-mission; duration of TB treatment.
• Facility-related factors. Convenience of clinic hours; waiting time; conveni-ence of waiting place; getting medica-tions from different dispensary than that of initial diagnosis; availability of transportation to dispensary; trans-portation cost; travelling time to dis-
Book 19-2.indb 108 2/21/2013 11:39:17 AM
املجلد التاسع عرشاملجلة الصحية لرشق املتوسطالعدد الثاين
109
At the end of the interview default-ers were asked to list the most important reasons for defaulting from the pro-gramme using an open-ended question.
Defaulters were approached by one of the researchers and each social worker at the 7 chest diseases dispensa-ries. Interviews were conducted at the patient’s home or one of the dispensa-ries. Controls were interviewed when they attended to collect their treatment. Following patients’ interviews a review was made of medical records of both cases and controls to collect clinical data such as date of starting treatment and initial symptoms. In addition, social worker records were reviewed to collect sensitive sociodemographic data such as income and housing condition.
Consent was taken from each pa-tient before participation. Patient iden-tification data were kept confidential.
Statistical analysis
Statistical analysis was carried out using SPSS, version 16. Pearson chi-squared test was carried out to assess
the association of different factors with defaulting from TB treatment. In case of sparse data, the Fisher exact probability was used as indicated. Unadjusted odds ratio (OR) and confidence intervals (CI) were presented to illustrate the magnitude of effect of different factors on defaulting from TB treatment. Sig-nificant factors in univariate analysis were included in a stepwise logistic re-gression analysis. The model fit was as-sessed using the omnibus test of model coefficients. It tests if the model with the predictors is significantly different from the model with only the intercept. Two-tailed P-value was reported and statistical significance was established at P < 0.05.
Results
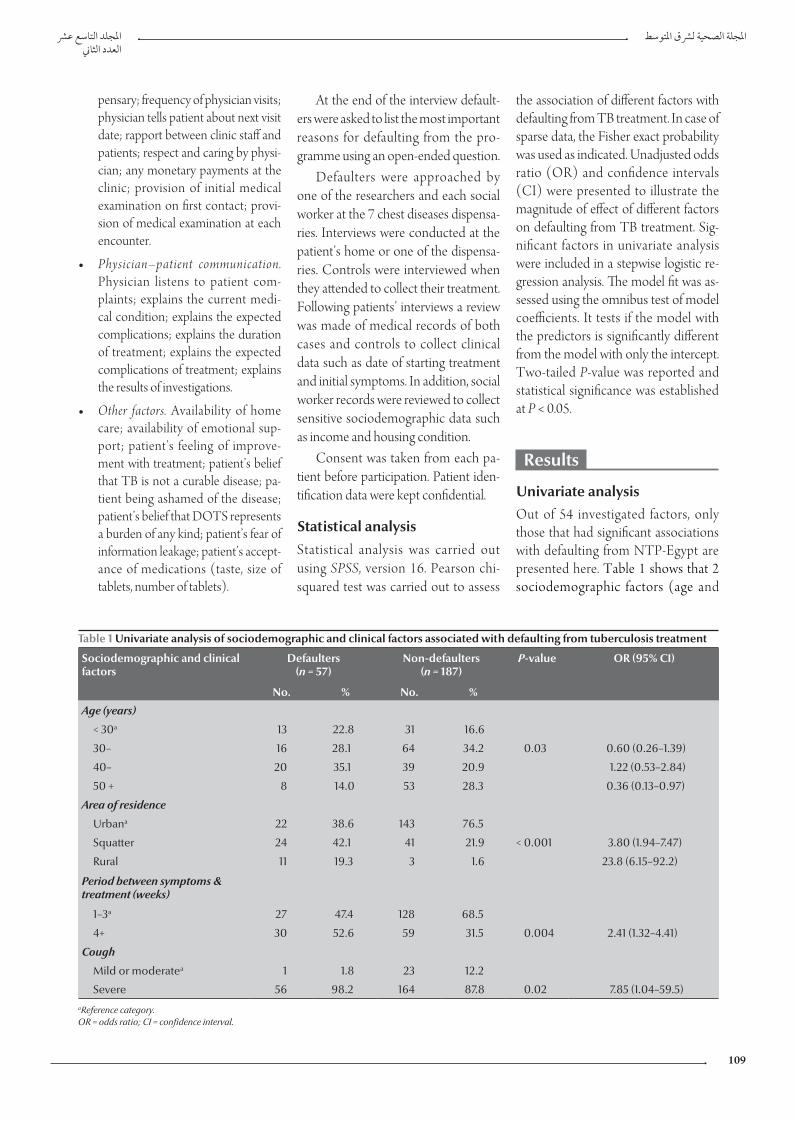
Univariate analysisOut of 54 investigated factors, only those that had significant associations with defaulting from NTP-Egypt are presented here. Table 1 shows that 2 sociodemographic factors (age and
pensary; frequency of physician visits; physician tells patient about next visit date; rapport between clinic staff and patients; respect and caring by physi-cian; any monetary payments at the clinic; provision of initial medical examination on first contact; provi-sion of medical examination at each encounter.
• Physician–patient communication. Physician listens to patient com-plaints; explains the current medi-cal condition; explains the expected complications; explains the duration of treatment; explains the expected complications of treatment; explains the results of investigations.
• Other factors. Availability of home care; availability of emotional sup-port; patient’s feeling of improve-ment with treatment; patient’s belief that TB is not a curable disease; pa-tient being ashamed of the disease; patient’s belief that DOTS represents a burden of any kind; patient’s fear of information leakage; patient’s accept-ance of medications (taste, size of tablets, number of tablets).
Table 1 Univariate analysis of sociodemographic and clinical factors associated with defaulting from tuberculosis treatment
Sociodemographic and clinical factors
Defaulters(n = 57)
Non-defaulters(n = 187)
P-value OR (95% CI)
No. % No. %
Age (years)
< 30a 13 22.8 31 16.6
30– 16 28.1 64 34.2 0.03 0.60 (0.26–1.39)
40– 20 35.1 39 20.9 1.22 (0.53–2.84)
50 + 8 14.0 53 28.3 0.36 (0.13–0.97)
Area of residence
Urbana 22 38.6 143 76.5
Squatter 24 42.1 41 21.9 < 0.001 3.80 (1.94–7.47)
Rural 11 19.3 3 1.6 23.8 (6.15–92.2)
Period between symptoms & treatment (weeks)
1–3a 27 47.4 128 68.5
4+ 30 52.6 59 31.5 0.004 2.41 (1.32–4.41)
Cough
Mild or moderatea 1 1.8 23 12.2
Severe 56 98.2 164 87.8 0.02 7.85 (1.04–59.5)aReference category. OR = odds ratio; CI = confidence interval.
Book 19-2.indb 109 2/21/2013 11:39:17 AM
EMHJ • Vol. 19 No. 2 • 2013 Eastern Mediterranean Health JournalLa Revue de Santé de la Méditerranée orientale
110
area of residence) were significantly different between defaulters and non-defaulters using univariate analysis. A higher percentage of defaulters than non-defaulters were found among pa-tients aged < 30 years (22.8% and 16.6% respectively). The highest percentage of defaulters (42.1%) lived in squatter ar-eas, while most of the controls (76.5%) lived in urban areas. When compared with patients residing in the urban area, patients living in the rural area were 23.8 times more likely to default while those living in a squatter area were 3.8 times more likely to default than those living in urban areas.
Significant clinical factors included the period between symptoms and treatment and severity of cough. Pa-tients with a long duration between symptoms and start of treatment were 2.41 times more likely to default than patients with a short duration between symptoms and start of treatment. Pa-tients presented with severe cough were 7.85 times more likely to default from treatment than those presenting with mild or moderate cough.
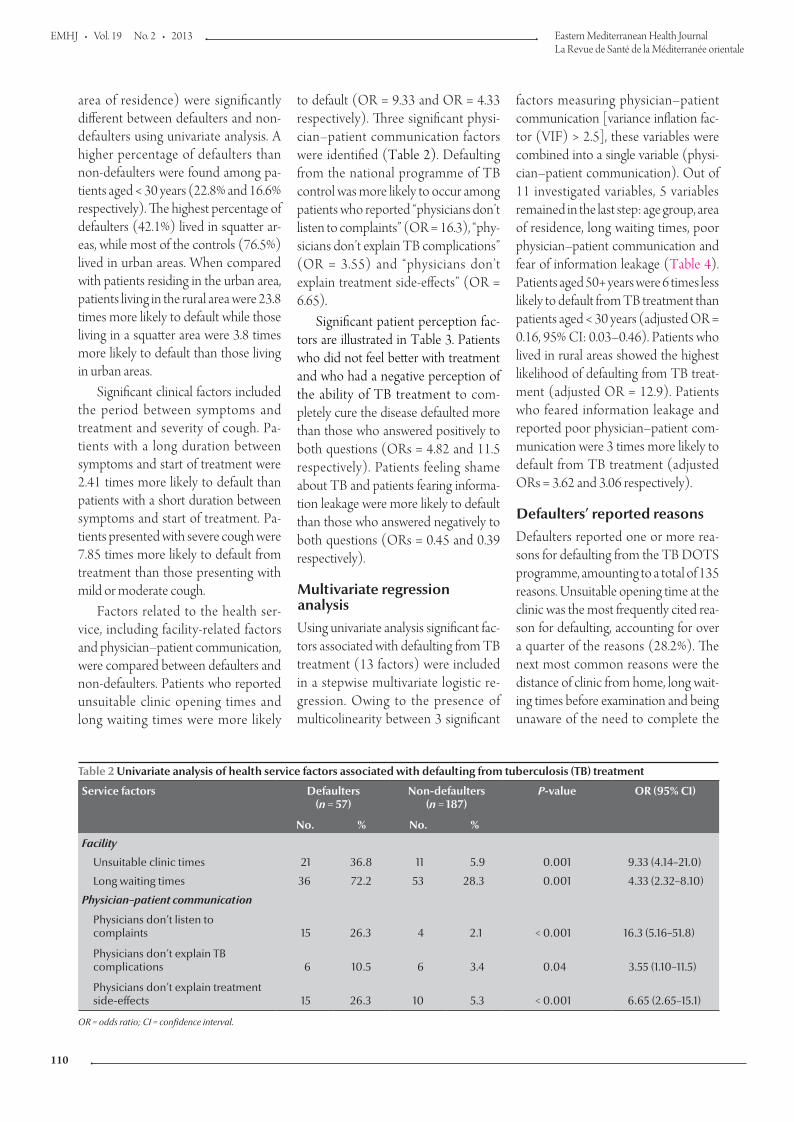
Factors related to the health ser-vice, including facility-related factors and physician–patient communication, were compared between defaulters and non-defaulters. Patients who reported unsuitable clinic opening times and long waiting times were more likely
to default (OR = 9.33 and OR = 4.33 respectively). Three significant physi-cian–patient communication factors were identified (Table 2). Defaulting from the national programme of TB control was more likely to occur among patients who reported “physicians don’t listen to complaints” (OR = 16.3), “phy-sicians don’t explain TB complications” (OR = 3.55) and “physicians don’t explain treatment side-effects” (OR = 6.65).
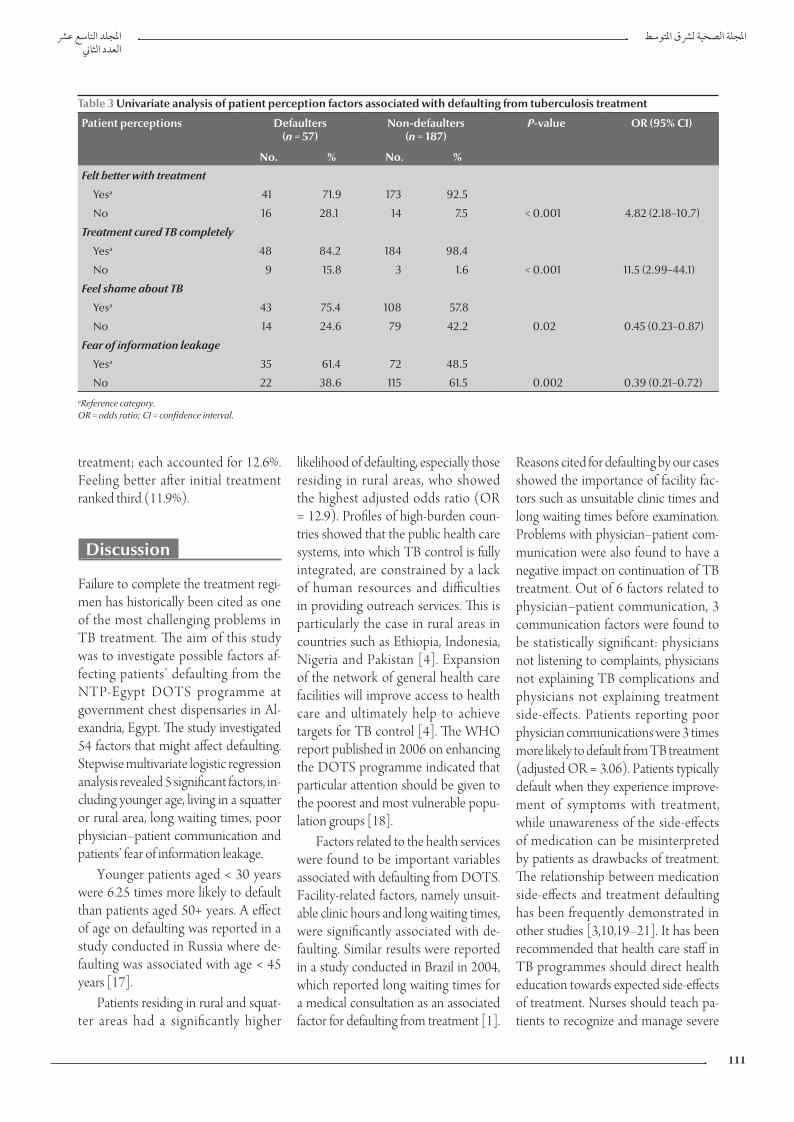
Significant patient perception fac-tors are illustrated in Table 3. Patients who did not feel better with treatment and who had a negative perception of the ability of TB treatment to com-pletely cure the disease defaulted more than those who answered positively to both questions (ORs = 4.82 and 11.5 respectively). Patients feeling shame about TB and patients fearing informa-tion leakage were more likely to default than those who answered negatively to both questions (ORs = 0.45 and 0.39 respectively).
Multivariate regression analysisUsing univariate analysis significant fac-tors associated with defaulting from TB treatment (13 factors) were included in a stepwise multivariate logistic re-gression. Owing to the presence of multicolinearity between 3 significant
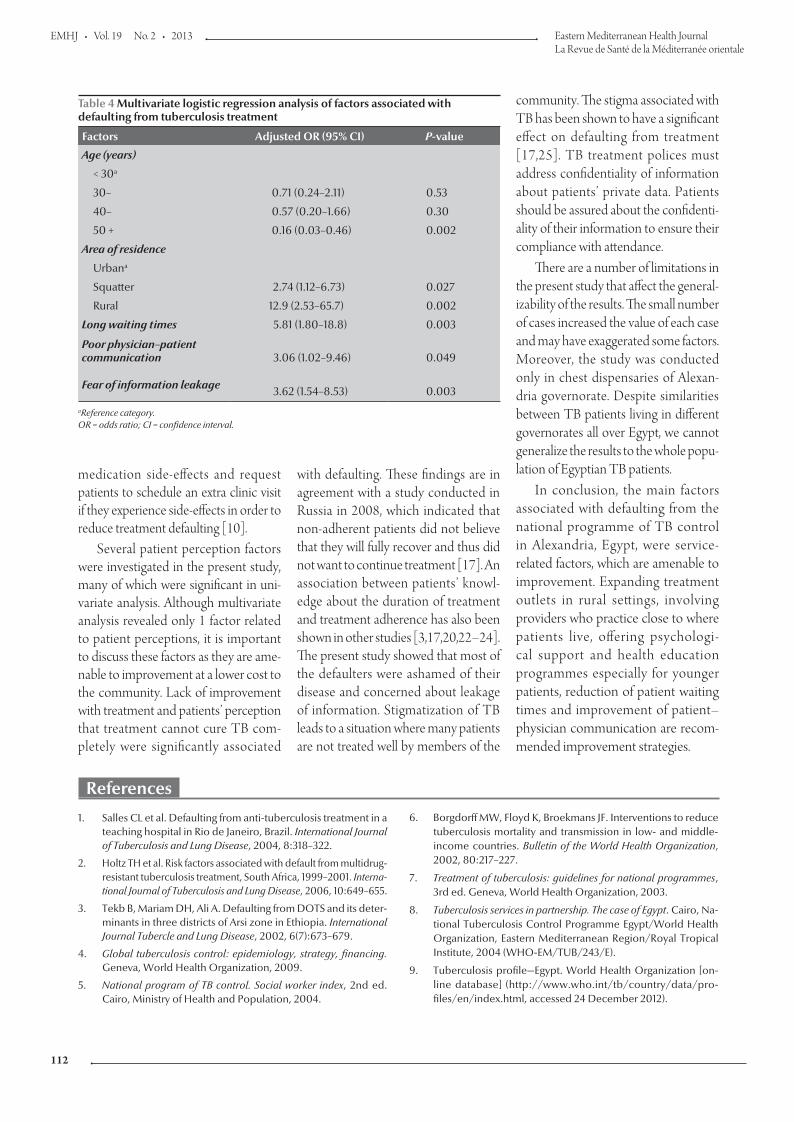
factors measuring physician–patient communication [variance inflation fac-tor (VIF) > 2.5], these variables were combined into a single variable (physi-cian–patient communication). Out of 11 investigated variables, 5 variables remained in the last step: age group, area of residence, long waiting times, poor physician–patient communication and fear of information leakage (Table 4). Patients aged 50+ years were 6 times less likely to default from TB treatment than patients aged < 30 years (adjusted OR = 0.16, 95% CI: 0.03–0.46). Patients who lived in rural areas showed the highest likelihood of defaulting from TB treat-ment (adjusted OR = 12.9). Patients who feared information leakage and reported poor physician–patient com-munication were 3 times more likely to default from TB treatment (adjusted ORs = 3.62 and 3.06 respectively).
Defaulters’ reported reasonsDefaulters reported one or more rea-sons for defaulting from the TB DOTS programme, amounting to a total of 135 reasons. Unsuitable opening time at the clinic was the most frequently cited rea-son for defaulting, accounting for over a quarter of the reasons (28.2%). The next most common reasons were the distance of clinic from home, long wait-ing times before examination and being unaware of the need to complete the
Table 2 Univariate analysis of health service factors associated with defaulting from tuberculosis (TB) treatment
Service factors Defaulters(n = 57)
Non-defaulters(n = 187)
P-value OR (95% CI)
No. % No. %
Facility
Unsuitable clinic times 21 36.8 11 5.9 0.001 9.33 (4.14–21.0)
Long waiting times 36 72.2 53 28.3 0.001 4.33 (2.32–8.10)
Physician–patient communication
Physicians don’t listen to complaints 15 26.3 4 2.1 < 0.001 16.3 (5.16–51.8)
Physicians don’t explain TB complications 6 10.5 6 3.4 0.04 3.55 (1.10–11.5)
Physicians don’t explain treatment side-effects 15 26.3 10 5.3 < 0.001 6.65 (2.65–15.1)
OR = odds ratio; CI = confidence interval.
Book 19-2.indb 110 2/21/2013 11:39:17 AM
املجلد التاسع عرشاملجلة الصحية لرشق املتوسطالعدد الثاين
111
treatment; each accounted for 12.6%. Feeling better after initial treatment ranked third (11.9%).
Discussion
Failure to complete the treatment regi-men has historically been cited as one of the most challenging problems in TB treatment. The aim of this study was to investigate possible factors af-fecting patients’ defaulting from the NTP-Egypt DOTS programme at government chest dispensaries in Al-exandria, Egypt. The study investigated 54 factors that might affect defaulting. Stepwise multivariate logistic regression analysis revealed 5 significant factors, in-cluding younger age, living in a squatter or rural area, long waiting times, poor physician–patient communication and patients’ fear of information leakage.
Younger patients aged < 30 years were 6.25 times more likely to default than patients aged 50+ years. A effect of age on defaulting was reported in a study conducted in Russia where de-faulting was associated with age < 45 years [17].
Patients residing in rural and squat-ter areas had a significantly higher
likelihood of defaulting, especially those residing in rural areas, who showed the highest adjusted odds ratio (OR = 12.9). Profiles of high-burden coun-tries showed that the public health care systems, into which TB control is fully integrated, are constrained by a lack of human resources and difficulties in providing outreach services. This is particularly the case in rural areas in countries such as Ethiopia, Indonesia, Nigeria and Pakistan [4]. Expansion of the network of general health care facilities will improve access to health care and ultimately help to achieve targets for TB control [4]. The WHO report published in 2006 on enhancing the DOTS programme indicated that particular attention should be given to the poorest and most vulnerable popu-lation groups [18].
Factors related to the health services were found to be important variables associated with defaulting from DOTS. Facility-related factors, namely unsuit-able clinic hours and long waiting times, were significantly associated with de-faulting. Similar results were reported in a study conducted in Brazil in 2004, which reported long waiting times for a medical consultation as an associated factor for defaulting from treatment [1].
Reasons cited for defaulting by our cases showed the importance of facility fac-tors such as unsuitable clinic times and long waiting times before examination. Problems with physician–patient com-munication were also found to have a negative impact on continuation of TB treatment. Out of 6 factors related to physician–patient communication, 3 communication factors were found to be statistically significant: physicians not listening to complaints, physicians not explaining TB complications and physicians not explaining treatment side-effects. Patients reporting poor physician communications were 3 times more likely to default from TB treatment (adjusted OR = 3.06). Patients typically default when they experience improve-ment of symptoms with treatment, while unawareness of the side-effects of medication can be misinterpreted by patients as drawbacks of treatment. The relationship between medication side-effects and treatment defaulting has been frequently demonstrated in other studies [3,10,19–21]. It has been recommended that health care staff in TB programmes should direct health education towards expected side-effects of treatment. Nurses should teach pa-tients to recognize and manage severe
Table 3 Univariate analysis of patient perception factors associated with defaulting from tuberculosis treatment
Patient perceptions Defaulters(n = 57)
Non-defaulters(n = 187)
P-value OR (95% CI)
No. % No. %
Felt better with treatment
Yesa 41 71.9 173 92.5
No 16 28.1 14 7.5 < 0.001 4.82 (2.18–10.7)
Treatment cured TB completely
Yesa 48 84.2 184 98.4
No 9 15.8 3 1.6 < 0.001 11.5 (2.99–44.1)
Feel shame about TB
Yesa 43 75.4 108 57.8
No 14 24.6 79 42.2 0.02 0.45 (0.23–0.87)
Fear of information leakage
Yesa 35 61.4 72 48.5
No 22 38.6 115 61.5 0.002 0.39 (0.21–0.72)aReference category. OR = odds ratio; CI = confidence interval.
Book 19-2.indb 111 2/21/2013 11:39:17 AM
EMHJ • Vol. 19 No. 2 • 2013 Eastern Mediterranean Health JournalLa Revue de Santé de la Méditerranée orientale
112
medication side-effects and request patients to schedule an extra clinic visit if they experience side-effects in order to reduce treatment defaulting [10].
Several patient perception factors were investigated in the present study, many of which were significant in uni-variate analysis. Although multivariate analysis revealed only 1 factor related to patient perceptions, it is important to discuss these factors as they are ame-nable to improvement at a lower cost to the community. Lack of improvement with treatment and patients’ perception that treatment cannot cure TB com-pletely were significantly associated
with defaulting. These findings are in agreement with a study conducted in Russia in 2008, which indicated that non-adherent patients did not believe that they will fully recover and thus did not want to continue treatment [17]. An association between patients’ knowl-edge about the duration of treatment and treatment adherence has also been shown in other studies [3,17,20,22–24]. The present study showed that most of the defaulters were ashamed of their disease and concerned about leakage of information. Stigmatization of TB leads to a situation where many patients are not treated well by members of the
Table 4 Multivariate logistic regression analysis of factors associated with defaulting from tuberculosis treatment
Factors Adjusted OR (95% CI) P-value
Age (years)
< 30a
30– 0.71 (0.24–2.11) 0.53
40– 0.57 (0.20–1.66) 0.30
50 + 0.16 (0.03–0.46) 0.002
Area of residence
Urbana
Squatter 2.74 (1.12–6.73) 0.027
Rural 12.9 (2.53–65.7) 0.002
Long waiting times 5.81 (1.80–18.8) 0.003
Poor physician–patient communication 3.06 (1.02–9.46) 0.049
Fear of information leakage 3.62 (1.54–8.53) 0.003
aReference category. OR = odds ratio; CI = confidence interval.
community. The stigma associated with TB has been shown to have a significant effect on defaulting from treatment [17,25]. TB treatment polices must address confidentiality of information about patients’ private data. Patients should be assured about the confidenti-ality of their information to ensure their compliance with attendance.
There are a number of limitations in the present study that affect the general-izability of the results. The small number of cases increased the value of each case and may have exaggerated some factors. Moreover, the study was conducted only in chest dispensaries of Alexan-dria governorate. Despite similarities between TB patients living in different governorates all over Egypt, we cannot generalize the results to the whole popu-lation of Egyptian TB patients.
In conclusion, the main factors associated with defaulting from the national programme of TB control in Alexandria, Egypt, were service-related factors, which are amenable to improvement. Expanding treatment outlets in rural settings, involving providers who practice close to where patients live, offering psychologi-cal support and health education programmes especially for younger patients, reduction of patient waiting times and improvement of patient–physician communication are recom-mended improvement strategies.
References
1. Salles CL et al. Defaulting from anti-tuberculosis treatment in a teaching hospital in Rio de Janeiro, Brazil. International Journal of Tuberculosis and Lung Disease, 2004, 8:318–322.
2. Holtz TH et al. Risk factors associated with default from multidrug-resistant tuberculosis treatment, South Africa, 1999–2001. Interna-tional Journal of Tuberculosis and Lung Disease, 2006, 10:649–655.
3. Tekb B, Mariam DH, Ali A. Defaulting from DOTS and its deter-minants in three districts of Arsi zone in Ethiopia. International Journal Tubercle and Lung Disease, 2002, 6(7):673–679.
4. Global tuberculosis control: epidemiology, strategy, financing. Geneva, World Health Organization, 2009.
5. National program of TB control. Social worker index, 2nd ed. Cairo, Ministry of Health and Population, 2004.
6. Borgdorff MW, Floyd K, Broekmans JF. Interventions to reduce tuberculosis mortality and transmission in low- and middle-income countries. Bulletin of the World Health Organization, 2002, 80:217–227.
7. Treatment of tuberculosis: guidelines for national programmes, 3rd ed. Geneva, World Health Organization, 2003.
8. Tuberculosis services in partnership. The case of Egypt. Cairo, Na-tional Tuberculosis Control Programme Egypt/World Health Organization, Eastern Mediterranean Region/Royal Tropical Institute, 2004 (WHO-EM/TUB/243/E).
9. Tuberculosis profile—Egypt. World Health Organization [on-line database] (http://www.who.int/tb/country/data/pro-files/en/index.html, accessed 24 December 2012).
Book 19-2.indb 112 2/21/2013 11:39:17 AM
املجلد التاسع عرشاملجلة الصحية لرشق املتوسطالعدد الثاين
113
10. Jittimanee SX et al. Treatment default among urban tuberculo-sis patients, Thailand. International Journal of Nursing Practice, 2007, 13:354–362.
11. Jakubowiak WM et al. Impact of socio-psychological factors on treatment adherence of TB patients in Russia. Tuberculosis, 2008, 88:495–502.
12. Mishra P et al. Adherence is associated with the quality of professional-patient interaction in Directly Observed Treat-ment Short-course, DOTS. Patient Education and Counseling, 2006, 63:29–37.
13. Dimitrova B et al. Health service providers’ perceptions of bar-riers to tuberculosis care in Russia. Health Policy and Planning, 2006, 21:265–274.
14. Janakan N, Seneviratne R. Factors contributing to medication noncompliance of newly diagnosed smear-positive pulmo-nary tuberculosis patients in the district of Colombo, Sri Lanka. Asia-Pacific Journal of Public Health, 2008, 20:214–223.
15. Fleiss JL et al. Statistical methods for rates and proportions, 3rd ed. London, Wiley-Interscience, 2003.
16. Lwanga SK, Lemeshow S. Sample size determination in health studies: a practical manual. Geneva, World Health Organiza-tion, 1991.
17. Jakubowiak WM et al. Risk factors associated with default among new pulmonary TB patients and social support in six Russian regions. International Journal of Tuberculosis and Lung Disease, 2007, 11:46–53.
18. The Stop TB strategy. Building on and enhancing DOTS to meet the TB-related Millennium Development Goals. Geneva, World Health Organization, 2006.
19. Quy HT et al. Treatment results among tuberculosis patients treated by private lung specialists involved in a public–private mix project in Vietnam. International Journal of Tuberculosis and Lung Disease, 2003, 7:1139–1146.
20. Okanurak K, Kitayaporn D, Akarasewi P. Factors contributing to treatment success among tuberculosis patients: a prospective cohort study in Bangkok. International Journal of Tuberculosis and Lung Disease, 2008, 12:1160–1165.
21. Gupta S, Gupta S, Behera D. Reasons for interruption of anti-tubercular treatment as reported by patients with tuberculosis admitted in a tertiary care institute. Indian Journal of Tuberculo-sis, 2011, 58:11–17.
22. Comolet TM, Rakotomalala R, Rajaonarioa H. Factors deter-mining compliance with tuberculosis treatment in an urban environment, Tamatave, Madagascar. International Journal of Tuberculosis and Lung Disease, 1998, 2:891–897.
23. Liam CK et al. Attitudes and knowledge of newly diagnosed tu-berculosis patients regarding the disease, and factors affecting treatment compliance. International Journal of Tuberculosis and Lung Disease, 1999, 3:300–309.
24. Hasker E et al. Why do tuberculosis patients default in Tashkent City, Uzbekistan? A qualitative study. International Journal of Tuberculosis and Lung Disease, 2010, 14:1132–1139.
25. Dodor EA, Afenyadu GY. Factors associated with tuberculosis treatment default and completion at the Effia-Nkwanta Region-al Hospital in Ghana. Transactions of the Royal Society of Tropical Medicine and Hygiene, 2005, 99:827–832.
Book 19-2.indb 113 2/21/2013 11:39:17 AM
EMHJ • Vol. 19 No. 2 • 2013 Eastern Mediterranean Health JournalLa Revue de Santé de la Méditerranée orientale
114
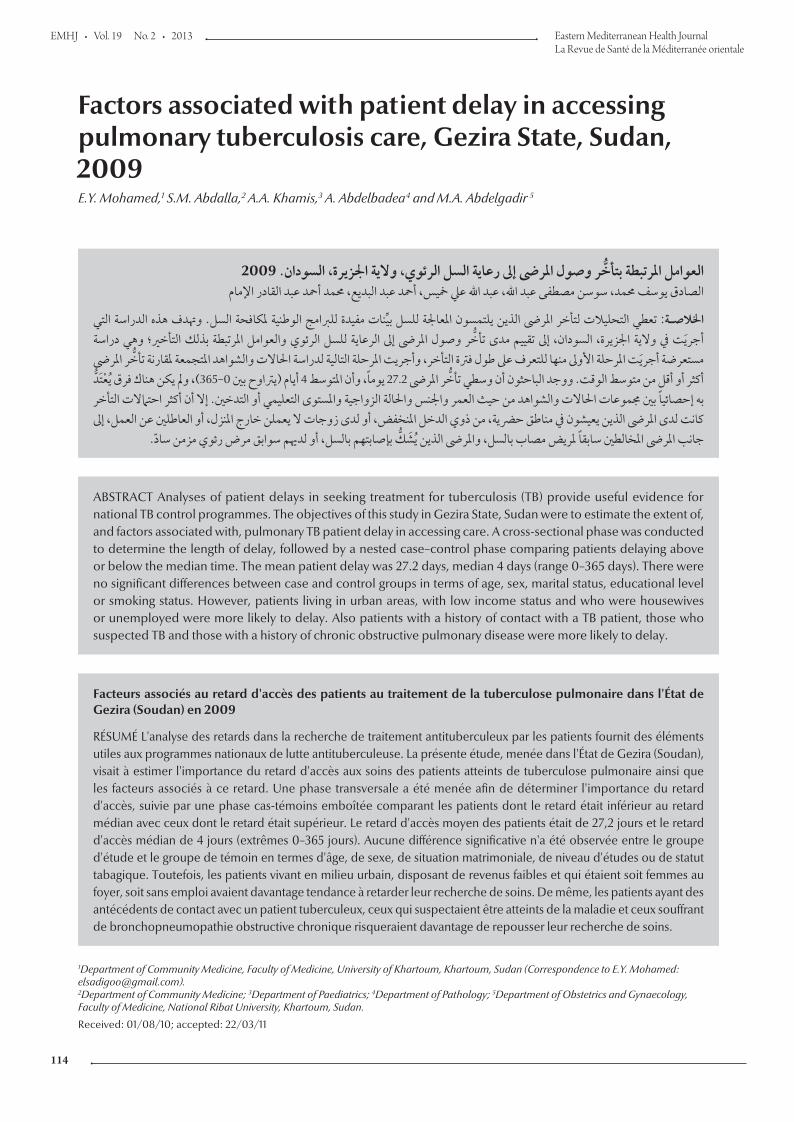
Factors associated with patient delay in accessing pulmonary tuberculosis care, Gezira State, Sudan, 2009E.Y. Mohamed,1 S.M. Abdalla,2 A.A. Khamis,3 A. Abdelbadea 4 and M.A. Abdelgadir 5
ABSTRACT Analyses of patient delays in seeking treatment for tuberculosis (TB) provide useful evidence for national TB control programmes. The objectives of this study in Gezira State, Sudan were to estimate the extent of, and factors associated with, pulmonary TB patient delay in accessing care. A cross-sectional phase was conducted to determine the length of delay, followed by a nested case–control phase comparing patients delaying above or below the median time. The mean patient delay was 27.2 days, median 4 days (range 0–365 days). There were no significant differences between case and control groups in terms of age, sex, marital status, educational level or smoking status. However, patients living in urban areas, with low income status and who were housewives or unemployed were more likely to delay. Also patients with a history of contact with a TB patient, those who suspected TB and those with a history of chronic obstructive pulmonary disease were more likely to delay.
1Department of Community Medicine, Faculty of Medicine, University of Khartoum, Khartoum, Sudan (Correspondence to E.Y. Mohamed: [email protected]).2Department of Community Medicine; 3Department of Paediatrics; 4Department of Pathology; 5Department of Obstetrics and Gynaecology, Faculty of Medicine, National Ribat University, Khartoum, Sudan.
Received: 01/08/10; accepted: 22/03/11
ر وصول املرىض إىل رعاية السل الرئوي، والية اجلزيرة، السودان. 2009 العوامل املرتبطة بتأخالصادق يوسف حممد، سوسن مصطفى عبد اهلل، عبد اهلل عيل مخيس، أمحد عبد البديع، حممد أمحد عبد القادر اإلمام
التي الدراسة السل. وهتدف هذه الوطنية ملكافحة للربامج بينات مفيدة للسل املعاجلة يلتمسون الذين املرىض لتأخر التحليالت اخلالصـة: تعطي دراسة وهي التأخري؛ بذلك املرتبطة والعوامل الرئوي للسل الرعاية إىل املرىض وصول ر تأخ مدى تقييم إىل السودان، اجلزيرة، والية يف أجريت ر املرىض مستعرضة أجريت املرحلة األوىل منها للتعرف عىل طول فرتة التأخر، وأجريت املرحلة التالية لدراسة احلاالت والشواهد املتجمعة ملقارنة تأخر املرىض 27.2 يوما، وأن املتوسط 4 أيام )يرتاوح بني 0–365(، ومل يكن هناك فرق يعتد أكثر أو أقل من متوسط الوقت. ووجد الباحثون أن وسطي تأخبه إحصائيا بني جمموعات احلاالت والشواهد من حيث العمر واجلنس واحلالة الزواجية واملستوى التعليمي أو التدخني. إال أن أكثر احتامالت التأخر كانت لدى املرىض الذين يعيشون يف مناطق حرضية، من ذوي الدخل املنخفض، أو لدى زوجات ال يعملن خارج املنزل، أو العاطلني عن العمل، إىل
جانب املرىض املخالطني سابقا ملريض مصاب بالسل، واملرىض الذين يشك بإصابتهم بالسل، أو لدهيم سوابق مرض رئوي مزمن ساد.
Facteurs associés au retard d'accès des patients au traitement de la tuberculose pulmonaire dans l'État de Gezira (Soudan) en 2009
RÉSUMÉ L'analyse des retards dans la recherche de traitement antituberculeux par les patients fournit des éléments utiles aux programmes nationaux de lutte antituberculeuse. La présente étude, menée dans l'État de Gezira (Soudan), visait à estimer l'importance du retard d'accès aux soins des patients atteints de tuberculose pulmonaire ainsi que les facteurs associés à ce retard. Une phase transversale a été menée afin de déterminer l'importance du retard d'accès, suivie par une phase cas-témoins emboîtée comparant les patients dont le retard était inférieur au retard médian avec ceux dont le retard était supérieur. Le retard d'accès moyen des patients était de 27,2 jours et le retard d'accès médian de 4 jours (extrêmes 0–365 jours). Aucune différence significative n'a été observée entre le groupe d'étude et le groupe de témoin en termes d'âge, de sexe, de situation matrimoniale, de niveau d'études ou de statut tabagique. Toutefois, les patients vivant en milieu urbain, disposant de revenus faibles et qui étaient soit femmes au foyer, soit sans emploi avaient davantage tendance à retarder leur recherche de soins. De même, les patients ayant des antécédents de contact avec un patient tuberculeux, ceux qui suspectaient être atteints de la maladie et ceux souffrant de bronchopneumopathie obstructive chronique risqueraient davantage de repousser leur recherche de soins.
Book 19-2.indb 114 2/21/2013 11:39:18 AM
املجلد التاسع عرشاملجلة الصحية لرشق املتوسطالعدد الثاين
115
Introduction
Tuberculosis (TB) is still a major cause of death in both developed and devel-oping countries [1]. In 2005, 12 million new cases of TB were identified, an almost 60% increase from the estimated number of cases in 1990 [2]. An effec-tive TB control programme requires early diagnosis and immediate initiation of treatment. Delay in diagnosis is seri-ous because it not only adversely affects disease prognosis at the individual level but also promotes transmission within the community and enhances TB epi-demics [3,4].
Delays in diagnosis and treatment of TB may reflect patient delays in seeking care, health care provider delays in mak-ing diagnosis and starting treatment, or both [5–11]. A delay in initiating TB care is not always the responsibil-ity of the patient; sometimes patients contact the health services early but the physician in charge does not sus-pect TB [12]. It has been found that patients become more contagious as the delay progresses. The longest delays are associated with the highest numbers of Mycobacterium tuberculosis bacilli on sputum smears. Diagnostic delay may result in more advanced and severe disease, higher mortality and sustained spread of M. tuberculosis in the com-munity as untreated people continue to transmit the infection to others [13,14]. The importance of delay is reflected in increasing costs and mortality due to TB. The many factors causing delay in diagnosis and treatment must be clearly identified and addressed locally in order to improve the quality and effectiveness of national TB control programmes (NTP). Studies analysing delays and their determinants provide useful evidence for assessment of case-finding success under DOTS.
The objectives of this study in Sudan were to estimate the extent of pulmo-nary TB patient delay in accessing care in Gezira State and to determine some of the factors associated with delays.
Methods
Study areaGezira State, located in the centre of Sudan, is one of the high TB burden states in the country. The TB case detec-tion rate was 37.9% in 2010 [15], which is far below the target of 70%, developed by the Stop TB partnership and the World Health Assembly, and within the Millennium Development Goal frame-work [16]. TB care is provided through 41 TB management units (TBMUs) distributed throughout the State [17].
Study designThis was a cross-sectional and case–control study to explore patient delay in diagnosis and treatment of TB. A cross-sectional phase was conducted to determine the extent of delay, and then a nested case–control phase was carried out comparing patients delaying above and below the median time.
Study population and samplingThe study population was newly diag-nosed (within 2 weeks) smear-positive pulmonary TB cases aged 15 years and older who attended the selected TB-MUs during the study periods.
The sampling type was simple random. All the 41 TBMUs in the 5 localities were considered and 10 of them were selected randomly (i.e. 2 out of every 8 on average). Based on the estimated incidence of TB with a maxi-mum allowed error of 10% and a 95% confidence interval (CI) the sample size was calculated as 282 and rounded up to 292 [18]. The sample was divided across the 5 localities according to population size by dividing the locality population over the total population of the state multiplied by the sample size. Within the TBMU, respondents were selected conveniently until the required sample was completed. The response rate was 100%.
The cut-off point for long delays was defined according to the median
delay of the sample. Patients with delays greater than the median were catego-rized as cases, while those with delays less than or equal to the median were considered as controls.
Data collection techniques and toolsData was collected during June and December 2009 by health workers who underwent intense training on interviewing and probing techniques. Patients were interviewed using a pre-coded, pre-tested questionnaire. The questionnaire included information about patients’ sociodemographic characteristics and selected factors that might affect delay in receiving TB care. The laboratory register was examined to confirm data regarding the time of diagnosis. The time taken to initiate treatment was calculated after the treat-ment was started.
A written consent was taken from the respondents. Ethical clearance was obtained from the Ministry of Health. Objectives, steps and expected outcomes of the research were explained to the participants as well as their right to with-draw from the study at any time without any consequences for their current care. Confidentiality of the data obtained were maintained before and during the study and will continue in the future.
Data management and analysisData analysis was performed using SPSS for Windows, version 13. Descriptive statistics were used, such as frequency, mean and standard deviation (SD), median, minimum and maximum. Comparisons between groups were made using the chi-squared test. P value < 0.05 was considered significant and all tests were 2-sided.
Results
The mean duration of patients’ delay was 27.2 (95% CI: 21.0–33.2) days. The median delay was 4 days (range
Book 19-2.indb 115 2/21/2013 11:39:18 AM
EMHJ • Vol. 19 No. 2 • 2013 Eastern Mediterranean Health JournalLa Revue de Santé de la Méditerranée orientale
116
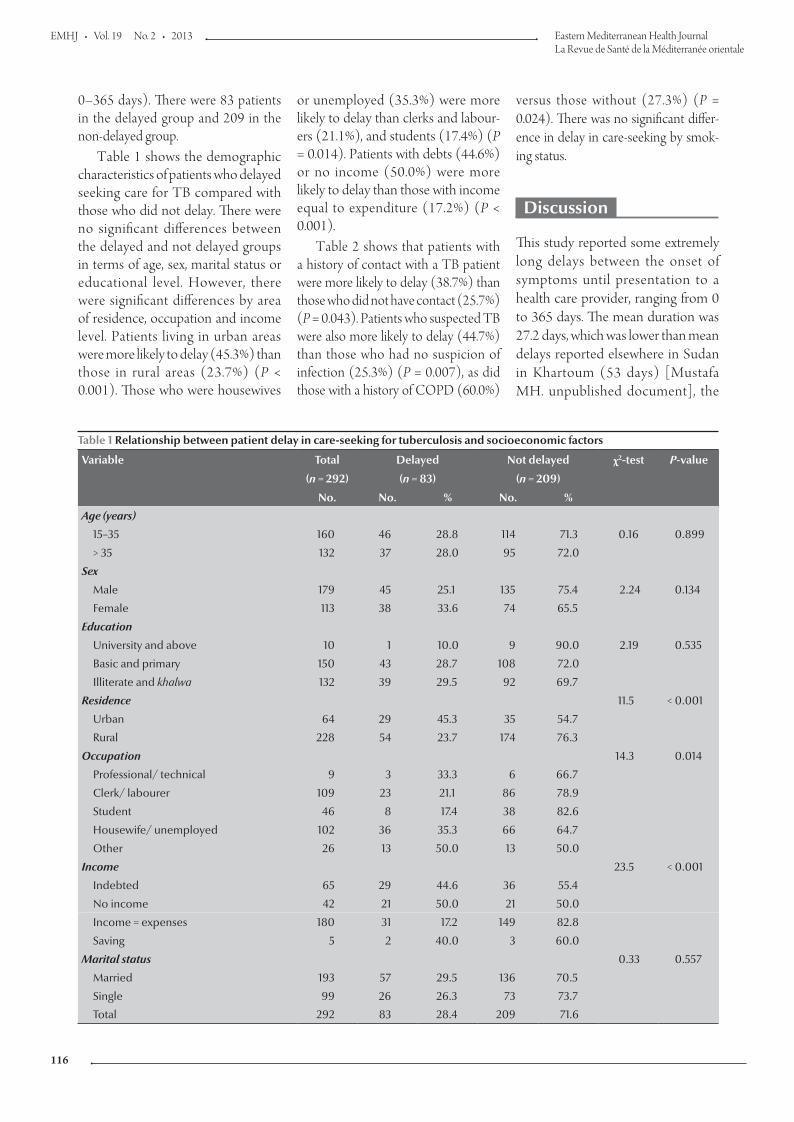
or unemployed (35.3%) were more likely to delay than clerks and labour-ers (21.1%), and students (17.4%) (P = 0.014). Patients with debts (44.6%) or no income (50.0%) were more likely to delay than those with income equal to expenditure (17.2%) (P < 0.001).
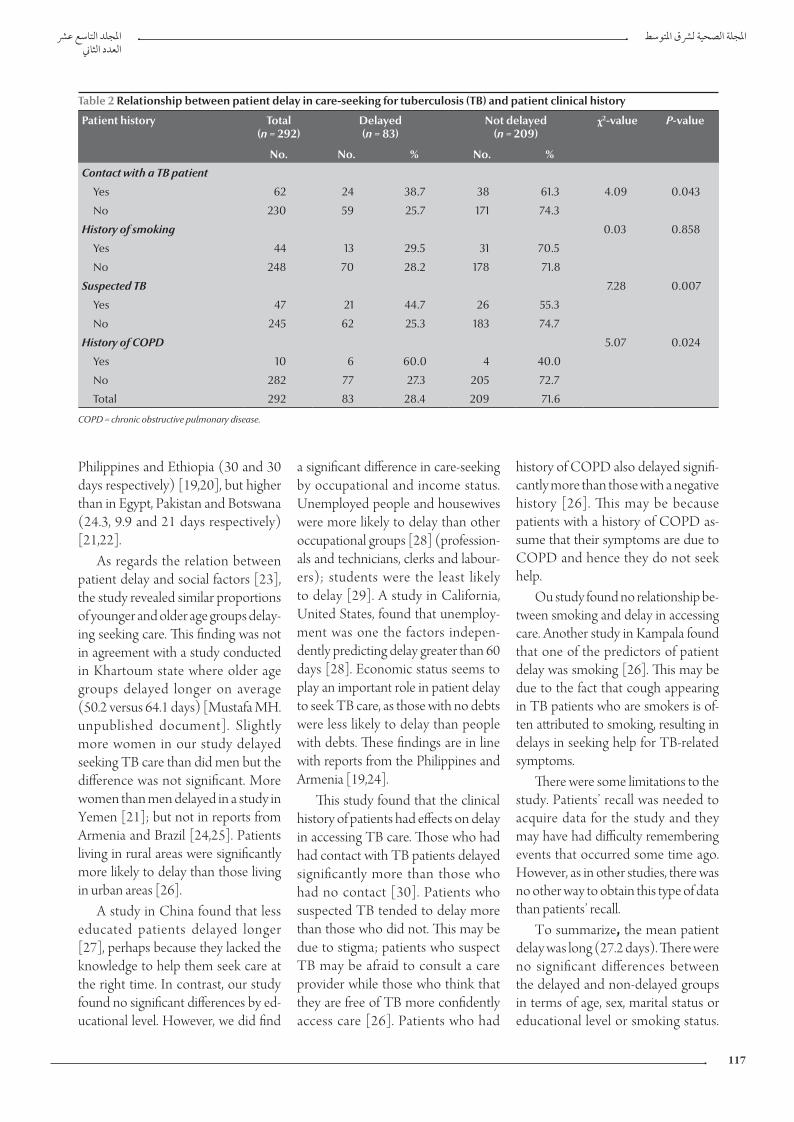
Table 2 shows that patients with a history of contact with a TB patient were more likely to delay (38.7%) than those who did not have contact (25.7%) (P = 0.043). Patients who suspected TB were also more likely to delay (44.7%) than those who had no suspicion of infection (25.3%) (P = 0.007), as did those with a history of COPD (60.0%)
versus those without (27.3%) (P = 0.024). There was no significant differ-ence in delay in care-seeking by smok-ing status.
Discussion
This study reported some extremely long delays between the onset of symptoms until presentation to a health care provider, ranging from 0 to 365 days. The mean duration was 27.2 days, which was lower than mean delays reported elsewhere in Sudan in Khartoum (53 days) [Mustafa MH. unpublished document], the
0–365 days). There were 83 patients in the delayed group and 209 in the non-delayed group.
Table 1 shows the demographic characteristics of patients who delayed seeking care for TB compared with those who did not delay. There were no significant differences between the delayed and not delayed groups in terms of age, sex, marital status or educational level. However, there were significant differences by area of residence, occupation and income level. Patients living in urban areas were more likely to delay (45.3%) than those in rural areas (23.7%) (P < 0.001). Those who were housewives
Table 1 Relationship between patient delay in care-seeking for tuberculosis and socioeconomic factors
Variable Total Delayed Not delayed χ2-test P-value
(n = 292) (n = 83) (n = 209)
No. No. % No. %
Age (years)
15–35 160 46 28.8 114 71.3 0.16 0.899
> 35 132 37 28.0 95 72.0
Sex
Male 179 45 25.1 135 75.4 2.24 0.134
Female 113 38 33.6 74 65.5
Education
University and above 10 1 10.0 9 90.0 2.19 0.535
Basic and primary 150 43 28.7 108 72.0
Illiterate and khalwa 132 39 29.5 92 69.7
Residence 11.5 < 0.001
Urban 64 29 45.3 35 54.7
Rural 228 54 23.7 174 76.3
Occupation 14.3 0.014
Professional/ technical 9 3 33.3 6 66.7
Clerk/ labourer 109 23 21.1 86 78.9
Student 46 8 17.4 38 82.6
Housewife/ unemployed 102 36 35.3 66 64.7
Other 26 13 50.0 13 50.0
Income 23.5 < 0.001
Indebted 65 29 44.6 36 55.4
No income 42 21 50.0 21 50.0
Income = expenses 180 31 17.2 149 82.8
Saving 5 2 40.0 3 60.0
Marital status 0.33 0.557
Married 193 57 29.5 136 70.5
Single 99 26 26.3 73 73.7
Total 292 83 28.4 209 71.6
Book 19-2.indb 116 2/21/2013 11:39:18 AM
املجلد التاسع عرشاملجلة الصحية لرشق املتوسطالعدد الثاين
117
Philippines and Ethiopia (30 and 30 days respectively) [19,20], but higher than in Egypt, Pakistan and Botswana (24.3, 9.9 and 21 days respectively) [21,22].
As regards the relation between patient delay and social factors [23], the study revealed similar proportions of younger and older age groups delay-ing seeking care. This finding was not in agreement with a study conducted in Khartoum state where older age groups delayed longer on average (50.2 versus 64.1 days) [Mustafa MH. unpublished document]. Slightly more women in our study delayed seeking TB care than did men but the difference was not significant. More women than men delayed in a study in Yemen [21]; but not in reports from Armenia and Brazil [24,25]. Patients living in rural areas were significantly more likely to delay than those living in urban areas [26].
A study in China found that less educated patients delayed longer [27], perhaps because they lacked the knowledge to help them seek care at the right time. In contrast, our study found no significant differences by ed-ucational level. However, we did find
a significant difference in care-seeking by occupational and income status. Unemployed people and housewives were more likely to delay than other occupational groups [28] (profession-als and technicians, clerks and labour-ers); students were the least likely to delay [29]. A study in California, United States, found that unemploy-ment was one the factors indepen-dently predicting delay greater than 60 days [28]. Economic status seems to play an important role in patient delay to seek TB care, as those with no debts were less likely to delay than people with debts. These findings are in line with reports from the Philippines and Armenia [19,24].
This study found that the clinical history of patients had effects on delay in accessing TB care. Those who had had contact with TB patients delayed significantly more than those who had no contact [30]. Patients who suspected TB tended to delay more than those who did not. This may be due to stigma; patients who suspect TB may be afraid to consult a care provider while those who think that they are free of TB more confidently access care [26]. Patients who had
history of COPD also delayed signifi-cantly more than those with a negative history [26]. This may be because patients with a history of COPD as-sume that their symptoms are due to COPD and hence they do not seek help.
Ou study found no relationship be-tween smoking and delay in accessing care. Another study in Kampala found that one of the predictors of patient delay was smoking [26]. This may be due to the fact that cough appearing in TB patients who are smokers is of-ten attributed to smoking, resulting in delays in seeking help for TB-related symptoms.
There were some limitations to the study. Patients’ recall was needed to acquire data for the study and they may have had difficulty remembering events that occurred some time ago. However, as in other studies, there was no other way to obtain this type of data than patients’ recall.
To summarize, the mean patient delay was long (27.2 days). There were no significant differences between the delayed and non-delayed groups in terms of age, sex, marital status or educational level or smoking status.
Table 2 Relationship between patient delay in care-seeking for tuberculosis (TB) and patient clinical history
Patient history Total(n = 292)
Delayed(n = 83)
Not delayed(n = 209)
χ2-value P-value
No. No. % No. %
Contact with a TB patient
Yes 62 24 38.7 38 61.3 4.09 0.043
No 230 59 25.7 171 74.3
History of smoking 0.03 0.858
Yes 44 13 29.5 31 70.5
No 248 70 28.2 178 71.8
Suspected TB 7.28 0.007
Yes 47 21 44.7 26 55.3
No 245 62 25.3 183 74.7
History of COPD 5.07 0.024
Yes 10 6 60.0 4 40.0
No 282 77 27.3 205 72.7
Total 292 83 28.4 209 71.6
COPD = chronic obstructive pulmonary disease.
Book 19-2.indb 117 2/21/2013 11:39:18 AM
EMHJ • Vol. 19 No. 2 • 2013 Eastern Mediterranean Health JournalLa Revue de Santé de la Méditerranée orientale
118
References
1. Dolin PJ, Raviglione MC, Kochi A. Global tuberculosis inci-dence and mortality during 1990–2000. Bulletin of the World Health Organization, 1994, 72:213–220.
2. Global tuberculosis control: surveillance, planning, financing. WHO report 2005. Geneva, World Health Organization, 2005 (WHO/HTM/TB/2005.349).
3. Dye C et al. Consensus statement. Global burden of tubercu-losis: estimated incidence, prevalence and mortality by coun-try. WHO Global Surveillance and Monitoring Project. Journal of the American Medical Association, 1999, 282:677–686.
4. Bjune G. Tuberculosis in the 21st century: an emerging pan-demic? Norsk Epidemiologi, 2005, 15:133–139.
5. Sherman LF et al. Patient and health care system delays in the diagnosis and treatment of tuberculosis. International Journal of Tuberculosis and Lung Disease, 1999, 3:1088–1095.
6. Wandwalo ER, Morkve O. Delay in tuberculosis case-finding and treatment in Mwanza, Tanzania. International Journal of Tuberculosis and Lung Disease, 2000, 4:133–138.
7. Demissie M, Lindtjorn B, Berhane Y. Patient and health care service delay in the diagnosis of pulmonary tuberculosis in Ethiopia. BMC Public Health, 2002, 25:23.
8. Golub JE et al. Delayed tuberculosis diagnosis and tuberculo-sis transmission. International Journal of Tuberculosis and Lung Disease, 2006, 10(1):24–23
9. Ohmori M et al. Trends of delays in tuberculosis case finding in Japan and associated factors. International Journal of Tuber-culosis and Lung Disease, 2005, 9:999–1005.
10. Xu B et al. Diagnostic delays in access to tuberculosis care in counties with or without the National Tuberculosis Control Program in rural China. International Journal of Tuberculosis and Lung Disease, 2005, 9:784–790.
11. Rojpibulstit M, Kanjanakiritamrong J, Chongsuvivatwong V. Patient and health system delays in the diagnosis of tuberculo-sis in Southern Thailand after health care reform. International Journal of Tuberculosis and Lung Disease, 2006, 10:422–428.
12. Yimer S, Bjune G, Alene G. Diagnostic and treatment delay among pulmonary tuberculosis patients in Ethiopia: a cross-sectional study. BMC Infectious Diseases, 2005, 5:112.
13. Toman K. Tuberculosis case finding and chemotherapy questions and answers. Geneva, World Health Organization, 1979.
14. Styblo K. Epidemiology of tuberculosis. Selected papers. Volume 24. The Hague, KNCV Tuberculosis Foundation, 1991.
15. National tuberculosis control programme Sudan. Progress report. January–December 2010. Khartoum, Federal Ministry of Health, 2010:35.
16. Global tuberculosis control strategy 2009: epidemiology, strat-egy, financing. Geneva, World Health Organization, 2009.
17. TB control program. Annual report 2006. Khartoum, Federal Ministry of Health, 2006.
18. Fleiss JL. Statistical methods for rates and proportions. New York, John Wiley and Sons, 1981.
19. Auer C et al. Health seeking and perceived causes of tubercu-losis among patients in Manila, Philippines. Tropical Medicine and International Health, 2000, 5:648–656.
20. Yimer S, Bjune G, Alene G. Diagnostic and treatment delay among pulmonary tuberculosis patients in Ethiopia: a cross-sectional study. BMC Infectious Diseases, 2005, 5:112.
21. Diagnostic and treatment delay in tuberculosis: An in depth analysis of the health seeking behaviour of patients and health system response in seven countries of the East Mediterra-nean Region. Cairo, World Health Organization Regional Office for the Eastern Mediterranean, 2006 (WHO-EM/TDR/009/E).
22. Steen TW, Mazonde GW. Pulmonary tuberculosis in Kwen-ing district Botswana: delay in diagnosis in 212 smear positive patients. International Journal of Tuberculosis and Lung Disease, 1998, 2:627–634.
23. Schneider D et al. Reasons for delay in seeking care for tuber-culosis, Republic of Armenia. Interdisciplinary Perspectives on Infectious Diseases, 2010:41262.
24. Schneider D et al. Reasons for delay in seeking care for tuber-culosis, Republic of Armenia, 2006–2007. Interdisciplinary Perspectives on Infectious Diseases, 2010:412624.
25. Dos Santos MAPS et al. Risk factors for treatment delay in pulmonary tuberculosis in Recife, Brazil. BMC Public Health, 2005, 5:25.
26. Kiwuwa MS, Charles K, Harriet MK. Patient and health service delay in pulmonary tuberculosis patients attending a referral hospital: a cross-sectional study. BMC Public Health 2005, 5:122.
27. Xu B et al. Diagnostic delays in access to tuberculosis care in counties with or without the National Tuberculosis Control Program in rural China. International Journal of Tuberculosis and Lung Disease, 2005, 9:784–790.
28. Asch S et al. Why do symptomatic patients delay obtaining care for tuberculosis? American Journal of Respiratory and Criti-cal Care Medicine, 1998, 157:1244–1248.
29. Okeibunor JC et al. Where do tuberculosis patients go for treatment before reporting to DOTS clinics in southern Nige-ria? Tanzania Health Research Bulletin, 2007, 9(2):94–101.
30. Salaniponi FM, Harries AD, Banda HJ. Care seeking behavior and diagnostic processes in patients with smear positive pul-monary tuberculosis in Malawi. International Journal of Tuber-culosis and Lung Disease, 1991, 4:327–332.
However, there were significant differ-ences by area of residence, occupation, income level, history of contact with a TB patient, history of COPD and hav-ing suspicion of pulmonary TB.
Acknowledgements
We would like to acknowledge the National Tuberculosis Control Pro-gram for offering us the chance to
conduct this work. We would also like to extend our thanks to Gezira Tuberculosis Control Programme and the staff at the localities who col-lected the data.
Book 19-2.indb 118 2/21/2013 11:39:18 AM
املجلد التاسع عرشاملجلة الصحية لرشق املتوسطالعدد الثاين
119
Mycobacterium tuberculosis spoligotypes circulating in the Lebanese population: a retrospective studyN. Bedrossian,1 M. Hamze,1,2 A.K. Rahmo,3 A. Jurjus,4 J. Saliba,4 F. Dabboussi 1,2 and W. Karam 5
ABSTRACT Genotyping Mycobacterium tuberculosis in Lebanon on the national level may be beneficial for assessing patients and monitoring the therapeutic response to DOTS. This study aimed to characterize the spoligotypes of clinical isolates of M. tuberculosis patients collected between April 2004 and October 2005 from all Lebanese provinces. Isolates (n = 60) were cultured and identified by their biochemical characteristics. DNA extracts of these samples were amplified by PCR and genotyped by spoligotyping. Thirteen (13) patterns of M. tuberculosis complex family strains were identified: 41.6% of the strains belonged to the T 1 family, 25.0% to LAM 9, 10.0% to Haarlem 3, 3.3% to each of CAS, LAM 8, BCG and Family 36 and 1.7% to each of Haarlem 1, LAM 10, S, M. africanum, X 1 and T 3 families. The noticeable absence of Beijing and East African Indian families was not consistent with the patterns reported in neighbouring countries. A more inclusive study of the Lebanese population is necessary to accurately identify most of the prevailing families in the country.
1Faculty of Medicine; 5Department of Biology, Lebanese University, Hadath Campus, Hadath, Lebanon (Correspondence to M. Hamze: [email protected]). 2AZM Center for Biotechnology, Lebanese University, Tripoli, Lebanon. 3National Commission of Biotechnology, Damascus, Syrian Arab Republic. 4Department of Human Morphology, American University of Beirut, Beirut, Lebanon.
Received: 12/08/11; accepted: 05/02/12
أنامط عديدات النكليوتيد البينية للمتفطرات السلية التي ترسي بني السكان اللبنانيني: دراسة استعاديةنوره بدروسيان، منذر محزة، عبد القادر رمحو، عبده جرجس، جيسيكا صليبا، فؤاد دبويس، وليد كرم
اخلالصـة: قد يعود التنميط اجليني للمتفطرات السلية بالفوائد عىل املستوى الوطني يف لبنان من أجل رصد االستجابة العالجية للمعاجلة القصرية األمد حتت اإلرشاف املبارش )دوتس(. وهتدف هذه الدراسة إىل حتديد خصائص املستفردات الرسيرية من أنامط عديدات النكليوتيد البينية للمتفطرات السلية التي مجعت من املرىض يف الفرتة من نيسان/أبريل 2004 وترشين األول/أكتوبر 2005 من مجيع املناطق اللبنانية. وبلغ عدد املستفردات 60، ف عىل خصائصها الكيميائية احليوية، وتضخيم املستخلصات من الدنا بالتفاعل السلسيل للبوليمراز، وحتديد أنامطها اجلينية من وزرعت وتم التعر41.6% منها 13 نمطا من الذراري املعقدة لفصائل املتفطرات السلية: ف عىل خالل التنميط التفصييل ألنامط عديدات النكليوتيد البينية. وتم التعر ،CAS و10% منها تنتمي إىل فصيلة هارمل 3، و3.3% منها تنتمي إىل كل من الفصائل ،LAM9 و25% تنتمي إىل فصيلة ،T1 من ذراري تنتمي إىل فصيلةو LAM و BCG، والفصيلة 36، يف حني كانت 1.7% منها تنتمي إىل كل من الفصائل هارمل 1، و LAM 10، و S، واملتفطرات األفريقية، و X1، و T3. ومل يكن الغياب امللحوظ لفصائل بيجني واهلندية الرشق أفريقية متامشيا مع النامذج املسجلة يف البلدان املجاورة؛ مما يدل عىل رضورة القيام بدراسة أكثر
ف بدقة عىل الفصائل األكثر انتشارا يف لبنان. إحاطة وشموال للسكان اللبنانيني من أجل التعر
Spoligotypes de Mycobacterium tuberculosis circulant dans la population libanaise : une étude rétrospective
RÉSUMÉ Le génotypage de Mycobacterium tuberculosis au Liban au niveau national peut être utile pour dépister les patients et surveiller la réponse au traitement de brève durée sous surveillance directe ou DOTS. L'objectif de l'étude visait à caractériser les spoligotypes des isolats cliniques de M. tuberculosis prélevés entre avril 2004 et octobre 2005 chez des patients de toutes les provinces libanaises. Les isolats (n = 60) ont été mis en culture puis identifiés en fonction de leurs caractéristiques biochimiques. Les extraits d'ADN de ces échantillons ont été amplifiés par PCR puis génotypés par spoligotypage. Treize (13) souches différentes de la famille du complexe M. tuberculosis ont été identifiées : 41,6 % des souches appartenaient à la famille T 1 ; 25,0 % à la famille LAM 9 ; 10,0 % à la famille Haarlem 3 ; 3,3 % chacune aux familles CAS, LAM 8, BCG et à la famille 36 et 1,7 % chacune aux familles Haarlem 1, LAM 10, S, M. africanum, X 1 et T 3. L'absence remarquable des familles Beijing, indiennes et d'Afrique de l'Est ne coïncidait pas avec les tendances rapportées dans les pays voisins. Une étude plus globale de la population libanaise est nécessaire pour identifier avec précision la plupart des familles dominantes dans notre pays.
Book 19-2.indb 119 2/21/2013 11:39:18 AM
EMHJ • Vol. 19 No. 2 • 2013 Eastern Mediterranean Health JournalLa Revue de Santé de la Méditerranée orientale
120
Introduction
After HIV/AIDS, tuberculosis (TB) is the second most common cause of death due to an infectious disease, and current trends suggest that TB will still be among the 10 leading causes of global disease burden in the year 2020 [1].
Molecular tools have enhanced our understanding of the epidemiology of TB by providing new insight into the transmission, dynamics, source and spread of Mycobacterium tuberculosis clones [2,3], which are often difficult to identify by traditional epidemiological investigations alone [4]. International databases, such as the World Spo-ligotyping Database, SpolDB3.0, have revealed the clonal structure of M. tu-berculosis isolates in different geographi-cal settings. The SpolDB4.0 database further defines super-families specific to certain locations [5]. The abundance of polymorphism indicates that transposi-tion and homologous recombination are the major events contributing to the diversity of M. tuberculosis strains [6].
Due to the importance and gravity of this disease in Lebanon, the Ministry of Public Health set up the national TB programme in 1992, which started the DOTS implementation/expansion in 1998. DOTS refers to a broad TB control strategy outlined by the World Health Organization (WHO) which aims to halt the spread of the infection and of multidrug resistant TB strains [7]. The total number of cases in Leba-non fell from 993 in 1993 to 195 in 2005, with pulmonary TB representing 60% to 65% of all TB cases. At present, according to the WHO report, the in-cidence of TB per 100 000 people in Lebanon was reported as 14 in 2008, 15 in 2009 and 17 in 2010 (report released in 2011) [8].
Genotyping M. tuberculosis in Leba-non on the national level in parallel with the DOTS programme may prove beneficial for assessing patients and monitoring the therapeutic response
to DOTS. In a previous study, charac-terization of M. tuberculosis in Lebanese patients by double-repetitive-element polymerase chain reaction (DRE-PCR) indicated the presence of several geno-types with evidence of certain groups specific to geographic areas, implicat-ing separate evolution of M. tuberculosis strains [9]. This investigation reports on the first nationwide study to character-ize by spoligotyping clinical isolates of M. tuberculosis from different regions of Lebanon. It will further provide insight into the future dynamics of the disease in our country and even among neigh-bouring countries.
Methods
Sampling of patientsFollowing an agreement with the na-tional TB programme of the Lebanese Ministry of Health, we obtained sputum samples from newly detected pulmo-nary TB cases (60 samples). Samples were collected between April 2004 and October 2005 from all Lebanese provinces (muhafazat) and were stored in the laboratory of the hospital at the Middle East Health Centre in Bsalim/Metn in Lebanon. Relevant informa-tion (e.g. sex, age, location, new/old case) was also obtained for each of the samples; however no information about the HIV status was available.
As this was a retrospective study, and the samples tested consisted of stock bacterial cultures and did not directly involve any human subjects, ethical approval was not required.
Specimen preparation and cultureSpecimens were decontaminated by the 2% N-acetyl-L-cysteine NaOH method. After neutralization and cen-trifugation, 0.2 mL of the concentrated specimen was inoculated onto one slant of Lowenstein-Jensen (LJ) medium (Becton Dickinson), 0.5 mL was also inoculated into modified Middlebrook
7H9 broth (BD BBL MGIT, Becton Dickinson) supplemented with PANTA (BBL MGIT PANTA, Becton Dickinson) and oleic acid, albumin, dextrose, and catalase (OADC) en-richment. The 2 media were incubated at 35–37 ºC, the LJ slant was exam-ined for growth twice weekly. The BD BBL MGIT tube was read daily with ultraviolet light starting on the 2nd day of incubation using a positive control and a negative control. Fluorescence is detected as a bright orange colour in the bottom of the tube and also as an orange reflection on the meniscus. A positive tube was subcultured and an acid-fast smear prepared. A positive acid-fast smear result indicated the presumptive presence of viable microorganisms in the tube.
Identification of strainsIdentity of strains was based on the following biochemical characteristics: production of niacin, nitrate reductase, catalase at laboratory temperature, cata-lase at 68 ºC, hydrolysis of Tween 80 in 10 days, urease in 18 hours, arylsulfatase in 3 days [10].
DNA extractionA loopful of each culture was suspended in animal-tissue lysis buffer (0.2 mL). DNA samples were extracted in a labo-ratory free of all mycobacterial products using QIAamp DNA blood mini kit (Qiagene). The accompanied proce-dure was adhered to, except for the incubation period which was extended to 3 hours. DNA was eluted in 100 µL PCR water (Gibco).
PCR amplificationAll DNA samples were positive for the IS6110 insertion element as determined by PCR amplification followed by detection by agarose gel electrophoresis using the method of Eisenach [11]. PCR set-up was also performed in a remote area separate from all subsequent procedures. Meas-ures to avoid cross- and carry-over PCR
Book 19-2.indb 120 2/21/2013 11:39:18 AM
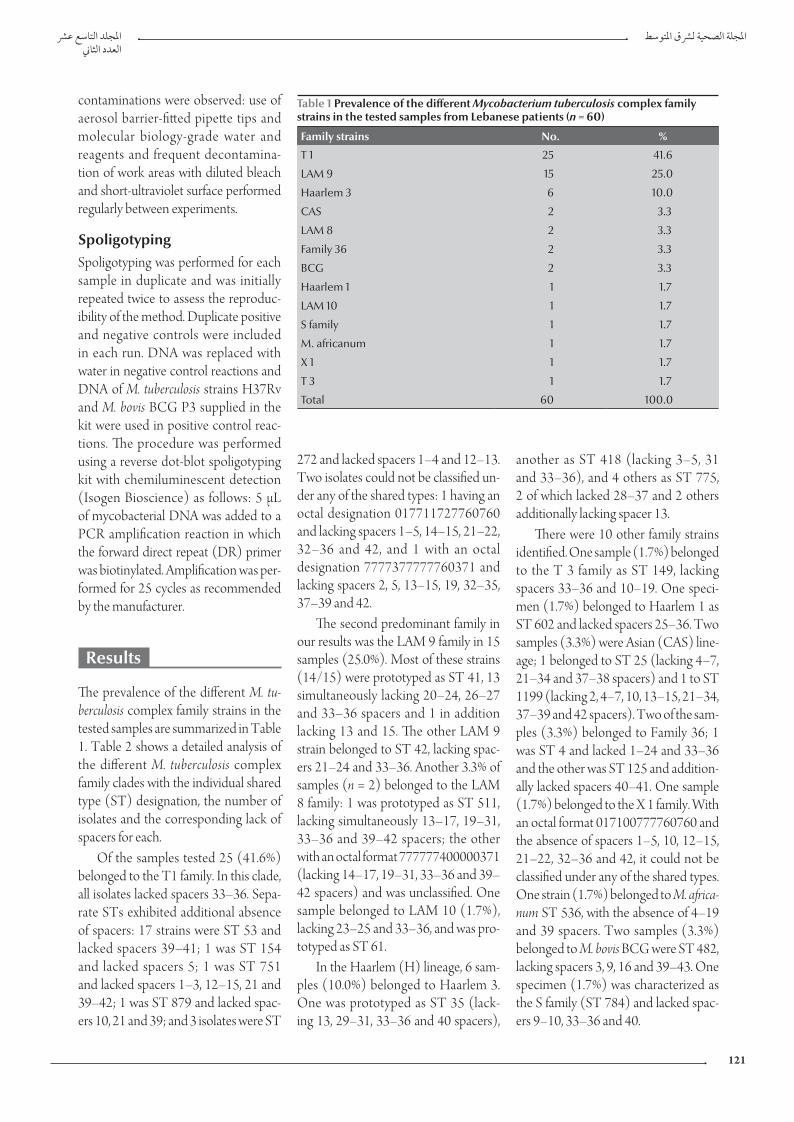
املجلد التاسع عرشاملجلة الصحية لرشق املتوسطالعدد الثاين
121
272 and lacked spacers 1–4 and 12–13. Two isolates could not be classified un-der any of the shared types: 1 having an octal designation 017711727760760 and lacking spacers 1–5, 14–15, 21–22, 32–36 and 42, and 1 with an octal designation 7777377777760371 and lacking spacers 2, 5, 13–15, 19, 32–35, 37–39 and 42.
The second predominant family in our results was the LAM 9 family in 15 samples (25.0%). Most of these strains (14/15) were prototyped as ST 41, 13 simultaneously lacking 20–24, 26–27 and 33–36 spacers and 1 in addition lacking 13 and 15. The other LAM 9 strain belonged to ST 42, lacking spac-ers 21–24 and 33–36. Another 3.3% of samples (n = 2) belonged to the LAM 8 family: 1 was prototyped as ST 511, lacking simultaneously 13–17, 19–31, 33–36 and 39–42 spacers; the other with an octal format 777777400000371 (lacking 14–17, 19–31, 33–36 and 39–42 spacers) and was unclassified. One sample belonged to LAM 10 (1.7%), lacking 23–25 and 33–36, and was pro-totyped as ST 61.
In the Haarlem (H) lineage, 6 sam-ples (10.0%) belonged to Haarlem 3. One was prototyped as ST 35 (lack-ing 13, 29–31, 33–36 and 40 spacers),
another as ST 418 (lacking 3–5, 31 and 33–36), and 4 others as ST 775, 2 of which lacked 28–37 and 2 others additionally lacking spacer 13.
There were 10 other family strains identified. One sample (1.7%) belonged to the T 3 family as ST 149, lacking spacers 33–36 and 10–19. One speci-men (1.7%) belonged to Haarlem 1 as ST 602 and lacked spacers 25–36. Two samples (3.3%) were Asian (CAS) line-age; 1 belonged to ST 25 (lacking 4–7, 21–34 and 37–38 spacers) and 1 to ST 1199 (lacking 2, 4–7, 10, 13–15, 21–34, 37–39 and 42 spacers). Two of the sam-ples (3.3%) belonged to Family 36; 1 was ST 4 and lacked 1–24 and 33–36 and the other was ST 125 and addition-ally lacked spacers 40–41. One sample (1.7%) belonged to the X 1 family. With an octal format 017100777760760 and the absence of spacers 1–5, 10, 12–15, 21–22, 32–36 and 42, it could not be classified under any of the shared types. One strain (1.7%) belonged to M. africa-num ST 536, with the absence of 4–19 and 39 spacers. Two samples (3.3%) belonged to M. bovis BCG were ST 482, lacking spacers 3, 9, 16 and 39–43. One specimen (1.7%) was characterized as the S family (ST 784) and lacked spac-ers 9–10, 33–36 and 40.
contaminations were observed: use of aerosol barrier-fitted pipette tips and molecular biology-grade water and reagents and frequent decontamina-tion of work areas with diluted bleach and short-ultraviolet surface performed regularly between experiments.
SpoligotypingSpoligotyping was performed for each sample in duplicate and was initially repeated twice to assess the reproduc-ibility of the method. Duplicate positive and negative controls were included in each run. DNA was replaced with water in negative control reactions and DNA of M. tuberculosis strains H37Rv and M. bovis BCG P3 supplied in the kit were used in positive control reac-tions. The procedure was performed using a reverse dot-blot spoligotyping kit with chemiluminescent detection (Isogen Bioscience) as follows: 5 µL of mycobacterial DNA was added to a PCR amplification reaction in which the forward direct repeat (DR) primer was biotinylated. Amplification was per-formed for 25 cycles as recommended by the manufacturer.
Results
The prevalence of the different M. tu-berculosis complex family strains in the tested samples are summarized in Table 1. Table 2 shows a detailed analysis of the different M. tuberculosis complex family clades with the individual shared type (ST) designation, the number of isolates and the corresponding lack of spacers for each.
Of the samples tested 25 (41.6%) belonged to the T1 family. In this clade, all isolates lacked spacers 33–36. Sepa-rate STs exhibited additional absence of spacers: 17 strains were ST 53 and lacked spacers 39–41; 1 was ST 154 and lacked spacers 5; 1 was ST 751 and lacked spacers 1–3, 12–15, 21 and 39–42; 1 was ST 879 and lacked spac-ers 10, 21 and 39; and 3 isolates were ST
Table 1 Prevalence of the different Mycobacterium tuberculosis complex family strains in the tested samples from Lebanese patients (n = 60)
Family strains No. %
T 1 25 41.6
LAM 9 15 25.0
Haarlem 3 6 10.0
CAS 2 3.3
LAM 8 2 3.3
Family 36 2 3.3
BCG 2 3.3
Haarlem 1 1 1.7
LAM 10 1 1.7
S family 1 1.7
M. africanum 1 1.7
X 1 1 1.7
T 3 1 1.7
Total 60 100.0
Book 19-2.indb 121 2/21/2013 11:39:19 AM
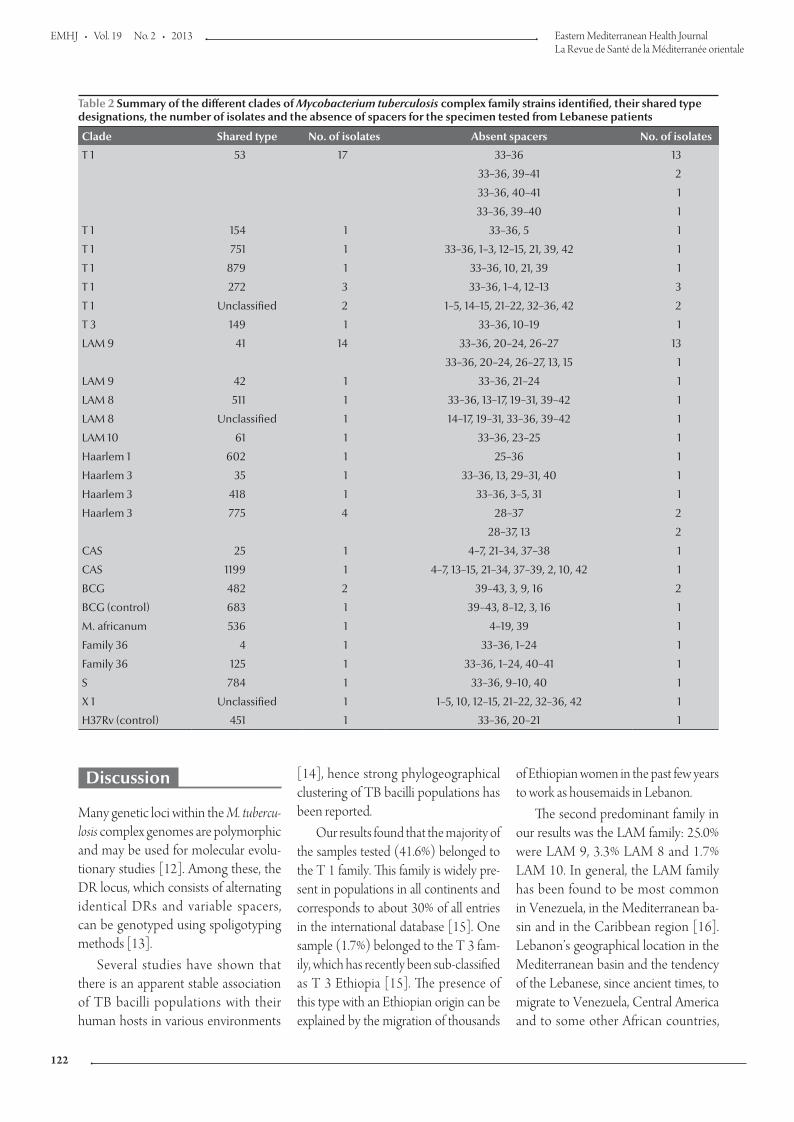
EMHJ • Vol. 19 No. 2 • 2013 Eastern Mediterranean Health JournalLa Revue de Santé de la Méditerranée orientale
122
Discussion
Many genetic loci within the M. tubercu-losis complex genomes are polymorphic and may be used for molecular evolu-tionary studies [12]. Among these, the DR locus, which consists of alternating identical DRs and variable spacers, can be genotyped using spoligotyping methods [13].
Several studies have shown that there is an apparent stable association of TB bacilli populations with their human hosts in various environments
[14], hence strong phylogeographical clustering of TB bacilli populations has been reported.
Our results found that the majority of the samples tested (41.6%) belonged to the T 1 family. This family is widely pre-sent in populations in all continents and corresponds to about 30% of all entries in the international database [15]. One sample (1.7%) belonged to the T 3 fam-ily, which has recently been sub-classified as T 3 Ethiopia [15]. The presence of this type with an Ethiopian origin can be explained by the migration of thousands
of Ethiopian women in the past few years to work as housemaids in Lebanon.
The second predominant family in our results was the LAM family: 25.0% were LAM 9, 3.3% LAM 8 and 1.7% LAM 10. In general, the LAM family has been found to be most common in Venezuela, in the Mediterranean ba-sin and in the Caribbean region [16]. Lebanon’s geographical location in the Mediterranean basin and the tendency of the Lebanese, since ancient times, to migrate to Venezuela, Central America and to some other African countries,
Table 2 Summary of the different clades of Mycobacterium tuberculosis complex family strains identified, their shared type designations, the number of isolates and the absence of spacers for the specimen tested from Lebanese patients
Clade Shared type No. of isolates Absent spacers No. of isolates
T 1 53 17 33–36 13
33–36, 39–41 2
33–36, 40–41 1
33–36, 39–40 1
T 1 154 1 33–36, 5 1
T 1 751 1 33–36, 1–3, 12–15, 21, 39, 42 1
T 1 879 1 33–36, 10, 21, 39 1
T 1 272 3 33–36, 1–4, 12–13 3
T 1 Unclassified 2 1–5, 14–15, 21–22, 32–36, 42 2
T 3 149 1 33–36, 10–19 1
LAM 9 41 14 33–36, 20–24, 26–27 13
33–36, 20–24, 26–27, 13, 15 1
LAM 9 42 1 33–36, 21–24 1
LAM 8 511 1 33–36, 13–17, 19–31, 39–42 1
LAM 8 Unclassified 1 14–17, 19–31, 33–36, 39–42 1
LAM 10 61 1 33–36, 23–25 1
Haarlem 1 602 1 25–36 1
Haarlem 3 35 1 33–36, 13, 29–31, 40 1
Haarlem 3 418 1 33–36, 3–5, 31 1
Haarlem 3 775 4 28–37 2
28–37, 13 2
CAS 25 1 4–7, 21–34, 37–38 1
CAS 1199 1 4–7, 13–15, 21–34, 37–39, 2, 10, 42 1
BCG 482 2 39–43, 3, 9, 16 2
BCG (control) 683 1 39–43, 8–12, 3, 16 1
M. africanum 536 1 4–19, 39 1
Family 36 4 1 33–36, 1–24 1
Family 36 125 1 33–36, 1–24, 40–41 1
S 784 1 33–36, 9–10, 40 1
X 1 Unclassified 1 1–5, 10, 12–15, 21–22, 32–36, 42 1
H37Rv (control) 451 1 33–36, 20–21 1
Book 19-2.indb 122 2/21/2013 11:39:19 AM
املجلد التاسع عرشاملجلة الصحية لرشق املتوسطالعدد الثاين
123
with intermittent visits to their mother country could explain our findings.
In the Haarlem (H) lineage, 10.0% of our samples belonged to Haarlem 3 and 1.7% to Haarlem 1. In Europe, this lineage represents about 25.0% of the isolates [15]. Outside Europe, the Haarlem strains were mainly found in Central America and the Caribbean (about 25%), suggesting a link of Haar-lem to the post-Columbus European colonization [17]. Today its widespread distribution in different geographical re-gions of the world such as Asia (except for India [18]), Europe and Africa has been documented [19]. The presence of Haarlem may always be related to European settlers [14] and in our areas, to the historical contacts that existed between Lebanon and many of the Eu-ropean communities.
The Central Asian (CAS) lineage covered 3.3% of the samples tested. Strains of this family have been reported in different countries of the Middle East (Islamic Republic of Iran, Pakistan, India and Afghanistan) [20], and to a lesser extent in several other regions (Africa 5.3%, Central America 0.1%, Europe 3.3%, Far East Asia 0.4%, North America 3.3% and Oceania 4.8%).
Another 3.3% of the samples be-longed to Family 36. Until now, this family has been identified as solely of USA origin [21].
There were 3.3% of samples belong-ing to M. bovis. This strain is character-ized by the presence of spacers 33 and 34 [22] and shares 99.95% identity with M. tuberculosis [23]. Humans are rarely af-fected, but people in some occupations such as veterinarians, farmers and abat-toir workers may be more at risk [23].
There was 1 sample (1.7%) belong-ing to the X 1 family. The X super-family is subdivided into at least 3 distinct fami-lies (X1 to X3) [24]. Its prevalence in North America is 21.5%, and in Central America 11.9%. It has been linked to an Anglo-Saxon ancestry, since it has been encountered in the UK and in English-colonized areas such as the
USA, Australia, South Africa and the Caribbean [25]. However, according to other investigations, this group of strains is currently correlated with African-Americans, a fact that may not represent the ancestry of this genotype [26].
Another sample (1.7%) belonged to M. africanum. It was first described in Senegal in 1968, in comparison to half of the smear-positive pulmonary TB cases in West Africa, but has not been found in other geographical ar-eas except among recent West African migrants [27]. There is a specificity of the M. africanum lineage for the African continent, with a decreasing gradient of prevalence from west to east [27].
Finally, 1 sample (1.7%) was char-acterized as the S family. This lineage, which is highly prevalent in Sicily and Sardinia, is thought to be identical to the F 28 in South Africa [15], although its origin remains unknown.
Noticeably none of the samples tested belonged to the Beijing family (characterized by the absence of spac-ers 1–34), which is quite prevalent in countries of the Middle East and Far East. Actually, they represent around 50% of the strains in Far East Asia, 16.5% in the Middle East and Central Asia, 17.2% in Oceania [15], 10% in India [18], and 13% of isolates globally [15]. This genotype, which may have been endemic in China for a long time [28], is emerging in some parts of the world, especially in countries of the former Soviet Union, and to a lesser extent in the Western hemisphere [29]. Either this genotype is actually absent in our country or additional samples should be tested in order to confirm this finding.
Another spoligotype that could not be detected was the East African Indian lineage. This super-family is highly prev-alent in Far East Asia (33.8%), in the Middle East and Central Asia (24.3%) and in Oceania (22.9%).
The current study demonstrated the circulation of several M. tuberculosis spoli-gotypes in the Lebanese population. The genetic diversity of M. tuberculosis isolates
from different regions of Lebanon neces-sitates additional studies by the simple spoligotyping test in order to achieve ac-curate epidemiological tracing of specific clusters and shared types which, in con-junction with TB control programmes, will help in prevention and treatment of TB. Determination of the sensitivity of the identified spoligotypes to the various antituberculosis drugs is in progress. This will provide further evidence of the clini-cal applicability of this work and quicker recognition of the long-feared virulent multidrug resistant strains.
Conclusion
Our results fit fairly well the molecular ep-idemiology of M. tuberculosis genotypes described in the international database. Four unclassified strains were detected: 2 strains belonging to the T 1 family (octal formats 017711727760760 and 7777377777760371), 1 strain belong-ing to LAM 8 (777777400000371) and 1 strain belonging to X 1 (017100777760760). However, the absence of Beijing and East African In-dian is not consistent with the patterns reported in neighbouring countries, despite the fact that Lebanon is open to workers from the Far and Middle East (e.g. Philippines, Bangladesh, Nepal, Sri Lanka, India, Pakistan, Islamic Republic of Iran, Russia, Iraq), from Africa (e.g. Egypt, Sudan, Ethiopia), in addition to the multinational forces lodging in south Lebanon. A more inclusive study of the Lebanese population is necessary to more accurately identify most of the prevailing families in our country and further extrapolate the benefits for pre-vention and possibly treatment of TB.
Acknowledgements
This work was totally funded by the Lebanese University. The SpolDB4 database was kindly provided by Chris-topher Sola and was used as a basis for data analysis.
Book 19-2.indb 123 2/21/2013 11:39:19 AM
EMHJ • Vol. 19 No. 2 • 2013 Eastern Mediterranean Health JournalLa Revue de Santé de la Méditerranée orientale
124
References
1. Murray M. Determinants of cluster distribution in the mo-lecular epidemiology of tuberculosis. Proceedings of the Na-tional Academy of Sciences of the United States of America, 2002, 99:1538–1543.
2. Gopaul KK et al. Progression toward an improved DNA ampli-fication-based typing technique in the study of Mycobacterium tuberculosis epidemiology. Journal of Clinical Microbiology, 2006, 44:2492–2498.
3. Mathema B et al. Molecular epidemiology of tuberculosis: cur-rent insights. Clinical Microbiology Reviews, 2006, 19:658–685.
4. Durmaz R et al. Population-based molecular epidemiological study of tuberculosis in Malatya, Turkey. Journal of Clinical Microbiology, 2007, 45:4027–4035.
5. Sola C et al. Spoligotype database of Mycobacterium tubercu-losis: biogeographic distribution of shared types and epide-miologic and phylogenetic perspectives. Emerging Infectious Diseases, 2001, 7:390–396.
6. Sreevatsan S et al. Restricted structural gene polymorphism in the Mycobacterium tuberculosis complex indicates evolu-tionarily recent global dissemination. Proceedings of the Na-tional Academy of Sciences of the United States of America, 1997, 94:9869–9874.
7. The five elements of DOTS. World Health Organization [online factsheet]. (http://www.who.int/tb/dots/whatisdots/en/index2.html, accessed 12 November 2012).
8. Global tuberculosis control report 2012. Geneva, World Health Organization, 2012.
9. Hamze M, Rahmo A, Saade M. Characterization of Mycobac-terium tuberculosis of Lebanese patients by double-repetitive-element polymerase chain reaction. Eastern Mediterranean Health Journal, 2010, 16:812–819.
10. Shinnick TM, Good RC. Mycobacterial taxonomy. European Journal of Clinical Microbiology and Infectious Diseases, 1994, 13:884–901.
11. Eisenach KD et al. Polymerase chain reaction amplification of a repetitive DNA sequence specific for Mycobacterium tubercu-losis. Journal of Infectious Diseases, 1990, 161:977–981.
12. Mostowy S, Behr MA. The origin and evolution of Mycobacte-rium tuberculosis. Clinics in Chest Medicine, 2005, 26:207–216, v–vi.
13. Groenen PM et al. Nature of DNA polymorphism in the direct repeat cluster of Mycobacterium tuberculosis; application for strain differentiation by a novel typing method. Molecular Mi-crobiology, 1993, 10:1057–1065.
14. Hirsh AE et al. Stable association between strains of Mycobac-terium tuberculosis and their human host populations. Proceed-ings of the National Academy of Sciences of the United States of America, 2004, 101:4871–4876.
15. Brudey K et al. Mycobacterium tuberculosis complex genetic di-versity: mining the fourth international spoligotyping database (SpolDB4) for classification, population genetics and epidemi-ology. BMC Microbiology, 2006, 6:23–50.
16. Sola C, Rastogi N. Molecular epidemiology and population genetics of tuberculosis. Kuala Lumpur, Malaysia, Academy of Sciences of Malaysia, 2006.
17. Duchêne V et al. Phylogenetic reconstruction of Mycobacte-rium tuberculosis within four settings of the Caribbean region: tree comparative analyse and first appraisal on their phyloge-ography. Infection, Genetics and Evolution, 2004, 4:5–14.
18. Kulkarni S et al. Spoligotyping of Mycobacterium tuberculosis isolates from patients with pulmonary tuberculosis in Mumbai, India. Research in Microbiology, 2005, 156:588–596.
19. Mardassi H et al. Tuberculosis due to resistant Haarlem strain, Tunisia. Emerging Infectious Diseases, 2005, 11:957–961.
20. Farnia P et al. Prevalence of Haarlem I and Beijing types of My-cobacterium tuberculosis strains in Iranian and Afghan MDR-TB patients. Journal of Infection, 2006, 53:331–336.
21. TB insight. Tuberculosis tracking and control [website] (http://tb insight.cs.rpi.edu, accessed 28 November 2012).
22. Singh UB et al. Predominant tuberculosis spoligotypes, Delhi, India. Emerging Infectious Diseases, 2004, 10:1138–1142.
23. Taylor GM et al. Genotypic analysis of Mycobacterium tuber-culosis from medieval human remains. Microbiology, 1999, 145:899–904.
24. Filliol I et al. Global distribution of Mycobacterium tuberculosis spoligotypes. Emerging Infectious Diseases, 2002, 8:1347–1349.
25. Sebban M et al. A data-mining approach to spacer oligonu-cleotide typing of Mycobacterium tuberculosis. Bioinformatics, 2002, 18:235–243.
26. Kempf MC et al. Long-term molecular analysis of tuberculosis strains in Alabama, a state characterized by a largely indig-enous, low-risk population. Journal of Clinical Microbiology, 2005, 43:870–878.
27. De Jong BC et al. Use of spoligotyping and large sequence polymorphisms to study the population structure of the Myco-bacterium tuberculosis complex in a cohort study of consecu-tive smear-positive tuberculosis cases in The Gambia. Journal of Clinical Microbiology, 2009, 47:994–1001.
28. Qian L et al. Retrospective analysis of the Beijing family of Mycobacterium tuberculosis in preserved lung tissues. Journal of Clinical Microbiology, 1999, 37:471–474.
29. Glynn JR et al. Worldwide occurrence of Beijing/W strains of Mycobacterium tuberculosis: a systematic review. Emerging Infectious Diseases, 2002, 8:843–849.
Book 19-2.indb 124 2/21/2013 11:39:19 AM
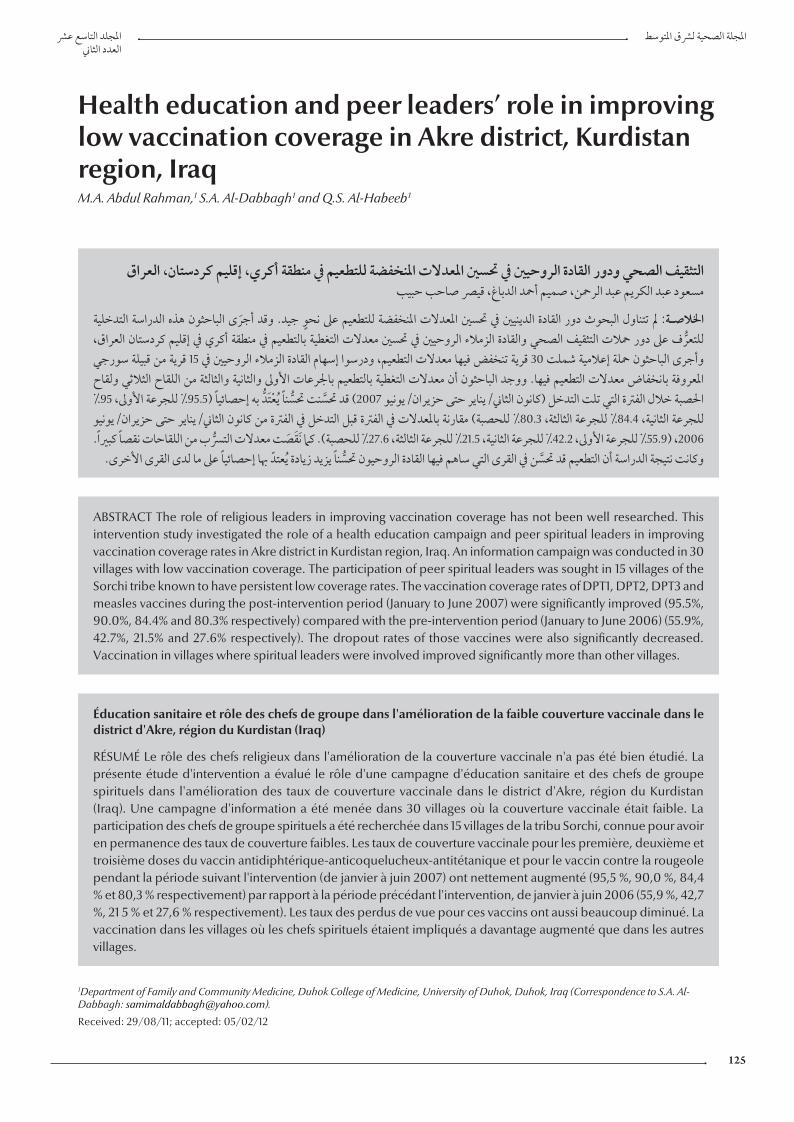
املجلد التاسع عرشاملجلة الصحية لرشق املتوسطالعدد الثاين
125
Health education and peer leaders’ role in improving low vaccination coverage in Akre district, Kurdistan region, IraqM.A. Abdul Rahman,1 S.A. Al-Dabbagh 1 and Q.S. Al-Habeeb 1
ABSTRACT The role of religious leaders in improving vaccination coverage has not been well researched. This intervention study investigated the role of a health education campaign and peer spiritual leaders in improving vaccination coverage rates in Akre district in Kurdistan region, Iraq. An information campaign was conducted in 30 villages with low vaccination coverage. The participation of peer spiritual leaders was sought in 15 villages of the Sorchi tribe known to have persistent low coverage rates. The vaccination coverage rates of DPT1, DPT2, DPT3 and measles vaccines during the post-intervention period (January to June 2007) were significantly improved (95.5%, 90.0%, 84.4% and 80.3% respectively) compared with the pre-intervention period (January to June 2006) (55.9%, 42.7%, 21.5% and 27.6% respectively). The dropout rates of those vaccines were also significantly decreased. Vaccination in villages where spiritual leaders were involved improved significantly more than other villages.
1Department of Family and Community Medicine, Duhok College of Medicine, University of Duhok, Duhok, Iraq (Correspondence to S.A. Al-Dabbagh: [email protected]).
Received: 29/08/11; accepted: 05/02/12
التثقيف الصحي ودور القادة الروحيني يف حتسني املعدالت املنخفضة للتطعيم يف منطقة أكري، إقليم كردستان، العراقمسعود عبد الكريم عبد الرمحن، صميم أمحد الدباغ، قيرص صاحب حبيب
التدخلية الدراسة هذه الباحثون أجرى وقد جيد. نحو عىل للتطعيم املنخفضة املعدالت حتسني يف الدينيني القادة دور البحوث تتناول مل اخلالصـة: العراق، إقليم كردستان بالتطعيم يف منطقة أكري يف التغطية الروحيني يف حتسني معدالت الزمالء التثقيف الصحي والقادة ف عىل دور محالت للتعروأجرى الباحثون محلة إعالمية شملت 30 قرية تنخفض فيها معدالت التطعيم، ودرسوا إسهام القادة الزمالء الروحيني يف 15 قرية من قبيلة سورجي الثالثي ولقاح اللقاح بالتطعيم باجلرعات األوىل والثانية والثالثة من التغطية الباحثون أن معدالت التطعيم فيها. ووجد بانخفاض معدالت املعروفة نا يعتد به إحصائيا )95.5% للجرعة األوىل، %95 نت حتس احلصبة خالل الفرتة التي تلت التدخل )كانون الثاين/يناير حتى حزيران/يونيو 2007( قد حتسللجرعة الثانية، 84.4% للجرعة الثالثة، 80.3% للحصبة( مقارنة باملعدالت يف الفرتة قبل التدخل يف الفرتة من كانون الثاين/يناير حتى حزيران/يونيو ب من اللقاحات نقصا كبريا. 2006، )55.9% للجرعة األوىل، 42.2% للجرعة الثانية، 21.5% للجرعة الثالثة، 27.6% للحصبة(. كام نقصت معدالت الترس
نا يزيد زيادة يعتد هبا إحصائيا عىل ما لدى القرى األخرى. ن يف القرى التي ساهم فيها القادة الروحيون حتس وكانت نتيجة الدراسة أن التطعيم قد حتس
Éducation sanitaire et rôle des chefs de groupe dans l'amélioration de la faible couverture vaccinale dans le district d'Akre, région du Kurdistan (Iraq)
RÉSUMÉ Le rôle des chefs religieux dans l'amélioration de la couverture vaccinale n'a pas été bien étudié. La présente étude d'intervention a évalué le rôle d'une campagne d'éducation sanitaire et des chefs de groupe spirituels dans l'amélioration des taux de couverture vaccinale dans le district d'Akre, région du Kurdistan (Iraq). Une campagne d'information a été menée dans 30 villages où la couverture vaccinale était faible. La participation des chefs de groupe spirituels a été recherchée dans 15 villages de la tribu Sorchi, connue pour avoir en permanence des taux de couverture faibles. Les taux de couverture vaccinale pour les première, deuxième et troisième doses du vaccin antidiphtérique-anticoquelucheux-antitétanique et pour le vaccin contre la rougeole pendant la période suivant l'intervention (de janvier à juin 2007) ont nettement augmenté (95,5 %, 90,0 %, 84,4 % et 80,3 % respectivement) par rapport à la période précédant l'intervention, de janvier à juin 2006 (55,9 %, 42,7 %, 21 5 % et 27,6 % respectivement). Les taux des perdus de vue pour ces vaccins ont aussi beaucoup diminué. La vaccination dans les villages où les chefs spirituels étaient impliqués a davantage augmenté que dans les autres villages.
Book 19-2.indb 125 2/21/2013 11:39:19 AM
EMHJ • Vol. 19 No. 2 • 2013 Eastern Mediterranean Health JournalLa Revue de Santé de la Méditerranée orientale
126
Introduction
Vaccination is considered to be among the most cost-effective public health interventions programmes [1]. Yet the global commitment to vaccination has not been sustained in all developing countries. In some countries, less than 1 in 3 children are immunized during their first year of life [2].
In Iraq immunization coverage rates in 2005 were less than that of neigh-bouring countries. In the Kurdistan region the rates of fully immunized infants with valid doses before their 1st birthday were 54% in Suleimany and 34% in Erbil and Duhok. The dropout rates between Bacille Calmette–Gué-rin (BCG) and measles vaccinations were 30.5%, 25.0% and 20.6% in Erbil, Duhok and in Suleimany respectively. Moreover, annual vaccination statistics of Duhok in 2005 revealed coverage rates for full immunization with oral polio vaccine (third dose), diphtheria-pertussis-tetanus (DPT) (third dose) and measles of 64.8%, 66.1% and 60.5% in the governorate in comparison with 40.3%, 40.1% and 44.3% in Akre district, which represented the lowest cover-age rates among all districts in Duhok [3]. DPT3 coverage rates are the most frequently used to monitor vaccination coverage, while dropout rates are used as indicators of a health system’s ability to deliver services requiring multiple vis-its [4]. The Global Alliance for Vaccines and Immunization set the objective of reaching 90% coverage at national level and 80% in each district in all countries by 2010 [2,5].
In Duhok governorate about 50% of the causes of vaccination failure or low coverage rates were due to lack of infor-mation and motivation [6,7]. Studies done in different parts of the world have shown the important role of health edu-cation in improving vaccination cover-age rates [8]. Education interventions can help people to identify their risk status, indications for specific vaccines and the potential benefits of vaccination
and can also reduce or remove barriers by changing negative attitudes and be-liefs about vaccination. Yet other studies have provided insufficient evidence to determine the effectiveness of client education in increasing targeted vac-cination coverage in adult populations at risk [9–12].
In many developing countries, re-ligious leaders have a legitimacy that political leaders may not have in advo-cating for vaccination, but their role in improving vaccination coverage has not been fully documented. The aim of this work was to study the effect of health education and the role of peer spiritual leaders in improving low vaccination coverage in Akre district of Duhok gov-ernorate in Iraq.
Methods
Study settingThis intervention study was carried out in Akre district, which is one of the 6 districts of Duhok governorate, cover-ing 1800 km2 about 120 km south-east of Dohuk city. Duhok governorate is one of the 3 governorates of Iraqi Kurd-istan region. Akre district has 5 sub-districts (Bardarash, Girdasin, Dinarta, Bejiland and central Akre) with a total of 179 204 inhabitants (46 942 urban and 132 262 rural) belonging to 4 main tribes (Goran, Zebaar, Herky and Sor-chi).
Study sampleThe strategy for delivery of routine immunization via the expanded pro-gramme on immunization (EPI) in Akre district is though 11 fixed units in 11 PHCs in the district, delivering vaccines 1–3 times per week according to their targets, in addition to 6 mobile outreach teams, which visit villages bimonthly according to a prepared timetable. Based on DPT3 coverage rates during 2005, 260 villages did not achieve the target coverage rate of 80% with 139 of them having a rate of < 20%.
The sample for the study was achieved by selecting all the target population of selected villages. The vil-lages selected for inclusion in this study had to fulfil a DPT 3 coverage rate < 20% and a target population (aged < 1 year) between 15–24 infants. The latter was adopted in order to have a reason-able size of target population for the intervention. The procedure resulted in 30 villages scattered through all sub-districts, 15 of which belonged to the Sorchi tribe.
InterventionBefore starting the study, a visit was carried out to the family of the local sheikh who was the most influential spiritual leader for the Sorchi popula-tion, to request their help in improving vaccination coverage among their tribe, stressing the need for preventing the re-emergence of vaccine preventable diseases such as the pertussis epidemic which occurred in most Sorchi villages during 2005–06. The sheikh’s family promised support and offered help by sending, in advance, a verbal message to their recognized representatives in all tribal villages. The message was that the vaccination programme is of great benefit for people in preventing many diseases and that they were requesting all families of the tribe to vaccinate their male and female children, as they did with their family and relative’s children. They also gave the research team per-mission to use that verbal message.
For the health education stage each of the 30 selected villages was offered a visit. Two days before each scheduled visit, the research team met members of the relevant local health unit or with the peer leader in villages where no such units were available. During each visit the planned health education programme was applied by one of the researchers (M.A.) with 2 paramed-ics from the vaccination unit. Invita-tion for attendance was done through using loudspeakers, sending children to nearby houses and interpersonal
Book 19-2.indb 126 2/21/2013 11:39:19 AM
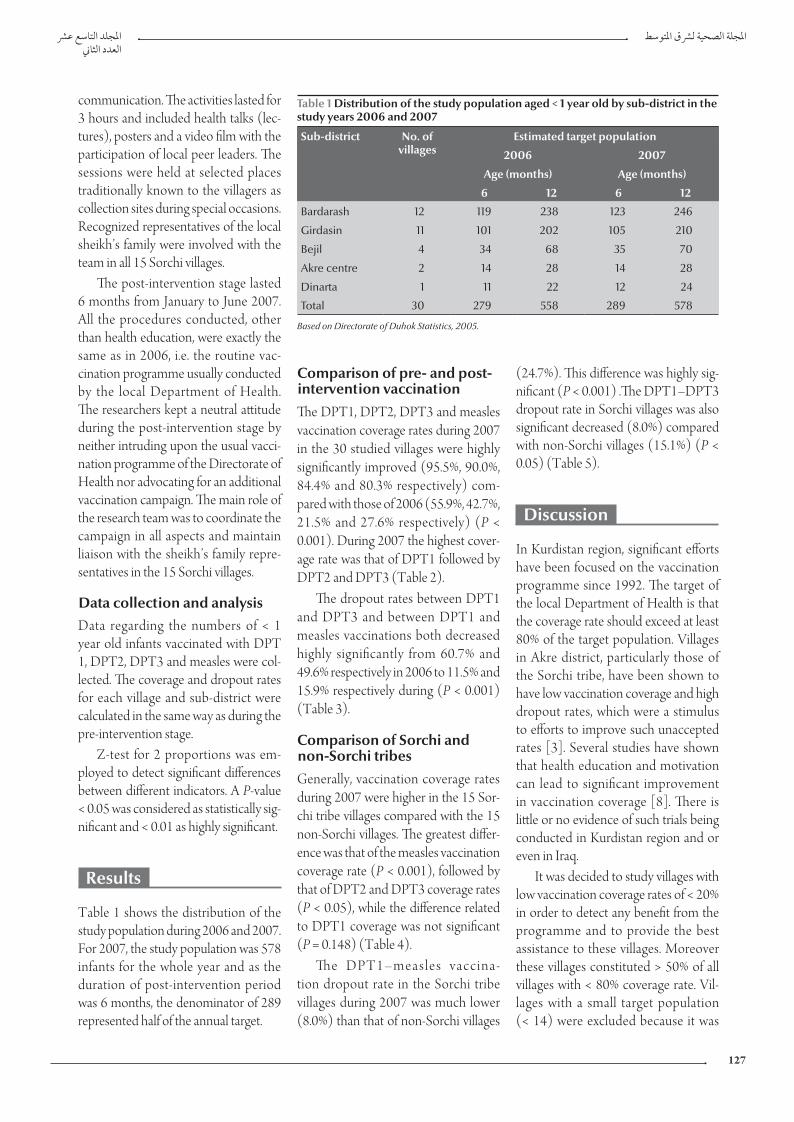
املجلد التاسع عرشاملجلة الصحية لرشق املتوسطالعدد الثاين
127
Comparison of pre- and post-intervention vaccinationThe DPT1, DPT2, DPT3 and measles vaccination coverage rates during 2007 in the 30 studied villages were highly significantly improved (95.5%, 90.0%, 84.4% and 80.3% respectively) com-pared with those of 2006 (55.9%, 42.7%, 21.5% and 27.6% respectively) (P < 0.001). During 2007 the highest cover-age rate was that of DPT1 followed by DPT2 and DPT3 (Table 2).
The dropout rates between DPT1 and DPT3 and between DPT1 and measles vaccinations both decreased highly significantly from 60.7% and 49.6% respectively in 2006 to 11.5% and 15.9% respectively during (P < 0.001) (Table 3).
Comparison of Sorchi and non-Sorchi tribesGenerally, vaccination coverage rates during 2007 were higher in the 15 Sor-chi tribe villages compared with the 15 non-Sorchi villages. The greatest differ-ence was that of the measles vaccination coverage rate (P < 0.001), followed by that of DPT2 and DPT3 coverage rates (P < 0.05), while the difference related to DPT1 coverage was not significant (P = 0.148) (Table 4).
The DPT1–measles vaccina-tion dropout rate in the Sorchi tribe villages during 2007 was much lower (8.0%) than that of non-Sorchi villages
(24.7%). This difference was highly sig-nificant (P < 0.001) .The DPT1–DPT3 dropout rate in Sorchi villages was also significant decreased (8.0%) compared with non-Sorchi villages (15.1%) (P < 0.05) (Table 5).
Discussion
In Kurdistan region, significant efforts have been focused on the vaccination programme since 1992. The target of the local Department of Health is that the coverage rate should exceed at least 80% of the target population. Villages in Akre district, particularly those of the Sorchi tribe, have been shown to have low vaccination coverage and high dropout rates, which were a stimulus to efforts to improve such unaccepted rates [3]. Several studies have shown that health education and motivation can lead to significant improvement in vaccination coverage [8]. There is little or no evidence of such trials being conducted in Kurdistan region and or even in Iraq.
It was decided to study villages with low vaccination coverage rates of < 20% in order to detect any benefit from the programme and to provide the best assistance to these villages. Moreover these villages constituted > 50% of all villages with < 80% coverage rate. Vil-lages with a small target population (< 14) were excluded because it was
communication. The activities lasted for 3 hours and included health talks (lec-tures), posters and a video film with the participation of local peer leaders. The sessions were held at selected places traditionally known to the villagers as collection sites during special occasions. Recognized representatives of the local sheikh’s family were involved with the team in all 15 Sorchi villages.
The post-intervention stage lasted 6 months from January to June 2007. All the procedures conducted, other than health education, were exactly the same as in 2006, i.e. the routine vac-cination programme usually conducted by the local Department of Health. The researchers kept a neutral attitude during the post-intervention stage by neither intruding upon the usual vacci-nation programme of the Directorate of Health nor advocating for an additional vaccination campaign. The main role of the research team was to coordinate the campaign in all aspects and maintain liaison with the sheikh’s family repre-sentatives in the 15 Sorchi villages.
Data collection and analysisData regarding the numbers of < 1 year old infants vaccinated with DPT 1, DPT2, DPT3 and measles were col-lected. The coverage and dropout rates for each village and sub-district were calculated in the same way as during the pre-intervention stage.
Z-test for 2 proportions was em-ployed to detect significant differences between different indicators. A P-value < 0.05 was considered as statistically sig-nificant and < 0.01 as highly significant.
Results
Table 1 shows the distribution of the study population during 2006 and 2007. For 2007, the study population was 578 infants for the whole year and as the duration of post-intervention period was 6 months, the denominator of 289 represented half of the annual target.
Table 1 Distribution of the study population aged < 1 year old by sub-district in the study years 2006 and 2007
Sub-district No. of villages
Estimated target population
2006 2007
Age (months) Age (months)
6 12 6 12
Bardarash 12 119 238 123 246
Girdasin 11 101 202 105 210
Bejil 4 34 68 35 70
Akre centre 2 14 28 14 28
Dinarta 1 11 22 12 24
Total 30 279 558 289 578
Based on Directorate of Duhok Statistics, 2005.
Book 19-2.indb 127 2/21/2013 11:39:19 AM
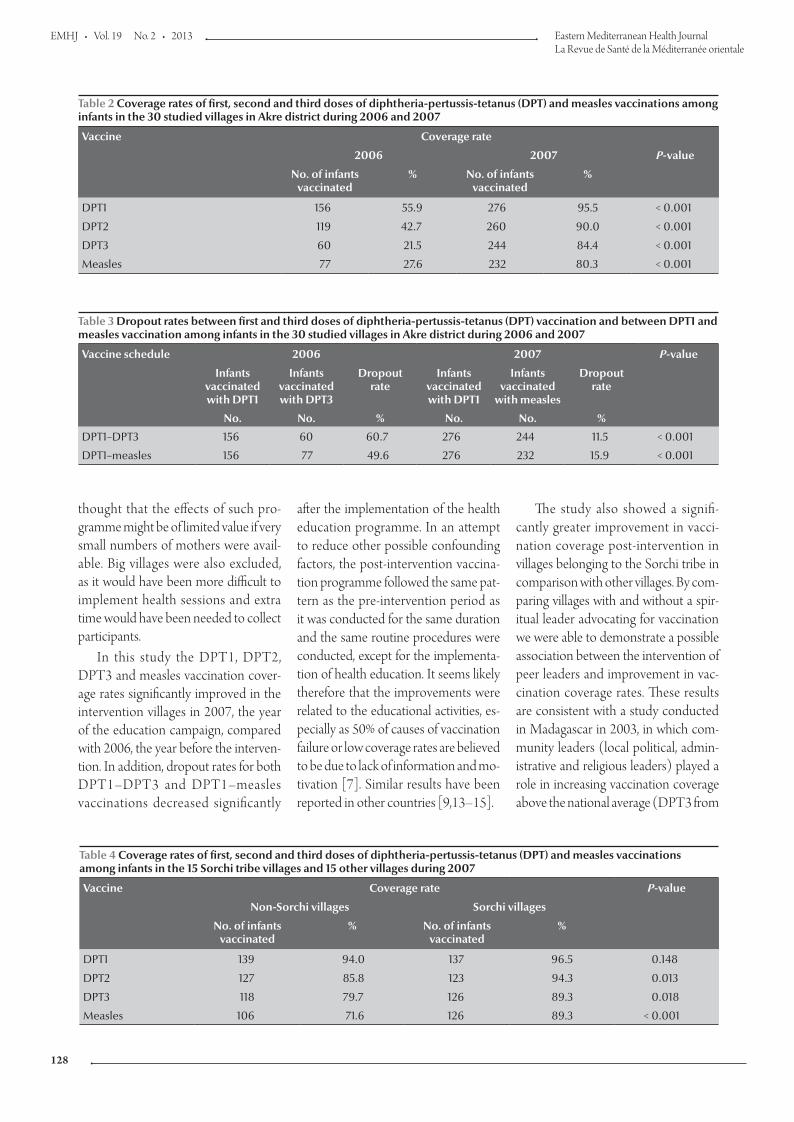
EMHJ • Vol. 19 No. 2 • 2013 Eastern Mediterranean Health JournalLa Revue de Santé de la Méditerranée orientale
128
thought that the effects of such pro-gramme might be of limited value if very small numbers of mothers were avail-able. Big villages were also excluded, as it would have been more difficult to implement health sessions and extra time would have been needed to collect participants.
In this study the DPT1, DPT2, DPT3 and measles vaccination cover-age rates significantly improved in the intervention villages in 2007, the year of the education campaign, compared with 2006, the year before the interven-tion. In addition, dropout rates for both DPT1–DPT3 and DPT1–measles vaccinations decreased significantly
after the implementation of the health education programme. In an attempt to reduce other possible confounding factors, the post-intervention vaccina-tion programme followed the same pat-tern as the pre-intervention period as it was conducted for the same duration and the same routine procedures were conducted, except for the implementa-tion of health education. It seems likely therefore that the improvements were related to the educational activities, es-pecially as 50% of causes of vaccination failure or low coverage rates are believed to be due to lack of information and mo-tivation [7]. Similar results have been reported in other countries [9,13–15].
The study also showed a signifi-cantly greater improvement in vacci-nation coverage post-intervention in villages belonging to the Sorchi tribe in comparison with other villages. By com-paring villages with and without a spir-itual leader advocating for vaccination we were able to demonstrate a possible association between the intervention of peer leaders and improvement in vac-cination coverage rates. These results are consistent with a study conducted in Madagascar in 2003, in which com-munity leaders (local political, admin-istrative and religious leaders) played a role in increasing vaccination coverage above the national average (DPT3 from
Table 2 Coverage rates of first, second and third doses of diphtheria-pertussis-tetanus (DPT) and measles vaccinations among infants in the 30 studied villages in Akre district during 2006 and 2007
Vaccine Coverage rate
2006 2007 P-value
No. of infants vaccinated
% No. of infants vaccinated
%
DPT1 156 55.9 276 95.5 < 0.001
DPT2 119 42.7 260 90.0 < 0.001
DPT3 60 21.5 244 84.4 < 0.001
Measles 77 27.6 232 80.3 < 0.001
Table 3 Dropout rates between first and third doses of diphtheria-pertussis-tetanus (DPT) vaccination and between DPT1 and measles vaccination among infants in the 30 studied villages in Akre district during 2006 and 2007
Vaccine schedule 2006 2007 P-value
Infants vaccinated with DPT1
Infants vaccinated with DPT3
Dropout rate
Infants vaccinated with DPT1
Infants vaccinated
with measles
Dropout rate
No. No. % No. No. %
DPT1–DPT3 156 60 60.7 276 244 11.5 < 0.001
DPT1–measles 156 77 49.6 276 232 15.9 < 0.001
Table 4 Coverage rates of first, second and third doses of diphtheria-pertussis-tetanus (DPT) and measles vaccinations among infants in the 15 Sorchi tribe villages and 15 other villages during 2007
Vaccine Coverage rate P-value
Non-Sorchi villages Sorchi villages
No. of infants vaccinated
% No. of infants vaccinated
%
DPT1 139 94.0 137 96.5 0.148
DPT2 127 85.8 123 94.3 0.013
DPT3 118 79.7 126 89.3 0.018
Measles 106 71.6 126 89.3 < 0.001
Book 19-2.indb 128 2/21/2013 11:39:19 AM
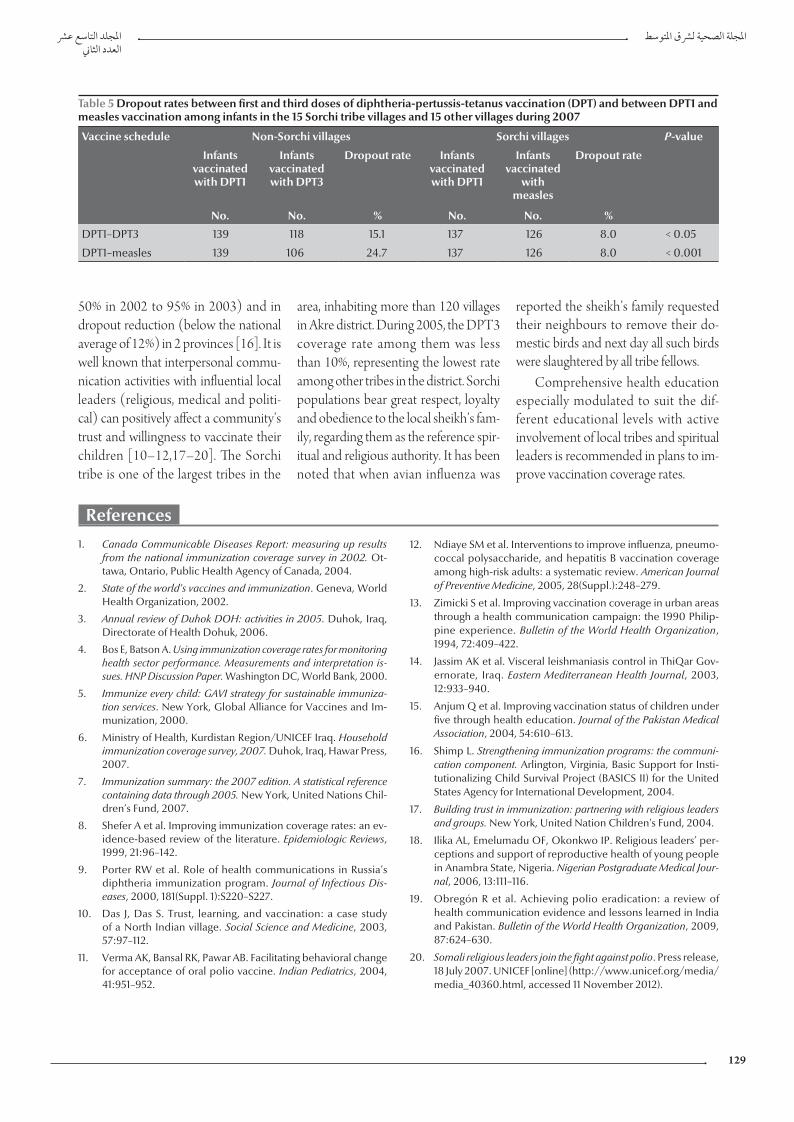
املجلد التاسع عرشاملجلة الصحية لرشق املتوسطالعدد الثاين
129
References
1. Canada Communicable Diseases Report: measuring up results from the national immunization coverage survey in 2002. Ot-tawa, Ontario, Public Health Agency of Canada, 2004.
2. State of the world's vaccines and immunization. Geneva, World Health Organization, 2002.
3. Annual review of Duhok DOH: activities in 2005. Duhok, Iraq, Directorate of Health Dohuk, 2006.
4. Bos E, Batson A. Using immunization coverage rates for monitoring health sector performance. Measurements and interpretation is-sues. HNP Discussion Paper. Washington DC, World Bank, 2000.
5. Immunize every child: GAVI strategy for sustainable immuniza-tion services. New York, Global Alliance for Vaccines and Im-munization, 2000.
6. Ministry of Health, Kurdistan Region/UNICEF Iraq. Household immunization coverage survey, 2007. Duhok, Iraq, Hawar Press, 2007.
7. Immunization summary: the 2007 edition. A statistical reference containing data through 2005. New York, United Nations Chil-dren’s Fund, 2007.
8. Shefer A et al. Improving immunization coverage rates: an ev-idence-based review of the literature. Epidemiologic Reviews, 1999, 21:96–142.
9. Porter RW et al. Role of health communications in Russia’s diphtheria immunization program. Journal of Infectious Dis-eases, 2000, 181(Suppl. 1):S220–S227.
10. Das J, Das S. Trust, learning, and vaccination: a case study of a North Indian village. Social Science and Medicine, 2003, 57:97–112.
11. Verma AK, Bansal RK, Pawar AB. Facilitating behavioral change for acceptance of oral polio vaccine. Indian Pediatrics, 2004, 41:951–952.
12. Ndiaye SM et al. Interventions to improve influenza, pneumo-coccal polysaccharide, and hepatitis B vaccination coverage among high-risk adults: a systematic review. American Journal of Preventive Medicine, 2005, 28(Suppl.):248–279.
13. Zimicki S et al. Improving vaccination coverage in urban areas through a health communication campaign: the 1990 Philip-pine experience. Bulletin of the World Health Organization, 1994, 72:409–422.
14. Jassim AK et al. Visceral leishmaniasis control in ThiQar Gov-ernorate, Iraq. Eastern Mediterranean Health Journal, 2003, 12:933–940.
15. Anjum Q et al. Improving vaccination status of children under five through health education. Journal of the Pakistan Medical Association, 2004, 54:610–613.
16. Shimp L. Strengthening immunization programs: the communi-cation component. Arlington, Virginia, Basic Support for Insti-tutionalizing Child Survival Project (BASICS II) for the United States Agency for International Development, 2004.
17. Building trust in immunization: partnering with religious leaders and groups. New York, United Nation Children's Fund, 2004.
18. Ilika AL, Emelumadu OF, Okonkwo IP. Religious leaders’ per-ceptions and support of reproductive health of young people in Anambra State, Nigeria. Nigerian Postgraduate Medical Jour-nal, 2006, 13:111–116.
19. Obregón R et al. Achieving polio eradication: a review of health communication evidence and lessons learned in India and Pakistan. Bulletin of the World Health Organization, 2009, 87:624–630.
20. Somali religious leaders join the fight against polio. Press release, 18 July 2007. UNICEF [online] (http://www.unicef.org/media/media_40360.html, accessed 11 November 2012).
50% in 2002 to 95% in 2003) and in dropout reduction (below the national average of 12%) in 2 provinces [16]. It is well known that interpersonal commu-nication activities with influential local leaders (religious, medical and politi-cal) can positively affect a community’s trust and willingness to vaccinate their children [10–12,17–20]. The Sorchi tribe is one of the largest tribes in the
area, inhabiting more than 120 villages in Akre district. During 2005, the DPT3 coverage rate among them was less than 10%, representing the lowest rate among other tribes in the district. Sorchi populations bear great respect, loyalty and obedience to the local sheikh’s fam-ily, regarding them as the reference spir-itual and religious authority. It has been noted that when avian influenza was
reported the sheikh’s family requested their neighbours to remove their do-mestic birds and next day all such birds were slaughtered by all tribe fellows.
Comprehensive health education especially modulated to suit the dif-ferent educational levels with active involvement of local tribes and spiritual leaders is recommended in plans to im-prove vaccination coverage rates.
Table 5 Dropout rates between first and third doses of diphtheria-pertussis-tetanus vaccination (DPT) and between DPT1 and measles vaccination among infants in the 15 Sorchi tribe villages and 15 other villages during 2007
Vaccine schedule Non-Sorchi villages Sorchi villages P-value
Infants vaccinated with DPT1
Infants vaccinated with DPT3
Dropout rate Infants vaccinated with DPT1
Infants vaccinated
with measles
Dropout rate
No. No. % No. No. %
DPT1–DPT3 139 118 15.1 137 126 8.0 < 0.05
DPT1–measles 139 106 24.7 137 126 8.0 < 0.001
Book 19-2.indb 129 2/21/2013 11:39:20 AM
EMHJ • Vol. 19 No. 2 • 2013 Eastern Mediterranean Health JournalLa Revue de Santé de la Méditerranée orientale
130
High incidence of hepatitis B infection after treatment for paediatric cancer at a teaching hospital in Baghdad M. F. Al-Jadiry,1 M. Al-Khafagi,2 A.F. Al-Darraji,2 R.M. Al-Saeed,2 S.F. Al-Badri 2 and S.A. Al-Hadad 1
ABSTRACT This study estimated the incidence of viral hepatitis in children treated for cancer, to identify variables that could affect this incidence and to assess the role of hepatitis B virus (HBV) vaccination in preventing infection. Between September 2007 and June 2008, 256 children in the haemato-oncology unit at the Children’s Welfare Teaching Hospital, Baghdad, were studied prospectively. Demographic and clinical data and vaccination history were recorded. Patients were tested for HBV at the time of diagnosis (all were negative) and after starting chemotherapy. On admission to the unit, 231 patients (90.2%) were revaccinated. At reassessment after treatment for cancer, HBV infection was found in 70 patients (27.3%). The variables that significantly increased the risk for HBV infection were a diagnosis of leukaemia and receiving more than 3 units of blood. A higher number of HBV vaccinations in hospital reduced the risk for HBV infection. The high rate of acquisition of HBV infection found in this study indicates the need for better screening of blood products and adherence to aseptic techniques in management of this group of patients.
1Baghdad College of Medicine; 2Children Welfare Teaching Hospital, Paediatric Oncology Unit, Baghdad, Iraq (Correspondence to M.F. Al-Jadiry: [email protected]).
Received: 08/07/11; accepted: 01/11/11
ل مرتفع حلدوث العدوى بالتهاب الكبد "يب" بعد معاجلة رسطانات األطفال يف مستشفى تعليمي يف بغداد معدمازن فيصل اجلادري، ميثاق اخلفاجي، عامر فاضل الدراجي، رغد ماجد السعيد، صفاء فرج البدري، سلمى عباس احلداد
ف عىل املتغريات التي قد تؤثر اخلالصـة: هتدف هذه الدراسة لتقرير معدل حدوث التهاب الكبد الفريويس لدى األطفال عقب معاجلتهم من الرسطان، وللتعرعىل هذا املعدل، ولتقييم دور التطعيم ضد فريوس التهاب الكبد "يب" يف الوقاية من العدوى. ففي الفرتة بني أيلول/سبتمرب 2007 وحزيران/يونيو 2008، درس الباحثون دراسة استقبالية 256 طفال يف وحدة األورام الدموية يف مستشفى محاية األطفال التعليميم يف بغداد. وقد سجل الباحثون املعطيات الديمغرافية والرسيرية وسوابق التطعيم، وأجروا للمرىض اختبارات لتحري فريوس التهاب الكبد "يب" وقت التشخيص )حيث كانت مجيع النتائج سلبية(، وبعد البدء باملعاجلة الكيميائية. وعند قبول األطفال املرىض يف املستشفى، كان 231 منهم )90%( قد تلقى التطعيم مرة ثانية. أما عند إعادة التقييم بعد معاجلة الرسطان فقد 70 مريضا )27.3%(؛ وكانت املتغريات التي تزيد من خطر العدوى بفريوس التهاب الكبد "يب" كشف الباحثون العدوى بفريوس التهاب الكبد "يب" لدى ي أكثر من ثالث وحدات من الدم. عىل أن زيادة أعداد التطعيامت املضادة لفريوس التهاب الكبد زيادة يعتد هبا إحصائيا هي: تشخيص ابيضاض الدم، وتلقل املرتفع الكتساب العدوى بفريوس التهاب الكبد "يب" يف هذه الكبد "يب". ويشري املعد التهاب بفريوس العدوى خطر من أنقصت قد املستشفى "يب" يف
الدراسة إىل احلاجة إىل حتريات أفضل ملنتجات الدم، وإىل االلتزام بالتقنيات العقيمة عند معاجلة هذه املجموعة من املرىض.
Incidence élevée de l'infection par le virus de l'hépatite B après un traitement pour un cancer chez l'enfant à l'hôpital universitaire de Bagdad
RÉSUMÉ La présente étude a estimé l'incidence de l'hépatite virale chez les enfants traités pour un cancer, afin d'identifier les variables qui pourraient influer sur son incidence et d'évaluer le rôle de la vaccination contre le virus de l'hépatite B dans la prévention de l'infection. Entre septembre 2007 et juin 2008, 256 enfants admis au service d'hémato-oncologie de l'hôpital pédiatrique universitaire à vocation sociale de Bagdad ont fait l'objet d'une étude prospective. Les données démographiques et cliniques ainsi que les antécédents de vaccination ont été notés. Les patients ont passé un test de dépistage de l'infection par le virus de l'hépatite B à la pose du diagnostic (tous étaient négatifs) et après l'instauration de la chimiothérapie. Lors de leur admission dans le service, 231 patients (90,2 %) ont été revaccinés. Après le traitement pour le cancer, un nouveau dépistage a été conduit et une infection par le virus de l'hépatite B a été retrouvée chez 70 patients (27,3 %). Un diagnostic de leucémie et une transfusion de plus de trois unités de sang étaient les variables augmentant nettement le risque d'infection par le virus de l'hépatite B. Un nombre plus élevé de vaccinations contre le virus de l'hépatite B à l'hôpital réduisait le risque d'une telle infection. Le taux élevé de nouvelles infections par le virus de l'hépatite B observé dans cette étude met en évidence la nécessité d'un meilleur dépistage des produits sanguins et d'une meilleure observance des techniques d'asepsie dans la prise en charge de ce groupe de patients.
Book 19-2.indb 130 2/21/2013 11:39:20 AM
املجلد التاسع عرشاملجلة الصحية لرشق املتوسطالعدد الثاين
131
Introduction
Children living in intermediate- and high-endemicity areas for hepatitis B virus (HBV) are at risk of getting the infection, especially those children with cancer who are obliged to receive intensive cytostatic chemotherapy, which requires multiple blood transfu-sions and causes immunodeficiency. HBV vaccination of seronegative patients at diagnosis may be recom-mended [1,2].
Iraq is a developing country, where HBV and hepatitis C virus (HCV) infections are still prevalent, with an HBV carrier rate of 2%–5%. Although Iraq includes HBV vaccination in its Expanded Programme on Immuniza-tion, the coverage rate is less than 80% [3,4].
Hospital-acquired HBV and HCV infections continue to occur despite increased awareness of the problem among the medical community [2]. Children with cancer need frequent blood counts, invasive diagnostic pro-cedures (e.g. bone marrow aspiration and biopsy), intravenous therapy and surgery, which may contribute to their risk for acquiring HBV infection.
We determined the risk for infection with hepatitis viruses among children being treated for cancer at our hospital, the Children’s Welfare Teaching Hos-pital, Baghdad. We also assessed the role of HBV vaccination in preventing infection.
Methods
Between September 2007 and June 2008, all 256 children ≤ 15 years old (the upper limit for receiving children in this hospital is 14 years) who were being treated for cancer or who had finished treatment and were attending for follow-up at the Children’s Welfare Teaching Hospital, Baghdad, were studied.
Demographic and clinical infor-mation was obtained, including name
of child, date of birth, sex, residence, type of cancer, date of diagnosis, re-sult of hepatitis screening at the time of diagnosis, duration of observation, presumed number of hepatitis vac-cinations given at home, number of HBV vaccinations given at the hos-pital, result of hepatitis screening at the time of reassessment, number of blood transfusions and hospital in which they were done. The sources for this information were the parents, the hospital records, and medical notes and documentation about the child's treatment held by the parents. Simple written consent was obtained from the families although all procedures and investigations were within the normal range of our work as we do frequent screening for hepatitis (every 3 months) because of high incidence in our patients.
The factors which were considered might have a statistically significant impact on the incidence of hepatitis B among the children were age, type of malignancy, residence, number of blood transfusions and hospital in which they were done, vaccination at home in the national immunization programme and vaccination at the hospital.
Blood samples were tested for hepa-titis B surface antigen (HBsAg) and anti-hepatitis C antibody (anti-HCV) with commercially available enzyme-linked immunosorbent assay (ELISA) diagnostic kits. Hepanostika HBsAg ultra 576T (bioMèrieux) was used to screen for HBV and Hepanostika HB-sAg Ultra 25T for confirmation. Bio-elisa HCV 480T (Biokit) was used to screening for HVC, but no confirma-tory tests were available.
Multi-transfused patients were de-fined as those who had received more than 3 units of blood.
Statistical analysisStatistical analysis was performed with GraphPad Instat 3 for Windows. Descrip-tive statistics were reported. The chi-squared test for trend and the Fisher
exact test were used to compare groups. Statistical significance was set at P < 0.05.
Results
The majority of the children (192/256, 75.0%) were diagnosed between 2006 and 2007; for the remainder, the diag-nosis had been made between 2001 and 2006.
All patients had a negative screen for HBV and HCV at the time of diag-nosis (the result for HCV was missing for 1 patient). At the time of reassess-ment, 70/256 (27.3%) patients were positive (screening and confirma-tory test) for HBV, and 19/244 (7.8%) were positive for HCV in the screening test (12 patients were not screened for HCV because of lack of laboratory materials).
The median age of the children in the study was 5 years and 5 months (range, 3 months to 15 years and 5 months); 168 (65.6%) were boys (male: female ratio, 1.9:1) (Table 1). The patients were referred from various parts of Iraq, however, the majority (149, 58.2%) were from Baghdad.
The duration of observation from the time of diagnosis of any cancer until the last screen for hepatitis was 2–82 months, with a median of 15.5 months. The majority of patients (166, 64.8%) had leukaemia and 59 (35.5%) of these were found to be HBsAg positive, the earliest at 3 months and the last at 80 months during the 2–82 months obser-vation period (Table 1).
The number of units of blood trans-fused ranged from 0 to 30 units, with a median of 7 units; 158 children (of the 231 who received transfusions) were transfused exclusively in our hospital (Table 1).
Most children had received 3 doses of HBV vaccine at home accord-ing to the national Iraqi vaccination schedule (3 doses: birth, 2 months and 6 months); 40 children had received
Book 19-2.indb 131 2/21/2013 11:39:20 AM
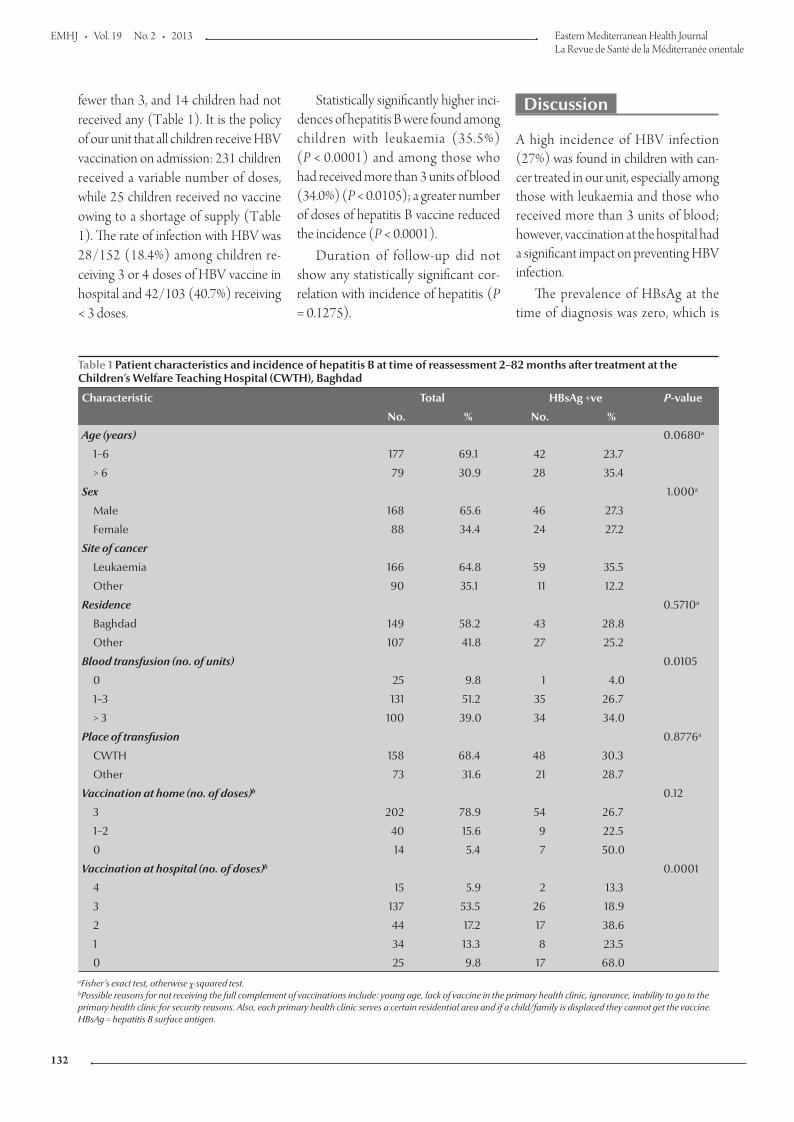
EMHJ • Vol. 19 No. 2 • 2013 Eastern Mediterranean Health JournalLa Revue de Santé de la Méditerranée orientale
132
Statistically significantly higher inci-dences of hepatitis B were found among children with leukaemia (35.5%) (P < 0.0001) and among those who had received more than 3 units of blood (34.0%) (P < 0.0105); a greater number of doses of hepatitis B vaccine reduced the incidence (P < 0.0001).
Duration of follow-up did not show any statistically significant cor-relation with incidence of hepatitis (P = 0.1275).
Discussion
A high incidence of HBV infection (27%) was found in children with can-cer treated in our unit, especially among those with leukaemia and those who received more than 3 units of blood; however, vaccination at the hospital had a significant impact on preventing HBV infection.
The prevalence of HBsAg at the time of diagnosis was zero, which is
fewer than 3, and 14 children had not received any (Table 1). It is the policy of our unit that all children receive HBV vaccination on admission: 231 children received a variable number of doses, while 25 children received no vaccine owing to a shortage of supply (Table 1). The rate of infection with HBV was 28/152 (18.4%) among children re-ceiving 3 or 4 doses of HBV vaccine in hospital and 42/103 (40.7%) receiving < 3 doses.
Table 1 Patient characteristics and incidence of hepatitis B at time of reassessment 2–82 months after treatment at the Children’s Welfare Teaching Hospital (CWTH), Baghdad
Characteristic Total HBsAg +ve P-value
No. % No. %
Age (years) 0.0680a
1–6 177 69.1 42 23.7
> 6 79 30.9 28 35.4
Sex 1.000a
Male 168 65.6 46 27.3
Female 88 34.4 24 27.2
Site of cancer
Leukaemia 166 64.8 59 35.5
Other 90 35.1 11 12.2
Residence 0.5710a
Baghdad 149 58.2 43 28.8
Other 107 41.8 27 25.2
Blood transfusion (no. of units) 0.0105
0 25 9.8 1 4.0
1–3 131 51.2 35 26.7
> 3 100 39.0 34 34.0
Place of transfusion 0.8776a
CWTH 158 68.4 48 30.3
Other 73 31.6 21 28.7
Vaccination at home (no. of doses)b 0.12
3 202 78.9 54 26.7
1–2 40 15.6 9 22.5
0 14 5.4 7 50.0
Vaccination at hospital (no. of doses)b 0.0001
4 15 5.9 2 13.3
3 137 53.5 26 18.9
2 44 17.2 17 38.6
1 34 13.3 8 23.5
0 25 9.8 17 68.0aFisher’s exact test, otherwise χ-squared test. bPossible reasons for not receiving the full complement of vaccinations include: young age, lack of vaccine in the primary health clinic, ignorance, inability to go to the primary health clinic for security reasons. Also, each primary health clinic serves a certain residential area and if a child/family is displaced they cannot get the vaccine. HBsAg = hepatitis B surface antigen.
Book 19-2.indb 132 2/21/2013 11:39:20 AM
املجلد التاسع عرشاملجلة الصحية لرشق املتوسطالعدد الثاين
133
lower than the estimated carrier rate in our country, perhaps reflecting the success of the active Expanded Pro-gramme for Immunization in the coun-try and the young age of the sample. The prevalence of HBsAg among children after treatment for cancer in this study was, however, higher than that found in other studies in the region. Mostafa et al. [5] in Egypt showed that the inci-dence of HBsAg increased from 3.6% at the time of diagnosis to 18.2% after 6 months of therapy in 111 paediatric malignancies. Kebudi et al. [6] in Tur-key studied the prevalence of HBV and HCV infections in 50 children with solid tumours at diagnosis who under-went intensive chemotherapy and mul-tiple transfusions. At diagnosis, 4% were HBV-positive and 2% HCV-positive; these values rose significantly to 20% and 14%, respectively after therapy.
The incidence of HCV infection in our study was lower than that in other studies of children with and without malignancies in developing countries [7,8]. This finding might raise questions about the accuracy of HCV screen-ing in our study, which depends on the method and on the quality of the available kits. The lack of polymerase chain reaction (PCR) testing kits in Iraq precluded confirmation of the presence of HCV in our patients.
We found no effect of age on the incidence of HBV infection, in accord-ance with the study of Baytan, Gunes and Gunay in Turkey [9].
Although there is no guarantee that the practices of the paramedi-cal staff in our unit led to infection through the reuse of single medication
vials or through contamination of injectable medications or flush solu-tions, the lack of an association with length of follow-up suggests that long-term exposure to medical and nursing procedures does not increase the risk if basic infection control measures are respected.
Our finding that children treated for leukaemia had a significantly higher incidence of HBV infection might be re-lated to the duration of chemotherapy, the degree of immunosuppression and the requirement for blood products. The effect of a greater number of blood transfusions on the incidence of HBV infection might point to inadequate screening in the national blood bank centre. Several factors can lead to hu-man immunodeficiency virus (HIV), HCV or HBV infections through blood donation: donation of blood during the infectious “window period” follow-ing infection when the available tests cannot detect infection; false-negative results due to poor test sensitivity (less than 100%), and blood donations falsely labelled as virus-negative due to errors in sampling, testing or recording of test results. In addition, blood dona-tions collected from individuals with fluctuating or waning levels of HBsAg during the later stages of HBV carriage can give false-negative results during donation [3].
Our study shows that prior vac-cination does not prevent infection, perhaps raising the question of the effi-cacy of the vaccines given, the reliability of histories taken from the parents and the degree of attenuation of the im-mune system during chemotherapy.
A shortage of kits for measuring anti-bodies to HBsAg precluded us from assessing the response to vaccination. Our results show, however, a statisti-cally significant association between the number of doses of vaccine given in hospital and a reduction in the inci-dence of hepatitis, which implies that the strict immunization policy we use in our oncology unit was successful. This finding differs from findings in 2 studies on children with acute lympho-blastic leukaemia treated at the Tata Memorial Hospital in India. In the first study, only 10.5% of 162 patients devel-oped protective levels of anti-HBsAg after 3 double doses of HBV vaccine, and 48.0% became infected with HBV [10]. In the second study, children were given 5 primary doses at monthly intervals, followed by a booster 1 year after the first dose. Serum antibodies were detected in only 30% of children who received all 6 doses of vaccine, and 43% became infected with HBV [11]. Fioredda et al. in Italy, however, found that the addition of boosters to the regular vaccination schedule was effective if they were given at least 6 months after the end of treatment [12]. Further study is needed to confirm these observations.
Conclusions
The high rate of acquisition of HBV infection in children with malignancy found in this study indicates the need for better screening of blood products and rigorous adherence to aseptic tech-niques in the management of this group of patients.
References
1. Kebudi R, Agaoglu L, Badur S. The seroprevalance of HIV-1 and HBV infections in multitransfused pediatric hematology-oncology patients in Istanbul. Journal of Pediatric Hematology/Oncology, 1992, 9:389–391.
2. Dumpis U et al. An outbreak of HBV and HCV infection in a paediatric oncology ward: epidemiological investigations and prevention of further spread. Journal of Medical Virology, 2003, 69(3):331–338.
3. Hepatitis B. Geneva, World Health Organization, 2008 (Factsheet No. 204) (http://www.who.int/mediacentre/factsheets/fs204/en/, accessed 28 December 2012).
4. Immunization service delivery. Hepatitis B. Countries using hepatitis B vaccine. Geneva, World Health Organization, 2009 (http://www.who.int/immunization_delivery/new_vaccines/hepb/en/index4.html, accessed 28 December 2012).
Book 19-2.indb 133 2/21/2013 11:39:20 AM
EMHJ • Vol. 19 No. 2 • 2013 Eastern Mediterranean Health JournalLa Revue de Santé de la Méditerranée orientale
134
5. Mostafa A et al. Seroprevalence of hepatitis B and C in pediatric malignancies. Journal of the Egyptian National Cancer Institute, 2003, 15:33–42.
6. Kebudi R et al. Seroprevalence of hepatitis B, hepatitis C and human Immunodeficiency virus infection with cancer at di-agnosis and following therapy in Turkey. Medical and Pediatric Oncology, 2000, 34:102–105.
7. Mollah AH et al. Common transfusion-transmitted infectious agents among thalassaemic children in Bangladesh. Journal of Health, Population and Nutrition, 2003, 21:67–71.
8. De Paula EV et al. Transfusion-transmitted infections among multi-transfused patients in Brazil. Journal of Clinical Virology, 2005, 34(Suppl. 2):S27–S32.
9. Baytan B, Gunes AM, Gunay U. Efficacy of primary hepatitis B immunization in children with acute lymphoblastic leukemia. Indian Pediatrics, 2008, 45:265–270.
10. Goyal S et al. Hepatitis B vaccination in acute lymphoblastic leukemia. Leukaemia Research, 1998, 22:193–195
11. Somjee S et al. Hepatitis B vaccination in children with acute lymphoblastic leukemia: results of an intensified immunization schedule. Leukaemia Research, 1999, 23:365–367.
12. Fioredda F et al. Re-immunisation schedule in leukaemic children after intensive chemotherapy: a possible strategy. European Journal of Haematology, 2005, 74:3–20.
Hepatitis B and C in the Eastern Mediterranean Region
Despite the availability of effective prevention strategies, hepatitis B virus (HBV) and hepatitis C virus (HCV) transmission occur throughout the WHO Eastern Mediterranean Region. In fact it is estimated that around 4.3 million persons are infected with HBV and 800 000 persons with HCV in the Region each year. The cost to treat patients with chronic HBV or HCV infection far outweighs the cost of implementing prevention programmes. Strategies recommended by the World Health Organization to reduce HBV and HBC infection include: sustainable hepatitis B vaccination of all infants, including provision of a first dose of vaccine within 24 hours of birth; vaccination and education of all persons occupationally exposed to blood and also health care students, and education and quality assurance in health care to ensure patient safety, injection safety and safe dental care.
Source: The growing threats of hepatitis B and C in the Eastern Mediterranean Region: a call for action (http://applications.emro.who.int/docs/EM_RC56_3_en.pdf)
Book 19-2.indb 134 2/21/2013 11:39:20 AM
املجلد التاسع عرشاملجلة الصحية لرشق املتوسطالعدد الثاين
135
Risk factors for human brucellosis in northern JordanM.N. Abo-Shehada 1 and M. Abu-Halaweh 2
ABSTRACT Little is known about the risk factors of human brucellosis in Jordan. A case–control study was conducted involving 56 Jordanians who had been treated for brucellosis and at least 3 matched controls for each case (n = 247). Matching was for sex, age, locality (the same village) and socioeconomic standard. Univariate and multivariate logistic regression analyses were used. In all, 17 risk factors were examined related to: contact with various livestock, milk and milk product consumption, drinking-water treatment and disease awareness. Most variables were associated with brucellosis in the univariate analysis but the final logistic model included only 4: milking sheep and goats (OR 3.5), consumption of raw feta cheese made from sheep and goat milk (OR 2.8) and consumption of cows’ milk (OR 0.4) and boiled feta cheese (OR 0.4). Small ruminant farmers need to be trained in safer milking practices and feta cheese making procedures.
1Department of Basic Veterinary Medical Sciences, Faculty of Veterinary Medicine, Jordan University of Science and Technology, Irbid, Jordan (Correspondence to M.N. Abo-Shehada: [email protected]).2Department of Biotechnology and Genetic Engineering, Faculty of Science, Philadelphia University, Jerash, Jordan.
Received: 24/05/09; accepted: 20/07/09
عوامل اختطار داء الربوسيالت البرشي يف شامل األردنحممود أبو شحادة، مروان أبو حالوة
اخلالصـة: إن املعلومات حول عوامل اختطار داء الربوسيالت يف األردن قليلة. وقد أجرى الباحثان دراسة للحاالت والشواهد شملت 56 أردنيا عوجلوا إلصابتهم بداء الربوسيالت مع ثالثة شواهد عىل األقل يف مقابل كل حالة، فبلغ عدد الشواهد 247، وكانت أوجه التقابل هي اجلنس والعمر واملوقع )يف نفس القرية(، واملعيار االجتامعي واالقتصادي. وباملجمل درس الباحثان 17 عامال من عوامل االختطار تتعلق باملخالطة ملختلف املوايش، واستهالك اللبن احلليب ومنتجات احلليب، ومعاجلة مياه الرشب والوعي باملرض. وكانت أكثر املتغريات ترتبط بداء الربوسيالت يف التحليل الوحيد ن أربعة متغريات فقط، هي: حلب النعاج والعنـزات )معدل األرجحية 3.5(، واستهالك جبن أبيض املتغري، إال أن النموذج اللوجستي النهائي يتضم)فيتا( غري مطبوخ مصنوع من ألبان النعاج والعنـزات )معدل األرجحية 2.8(، واستهالك حليب البقر )معدل األرجحية 0.4(، واستهالك اجلبن األبيض )فيتا( املطبوخ )معدل األرجحية 0.4(. ويرى الباحثان رضورة تدريب الفئة القليلة املتبقية من املزارعني حول املامرسات األكثر أمانا للحلب
وإلجراءات إعدادات اجلبنة )فيتا( البيضاء.
Facteurs de risque de la brucellose humaine dans le nord de la Jordanie
RÉSUMÉ Les données sur les facteurs de risque de la brucellose humaine en Jordanie sont rares. Une étude cas-témoins a été menée auprès de 56 Jordaniens traités pour une brucellose et d'au moins trois témoins appariés pour chaque cas (n = 247). L'appariement concernait le sexe, l'âge, la localité (le même village) et le statut socioéconomique. Des analyses de régression logistique univariées et multivariées ont été utilisées. En tout, 17 facteurs de risque liés aux domaines suivants ont été examinés : contact avec du bétail divers, consommation de lait et de produits laitiers, traitement de l'eau de boisson et connaissance de la maladie. La plupart des variables étaient associées à la brucellose dans l'analyse univariée mais le modèle de régression logistique final n'en a conservé que quatre : la traite des brebis et des chèvres (OR = 3,5), la consommation de fromage feta cru fait à partir de lait de brebis et de chèvre (OR = 2,8), la consommation de lait de vache (OR = 0,4) et de fromage feta bouilli (OR = 0,4). Les éleveurs de petits ruminants doivent être formés à des pratiques de traite et à des méthodes de fabrication du fromage feta plus sûres.
Book 19-2.indb 135 2/21/2013 11:39:20 AM
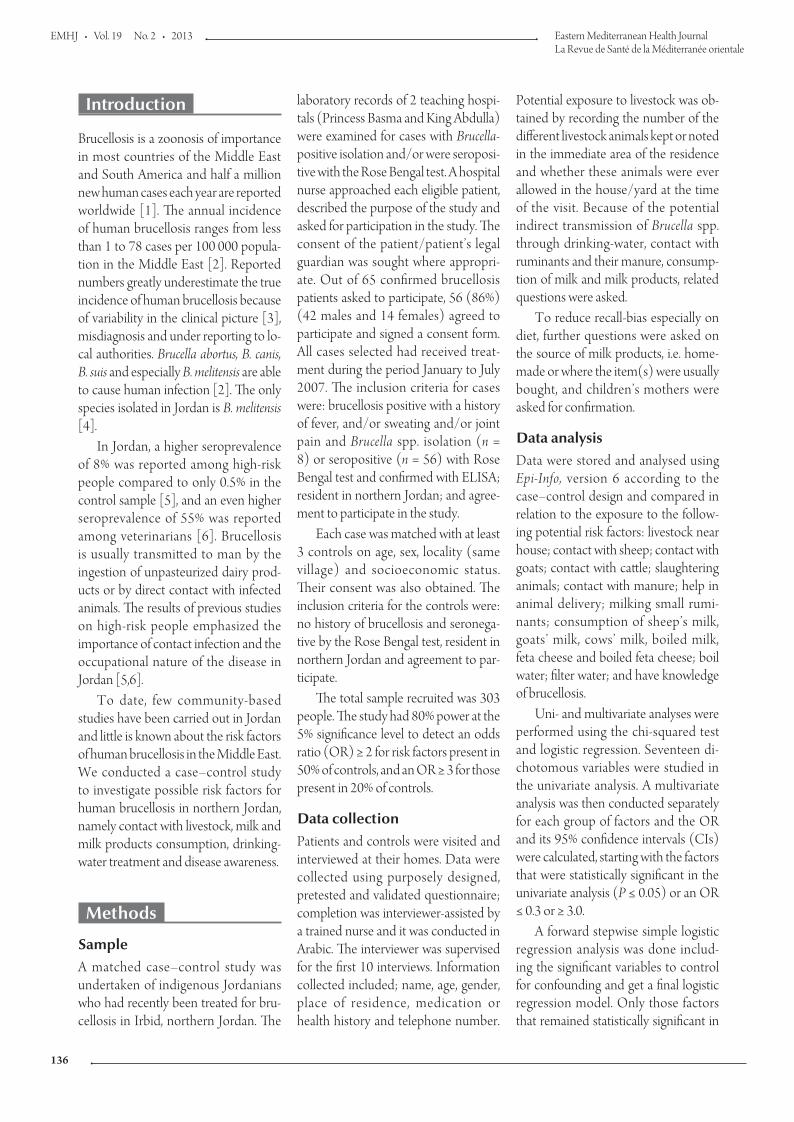
EMHJ • Vol. 19 No. 2 • 2013 Eastern Mediterranean Health JournalLa Revue de Santé de la Méditerranée orientale
136
Introduction
Brucellosis is a zoonosis of importance in most countries of the Middle East and South America and half a million new human cases each year are reported worldwide [1]. The annual incidence of human brucellosis ranges from less than 1 to 78 cases per 100 000 popula-tion in the Middle East [2]. Reported numbers greatly underestimate the true incidence of human brucellosis because of variability in the clinical picture [3], misdiagnosis and under reporting to lo-cal authorities. Brucella abortus, B. canis, B. suis and especially B. melitensis are able to cause human infection [2]. The only species isolated in Jordan is B. melitensis [4].
In Jordan, a higher seroprevalence of 8% was reported among high-risk people compared to only 0.5% in the control sample [5], and an even higher seroprevalence of 55% was reported among veterinarians [6]. Brucellosis is usually transmitted to man by the ingestion of unpasteurized dairy prod-ucts or by direct contact with infected animals. The results of previous studies on high-risk people emphasized the importance of contact infection and the occupational nature of the disease in Jordan [5,6].
To date, few community-based studies have been carried out in Jordan and little is known about the risk factors of human brucellosis in the Middle East. We conducted a case–control study to investigate possible risk factors for human brucellosis in northern Jordan, namely contact with livestock, milk and milk products consumption, drinking-water treatment and disease awareness.
Methods
SampleA matched case–control study was undertaken of indigenous Jordanians who had recently been treated for bru-cellosis in Irbid, northern Jordan. The
laboratory records of 2 teaching hospi-tals (Princess Basma and King Abdulla) were examined for cases with Brucella-positive isolation and/or were seroposi-tive with the Rose Bengal test. A hospital nurse approached each eligible patient, described the purpose of the study and asked for participation in the study. The consent of the patient/patient’s legal guardian was sought where appropri-ate. Out of 65 confirmed brucellosis patients asked to participate, 56 (86%) (42 males and 14 females) agreed to participate and signed a consent form. All cases selected had received treat-ment during the period January to July 2007. The inclusion criteria for cases were: brucellosis positive with a history of fever, and/or sweating and/or joint pain and Brucella spp. isolation (n = 8) or seropositive (n = 56) with Rose Bengal test and confirmed with ELISA; resident in northern Jordan; and agree-ment to participate in the study.
Each case was matched with at least 3 controls on age, sex, locality (same village) and socioeconomic status. Their consent was also obtained. The inclusion criteria for the controls were: no history of brucellosis and seronega-tive by the Rose Bengal test, resident in northern Jordan and agreement to par-ticipate.
The total sample recruited was 303 people. The study had 80% power at the 5% significance level to detect an odds ratio (OR) ≥ 2 for risk factors present in 50% of controls, and an OR ≥ 3 for those present in 20% of controls.
Data collectionPatients and controls were visited and interviewed at their homes. Data were collected using purposely designed, pretested and validated questionnaire; completion was interviewer-assisted by a trained nurse and it was conducted in Arabic. The interviewer was supervised for the first 10 interviews. Information collected included; name, age, gender, place of residence, medication or health history and telephone number.
Potential exposure to livestock was ob-tained by recording the number of the different livestock animals kept or noted in the immediate area of the residence and whether these animals were ever allowed in the house/yard at the time of the visit. Because of the potential indirect transmission of Brucella spp. through drinking-water, contact with ruminants and their manure, consump-tion of milk and milk products, related questions were asked.
To reduce recall-bias especially on diet, further questions were asked on the source of milk products, i.e. home-made or where the item(s) were usually bought, and children’s mothers were asked for confirmation.
Data analysisData were stored and analysed using Epi-Info, version 6 according to the case–control design and compared in relation to the exposure to the follow-ing potential risk factors: livestock near house; contact with sheep; contact with goats; contact with cattle; slaughtering animals; contact with manure; help in animal delivery; milking small rumi-nants; consumption of sheep’s milk, goats’ milk, cows’ milk, boiled milk, feta cheese and boiled feta cheese; boil water; filter water; and have knowledge of brucellosis.
Uni- and multivariate analyses were performed using the chi-squared test and logistic regression. Seventeen di-chotomous variables were studied in the univariate analysis. A multivariate analysis was then conducted separately for each group of factors and the OR and its 95% confidence intervals (CIs) were calculated, starting with the factors that were statistically significant in the univariate analysis (P ≤ 0.05) or an OR ≤ 0.3 or ≥ 3.0.
A forward stepwise simple logistic regression analysis was done includ-ing the significant variables to control for confounding and get a final logistic regression model. Only those factors that remained statistically significant in
Book 19-2.indb 136 2/21/2013 11:39:20 AM
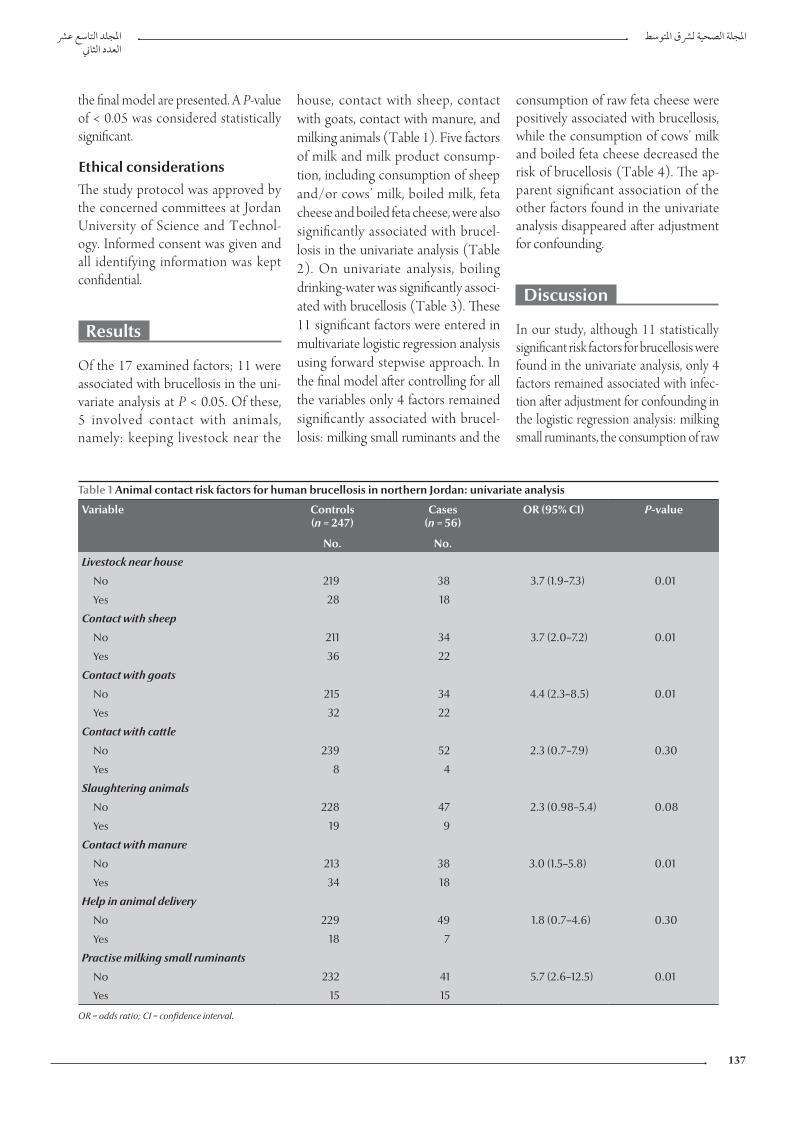
املجلد التاسع عرشاملجلة الصحية لرشق املتوسطالعدد الثاين
137
house, contact with sheep, contact with goats, contact with manure, and milking animals (Table 1). Five factors of milk and milk product consump-tion, including consumption of sheep and/or cows’ milk, boiled milk, feta cheese and boiled feta cheese, were also significantly associated with brucel-losis in the univariate analysis (Table 2). On univariate analysis, boiling drinking-water was significantly associ-ated with brucellosis (Table 3). These 11 significant factors were entered in multivariate logistic regression analysis using forward stepwise approach. In the final model after controlling for all the variables only 4 factors remained significantly associated with brucel-losis: milking small ruminants and the
consumption of raw feta cheese were positively associated with brucellosis, while the consumption of cows’ milk and boiled feta cheese decreased the risk of brucellosis (Table 4). The ap-parent significant association of the other factors found in the univariate analysis disappeared after adjustment for confounding.
Discussion
In our study, although 11 statistically significant risk factors for brucellosis were found in the univariate analysis, only 4 factors remained associated with infec-tion after adjustment for confounding in the logistic regression analysis: milking small ruminants, the consumption of raw
the final model are presented. A P-value of < 0.05 was considered statistically significant.
Ethical considerationsThe study protocol was approved by the concerned committees at Jordan University of Science and Technol-ogy. Informed consent was given and all identifying information was kept confidential.
Results
Of the 17 examined factors; 11 were associated with brucellosis in the uni-variate analysis at P < 0.05. Of these, 5 involved contact with animals, namely: keeping livestock near the
Table 1 Animal contact risk factors for human brucellosis in northern Jordan: univariate analysis
Variable Controls (n = 247)
Cases (n = 56)
OR (95% CI) P-value
No. No.
Livestock near house
No 219 38 3.7 (1.9–7.3) 0.01
Yes 28 18
Contact with sheep
No 211 34 3.7 (2.0–7.2) 0.01
Yes 36 22
Contact with goats
No 215 34 4.4 (2.3–8.5) 0.01
Yes 32 22
Contact with cattle
No 239 52 2.3 (0.7–7.9) 0.30
Yes 8 4
Slaughtering animals
No 228 47 2.3 (0.98–5.4) 0.08
Yes 19 9
Contact with manure
No 213 38 3.0 (1.5–5.8) 0.01
Yes 34 18
Help in animal delivery
No 229 49 1.8 (0.7–4.6) 0.30
Yes 18 7
Practise milking small ruminants
No 232 41 5.7 (2.6–12.5) 0.01
Yes 15 15
OR = odds ratio; CI = confidence interval.
Book 19-2.indb 137 2/21/2013 11:39:21 AM
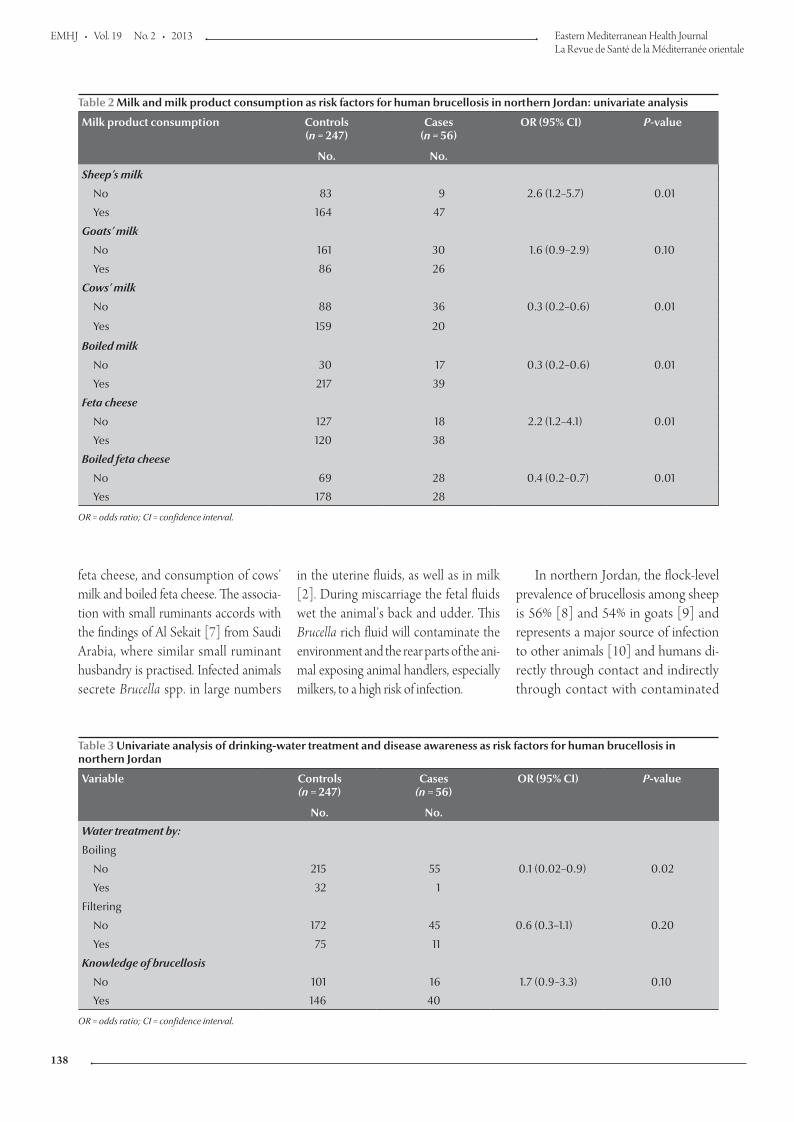
EMHJ • Vol. 19 No. 2 • 2013 Eastern Mediterranean Health JournalLa Revue de Santé de la Méditerranée orientale
138
feta cheese, and consumption of cows’ milk and boiled feta cheese. The associa-tion with small ruminants accords with the findings of Al Sekait [7] from Saudi Arabia, where similar small ruminant husbandry is practised. Infected animals secrete Brucella spp. in large numbers
in the uterine fluids, as well as in milk [2]. During miscarriage the fetal fluids wet the animal’s back and udder. This Brucella rich fluid will contaminate the environment and the rear parts of the ani-mal exposing animal handlers, especially milkers, to a high risk of infection.
In northern Jordan, the flock-level prevalence of brucellosis among sheep is 56% [8] and 54% in goats [9] and represents a major source of infection to other animals [10] and humans di-rectly through contact and indirectly through contact with contaminated
Table 2 Milk and milk product consumption as risk factors for human brucellosis in northern Jordan: univariate analysis
Milk product consumption Controls (n = 247)
Cases (n = 56)
OR (95% CI) P-value
No. No.
Sheep’s milk
No 83 9 2.6 (1.2–5.7) 0.01
Yes 164 47
Goats’ milk
No 161 30 1.6 (0.9–2.9) 0.10
Yes 86 26
Cows’ milk
No 88 36 0.3 (0.2–0.6) 0.01
Yes 159 20
Boiled milk
No 30 17 0.3 (0.2–0.6) 0.01
Yes 217 39
Feta cheese
No 127 18 2.2 (1.2–4.1) 0.01
Yes 120 38
Boiled feta cheese
No 69 28 0.4 (0.2–0.7) 0.01
Yes 178 28
OR = odds ratio; CI = confidence interval.
Table 3 Univariate analysis of drinking-water treatment and disease awareness as risk factors for human brucellosis in northern Jordan
Variable Controls (n = 247)
Cases (n = 56)
OR (95% CI) P-value
No. No.
Water treatment by:
Boiling
No 215 55 0.1 (0.02–0.9) 0.02
Yes 32 1
Filtering
No 172 45 0.6 (0.3–1.1) 0.20
Yes 75 11
Knowledge of brucellosis
No 101 16 1.7 (0.9–3.3) 0.10
Yes 146 40
OR = odds ratio; CI = confidence interval.
Book 19-2.indb 138 2/21/2013 11:39:21 AM
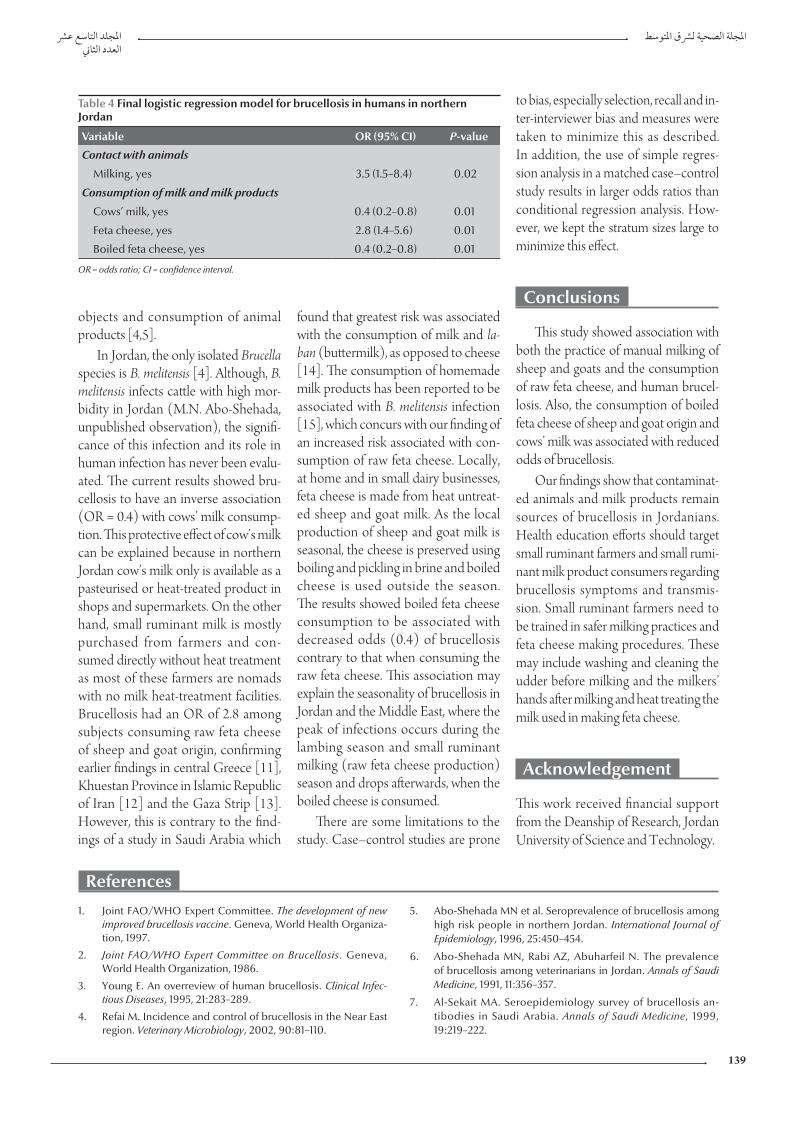
املجلد التاسع عرشاملجلة الصحية لرشق املتوسطالعدد الثاين
139
References
1. Joint FAO/WHO Expert Committee. The development of new improved brucellosis vaccine. Geneva, World Health Organiza-tion, 1997.
2. Joint FAO/WHO Expert Committee on Brucellosis. Geneva, World Health Organization, 1986.
3. Young E. An overreview of human brucellosis. Clinical Infec-tious Diseases, 1995, 21:283–289.
4. Refai M. Incidence and control of brucellosis in the Near East region. Veterinary Microbiology, 2002, 90:81–110.
5. Abo-Shehada MN et al. Seroprevalence of brucellosis among high risk people in northern Jordan. International Journal of Epidemiology, 1996, 25:450–454.
6. Abo-Shehada MN, Rabi AZ, Abuharfeil N. The prevalence of brucellosis among veterinarians in Jordan. Annals of Saudi Medicine, 1991, 11:356–357.
7. Al-Sekait MA. Seroepidemiology survey of brucellosis an-tibodies in Saudi Arabia. Annals of Saudi Medicine, 1999, 19:219–222.
objects and consumption of animal products [4,5].
In Jordan, the only isolated Brucella species is B. melitensis [4]. Although, B. melitensis infects cattle with high mor-bidity in Jordan (M.N. Abo-Shehada, unpublished observation), the signifi-cance of this infection and its role in human infection has never been evalu-ated. The current results showed bru-cellosis to have an inverse association (OR = 0.4) with cows’ milk consump-tion. This protective effect of cow’s milk can be explained because in northern Jordan cow’s milk only is available as a pasteurised or heat-treated product in shops and supermarkets. On the other hand, small ruminant milk is mostly purchased from farmers and con-sumed directly without heat treatment as most of these farmers are nomads with no milk heat-treatment facilities. Brucellosis had an OR of 2.8 among subjects consuming raw feta cheese of sheep and goat origin, confirming earlier findings in central Greece [11], Khuestan Province in Islamic Republic of Iran [12] and the Gaza Strip [13]. However, this is contrary to the find-ings of a study in Saudi Arabia which
found that greatest risk was associated with the consumption of milk and la-ban (buttermilk), as opposed to cheese [14]. The consumption of homemade milk products has been reported to be associated with B. melitensis infection [15], which concurs with our finding of an increased risk associated with con-sumption of raw feta cheese. Locally, at home and in small dairy businesses, feta cheese is made from heat untreat-ed sheep and goat milk. As the local production of sheep and goat milk is seasonal, the cheese is preserved using boiling and pickling in brine and boiled cheese is used outside the season. The results showed boiled feta cheese consumption to be associated with decreased odds (0.4) of brucellosis contrary to that when consuming the raw feta cheese. This association may explain the seasonality of brucellosis in Jordan and the Middle East, where the peak of infections occurs during the lambing season and small ruminant milking (raw feta cheese production) season and drops afterwards, when the boiled cheese is consumed.
There are some limitations to the study. Case–control studies are prone
to bias, especially selection, recall and in-ter-interviewer bias and measures were taken to minimize this as described. In addition, the use of simple regres-sion analysis in a matched case–control study results in larger odds ratios than conditional regression analysis. How-ever, we kept the stratum sizes large to minimize this effect.
Conclusions
This study showed association with both the practice of manual milking of sheep and goats and the consumption of raw feta cheese, and human brucel-losis. Also, the consumption of boiled feta cheese of sheep and goat origin and cows’ milk was associated with reduced odds of brucellosis.
Our findings show that contaminat-ed animals and milk products remain sources of brucellosis in Jordanians. Health education efforts should target small ruminant farmers and small rumi-nant milk product consumers regarding brucellosis symptoms and transmis-sion. Small ruminant farmers need to be trained in safer milking practices and feta cheese making procedures. These may include washing and cleaning the udder before milking and the milkers’ hands after milking and heat treating the milk used in making feta cheese.
Acknowledgement
This work received financial support from the Deanship of Research, Jordan University of Science and Technology.
Table 4 Final logistic regression model for brucellosis in humans in northern Jordan
Variable OR (95% CI) P-value
Contact with animals
Milking, yes 3.5 (1.5–8.4) 0.02
Consumption of milk and milk products
Cows’ milk, yes 0.4 (0.2–0.8) 0.01
Feta cheese, yes 2.8 (1.4–5.6) 0.01
Boiled feta cheese, yes 0.4 (0.2–0.8) 0.01
OR = odds ratio; CI = confidence interval.
Book 19-2.indb 139 2/21/2013 11:39:21 AM
EMHJ • Vol. 19 No. 2 • 2013 Eastern Mediterranean Health JournalLa Revue de Santé de la Méditerranée orientale
140
8. Al-Talafhah AH, Lafi SQ, Al-Tarazi Y. Epidemiology of ovine brucellosis in Awassi sheep in Northern Jordan. Preventive Veterinary Medicine, 2003, 60:297–306.
9. Al-Majali A. Seroepidemiology of caprine brucellosis in Jor-dan. Small Ruminant Research, 2005, 58:13–18.
10. Abo-Shehada MN. Seroprevalence of Brucella species in equids in Jordan. Veterinary Record, 2009, 165(9):267–268.
11. Minas M et al. Epidemiological and clinical aspects of human brucellosis in Central Greece. Japanese Journal of Infectious Diseases, 2007, 60:362–366.
12. Alavi S, Rafiei A, Nikkhooi A. The effect of lifestyle on brucel-losis among nomads in Khuzestan province of Iran. Pakistan Journal of Medical Sciences, 2007, 23:358–360.
13. Awad R. Human brucellosis in the Gaza Strip, Palestine. Eastern Mediterranean Health Journal, 1998, 4:225–233.
14. Cooper CW. Risk factors in transmission of brucellosis from animals to humans in Saudi Arabia. Transactions of the Royal Society of Tropical Medicine and Hygiene, 1992, 86:206–209.
15. Kolar J. Control of Brucella melitensis brucellosis in develop-ing countries. Annales de l'Institut Pasteur. Microbiology, 1987, 138(1):122–126.
Research priorities for zoonoses and marginalized infections: Technical Report of the TDR Disease Reference Group on Zoonoses and Marginalized Infectious Diseases of Poverty
The above-mentioned report provides a review and analysis of the research on zoonoses and marginalized infections which affect poor populations, and a list of research priorities to support disease control. The work is the output of the disease reference group on zoonoses and marginalized infectious diseases (DRG6), which is part of an independent "think tank" of international experts, established and funded by the Special Programme for Research and Training in Tropical Diseases (TDR), to identify key research priorities through the review of research evidence and input from stakeholder consultations.
The report covers a diverse range of diseases including zoonotic helminth protozoa, viral and bacterial infections considered to be neglected and associated with poverty. Disease-specific research issues are elaborated under individual disease sections and many common priorities are readily identified among the disease such as need for new and/or improved drugs and regimens, diagnostics and, where appropriate, vaccines. The disease specific priorities are described as micro priorities compared with the macro level priorities which will drive such policies as the need for improved surveillance; the need for intersectoral interaction between health, livestock, agriculture, natural resources and wildlife in tackling the zoonotic diseases; and the need for a true assessment of the burden of the zoonoses.
Further information about this and other WHO publications is available at: http://apps.who.int/bookorders/anglais/home1.jsp
Book 19-2.indb 140 2/21/2013 11:39:21 AM
املجلد التاسع عرشاملجلة الصحية لرشق املتوسطالعدد الثاين
141
Public awareness of and support for smoke-free legislation in Turkey: a national survey using the lot quality sampling techniqueB. Cakir,1 T. Buzgan,2 S. Com,2 H. Irmak,2 E. Aydin 2 and C. Arpad 1
ABSTRACT Six months after new legislation in Turkey banning smoking in all public places, a national survey was carried out to assess its implementation. This paper summarizes the main findings on the public’s awareness of and support for the new law. In a household interview survey of 32 972 adults representative of the Turkish adult population, a high proportion of both non-smokers and current smokers (91.4% and 67.2% respectively) strongly supported the new law. Knowledge about the health hazards of passive smoking and support for the law, however, were relatively lower among smokers than non-smokers. After controlling for smoking status, people with better knowledge about passive smoking were over 5 times more likely to support the new law. Tobacco control activities should be tailored to local needs, with a focus on increasing awareness about the health hazards of passive smoking. The study also demonstrated application of the lot quality sampling technique (LQT) for monitoring tobacco control activities in a national survey.
1Department of Public Health, Faculty of Medicine, Hacettepe University, Ankara, Turkey (Correspondence to B. Cakir: [email protected]).2General Directorate of Primary Health Care Services, Ministry of Health, Ankara, Turkey.
Received: 24/10/10; accepted: 18/04/11
ة الناس ودعمهم للترشيعات حول اخللو من الدخان يف تركيا: مسح وطني باستخدام تقنية االعتيان جلودة التشغيلة وعي عامباتو تشاكري، طوران بوزقان، رساج الدين تشوم، حسن إرماق، إيربو آيدن، جيالن آرباد
اخلالصـة: بعد مرور ستة أشهر عىل إصدار الترشيع اجلديد يف تركيا حلظر التدخني يف مجيع األماكن العامة، أجرى الباحثون مسحا لتقييم مدى التنفيذ. ة الناس والدعم الذي يقدمونه هلذا القانون اجلديد. وقد أجرى الباحثون مقابالت شملت م هذه الورقة تلخيصا للنتائج الرئيسية ملدى الوعي بني عام وتقد972 32 من السكان البالغني الذين يمثلون السكان البالغني األتراك، ووجدوا أن نسبة مرتفعة من كل من غري املدخنني )91.4%( ومن املدخنني يف الوقت
احلايل )67.2( تدعم القانون اجلديد بقوة. إال أن املعارف حول املخاطر الصحية للتدخني السلبي ودعم القانون كانت أخفض لدى املدخنني مما لدى غري املدخنني. وبعد التصحيح اخلاص بالوضع من حيث التدخني، كان احلاصلون عىل معارف أفضل حول التدخني السلبي أكثر دعام للقانون بمقدار يقرب من مخسة أضعاف؛ مما يعني أنه ينبغي تصميم أنشطة مكافحة التدخني لتناسب االحتياجات املحلية، مع الرتكيز عىل زيادة الوعي حول املخاطر الصحية
للتدخني السلبي. وقد عرضت الدراسة أيضا مثال عىل تطبيق تقنية االعتيان جلودة التشغيلة لرصد أنشطة مكافحة التبغ يف املسح الوطني.
Sensibilisation et soutien du public à la législation antitabac en Turquie : enquête nationale recourant à l'échantillonnage par lots pour l'assurance qualité
RÉSUMÉ Six mois après la nouvelle législation en Turquie interdisant le tabac dans tous les lieux publics, une enquête nationale a été menée pour évaluer sa mise en œuvre. Le présent article résume les principaux résultats sur la sensibilisation du public à la nouvelle législation antitabac et son soutien en la matière. Dans une enquête par entretien auprès des ménages portant sur 32 972 adultes représentatifs de la population adulte turque, une proportion élevée de non-fumeurs et de fumeurs (91,4 % et 67,2 % respectivement) soutenait fortement la nouvelle législation. Les connaissances sur les risques sanitaires du tabagisme passif et le soutien à la loi étaient toutefois plus faibles chez les fumeurs que chez les non-fumeurs. Après vérification du statut tabagique, les adultes ayant davantage de connaissances sur le tabagisme passif étaient plus de cinq fois plus susceptibles de soutenir la nouvelle loi. Il faut adapter les activités de lutte antitabac aux besoins locaux en faisant davantage de sensibilisation aux risques sanitaires du tabagisme passif. L'étude a aussi permis de mettre en application la technique d'échantillonnage par lots pour l'assurance qualité dans le cadre suivi du activités de lutte antitabac dans une enquête nationale.
Book 19-2.indb 141 2/21/2013 11:39:21 AM
EMHJ • Vol. 19 No. 2 • 2013 Eastern Mediterranean Health JournalLa Revue de Santé de la Méditerranée orientale
142
Introduction
In January 2008 Turkey passed new legislation on tobacco control, to be implemented in 2 phases. The first phase prohibited smoking inside all public places and workplaces in Turkey and went into effect in May 2008. The second phase, in July 2009, was to fur-ther prevent smoking inside all public places, including inside all restaurants, bar and cafes and their open spaces. The 18-month period between the 2 phases was expected to help in the readjust-ment process of smokers, as an adapta-tion period. Even a complete tobacco ban, however, may not be effective in tobacco control unless it is well-known and supported by the public. Observa-tions and general agreement over the 6 months after the enactment of the law seemed to indicate that there had been a dramatic decrease in smoking in public and workplaces. However, almost no scientific evidence was available about the impact of the new law [1] and, given that the second phase of the law would bring in more restrictions on smok-ing behaviour, it was felt essential to investigate the public’s knowledge about the new law, their support for it, the ef-fectiveness of earlier bans on tobacco advertising, promotion and sponsorship and the public’s compliance with the to-bacco control ordinances in general. The ultimate goal was to be fully prepared for potential obstacles in implementation of the second phase of the law.
A national survey was therefore carried out 6 months after the imple-mentation of the first phase of the 100% smoke-free law in Turkey. Of several available sampling methodologies, the authors chose to use the lot quality sam-pling technique (LQT), which is an easy, quick, low-cost method developed by the World Health Organization (WHO) [2–4]. While traditional sur-vey methods are preferable for providing information on prevalence rates at the regional and national levels, this method makes it possible to conduct surveys in
small geographical or population-based areas (“lots”) using small sample sizes in a cost-efficient way. To our knowledge, this is the first study using LQT in a tobacco-related survey. Details of the national survey and full set of analytical tables are presented elsewhere [5]. This paper summarizes the main findings on the public’s awareness of and support for the new smoke-free legislation and demonstrates application of the LQT for monitoring tobacco control ordi-nances in a national survey.
Methods
Study design and sampling strategyThe target population in this national, cross-sectional survey was all Turkish adults (aged 15 years or over) residing in all 81 cities, corresponding to about 51 million individuals. The confidence level was set at 95% and the accuracy level at ± 5%. The threshold levels to identify spe-cial subpopulations within each city with lower than acceptable rates were deter-mined by the Ministry of Health (MoH) as < 85% for the prevalence of awareness of the new smoke-free legislation and/or passive smoking and < 70% for the prevalence of support for the new law. Correspondingly, 384 fully-completed surveys in each of the 81 provinces were determined as the minimum sample size required [6]. The minimum num-ber of questionnaires to be completed in each province was rounded to 400, corresponding to a minimum of 32 400 interviews nationwide.
In each city, the lots were deter-mined by the provincial health directo-rate as the official/administrative units through which they provided educa-tional activities and/or interventions. Lots were chosen either as districts, community health centres, family medi-cine service areas and/or district health directorate service areas, as appropriate for the health care structure in the city. In addition, in each city, this sample size
of 400 was divided by the number of lots determined for that city; for each lot, the required minimum number calculated was rounded to the upper integer. Deci-sion values were calculated based on the topic of interest and the lot sample size in that particular city.
The most commonly used sampling frames were household registry records of the MoH, which are updated an-nually by local health officials. In cities where family medicine practice was in use (about 25 cities), family medicine listings were used as the sampling frame. In small rural areas where no listing was available (< 5% of the whole adult popu-lation), maps were used to identify areas for interviews. Given that individuals reached at houses were often females (even after 3 visits), city supervisors were requested to interview a randomly selected male when the selected male could not be reached after 3 house vis-its or to substitute a randomly chosen female for an unreached female; the complementary (second) lists were prepared preceding the field study ac-cordingly. It is noteworthy that there was no requirement for a gender bal-ance in selection of the master lists. For each incomplete interview, the reason for missing data was recorded together with the sex and age of the originally selected individual and this informa-tion was further used to compare and contrast the characteristics of missing and completed interviews.
Data collectionQuestionnaireData were collected via face-to-face interviews in households from each randomly selected individual using a standard questionnaire. This question-naire included a total of 43 questions on sociodemographic characteristics, knowledge about the health hazards of passive smoking, awareness about the new smoke-free legislation, level of support for the new legislation, expo-sure to any anti-smoking media mes-sages related to the publicizing of the
Book 19-2.indb 142 2/21/2013 11:39:21 AM

املجلد التاسع عرشاملجلة الصحية لرشق املتوسطالعدد الثاين
143
Statistical analysisThe major dependent variables in the study were knowledge about, support for and exposure to media messages about the new law. Other covariates included sociodemographic character-istics, smoking history, exposure to pas-sive smoking, thoughts and behaviours on given statements (on tobacco-use in the public, exposure to media messages, etc.), (specific enquiries on) level of approval/support for prohibition of smoking in eateries in indoor places but not in open areas and experience with violation of the new law over the preceding 6 months (if any).
The data analyses included frequency and percentage distributions and calcula-tion of prevalence rates with relevant standard errors (SE). Logistic regres-sion modelling was used for multivariate analysis: modelling was conducted for 5 outcomes of interest: current smoking status; having knowledge on the new law; support for the new law; having knowledge on health hazards of passive smoking; and exposure to at least one an-ti-smoking media message. Models 5 and 6 additionally included current smoking status of the respondents, while model 3 was controlled for current smoking status and the knowledge on the new law in ad-dition to the covariates in the first 3 mod-els. Based on the sampling characteristics, all analyses were weighted, where weights were calculated as inverses of the sam-pling fractions. Statistical significance of the differences was discussed based on 95% confidence intervals (CI) and SE, but chi-squared test P-values were also provided, with a pre-set alpha of 0.05. All analyses were conducted using the statistical software package SPSS, version 15, complex samples module.
Results
A total of 33 187 questionnaires were returned from the field and optically scanned. Questionnaires with unac-ceptable and unreliable entries, missing
more than 25% of the answers for 43 questions, with inconsistencies in con-trol questions and missing information on sex and age were excluded in statisti-cal analyses (n = 215 questionnaires). The results were therefore based on a total of 32 972 questionnaires, com-pleted by adults residing in all 81 cities throughout Turkey. The number of lots studied in each city ranged from 4 to 28.
Prevalence of smokingThe prevalence of current smoking was found to be 33.8% (SE 0.07%) in the Turkish adult population, correspond-ing to 46.9% (SE 0.01%) of all adult males (n = 16 064) and 20.9% (SD 0.08%) of all adult females (n = 16 908). Of all quitters (4812 males and 2835 fe-males), 9.6% (SE 1.0%) of male quitters and 14.7% (SE 1.6%) of female quitters reported that they stopped smoking within 6 months prior to the survey, meaning that they stopped smoking after the enactment of the new smoke-free legislation.
Awareness of and support for the new smoke-free lawThe rates of awareness about the new law, knowledge about health hazards of passive smoking and the level of sup-port for the new law were studied by sex and current smoking status. Overall 57.7% of smokers and 47.7% of non-smokers had heard/read a great deal about the smoke-free law and 34.3% of smokers and 42.5% of non-smokers knew that passive smoking was a very serious risk to people’s health (Table 1). More non-smokers (91.4%) than smokers (67.2%) were strongly in fa-vour of the new law; an additional 5.3% of non-smokers and 19.8% of smokers were somewhat in favour of the new law (Table 1).
Respondents were asked about their experience of seeing/reading/hearing messages about the new law in the me-dia and/or in workplaces/indoor places where smoking was prohibited over the
new regulations and frequency of use of smoke-free eating places after the legislation. Inquiries were based both on open-ended questions and on opinions provided for given statements and/or conditions. For example, study par-ticipants rated their approval level (on a 5-level Likert scale) for statements, such as “The new legislation prohibiting smoking in workplaces will never work in Turkey—people will continue to smoke wherever they want” or “The new legislation prohibiting smoking in workplaces is a good idea because exposure to secondhand smoke is a direct threat to our health”.
FieldworkTo train provincial team leaders, pro-vincial supervisors, regional supervisors and central supervisors a set of 3 con-secutive “training of trainers” sessions of 2–3 days were held at 3 separate loca-tions (to guarantee full attendance of the trainees). These trainings provided technical instructions on determination of lots, sample selection and other city-specific preparations based on docu-ments brought from 81 provinces and introduced the field manuals.
Prior to the field study, a pretest was conducted in the Ankara area on a convenience sample of rural and urban residents, aged 15 years or above. Su-pervisors travelled to the sites prior to initiation of the fieldwork, assisted with city-specific preparations, supervised the local interviewers, field control-lers and provincial supervisors (from provincial health directorates) and also helped them with managing problems during data collection and/or transfer of the questionnaires to Ankara.
Field interviewers were chosen from among local nurses and midwives (as interviewers) and physicians (as controllers or provincial supervisors). Local interviewers, controllers and su-pervisors were trained on how to select a household and they could request assistance from the study centre (by phone) if required.
Book 19-2.indb 143 2/21/2013 11:39:21 AM
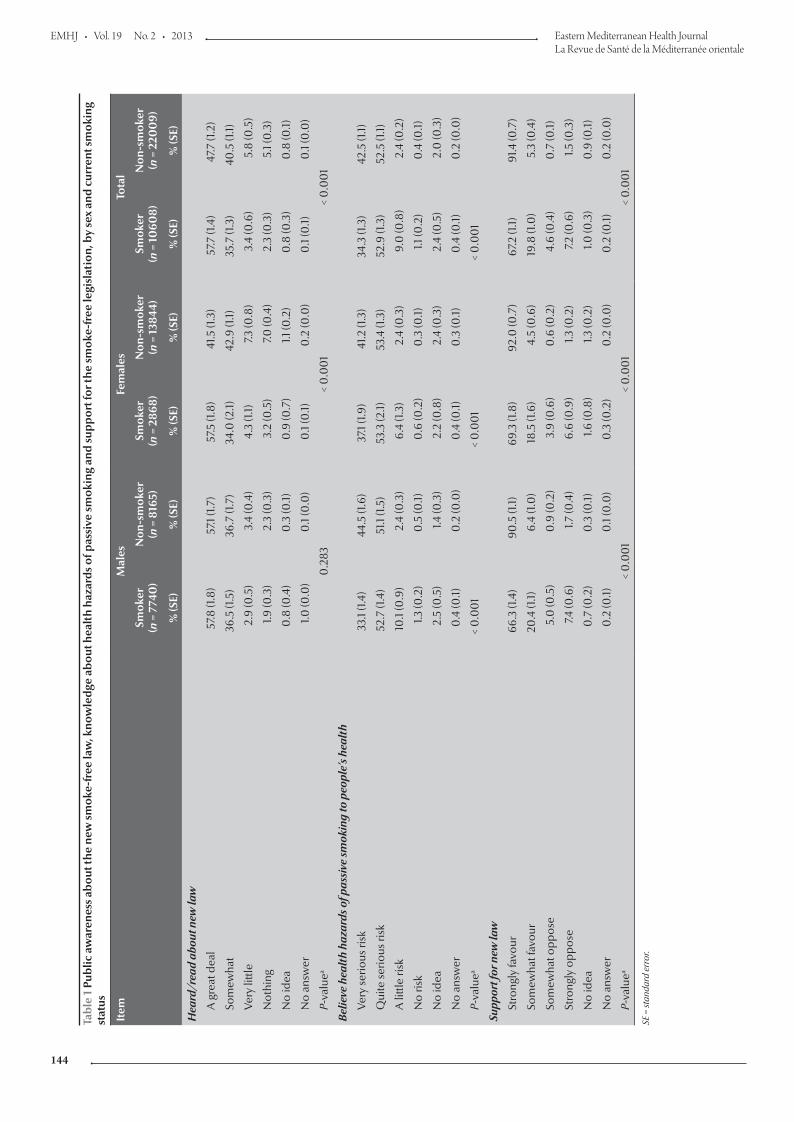
EMHJ • Vol. 19 No. 2 • 2013 Eastern Mediterranean Health JournalLa Revue de Santé de la Méditerranée orientale
144
Tabl
e 1
Publ
ic a
war
enes
s ab
out t
he n
ew s
mok
e-fr
ee la
w, k
now
ledg
e ab
out h
ealt
h ha
zard
s of
pas
sive
sm
okin
g an
d su
ppor
t for
the
smok
e-fr
ee le
gisl
atio
n, b
y se
x an
d cu
rren
t sm
okin
g st
atus
Item
Mal
esFe
mal
esTo
tal
Smok
er(n
= 7
740
)N
on-s
mok
er(n
= 8
165)
Smok
er(n
= 2
868)
Non
-sm
oker
(n =
138
44)
Smok
er(n
= 10
608)
Non
-sm
oker
(n =
220
09)
% (S
E)%
(SE)
% (S
E)%
(SE)
% (S
E)%
(SE)
Hea
rd/r
ead
abou
t new
law
A g
reat
dea
l57
.8 (1
.8)
57.1
(1.7)
57.5
(1.8
)41
.5 (1
.3)
57.7
(1.4
)47
.7 (1
.2)
Som
ewha
t36
.5 (1
.5)
36.7
(1.7
)34
.0 (2
.1)42
.9 (1
.1)35
.7 (1
.3)
40.5
(1.1)
Very
littl
e2.
9 (0
.5)
3.4
(0.4
)4.
3 (1.
1)7.3
(0.8
)3.
4 (0
.6)
5.8
(0.5
)
Not
hing
1.9 (0
.3)
2.3
(0.3
)3.
2 (0
.5)
7.0 (0
.4)
2.3
(0.3
)5.
1 (0
.3)
No
idea
0.8
(0.4
)0
.3 (0
.1)0
.9 (0
.7)
1.1 (0
.2)
0.8
(0.3
)0
.8 (0
.1)
No
answ
er1.0
(0.0
)0
.1 (0
.0)
0.1
(0.1)
0.2
(0.0
)0
.1 (0
.1)0
.1 (0
.0)
P-va
luea
0.2
83<
0.0
01
< 0
.00
1
Belie
ve h
ealt
h ha
zard
s of p
assi
ve sm
okin
g to
peo
ple’
s hea
lth
Very
serio
us ri
sk33
.1 (1.
4)44
.5 (1
.6)
37.1
(1.9)
41.2
(1.3
)34
.3 (1
.3)
42.5
(1.1)
Qui
te se
rious
risk
52.7
(1.4
)51
.1 (1.
5)53
.3 (2
.1)53
.4 (1
.3)
52.9
(1.3
)52
.5 (1
.1)
A li
ttle
risk
10.1
(0.9
)2.
4 (0
.3)
6.4
(1.3)
2.4
(0.3
)9.
0 (0
.8)
2.4
(0.2
)
No
risk
1.3 (0
.2)
0.5
(0.1)
0.6
(0.2
)0
.3 (0
.1)1.1
(0.2
)0
.4 (0
.1)
No
idea
2.5
(0.5
)1.4
(0.3
)2.
2 (0
.8)
2.4
(0.3
)2.
4 (0
.5)
2.0
(0.3
)
No
answ
er0
.4 (0
.1)0
.2 (0
.0)
0.4
(0.1)
0.3
(0.1)
0.4
(0.1)
0.2
(0.0
)
P-va
luea
< 0
.00
1<
0.0
01
< 0
.00
1
Supp
ort f
or n
ew la
w
Stro
ngly
favo
ur66
.3 (1
.4)
90.5
(1.1)
69.3
(1.8
)92
.0 (0
.7)
67.2
(1.1)
91.4
(0.7
)
Som
ewha
t fav
our
20.4
(1.1)
6.4
(1.0
)18
.5 (1
.6)
4.5
(0.6
)19
.8 (1
.0)
5.3
(0.4
)
Som
ewha
t opp
ose
5.0
(0.5
)0
.9 (0
.2)
3.9
(0.6
)0
.6 (0
.2)
4.6
(0.4
)0
.7 (0
.1)
Stro
ngly
opp
ose
7.4 (0
.6)
1.7 (0
.4)
6.6
(0.9
)1.3
(0.2
)7.2
(0.6
)1.5
(0.3
)
No
idea
0.7
(0.2
)0
.3 (0
.1)1.6
(0.8
)1.3
(0.2
)1.0
(0.3
)0
.9 (0
.1)
No
answ
er0
.2 (0
.1)0
.1 (0
.0)
0.3
(0.2
)0
.2 (0
.0)
0.2
(0.1)
0.2
(0.0
)
P-va
luea
< 0
.00
1<
0.0
01
< 0
.00
1
SE =
stan
dard
err
or.
Book 19-2.indb 144 2/21/2013 11:39:21 AM
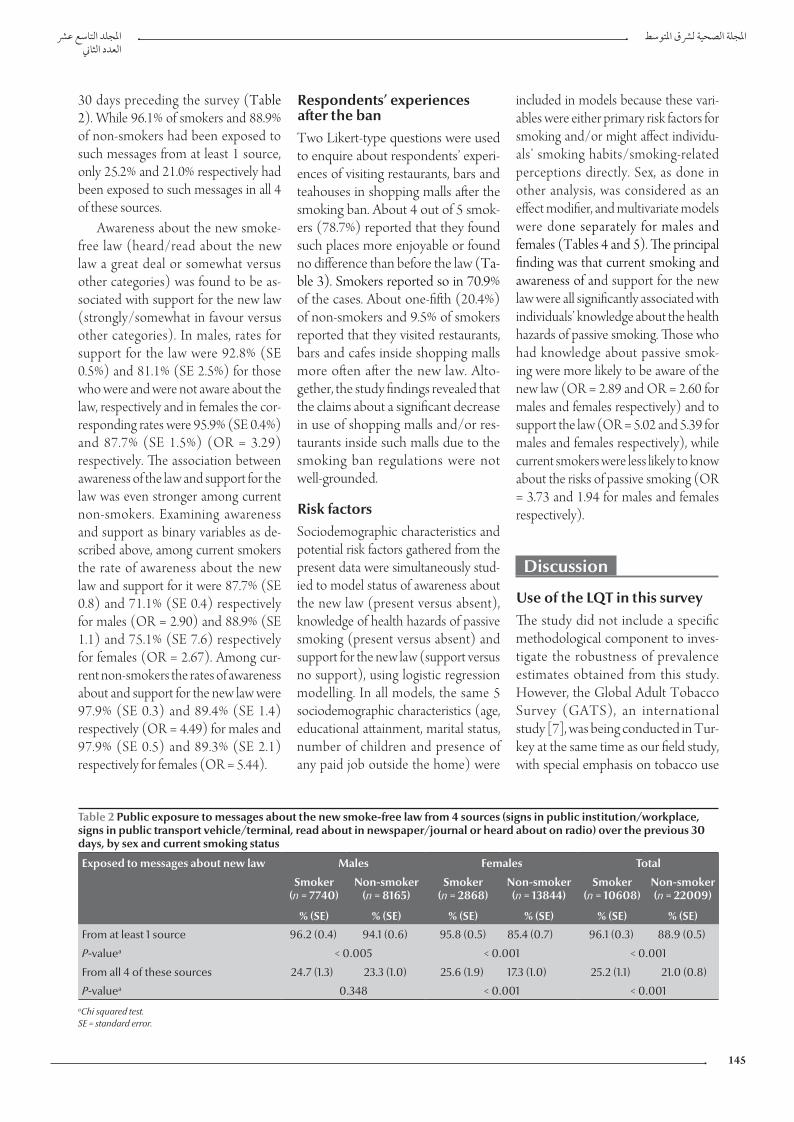
املجلد التاسع عرشاملجلة الصحية لرشق املتوسطالعدد الثاين
145
30 days preceding the survey (Table 2). While 96.1% of smokers and 88.9% of non-smokers had been exposed to such messages from at least 1 source, only 25.2% and 21.0% respectively had been exposed to such messages in all 4 of these sources.
Awareness about the new smoke-free law (heard/read about the new law a great deal or somewhat versus other categories) was found to be as-sociated with support for the new law (strongly/somewhat in favour versus other categories). In males, rates for support for the law were 92.8% (SE 0.5%) and 81.1% (SE 2.5%) for those who were and were not aware about the law, respectively and in females the cor-responding rates were 95.9% (SE 0.4%) and 87.7% (SE 1.5%) (OR = 3.29) respectively. The association between awareness of the law and support for the law was even stronger among current non-smokers. Examining awareness and support as binary variables as de-scribed above, among current smokers the rate of awareness about the new law and support for it were 87.7% (SE 0.8) and 71.1% (SE 0.4) respectively for males (OR = 2.90) and 88.9% (SE 1.1) and 75.1% (SE 7.6) respectively for females (OR = 2.67). Among cur-rent non-smokers the rates of awareness about and support for the new law were 97.9% (SE 0.3) and 89.4% (SE 1.4) respectively (OR = 4.49) for males and 97.9% (SE 0.5) and 89.3% (SE 2.1) respectively for females (OR = 5.44).
Respondents’ experiences after the banTwo Likert-type questions were used to enquire about respondents’ experi-ences of visiting restaurants, bars and teahouses in shopping malls after the smoking ban. About 4 out of 5 smok-ers (78.7%) reported that they found such places more enjoyable or found no difference than before the law (Ta-ble 3). Smokers reported so in 70.9% of the cases. About one-fifth (20.4%) of non-smokers and 9.5% of smokers reported that they visited restaurants, bars and cafes inside shopping malls more often after the new law. Alto-gether, the study findings revealed that the claims about a significant decrease in use of shopping malls and/or res-taurants inside such malls due to the smoking ban regulations were not well-grounded.
Risk factorsSociodemographic characteristics and potential risk factors gathered from the present data were simultaneously stud-ied to model status of awareness about the new law (present versus absent), knowledge of health hazards of passive smoking (present versus absent) and support for the new law (support versus no support), using logistic regression modelling. In all models, the same 5 sociodemographic characteristics (age, educational attainment, marital status, number of children and presence of any paid job outside the home) were
included in models because these vari-ables were either primary risk factors for smoking and/or might affect individu-als’ smoking habits/smoking-related perceptions directly. Sex, as done in other analysis, was considered as an effect modifier, and multivariate models were done separately for males and females (Tables 4 and 5). The principal finding was that current smoking and awareness of and support for the new law were all significantly associated with individuals’ knowledge about the health hazards of passive smoking. Those who had knowledge about passive smok-ing were more likely to be aware of the new law (OR = 2.89 and OR = 2.60 for males and females respectively) and to support the law (OR = 5.02 and 5.39 for males and females respectively), while current smokers were less likely to know about the risks of passive smoking (OR = 3.73 and 1.94 for males and females respectively).
Discussion
Use of the LQT in this surveyThe study did not include a specific methodological component to inves-tigate the robustness of prevalence estimates obtained from this study. However, the Global Adult Tobacco Survey (GATS), an international study [7], was being conducted in Tur-key at the same time as our field study, with special emphasis on tobacco use
Table 2 Public exposure to messages about the new smoke-free law from 4 sources (signs in public institution/workplace, signs in public transport vehicle/terminal, read about in newspaper/journal or heard about on radio) over the previous 30 days, by sex and current smoking status
Exposed to messages about new law Males Females Total
Smoker(n = 7740)
Non-smoker(n = 8165)
Smoker(n = 2868)
Non-smoker(n = 13844)
Smoker(n = 10608)
Non-smoker(n = 22009)
% (SE) % (SE) % (SE) % (SE) % (SE) % (SE)
From at least 1 source 96.2 (0.4) 94.1 (0.6) 95.8 (0.5) 85.4 (0.7) 96.1 (0.3) 88.9 (0.5)
P-valuea < 0.005 < 0.001 < 0.001
From all 4 of these sources 24.7 (1.3) 23.3 (1.0) 25.6 (1.9) 17.3 (1.0) 25.2 (1.1) 21.0 (0.8)
P-valuea 0.348 < 0.001 < 0.001aChi squared test. SE = standard error.
Book 19-2.indb 145 2/21/2013 11:39:21 AM
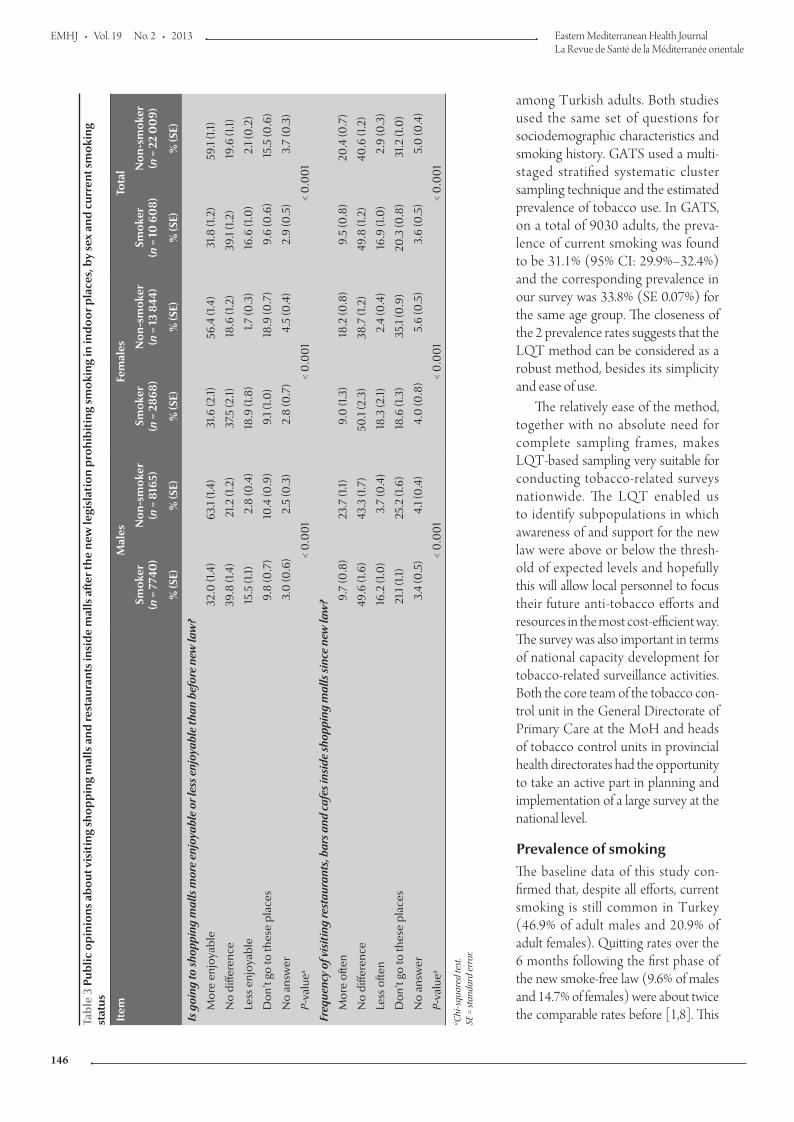
EMHJ • Vol. 19 No. 2 • 2013 Eastern Mediterranean Health JournalLa Revue de Santé de la Méditerranée orientale
146
among Turkish adults. Both studies used the same set of questions for sociodemographic characteristics and smoking history. GATS used a multi-staged stratified systematic cluster sampling technique and the estimated prevalence of tobacco use. In GATS, on a total of 9030 adults, the preva-lence of current smoking was found to be 31.1% (95% CI: 29.9%–32.4%) and the corresponding prevalence in our survey was 33.8% (SE 0.07%) for the same age group. The closeness of the 2 prevalence rates suggests that the LQT method can be considered as a robust method, besides its simplicity and ease of use.
The relatively ease of the method, together with no absolute need for complete sampling frames, makes LQT-based sampling very suitable for conducting tobacco-related surveys nationwide. The LQT enabled us to identify subpopulations in which awareness of and support for the new law were above or below the thresh-old of expected levels and hopefully this will allow local personnel to focus their future anti-tobacco efforts and resources in the most cost-efficient way. The survey was also important in terms of national capacity development for tobacco-related surveillance activities. Both the core team of the tobacco con-trol unit in the General Directorate of Primary Care at the MoH and heads of tobacco control units in provincial health directorates had the opportunity to take an active part in planning and implementation of a large survey at the national level.
Prevalence of smokingThe baseline data of this study con-firmed that, despite all efforts, current smoking is still common in Turkey (46.9% of adult males and 20.9% of adult females). Quitting rates over the 6 months following the first phase of the new smoke-free law (9.6% of males and 14.7% of females) were about twice the comparable rates before [1,8]. This Ta
ble
3 P
ublic
op
inio
ns a
bo
ut v
isit
ing
sho
pp
ing
mal
ls a
nd re
stau
rant
s in
sid
e m
alls
aft
er th
e ne
w le
gisl
atio
n p
rohi
bit
ing
smo
king
in in
do
or p
lace
s, b
y se
x an
d c
urre
nt s
mo
king
st
atus
Item
Mal
esFe
mal
esTo
tal
Smok
er(n
= 7
740
)N
on-s
mok
er(n
= 8
165)
Smok
er(n
= 2
868)
Non
-sm
oker
(n =
13
844)
Smok
er(n
= 1
0 6
08)
Non
-sm
oker
(n =
22
00
9)
% (S
E)%
(SE)
% (S
E)%
(SE)
% (S
E)%
(SE)
Is g
oing
to sh
oppi
ng m
alls
mor
e en
joya
ble
or le
ss e
njoy
able
than
bef
ore
new
law
?
Mor
e en
joya
ble
32.0
(1.4
)63
.1 (1.
4)31
.6 (2
.1)56
.4 (1
.4)
31.8
(1.2
)59
.1 (1.
1)
No
diffe
renc
e39
.8 (1
.4)
21.2
(1.2
)37
.5 (2
.1)18
.6 (1
.2)
39.1
(1.2)
19.6
(1.1)
Less
enj
oyab
le15
.5 (1
.1)2.
8 (0
.4)
18.9
(1.8
)1.7
(0.3
)16
.6 (1
.0)
2.1 (
0.2
)
Don
’t go
to th
ese
plac
es9.
8 (0
.7)
10.4
(0.9
)9.
1 (1.0
)18
.9 (0
.7)
9.6
(0.6
)15
.5 (0
.6)
No
answ
er3.
0 (0
.6)
2.5
(0.3
)2.
8 (0
.7)
4.5
(0.4
)2.
9 (0
.5)
3.7
(0.3
)
P-va
luea
< 0
.00
1<
0.0
01
< 0
.00
1
Freq
uenc
y of
vis
itin
g re
stau
rant
s, b
ars a
nd c
afes
insi
de sh
oppi
ng m
alls
sinc
e ne
w la
w?
Mor
e of
ten
9.7
(0.8
)23
.7 (1
.1)9.
0 (1
.3)
18.2
(0.8
)9.
5 (0
.8)
20.4
(0.7
)
No
diffe
renc
e49
.6 (1
.6)
43.3
(1.7
)50
.1 (2
.3)
38.7
(1.2
)49
.8 (1
.2)
40.6
(1.2
)
Less
ofte
n16
.2 (1
.0)
3.7
(0.4
)18
.3 (2
.1)2.
4 (0
.4)
16.9
(1.0
)2.
9 (0
.3)
Don
’t go
to th
ese
plac
es21
.1 (1.
1)25
.2 (1
.6)
18.6
(1.3
)35
.1 (0
.9)
20.3
(0.8
)31
.2 (1
.0)
No
answ
er3.
4 (0
.5)
4.1 (
0.4
)4.
0 (0
.8)
5.6
(0.5
)3.
6 (0
.5)
5.0
(0.4
)
P-va
luea
< 0
.00
1<
0.0
01
< 0
.00
1a C
hi-s
quar
ed te
st.
SE =
stan
dard
err
or.
Book 19-2.indb 146 2/21/2013 11:39:22 AM
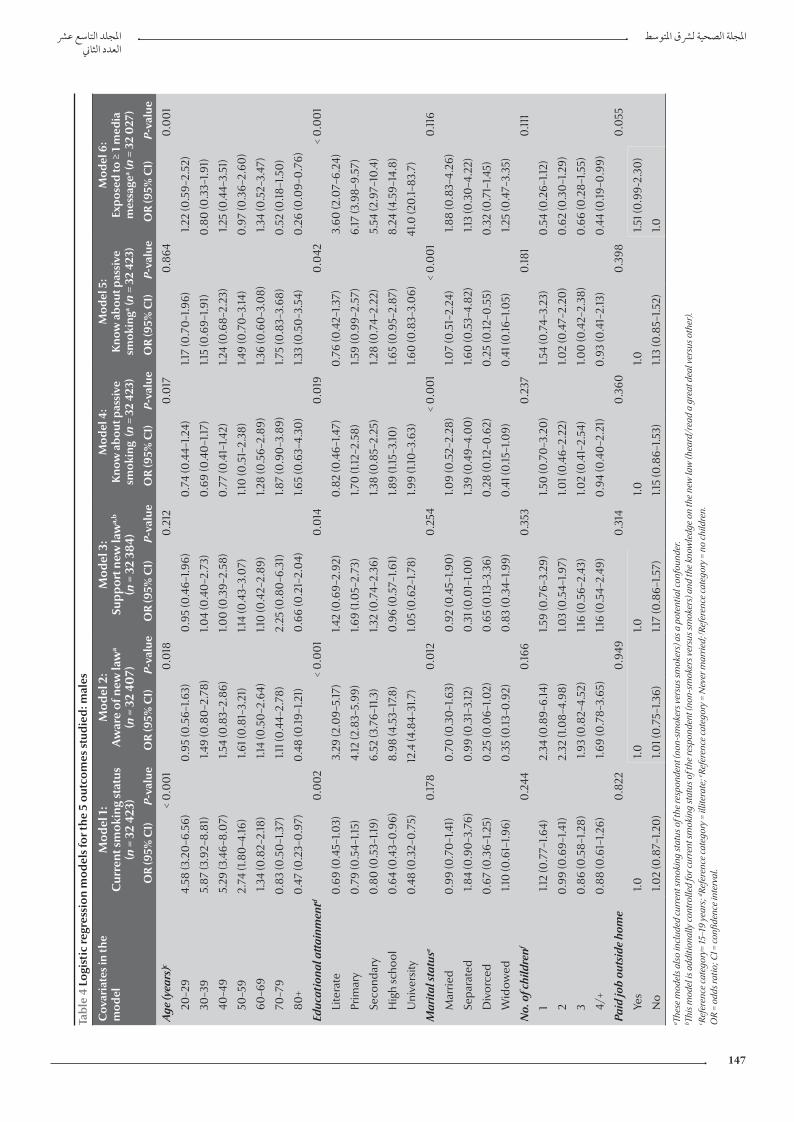
املجلد التاسع عرشاملجلة الصحية لرشق املتوسطالعدد الثاين
147
Tabl
e 4
Logi
stic
regr
essi
on m
odel
s fo
r the
5 o
utco
mes
stu
died
: mal
es
Cov
aria
tes
in th
e m
odel
Mod
el 1
: C
urre
nt s
mok
ing
stat
us
(n =
32
423)
Mod
el 2
: A
war
e of
new
law
a
(n =
32
407)
Mod
el 3
:Su
ppor
t new
law
a,b
(n =
32
384)
Mod
el 4
: K
now
abo
ut p
assi
ve
smok
ing
(n =
32
423)
Mod
el 5
: K
now
abo
ut p
assi
ve
smok
inga
(n =
32
423)
Mod
el 6
: Ex
pose
d to
≥ 1
med
ia
mes
sage
a (n =
32
027
)
OR
(95%
CI)
P-va
lue
OR
(95%
CI)
P-va
lue
OR
(95%
CI)
P-va
lue
OR
(95%
CI)
P-va
lue
OR
(95%
CI)
P-va
lue
OR
(95%
CI)
P-va
lue
Age
(yea
rs)c
< 0
.00
10
.018
0.2
120
.017
0.8
640
.00
1
20–2
94.
58 (3
.20
–6.5
6)0
.95
(0.5
6–1.6
3)0
.95
(0.4
6–1.9
6)0
.74
(0.4
4–1.2
4)1.1
7 (0
.70
–1.9
6)1.2
2 (0
.59–
2.52
)
30–3
95.
87 (3
.92–
8.81
)1.4
9 (0
.80
–2.7
8)1.0
4 (0
.40
–2.7
3)0
.69
(0.4
0–1
.17)
1.15
(0.6
9–1.9
1)0
.80
(0.3
3–1.9
1)
40–4
95.
29 (3
.46–
8.0
7)1.5
4 (0
.83–
2.86
)1.0
0 (0
.39–
2.58
)0
.77
(0.4
1–1.4
2)1.2
4 (0
.68–
2.23
)1.2
5 (0
.44–
3.51
)
50–5
92.
74 (1
.80
–4.16
)1.6
1 (0
.81–
3.21
)1.1
4 (0
.43–
3.0
7)1.1
0 (0
.51–
2.38
)1.4
9 (0
.70
–3.14
)0
.97
(0.3
6–2.
60)
60–6
91.3
4 (0
.82–
2.18
)1.1
4 (0
.50
–2.6
4)1.1
0 (0
.42–
2.89
)1.2
8 (0
.56–
2.89
)1.3
6 (0
.60
–3.0
8)1.3
4 (0
.52–
3.47
)
70–7
90
.83
(0.5
0–1
.37)
1.11 (
0.4
4–2.
78)
2.25
(0.8
0–6
.31)
1.87
(0.9
0–3
.89)
1.75
(0.8
3–3.
68)
0.5
2 (0
.18–1
.50
)
80+
0.4
7 (0
.23–
0.9
7)0
.48
(0.19
–1.2
1)0
.66
(0.2
1–2.
04)
1.65
(0.6
3–4.
30)
1.33
(0.5
0–3
.54)
0.2
6 (0
.09–
0.7
6)
Educ
atio
nal a
ttai
nmen
td0
.00
2<
0.0
01
0.0
140
.019
0.0
42<
0.0
01
Lite
rate
0.6
9 (0
.45–
1.03)
3.29
(2.0
9–5.
17)
1.42
(0.6
9–2.
92)
0.8
2 (0
.46–
1.47)
0.7
6 (0
.42–
1.37)
3.60
(2.0
7–6.
24)
Prim
ary
0.7
9 (0
.54–
1.15)
4.12
(2.8
3–5.
99)
1.69
(1.0
5–2.
73)
1.70
(1.12
–2.5
8)1.5
9 (0
.99–
2.57
)6.
17 (3
.98–
9.57
)
Seco
ndar
y0
.80
(0.5
3–1.1
9)6.
52 (3
.76–
11.3
)1.3
2 (0
.74–
2.36
)1.3
8 (0
.85–
2.25
)1.2
8 (0
.74–
2.22
)5.
54 (2
.97–
10.4
)
Hig
h sc
hool
0.6
4 (0
.43–
0.9
6)8.
98 (4
.53–
17.8
)0
.96
(0.5
7–1.6
1)1.8
9 (1.
15–3
.10)
1.65
(0.9
5–2.
87)
8.24
(4.5
9–14
.8)
Uni
vers
ity0
.48
(0.3
2–0
.75)
12.4
(4.8
4–31
.7)
1.05
(0.6
2–1.7
8)1.9
9 (1.
10–3
.63)
1.60
(0.8
3–3.
06)
41.0
(20
.1–83
.7)
Mar
ital s
tatu
se0
.178
0.0
120
.254
< 0
.00
1<
0.0
01
0.11
6
Mar
ried
0.9
9 (0
.70
–1.4
1)0
.70
(0.3
0–1
.63)
0.9
2 (0
.45–
1.90
)1.0
9 (0
.52–
2.28
)1.0
7 (0
.51–
2.24
)1.8
8 (0
.83–
4.26
)
Sepa
rate
d1.8
4 (0
.90
–3.7
6)0
.99
(0.3
1–3.
12)
0.3
1 (0
.01–
1.00
)1.3
9 (0
.49–
4.0
0)
1.60
(0.5
3–4.
82)
1.13
(0.3
0–4
.22)
Div
orce
d0
.67
(0.3
6–1.2
5)0
.25
(0.0
6–1.0
2)0
.65
(0.13
–3.3
6)0
.28
(0.12
–0.6
2)0
.25
(0.12
–0.5
5)0
.32
(0.7
1–1.4
5)
Wid
owed
1.10
(0.6
1–1.9
6)0
.35
(0.13
–0.9
2)0
.83
(0.3
4–1.9
9)0
.41 (
0.15
–1.0
9)0
.41 (
0.16
–1.0
5)1.2
5 (0
.47–
3.35
)
No.
of c
hild
renf
0.2
440
.166
0.3
530
.237
0.18
10
.111
11.1
2 (0
.77–
1.64)
2.34
(0.8
9–6.
14)
1.59
(0.7
6–3.
29)
1.50
(0.7
0–3
.20
)1.5
4 (0
.74–
3.23
)0
.54
(0.2
6–1.1
2)
20
.99
(0.6
9–1.4
1)2.
32 (1
.08–
4.98
)1.0
3 (0
.54–
1.97)
1.01 (
0.4
6–2.
22)
1.02
(0.4
7–2.
20)
0.6
2 (0
.30
–1.2
9)
30
.86
(0.5
8–1.2
8)1.9
3 (0
.82–
4.52
)1.1
6 (0
.56–
2.43
)1.0
2 (0
.41–
2.54
)1.0
0 (0
.42–
2.38
)0
.66
(0.2
8–1.5
5)
4/+
0.8
8 (0
.61–
1.26)
1.69
(0.7
8–3.
65)
1.16
(0.5
4–2.
49)
0.9
4 (0
.40
–2.2
1)0
.93
(0.4
1–2.
13)
0.4
4 (0
.19–0
.99)
Paid
job
outs
ide
hom
e0
.822
0.9
490
.314
0.3
600
.398
0.0
55
Yes
1.01.0
1.01.0
1.01.5
1 (0
.99-
2.30
)
No
1.02
(0.8
7–1.2
0)
1.01 (
0.7
5–1.3
6)1.1
7 (0
.86–
1.57)
1.15
(0.8
6–1.5
3)1.1
3 (0
.85–
1.52)
1.0a Th
ese
mod
els a
lso
incl
uded
cur
rent
smok
ing
stat
us o
f the
resp
onde
nt (n
on-s
mok
ers v
ersu
s sm
oker
s) a
s a p
oten
tial c
onfo
unde
r.
b This
mod
el is
add
ition
ally
cont
rolle
d fo
r cur
rent
smok
ing
stat
us o
f the
resp
onde
nt (n
on-s
mok
ers v
ersu
s sm
oker
s) a
nd th
e kn
owle
dge
on th
e ne
w la
w (h
eard
/rea
d a
grea
t dea
l ver
sus o
ther
).
c Refe
renc
e ca
tego
ry=
15–1
9 ye
ars;
d Refe
renc
e ca
tego
ry =
illit
erat
e; e Re
fere
nce
cate
gory
= N
ever
mar
ried;
f Refe
renc
e ca
tego
ry =
no
child
ren.
O
R =
odds
ratio
; CI =
confi
denc
e in
terv
al.
Book 19-2.indb 147 2/21/2013 11:39:22 AM
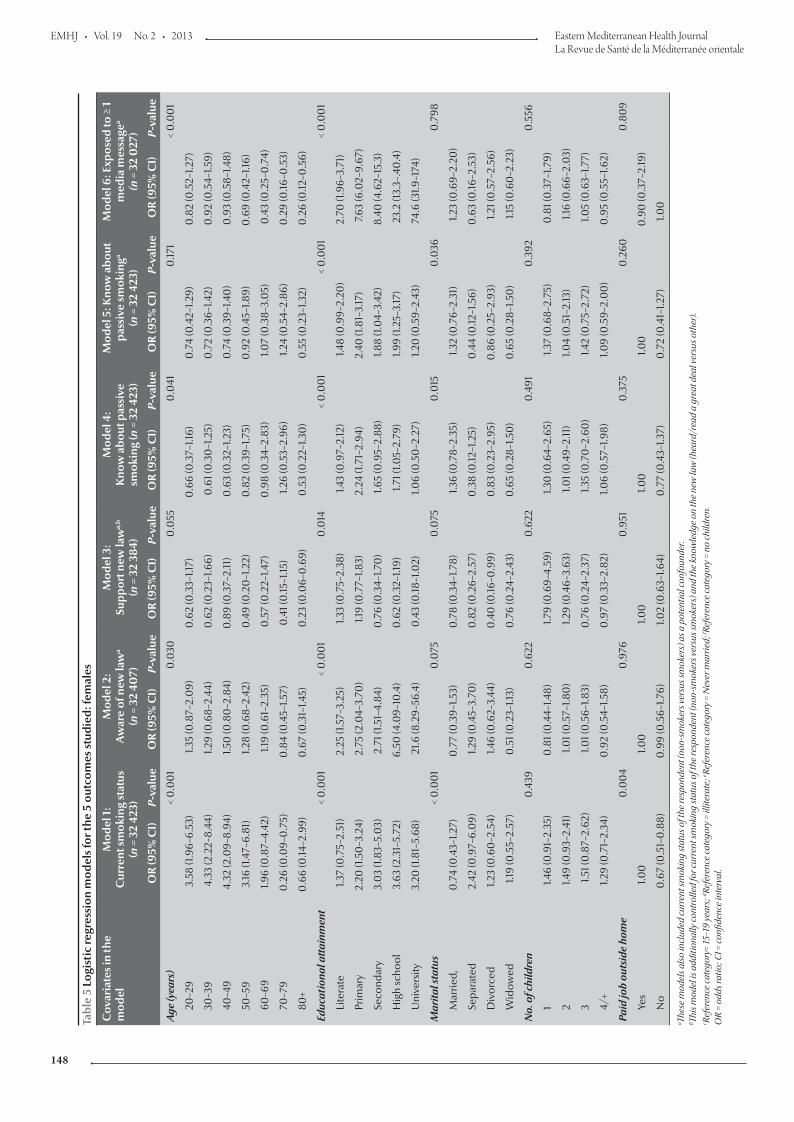
EMHJ • Vol. 19 No. 2 • 2013 Eastern Mediterranean Health JournalLa Revue de Santé de la Méditerranée orientale
148
Tabl
e 5
Logi
stic
regr
essi
on m
odel
s fo
r the
5 o
utco
mes
stu
died
: fem
ales
Cov
aria
tes
in th
e m
odel
Mod
el 1
:C
urre
nt s
mok
ing
stat
us
(n =
32
423)
Mod
el 2
:A
war
e of
new
law
a
(n =
32
407)
Mod
el 3
:Su
ppor
t new
law
a,b
(n =
32
384)
Mod
el 4
:K
now
abo
ut p
assi
ve
smok
ing
(n =
32
423)
Mod
el 5
: Kno
w a
bout
pa
ssiv
e sm
okin
ga
(n =
32
423)
Mod
el 6
: Exp
osed
to ≥
1
med
ia m
essa
gea
(n =
32
027
)
OR
(95%
CI)
P-va
lue
OR
(95%
CI)
P-va
lue
OR
(95%
CI)
P-va
lue
OR
(95%
CI)
P-va
lue
OR
(95%
CI)
P-va
lue
OR
(95%
CI)
P-va
lue
Age
(yea
rs)
< 0
.00
10
.030
0.0
550
.041
0.17
1
< 0
.00
1
20–2
93.
58 (1
.96–
6.53
)1.3
5 (0
.87–
2.0
9)0
.62
(0.3
3–1.1
7)0
.66
(0.3
7–1.1
6)0
.74
(0.4
2–1.2
9)0
.82
(0.5
2–1.2
7)
30–3
94.
33 (2
.22–
8.44
)1.2
9 (0
.68–
2.44
)0
.62
(0.2
3–1.6
6)0
.61 (
0.3
0–1
.25)
0.7
2 (0
.36–
1.42)
0.9
2 (0
.54–
1.59)
40–4
94.
32 (2
.09–
8.94
)1.5
0 (0
.80
–2.8
4)0
.89
(0.3
7–2.
11)
0.6
3 (0
.32–
1.23)
0.7
4 (0
.39–
1.40
)0
.93
(0.5
8–1.4
8)
50–5
93.
16 (1
.47–
6.81
)1.2
8 (0
.68–
2.42
)0
.49
(0.2
0–1
.22)
0.8
2 (0
.39–
1.75)
0.9
2 (0
.45–
1.89)
0.6
9 (0
.42–
1.16)
60–6
91.9
6 (0
.87–
4.42
)1.1
9 (0
.61–
2.35
)0
.57
(0.2
2–1.4
7)0
.98
(0.3
4–2.
83)
1.07
(0.3
8–3.
05)
0.4
3 (0
.25–
0.7
4)
70–7
90
.26
(0.0
9–0
.75)
0.8
4 (0
.45–
1.57)
0.4
1 (0
.15–1
.15)
1.26
(0.5
3–2.
96)
1.24
(0.5
4–2.
86)
0.2
9 (0
.16–0
.53)
80+
0.6
6 (0
.14–2
.99)
0.6
7 (0
.31–
1.45)
0.2
3 (0
.06–
0.6
9)0
.53
(0.2
2–1.3
0)
0.5
5 (0
.23–
1.32)
0.2
6 (0
.12–0
.56)
Educ
atio
nal a
ttai
nmen
t<
0.0
01
< 0
.00
10
.014
< 0
.00
1<
0.0
01
< 0
.00
1
Lite
rate
1.37
(0.7
5–2.
51)
2.25
(1.5
7–3.
25)
1.33
(0.7
5–2.
38)
1.43
(0.9
7–2.
12)
1.48
(0.9
9–2.
20)
2.70
(1.9
6–3.
71)
Prim
ary
2.20
(1.5
0–3
.24)
2.75
(2.0
4–3.
70)
1.19
(0.7
7–1.8
3)2.
24 (1
.71–
2.94
)2.
40 (1
.81–
3.17
)7.6
3 (6
.02–
9.67
)
Seco
ndar
y3.
03
(1.83
–5.0
3)2.
71 (1
.51–
4.84
)0
.76
(0.3
4–1.7
0)
1.65
(0.9
5–2.
88)
1.88
(1.0
4–3.
42)
8.40
(4.6
2–15
.3)
Hig
h sc
hool
3.63
(2.3
1–5.
72)
6.50
(4.0
9–10
.4)
0.6
2 (0
.32–
1.19)
1.71 (
1.05–
2.79
)1.9
9 (1.
25–3
.17)
23.2
(13.
3–.4
0.4
)
Uni
vers
ity3.
20 (1
.81–
5.68
)21
.6 (8
.29–
56.4
)0
.43
(0.18
–1.0
2)1.0
6 (0
.50
–2.2
7)1.2
0 (0
.59–
2.43
)74
.6 (3
1.9–1
74)
Mar
ital s
tatu
s<
0.0
01
0.0
750
.075
0.0
150
.036
0.7
98
Mar
ried,
0.7
4 (0
.43–
1.27)
0.7
7 (0
.39–
1.53)
0.7
8 (0
.34–
1.78)
1.36
(0.7
8–2.
35)
1.32
(0.7
6–2.
31)
1.23
(0.6
9–2.
20)
Sepa
rate
d2.
42 (0
.97–
6.0
9)1.2
9 (0
.45–
3.70
)0
.82
(0.2
6–2.
57)
0.3
8 (0
.12–1
.25)
0.4
4 (0
.12–1
.56)
0.6
3 (0
.16–2
.53)
Div
orce
d1.2
3 (0
.60
–2.5
4)1.4
6 (0
.62–
3.44
)0
.40
(0.16
–0.9
9)0
.83
(0.2
3–2.
95)
0.8
6 (0
.25–
2.93
)1.2
1 (0
.57–
2.56
)
Wid
owed
1.19
(0.5
5–2.
57)
0.5
1 (0
.23–
1.13)
0.7
6 (0
.24–
2.43
)0
.65
(0.2
8–1.5
0)
0.6
5 (0
.28–
1.50
)1.1
5 (0
.60
–2.2
3)
No.
of c
hild
ren
0.4
390
.622
0.6
220
.491
0.3
920
.556
11.4
6 (0
.91–
2.35
)0
.81 (
0.4
4–1.4
8)1.7
9 (0
.69–
4.59
)1.3
0 (0
.64–
2.65
)1.3
7 (0
.68–
2.75
)0
.81 (
0.3
7–1.7
9)
21.4
9 (0
.93–
2.41
)1.0
1 (0
.57–
1.80
)1.2
9 (0
.46–
3.63
)1.0
1 (0
.49–
2.11
)1.0
4 (0
.51–
2.13
)1.1
6 (0
.66–
2.0
3)
31.5
1 (0
.87–
2.62
)1.0
1 (0
.56–
1.83)
0.7
6 (0
.24–
2.37
)1.3
5 (0
.70
–2.6
0)
1.42
(0.7
5–2.
72)
1.05
(0.6
3–1.7
7)
4/+
1.29
(0.7
1–2.
34)
0.9
2 (0
.54–
1.58)
0.9
7 (0
.33–
2.82
)1.0
6 (0
.57–
1.98)
1.09
(0.5
9–2.
00
)0
.95
(0.5
5–1.6
2)
Paid
job
outs
ide
hom
e0
.00
40
.976
0.9
510
.375
0.2
600
.80
9
Yes
1.00
1.00
1.00
1.00
1.00
0.9
0 (0
.37–
2.19
)
No
0.6
7 (0
.51–
0.8
8)0
.99
(0.5
6–1.7
6)1.0
2 (0
.63–
1.64)
0.7
7 (0
.43–
1.37)
0.7
2 (0
.41–
1.27)
1.00
a Thes
e m
odel
s als
o in
clud
ed c
urre
nt sm
okin
g st
atus
of t
he re
spon
dent
(non
-sm
oker
s ver
sus s
mok
ers)
as a
pot
entia
l con
foun
der.
b Th
is m
odel
is a
dditi
onal
ly co
ntro
lled
for c
urre
nt sm
okin
g st
atus
of t
he re
spon
dent
(non
-sm
oker
s ver
sus s
mok
ers)
and
the
know
ledg
e on
the
new
law
(hea
rd/r
ead
a gr
eat d
eal v
ersu
s oth
er).
c Re
fere
nce
cate
gory
= 15
–19
year
s; d Re
fere
nce
cate
gory
= il
liter
ate;
e Refe
renc
e ca
tego
ry =
Nev
er m
arrie
d; f Re
fere
nce
cate
gory
= n
o ch
ildre
n.
OR
= od
ds ra
tio; C
I = co
nfide
nce
inte
rval
.
Book 19-2.indb 148 2/21/2013 11:39:22 AM
املجلد التاسع عرشاملجلة الصحية لرشق املتوسطالعدد الثاين
149
phase of the programme included ef-forts to increase the public awareness about the health hazards of smoking and its economic burden and an in-crease in the number of smoking cessa-tion clinics. Further studies are needed to investigate whether smoking bans, especially those in the workplace, affect quit rates directly.
Awareness of and attitudes to the new national tobacco control lawsThe main findings of this survey re-vealed that the rate of awareness about the new smoke-free law was fairly high among the general public (47.7% of non-smokers and 57.7% of smokers knew about the law) and the law was supported by a high proportion of Turkish adults, even among current smokers (91.4% of non-smokers and 67.2% of smokers strongly favoured the new law). Furthermore, it is noteworthy that, controlling for smoking status, one of the strongest, yet modifiable, risk fac-tors among the studied predictors of awareness and attitudes was the general public’s knowledge about the health hazards of passive smoking. Those who knew about the dangers of pas-sive smoking were nearly 3 times more likely to know about the law and were over 5 times more likely to support the new law. Current smokers were significantly less likely to have knowl-edge about the health effects of passive smoking than were smokers. This high-lights the importance of increasing the awareness of the general public about the health threats of passive smoking in future interventional activities. Iden-tification of subpopulations with less knowledge and/or support for the law will lead to effective targeted plans for intervention.
The new 100% smoke-free law banned smoking in closed areas in Turkey such as shopping malls. It is important to note that 31.2% of non-smokers reported that they did not go to eating places in shopping malls and
about 20.3% of smokers did not go to shopping malls at all. Thus studies con-ducted to those visiting shopping malls, as is usually the case when monitor-ing tobacco control activities, cannot capture about 20%–30% of the general adult population and inferences based on data from this method will therefore be biased.
Regardless of sex, there was a posi-tive and dose–response association between educational attainment and awareness about the new law and about the risks of passive smoking to smoking-related media messages, matching our expectation that bet-ter educated people may have more access to the media than their coun-terparts with lower educational attain-ment. The content and transmission of anti-smoking media messages may need to be improved for better use by the population with low educational attainment.
Last but not least, the study re-vealed, at a national level, that indi-viduals did not change their frequency of visits either to shopping malls or to the eateries inside such malls after the ban. Even more importantly, 59.1% of non-smokers and 31.8% of smok-ers agreed that they found smoke-free shopping malls “more enjoyable than before” and 20.4% of non-smokers and about 9.5% of smokers even reported increasing their visits to smoke-free restaurants in shopping malls after May 2008. The results can be seen as important in putting an end to the discussion of unfair business in the hospitality sector after the smoking ban in May 2008, in favour of the eater-ies outside the indoor areas.
Limitations of the studyIt is important to note that the findings about the awareness of the new smoke-free law were based on self-reports; evaluation of the actual content of this knowledge was beyond the scope of this study. In evaluating the level of support for the new law all participants were
first informed about the new law, with a standard sentence explaining it. Later, each individual was asked whether s/he was in favour of the law or opposed it. Therefore, no “differential” misclas-sification bias (if any) was expected due to a difference (if any) in knowledge on the new law and/or current smok-ing status. Besides a general statement about the support for the new 100% smoke-free law, several statements re-garding smoking bans were presented to the interviewed individuals and their opinions were obtained.
Conclusion
This study has provided important findings about the awareness of the general public in Turkey about the new 100% smoke-free law and the level of compliance with the law. Even more important for the international literature, we demonstrate the use of the LQT in a tobacco-related survey in a developing country. We believe that conducting similar surveys would be of great benefit in developing countries not only for tobacco control surveil-lance, but to develop national capac-ity to provide evidence on a variety of other health topics of interest at the local level.
Acknowledgements
This survey was supported technically and/or financially by the World Health Organization- Tobacco Free Initiative, World Health Organization Regional Office for Europe, World Health Or-ganization Country Office (Turkey) and the US Centers for Disease Control and Prevention; and the Turkish Min-istry of Health, Primary Health Care General Directorate, Tobacco Control Unit, within the scope of Bloomberg Initiative to Reduce Tobacco Use.
The authors would like to thank Cevdet Erdol, Jo Bickmayer, Nichole
Book 19-2.indb 149 2/21/2013 11:39:22 AM
EMHJ • Vol. 19 No. 2 • 2013 Eastern Mediterranean Health JournalLa Revue de Santé de la Méditerranée orientale
150
Veatch, Stephen Hamill, Wick C. Warren, Juliette Lee, Veronica Lee, Meltem Sengelen, Meliksah Ertem, Pi-nar Pazarli, Osman Elbek and Zeynep
Ayfer Aytemur. Hayati Baykan, Hü-seyin İlter, Serdar Acar, Derya Özkaya, Irmak Arpad, Gokturk Demirel, Toker Erguder; and all physicians, nurses,
midwives, health technicians and drivers who took part and all other colleagues at the provincial health de-partments.
References
1. Sferrazza L et al. Using polling for smoke-free implementa-tion and enforcement in Turkey. Paper presented that the 14th World Conference on Tobacco or Health, Mumbai, 8–12 March 2009.
2. Robertson S. Monitoring immunization services using the lot quality technique. Geneva, World Health Organization, 1996 (WHO/VRD/TRAM/96.01).
3. Lemeshow S, Taber S. Lot quality assurance sampling: single- and double-sampling plans. World Health Statistics Quarterly, 1991, 44:115–132.
4. Robertson SE, Valadez JJ. Global review of health care surveys using lot quality assurance sampling (LQAS), 1984–2004. Social Science and Medicine, 2006, 63:1648–1660.
5. Buzgan T et al., eds. Initial 6-month evaluation of the effects of the 100 percent-smoke-free legislation and health hazards of passive smoking: and evaluation of the coverage of the related mass media campaign. Ankara, Turkey, Ministry of Health, xxxx .
6. Sample LQ software package. Brixton Health [website] (http://www.brixtonhealth.com/index.html, accessed 22 July 2012).
7. Global Adult Tobacco Survey.Turkey report—2010. Anka-ra, General Directorate of Primary Health Care, Ministry of Health, 2010 (MoH Publication No. 803).
8. Bilir N et al. Tobacco Control in Turkey Copenhagen, Den-mark, World Health Organization Regional Office for Europe, 2009.
Book 19-2.indb 150 2/21/2013 11:39:22 AM
املجلد التاسع عرشاملجلة الصحية لرشق املتوسطالعدد الثاين
151
Blood lead level among Palestinian schoolchildren: a pilot studyA.F. Sawalha,1 R.O. Wright,2 D.C. Bellinger,2 C. Amarasiriwardean,2 A.S. Abu-Taha 3 and W.M. Sweileh 3
ABSTRACT In Palestine, chronic exposure to lead has not been adequately addressed as a problem for children. To assess the exposure of Palestinian schoolchildren, we surveyed blood lead levels in 3 schools in Nablus city and collected demographic and clinical data. Blood samples were collected from 178 children (140 boys, 38 girls), age range 6–8 years. The overall mean blood lead level was 3.2 (SD 2.4) µg/dL, and 4.5% of children had levels above 10 µg/dL. Blood lead levels were significantly higher among children living in refugee camps near industrial/high traffic regions than among children living in residential areas of the city. Blood lead levels were positively correlated with family size (r = 0.15) and negatively correlated with household area (r = –0.18). Blood lead levels among these Palestinian schoolchildren were higher than those of other countries where leaded gasoline has been banned and seemed to be higher in more economically deprived children.
1Poison Control and Drug Information Centre; 3College of Pharmacy, An-Najah National University, Nablus, Palestine (Correspondence to A.F. Sawalha: [email protected]).2Harvard Medical School and School of Public Health, Boston, Massachusetts, United States of America.
Received: 22/11/11; accepted: 05/02/12
مستوى رصاص الدم بني أطفال املدارس الفلسطينيني: دراسة ارتياديةأنسام صواحلة، روبرت رايت، ديفيد بيلينجر، تشيرتا اماراسرييواردين، أدهم ابو طه، وليد صويلح
مسحا الباحثون أجرى وقد األطفال. لدى املشكالت أحد باعتباره الكافية بالدراسة فلسطني يف للرصاص املزمن ض التعر حيظ مل اخلالصـة: ض أطفال املدارس الفلسطينيني ملستويات الرصاص يف الدم يف ثالث مدارس يف مدينة نابلس، ومجعوا املعطيات الديموغرافية والرسيرية لتقييم تعرللرصاص. فجمعوا عينات الدم من 178 طفال )140 فتى و38 فتاة(، وهم من جمموعة عمرية ترتاوح بني 6 و8 سنوات. ووجدوا أن املستوى الوسطي اإلمجايل للرصاص يف الدم 3.2 مكغ/دييس لرت ± 2.4، وأن 4.5% من األطفال كان لدهيم مستويات تزيد عىل 10 مكغ/دييس لرت. وقد كانت مستويات باحلركة مكتظة أو صناعية مناطق من القريبة النازحني خميامت يف يعيشون الذين األطفال لدى إحصائيا به يعتد بمقدار أعىل الدم يف الرصاص املرورية، ولدى األطفال الذين يعيشون يف مناطق سكنية ضمن املدينة. وقد كانت مستويات الرصاص يف الدم تـرتابط ترابطا إجيابيا مع حجم األرسة)r = 0.15( وترابطا سلبيا مع مساحة املسكن )r =0.18(. وكانت مستويات الرصاص يف الدم لدى أطفال املدارس الفلسطينية أعىل مما هي عليه يف
البلدان األخرى التي حيظر فيها الغازولني املعالج بالرصاص، ويبدو أنه أعىل لدى األطفال املحرومني اقتصاديا.
Concentration sanguine de plomb chez des écoliers palestiniens : une étude pilote
RÉSUMÉ En Palestine, l'exposition chronique au plomb n'a pas été abordée adéquatement comme un problème chez l'enfant. Pour évaluer l'exposition des écoliers palestiniens, nous avons recherché les taux de plomb sanguins chez des élèves de trois écoles de la ville de Naplouse et avons recueilli les données démographiques et cliniques. Des échantillons de sang ont été recueillis auprès de 178 enfants (140 garçons, 38 filles), âgés de six à huit ans. La concentration de plomb moyenne globale dans le sang était de 3,2 µg/dl (E.T. 2,4), et 4,5 % des enfants présentaient des niveaux supérieurs à 10 µg/dl. Les taux de plomb sanguins étaient nettement plus élevés chez les enfants vivant dans des camps de réfugiés près de zones industrielles/de circulation intense que chez les enfants vivant dans des zones résidentielles de la ville. Les taux de plomb dans le sang étaient positivement corrélés à la taille de la famille (r = 0,15) et négativement corrélés au nombre de mètres carrés du logement familial (r = –0,18). Les taux de plomb dans le sang chez ces écoliers palestiniens étaient supérieurs à ceux d'autres pays où le carburant contenant plomb a été interdit. Ils semblaient aussi supérieurs chez les enfants plus faibles économiquement.
Book 19-2.indb 151 2/21/2013 11:39:22 AM
EMHJ • Vol. 19 No. 2 • 2013 Eastern Mediterranean Health JournalLa Revue de Santé de la Méditerranée orientale
152
Introduction
Lead is a toxic heavy metal that is ubiq-uitous in the environment as a result of industrialization. Exposure occurs primarily through ingestion and inhala-tion [1,2]. In the Middle East, the major reported sources of lead exposure are industrial, including smelters, battery factories and radiator repair shops; flour from traditional stone mills; and the occasional burning of wastes [3,4]. In Palestine, leaded gasoline used by automobiles remains the major source of environmental lead pollution. These exposures can be prevented by increas-ing public health awareness and by implementing measures to phase out sources of lead from the environment.
Lead poisoning frequently goes un-recognized. Elevated blood lead levels (BLL) can adversely affect many organ systems including mental development [5], haemoglobin level [6], kidney function [7], cardiovascular function in adults and reproduction in women [8]. It has been reported that even slightly elevated levels can result in reduced IQ, learning disabilities and behavioural problems [9,10]. The United States Centers for Disease Control and Pre-vention (CDC) recommends a BLL of 10 µg/dL or above as the level of concern at which public health action needs to be initiated. The CDC consider low-dose exposure to lead poisoning in children to be a preventable paediatric health problem and have emphasized the need for primary prevention [11]. Therefore screening for elevated BLL and prevention measures are recom-mended [11], including universal screening, if the prevalence of elevated BLL in the community is unknown.
In Palestine, chronic exposure to lead has not been adequately addressed as a problem for schoolchildren of differ-ent socioeconomic strata. Health care providers do not routinely screen chil-dren for lead exposure, and so no data are available to evaluate BLL and the ex-tent of lead exposure in schoolchildren.
Furthermore, baseline data about BLL in children are important to inform advocacy efforts to phase out leaded gasoline in Palestine. Such data need to take into consideration the social and economic differences between children living in different environments. This study therefore aimed to investigate BLL among schoolchildren in Pales-tine, with emphasis on the comparison between those living in a refugee camp environment and those living in the city.
Methods
Study settings and schoolsThis cross-sectional survey was carried out in the spring of 2009 in Nablus city, one of the largest cities in the West Bank of Palestine. The total population of the West Bank is approximately 2.5 mil-lion, 20% of whom have been living in refugee camps since 1948 [12].
The sample was taken from among 1000 first-grade students attending 3 schools in different areas of Nablus. The schools were selected to represent dif-ferent geographic and socioeconomic strata in the city. We choose 2 of the 3 refugee camp schools run by the United Nations Relief and Works Agency for Palestine Refugees in the Near East (UNRWA). The choice of UNRWA schools was based on the fact that the populations of refugee camps are char-acterized by low socioeconomic status and poor health standards. The camps have concrete houses built before 1950, with narrow streets and high popula-tion density and are located close to the main streets with heavy traffic which might to greater lead exposure for chil-dren. Al-Ain UNRWA school is located at the northern part of Nablus city and serves boys living at Al-Ain refugee camp. Asker UNRWA school is located in the eastern part of Nablus city, close to an industrial area, and serves solely boys, who have a similar background to children who attend Al-Ain UN-RWA school. We also chose 1 of the
estimated 10 private schools, which was located at the middle of Nablus city away from the main highway and which therefore might have lower exposure to environmental lead. Private schools are attended by children from families living outside the refugee camps, who generally have higher economic and parental education levels. The Al-Talaa private school has approximately 1000 students who come from a number of different residential areas in Nablus city.
SampleWe calculated the sample size with a 99% confidence limit with an interval of ± 2 and a standard deviation of 5. The expected sample size was 166. The final sample included 103 first graders from around 300 in total at the UN-RWA schools and 75 first graders from around 150 at the private school, which represented approximately 45% of chil-dren who were invited to participate in the study and 6% (178/3000) of the total number of 6–8-year-old children in Nablus city.
Data collectionOn the first day of the study, all children in the 3 selected schools were given a written consent form and a brochure explaining the study to be handed to their parents. Of 400 consent forms distributed, 178 were signed by the parents and returned to the researchers a week later.
Before venous blood samples were collected, parents completed a ques-tionnaire to collect data about sociode-mographic parameters, child’s general health status (i.e. presence of any eating or sleeping problems, growth problems, any diseases suffered, vaccinations taken and potential sources of lead exposure in the home environment). The question-naire was written in Arabic. The ques-tionnaires were filled by parents without assistance from the authors. Only chil-dren who brought back the completely filled questionnaire along with a signed consent form were included in the study.
Book 19-2.indb 152 2/21/2013 11:39:23 AM
املجلد التاسع عرشاملجلة الصحية لرشق املتوسطالعدد الثاين
153
between continuous variables were as-sessed using Pearson correlation. The significance level was set at P < 0.05.
Results
Background demographic and clinical dataA total of 178 children were included in the study (75 from Al-Tala private school, 31 from Al-Ain UNRWA school and 72 from Asker UNRWA school). In our sample, there were 140 boys (78.7%) and 38 (21.3%) girls; all the girls were from Al-Talaa private school. The mean age of the children was 6.4 (SD 0.5) years, range 6–8, median 6 years.
The mean family size, measured as number of family members, was 4.3 (SD 1.7) and the mean household area was 126 (SD 66) m2. There was a sig-nificant difference among children in the 3 schools with regard to family size. Children at Al-Talaa private school had the smallest family size [3.6 (SD 1.4)] and Al-Ain UNRWA school had the highest [5.2 (SD 1.9)] (Table 1). There was also a significant difference among children in the 3 schools with regard to household area, with children at Al-Talaa having the largest household area 152 (SD 45) m2 and Al-Ain UNRWA school the lowest [104 (SD 75) m2] (Table 1).
Their mean haemoglobin level of the children was 12.3 (SD 0.8) g/dL. The mean weight of the children was 23.5 (SD 3.9) kg, and the mean arm circumference was 17.5 (SD 1.7) cm. For Al-Ain UNRWA school, the mean weight was 23.3 (SD5.7) kg, for Al-Talaa it was 24.1 (SD 3.5), kg and for Asker it was 22.9 (SD 3.1) kg. As for the arm circumference, it was 17.2 (SD 2.4) cm for Al-Ain, 17.9 (SD 1.5) cm for Al-Talaa and 17.2 (SD 1.3) cm for Asker.
Blood lead levelsThe mean BLL among all children when the 3 sites were pooled was 3.2
(SD 2.4) µg/dL. However, 8 children (4.5%) had BLL above 10 µg/dL (maximum was 13.9 µg/dL), which is the level of concern according to CDC guidelines. All 8 children with a BLL > 10 µg/dL were from Asker UNRWA school. Further analysis showed that there were significant differences in BLL among children from the 3 schools (P < 0.01, F = 41). The lowest mean blood lead levels were at the private school [1.9 (SD 0.6) µg/dL, range 0.7–4.3 µg/dL], followed by Al-Ain UNRWA school [2.7 (SD 0.9), range 1.2–4.4 µg/dL], while Asker UNRWA school had the highest level [4.9 (SD 0.4) µg/dL, range 0.8–13.9 µg/dL]. Post hoc analysis using the Tukey test showed that children at Asker UNRWA school had a significantly higher mean BLL than children at Al-Tala private school (P < 0.01) or at Al-Ain UNRWA school (P < 0.01).
Risk factors for high lead levelsPearson correlation analysis showed that age was not correlated with BLL for the whole sample or at any of the 3 schools (P > 0.5). The only school with data on both boys and girls was Al-Talaa private school. The mean BLL for boys at was 2.0 (SD 0.7) µg/dL and for girls at the same school was 1.9 (SD 0.6) µg/dL. This difference was not statistically significant (P > 0.05).
None of the other health param-eters measured (haemoglobin level, weight or arm circumference) were significantly correlated with BLL. Fam-ily size was positively correlated with children’s BLL (r = 0.153, P = 0.048) and household size was negatively cor-related with BLL (r = –0.18, P = 0 .031) (Table 1).
Discussion
Lead is considered a serious neuro-toxicant, and research suggests that children's intellectual functioning is impaired by BLL concentrations even
For each child, weight, height and arm circumference were measured before blood sample collection. Blood sample collection was carried out by well trained nursing staff supervised by a medical laboratory expert.
Blood samples were analysed for lead at the trace metals laboratory at Harvard School of Public Health in Boston, Massachusetts. For the lead assay blood samples were first weighed (~1 g) and digested for 24 hours in 2 mL of concentrated nitric acid. These samples were then treated with 1 mL of 30% hydrogen peroxide per 1 g of blood and left overnight. Samples were subsequently diluted to 10 mL with deionized water. Lead concentrations were measured using a dynamic reac-tion cell-inductively coupled plasma mass spectrometer (DRC-ICP-MS, DRC II, Perkin Elmer). Analyses were performed using an external calibration method, with lutetium as the internal standard for lead.
Quality control measures included analysis of initial and continuous cali-bration verification standards [National Institute of Standards and Technology standard reference material for trace elements in water (NIST 1643e)], 1 ppb lead standard, procedural blanks, duplicate samples, spiked samples and certified reference material (NIST 955b in bovine blood for lead) to monitor for contamination, accuracy and recovery rates. Recovery rates for lead in quality control and spiked samples were 90%–115%, and precision was measured as % relative standard deviation (SD) and it was less than 5% for lead. The limits of detection of lead were 0.2 µg/dL. Results from ICP-MS analyses are the average of 5 replicate measurements.
Data analysisData obtained from questionnaires and blood sample analyses were analysed using SPSS, version 16 for Windows. Comparisons among the 3 schools were made using robust ANOVA test with Tukey post hoc analysis. Correlations
Book 19-2.indb 153 2/21/2013 11:39:23 AM
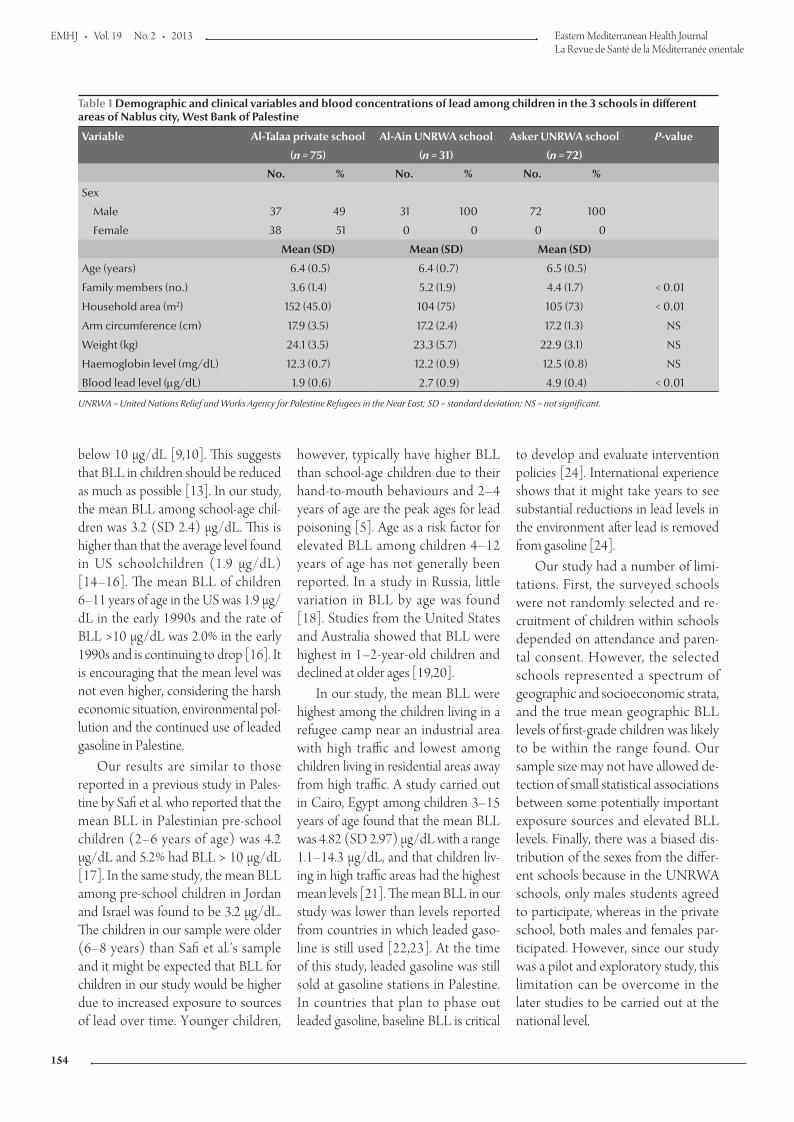
EMHJ • Vol. 19 No. 2 • 2013 Eastern Mediterranean Health JournalLa Revue de Santé de la Méditerranée orientale
154
below 10 µg/dL [9,10]. This suggests that BLL in children should be reduced as much as possible [13]. In our study, the mean BLL among school-age chil-dren was 3.2 (SD 2.4) µg/dL. This is higher than that the average level found in US schoolchildren (1.9 µg/dL) [14–16]. The mean BLL of children 6–11 years of age in the US was 1.9 µg/dL in the early 1990s and the rate of BLL >10 µg/dL was 2.0% in the early 1990s and is continuing to drop [16]. It is encouraging that the mean level was not even higher, considering the harsh economic situation, environmental pol-lution and the continued use of leaded gasoline in Palestine.
Our results are similar to those reported in a previous study in Pales-tine by Safi et al. who reported that the mean BLL in Palestinian pre-school children (2–6 years of age) was 4.2 µg/dL and 5.2% had BLL > 10 µg/dL [17]. In the same study, the mean BLL among pre-school children in Jordan and Israel was found to be 3.2 µg/dL. The children in our sample were older (6–8 years) than Safi et al.’s sample and it might be expected that BLL for children in our study would be higher due to increased exposure to sources of lead over time. Younger children,
however, typically have higher BLL than school-age children due to their hand-to-mouth behaviours and 2–4 years of age are the peak ages for lead poisoning [5]. Age as a risk factor for elevated BLL among children 4–12 years of age has not generally been reported. In a study in Russia, little variation in BLL by age was found [18]. Studies from the United States and Australia showed that BLL were highest in 1–2-year-old children and declined at older ages [19,20].
In our study, the mean BLL were highest among the children living in a refugee camp near an industrial area with high traffic and lowest among children living in residential areas away from high traffic. A study carried out in Cairo, Egypt among children 3–15 years of age found that the mean BLL was 4.82 (SD 2.97) µg/dL with a range 1.1–14.3 µg/dL, and that children liv-ing in high traffic areas had the highest mean levels [21]. The mean BLL in our study was lower than levels reported from countries in which leaded gaso-line is still used [22,23]. At the time of this study, leaded gasoline was still sold at gasoline stations in Palestine. In countries that plan to phase out leaded gasoline, baseline BLL is critical
to develop and evaluate intervention policies [24]. International experience shows that it might take years to see substantial reductions in lead levels in the environment after lead is removed from gasoline [24].
Our study had a number of limi-tations. First, the surveyed schools were not randomly selected and re-cruitment of children within schools depended on attendance and paren-tal consent. However, the selected schools represented a spectrum of geographic and socioeconomic strata, and the true mean geographic BLL levels of first-grade children was likely to be within the range found. Our sample size may not have allowed de-tection of small statistical associations between some potentially important exposure sources and elevated BLL levels. Finally, there was a biased dis-tribution of the sexes from the differ-ent schools because in the UNRWA schools, only males students agreed to participate, whereas in the private school, both males and females par-ticipated. However, since our study was a pilot and exploratory study, this limitation can be overcome in the later studies to be carried out at the national level.
Table 1 Demographic and clinical variables and blood concentrations of lead among children in the 3 schools in different areas of Nablus city, West Bank of Palestine
Variable Al-Talaa private school Al-Ain UNRWA school Asker UNRWA school P-value
(n = 75) (n = 31) (n = 72)
No. % No. % No. %
Sex
Male 37 49 31 100 72 100
Female 38 51 0 0 0 0
Mean (SD) Mean (SD) Mean (SD)
Age (years) 6.4 (0.5) 6.4 (0.7) 6.5 (0.5)
Family members (no.) 3.6 (1.4) 5.2 (1.9) 4.4 (1.7) < 0.01
Household area (m2) 152 (45.0) 104 (75) 105 (73) < 0.01
Arm circumference (cm) 17.9 (3.5) 17.2 (2.4) 17.2 (1.3) NS
Weight (kg) 24.1 (3.5) 23.3 (5.7) 22.9 (3.1) NS
Haemoglobin level (mg/dL) 12.3 (0.7) 12.2 (0.9) 12.5 (0.8) NS
Blood lead level (µg/dL) 1.9 (0.6) 2.7 (0.9) 4.9 (0.4) < 0.01
UNRWA = United Nations Relief and Works Agency for Palestine Refugees in the Near East; SD = standard deviation; NS = not significant.
Book 19-2.indb 154 2/21/2013 11:39:23 AM
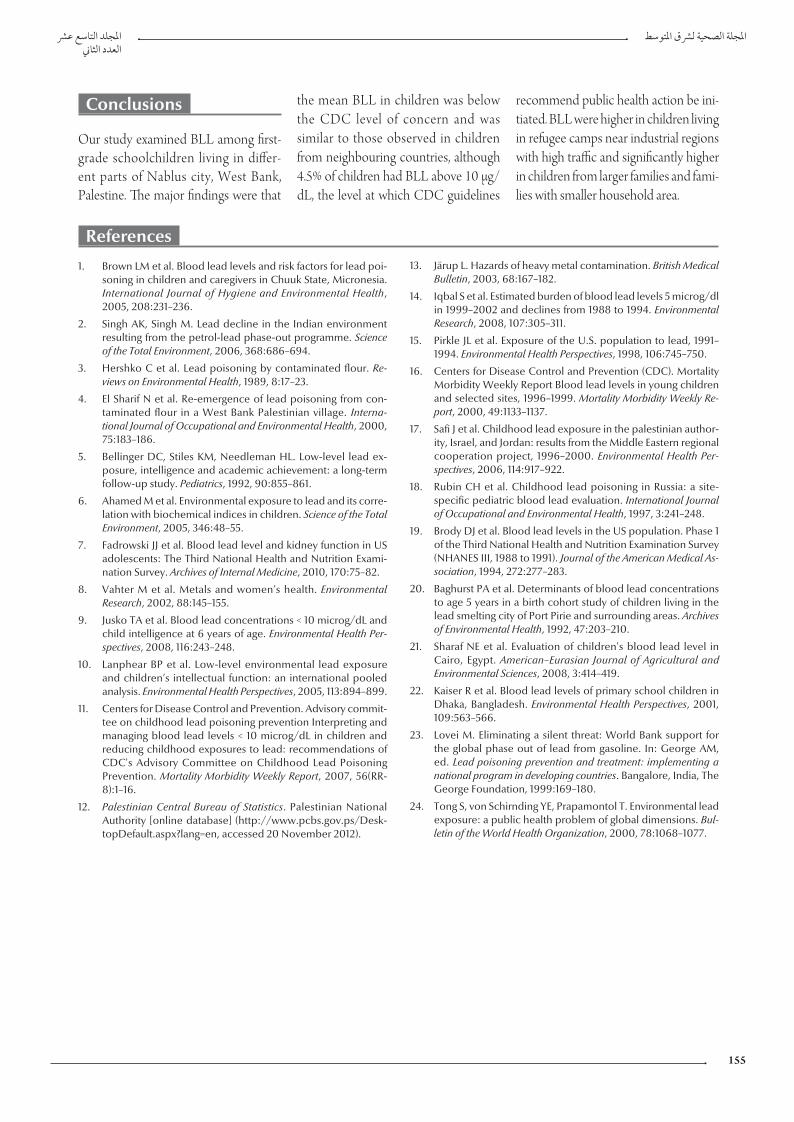
املجلد التاسع عرشاملجلة الصحية لرشق املتوسطالعدد الثاين
155
References
1. Brown LM et al. Blood lead levels and risk factors for lead poi-soning in children and caregivers in Chuuk State, Micronesia. International Journal of Hygiene and Environmental Health, 2005, 208:231–236.
2. Singh AK, Singh M. Lead decline in the Indian environment resulting from the petrol-lead phase-out programme. Science of the Total Environment, 2006, 368:686–694.
3. Hershko C et al. Lead poisoning by contaminated flour. Re-views on Environmental Health, 1989, 8:17–23.
4. El Sharif N et al. Re-emergence of lead poisoning from con-taminated flour in a West Bank Palestinian village. Interna-tional Journal of Occupational and Environmental Health, 2000, 75:183–186.
5. Bellinger DC, Stiles KM, Needleman HL. Low-level lead ex-posure, intelligence and academic achievement: a long-term follow-up study. Pediatrics, 1992, 90:855–861.
6. Ahamed M et al. Environmental exposure to lead and its corre-lation with biochemical indices in children. Science of the Total Environment, 2005, 346:48–55.
7. Fadrowski JJ et al. Blood lead level and kidney function in US adolescents: The Third National Health and Nutrition Exami-nation Survey. Archives of Internal Medicine, 2010, 170:75–82.
8. Vahter M et al. Metals and women’s health. Environmental Research, 2002, 88:145–155.
9. Jusko TA et al. Blood lead concentrations < 10 microg/dL and child intelligence at 6 years of age. Environmental Health Per-spectives, 2008, 116:243–248.
10. Lanphear BP et al. Low-level environmental lead exposure and children’s intellectual function: an international pooled analysis. Environmental Health Perspectives, 2005, 113:894–899.
11. Centers for Disease Control and Prevention. Advisory commit-tee on childhood lead poisoning prevention Interpreting and managing blood lead levels < 10 microg/dL in children and reducing childhood exposures to lead: recommendations of CDC's Advisory Committee on Childhood Lead Poisoning Prevention. Mortality Morbidity Weekly Report, 2007, 56(RR-8):1–16.
12. Palestinian Central Bureau of Statistics. Palestinian National Authority [online database] (http://www.pcbs.gov.ps/Desk-topDefault.aspx?lang=en, accessed 20 November 2012).
13. Järup L. Hazards of heavy metal contamination. British Medical Bulletin, 2003, 68:167–182.
14. Iqbal S et al. Estimated burden of blood lead levels 5 microg/dl in 1999–2002 and declines from 1988 to 1994. Environmental Research, 2008, 107:305–311.
15. Pirkle JL et al. Exposure of the U.S. population to lead, 1991–1994. Environmental Health Perspectives, 1998, 106:745–750.
16. Centers for Disease Control and Prevention (CDC). Mortality Morbidity Weekly Report Blood lead levels in young children and selected sites, 1996–1999. Mortality Morbidity Weekly Re-port, 2000, 49:1133–1137.
17. Safi J et al. Childhood lead exposure in the palestinian author-ity, Israel, and Jordan: results from the Middle Eastern regional cooperation project, 1996–2000. Environmental Health Per-spectives, 2006, 114:917–922.
18. Rubin CH et al. Childhood lead poisoning in Russia: a site-specific pediatric blood lead evaluation. International Journal of Occupational and Environmental Health, 1997, 3:241–248.
19. Brody DJ et al. Blood lead levels in the US population. Phase 1 of the Third National Health and Nutrition Examination Survey (NHANES III, 1988 to 1991). Journal of the American Medical As-sociation, 1994, 272:277–283.
20. Baghurst PA et al. Determinants of blood lead concentrations to age 5 years in a birth cohort study of children living in the lead smelting city of Port Pirie and surrounding areas. Archives of Environmental Health, 1992, 47:203–210.
21. Sharaf NE et al. Evaluation of children's blood lead level in Cairo, Egypt. American–Eurasian Journal of Agricultural and Environmental Sciences, 2008, 3:414–419.
22. Kaiser R et al. Blood lead levels of primary school children in Dhaka, Bangladesh. Environmental Health Perspectives, 2001, 109:563–566.
23. Lovei M. Eliminating a silent threat: World Bank support for the global phase out of lead from gasoline. In: George AM, ed. Lead poisoning prevention and treatment: implementing a national program in developing countries. Bangalore, India, The George Foundation, 1999:169–180.
24. Tong S, von Schirnding YE, Prapamontol T. Environmental lead exposure: a public health problem of global dimensions. Bul-letin of the World Health Organization, 2000, 78:1068–1077.
Conclusions
Our study examined BLL among first-grade schoolchildren living in differ-ent parts of Nablus city, West Bank, Palestine. The major findings were that
the mean BLL in children was below the CDC level of concern and was similar to those observed in children from neighbouring countries, although 4.5% of children had BLL above 10 µg/dL, the level at which CDC guidelines
recommend public health action be ini-tiated. BLL were higher in children living in refugee camps near industrial regions with high traffic and significantly higher in children from larger families and fami-lies with smaller household area.
Book 19-2.indb 155 2/21/2013 11:39:23 AM
EMHJ • Vol. 19 No. 2 • 2013 Eastern Mediterranean Health JournalLa Revue de Santé de la Méditerranée orientale
156
Birth weight and risk of childhood acute leukaemiaA. Gholami,1 S. Salarilak,2 S. Hejazi 3 and H.R. Khalkhali 4
ABSTRACT Studies of risk factors for acute leukaemia are inconclusive. This case–control study was done in West Azerbaijan province, Islamic Republic of Iran, to determine the relationship between birth weight and acute leukaemia in children aged under 15 years. For every patient 2 age- and sex-matched controls were selected from hospital and community populations. Of 130 cases diagnosed over the period 2003–2009, 108 (83.1%) had lymphoblastic and 22 (16.9%) myloblastic type. Significantly more of them were male than female (55.4% versus 44.6%). In a multivariate logistic regression model variables significantly associated with acute leukaemia were: birth weight (OR = 2.25), birth order (OR = 2.25), birth place (OR = 7.93), history of chickenpox (OR = 0.46) and mothers’ education (OR = 3.23). The risk of acute leukaemia increased significantly with increasing birth weight in the total group and among girls, but not among boys.
1School of Nursing, Neyshabur Faculty of Medical Sciences, Neyshabur, Islamic Republic of Iran.2Department of Public Health, Islamic Azad University (Tabriz Branch), Tabriz, Islamic Republic of Iran (Correspondence to S. Salarilak: [email protected]).3Motahari Teaching Hospital, Children’s Blood Section; 4Department of Biostatistics and Epidemiology, Urmia University of Medical Sciences, Urmia, Islamic Republic of Iran.
Received: 21/11/11; accepted: 21/02/12
الوزن عند الوالدة واختطار ابيضاض الدم احلاد يف الطفولةعيل غالمي، شاكر ساالري لك، ساسان حجازي، محيد رضا خلخايل
اخلالصـة: نظرا ألن الدراسات حول عوامل اختطار ابيضاض الدم احلاد مازالت غري جازمة فقد أجرى الباحثون هذه الدراسات للحاالت والشواهد يف ف عىل العالقة بني الوزن عند الوالدة وابيضاض الدم احلاد لدى األطفال دون سن اخلامسة عرشة. والية غرب أذربيجان يف مجهورية إيران اإلسالمية للتعروقد اختار الباحثون اثنني من الشواهد مقابل كل مريض يوافقانه بالعمر وباجلنس من السكان يف املجتمع ويف املستشفى. وقد شملت الدراسة 130 مريضا تم تشخيصهم خالل الفرتة 2003–2009، وكان لدى 108 منهم )83.1%( نمط األرومات اللمفاوية، ولدى 22 منهم )16.9%( نمط األرومات النقوية. ات اتضح أن املتغريات يف املتعدد املتغري واتضح من حيث االعتداد اإلحصائي أن الذكور )55.4%( أكثر من اإلناث )44.6(. وعند إجراء النموذج التحو2.25(، الرتتيب بني املولودين )نسبة األرجحية يعتد به إحصائيا مع ابيضاض الدم احلاد هي: الوزن عند الوالدة )نسبة األرجحية التي تـرتابط ترابطا 2.25(، مكان الوالدة )نسبة األرجحية 7.93(، قصة إصابة سابقة باحلامق )نسبة األرجحية 0.46(، درجة تعلم األمهات )نسبة األرجحية 3.23(. واستنتج
الباحثون أن خطر االبيضاض احلاد يزداد زيادة يعتد هبا إحصائيا بازدياد الوزن عند الوالدة يف جممل املجموعة وبني الفتيات ال بني الفتيان.
Poids de naissance et risque de leucémie aiguë de l'enfant
RÉSUMÉ Les études des facteurs de risques d'une leucémie aiguë n'ont pas permis de tirer de conclusions. La présente étude cas-témoins a été menée dans la province d'Azerbaïdjan de l'ouest (République islamique d'Iran), pour déterminer la relation entre le poids de naissance et une leucémie aiguë chez l'enfant de moins de 15 ans. Pour chaque patient, deux témoins appariés pour l'âge et le sexe ont été sélectionnés dans des populations hospitalières ou communautaires. Sur 130 cas diagnostiqués entre 2003 et 2009, 108 (83,1 %) étaient porteurs du type lymphoblastique et 22 (16,9 %) du type myéloblastique. Les patients de sexe masculin étaient nettement plus nombreux que les patients de sexe féminin (55,4 % contre 44,6 %). Dans un modèle de régression logistique multivariée, les variables fortement associées à une leucémie aiguë étaient les suivantes : poids de naissance (OR = 2,25), rang de naissance (OR = 2,25), lieu de naissance (OR = 7,93), antécédents de varicelle (OR = 0,46) et niveau d'études de la mère (OR = 3,23). Le risque d'une leucémie aiguë augmentait nettement avec un poids de naissance accru dans l'ensemble du groupe et chez les filles, mais pas chez les garçons.
Book 19-2.indb 156 2/21/2013 11:39:23 AM
املجلد التاسع عرشاملجلة الصحية لرشق املتوسطالعدد الثاين
157
Introduction
Leukaemia is a malignant progressive cancer which is caused by incomplete production of white blood cells and their precursors in blood and bone marrow. The disease is classified into acute and chronic types according to the speed of progression of cancer and into lymphoblastic or myeloblastic ac-cording to the types of white blood cell affected [1–3]. Leukaemia is the most prevalent childhood cancer and the most common type in children is acute lymphoblastic leukaemia (ALL). ALL is a very rapid cancer which is usually seen in ages between 2 and 6 years [2]. ALL has a high mortality rate, great costs for treatment and a long period of hospi-talization, with associated psychological trauma for patients and their families [4].
In view of the social and economic burden of this disease, a number of stud-ies have been done in different coun-tries to study the relationship between genetic and environmental factors and the risk of acute leukaemia. One of these factors is birth weight and in some studies a statistically significant relation-ship has been reported between birth weight and leukaemia [5–21], while other studies have found no relation-ship [22–25]. In view of the conflicting findings on this subject, we decided to study the relationship between birth weight and acute leukaemia in children in the province of West Azerbaijan, Is-lamic Republic of Iran.
Methods
Study sampleThis was a case–control study. The case group were patients with acute leukaemia, diagnosed from 20 March 2003 and 20 March 2009, age less than 15 years at the time of diagnosis and residing in West Azerbaijan prov-ince at the time of diagnosis. For each patient we selected 2 controls from 2
groups: a hospital control and a com-munity control. Cases and controls were matched according to age group (< 5, 5–9 and 10–14 years old) and sex. Hospital controls were selected from the children’s ward and the chil-dren’s clinic centre in Motahari hos-pital in the city of Urmia. Community controls were selected from children who came to Urmia health centres for routine health care. Inclusion criteria for controls were not having acute leukaemia or any other blood disease, age less than 15 years at the time of data collection and residing in West Azerbaijan province.
Data collectionA specially designed questionnaire was used to collect data on the child’s demo-graphic characteristics, type of cancer (for cases only), child’s risk factors (birth order, birth place, history of chickenpox, history of icterus, history of mumps infection, history of X-ray exposure, breastfeeding, formula-milk feeding) and parents’ demographic characteris-tics (mother’s age, father’s age, mother’s education and father’s education at the birth of the child). The questionnaire design was based on a questionnaire provided by the Washington Health Department [26] and questionnaires from previous studies in the Islamic Republic of Iran and with input from local professors of epidemiology and oncology. A pilot study was done to test the validity of the questionnaire. Ques-tionnaires were completed using data files and face-to-face interviews with the mothers of patients and controls.
To prevent recall bias in the birth weight variable, we used the birth weight recorded in the household folders kept by the health system and in vaccination cards; the birth weight of 90.8% of the case patients and 95.0% of controls were recorded.
Statistical analysisA logistic regression model in SPSS, version 16 was used to investigate the
relationship between birth weight and acute leukaemia and also to control for confounding factors and investigate the possible effects on acute leukaemia risk of the risk factors investigated. We report odds ratios (OR), 95% confi-dence interval (CI) and P-values for all variables. The chi-squared test for trend was used to determine the trend of birth weight in the developing of acute leukaemia.
Results
A total of 138 children affected by acute leukaemia were diagnosed in west Azer-baijan province over the study period (113 with ALL and 25 with AML); 8 patients dropped out of the study, 1 because the parents did not agree to participation and 7 because of a change of address. So the study was based on 130 patients, of whom 108 (83.1%) were affected by ALL and 22 (16.9%) by AML. Of these, 72 patients (55.4%) were boys and 58 (44.6%) girls. At the time of diagnosis, 52.3% of their families lived in urban areas and 47.7% in rural areas. Most cases (43.1%) were aged under 5 years (Figure 1). There were 260 age and sex-match controls: 144 boys (55.4%) and 116 girls (44.6%).
The mean birth weight of children affected by acute leukaemia [3400 (SD 650) g] was significantly higher than that the control group [3240 (SD 592) g] (P = 0.02).
A univariate logistic regression model was used to evaluate the contri-bution of each variable and its relation to leukaemia. Variables with a signifi-cant association were as follows: birth weight (< 4000 g versus ≥ 4000 g), birth order (1 versus ≥ 2), birth place (home versus hospital), history of chickenpox, mother’s and father’s age (< 35 versus ≥ 35 years) and mother’s and father’s education (below high school versus high school and above) (Table 1). Variables without any sig-nificant relationship according to the
Book 19-2.indb 157 2/21/2013 11:39:23 AM
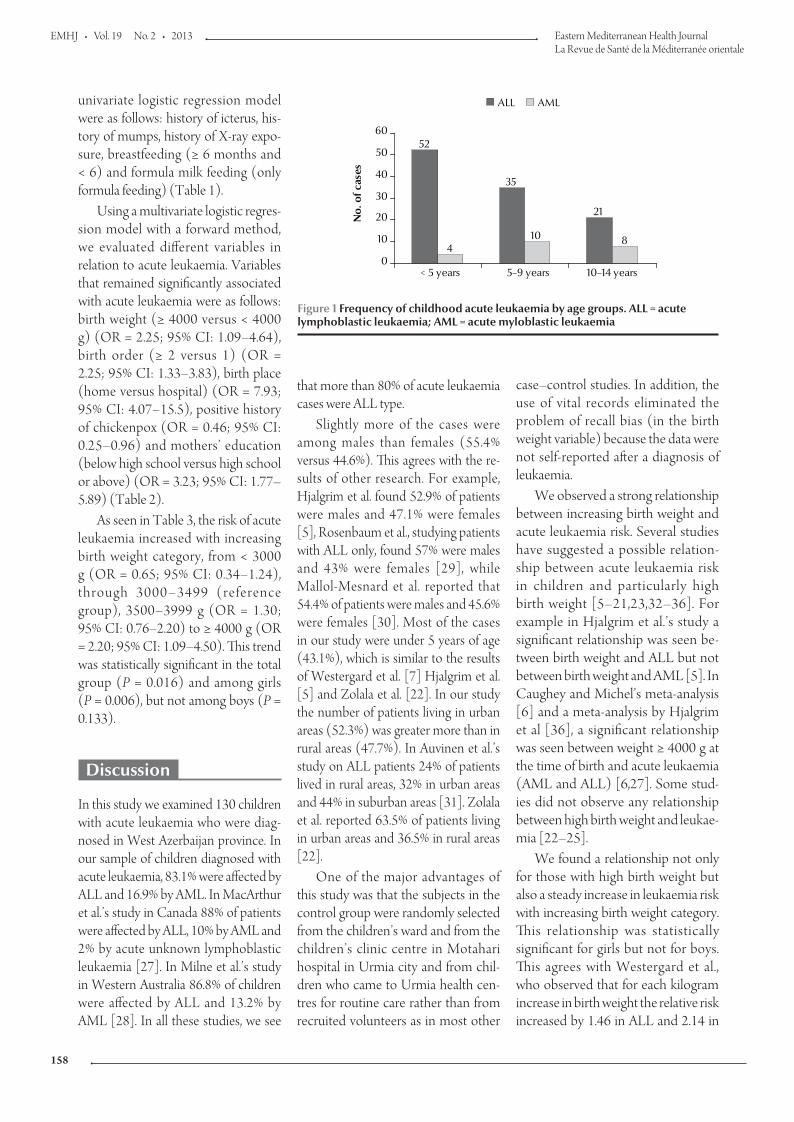
EMHJ • Vol. 19 No. 2 • 2013 Eastern Mediterranean Health JournalLa Revue de Santé de la Méditerranée orientale
158
that more than 80% of acute leukaemia cases were ALL type.
Slightly more of the cases were among males than females (55.4% versus 44.6%). This agrees with the re-sults of other research. For example, Hjalgrim et al. found 52.9% of patients were males and 47.1% were females [5], Rosenbaum et al., studying patients with ALL only, found 57% were males and 43% were females [29], while Mallol-Mesnard et al. reported that 54.4% of patients were males and 45.6% were females [30]. Most of the cases in our study were under 5 years of age (43.1%), which is similar to the results of Westergard et al. [7] Hjalgrim et al. [5] and Zolala et al. [22]. In our study the number of patients living in urban areas (52.3%) was greater more than in rural areas (47.7%). In Auvinen et al.’s study on ALL patients 24% of patients lived in rural areas, 32% in urban areas and 44% in suburban areas [31]. Zolala et al. reported 63.5% of patients living in urban areas and 36.5% in rural areas [22].
One of the major advantages of this study was that the subjects in the control group were randomly selected from the children’s ward and from the children’s clinic centre in Motahari hospital in Urmia city and from chil-dren who came to Urmia health cen-tres for routine care rather than from recruited volunteers as in most other
case–control studies. In addition, the use of vital records eliminated the problem of recall bias (in the birth weight variable) because the data were not self-reported after a diagnosis of leukaemia.
We observed a strong relationship between increasing birth weight and acute leukaemia risk. Several studies have suggested a possible relation-ship between acute leukaemia risk in children and particularly high birth weight [5–21,23,32–36]. For example in Hjalgrim et al.’s study a significant relationship was seen be-tween birth weight and ALL but not between birth weight and AML [5]. In Caughey and Michel’s meta-analysis [6] and a meta-analysis by Hjalgrim et al [36], a significant relationship was seen between weight ≥ 4000 g at the time of birth and acute leukaemia (AML and ALL) [6,27]. Some stud-ies did not observe any relationship between high birth weight and leukae-mia [22–25].
We found a relationship not only for those with high birth weight but also a steady increase in leukaemia risk with increasing birth weight category. This relationship was statistically significant for girls but not for boys. This agrees with Westergard et al., who observed that for each kilogram increase in birth weight the relative risk increased by 1.46 in ALL and 2.14 in
univariate logistic regression model were as follows: history of icterus, his-tory of mumps, history of X-ray expo-sure, breastfeeding (≥ 6 months and < 6) and formula milk feeding (only formula feeding) (Table 1).
Using a multivariate logistic regres-sion model with a forward method, we evaluated different variables in relation to acute leukaemia. Variables that remained significantly associated with acute leukaemia were as follows: birth weight (≥ 4000 versus < 4000 g) (OR = 2.25; 95% CI: 1.09–4.64), birth order (≥ 2 versus 1) (OR = 2.25; 95% CI: 1.33–3.83), birth place (home versus hospital) (OR = 7.93; 95% CI: 4.07–15.5), positive history of chickenpox (OR = 0.46; 95% CI: 0.25–0.96) and mothers’ education (below high school versus high school or above) (OR = 3.23; 95% CI: 1.77–5.89) (Table 2).
As seen in Table 3, the risk of acute leukaemia increased with increasing birth weight category, from < 3000 g (OR = 0.65; 95% CI: 0.34–1.24), through 3000–3499 (reference group), 3500–3999 g (OR = 1.30; 95% CI: 0.76–2.20) to ≥ 4000 g (OR = 2.20; 95% CI: 1.09–4.50). This trend was statistically significant in the total group (P = 0.016) and among girls (P = 0.006), but not among boys (P = 0.133).
Discussion
In this study we examined 130 children with acute leukaemia who were diag-nosed in West Azerbaijan province. In our sample of children diagnosed with acute leukaemia, 83.1% were affected by ALL and 16.9% by AML. In MacArthur et al.’s study in Canada 88% of patients were affected by ALL, 10% by AML and 2% by acute unknown lymphoblastic leukaemia [27]. In Milne et al.’s study in Western Australia 86.8% of children were affected by ALL and 13.2% by AML [28]. In all these studies, we see
52
35
21
410 8
0
10
20
30
40
50
60
< 5 years 5–9 years 10–14 years
No.
of c
ases
ALL AML
Figure 1 Frequency of childhood acute leukaemia by age groups. ALL = acute lymphoblastic leukaemia; AML = acute myloblastic leukaemia
Book 19-2.indb 158 2/21/2013 11:39:23 AM
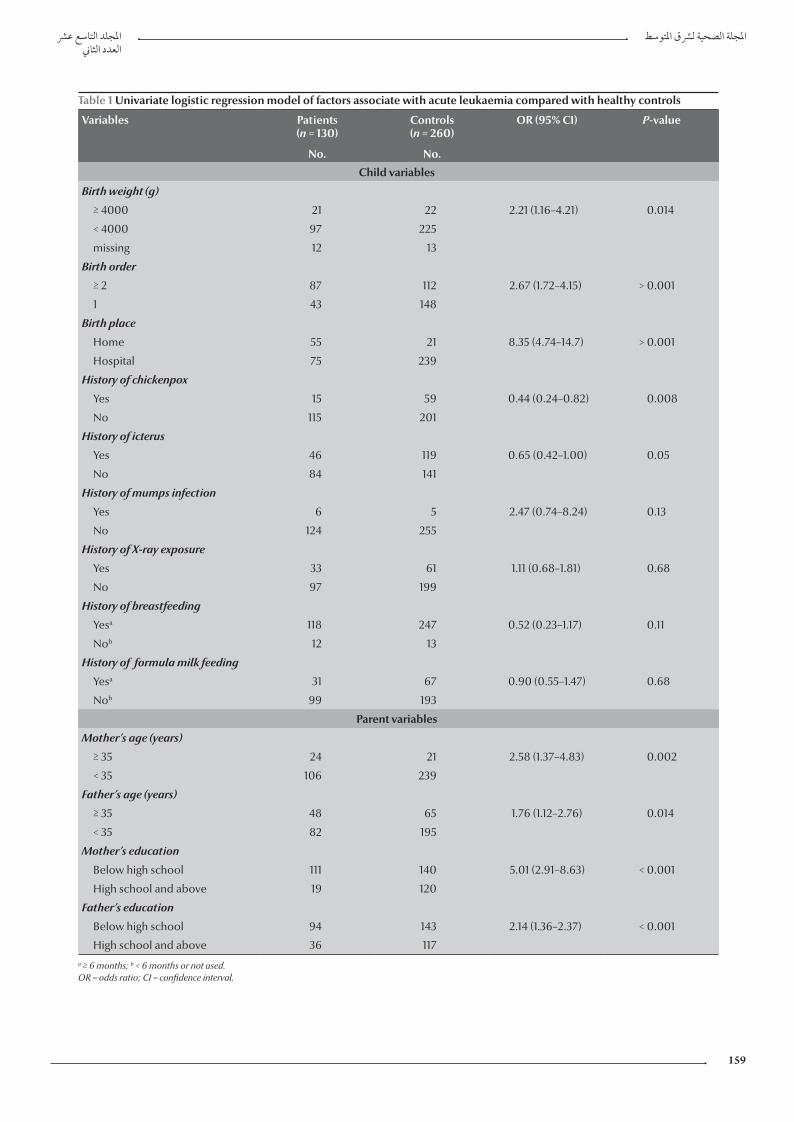
املجلد التاسع عرشاملجلة الصحية لرشق املتوسطالعدد الثاين
159
Table 1 Univariate logistic regression model of factors associate with acute leukaemia compared with healthy controls
Variables Patients(n = 130)
Controls(n = 260)
OR (95% CI) P-value
No. No.
Child variables
Birth weight (g)
≥ 4000 21 22 2.21 (1.16–4.21) 0.014
< 4000 97 225
missing 12 13
Birth order
≥ 2 87 112 2.67 (1.72–4.15) > 0.001
1 43 148
Birth place
Home 55 21 8.35 (4.74–14.7) > 0.001
Hospital 75 239
History of chickenpox
Yes 15 59 0.44 (0.24–0.82) 0.008
No 115 201
History of icterus
Yes 46 119 0.65 (0.42–1.00) 0.05
No 84 141
History of mumps infection
Yes 6 5 2.47 (0.74–8.24) 0.13
No 124 255
History of X-ray exposure
Yes 33 61 1.11 (0.68–1.81) 0.68
No 97 199
History of breastfeeding
Yesa 118 247 0.52 (0.23–1.17) 0.11
Nob 12 13
History of formula milk feeding
Yesa 31 67 0.90 (0.55–1.47) 0.68
Nob 99 193
Parent variables
Mother’s age (years)
≥ 35 24 21 2.58 (1.37–4.83) 0.002
< 35 106 239
Father’s age (years)
≥ 35 48 65 1.76 (1.12–2.76) 0.014
< 35 82 195
Mother’s education
Below high school 111 140 5.01 (2.91–8.63) < 0.001
High school and above 19 120
Father’s education
Below high school 94 143 2.14 (1.36–2.37) < 0.001
High school and above 36 117a ≥ 6 months; b < 6 months or not used. OR = odds ratio; CI = confidence interval.
Book 19-2.indb 159 2/21/2013 11:39:24 AM
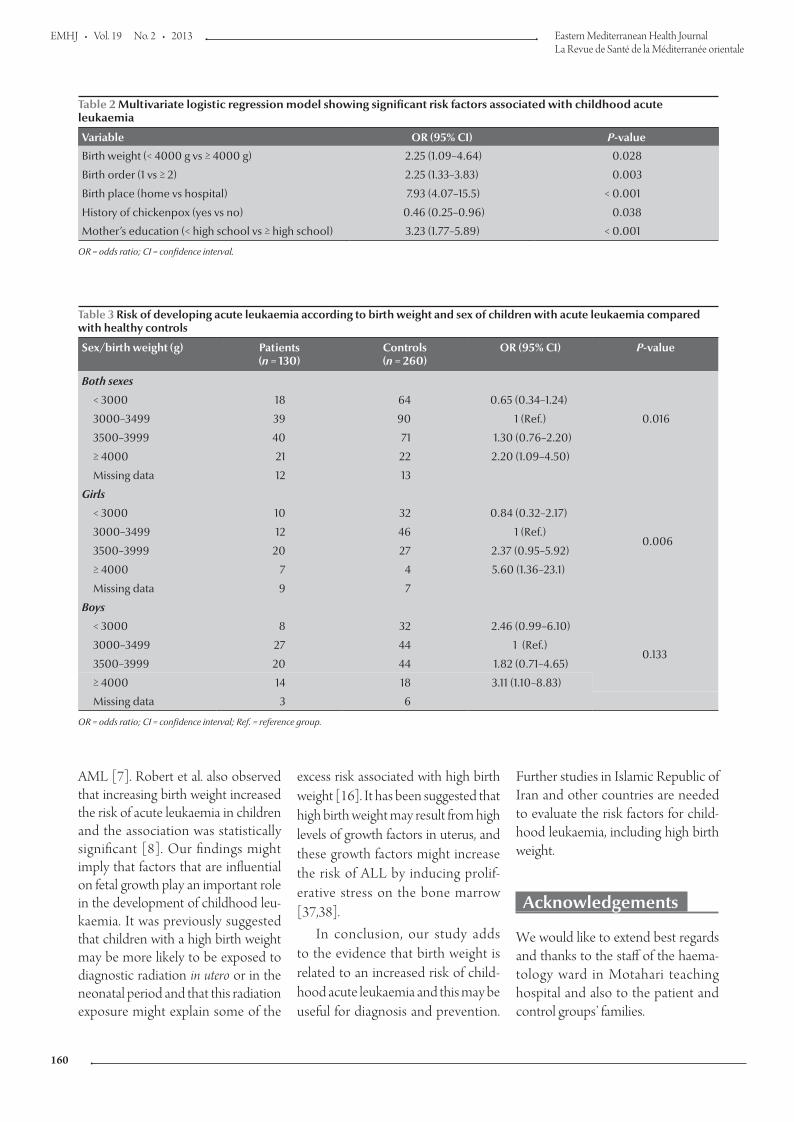
EMHJ • Vol. 19 No. 2 • 2013 Eastern Mediterranean Health JournalLa Revue de Santé de la Méditerranée orientale
160
AML [7]. Robert et al. also observed that increasing birth weight increased the risk of acute leukaemia in children and the association was statistically significant [8]. Our findings might imply that factors that are influential on fetal growth play an important role in the development of childhood leu-kaemia. It was previously suggested that children with a high birth weight may be more likely to be exposed to diagnostic radiation in utero or in the neonatal period and that this radiation exposure might explain some of the
excess risk associated with high birth weight [16]. It has been suggested that high birth weight may result from high levels of growth factors in uterus, and these growth factors might increase the risk of ALL by inducing prolif-erative stress on the bone marrow [37,38].
In conclusion, our study adds to the evidence that birth weight is related to an increased risk of child-hood acute leukaemia and this may be useful for diagnosis and prevention.
Further studies in Islamic Republic of Iran and other countries are needed to evaluate the risk factors for child-hood leukaemia, including high birth weight.
Acknowledgements
We would like to extend best regards and thanks to the staff of the haema-tology ward in Motahari teaching hospital and also to the patient and control groups’ families.
Table 2 Multivariate logistic regression model showing significant risk factors associated with childhood acute leukaemia
Variable OR (95% CI) P-value
Birth weight (< 4000 g vs ≥ 4000 g) 2.25 (1.09–4.64) 0.028
Birth order (1 vs ≥ 2) 2.25 (1.33–3.83) 0.003
Birth place (home vs hospital) 7.93 (4.07–15.5) < 0.001
History of chickenpox (yes vs no) 0.46 (0.25–0.96) 0.038
Mother’s education (< high school vs ≥ high school) 3.23 (1.77–5.89) < 0.001
OR = odds ratio; CI = confidence interval.
Table 3 Risk of developing acute leukaemia according to birth weight and sex of children with acute leukaemia compared with healthy controls
Sex/birth weight (g) Patients(n = 130)
Controls(n = 260)
OR (95% CI) P-value
Both sexes
0.016
< 3000 18 64 0.65 (0.34–1.24)
3000–3499 39 90 1 (Ref.)
3500–3999 40 71 1.30 (0.76–2.20)
≥ 4000 21 22 2.20 (1.09–4.50)
Missing data 12 13
Girls
< 3000 10 32 0.84 (0.32–2.17)
0.0063000–3499 12 46 1 (Ref.)
3500–3999 20 27 2.37 (0.95–5.92)
≥ 4000 7 4 5.60 (1.36–23.1)
Missing data 9 7
Boys
< 3000 8 32 2.46 (0.99–6.10)
0.1333000–3499 27 44 1 (Ref.)
3500–3999 20 44 1.82 (0.71–4.65)
≥ 4000 14 18 3.11 (1.10–8.83)
Missing data 3 6
OR = odds ratio; CI = confidence interval; Ref. = reference group.
Book 19-2.indb 160 2/21/2013 11:39:24 AM
املجلد التاسع عرشاملجلة الصحية لرشق املتوسطالعدد الثاين
161
1. Acute lymphocytic leukemia. Leukemia and Lymphoma Society [online factsheet] (http://www.lls.org/#/diseaseinformation/leukemia/acutelymphoblasticleukemia/ 2006, accessed 26 November 2012).
2. Henry JB. Clinical diagnosis and management by laboratory methods, 20th ed. Philadelphia, Saunders, 2001.
3. Acute myelogenous leukemia. Leukemia and Lymphoma So-ciety [online factsheet] (http://www.lls.org/diseaseinforma-tion/leukemia/acutemyeloidleukemia/2006, accessed 26 November 2012).
4. Pizzo P. Poplack D. Principles and practice of pediatric oncology, 3rd ed. Philadelphia, Pennsylvania, Lippincott Williams and Wilkins, 2001:409–419.
5. Hjalgrim LL et al. Birth weight and risk for childhood leukemia in Denmark, Sweden, Norway, and Iceland. Journal of the Na-tional Cancer Institute, 2004, 96:1549–1556.
6. Caughey RW, Michels KB. Birth weight and childhood leu-kemia: a meta-analysis and review of the current evidence. International Journal of Cancer, 2009, 124:2658–2670.
7. Westergaard T et al. Birth characteristics, sibling patterns, and acute leukemia risk in childhood: a population-based cohort study. Journal of the National Cancer Institute, 1997, 89:939–947.
8. Caughey RW, Michels KB. Birth weight and childhood leu-kemia: a meta-analysis and review of the current evidence. International Journal of Cancer, 2009, 124:2658–2670.
9. Smith A et al.; UKCCS investigators. Birth weight, sex and child-hood cancer: A report from the United Kingdom Childhood Cancer Study. Cancer Epidemiology, 2009, 33:363–367.
10. Samuelsen SO et al. Birth weight and childhood cancer. Epide-miology, 2009, 20:484–487.
11. McLaughlin CC et al. Birth weight, maternal weight and childr-hood leukaemia. British Journal of Cancer, 2006, 94:1738–1744.
12. Schüz J, Forman MR. Birthweight by gestational age and child-hood cancer. Cancer Causes and Control, 2007, 18:655–663.
13. Kaye SA et al. Maternal reproductive history and birth charac-teristics in childhood acute lymphoblastic leukemia. Cancer, 1991, 68:1351–1355.
14. Petridou E et al. The risk profile of childhood leukaemia in Greece: a nationwide case –control study. British Journal of Cancer, 1997, 76:1241–1247.
15. Robison LL et al. Birth weight as a risk factor for childhood acute lymphoblastic leukemia. Pediatric Hematology and On-cology, 1987, 4:63–72.
16. Daling JR et al. Birth weight and the incidence of childhood cancer. Journal of the National Cancer Institute, 1984, 72:1039–1041.
17. Yeazel MW et al. High birth weight and risk of specific child-hood cancers: a report from the Children’s Cancer Group. Journal of Pediatrics, 1997, 131:671–677.
18. Schüz J et al. Association of childhood cancer with factors related to pregnancy and birth. International Journal of Epide-miology, 1999, 28:631–639.
19. Ross JA et al. Evaluating the relationships among maternal re-productive history, birth characteristics, and infant leukemia: a report from the Children’s Cancer Group. Annals of Epidemiol-ogy, 1997, 7:172–179.
20. Wertelecki W, Mantel N. Increased birth weight in leukemia. Pediatric Research, 1973, 7:132–138.
21. Cnattingius S et al. Prenatal and neonatal risk factors for child-hood lymphatic leukemia. Journal of the National Cancer Insti-tute, 1995, 87:908–914.
22. Zolala F et al. Determination the inducing factors of acute lymphoblastic leukemia in children under 15 years old in Fars province (Iran) in the year 2001. Rafsanjan of Medical Sciences and Health Services, 2004, 3:267–275.
23. Eisenberg DE, Sorahan T. Birth weight and childhood cancer deaths. Journal of the National Cancer Institute, 1987, 78:1095–1100.
24. Shu XO et al. Breast-feeding and risk of childhood acute leuke-mia. Journal of the National Cancer Institute, 1999, 91:1765–1772.
25. Berger R. Acute lymphoblastic leukemia and chromosome 21. Cancer Genetics and Cytogenetics, 1997, 94:8–12.
26. A survey related to childhood acute lymphocytic leukaemia. Whatcom County, Washington, Washington State Depart-ment of Health, 1999 (www.co.whatcom.wa.us/health/pdf/leukemia_survey.PDF, accessed 10 December 2012).
27. MacArthur AC et al. Risk of childhood leukemia associated with parental smoking and alcohol consumption prior to con-ception and during pregnancy: the cross-Canada childhood leukemia study. Cancer Causes and Control, 2008, 19:283–295.
28. Milne E et al. Fetal growth and acute childhood leukemia: looking beyond birth weight. American Journal of Epidemiol-ogy, 2007, 166:151–159.
29. Rosenbaum PF, Buck GM, Brecher ML. Early child-care and preschool experiences and the risk of childhood acute lymph-oblastic leukemia. American Journal of Epidemiology, 2000, 152:1136–1144.
30. Mallol-Mesnard N et al. Vaccination and the risk of childhood acute leukaemia: the ESCALE study (SFCE). International Jour-nal of Epidemiology, 2007, 36:110–116.
31. Auvinen A et al. Extremely low-frequency magnetic fields and childhood acute lymphoblastic leukemia: an exploratory analysis of alternative exposure metrics. American Journal of Epidemiology, 2000, 152:20–31.
32. Fasal E, Jackson EW, Klauber MR. Birth characteristics and leukemia in childhood. Journal of the National Cancer Institute, 1971, 47:501–509.
33. Shu XO et al. A population-based case–control study of child-hood leukemia in Shanghai. Cancer, 1988, 62:635–644.
34. Cnattingius S et al. Prenatal and neonatal risk factors for child-hood lymphatic leukemia. Journal of the National Cancer Insti-tute, 1995, 87:908–914.
35. Hirayama T. Descriptive and analytical epidemiology of childhood malignancy in Japan. In: Kobayashi N, ed. Recent advances in management of children with cancer. Tokyo, The Children’s Cancer Association of Japan, 1980:27–43.
36. Hjalgrim LL et al. Birth weight as a risk factor for childhood leu-kemia: a meta-analysis of 18 epidemiologic studies. American Journal of Epidemiology, 2003, 158:724–735.
37. Ross JA et al. Big babies and infant leukemia: a role for in-sulin-like growth factor-1? Cancer Causes and Control, 1996, 7:553–559.
38. Albanes D, Winick M. Are cell number and cell proliferation risk factors for cancer? Journal of the National Cancer Institute, 1988, 80:772–775.
References
Book 19-2.indb 161 2/21/2013 11:39:24 AM
EMHJ • Vol. 19 No. 2 • 2013 Eastern Mediterranean Health JournalLa Revue de Santé de la Méditerranée orientale
162
External cephalic version for breech presentation at term: predictors of success, and impact on the rate of caesarean sectionO.A. Hussin,1 M.A. Mahmoud 1 and M.M. Abdel-Fattah 2
ABSTRACT The incidence of caesarean section for breech presentation has increased markedly in the last 20 years. A prospective, interventional cohort study was carried out of the success rate of external cephalic version (ECV) and its predictors of as well as its impact on the rate of caesarean section for vaginal breech delivery. All 128 women admitted during the study period to the obstetrics department of a tertiary care military hospital in Taif, Saudi Arabia with breech presentation at term, regardless of age and parity, who accepted ECV were recruited. ECV was successful in 53.9% of the women. Most of the women with successful ECV delivered normally (84.1%) and only 14.5% of them delivered by caesarean section. Conversely, normal vaginal delivery was reported among 8.5% of those who had spontaneous version with failed ECV and approximately two-thirds of them delivered by caesarean section (62.7%). Successful ECV reduced the breech and caesarean section rate.
1Department of Gynaecology and Obstetrics; 2Department of Preventive Medicine (Research Unit), Al-Hada Armed Forces Hospital, Taif, Saudi Arabia (Correspondence to M.M. Abdel-Fattah: [email protected]; [email protected]).
Received: 31/10/11; accepted: 21/02/12
التحويل اخلارجي للرأس يف املجيء املقعدي يف متام احلمل: منبئات النجاح وأثرها عىل معدالت إجراء العملية القيرصيةأميمة حسني، حممود حممود، معتز عبد الفتاح
اخلالصـة: لقد زادت معدالت إجراء العمليات القيرصية يف حاالت املجيء املقعدي زيادة ملحوظة خالل العقدين املاضيني. وقد أجرى الباحثون القيرصية العمليات إجراء معدالت عىل وأثرها النجاح ومنبئات للرأس اخلارجي التحويل نجاح معدالت حول أترابية تدخلية استقبالية دراسة منسوبة إىل الوالدة املقعدية عرب املهبل. وشملت الدراسة 128 امرأة أدخلن قسم التوليد خالل فرتة الدراسة يف مستشفى عسكري للرعاية الثالثية يف الطائف، يف اململكة العربية السعودية، ولدهين جميء مقعدي يف متام احلمل، دون اعتبار العمر وعدد مرات الوالدات السابقة، وقد قبلن مجيعا إجراء التحويل اخلارجي للرأس لدهين. واتضح للباحثني أن التحويل اخلارجي للرأس قد نجح يف 53.9% من النساء، وأن معظم من نجح لدهين التحويل قد ولدن والدة طبيعية )84.1%(، وأن 14.5% فقط منهن ولدن بالعملية القيرصية، وباملقابل فقد حدثت الوالدة الطبيعية لدى 8.5% ممن حدث لدهين حتويل تلقائي من بني من أخفق لدهين التحويل اخلارجي للرأس، أما ما يقرب من الثلثني منهن فقد أجريت هلن العملية القيرصية )62.7%(. ويرى الباحثون
أن تطبيق التحويل اخلارجي للرأس ينقص معدالت إجراء العملية القيرصية والوالدة املقعدية لدى احلوامل الالئي نجح لدهين ذلك التحويل.
Version céphalique externe en cas de présentation par le siège à terme : facteurs prédictifs de succès et impact sur le taux de césariennes
RÉSUMÉ L'incidence des césariennes en cas de présentation par le siège a beaucoup augmenté au cours des 20 dernières années. Une étude interventionnelle d'une cohorte prospective a été menée pour connaître le taux de succès des versions céphaliques externes et ses facteurs prédictifs, ainsi que l'impact sur le taux de césariennes par rapport à l'accouchement du siège par voie vaginale. Les 128 femmes qui ont été admises pendant l'étude au service d'obstétrique de l'hôpital militaire de soins de santé tertiaires à Taif (Arabie saoudite) pour une présentation par le siège à terme, et qui ont accepté une version céphalique externe ont toutes été recrutées indépendamment de leur âge et du nombre de leurs accouchements. La version céphalique externe a été un succès chez 53,9 % de ces femmes. La plupart des femmes pour qui la version céphalique externe a été un succès ont accouché par voie basse (84,1 %) et seules 14,5 % d'entre elles ont accouché par césarienne. À l'inverse, un accouchement par voie basse a été rapporté chez 8,5 % des femmes ayant eu une version spontanée après un échec de la version céphalique externe et environ deux tiers d'entre elles ont accouché par césarienne (62,7 %). Le succès dans la version céphalique externe permettait de réduire le taux de présentation par le siège et le taux de césariennes chez les femmes.
Book 19-2.indb 162 2/21/2013 11:39:24 AM
املجلد التاسع عرشاملجلة الصحية لرشق املتوسطالعدد الثاين
163
Introduction
Breech presentation complicates 3%–4% of all term deliveries [1]. It has been widely recognized that there is higher perinatal morbidity with breech presentation, due principally to prema-turity, congenital malformations, birth asphyxia and birth trauma [1]. Breech presentation, whatever the mode of delivery, is a signal for potential fetal handicap and this should be commu-nicated to the mother during antenatal, intrapartum and neonatal management [2]. The incidence of caesarean section for breech presentation has increased markedly in the last 20 years [3]. The Term Breech Trial concluded that, at least for mortality and markers of intermediate term morbidity, elective caesarean section was safer for the fetus and of similar safety to the mother when compared with intention to deliver vagi-nally [4–6]. This means that measures to reduce the incidence of breech pres-entation have become more important and that the effect of any such measure on the incidence of caesarean section will be more evident [1].
External cephalic version (ECV) at or near to term is a safe procedure which could effectively reduce the in-cidence of caesarean section in breech pregnancies [1]. ECV has been sub-jected to rigorous scientific appraisal in more than 6 randomized controlled studies. There is a significant reduction in the incidence of caesarean section in women where there is an intention to undertake ECV without any increased risk to the baby [7]. Routine use of ECV could reduce the rate of caesarean delivery by about two-thirds [8]. It is recommended that all women with an uncomplicated breech pregnancy at term (37–42 weeks) should be of-fered ECV [1,9]. Although primar-ily intended for uncomplicated breech pregnancies at term, ECV has been carried out successfully in previous caesarean sections [10,11] and during early labour [7].
The current study aimed to study the success rate of ECV and its predic-tors in a tertiary care setting as well as its impact on reducing the rate of caesar-ean section for breech presentation and vaginal breech delivery.
Methods
Study setting and sampleIn a prospective, interventional cohort study all women admitted to the ob-stetric department of Al-Hada Armed Forces Hospital (a tertiary care hospital with 360 beds) in Taif, Saudi Arabia, during the period June 2008 to June 2010, regardless of age and parity, with breech presentation at term were in-cluded in the study. Inclusion criteria were women with gestation of 37 weeks and onwards with breech presentation regardless of age and parity, who ac-cepted ECV. The exclusion criteria were refusal of ECV, multiple pregnancy, severe intrauterine growth retardation, severe amniotic fluid abnormalities, placenta previa, significant third tri-mester bleeding, uterine malformation, uncontrolled hypertensive disorders, major fetal anomalies, non-reassuring cardiotocography and any indication for caesarean section.
Data collectionEach patient was instructed to present to the labour ward in a fasting state, and an initial cardiotocography was done. A clinical assessment as well as bedside ultrasound scan was performed by the operator to confirm the fetal presenta-tion. The degree of fetal flexion and the position of the fetal back were noted. Tocolysis was given to patients with irritable uterus and the procedure was done 1 hour later.
The ECV procedure included dislodging the fetal breech from the pelvis while holding the fetus in a flexed position with both hands, turning the breech away from the pelvis. After completion of the procedure another
ultrasound was done to confirm the presentation and a cardiotography was repeated. Patients were discharged with a documented plan of delivery.
The rates of successful ECV, normal spontaneous vaginal delivery after suc-cessful ECV, caesarean section after attempted ECV and ECV-related fetal complications (bradycardia, emergency caesarean section or spontaneous rup-ture membrane during the procedure) were computed as outcome measures. The variables included in the study were: success of ECV, complications, presentation in labour, mode of deliv-ery, fetal outcome (Apgar score < 7 at 5 minutes) and length of post-delivery hospital stay.
Statistical analysisData were analysed using SPSS, version 13 and Epi-info, version 3.3.2. The chi-squared test was used to compare 2 or more qualitative variables. Failed ECV was treated as the dependent variable in both bivariate and logistic regres-sion analysis. Age, parity, position of the placenta, fetal weight, maximum pool depth of amniotic fluid and tocolysis were treated as independent categorical variables. Bivariate data analysis was performed and expressed as crude odds ratio (OR) and their 95% confidence intervals (CI). Multiple associations were evaluated in a multiple logistic re-gression model based on the backward stepwise selection, where significant variables from the univariate analysis were included. The adjusted measure of association between risk factors and failed ECV was expressed as the OR with 95% CI. Adjusted or crude ORs with 95% CI that did not include 1.0 were considered significant.
Results
For the 128 women recruited to the study the mean age was 30.1 (SD 6.7) years with a minimum of 17 years and a maximum of 46 years.
Book 19-2.indb 163 2/21/2013 11:39:24 AM
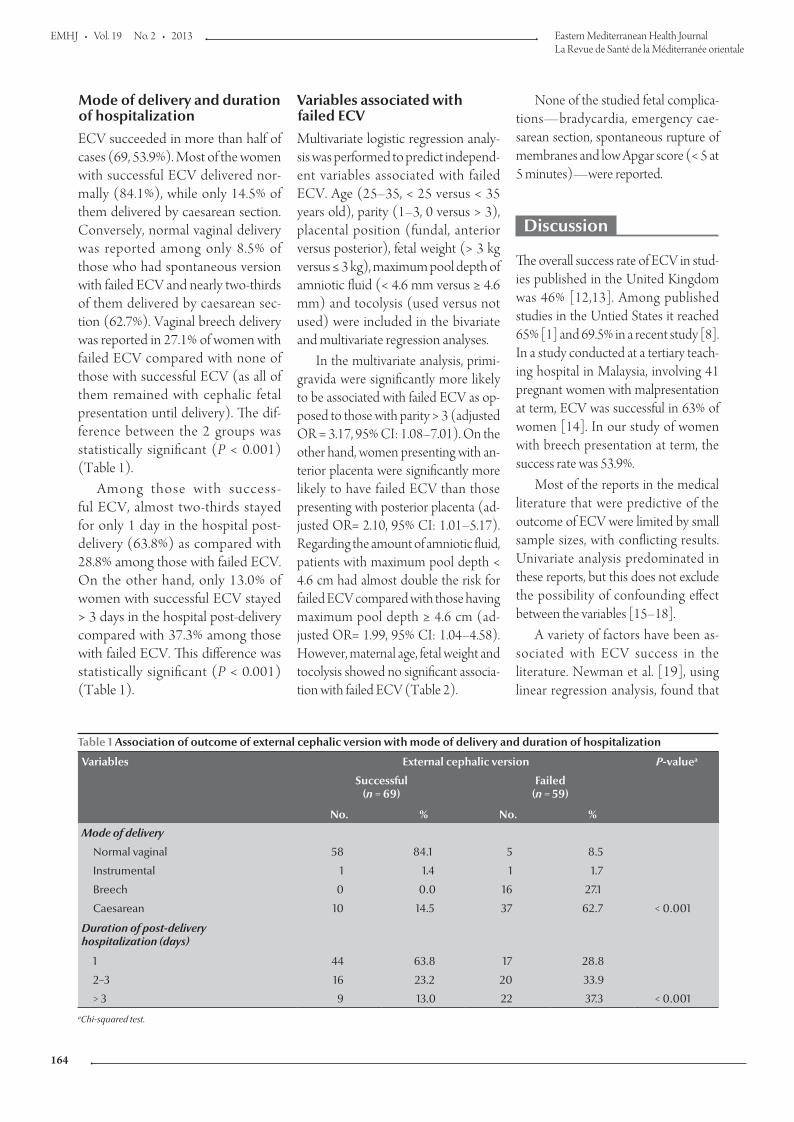
EMHJ • Vol. 19 No. 2 • 2013 Eastern Mediterranean Health JournalLa Revue de Santé de la Méditerranée orientale
164
Variables associated with failed ECVMultivariate logistic regression analy-sis was performed to predict independ-ent variables associated with failed ECV. Age (25–35, < 25 versus < 35 years old), parity (1–3, 0 versus > 3), placental position (fundal, anterior versus posterior), fetal weight (> 3 kg versus ≤ 3 kg), maximum pool depth of amniotic fluid (< 4.6 mm versus ≥ 4.6 mm) and tocolysis (used versus not used) were included in the bivariate and multivariate regression analyses.
In the multivariate analysis, primi-gravida were significantly more likely to be associated with failed ECV as op-posed to those with parity > 3 (adjusted OR = 3.17, 95% CI: 1.08–7.01). On the other hand, women presenting with an-terior placenta were significantly more likely to have failed ECV than those presenting with posterior placenta (ad-justed OR= 2.10, 95% CI: 1.01–5.17). Regarding the amount of amniotic fluid, patients with maximum pool depth < 4.6 cm had almost double the risk for failed ECV compared with those having maximum pool depth ≥ 4.6 cm (ad-justed OR= 1.99, 95% CI: 1.04–4.58). However, maternal age, fetal weight and tocolysis showed no significant associa-tion with failed ECV (Table 2).
None of the studied fetal complica-tions—bradycardia, emergency cae-sarean section, spontaneous rupture of membranes and low Apgar score (< 5 at 5 minutes)—were reported.
Discussion
The overall success rate of ECV in stud-ies published in the United Kingdom was 46% [12,13]. Among published studies in the Untied States it reached 65% [1] and 69.5% in a recent study [8]. In a study conducted at a tertiary teach-ing hospital in Malaysia, involving 41 pregnant women with malpresentation at term, ECV was successful in 63% of women [14]. In our study of women with breech presentation at term, the success rate was 53.9%.
Most of the reports in the medical literature that were predictive of the outcome of ECV were limited by small sample sizes, with conflicting results. Univariate analysis predominated in these reports, but this does not exclude the possibility of confounding effect between the variables [15–18].
A variety of factors have been as-sociated with ECV success in the literature. Newman et al. [19], using linear regression analysis, found that
Mode of delivery and duration of hospitalizationECV succeeded in more than half of cases (69, 53.9%). Most of the women with successful ECV delivered nor-mally (84.1%), while only 14.5% of them delivered by caesarean section. Conversely, normal vaginal delivery was reported among only 8.5% of those who had spontaneous version with failed ECV and nearly two-thirds of them delivered by caesarean sec-tion (62.7%). Vaginal breech delivery was reported in 27.1% of women with failed ECV compared with none of those with successful ECV (as all of them remained with cephalic fetal presentation until delivery). The dif-ference between the 2 groups was statistically significant (P < 0.001) (Table 1).
Among those with success-ful ECV, almost two-thirds stayed for only 1 day in the hospital post-delivery (63.8%) as compared with 28.8% among those with failed ECV. On the other hand, only 13.0% of women with successful ECV stayed > 3 days in the hospital post-delivery compared with 37.3% among those with failed ECV. This difference was statistically significant (P < 0.001) (Table 1).
Table 1 Association of outcome of external cephalic version with mode of delivery and duration of hospitalization
Variables External cephalic version P-valuea
Successful(n = 69)
Failed(n = 59)
No. % No. %
Mode of delivery
Normal vaginal 58 84.1 5 8.5
Instrumental 1 1.4 1 1.7
Breech 0 0.0 16 27.1
Caesarean 10 14.5 37 62.7 < 0.001
Duration of post-delivery hospitalization (days)
1 44 63.8 17 28.8
2–3 16 23.2 20 33.9
> 3 9 13.0 22 37.3 < 0.001aChi-squared test.
Book 19-2.indb 164 2/21/2013 11:39:24 AM
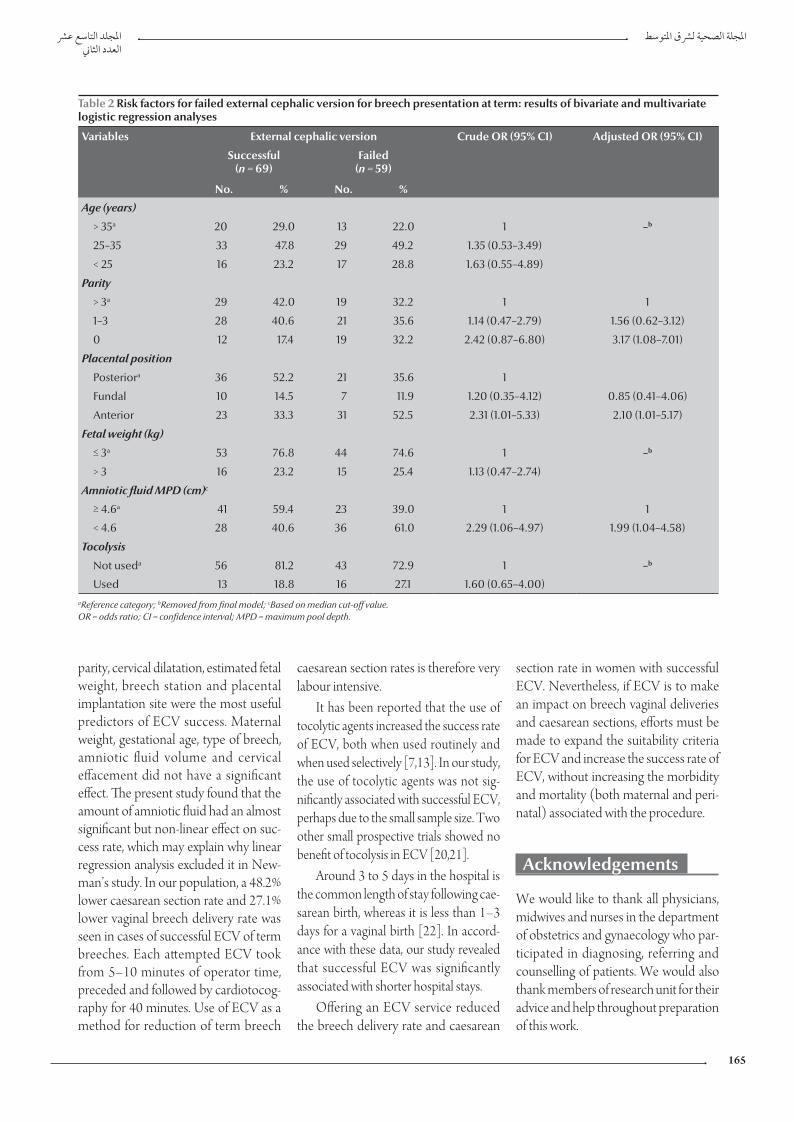
املجلد التاسع عرشاملجلة الصحية لرشق املتوسطالعدد الثاين
165
parity, cervical dilatation, estimated fetal weight, breech station and placental implantation site were the most useful predictors of ECV success. Maternal weight, gestational age, type of breech, amniotic fluid volume and cervical effacement did not have a significant effect. The present study found that the amount of amniotic fluid had an almost significant but non-linear effect on suc-cess rate, which may explain why linear regression analysis excluded it in New-man’s study. In our population, a 48.2% lower caesarean section rate and 27.1% lower vaginal breech delivery rate was seen in cases of successful ECV of term breeches. Each attempted ECV took from 5–10 minutes of operator time, preceded and followed by cardiotocog-raphy for 40 minutes. Use of ECV as a method for reduction of term breech
caesarean section rates is therefore very labour intensive.
It has been reported that the use of tocolytic agents increased the success rate of ECV, both when used routinely and when used selectively [7,13]. In our study, the use of tocolytic agents was not sig-nificantly associated with successful ECV, perhaps due to the small sample size. Two other small prospective trials showed no benefit of tocolysis in ECV [20,21].
Around 3 to 5 days in the hospital is the common length of stay following cae-sarean birth, whereas it is less than 1–3 days for a vaginal birth [22]. In accord-ance with these data, our study revealed that successful ECV was significantly associated with shorter hospital stays.
Offering an ECV service reduced the breech delivery rate and caesarean
section rate in women with successful ECV. Nevertheless, if ECV is to make an impact on breech vaginal deliveries and caesarean sections, efforts must be made to expand the suitability criteria for ECV and increase the success rate of ECV, without increasing the morbidity and mortality (both maternal and peri-natal) associated with the procedure.
Acknowledgements
We would like to thank all physicians, midwives and nurses in the department of obstetrics and gynaecology who par-ticipated in diagnosing, referring and counselling of patients. We would also thank members of research unit for their advice and help throughout preparation of this work.
Table 2 Risk factors for failed external cephalic version for breech presentation at term: results of bivariate and multivariate logistic regression analyses
Variables External cephalic version Crude OR (95% CI) Adjusted OR (95% CI)
Successful(n = 69)
Failed(n = 59)
No. % No. %
Age (years)
> 35a 20 29.0 13 22.0 1 –b
25–35 33 47.8 29 49.2 1.35 (0.53–3.49)
< 25 16 23.2 17 28.8 1.63 (0.55–4.89)
Parity
> 3a 29 42.0 19 32.2 1 1
1–3 28 40.6 21 35.6 1.14 (0.47–2.79) 1.56 (0.62–3.12)
0 12 17.4 19 32.2 2.42 (0.87–6.80) 3.17 (1.08–7.01)
Placental position
Posteriora 36 52.2 21 35.6 1
Fundal 10 14.5 7 11.9 1.20 (0.35–4.12) 0.85 (0.41–4.06)
Anterior 23 33.3 31 52.5 2.31 (1.01–5.33) 2.10 (1.01–5.17)
Fetal weight (kg)
≤ 3a 53 76.8 44 74.6 1 –b
> 3 16 23.2 15 25.4 1.13 (0.47–2.74)
Amniotic fluid MPD (cm)c
≥ 4.6a 41 59.4 23 39.0 1 1
< 4.6 28 40.6 36 61.0 2.29 (1.06–4.97) 1.99 (1.04–4.58)
Tocolysis
Not useda 56 81.2 43 72.9 1 –b
Used 13 18.8 16 27.1 1.60 (0.65–4.00)aReference category; bRemoved from final model; cBased on median cut-off value. OR = odds ratio; CI = confidence interval; MPD = maximum pool depth.
Book 19-2.indb 165 2/21/2013 11:39:24 AM
EMHJ • Vol. 19 No. 2 • 2013 Eastern Mediterranean Health JournalLa Revue de Santé de la Méditerranée orientale
166
References
1. External cephalic version (ECV) and reducing the incidence of breech presentation (Green-top Guideline 20a). London, Royal College of Obstetricians and Gynaecologists, 2006.
2. Danielian PJ, Wang J, Hall MH. Long term outcome by method of delivery of fetuses in breech presentation at term: popula-tion based follow up. British Medical Journal, 1996, 312:1451–1453.
3. Rietberg CC, Elferink-Stinkens PM, Visser GH. The effect of the Term Breech Trial on medical intervention behaviour and neonatal outcome in The Netherlands: an analysis of 35,453 term breech infants. British Journal of Obstetrics and Gynaecol-ogy, 2005, 112:205–209.
4. Hannah ME et al.; Term Breech Trial Collaborative Group. Planned caesarean section versus planned vaginal birth for breech presentation at term: a randomised multicentre trial. Lancet, 2000, 356:1375–1383.
5. Hofmeyr GJ, Hannah ME. Planned caesarean section for term breech delivery. Cochrane Database of Systematic Reviews, 2003, (3):CD000166.
6. Cunningham FG et al. Breech presentation and delivery. In: Williams’ obstetrics, 23rd ed. New York, McGraw-Hill, 2010:527–543.
7. Hofmeyr GJ, Kulier R. External cephalic version for breech presentation at term. Cochrane Database of Systematic Reviews, 2000, (2):CD000083.
8. Zhang J, Bowes EA, Fortney JA. Efficacy of external cephalic version: a review. Obstetrics and Gynecology, 1993, 82:306–312.
9. Lau TK et al. Predictors of successful external cephalic version at term: a prospective study. British Journal of Obstetrics and Gynaecology, 1997, 104:798–802.
10. Shalev E, Battino S, Giladi Y. External cephalic version at term using tocolysis. Acta Obstetricia et Gynecologica Scandinavica, 1993, 72:455–457.
11. Flamm BL et al. External cephalic version after caesarean section. American Journal of Obstetrics and Gynecology, 1991, 165:370–372.
12. Bewley S et al. The introduction of external cephalic version at term into routine clinical practice. European Journal of Ob-stetrics, Gynecology, and Reproductive Biology, 1993, 52:89–93.
13. Breech presentation, management (Green-top Guideline 20b). London, Royal College of Obstetricians and Gynaecologists, 2001.
14. Yong SPY. Introducing external cephalic version in a Malaysian setting. Hong Kong Medical Journal, 2007, 13:40–45.
15. Brocks V, Philipsen T, Secher NJ. A randomized trial of external cephalic version with tocolysis in late pregnancy. British Jour-nal of Obstetrics and Gynaecology, 1984, 91:653–656.
16. Donald WL, Barton JJ. Ultrasonography and external cephalic version at term. American Journal of Obstetrics and Gynecology, 1990, 162:1542–1545.
17. Shalev E et al. External cephalic version at term—using to-colysis. Acta Obstetricia et Gynecologica Scandinavica, 1993, 72:455–457.
18. Klatt TE, Cruikshank DP. Breech, other malpresentations, and umbilical cord complications. In: Gibbs RS, et al., eds. Danforth's Obstetrics and Gynecology, 10th ed. Philadelphia, Lippincott Williams and Wilkins, 2008:400–416.
19. Newman RB et al. Predicting success of external cephalic version. American Journal of Obstetrics and Gynecology, 1993, 169:245–249.
20. Robertson AW et al. External cephalic version at term: is a toco-lytic necessary? Obstetrics and Gynecology, 1987, 70:896–899.
21. Tan GWT et al. A prospective randomised controlled trial of external cephalic version comparing two methods of uterine tocolysis with a non-tocolysis group. Singapore Medical Jour-nal, 1989, 30:155–158.
22. Santrock JW, Brown WC. Child development, 6th ed. Madison, Wisconsin, Brown and Benchmark, 1994.
Book 19-2.indb 166 2/21/2013 11:39:24 AM
املجلد التاسع عرشاملجلة الصحية لرشق املتوسطالعدد الثاين
167
Depression among a group of elders in Alexandria, EgyptH.M. El Kady 1 and H.K. Ibrahim 1
ABSTRACT Depression is projected to be the leading cause of disease burden in older populations by the year 2020. The aim of this study was to assess the prevalence depression among a group of elders in Alexandria, Egypt and compare the characteristic of elders in 3 different settings. A descriptive, cross-sectional study was carried out among 100 people aged 60+ years in a government elderly home, an internal medicine ward in Alexandria Main University Hospital and a slum area in Alexandria. Based on the Geriatric Depression Scale (short form) the highest prevalence of scores that were suggestive or indicative of depression was among elders who were hospitalized (79.0%), had ophthalmic diseases (85.7%) or tumours (80.0%), had 2+ chronic morbidities (64.9%), were taking 4+ medications daily (83,3%), were more physically dependent and had had 2+ hospital admissions in the last 3 years (90.9%). Modifiable factors that impact on depression need to be considered in developing interventions for improving mood states in the elderly.
1Department of Family Health, High Institute of Public Health, University of Alexandria, Alexandria, Egypt (Correspondence to H.K. Ibrahim: [email protected]).
Received: 15/02/12; accepted: 21/02/12
االكتئاب لدى جمموعة من املسنني يف اإلسكندرية، مرصهبة حممود القايض، هالة قدري إبراهيم
انتشار معدل لتقييم الدراسة هذه وهتدف .2020 عام يف املسنني لدى املريض للعبء الرئييس السبب هو سيكون االكتئاب أن ر يقد اخلالصـة: االكتئاب بني جمموعة من املسنني يف اإلسكندرية، مرص، ومقارنة خصائص املسنني يف ثالثة مواقع خمتلفة، وهي دراسة وصفية مستعرضة شملت مئة شخص ممن تزيد أعامرهم عىل ستني عاما، يقيمون يف أحد النزل احلكومية و ىف أحد أجنحة قسم األمراض الباطنة باملستشفى الرئيسى اجلامعى، ويف جناح الطب الباطني ويف أحد املناطق العشوائية يف اإلسكندرية. واستخدمت الباحثتان سلم مقياس االكتئاب للمسنني )بشكله املخترص(، فوجدتا أن أعىل معدالت االنتشار التي تشري أو توحي باالكتئاب كانت لدى املودعني باملستشفى الذين أدخلوا املستشفيات )79%(، أو الذين لدهيم مرض عيني )85.7%(، أو أورام )80%(، أو لدهيم أكثر من مرضني مزمنني )64.9%(، أو الذين يتناولون أكثر من أربعة أدوية يوميا )83.3%(، أو الذين يعتمدون بدنيا عىل غريهم أكثر من سواهم، أو الذين أدخلوا املستشفى ألكثر من مرتني خالل السنوات الثالث املنرصمة )90.9%(. ومتس احلاجة
للنظر يف العوامل القابلة للتعديل والتي تؤثر عىل االكتئاب البتكار تدخالت تستهدف حتسني األحوال املزاجية لدى املسنني.
Dépression dans un groupe d'anciens à Alexandrie (Égypte)
RÉSUMÉ Il a été estimé que la dépression représenterait la cause principale de la charge morbide dans les populations de personnes âgées d'ici 2020. L'objectif de la présente étude était d'évaluer la prévalence de la dépression dans un groupe d'anciens à Alexandrie (Égypte), et de comparer les caractéristiques de ces derniers dans trois milieux différents. Une étude transversale descriptive a été menée auprès de 100 personnes âgées de plus de 60 ans dans une maison de retraite du gouvernement, dans un service de médecine interne et dans un bidonville à Alexandrie. À partir de la version abrégée de l'échelle gériatrique de dépression, les scores indiquant ou suggérant une dépression étaient plus élevés dans les populations suivantes : les anciens hospitalisés (79,0 %), les personnes âgées souffrant de maladies ophtalmiques (85,7 %) ou de tumeurs (80,0 %), atteintes de plus deux comorbidités chroniques (64,9 %), ou prenant plus de quatre traitements quotidiens (83,3 %), ou davantage dépendants physiquement et admis plus de deux fois à l'hôpital au cours des trois années précédentes (90,9 %). Les facteurs modifiables ayant un impact sur la dépression doivent être pris en compte dans l'élaboration d'interventions visant à lutter contre la dépression chez les anciens.
Book 19-2.indb 167 2/21/2013 11:39:25 AM
EMHJ • Vol. 19 No. 2 • 2013 Eastern Mediterranean Health JournalLa Revue de Santé de la Méditerranée orientale
168
Introduction
Depression is an important problem that may highly influence the quality of life of elderly people in different settings. The prevalence of depression in people aged 65 years and older may be as high as 40% in hospitalized and 30% in nursing home patients and 8%–15% in commu-nity settings. Studies of depressed elders indicate that they have comparable or poorer physical functioning than elders with chronic medical conditions such as heart and lung diseases, arthritis and diabetes [1,2]. Depression can increase perceptions of poor health, the utiliza-tion of medical services and health care costs. Conversely, a diagnosis of certain chronic diseases may trigger symptoms of depression [3].
There are many factors related to depression among elders. It has been at-tributed to the increasing stressors with age resulting from declining health and dwindling social relationships [4]. Low socioeconomic status was found to be significantly associated with depression after adjustment for age, illness, sex and self-rated health [5]. Presence of co-morbidity may correlate with depression among the elderly. Also, several clinical trials reported a positive correlation of de-pression with functional decline, impair-ment in activities of daily living (ADL) and a steep decline in strength [6].
Research suggests that the liv-ing environment of older adults is an important determinant of health and longevity. Existing evidence indicates that the health care needs and costs of institutionalized persons are much higher than those of elders in other set-tings [7]. Significant differences have been found between elders residing in institutions or in the community in terms of mortality risk, daily function-ing, disease prevalence, life satisfaction, depression and quality of life [8,9]. For many older adults, especially in devel-oped countries, institutionalization rep-resents a loss of independence, marked by feelings of limited usefulness, a loss
of self-actualization, reliance on others and a general lack of mastery or sense of control. Institutionalized persons are typically those with no spouse or living children or with offspring who are not available to provide care [10]. In many cases, these individuals are considered abandoned by children who have not fulfilled their filial obligations. Conse-quently, the institutionalized are socially disadvantaged and depend on support from limited subsidies from local gov-ernment or collectives [9]. Depression can also have adverse health effects for many hospitalized older adults. High levels of depressive symptoms are asso-ciated with poor treatment adherence, longer lengths of hospital stays, increase in hospital readmission and reduced functional status [11].
Most of the research on this subject is based on high-income countries and little is known about elders in developing countries. The aim of this study was to as-sess the prevalence of depression among elders in Alexandria, Egypt, and compare the characteristics of those from 3 differ-ent settings: hospitalized, institutional-ized or community dwelling.
Methods
Study setting and sampleA descriptive, cross-sectional study was carried out among elders aged 60+ years in a government-run home for the elderly (Dar El Saada), an internal medicine ward in the Main Univer-sity Hospital and a slum area (Ezbet Sekeena) in Alexandria city.
The sample included all elders who were able to communicate and agreed to participate in the study. Using a power of 80% to detect a difference of 37% [4,12] at the depression prevalence among hospitalized and community dwelling elders as the largest recorded difference in comparison to institution-alized elders, α-error = 0.05, the minimal required sample size was found to be 28 (increased to 33) for each group.
The sample size was calculated using Epi-info 2002 software. We randomly selected 33 elders from institutions, 33 who were in hospital at the time of the study and 34 who were currently living in the community.
Data collectionA structured pre-coded interview schedule was used to collect data about sociodemographic characteristics and medical history (the type and number of chronic diseases from which the patient suffered, the number of medica-tions he/she was taking and the number of hospital admissions in the 3 years before the study).
The Katz scale for ADLs was used to assess degree of dependency in performing the basic ADLs including bathing, dressing, toileting, transfer, urinary and faecal continence and feed-ing [13]. The 6 functions are measured and scored according to the individual’s actual performance of these functions. They are categorized into 3 levels of dependency: each item is scored from 0–2, where 2 = full independence without need for human assistance, 1 = partial dependence with the need for some help and 0 = total dependence with an inability to perform the task even with assistance. The total score of the scale is from 0–12. According to the scale patients are classified into 3 categories: totally independent (score 9–12), partially dependent (score 5–8) or totally dependent (score 0–4). The Katz scale was translated in to Arabic language and tested for reliability using test–retest ], which showed a Pearson correlation coefficient of 0.8.
The short form of the Geriatric De-pression Scale (GDS) [14] was used to assess the presence or absence of depression among the elders. The re-sponses to each item are yes/no (scored 1 or 0) and the total scores (15 items) are classified as follows: no depression (score 0–4), suggestive of depression (score 5–9), almost always indicative of depression (score > 9). The scale was
Book 19-2.indb 168 2/21/2013 11:39:25 AM
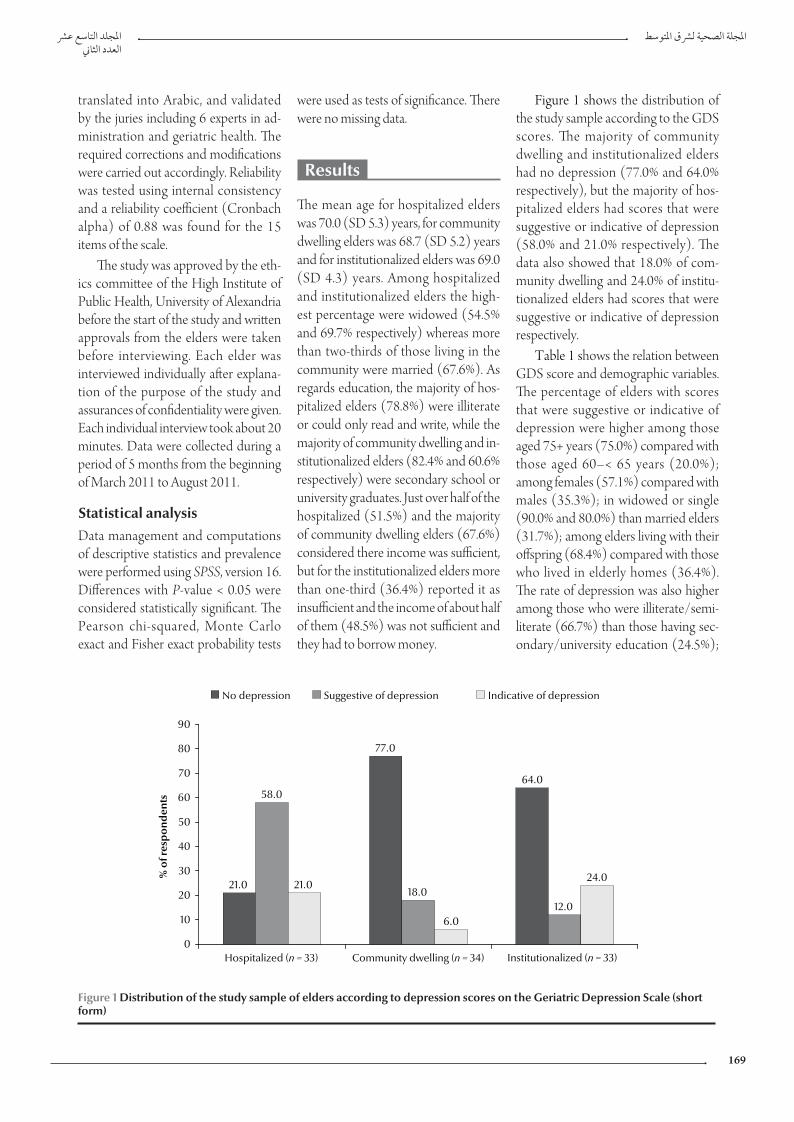
املجلد التاسع عرشاملجلة الصحية لرشق املتوسطالعدد الثاين
169
were used as tests of significance. There were no missing data.
Results
The mean age for hospitalized elders was 70.0 (SD 5.3) years, for community dwelling elders was 68.7 (SD 5.2) years and for institutionalized elders was 69.0 (SD 4.3) years. Among hospitalized and institutionalized elders the high-est percentage were widowed (54.5% and 69.7% respectively) whereas more than two-thirds of those living in the community were married (67.6%). As regards education, the majority of hos-pitalized elders (78.8%) were illiterate or could only read and write, while the majority of community dwelling and in-stitutionalized elders (82.4% and 60.6% respectively) were secondary school or university graduates. Just over half of the hospitalized (51.5%) and the majority of community dwelling elders (67.6%) considered there income was sufficient, but for the institutionalized elders more than one-third (36.4%) reported it as insufficient and the income of about half of them (48.5%) was not sufficient and they had to borrow money.
Figure 1 shows the distribution of the study sample according to the GDS scores. The majority of community dwelling and institutionalized elders had no depression (77.0% and 64.0% respectively), but the majority of hos-pitalized elders had scores that were suggestive or indicative of depression (58.0% and 21.0% respectively). The data also showed that 18.0% of com-munity dwelling and 24.0% of institu-tionalized elders had scores that were suggestive or indicative of depression respectively.
Table 1 shows the relation between GDS score and demographic variables. The percentage of elders with scores that were suggestive or indicative of depression were higher among those aged 75+ years (75.0%) compared with those aged 60–< 65 years (20.0%); among females (57.1%) compared with males (35.3%); in widowed or single (90.0% and 80.0%) than married elders (31.7%); among elders living with their offspring (68.4%) compared with those who lived in elderly homes (36.4%). The rate of depression was also higher among those who were illiterate/semi-literate (66.7%) than those having sec-ondary/university education (24.5%);
translated into Arabic, and validated by the juries including 6 experts in ad-ministration and geriatric health. The required corrections and modifications were carried out accordingly. Reliability was tested using internal consistency and a reliability coefficient (Cronbach alpha) of 0.88 was found for the 15 items of the scale.
The study was approved by the eth-ics committee of the High Institute of Public Health, University of Alexandria before the start of the study and written approvals from the elders were taken before interviewing. Each elder was interviewed individually after explana-tion of the purpose of the study and assurances of confidentiality were given. Each individual interview took about 20 minutes. Data were collected during a period of 5 months from the beginning of March 2011 to August 2011.
Statistical analysisData management and computations of descriptive statistics and prevalence were performed using SPSS, version 16. Differences with P-value < 0.05 were considered statistically significant. The Pearson chi-squared, Monte Carlo exact and Fisher exact probability tests
21.0
77.0
64.058.0
18.012.0
21.0
6.0
24.0
0
10
20
30
40
50
60
70
80
90
Hospitalized (n = 33) Community dwelling (n = 34) Institutionalized (n = 33)
% o
f res
pon
den
ts
No depression Suggestive of depression Indicative of depression
Figure 1 Distribution of the study sample of elders according to depression scores on the Geriatric Depression Scale (short form)
Book 19-2.indb 169 2/21/2013 11:39:25 AM
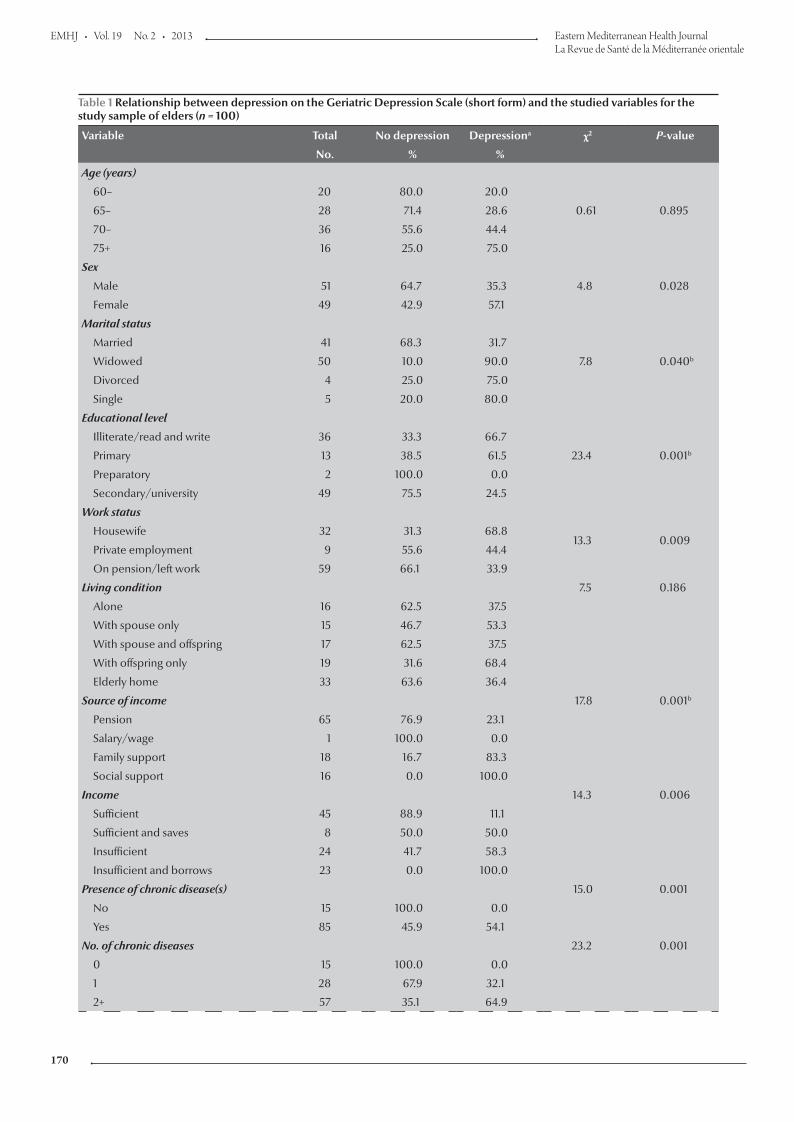
EMHJ • Vol. 19 No. 2 • 2013 Eastern Mediterranean Health JournalLa Revue de Santé de la Méditerranée orientale
170
Table 1 Relationship between depression on the Geriatric Depression Scale (short form) and the studied variables for the study sample of elders (n = 100)
Variable Total No depression Depressiona χ2 P-value
No. % %
Age (years)
0.61 0.895
60– 20 80.0 20.0
65– 28 71.4 28.6
70– 36 55.6 44.4
75+ 16 25.0 75.0
Sex
4.8 0.028Male 51 64.7 35.3
Female 49 42.9 57.1
Marital status
7.8 0.040b
Married 41 68.3 31.7
Widowed 50 10.0 90.0
Divorced 4 25.0 75.0
Single 5 20.0 80.0
Educational level
23.4 0.001b
Illiterate/read and write 36 33.3 66.7
Primary 13 38.5 61.5
Preparatory 2 100.0 0.0
Secondary/university 49 75.5 24.5
Work status
13.3 0.009Housewife 32 31.3 68.8
Private employment 9 55.6 44.4
On pension/left work 59 66.1 33.9
Living condition 7.5 0.186
Alone 16 62.5 37.5
With spouse only 15 46.7 53.3
With spouse and offspring 17 62.5 37.5
With offspring only 19 31.6 68.4
Elderly home 33 63.6 36.4
Source of income 17.8 0.001b
Pension 65 76.9 23.1
Salary/wage 1 100.0 0.0
Family support 18 16.7 83.3
Social support 16 0.0 100.0
Income 14.3 0.006
Sufficient 45 88.9 11.1
Sufficient and saves 8 50.0 50.0
Insufficient 24 41.7 58.3
Insufficient and borrows 23 0.0 100.0
Presence of chronic disease(s) 15.0 0.001
No 15 100.0 0.0
Yes 85 45.9 54.1
No. of chronic diseases 23.2 0.001
0 15 100.0 0.0
1 28 67.9 32.1
2+ 57 35.1 64.9
Book 19-2.indb 170 2/21/2013 11:39:25 AM
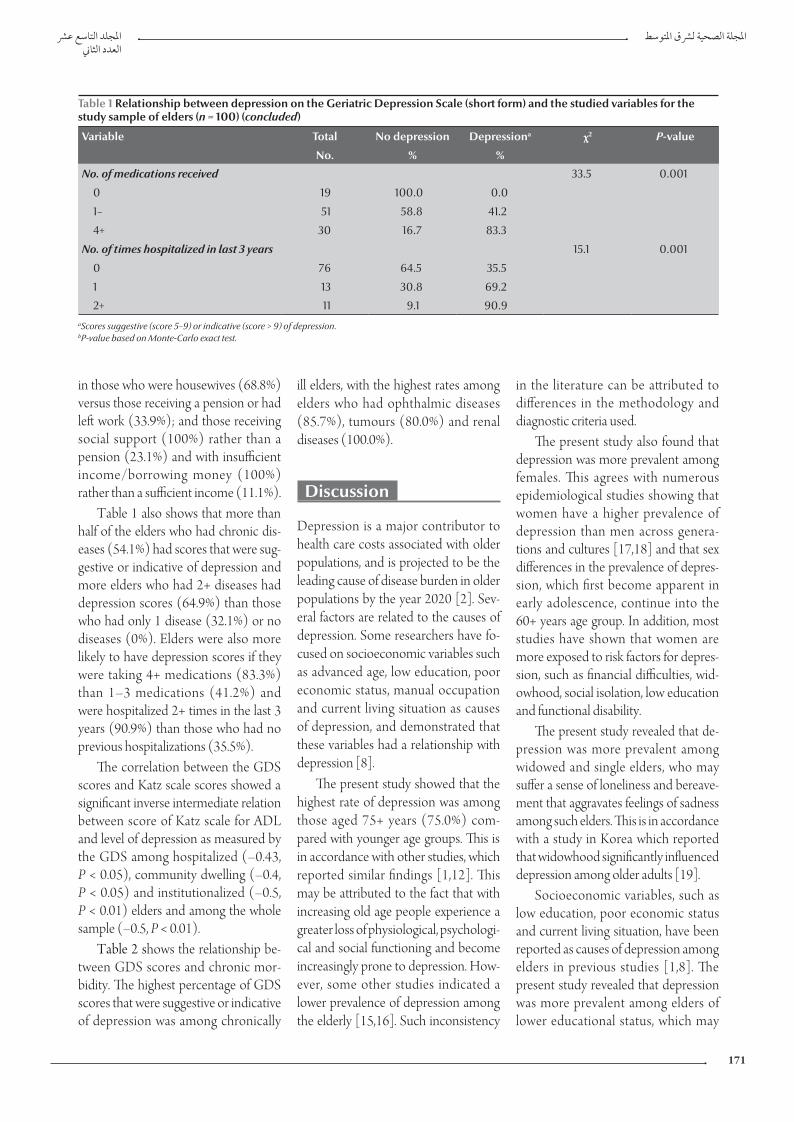
املجلد التاسع عرشاملجلة الصحية لرشق املتوسطالعدد الثاين
171
in those who were housewives (68.8%) versus those receiving a pension or had left work (33.9%); and those receiving social support (100%) rather than a pension (23.1%) and with insufficient income/borrowing money (100%) rather than a sufficient income (11.1%).
Table 1 also shows that more than half of the elders who had chronic dis-eases (54.1%) had scores that were sug-gestive or indicative of depression and more elders who had 2+ diseases had depression scores (64.9%) than those who had only 1 disease (32.1%) or no diseases (0%). Elders were also more likely to have depression scores if they were taking 4+ medications (83.3%) than 1–3 medications (41.2%) and were hospitalized 2+ times in the last 3 years (90.9%) than those who had no previous hospitalizations (35.5%).
The correlation between the GDS scores and Katz scale scores showed a significant inverse intermediate relation between score of Katz scale for ADL and level of depression as measured by the GDS among hospitalized (–0.43, P < 0.05), community dwelling (–0.4, P < 0.05) and institutionalized (–0.5, P < 0.01) elders and among the whole sample (–0.5, P < 0.01).
Table 2 shows the relationship be-tween GDS scores and chronic mor-bidity. The highest percentage of GDS scores that were suggestive or indicative of depression was among chronically
ill elders, with the highest rates among elders who had ophthalmic diseases (85.7%), tumours (80.0%) and renal diseases (100.0%).
Discussion
Depression is a major contributor to health care costs associated with older populations, and is projected to be the leading cause of disease burden in older populations by the year 2020 [2]. Sev-eral factors are related to the causes of depression. Some researchers have fo-cused on socioeconomic variables such as advanced age, low education, poor economic status, manual occupation and current living situation as causes of depression, and demonstrated that these variables had a relationship with depression [8].
The present study showed that the highest rate of depression was among those aged 75+ years (75.0%) com-pared with younger age groups. This is in accordance with other studies, which reported similar findings [1,12]. This may be attributed to the fact that with increasing old age people experience a greater loss of physiological, psychologi-cal and social functioning and become increasingly prone to depression. How-ever, some other studies indicated a lower prevalence of depression among the elderly [15,16]. Such inconsistency
in the literature can be attributed to differences in the methodology and diagnostic criteria used.
The present study also found that depression was more prevalent among females. This agrees with numerous epidemiological studies showing that women have a higher prevalence of depression than men across genera-tions and cultures [17,18] and that sex differences in the prevalence of depres-sion, which first become apparent in early adolescence, continue into the 60+ years age group. In addition, most studies have shown that women are more exposed to risk factors for depres-sion, such as financial difficulties, wid-owhood, social isolation, low education and functional disability.
The present study revealed that de-pression was more prevalent among widowed and single elders, who may suffer a sense of loneliness and bereave-ment that aggravates feelings of sadness among such elders. This is in accordance with a study in Korea which reported that widowhood significantly influenced depression among older adults [19].
Socioeconomic variables, such as low education, poor economic status and current living situation, have been reported as causes of depression among elders in previous studies [1,8]. The present study revealed that depression was more prevalent among elders of lower educational status, which may
Table 1 Relationship between depression on the Geriatric Depression Scale (short form) and the studied variables for the study sample of elders (n = 100) (concluded)
Variable Total No depression Depressiona χ2 P-value
No. % %
No. of medications received 33.5 0.001
0 19 100.0 0.0
1– 51 58.8 41.2
4+ 30 16.7 83.3
No. of times hospitalized in last 3 years 15.1 0.001
0 76 64.5 35.5
1 13 30.8 69.2
2+ 11 9.1 90.9aScores suggestive (score 5–9) or indicative (score > 9) of depression. bP-value based on Monte-Carlo exact test.
Book 19-2.indb 171 2/21/2013 11:39:25 AM
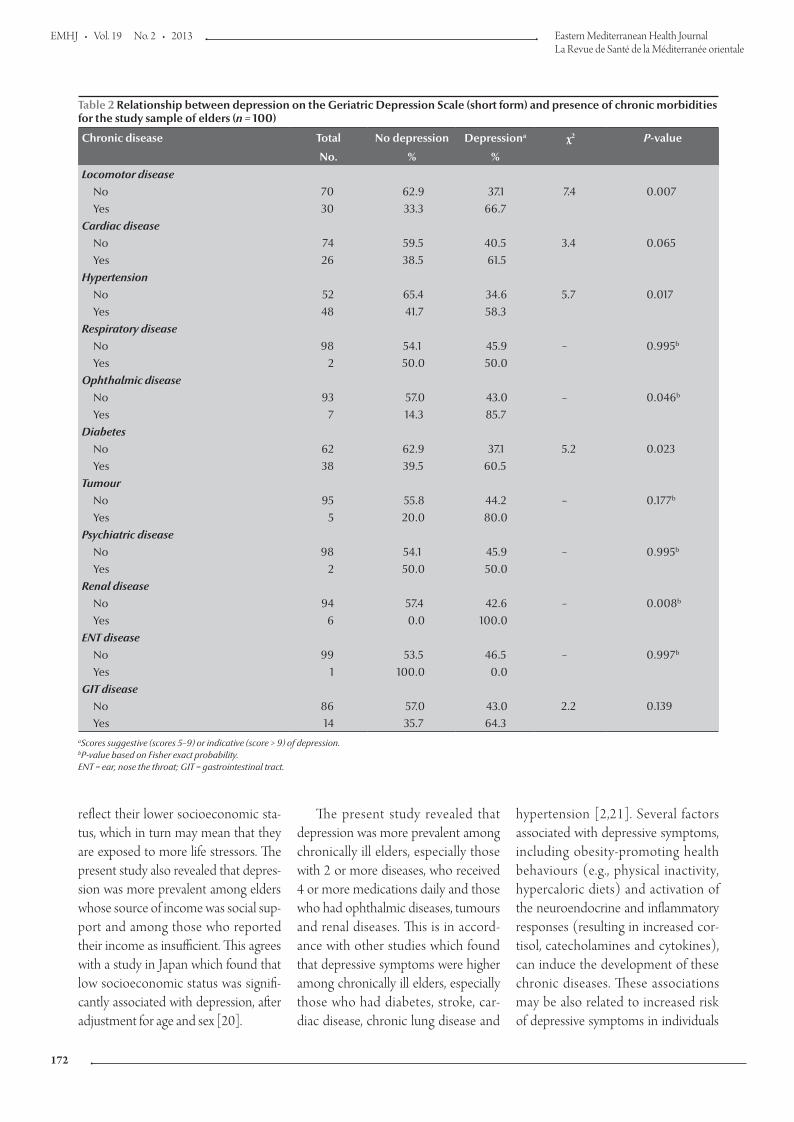
EMHJ • Vol. 19 No. 2 • 2013 Eastern Mediterranean Health JournalLa Revue de Santé de la Méditerranée orientale
172
reflect their lower socioeconomic sta-tus, which in turn may mean that they are exposed to more life stressors. The present study also revealed that depres-sion was more prevalent among elders whose source of income was social sup-port and among those who reported their income as insufficient. This agrees with a study in Japan which found that low socioeconomic status was signifi-cantly associated with depression, after adjustment for age and sex [20].
The present study revealed that depression was more prevalent among chronically ill elders, especially those with 2 or more diseases, who received 4 or more medications daily and those who had ophthalmic diseases, tumours and renal diseases. This is in accord-ance with other studies which found that depressive symptoms were higher among chronically ill elders, especially those who had diabetes, stroke, car-diac disease, chronic lung disease and
hypertension [2,21]. Several factors associated with depressive symptoms, including obesity-promoting health behaviours (e.g., physical inactivity, hypercaloric diets) and activation of the neuroendocrine and inflammatory responses (resulting in increased cor-tisol, catecholamines and cytokines), can induce the development of these chronic diseases. These associations may be also related to increased risk of depressive symptoms in individuals
Table 2 Relationship between depression on the Geriatric Depression Scale (short form) and presence of chronic morbidities for the study sample of elders (n = 100)
Chronic disease Total No depression Depressiona χ2 P-value
No. % %
Locomotor disease7.4 0.007No 70 62.9 37.1
Yes 30 33.3 66.7Cardiac disease
3.4 0.065No 74 59.5 40.5Yes 26 38.5 61.5
Hypertension5.7 0.017No 52 65.4 34.6
Yes 48 41.7 58.3Respiratory disease
– 0.995bNo 98 54.1 45.9Yes 2 50.0 50.0
Ophthalmic disease– 0.046bNo 93 57.0 43.0
Yes 7 14.3 85.7Diabetes
5.2 0.023No 62 62.9 37.1Yes 38 39.5 60.5
Tumour– 0.177bNo 95 55.8 44.2
Yes 5 20.0 80.0Psychiatric disease
– 0.995bNo 98 54.1 45.9Yes 2 50.0 50.0
Renal disease– 0.008bNo 94 57.4 42.6
Yes 6 0.0 100.0ENT disease
– 0.997bNo 99 53.5 46.5Yes 1 100.0 0.0
GIT disease2.2 0.139No 86 57.0 43.0
Yes 14 35.7 64.3aScores suggestive (scores 5–9) or indicative (score > 9) of depression. bP-value based on Fisher exact probability. ENT = ear, nose the throat; GIT = gastrointestinal tract.
Book 19-2.indb 172 2/21/2013 11:39:25 AM
املجلد التاسع عرشاملجلة الصحية لرشق املتوسطالعدد الثاين
173
References
1. Huang CQ et al. Chronic diseases and risk for depression in old age: a meta-analysis of published literature. Ageing Research Reviews, 2010, 9:131–141.
2. Von Korff M et al. Disability and depression among high utiliz-ers of health care. A longitudinal analysis. Archives of General Psychiatry, 1992, 49:91–100.
3. Carvalhais SM et al. The influence of socio-economic condi-tions on the prevalence of depressive symptoms and its covari-ates in an elderly population with slight income differences: the Bambuí Health and Aging Study (BHAS). International Jour-nal of Social Psychiatry, 2008, 54:447–456.
4. Borson S et al. Geriatric mental health services research: strate-gic plan for an aging population. American Journal of Geriatric Psychiatry, 2001, 9:191–204.
5. Demura S, Sato S. Relationships between depression, lifestyle and quality of life in the community dwelling elderly: a com-parison between gender and age groups. Journal of Physiologi-cal Anthropology and Applied Human Science, 2003, 22:159–166.
6. Rantanen T et al. Depressed mood and body mass index as predictors of muscle strength decline in old men. Journal of the American Geriatrics Society, 2000, 48:613–617.
7. Federal Interagency Forum on Aging Related Statistics. Older Americans 2004: key indicators of well-being. Washington DC, US Government Printing Office, 2004.
8. Van Dijk PT et al. Comorbidity and 1-year mortality risks in nursing home residents. Journal of the American Geriatrics Soci-ety, 2005, 53:660–665.
9. Harris Y, Cooper JK. Depressive symptoms in older people predict nursing home admission. Journal of the American Geri-atrics Society, 2006, 54:593–597.
10. Davis MA et al. Living arrangements, changes in living arrange-ments, and survival among community dwelling older adults. American Journal of Public Health, 1997, 87:371–377.
11. Carrie A et al. Patterns and correlates of depression in hospital-ized older adults. Archives of Gerontology and Geriatrics, 2011, 30:33–36.
with these chronic diseases, increased risk of these chronic diseases in indi-viduals with depressive symptoms or both [2].
In the present study, depression was more prevalent among elders who had 2 or more previous hospital admis-sions. This agrees with a study in the United States, which showed that high rates of depressive symptoms were as-sociated with more frequent hospital admissions [11]. The present study also revealed that there was an inverse relationship between scores on the Katz scale for ADL and level of depression as measured by the GDS among the study sample. This is in accordance with several clinical trials that reported a positive correlation of depression with functional decline and impairment of ADL [22,23]. This is due to the fact that physical dependence brings about marked feelings of limited usefulness, loss of self-actualization, reliance on others and a general lack of mastery or sense of control.
Research suggests that the living environment of older adults is an im-portant determinant of their health and longevity. Existing evidence indicates that the health care needs of institu-tionalized persons are much higher than those of elders in other settings [9]. Significant differences have also
been found between institutionalized and community-residing individuals in mortality risk, daily functioning, disease prevalence, life satisfaction, depression and quality of life [11]. In addition, depression can have adverse health ef-fects for many hospitalized older adults. High levels of depressive symptoms are associated with poor treatment adher-ence, longer lengths of stay, increase in hospital readmission and reduced func-tional status [24]. Compounding this relationship is the fact that hospitaliza-tion can increase depressive symptoms in many older adults. The prevalence of depressive symptoms was as high as 50% among hospitalized older adults in a study in Australia, yet it was reported to be much lower in persons 3–12 months after hospital discharge [25]. The present study revealed similar find-ings; depression was more prevalent among hospitalized and institutional-ized elders than among those living in the community.
Most of the previous studies on geri-atric depression have focused on its high prevalence. They have not attempted to reduce the occurrence of depression among elders. The way in which depres-sion among the elderly is related with their residence and competence of ADL has rarely been studied. The identifica-tion of factors to predict the depression
level among the elderly population can pave the way to developing effective interventions for decreasing geriatric depression. Any interventions should be focused on factors that are modifia-ble or on the behavioural characteristics which contribute to depression.
Conclusion
In conclusion, depression rates were higher among hospitalized and insti-tutionalized elders, among women, widowed and single elders, among housewives, among those living with their offspring only and among more physically dependent elders. Depres-sion was also more prevalent among elders whose source of income was social support and among those whose income was insufficient. It was more prevalent among elders having 2 or more chronic morbidities, those taking 4 or more medications daily and those who had 2 or more hospital admissions in the last 3 years. It is recommended that modifiable factors such as com-petence in ADL, presence of chronic morbidities and degree of social and financial support should be considered as variables in developing interven-tions for improving mood states in the elderly.
Book 19-2.indb 173 2/21/2013 11:39:26 AM
EMHJ • Vol. 19 No. 2 • 2013 Eastern Mediterranean Health JournalLa Revue de Santé de la Méditerranée orientale
174
12. Jeon HS, Dunkle RE. Stress and depression among the oldest-old: a longitudinal analysis. Research on Aging, 2009, 31:661–687.
13. Katz S et al. Studies of illness in the aged: the index of ADL: a standardized measure of biological and psychological functions. Journal of the American Medical Association, 1963, 185:914–919.
14. Sheikh JI, Yesavage JA. Geriatric Depression Scale: recent evi-dence and development of a shorter version. In: Brink TL, ed. Clinical gerontology. New York, Haworth Press, 1986:112.
15. Copeland JR et al. Depression in Europe. Geographical distri-bution among older people. British Journal of Psychiatry, 1999, 174:312–321.
16. Mara Cristina F et al. Depressive symptoms and cognitive performance of the elderly: relationship between institution-alization and activity programs. Revista Brasileira de Psiquiatria, 2006, 28:118–121.
17. Wang JK, Su TP, Chou P. Sex differences in prevalence and risk indicators of geriatric depression: the Shih-Pai community-based survey. Journal of the Formosan Medical Association, 2010, 109:345–353.
18. Zunzunegui MV et al.; CLESA Working Group. Gender differ-ences in depressive symptoms among older adults: a cross-national comparison: the CLESA project. Social Psychiatry and Psychiatric Epidemiology, 2007, 42:198–207.
19. Shin KR et al. Depression among community-dwelling older adults in Korea: a prediction model of depression. Archives of Psychiatric Nursing, 2009, 23:50–57.
20. Murata C et al. Association between depression and socio-economic status among community-dwelling elderly in Japan: the Aichi Gerontological Evaluation Study (AGES). Health and Place, 2008, 14:406–414.
21. Nicholson A, Kuper H, Hemingway H. Depression as an aetiologic and prognostic factor in coronary heart disease: a meta-analysis of 6362 events among 146 538 participants in 54 observational studies. European Heart Journal, 2006, 27:2763–2774.
22. Unützer J et al. Depressive symptoms and mortality in a pro-spective study of 2,558 older adults. American Journal of Geriat-ric Psychiatry, 2002, 10:521–530.
23. Onishi J et al. The relationship between functional disability and depressive mood in Japanese older adult inpatients. Jour-nal of Geriatric Psychiatry and Neurology, 2004, 17:93–98.
24. Cullum S et al. Does depression predict adverse outcomes for older medical inpatients? A prospective cohort study of indi-viduals screened for a trial. Age and Ageing, 2008, 37:690–695.
25. Brodaty H et al. Rates of depression at 3 and 15 months post-stroke and their relationship with cognitive decline: the Sydney Stroke Study. American Journal of Geriatric Psychiatry, 2007, 15:477–486.
Development of regional survey on ageing and health
The World Health Organization Regional Office for the Eastern Mediterranean (WHO/EMRO) is currently developing a regional comprehensive survey on ageing and health in Member States to collect a range of data on older persons. Data will be collected on demographic, socioeconomic, health, age-friendly health services and relevant legislation indicators in order to create an up-to-date database to inform evidence-based decision-making regarding comprehensive care for the elderly at the country and regional levels.
This survey will seek to include data on monitoring and evaluation of national capacities, numbers of primary health care centres which meet the criteria of age-friendly primary health care and changes in the environment which promote the development of age-friendly cities, and in turn, age-friendly countries
Further information about the work of WHO/EMRO on the health of the elderly is available at: http://www.emro.who.int/fr/entity/elderly-health/
Book 19-2.indb 174 2/21/2013 11:39:26 AM
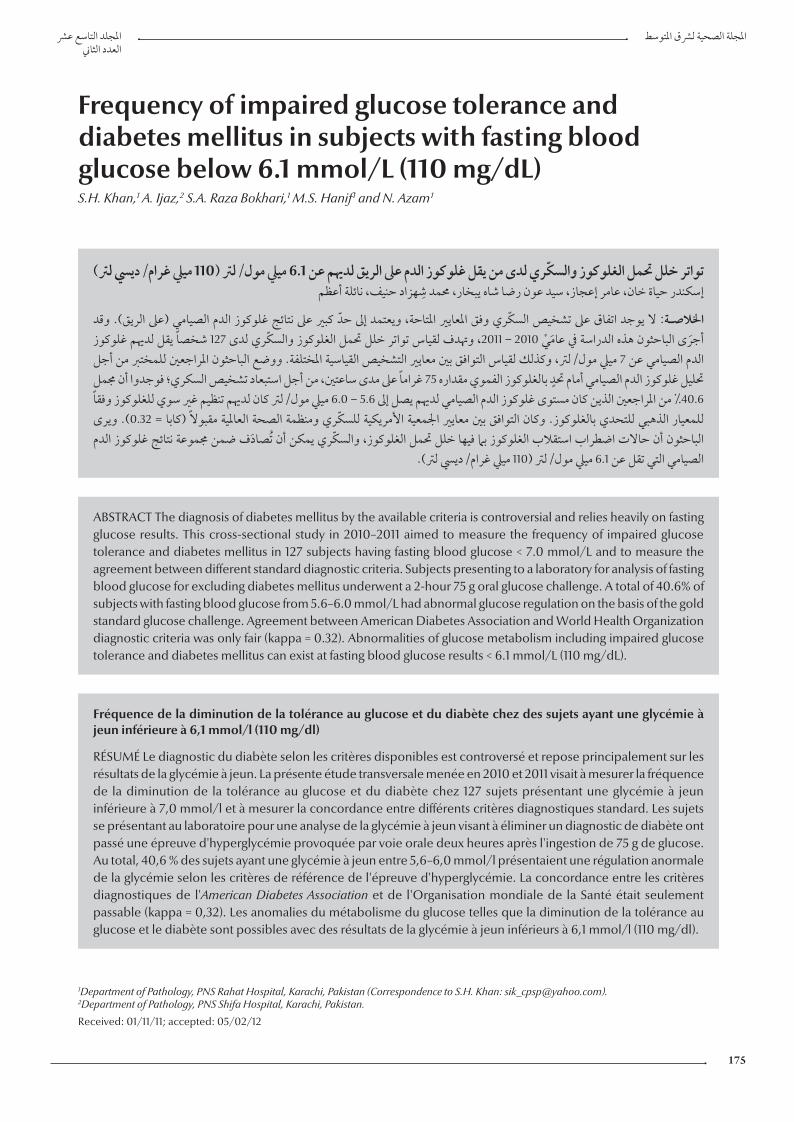
املجلد التاسع عرشاملجلة الصحية لرشق املتوسطالعدد الثاين
175
Frequency of impaired glucose tolerance and diabetes mellitus in subjects with fasting blood glucose below 6.1 mmol/L (110 mg/dL)S.H. Khan,1 A. Ijaz,2 S.A. Raza Bokhari,1 M.S. Hanif 1 and N. Azam 1
ABSTRACT The diagnosis of diabetes mellitus by the available criteria is controversial and relies heavily on fasting glucose results. This cross-sectional study in 2010–2011 aimed to measure the frequency of impaired glucose tolerance and diabetes mellitus in 127 subjects having fasting blood glucose < 7.0 mmol/L and to measure the agreement between different standard diagnostic criteria. Subjects presenting to a laboratory for analysis of fasting blood glucose for excluding diabetes mellitus underwent a 2-hour 75 g oral glucose challenge. A total of 40.6% of subjects with fasting blood glucose from 5.6–6.0 mmol/L had abnormal glucose regulation on the basis of the gold standard glucose challenge. Agreement between American Diabetes Association and World Health Organization diagnostic criteria was only fair (kappa = 0.32). Abnormalities of glucose metabolism including impaired glucose tolerance and diabetes mellitus can exist at fasting blood glucose results < 6.1 mmol/L (110 mg/dL).
1Department of Pathology, PNS Rahat Hospital, Karachi, Pakistan (Correspondence to S.H. Khan: [email protected]).2Department of Pathology, PNS Shifa Hospital, Karachi, Pakistan.
Received: 01/11/11; accepted: 05/02/12
تواتر خلل حتمل الغلوكوز والسكري لدى من يقل غلوكوز الدم عىل الريق لدهيم عن 6.1 مييل مول/لرت )110 مييل غرام/دييس لرت(إسكندر حياة خان، عامر إعجاز، سيد عون رضا شاه يبخار، حممد شهزاد حنيف، نائلة أعظم
الريق(. وقد الصيامي )عىل الدم نتائج غلوكوز إىل حد كبري عىل املتاحة، ويعتمد املعايري السكري وفق اتفاق عىل تشخيص يوجد اخلالصـة: ال أجرى الباحثون هذه الدراسة يف عامي 2010 - 2011، وهتدف لقياس تواتر خلل حتمل الغلوكوز والسكري لدى 127 شخصا يقل لدهيم غلوكوز الدم الصيامي عن 7 مييل مول/لرت، وكذلك لقياس التوافق بني معايري التشخيص القياسية املختلفة. ووضع الباحثون املراجعني للمخترب من أجل حتليل غلوكوز الدم الصيامي أمام حتد بالغلوكوز الفموي مقداره 75 غراما عىل مدى ساعتني، من أجل استبعاد تشخيص السكري؛ فوجدوا أن جممل 40.6% من املراجعني الذين كان مستوى غلوكوز الدم الصيامي لدهيم يصل إىل 5.6 - 6.0 مييل مول/لرت كان لدهيم تنظيم غري سوي للغلوكوز وفقا
0.32(. ويرى )كابا = العاملية مقبوال الصحة للسكري ومنظمة التوافق بني معايري اجلمعية األمريكية بالغلوكوز. وكان للتحدي الذهبي للمعيار الباحثون أن حاالت اضطراب استقالب الغلوكوز بام فيها خلل حتمل الغلوكوز، والسكري يمكن أن تصادف ضمن جمموعة نتائج غلوكوز الدم
الصيامي التي تقل عن 6.1 مييل مول/لرت )110 مييل غرام/دييس لرت(.
Fréquence de la diminution de la tolérance au glucose et du diabète chez des sujets ayant une glycémie à jeun inférieure à 6,1 mmol/l (110 mg/dl)
RÉSUMÉ Le diagnostic du diabète selon les critères disponibles est controversé et repose principalement sur les résultats de la glycémie à jeun. La présente étude transversale menée en 2010 et 2011 visait à mesurer la fréquence de la diminution de la tolérance au glucose et du diabète chez 127 sujets présentant une glycémie à jeun inférieure à 7,0 mmol/l et à mesurer la concordance entre différents critères diagnostiques standard. Les sujets se présentant au laboratoire pour une analyse de la glycémie à jeun visant à éliminer un diagnostic de diabète ont passé une épreuve d'hyperglycémie provoquée par voie orale deux heures après l'ingestion de 75 g de glucose. Au total, 40,6 % des sujets ayant une glycémie à jeun entre 5,6–6,0 mmol/l présentaient une régulation anormale de la glycémie selon les critères de référence de l'épreuve d'hyperglycémie. La concordance entre les critères diagnostiques de l'American Diabetes Association et de l'Organisation mondiale de la Santé était seulement passable (kappa = 0,32). Les anomalies du métabolisme du glucose telles que la diminution de la tolérance au glucose et le diabète sont possibles avec des résultats de la glycémie à jeun inférieurs à 6,1 mmol/l (110 mg/dl).
Book 19-2.indb 175 2/21/2013 11:39:26 AM
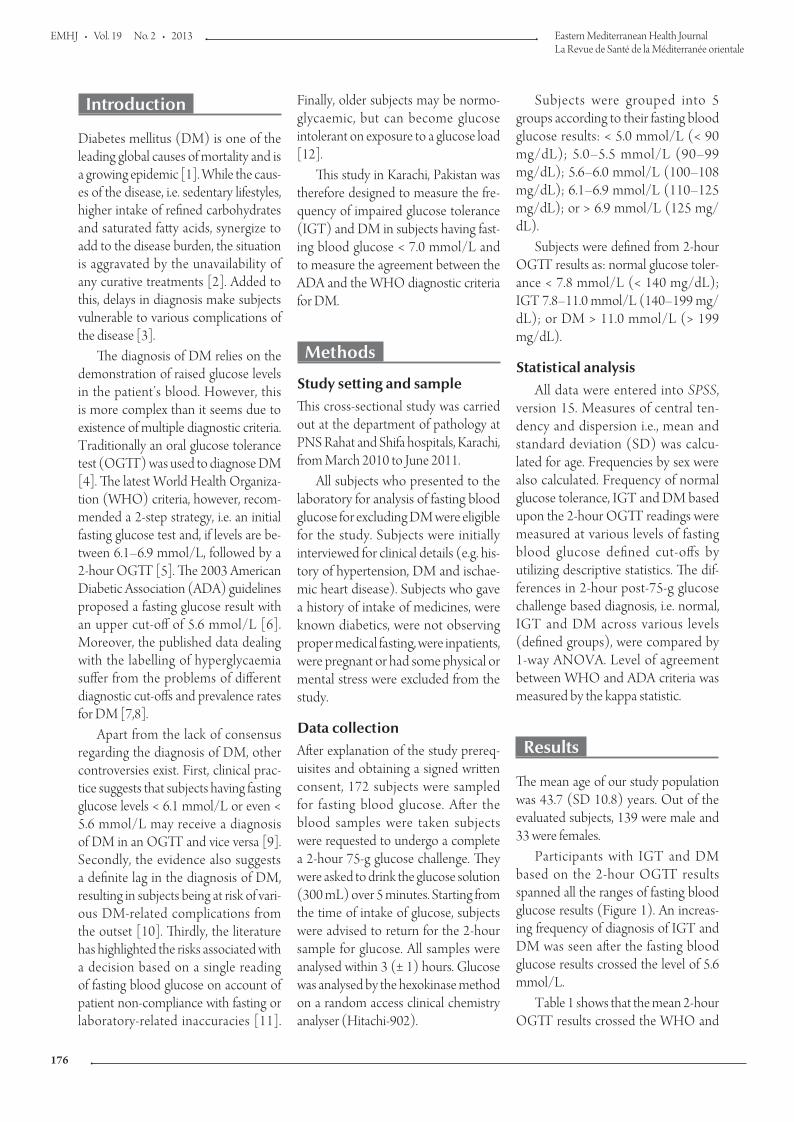
EMHJ • Vol. 19 No. 2 • 2013 Eastern Mediterranean Health JournalLa Revue de Santé de la Méditerranée orientale
176
Introduction
Diabetes mellitus (DM) is one of the leading global causes of mortality and is a growing epidemic [1]. While the caus-es of the disease, i.e. sedentary lifestyles, higher intake of refined carbohydrates and saturated fatty acids, synergize to add to the disease burden, the situation is aggravated by the unavailability of any curative treatments [2]. Added to this, delays in diagnosis make subjects vulnerable to various complications of the disease [3].
The diagnosis of DM relies on the demonstration of raised glucose levels in the patient’s blood. However, this is more complex than it seems due to existence of multiple diagnostic criteria. Traditionally an oral glucose tolerance test (OGTT) was used to diagnose DM [4]. The latest World Health Organiza-tion (WHO) criteria, however, recom-mended a 2-step strategy, i.e. an initial fasting glucose test and, if levels are be-tween 6.1–6.9 mmol/L, followed by a 2-hour OGTT [5]. The 2003 American Diabetic Association (ADA) guidelines proposed a fasting glucose result with an upper cut-off of 5.6 mmol/L [6]. Moreover, the published data dealing with the labelling of hyperglycaemia suffer from the problems of different diagnostic cut-offs and prevalence rates for DM [7,8].
Apart from the lack of consensus regarding the diagnosis of DM, other controversies exist. First, clinical prac-tice suggests that subjects having fasting glucose levels < 6.1 mmol/L or even < 5.6 mmol/L may receive a diagnosis of DM in an OGTT and vice versa [9]. Secondly, the evidence also suggests a definite lag in the diagnosis of DM, resulting in subjects being at risk of vari-ous DM-related complications from the outset [10]. Thirdly, the literature has highlighted the risks associated with a decision based on a single reading of fasting blood glucose on account of patient non-compliance with fasting or laboratory-related inaccuracies [11].
Finally, older subjects may be normo-glycaemic, but can become glucose intolerant on exposure to a glucose load [12].
This study in Karachi, Pakistan was therefore designed to measure the fre-quency of impaired glucose tolerance (IGT) and DM in subjects having fast-ing blood glucose < 7.0 mmol/L and to measure the agreement between the ADA and the WHO diagnostic criteria for DM.
Methods
Study setting and sampleThis cross-sectional study was carried out at the department of pathology at PNS Rahat and Shifa hospitals, Karachi, from March 2010 to June 2011.
All subjects who presented to the laboratory for analysis of fasting blood glucose for excluding DM were eligible for the study. Subjects were initially interviewed for clinical details (e.g. his-tory of hypertension, DM and ischae-mic heart disease). Subjects who gave a history of intake of medicines, were known diabetics, were not observing proper medical fasting, were inpatients, were pregnant or had some physical or mental stress were excluded from the study.
Data collectionAfter explanation of the study prereq-uisites and obtaining a signed written consent, 172 subjects were sampled for fasting blood glucose. After the blood samples were taken subjects were requested to undergo a complete a 2-hour 75-g glucose challenge. They were asked to drink the glucose solution (300 mL) over 5 minutes. Starting from the time of intake of glucose, subjects were advised to return for the 2-hour sample for glucose. All samples were analysed within 3 (± 1) hours. Glucose was analysed by the hexokinase method on a random access clinical chemistry analyser (Hitachi-902).
Subjects were grouped into 5 groups according to their fasting blood glucose results: < 5.0 mmol/L (< 90 mg/dL); 5.0–5.5 mmol/L (90–99 mg/dL); 5.6–6.0 mmol/L (100–108 mg/dL); 6.1–6.9 mmol/L (110–125 mg/dL); or > 6.9 mmol/L (125 mg/dL).
Subjects were defined from 2-hour OGTT results as: normal glucose toler-ance < 7.8 mmol/L (< 140 mg/dL); IGT 7.8–11.0 mmol/L (140–199 mg/dL); or DM > 11.0 mmol/L (> 199 mg/dL).
Statistical analysisAll data were entered into SPSS,
version 15. Measures of central ten-dency and dispersion i.e., mean and standard deviation (SD) was calcu-lated for age. Frequencies by sex were also calculated. Frequency of normal glucose tolerance, IGT and DM based upon the 2-hour OGTT readings were measured at various levels of fasting blood glucose defined cut-offs by utilizing descriptive statistics. The dif-ferences in 2-hour post-75-g glucose challenge based diagnosis, i.e. normal, IGT and DM across various levels (defined groups), were compared by 1-way ANOVA. Level of agreement between WHO and ADA criteria was measured by the kappa statistic.
Results
The mean age of our study population was 43.7 (SD 10.8) years. Out of the evaluated subjects, 139 were male and 33 were females.
Participants with IGT and DM based on the 2-hour OGTT results spanned all the ranges of fasting blood glucose results (Figure 1). An increas-ing frequency of diagnosis of IGT and DM was seen after the fasting blood glucose results crossed the level of 5.6 mmol/L.
Table 1 shows that the mean 2-hour OGTT results crossed the WHO and
Book 19-2.indb 176 2/21/2013 11:39:26 AM
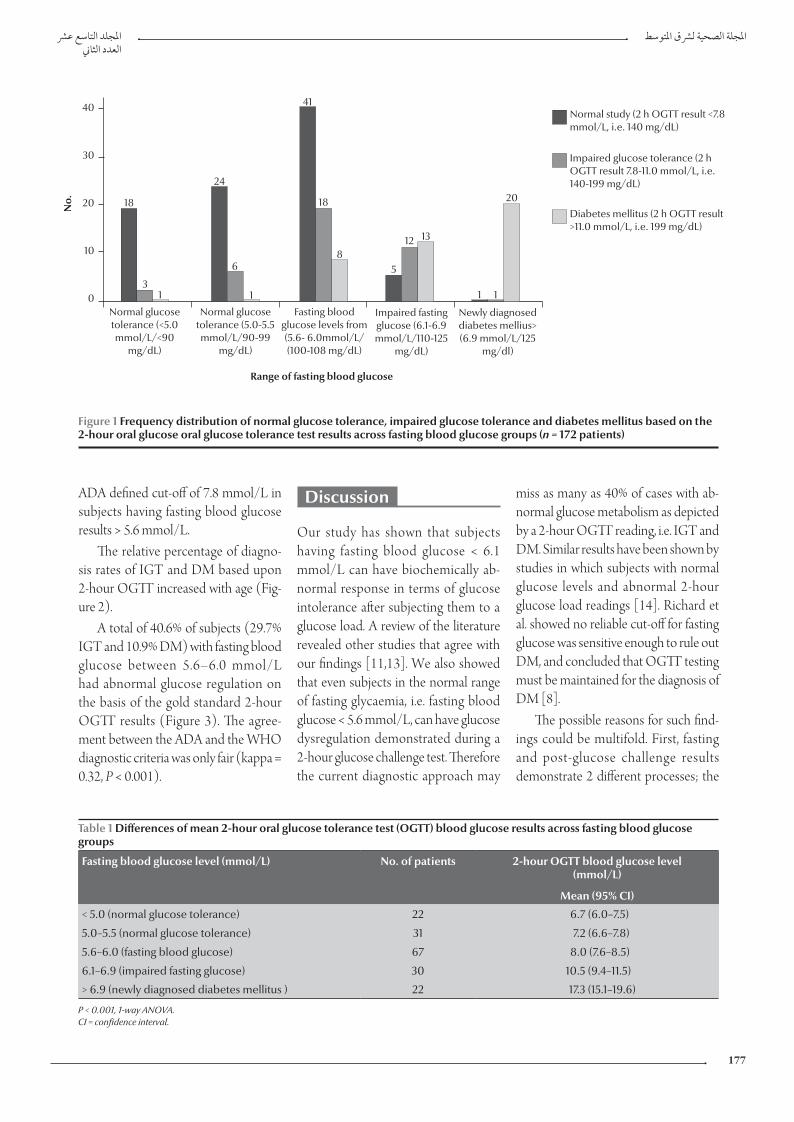
املجلد التاسع عرشاملجلة الصحية لرشق املتوسطالعدد الثاين
177
Discussion
Our study has shown that subjects having fasting blood glucose < 6.1 mmol/L can have biochemically ab-normal response in terms of glucose intolerance after subjecting them to a glucose load. A review of the literature revealed other studies that agree with our findings [11,13]. We also showed that even subjects in the normal range of fasting glycaemia, i.e. fasting blood glucose < 5.6 mmol/L, can have glucose dysregulation demonstrated during a 2-hour glucose challenge test. Therefore the current diagnostic approach may
miss as many as 40% of cases with ab-normal glucose metabolism as depicted by a 2-hour OGTT reading, i.e. IGT and DM. Similar results have been shown by studies in which subjects with normal glucose levels and abnormal 2-hour glucose load readings [14]. Richard et al. showed no reliable cut-off for fasting glucose was sensitive enough to rule out DM, and concluded that OGTT testing must be maintained for the diagnosis of DM [8].
The possible reasons for such find-ings could be multifold. First, fasting and post-glucose challenge results demonstrate 2 different processes; the
ADA defined cut-off of 7.8 mmol/L in subjects having fasting blood glucose results > 5.6 mmol/L.
The relative percentage of diagno-sis rates of IGT and DM based upon 2-hour OGTT increased with age (Fig-ure 2).
A total of 40.6% of subjects (29.7% IGT and 10.9% DM) with fasting blood glucose between 5.6–6.0 mmol/L had abnormal glucose regulation on the basis of the gold standard 2-hour OGTT results (Figure 3). The agree-ment between the ADA and the WHO diagnostic criteria was only fair (kappa = 0.32, P < 0.001).
Table 1 Differences of mean 2-hour oral glucose tolerance test (OGTT) blood glucose results across fasting blood glucose groups
Fasting blood glucose level (mmol/L) No. of patients 2-hour OGTT blood glucose level(mmol/L)
Mean (95% CI)
< 5.0 (normal glucose tolerance) 22 6.7 (6.0–7.5)
5.0–5.5 (normal glucose tolerance) 31 7.2 (6.6–7.8)
5.6–6.0 (fasting blood glucose) 67 8.0 (7.6–8.5)
6.1–6.9 (impaired fasting glucose) 30 10.5 (9.4–11.5)
> 6.9 (newly diagnosed diabetes mellitus ) 22 17.3 (15.1–19.6)
P < 0.001, 1-way ANOVA. CI = confidence interval.
40
30
20
10
0Normal glucose tolerance (<5.0 mmol/L/<90
mg/dL)
Normal glucose tolerance (5.0-5.5 mmol/L/90-99
mg/dL)
Fasting blood glucose levels from (5.6- 6.0mmol/L/(100-108 mg/dL)
Impaired fasting glucose (6.1-6.9 mmol/L/110-125
mg/dL)
Newly diagnosed diabetes mellius> (6.9 mmol/L/125
mg/dl)
41
18
8
18
31
24
6
1
5
12 13
1 1
20
Normal study (2 h OGTT result <7.8 mmol/L, i.e. 140 mg/dL)
Impaired glucose tolerance (2 h OGTT result 7.8-11.0 mmol/L, i.e. 140-199 mg/dL)
Diabetes mellitus (2 h OGTT result >11.0 mmol/L, i.e. 199 mg/dL)
Range of fasting blood glucose
No.
Figure 1 Frequency distribution of normal glucose tolerance, impaired glucose tolerance and diabetes mellitus based on the 2-hour oral glucose oral glucose tolerance test results across fasting blood glucose groups (n = 172 patients)
Book 19-2.indb 177 2/21/2013 11:39:26 AM
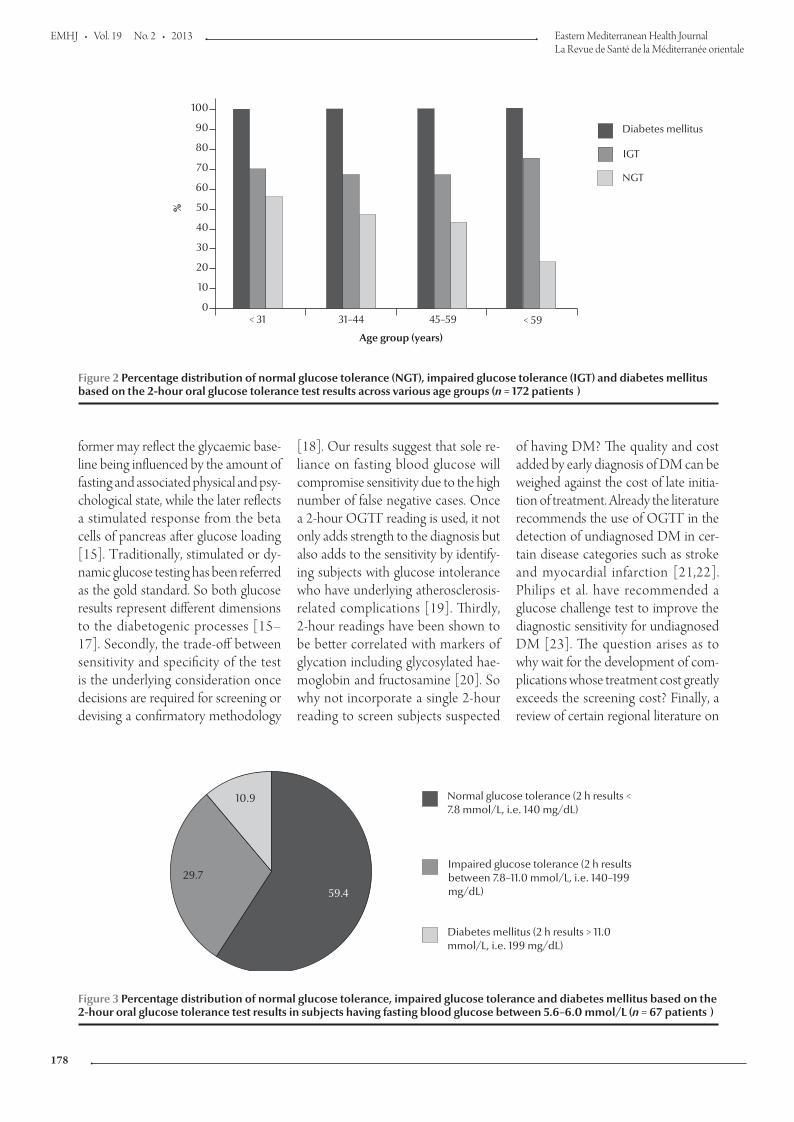
EMHJ • Vol. 19 No. 2 • 2013 Eastern Mediterranean Health JournalLa Revue de Santé de la Méditerranée orientale
178
former may reflect the glycaemic base-line being influenced by the amount of fasting and associated physical and psy-chological state, while the later reflects a stimulated response from the beta cells of pancreas after glucose loading [15]. Traditionally, stimulated or dy-namic glucose testing has been referred as the gold standard. So both glucose results represent different dimensions to the diabetogenic processes [15–17]. Secondly, the trade-off between sensitivity and specificity of the test is the underlying consideration once decisions are required for screening or devising a confirmatory methodology
[18]. Our results suggest that sole re-liance on fasting blood glucose will compromise sensitivity due to the high number of false negative cases. Once a 2-hour OGTT reading is used, it not only adds strength to the diagnosis but also adds to the sensitivity by identify-ing subjects with glucose intolerance who have underlying atherosclerosis-related complications [19]. Thirdly, 2-hour readings have been shown to be better correlated with markers of glycation including glycosylated hae-moglobin and fructosamine [20]. So why not incorporate a single 2-hour reading to screen subjects suspected
of having DM? The quality and cost added by early diagnosis of DM can be weighed against the cost of late initia-tion of treatment. Already the literature recommends the use of OGTT in the detection of undiagnosed DM in cer-tain disease categories such as stroke and myocardial infarction [21,22]. Philips et al. have recommended a glucose challenge test to improve the diagnostic sensitivity for undiagnosed DM [23]. The question arises as to why wait for the development of com-plications whose treatment cost greatly exceeds the screening cost? Finally, a review of certain regional literature on
Figure 2 Percentage distribution of normal glucose tolerance (NGT), impaired glucose tolerance (IGT) and diabetes mellitus based on the 2-hour oral glucose tolerance test results across various age groups (n = 172 patients )
100
90
80
70
60
50
40
30
20
10
0< 31 31–44 45–59 < 59
Diabetes mellitus
IGT
NGT%
Age group (years)
59.4
29.7
10.9 Normal glucose tolerance (2 h results < 7.8 mmol/L, i.e. 140 mg/dL)
Impaired glucose tolerance (2 h results between 7.8–11.0 mmol/L, i.e. 140–199 mg/dL)
Diabetes mellitus (2 h results > 11.0 mmol/L, i.e. 199 mg/dL)
Figure 3 Percentage distribution of normal glucose tolerance, impaired glucose tolerance and diabetes mellitus based on the 2-hour oral glucose tolerance test results in subjects having fasting blood glucose between 5.6–6.0 mmol/L (n = 67 patients )
Book 19-2.indb 178 2/21/2013 11:39:27 AM
املجلد التاسع عرشاملجلة الصحية لرشق املتوسطالعدد الثاين
179
References
1. Farag YM, Gaballa MR. Diabesity: an overview of a ris-ing epidemic. Nephrology, Dialysis, Transplantation, 2011, 26:28–35.
2. Chang K. Comorbidities, quality of life and patients' willing-ness to pay for a cure for type 2 diabetes in Taiwan. Public Health, 2010, 124:284–294.
3. Baldé NM et al. Frequency of diabetic microangiopathy in newly diagnosed diabetes mellitus in Conakry: late diagnosis and lack of screening. Dakar Med., 2007, 52:165–170.
4. National Diabetes Data Group. Classification and diagnosis of diabetes mellitus and other categories of glucose intolerance. Diabetes, 1979, 28:1039–1057.
5. Definition and diagnosis of diabetes mellitus and intermediate hyperglycaemia. Report of a WHO/IDF consultation. Geneva, World Health Organization, 2006.
6. Summary of revisions for the 2010 clinical practice recommen-dations. Diabetes Care, 2010, 33(Suppl. 1):S3.
7. Herdzik E et al. Comparison of ADA and WHO diagnostic criteria for diabetes diagnosis and other categories of glucose intolerance. Polski Merkuriusz Lekarski, 2002, 13:316–320.
8. Richard JL et al. Diagnosis of diabetes mellitus and intermedi-ate glucose abnormalities in obese subjects based on ADA (1997) and WHO (1985) criteria. Diabetic Medicine, 2002, 19:292–299.
9. Tirosh A et al. Normal fasting plasma glucose levels and type 2 diabetes in young men. New England Journal of Medicine, 2005, 353:1454–1462.
10. Haffner SM et al. Cardiovascular risk factors in confirmed pre-diabetic individuals. Does the clock for coronary heart disease start ticking before the onset of clinical diabetes? Journal of the American Medical Association, 1990, 263:2893–2898.
11. Balion CM et al. Reproducibility of impaired glucose toler-ance (IGT) and impaired fasting glucose (IFG) classification: a systematic review. Clinical Chemistry and Laboratory Medicine, 2007, 45:1180–1185.
12. Choi KM et al. Comparison of ADA and WHO criteria for the diagnosis of diabetes in elderly Koreans. Diabetic Medicine, 2002, 19:853–857.
13. Kuzuya T et al. Committee of the Japan Diabetes Society on the diagnostic criteria of diabetes mellitus. Report of the Commit-tee on the classification and diagnostic criteria of diabetes mel-litus. Diabetes Research and Clinical Practice, 2002, 55:65–85.
14. De Vegt F et al. Relation of impaired fasting and post load glucose with incident type 2 diabetes in a Dutch population: The Hoorn Study. Journal of the American Medical Association, 2001, 285:2109–2113.
15. Li HY et al. The performance of risk scores and hemoglobin A1c to find undiagnosed diabetes with isolated post load hypergly-cemia. Endocrine Journal, 2011, 58:441–448.
16. Temelkova-Kurktschiev TS, Hanefeld M. Oral glucose toler-ance test: to be or not to be performed? Clinical Laboratory, 2002, 48:143–152.
17. Silverman RA et al. Hemoglobin A1c as a screen for previously undiagnosed prediabetes and diabetes in an acute-care set-ting. Diabetes Care, 2011, 34(9):1908–1912.
diabetes screening highlights the vary-ing recommendations about screening in our population in contrast to their non-Asian counterparts [12,24]. More regional literature do exist recom-mending a lower threshold of screen-ing for DM in our population [24–26]. Thus racial and regional differences in the pattern of diabetes could be an-other reason for subjects demonstrat-ing glucose intolerance during glucose loading.
Comparing WHO criteria for di-agnosis of diabetes with ADA criteria shows minimal agreement between the 2 definitions of similar disease. The available literature review does sug-gest comparable results [7,8,27]. In the opinion of the authors, the lower cut-offs may be more compatible with the screening concept for diagnosing DM, while subjects having a slightly higher degree of clinical suspicion may be further confirmed by adopting the 2-hour OGTT test as per WHO recommendations. There may also
be an argument for further lowering the cut-offs for our population, but prospective clinical trials must address this issue [18].
We have also observed that ageing is related to post-glucose load intolerance. Choi et al. reported similar findings [12]. The reason could be the age-related deterioration in the functioning of beta cells of the pancreas or the development of insulin resistance which appears later in life [12,28].
There are some limitations to our study which should be noted. First, stress hyperglycaemia is a known en-tity. Attempts were made to exclude subjects with any degree of physical ailments, but a psychological stress evaluation was not carried out among our subjects. Secondly, the results may have been confounded by the presence of obesity, hypertension or ischaemic heart disease.
This study was clinically important because it highlighted controversies associated with the diagnostic criteria
for DM. At present clinical practice suggests labelling of individuals as normoglycaemic based on a fasting blood glucose result. However, in the light of our findings it can be suggested that a patient can have DM when the fasting blood glucose result is normal. Interpretation of fasting blood glucose results must include consideration of a patient’s age and clinical information. Moreover, a 2-hour OGTT reading should also be considered as a screen-ing test after a necessary cost–benefit analysis and consensus among the au-thorities.
Conclusion
Abnormalities of glucose metabolism including impaired glucose tolerance and DM can exist at fasting blood glu-cose results < 6.1 mmol/L (110 mg/dL). WHO and ADA criteria showed poor agreement between each other for the diagnosis of DM.
Book 19-2.indb 179 2/21/2013 11:39:27 AM
EMHJ • Vol. 19 No. 2 • 2013 Eastern Mediterranean Health JournalLa Revue de Santé de la Méditerranée orientale
180
18. Waugh N et al. Screening for type 2 diabetes: literature review and economic modelling. Health Technology Assessment, 2007, 11(17):iii–iv, ix–xi, 1–125.
19. Hanefeld M et al. Post-challenge hyperglycaemia relates more strongly than fasting hyperglycaemia with carotid intima-media thickness: the RIAD Study. Risk Factors in Impaired Glucose Tolerance for Atherosclerosis and Diabetes. Diabetic Medicine, 2000, 17:835–840.
20. Rosediani M, Azidah AK, Mafauzy M. Correlation between fasting plasma glucose, post prandial glucose and glycated haemoglobin and fructosamine. Medical Journal of Malaysia, 2006, 61:67–71.
21. Lindsberg PJ, Tuomi T, Kaste M. Oral glucose tolerance test should be performed after stroke and transient ischemic at-tack. International Journal of Stroke, 2011, 6:317–320.
22. Kitada S et al. Post-load hyperglycemia as an important predic-tor of long-term adverse cardiac events after acute myocardial infarction: a scientific study. Cardiovascular Diabetology, 2010, 9:75.
23. Phillips LS et al. Glucose challenge test screening for pre-diabetes and undiagnosed diabetes. Diabetologia, 2009, 52:1798–1807.
24. Noda M et al. Fasting plasma glucose and 5-year incidence of diabetes in the JPHC diabetes study—suggestion for the thresh-old for impaired fasting glucose among Japanese. Endocrine Journal, 2010, 57:629–637.
25. Ryu S et al. Should the lower limit of impaired fasting glucose be reduced from 110 mg/dL in Korea? Metabolism: Clinical and Experimental, 2006, 55:489–493.
26. Nang EE et al. Is there a clear threshold for fasting plasma glucose that differentiates between those with and without neuropathy and chronic kidney disease? The Singapore Pro-spective Study Program. American Journal of Epidemiology, 2009, 169:1454–1462.
27. Park KS et al. Comparison of glucose tolerance categories in the Korean population according to World Health Organiza-tion and American Diabetes Association diagnostic criteria. Korean Journal of Internal Medicine, 2000, 15:37–41.
28. Hasegawa G. Decreased senescence marker protein-30 could be a factor that contributes to the worsening of glucose toler-ance in normal aging. Islets, 2010, 2:258–260.
Note from the Editor
We wish to draw the kind attention of our potential authors to the importance of applying the editorial requirements of the EMHJ when preparing their manuscripts for submission for publication. These provisions can be seen in the Guidelines for Authors, which are published at the end of every issue of the Journal. We regret that we are unable to accept papers that do not conform to the editorial requirements.
Book 19-2.indb 180 2/21/2013 11:39:27 AM
املجلد التاسع عرشاملجلة الصحية لرشق املتوسطالعدد الثاين
181
Interleukins 12 and 13 levels among beta-thalassaemia major patientsR.A. Hashad,1 N.A. Hamed,2 M.M. El Gharabawy,1 H.A. El Metwally 1 and M.G. Morsi 1
ABSTRACT The role of inflammatory cytokines in the pathophysiology of beta-thalassaemia is still unclear. In this study production levels of interleukins (IL)-12 and IL-13 were measured by commercial ELISA in culture supernatants of mitogen-stimulated peripheral blood mononuclear cells from 30 non-splenectomized beta-thalassaemia cases with iron overload and 20 age- and sex-matched healthy individuals. IL-12 levels were significantly lower among cases compared with controls (91.4 pg/mL versus 154.6 pg/mL), while IL-13 levels were significantly higher (42.5 pg/mL versus 5.7 pg/mL). There was a significant negative correlation between IL-12 and IL-13 levels among beta-thalassaemia cases (r = –0.42). Patients with beta-thalassaemia alone had higher IL-12 levels than beta-thalassaemia patients who were seropositive for chronic hepatitis B or C virus infection (140 pg/mL versus 50 pg/mL); IL-13 levels were slightly lower (65 pg/mL versus 67 pg/mL). An imbalance in the IL-12/IL-13 axis may be relevant to the pathophysiology of beta-thalassaemia.
1Department of Medical Microbiology and Immunology; 2Haematology Unit; Department of Internal Medicine, Faculty of Medicine, University of Alexandria, Alexandria, Egypt (Correspondence to M.G. Morsi: [email protected]).
Received: 31/10/11; accepted: 09/02/12
مستويات اإلنرتلوكينات 12 و13 لدى مرىض الثالسيميا-بيتا الكربىروال أمحد حشاد، هنلة عبد املنعم حامد، مها منري الغرباوي، هالة عبد الرؤوف املتويل، منى مجال الدين مريس
اخلالصـة: اليزال الغموض يشوب دور مركبات السيتوكني االلتهابية يف الفيزيولوجيا املرضية للثالسيميا-بيتا. وقد قاست الباحثات يف هذه الدراسة املحيطي الدم الطافية عىل مزرعة خلاليا السوائل باإلنزيم )إليزا( يف املرتبط التجارية للممتز املقايسة 12 و13 مستخدمات مستويات اإلنرتلوكينات الوحيدة النواة، واملنبهة بامدة حمرضة لالنقسام الفتييل، مستمدة من 30 حالة ثالسيميا-بيتا مل جير هلا استئصال للطحال، ويزيد لدهيا عبء احلديد، مع 20 حالة متاثل مع تلك احلاالت من حيث العمر واجلنس، وتتمتع بالصحة. ووجدت الباحثات أن مستويات اإلنرتلوكني 12 أخفض بمقدار يعتد به
إحصائيا لدى احلاالت )91.4 بيكوغرام/مييل لرت( مما هي عليه لدى الشواهد )154.6 بيكوغرام/مييل لرت(، وأن مستويات اإلنرتلوكني 13 كانت أعىل بمقدار يعتد به إحصائيا لدى احلاالت )42.5 بيكوغرام/مييل لرت( مما هي عليه لدى الشواهد )5.7 بيكو غرام/مييل لرت(. كام وجدت الباحثات ترابطا بالثالسيميا-بيتا املرىض لدى وكان .)r = –0.42( الكربى الثالسيميا-بيتا حاالت لدى و13 12 اإلنرتلوكني مستويات بني إحصائيا به يعتد سلبيا املزمنة بفريوس بالثالسيميا-بيتا اإلجيابيني مصليا للعدوى بيكو غرام/مييل لرت( مما لدى املرىض 140( 12 لوحدها مستويات أعىل من اإلنرتلوكني االلتهاب الكبدي "يب" و"يس" )50 بيكوغرام/مييل لرت(، أما مستويات اإلنرتلوكني 13 فقد كانت أخفض بقليل لدى مرىض الثالسيميا-بيتا الكربى لوحدها )65 بيكوغرام/مييل لرت( مما لدى مرىض الثالسيميا-بيتا الكربى اإلجيابيني مصليا للعدوى املزمنة بفريوس االلتهاب الكبدي "يب" و"يس" )67 بيكوغرام/مييل لرت(. وترى الباحثات أن اختالل التوازن يف حمور اإلنرتلوكينات 12 و13 قد يكون له دور يف الفيزيولوجيا املرضية للثالسيميا-بيتا.
Taux des interleukines 12 et 13 chez des patients atteints de bêta-thalassémie majeure
RÉSUMÉ Le rôle des cytokines inflammatoires dans la physiopathologie de la bêta-thalassémie reste à élucider. Dans la présente étude, les taux de production des interleukines 12 et 13 (IL-12 et IL-13) ont été mesurés à l'aide de la méthode ELISA dans les surnageants de culture de cellules mononucléées de sang périphérique stimulées par des mitogènes chez 30 cas de bêta-thalassémie non splénectomisés présentant une surcharge martiale ainsi que chez 20 individus en bonne santé appariés pour l'âge et le sexe. Les taux d'IL-12 étaient nettement inférieurs chez les malades par rapport aux témoins (91,4 pg/ml contre 154,6 pg/ml), alors que les taux d'IL-13 étaient significativement plus élevés (42,5 pg/ml contre 5,7 pg/ml). Une corrélation négative importante existait entre les taux d'IL-12 et d'IL-13 chez les patients atteints de beta-thalassémie (r = –0,42). Les patients uniquement porteurs d'une bêta-thalassémie avaient des taux d'IL-12 plus élevés que les patients atteints d'une bêta-thalassémie et également chroniquement infectés par le virus de l'hépatite B ou C (140 pg/ml contre 50 pg/ml) ; les taux de l'IL-13 étaient légèrement inférieurs (65 pg/ml contre 67 pg/ml). Un défaut de l'axe IL-12/IL-13 peut être révélateur de la physiopathologie de la bêta-thalassémie.
Book 19-2.indb 181 2/21/2013 11:39:27 AM
EMHJ • Vol. 19 No. 2 • 2013 Eastern Mediterranean Health JournalLa Revue de Santé de la Méditerranée orientale
182
Introduction
Thalassaemias are a worldwide prob-lem [1]. Beta-thalassaemia is the most common type and has the highest frequency in the Mediterranean area. Heterozygotes have thalassaemia mi-nor, a condition in which there is usu-ally mild anaemia and little or no clinical disability. Homozygotes (thalassaemia major) are either unable to synthesize haemoglobin A or at best produce very little and, after the first 4 months of life, develop a profound hypochromic anaemia [2]. Blood transfusions may be required every 4–6 weeks [1]. However, one of the most common side-effects of blood transfusion is infection of the recipient with hepatitis B virus (HBV) and/or C virus (HCV). HCV is the most common transfusion-transmitted infection [2].
Several immunological defects can be found in patients with beta-thalas-saemia, among which the impairment of neutrophils and macrophage phago-cytic and killing functions and the production of some cytokines are the most important. The plasma levels of these cytokines may be relevant in the pathophysiology of beta-thalassaemia [3]. Interleukin (IL)-12 and IL-13 are 2 recently characterized cytokines which play an important role in the induction of T-helper cell type 1 (Th1-) and Th2-like cells, respectively [4]. IL-12 has the potential for use either as a single immunotherapeutic agent, in combi-nation with other chemotherapeutic agents, or as a vaccine adjuvant [5]. IL-13 is a cytokine secreted by many cell types especially Th2 cells. It displays homology with IL-4 and shares some of its biological functions, especially with regards to changes induced on haematopoietic cells. It acts as an im-munoregulatory and effector cytokine [6]. Several studies have shown that an imbalance in the IL-3/IL-7 and IL-6/IL-8 axes may contribute to the development of beta-thalassaemia ma-jor [3,4]. The plasma levels of IL-12
and IL-13 may also be relevant in the pathophysiology of beta-thalassaemia. To evaluate this hypothesis, IL-12 and IL-13 concentrations were investigated in beta-thalassaemia patients and con-trols and in relation to their HBV and HCV status.
Methods
SampleThis case–control study was done on 30 patients [18 males and 12 females, mean age 21.6 (SD 9.3) years] admit-ted to the department of haematology at Alexandria Main University hospital, Egypt, during the year 2010 with a final diagnosis of beta-thalassaemia major. The inclusion criteria were all cases who were non-splenectomized, HIV negative and having iron overload. They were diagnosed from complete blood count, haemoglobin electro-phoresis and high serum ferritin, with bone marrow confirmation. Age- and sex-matched controls were 20 healthy volunteers [8 males and 12 females, mean age 21.3 (SD 11.9)] from among hospital staff (doctors, technicians and laboratory workers) who were HBV, HCV and HIV negative. Informed consent was taken from all subjects participating in the study. All those en-rolled were subjected to the following: history taking, full clinical assessment, complete blood count and liver and renal function tests.
Data collectionEstimation of IL-12 and IL-13 levels was done by isolation of peripheral blood mononuclear cells (PBMCs) from heparinized venous blood by Ficoll–Hypaque density layer centrifu-gation (Sigma) and cultured at 2 × 10⁵ cells per 500 µL Rosell Park Memo-rial Institute (RPMI) 1640 medium supplemented with antibiotics and 5% fetal calf serum (FCS). For stimula-tion, 5 μg/mL phytohaemagglutinin mitogen (PHA, Wellcome) was used.
Incubation of cultures was performed at 37 °C in a humidified atmosphere of 5% CO2. After 2 days of culture, su-pernates were collected from each tube and stored at –20 °C to be assayed using commercial ELISA kits (RayBio) were followed according to manufacturers’ instructions [7,8].
HBsAg and HCV Abs were de-tected by ELISA HBsAg test system 2 and HCV version 3.0 ELISA test system (Ortho-Clinical Diagnostics) [9,10].
Data analysisSPSS, version 15.0 for Windows was used for analysis of the data. The 5% level of significance was taken to test the significance of the results obtained; P ≤ 0.05 was considered significant. Data were shown as mean and standard deviation (SD).
Results
Table 1 shows the IL-12 and IL-13 lev-els among both studied groups. In the control group IL-12 levels ranged from 46.2–243.9 (pg/mL), with a mean of 154.6 (SD 61.1) pg/mL, while patients’ levels ranged from 40.4–135.4 pg/mL with a mean of 91.9 (SD 28.5) pg/mL, a highly significant difference (P < 0.001). IL-13 levels among controls ranged from 2.7–8.5 pg/mL, with a mean of 5.7 (SD 1.8) pg/mL, while patients’ values ranged from 9.9–65.0 pg/mL with a mean of 42.5 (SD 18.0) pg/mL, also a highly significant differ-ence (P < 0.001).
There were 4 beta-thalassaemic patients who were seropositive for HBV and HCV infection. There was no correlation between IL-12 and IL-13 among controls, but there was a signifi-cant negative correlation between IL-12 and IL-13 levels, i.e. a decrease in IL-12 with increasing IL-13, among cases of beta-thalassaemia (n = 26) (r = –0.42, P = 0.003). Figure 1a and 1b shows the IL-12 and IL-13 levels of controls and patients with thalassaemia major and
Book 19-2.indb 182 2/21/2013 11:39:27 AM
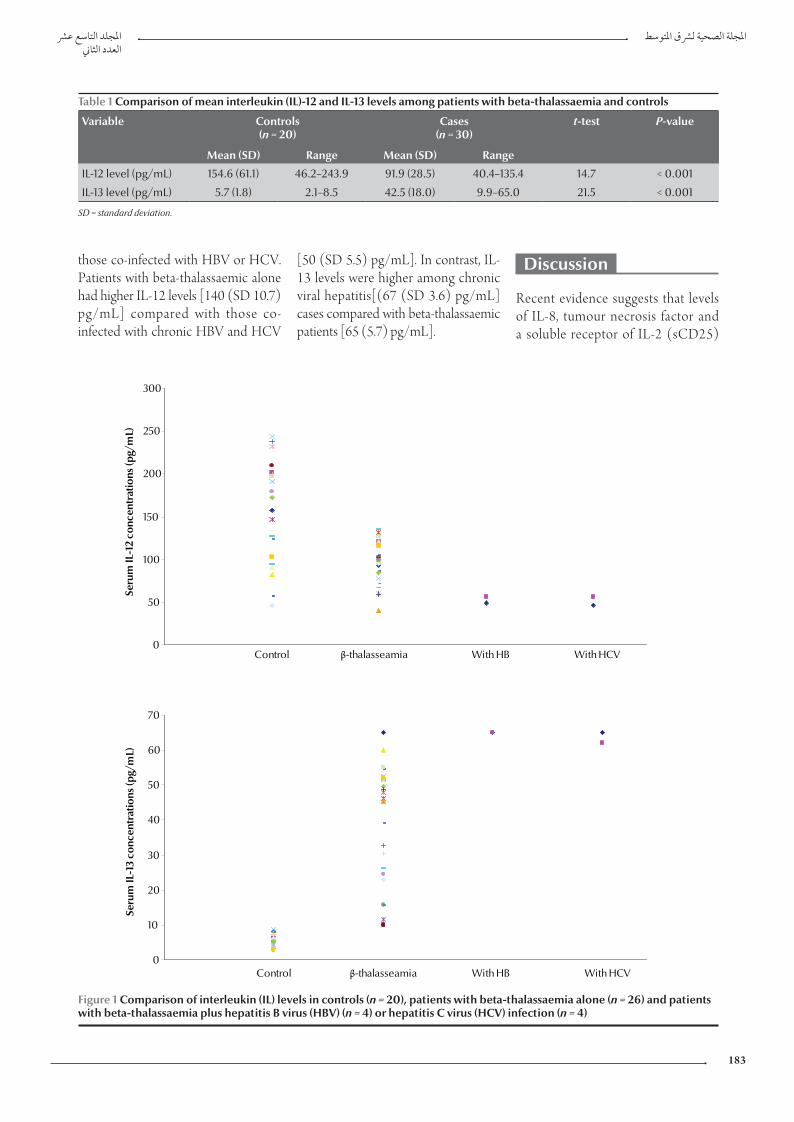
املجلد التاسع عرشاملجلة الصحية لرشق املتوسطالعدد الثاين
183
[50 (SD 5.5) pg/mL]. In contrast, IL-13 levels were higher among chronic viral hepatitis[(67 (SD 3.6) pg/mL] cases compared with beta-thalassaemic patients [65 (5.7) pg/mL].
Discussion
Recent evidence suggests that levels of IL-8, tumour necrosis factor and a soluble receptor of IL-2 (sCD25)
those co-infected with HBV or HCV. Patients with beta-thalassaemic alone had higher IL-12 levels [140 (SD 10.7) pg/mL] compared with those co-infected with chronic HBV and HCV
Table 1 Comparison of mean interleukin (IL)-12 and IL-13 levels among patients with beta-thalassaemia and controls
Variable Controls(n = 20)
Cases(n = 30)
t-test P-value
Mean (SD) Range Mean (SD) Range
IL-12 level (pg/mL) 154.6 (61.1) 46.2–243.9 91.9 (28.5) 40.4–135.4 14.7 < 0.001
IL-13 level (pg/mL) 5.7 (1.8) 2.1–8.5 42.5 (18.0) 9.9–65.0 21.5 < 0.001
SD = standard deviation.
0
50
100
150
200
250
300
Seru
m IL
-12
conc
entr
atio
ns (p
g/m
L)
Control β-thalasseamia With HB With HCV
0
10
20
30
40
50
60
70
Control β-thalasseamia With HB With HCV
Seru
m IL
-13
conc
entr
atio
ns (p
g/m
L)
Figure 1 Comparison of interleukin (IL) levels in controls (n = 20), patients with beta-thalassaemia alone (n = 26) and patients with beta-thalassaemia plus hepatitis B virus (HBV) (n = 4) or hepatitis C virus (HCV) infection (n = 4)
Book 19-2.indb 183 2/21/2013 11:39:28 AM
EMHJ • Vol. 19 No. 2 • 2013 Eastern Mediterranean Health JournalLa Revue de Santé de la Méditerranée orientale
184
and imbalances in the IL-3/IL-7 and IL-6/IL-8 axes may have biological and clinical importance in thalassaemic patients [11]. Our data demonstrates that IL-12 production was significantly suppressed in thalassaemic patients (91.9 pg/mL) compared with controls (154.6 pg/mL), indicating the involve-ment of this cytokine in the suppres-sion of erythropoiesis in thalassaemic patients, similar to the involvement of IL-3 in erythropoiesis of thalassaemic patients [12] and it suggests that IL-12 is a cytokine involved in the cellular immunological alterations in beta-tha-lassaemia. Meanwhile patients with beta-thalassaemia were found to have significantly higher IL-13 concentra-tions (42.5 pg/mL) than normal con-trols (5.7 pg/mL). Our data suggests that there could be an intrinsic cause for the IL-13 increase in thalassaemia major. This increase downregulates macrophage activity thereby inhibit-ing production of proinflammatory cytokines and chemokines [13]. IL-13 needs to be studied in detail in order to learn more about the involvement of this cytokine in erythropoiesis of thalassaemic patients.
Substantial evidence suggests that an imbalance in production of these 2 critical immunoregulatory cytokines (i.e. overproduction of IL-13 and im-pairment of IL-12 production) may be associated with cellular immunological alterations in beta- thalassaemia. Al-though it is not entirely clear what tips the balance between these cytokines, the potential role of IL-12 and IL-13 and the interaction between them in thalassaemic patients require further investigation. These findings clearly agree with the results of Willskarp who suggested that an imbalance in the production of IL-12 and IL-13 occurs in the lung of atopic and asthmatic individuals [14]. In our study a signifi-cant negative correlation was found between IL-12 and IL-13 levels (r = –0.42). Meanwhile, there was no cor-relation between these 2 inflammatory cytokines in normal controls. From these observations we can conclude that an imbalance in the IL-12/IL-13 axis may be relevant in the pathophysi-ology of beta-thalassaemia.
Beta-thalassaemic patients had higher serum IL-12 levels (140 pg/mL) compared with those of chronic
hepatitis B or C patients (50 pg/mL). On the other hand, serum IL-13 con-centrations in patients with chronic viral hepatitis (67 pg/mL) were slightly higher compared with those of thalas-saemia patients (65 pg/mL).These findings clearly agree with the results of Uguccioni et al. [15]. Similar val-ues were also reported by Di Marco et al. [16]. Several other studies have investigated the role of cytokines and interleukins in the pathophysiology of beta-thalassaemia [17–22].
Our data and those from the lit-erature strongly support the hypothesis that beta-thalassaemia major is associat-ed with a downregulation of IL-12 and an upregulation of IL-13 which leads to an imbalance in IL-12/IL-13 axis which may be relevant in the pathophysiology of beta-thalassaemia. HBV and HCV, probably resulting from repeated blood transfusion, may aggravate the condi-tion. These cytokines deserve more in-vestigation on larger samples as well as in vivo trials in experimental animals, as they may be a target for immunotherapy to clear hepatitis virus infection (result-ing from repeated transfusion) and raise patients’ immunity.
References
1. Edwards C, Bouchier I. Davidson’s principles and practice of medicine, 16th ed. Edinburgh, Churchill Livingstone 1991.
2. Shang G et al. Residual risk of transfusion-transmitted viral in-fections in Shenzhen, China, 2001 through 2004. Transfusion, 2007, 47:529–539.
3. Oztürk O et al. Increased plasma levels of interleukin-6 and interleukin-8 in beta-thalassaemia major. Haematologia, 2001, 31:237–244.
4. Kutukculer N et al. Plasma interleukin-3 (IL-3) and IL-7 con-centrations in children with homozygous beta-thalassemia. Journal of Tropical Pediatrics, 1997, 43:366–367.
5. Gately MK, Mulqueen MJ. Interleukin-12: potential clinical application in the treatment and prevention of infectious dis-eases. Drugs, 1996, 52(Suppl. 2):18–25.
6. Wynn TA. IL-13 effector functions. Annual Review of Immunol-ogy, 2003, 21:425–456.
7. O’Neill LAJ, Bowie A eds. Interleukin protocols (methods in mo-lecular medicine). Totawa, New Jersey, Humana Press, 2001.
8. Morsi MG, Atta HY, Rabie AK. Comparative study of different test systems for measuring cytokine production among tuber-culous andhealthy persons. Egyptian Journal of Immunology, 1998, 5:153–162.
9. Valentine-Thon E et al. European proficiency testing program for molecular detection and quantitation of hepatitis B virus DNA. Journal of Clinical Microbiology, 2001, 39:4407–4412.
10. Tobler LH et al. Impact of HCV 3.0 EIA relative to HCV 2.0 EIA on blood-donor screening. Transfusion, 2003, 43:1452–1459.
11. Rund D, Rachmilewitz E. Beta-thalassemia. New England Jour-nal of Medicine, 2005, 353:1135–1146.
12. Kutukculer N et al. Plasma interleukin-3 (IL-3) and IL-7 con-centrations in children with homozygous beta-thalassemia. Journal of Tropical Pediatrics, 1997, 43:366–367.
13. Sakamoto O et al. Interleukin-13 selectively suppresses the growth of human macrophage progenitors at the late stage. Blood, 1995, 85:3487–3493.
14. Willskarp M. IL-12/IL-13 axis in allergic asthma. Journal of Al-lergy and Clinical Immunology, 2001, 107(7):9–18.
15. Uguccioni M et al. Elevated interleukin-8 serum concentra-tions in beta-thalassemia and graft-versus-host disease. Blood, 1993, 81:2252–2256.
16. Di Marco V et al. Alpha interferon treatment of chronic hepa-titis C in beta-thalassaemia. Gut, 1993, 34(2 Suppl.):S142–S143.
17. Lombardi G et al. Serum levels of cytokines and soluble antigens in polytransfused patients with beta-thalassemia
Book 19-2.indb 184 2/21/2013 11:39:28 AM
املجلد التاسع عرشاملجلة الصحية لرشق املتوسطالعدد الثاين
185
major: relationship to immune status. Haematologica, 1994, 79:406–412.
18. Dore F et al. Serum interleukin-8 levels in thalassemia interme-dia. Haematologica, 1995, 80:431–433.
19. Kutukculer N et al. Plasma interleukin-3 (IL-3) and IL-7 con-centrations in children with homozygous beta-thalassemia. Journal of Tropical Pediatrics, 1997, 43:366–367.
20. Oztürk O et al. Increased plasma levels of interleukin-6 and interleukin-8 in beta-thalassaemia major. Haematologia, 2001, 31:237–244.
21. Di Marco V et al. Liver disease in chelated transfusion depend-ent thalassemics: the role of iron overload and chronic hepati-tis C. Haematologica, 2008, 93:1243–1246.
22. Angelucci E et al. Italian Society of Hematology practice guide-lines for the management of iron overload in thalassemia major and related disorders. Haematologica, 2008, 93:741–752.
Community genetics services: report of a WHO consultation on community genetics in low- and middle-income countries
The objective of the above-mentioned Consultation was to develop an evidence-based report on community genetics services to provide guidance to low- and middle-income countries (LMIC) in accordance with the 2008–2013 Action plan for the global strategy for the prevention and control of noncommunicable diseases (NCDs). The high rates of congenital disorders in LMIC may result in part from: low availability of public health measures for the care and prevention of these disorders; high frequency of haemoglobinopathies in Africa, the Middle-East and South-East Asia; high rates of consanguineous marriage in the Eastern Mediterranean and South-East Asia regions that can increase the occurrence of recessively inherited diseases; advanced maternal age at conception in many such countries which increases the risk of chromosomal trisomies; and large family size that may increase the number of affected children in families with autosomal recessive conditions. While noting that prevention programmes have been successfully implemented in some LMIC (e.g. Bahrain, Cyprus and Iran), the Group emphasized the need to upgrade community genetics services in LMIC and the need for education in genetics to be provided to all health professionals, policy-makers and the general public. This also included sensitization to ethical, legal and social issues which are of key concern in the context of congenital disorders and genetic diseases.
This document is available at: http://whqlibdoc.who.int/publications/2011/9789241501149_eng.pdf
Book 19-2.indb 185 2/21/2013 11:39:28 AM
EMHJ • Vol. 19 No. 2 • 2013 Eastern Mediterranean Health JournalLa Revue de Santé de la Méditerranée orientale
186
Revue
Médicaments et allaitement maternel : évaluation du risque médicamenteux chez le nourrissonY. Khabbal,1 S. Zaoui 2 et Y. Cherrah 3
RÉSUMÉ Le lait maternel, en plus de ses propriétés nutritives et immunologiques indéniables, est un élément important pour le développement du nourrisson. Des mises en garde parfois exagérées empêchent la mère et l’enfant de profiter à la fois des bienfaits de l’allaitement et d’une médication appropriée. Cette attitude est justifiée par l’absence totale d’investigations sur l’excrétion des médicaments dans le lait maternel lors des essais cliniques. Le risque réel a été évalué par plusieurs classifications. Une estimation du passage des médicaments dans le lait et une estimation de l’exposition du nourrisson au médicament sont possibles, constituant ainsi un indice très fiable pour mieux juger le risque encouru par le nourrisson. Généralement, nous sommes confrontés à deux situations différentes : une nouvelle prescription durant l’allaitement ou le maintien d’un traitement déjà prescrit lors de la grossesse. Si le traitement sera prescrit pour une longue période pendant l’allaitement, la nécessité d’une démarche stratégique s’impose.
1Laboratoire de Pharmacologie et de Toxicologie, Faculté de Médecine et de Pharmacie, Université Sidi Mohammed Ben Abdellah, Fès (Maroc) (Correspondance à adresser à Y. Khabbal : [email protected] ou [email protected]).2Laboratoire de Pharmacologie et de Toxicologie, Laboratoire de Recherche PCIM (Pneumo-cardio-immunopathologie et Métabolisme), Faculté de Médecine et de Pharmacie, Université Cadi Ayyad, Marrakech (Maroc).3Laboratoire de Pharmacologie et de Toxicologie, Faculté de Médecine et de Pharmacie, Université Mohammed V, Rabat (Maroc).
Reçu : 21/02/12; accepté : 23/02/12
ع األدوية واإلرضاع الطبيعي من الثدي: تقييم خطر األدوية عىل الرضيوسف خبال، سناء الزاوي، حيي الرشاح
اخلالصـة: يعد اللبن احلليب من العنارص اهلامة يف تنمية األطفال، إضافة إىل منافعه التي ال تنكر يف التغذية ويف املناعة. وقد متنع التحذيرات، التي قد يكون مبالغا فيها، األمهات واألطفال من التمتع بمنافع كل من اإلرضاع الطبيعي من الثدي ومن تناول األدوية. ويعود تربير تلك األساليب إىل الغياب التام للدراسات حول إفراغ األدوية يف حليب الثدي من خالل دراسات رسيرية. وقد قيم الباحثون األخطار احلقيقية من خالل تصنيفات ع لألدوية، وكلها ممكنة، ويمكنها توفري مؤرش يعتمد عليه ض الرض عديدة، ومن خالل تقدير عبور األدوية يف احلليب، ومن خالل تقدير مدى تعرع. وعىل وجه اإلمجال فإننا بمواجهة حالتني خمتلفتني؛ إما معاجلة جديدة خالل فرتة للحصول عىل أحكام أصوب حول األخطار التي هتدد الرضاإلرضاع، أو مواصلة معاجلة وصفت من قبل أثناء احلمل. وإذا كان ثمة حاجة لوصف املعاجلات ملدة طويلة أثناء اإلرضاع الطبيعي من الثدي، فإن
من املطلوب وضع أسلوب اسرتاتيجي لذلك.
Medicines and breastfeeding: assessing the risk of medicines to infants
ABSTRACT Milk, in addition to its undeniable nutritional and immunological benefits, is an important element for the development of the infant. Warnings, sometimes exaggerated, may prevent the mother and child from enjoying the benefits of both breastfeeding and appropriate medication. This approach is justified by the total absence of investigations on the excretion of drugs in breast milk during clinical trials. The actual risk was evaluated by several classifications; an estimate of the passage of drugs into milk and estimation of infant exposure to the drug are possible and can provide a reliable indicator to better judge the risk to the infant. Generally we are faced with two different situations: a new treatment during lactation or maintenance treatment already prescribed during pregnancy. If treatment needs to be prescribed for a long period of breastfeeding, a strategic approach is required.
Book 19-2.indb 186 2/21/2013 11:39:28 AM
املجلد التاسع عرشاملجلة الصحية لرشق املتوسطالعدد الثاين
187
Introduction
Soucieux d’éviter les effets indésirables chez le nourrisson, le prescripteur est contraint dans plusieurs situations à ne pas utiliser chez la femme allaitante certaines molécules ou à indiquer le sevrage précoce du nourrisson, empêchant ainsi la mère et l’enfant de profiter à la fois des bienfaits de l’allaitement et de la médication appropriée.
Cette attitude est justifiée par l’absence totale d’investigations sur l’excrétion des médicaments dans le lait maternel lors des essais cliniques.
Dans ce travail, nous exposons la démarche classique pour évaluer - s’il existe bien sûr - le risque lié à une exposition médicamenteuse du nourrisson pendant l’allaitement maternel.
Classification du risque médicamenteux
En plus de ses propriétés nutritives et immunologiques indéniables, le lait maternel est un élément important pour le développement du nourrisson [1]. Des mises en garde parfois exagérées empêchent la mère et l’enfant de profiter à la fois des bienfaits de l’allaitement et d’une médication appropriée. Mis à part l’hypersensibilité qui survient à des concentrations sub-thérapeutiques, les effets pharmacologiques à surveiller pendant l’allaitement (léthargie, somnolence, insomnie, hyperactivité) surviennent lorsque la concentration minimale efficace est atteinte. Certains symptômes, comme la diminution des réflexes de succion, la perte de poids du nouveau-né, permettront aussi, mais de manière indirecte, de mettre en évidence un effet pharmacolo-gique [2].
Plusieurs classifications sont proposées pour évaluer le risque lié à
l’exposition au médicament pendant l’allaitement. Citons à titre d’exemple la c lass ificat ion de Briggs , une classification pratique et rapide : cet auteur classe le risque lié à l’exposition au médicament pendant l’allaitement de A à X et décrit la pharmacocinétique de la molécule dans le compartiment lacté [3]. Cette même graduation est adoptée par Delaloye.
Le manuel de référence reste celui de Thomas Hale qui propose une classification claire et pratique [4]. Le risque lié à l’exposition au médicament pendant l’allaitement est classé de L1 à L5 :
• L1 : (médicament) le plus sûr, car la molécule a été largement u t i l i s é e p a r d e n o m b r e u s e s femmes allaitantes sans que l’on ait observé une augmentation d’effets indésirables chez le nourrisson. Les études contrôlées chez les femmes allaitantes ne démontrent ni risque ni possibilité d’effets néfastes pour le nourrisson, ou la biodisponibilité de la molécule prise par voie orale est négligeable.
• L2 : sûr, car les données sont limitées chez la femme allaitante. Cependant, il n’a pas été mis en évidence d’augmentation des effets indésirables chez le nourrisson, et/ou la preuve d'un risque avéré, suite à l'utilisation de ce médicament chez une femme qui allaite, est faible.
• L3 : moyennement sûr. Il n'y a pas d'études contrôlées chez les femmes qui allaitent mais le risque d'effets indésirables chez le nourrisson est possible, ou des études contrôlées montrent un faible risque d’effets indésirables non menaçants. La molécule ne doit être administrée à la femme allaitante que si le bénéfice justifie le risque potentiel chez l’enfant.
• L4 : potentiellement dangereux. Il y a des preuves positives de risque pour le nourrisson allaité, mais
les avantages de l'utilisation chez les mères qui allaitent peuvent être acceptables malgré le risque pour l'enfant (par exemple, si le médicament est nécessaire dans une situation potentiellement mortelle ou dans le cas d’une maladie grave pour laquelle des médicaments plus sûrs ne peuvent pas être utilisés ou sont inefficaces).
• L5 : contre-indiqué car des études basées sur l'expérience humaine ont démontré chez les mères qui allaitent qu'il existe un risque documenté important pour le nourrisson, ou il s'agit d'un médicament qui présente un risque élevé de dommages importants chez le nourrisson. L e r i s q u e d e l ' u t i l i s a t i o n d u médicament chez les femmes qui allaitent l’emporte sur tout avantage possible de l'allaitement maternel. Le médicament est contre-indiqué chez les femmes qui allaitent un nourrisson.
Facteurs modulant le passage des médicaments dans le compartiment lacté
Le lait et le plasma sont deux c o m p a r t i m e n t s b i o l o g i q u e s indépendants mais il y a assez souvent une corrélation parfaite entre la concentration des médicaments dans les deux compartiments [4] : si le taux plasmatique augmente, le taux lacté augmente aussi, et si au contraire le taux plasmatique baisse, le médicament repasse dans le compartiment plasmatique et le taux lacté baisse logiquement. Plusieurs facteurs influent sur la concentration des médicaments dans le lait maternel.
La composition du lait La composition du lait joue un rôle prépondérant pour expliquer la
Book 19-2.indb 187 2/21/2013 11:39:28 AM
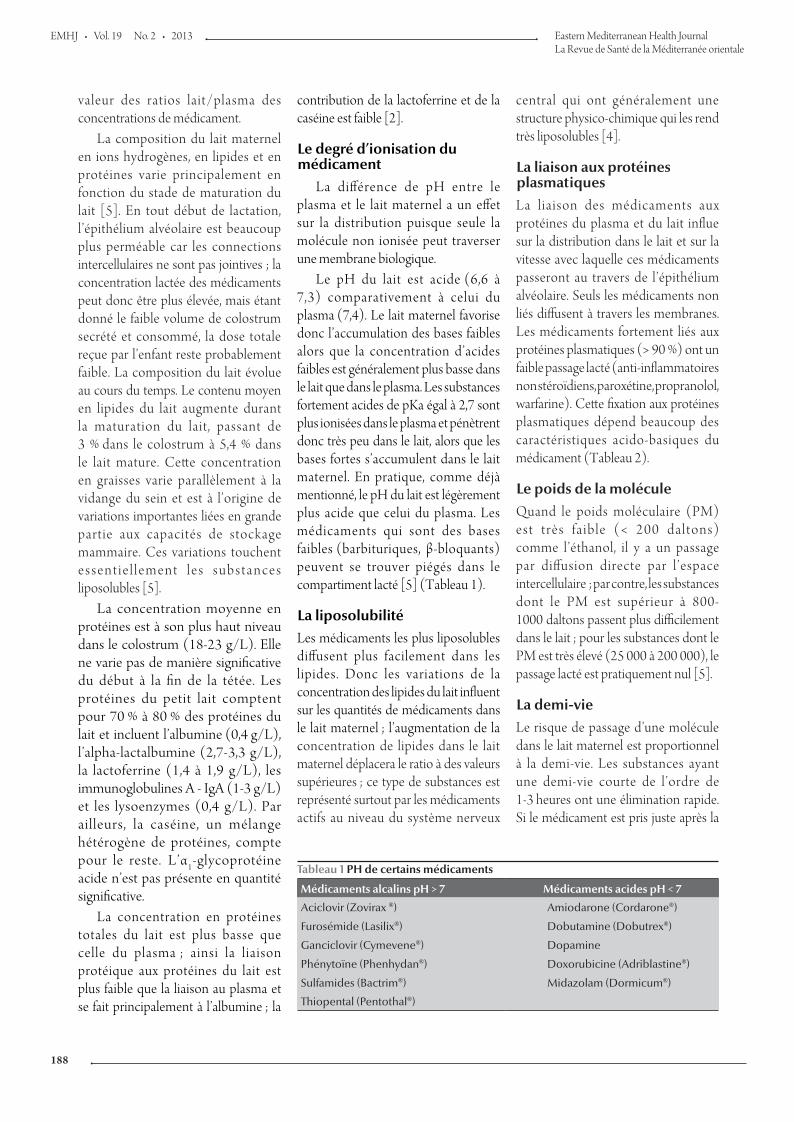
EMHJ • Vol. 19 No. 2 • 2013 Eastern Mediterranean Health JournalLa Revue de Santé de la Méditerranée orientale
188
contribution de la lactoferrine et de la caséine est faible [2].
Le degré d’ionisation du médicament
La différence de pH entre le plasma et le lait maternel a un effet sur la distribution puisque seule la molécule non ionisée peut traverser une membrane biologique.
Le pH du lait est acide (6,6 à 7,3) comparativement à celui du plasma (7,4). Le lait maternel favorise donc l’accumulation des bases faibles alors que la concentration d’acides faibles est généralement plus basse dans le lait que dans le plasma. Les substances fortement acides de pKa égal à 2,7 sont plus ionisées dans le plasma et pénètrent donc très peu dans le lait, alors que les bases fortes s’accumulent dans le lait maternel. En pratique, comme déjà mentionné, le pH du lait est légèrement plus acide que celui du plasma. Les médicaments qui sont des bases faibles (barbituriques, β-bloquants) peuvent se trouver piégés dans le compartiment lacté [5] (Tableau 1).
La liposolubilitéLes médicaments les plus liposolubles diffusent plus facilement dans les lipides. Donc les variations de la concentration des lipides du lait influent sur les quantités de médicaments dans le lait maternel ; l’augmentation de la concentration de lipides dans le lait maternel déplacera le ratio à des valeurs supérieures ; ce type de substances est représenté surtout par les médicaments actifs au niveau du système nerveux
central qui ont généralement une structure physico-chimique qui les rend très liposolubles [4].
La liaison aux protéines plasmatiquesLa liaison des médicaments aux protéines du plasma et du lait influe sur la distribution dans le lait et sur la vitesse avec laquelle ces médicaments passeront au travers de l’épithélium alvéolaire. Seuls les médicaments non liés diffusent à travers les membranes. Les médicaments fortement liés aux protéines plasmatiques (> 90 %) ont un faible passage lacté (anti-inflammatoires non stéroïdiens, paroxétine, propranolol, warfarine). Cette fixation aux protéines plasmatiques dépend beaucoup des caractéristiques acido-basiques du médicament (Tableau 2).
Le poids de la moléculeQuand le poids moléculaire (PM) est très faible (< 200 daltons) comme l’éthanol, il y a un passage par diffusion directe par l’espace intercellulaire ; par contre, les substances dont le PM est supérieur à 800- 1000 daltons passent plus difficilement dans le lait ; pour les substances dont le PM est très élevé (25 000 à 200 000), le passage lacté est pratiquement nul [5].
La demi-vieLe risque de passage d’une molécule dans le lait maternel est proportionnel à la demi-vie. Les substances ayant une demi-vie courte de l’ordre de 1-3 heures ont une élimination rapide. Si le médicament est pris juste après la
valeur des ratios lait/plasma des concentrations de médicament.
La composition du lait maternel en ions hydrogènes, en lipides et en protéines varie principalement en fonction du stade de maturation du lait [5]. En tout début de lactation, l’épithélium alvéolaire est beaucoup plus perméable car les connections intercellulaires ne sont pas jointives ; la concentration lactée des médicaments peut donc être plus élevée, mais étant donné le faible volume de colostrum secrété et consommé, la dose totale reçue par l’enfant reste probablement faible. La composition du lait évolue au cours du temps. Le contenu moyen en lipides du lait augmente durant la maturation du lait, passant de 3 % dans le colostrum à 5,4 % dans le lait mature. Cette concentration en graisses varie parallèlement à la vidange du sein et est à l’origine de variations importantes liées en grande partie aux capacités de stockage mammaire. Ces variations touchent e s s e n t i e l l e m e n t l e s s u b s t a n c e s liposolubles [5].
La concentration moyenne en protéines est à son plus haut niveau dans le colostrum (18-23 g/L). Elle ne varie pas de manière significative du début à la fin de la tétée. Les protéines du petit lait comptent pour 70 % à 80 % des protéines du lait et incluent l’albumine (0,4 g/L), l’alpha-lactalbumine (2,7-3,3 g/L), la lactoferrine (1,4 à 1,9 g/L), les immunoglobulines A - IgA (1-3 g/L) et les lysoenzymes (0,4 g/L). Par ailleurs, la caséine, un mélange hétérogène de protéines, compte pour le reste. L’α1-glycoprotéine acide n’est pas présente en quantité significative.
La concentration en protéines totales du lait est plus basse que celle du plasma ; ainsi la liaison protéique aux protéines du lait est plus faible que la liaison au plasma et se fait principalement à l’albumine ; la
Tableau 1 PH de certains médicaments
Médicaments alcalins pH > 7 Médicaments acides pH < 7
Aciclovir (Zovirax ®) Amiodarone (Cordarone®)
Furosémide (Lasilix®) Dobutamine (Dobutrex®)
Ganciclovir (Cymevene®) Dopamine
Phénytoïne (Phenhydan®) Doxorubicine (Adriblastine®)
Sulfamides (Bactrim®) Midazolam (Dormicum®)
Thiopental (Pentothal®)
Book 19-2.indb 188 2/21/2013 11:39:28 AM
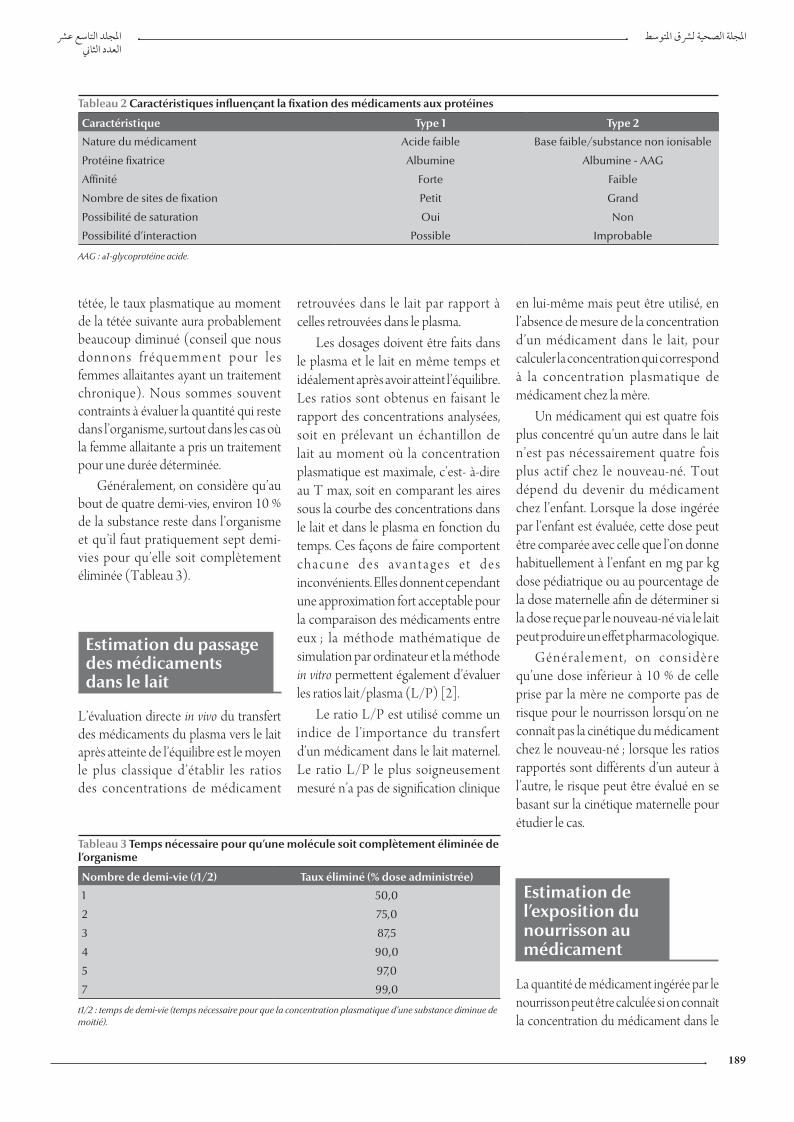
املجلد التاسع عرشاملجلة الصحية لرشق املتوسطالعدد الثاين
189
tétée, le taux plasmatique au moment de la tétée suivante aura probablement beaucoup diminué (conseil que nous donnons fréquemment pour les femmes allaitantes ayant un traitement chronique). Nous sommes souvent contraints à évaluer la quantité qui reste dans l’organisme, surtout dans les cas où la femme allaitante a pris un traitement pour une durée déterminée.
Généralement, on considère qu’au bout de quatre demi-vies, environ 10 % de la substance reste dans l’organisme et qu’il faut pratiquement sept demi-vies pour qu’elle soit complètement éliminée (Tableau 3).
Estimation du passage des médicaments dans le lait
L’évaluation directe in vivo du transfert des médicaments du plasma vers le lait après atteinte de l’équilibre est le moyen le plus classique d’établir les ratios des concentrations de médicament
retrouvées dans le lait par rapport à celles retrouvées dans le plasma.
Les dosages doivent être faits dans le plasma et le lait en même temps et idéalement après avoir atteint l’équilibre. Les ratios sont obtenus en faisant le rapport des concentrations analysées, soit en prélevant un échantillon de lait au moment où la concentration plasmatique est maximale, c’est- à-dire au T max, soit en comparant les aires sous la courbe des concentrations dans le lait et dans le plasma en fonction du temps. Ces façons de faire comportent c h a c u n e d e s a v a n t a g e s e t d e s inconvénients. Elles donnent cependant une approximation fort acceptable pour la comparaison des médicaments entre eux ; la méthode mathématique de simulation par ordinateur et la méthode in vitro permettent également d’évaluer les ratios lait/plasma (L/P) [2].
Le ratio L/P est utilisé comme un indice de l’importance du transfert d’un médicament dans le lait maternel. Le ratio L/P le plus soigneusement mesuré n’a pas de signification clinique
en lui-même mais peut être utilisé, en l’absence de mesure de la concentration d’un médicament dans le lait, pour calculer la concentration qui correspond à la concentration plasmatique de médicament chez la mère.
Un médicament qui est quatre fois plus concentré qu’un autre dans le lait n’est pas nécessairement quatre fois plus actif chez le nouveau-né. Tout dépend du devenir du médicament chez l’enfant. Lorsque la dose ingérée par l’enfant est évaluée, cette dose peut être comparée avec celle que l’on donne habituellement à l’enfant en mg par kg dose pédiatrique ou au pourcentage de la dose maternelle afin de déterminer si la dose reçue par le nouveau-né via le lait peut produire un effet pharmacologique.
Généralement , on considère qu’une dose inférieur à 10 % de celle prise par la mère ne comporte pas de risque pour le nourrisson lorsqu’on ne connaît pas la cinétique du médicament chez le nouveau-né ; lorsque les ratios rapportés sont différents d’un auteur à l’autre, le risque peut être évalué en se basant sur la cinétique maternelle pour étudier le cas.
Estimation de l’exposition du nourrisson au médicament
La quantité de médicament ingérée par le nourrisson peut être calculée si on connaît la concentration du médicament dans le
Tableau 2 Caractéristiques influençant la fixation des médicaments aux protéines
Caractéristique Type 1 Type 2
Nature du médicament Acide faible Base faible/substance non ionisable
Protéine fixatrice Albumine Albumine - AAG
Affinité Forte Faible
Nombre de sites de fixation Petit Grand
Possibilité de saturation Oui Non
Possibilité d’interaction Possible Improbable
AAG : α1-glycoprotéine acide.
Tableau 3 Temps nécessaire pour qu’une molécule soit complètement éliminée de l’organisme
Nombre de demi-vie (t1/2) Taux éliminé (% dose administrée)
1 50,0
2 75,0
3 87,5
4 90,0
5 97,0
7 99,0
t1/2 : temps de demi-vie (temps nécessaire pour que la concentration plasmatique d’une substance diminue de moitié).
Book 19-2.indb 189 2/21/2013 11:39:28 AM
EMHJ • Vol. 19 No. 2 • 2013 Eastern Mediterranean Health JournalLa Revue de Santé de la Méditerranée orientale
190
plasma maternel (Cmat), le volume de lait ingéré (VLI) par unité de poids et par jour en mL/kg/jour et le rapport des concentrations entre le lait et le plasma de la mère (ratio L/P). La concentration du médicament dans le plasma maternel qui est indiquée dans les études pharmaco-cinétiques peut être utilisée en pratique et multipliée par le ratio L/P pour donner la concentration par millilitre de lait.
On calcule ensuite directement la dose ingérée par l’enfant en multipliant la concentration dans le lait par le volume de lait ingéré par kg : Cmat × ratio L/P × VLI = dose kg/jour.
Ce mode de calcul de l’exposition a été proposé par Wilson et al. [6]. Il donne la quantité de médicament ingérée par le nourrisson sur une période de 24 heures. Il est certes utile mais les paramètres pharmacocinétiques doivent absolument être évalués en tenant compte de l’immaturité du nourrisson [7].
Appréhension pratique
La concentration maximale dans le lait correspond aux pics de concentration dans le plasma maternel. Il est donc préférable de ne pas allaiter lorsque la concentration du médicament dans le plasma maternel est à son maximum. De plus, la quantité de médicament liposoluble transmise à l’enfant varie en fonction de la durée de l’allaitement.
Pendant les dix à quinze premières minutes de tétée, le lait contient moins de lipides de sorte que dans les séances plus longues, l’enfant reçoit moins de substance liposoluble au début qu’en fin de tétée. Enfin, la quantité de lait absorbée par le nourrisson influe sur la quantité de substance ingérée. Même si la concentration du médicament par mL de lait est faible, la dose accumulée dans 600 à 1000 mL de lait par 24 heures peut entraîner un effet pharmacologique chez un enfant de
3 à 4 kg si ce médicament a une longue demi-vie chez le nouveau-né.
Un nouveau-né âgé d’une semaine consomme au plus 40 mL aux 4 heures, alors qu’à six semaines il consomme 150 mL aux 6 heures et qu’à 16 semaines il ingère de 150 mL à 225 mL ; 4 à 6 fois par jour, la quantité de substance ingérée par séance d’allaitement, négligeable au début, pourra avoir un effet sur l’enfant plus tard au cours de l’allaitement [8].
S o u v e n t , d a n s l a p r a t i q u e quotidienne, lorsqu’une conduite à tenir explicite figure dans la monographie d’un produit « allaitement possible » ou « allaitement contre-indiqué », elle doit être suivie dans la majorité des cas ; mais lorsque la conduite à tenir dans la monographie est moins claire « allaitement déconseillé » ou « simples données cinétiques » ou « rubrique non renseignée », la décision d’allaiter ou de poursuivre un allaitement maternel sous traitement doit être le plus souvent prise au cas par cas, en accord avec la mère, après l’avoir informée des risques éventuels. Il faut alors tenir compte de l’activité pharmacologique du médicament et de son profil cinétique, du profil des effets indésirables du médicament, de l’âge du nourrisson, du niveau d’allaitement, de la possibilité de la surveillance et de suivi du nourrisson et de la compréhension de la mère.
G é n é r a l e m e n t , n o u s s o m m e s c o n f r o n t é s à d e u x s i t u a t i o n s différentes : une nouvelle prescription durant l’allaitement ou le maintien d’un traitement déjà prescrit lors de la grossesse. En fait, si la mère souffre d ’ u n e a ff e c t i o n c h r o n i q u e p o u r laquelle le traitement est pris au long cours, et généralement antérieure à la grossesse, dans cette situation le risque paraît moindre pendant la période de l’allaitement relativement à la période de la grossesse car les concentrations qui atteignent le fœtus sont supérieures à celles qui atteignent le nourrisson par le biais du transfert lacté. Par contre, quand
des effets indésirables surviennent chez un enfant allaité en post-partum, ils sont plus probablement la conséquence de l’exposition au médicament in utero. Les médicaments les plus concernés sont généralement les psychotropes : dans une telle situation, une surveillance sera programmée avant la naissance.
Dans l’autre cas, le médecin est contraint à prescrire un traitement pendant l’allaitement. Si le traitement est destiné à traiter une pathologie aiguë, une suspension temporaire pourra être envisagée avec deux simples précautions : maintenir la lactation en tirant et en jetant le lait et reprendre le traitement en considérant les 7 demi-vies nécessaires à une élimination totale du traitement. Par ailleurs, si le traitement sera prescrit pendant une longue période au cours de l’allaitement, une démarche stratégique s’impose et consiste pratiquement à :
• évaluer de façon individuelle le rapport bénéfice/risque en tenant compte des données cliniques comme l’âge de l’enfant, son immaturité hépatique, ses capacités d’épuration, et des données pharmacologiques, surtout la classe pharmacologique du médicament et son potentiel à engendrer des effets indésirables ;
• connaître les médicaments ayant une affinité lactée et pouvant donner des concentrations élevées dans le lait ;
• être vigilant avec les médicaments qui peuvent entraîner une sédation ou une dépression respiratoire ou un syndrome de sevrage ;
• penser aux médicaments qui peuvent entraîner une diminution de la production lactée ;
• p r o m o u v o i r l e s m é d i c a m e n t s utilisables chez l’enfant ;
• promouvoir les médicaments ayant des données sur leur concentration lactée ;
• prendre le médicament à la fin de la tétée.
Book 19-2.indb 190 2/21/2013 11:39:28 AM
املجلد التاسع عرشاملجلة الصحية لرشق املتوسطالعدد الثاين
191
Références
1. Department of Health and Human Service Office on Women’s Health. Benefits of breastfeeding. Nutrition in Clinical Care, 2003, 6:125–131.
2. Leblanc PP et al. Traité de biopharmacie et pharmacocinétique. 3e édition [Treatise on biopharmaceutics and pharmacokinetics, 3rd ed.]. Montréal et Paris, Presses de l’Université de Montréal et Éditions Vigot, 1997:307–310.
3. Briggs GG, Freeman RK, Yaffe SJ. Drugs in pregnancy and lacta-tion. Baltimore, Williams and Wilkins, 1999:1595.
4. Hale TW. Medications and mothers’ milk. Amarillo, Pharmasoft Publishing, 2002:812.
5. Gremmo-Féger G, Dobrzynski M, Collet M. Allaitement ma-ternel et médicaments [Breastfeeding and drugs]. Journal de Gynécologie, Obstétrique et Biologie de la Reproduction, 2003, 32(5):466–475.
6. Wilson J. Drugs in breast milk. New York, ADIS Press, 1981.
7. Saulnier JL et Comité de Rédaction du Centre National d’Information sur le Médicament Hospitalier (CNIMH). Évalu-ation thérapeutique - Médicaments et allaitement [Therapeu-tic evaluation – drugs and breastfeeding]. Dossier du CNIMH, 1996, XVII(5-6).
Conclusion
Les paramètres pharmacocinétiques varient pour chaque médicament et les études en cas d’allaitement maternel manquent pour un nombre important de spécialités, en particulier quand leur commercialisation est récente. Ainsi, la mention « ne pas utiliser chez la femme allaitante » signifie plutôt l’absence
d’investigations pharmacocinétiques sur l’excrétion dans le lait que l’existence d’observations cliniques. Certaines règles simples peuvent aider les professionnels de santé confrontés à la prescription de médicaments chez la femme allaitant son enfant, comme proscrire les médicaments non indispensables, éviter les spécialités contenant une association de principes
actifs et se méfier de l’automédication. Il convient de toujours privilégier, dans une classe médicamenteuse donnée, le médicament passant le moins dans le lait, sans métabolite actif, à demi-vie courte ou ne s’accumulant pas dans le compartiment lacté. Enfin, la voie d’administration occasionnant le plus faible passage systémique doit être préférée.
Book 19-2.indb 191 2/21/2013 11:39:28 AM
EMHJ • Vol. 19 No. 2 • 2013 Eastern Mediterranean Health JournalLa Revue de Santé de la Méditerranée orientale
192
Revue
Diagnostic et évaluation de l’hépatite virale C chez l’hémodialyséA. Bahadi,1 O. Maoujoud,1 Y. Zejjari,1 A. Alayoud,1 K. Hassani,1 D. Elkabbaj 1 et M. Benyahia 1
RÉSUMÉ L’hépatite virale C constitue un problème de santé à l’échelle mondiale. L’Organisation mondiale de la Santé estime que 3 % de la population mondiale est infectée par le virus de l’hépatite C (VHC). Chez les hémodialysés, la prévalence atteint 80 % dans certains pays. Au Maroc, la prévalence est de 32 % selon le registre marocain de dialyse. L’histoire naturelle de l’infection par le virus de l’hépatite C chez l’hémodialysé chronique est caractérisée par une évolution silencieuse. Les moyens de diagnostic du VHC sont divers et de plus en plus sensibles : les tests indirects à la recherche des anticorps anti-VHC qui sont reproductibles mais les cas de faux négatifs sont très fréquents, et les tests directs recherchant l’ARN viral qui sont de plus en plus sensibles mais ne sont pas toujours disponibles et ont un coût élevé. L’utilisation de ces tests a été codifiée grâce aux nouvelles recommandations des sociétés savantes. Cependant, l’évaluation de l’atteinte hépatique demeure controversée et la ponction-biopsie hépatique reste la méthode de référence. Le présent article passe en revue les approches pour le diagnostic et l’évaluation de l’hépatite C chez l’hémodialysé.
1Service de Néphrologie, Dialyse et Transplantation rénale, Hôpital militaire d’instruction Mohammed V, Rabat (Maroc) (Correspondance à adresser à A. Bahadi : [email protected]).
Reçu : 28/02/12; accepté : 19/06/12
مراجعة تشخيص وتقييم فريوس التهاب الكبد يس بني مرىض الديال الدموي
عبدالعايل هبادي، عمر موجود، يارس زجياري، أمحد العيود، كوتر حساين، دريس الكباج، حممد بن حييى
ر منظمة الصحة العاملية أن 3% من سكان العامل اخلالصـة: يعد التهاب الكبد "يس" من املشكالت الصحية الواسعة االنتشار يف شتى أرجاء العامل. وتقديال، قد يصل معدل العدوى يف بعض البلدان إىل 80%، ويف املغرب يصل إىل %32 مصابون بالعدوى بفريوس التهاب الكبد "يس". ولدى مرىض الديال الدموي املزمن بتفاقم صامت. وهناك طرق يال. وتتسم السرية الطبيعية للعدوى بالتهاب الكبد "يس" لدى مرىض الد وفق السجل املغريب للدويمكن الكبد، "يس" اللتهاب الفريوس ألضداد مبارشة غري اختبارات وهناك باطراد، تتزايد خمتلفة لتشخيص التهاب الكبد "يس" وحساسيتها تكرارها، ولكن تشيع النتائج السلبية الكاذبة؛ وهناك طرق غري مبارشة الختبار الرنا الفريويس، وهي طرق أكثر حساسية ولكنها ال تكون متوافرة دائام، وتكون أغىل ثمنا من غريها. وقد تم تصنيف استعامالت هذه االختبارات من خالل التوصيات اجلديدة التي أصدرهتا اجلمعيات العلمية؛ إال أن تقييم أمراض الكبد اليزال موضع جدل، والتزال خزعة الكبد متثل املعيار الذهبي. وتستعرض هذه الورقة أساليب تشخيص وتقييم مرىض التهاب
يال الدموي. الكبد "يس" اخلاضعني للد
Diagnosis and evaluation of hepatitis C virus among haemodialysis patients
ABSTRACT Hepatitis C is a health problem worldwide. The World Health Organization estimates that 3% of world’s population is infected with hepatitis C virus (HCV). In haemodialysis patients, the prevalence reaches 80% in some countries. In Morocco, HCV prevalence is 32% according to the Moroccan register of dialysis. The natural history of hepatitis C infection in chronic haemodialysis patients is characterized by a silent evolution. There are different methods to diagnose HCV and they are becoming increasingly sensitive. There are indirect tests for antibodies to HCV: these are reproducible but false negatives are common and there is direct testing of viral RNA: this is more sensitive but not always available and is more expensive. The use of these tests has been categorized through new recommendations from learned societies. However, the evaluation of liver disease is still controversial and liver biopsy remains the gold standard. This paper reviews the approaches for diagnosing and evaluating hepatitis C in haemodialysis patients.
Book 19-2.indb 192 2/21/2013 11:39:29 AM
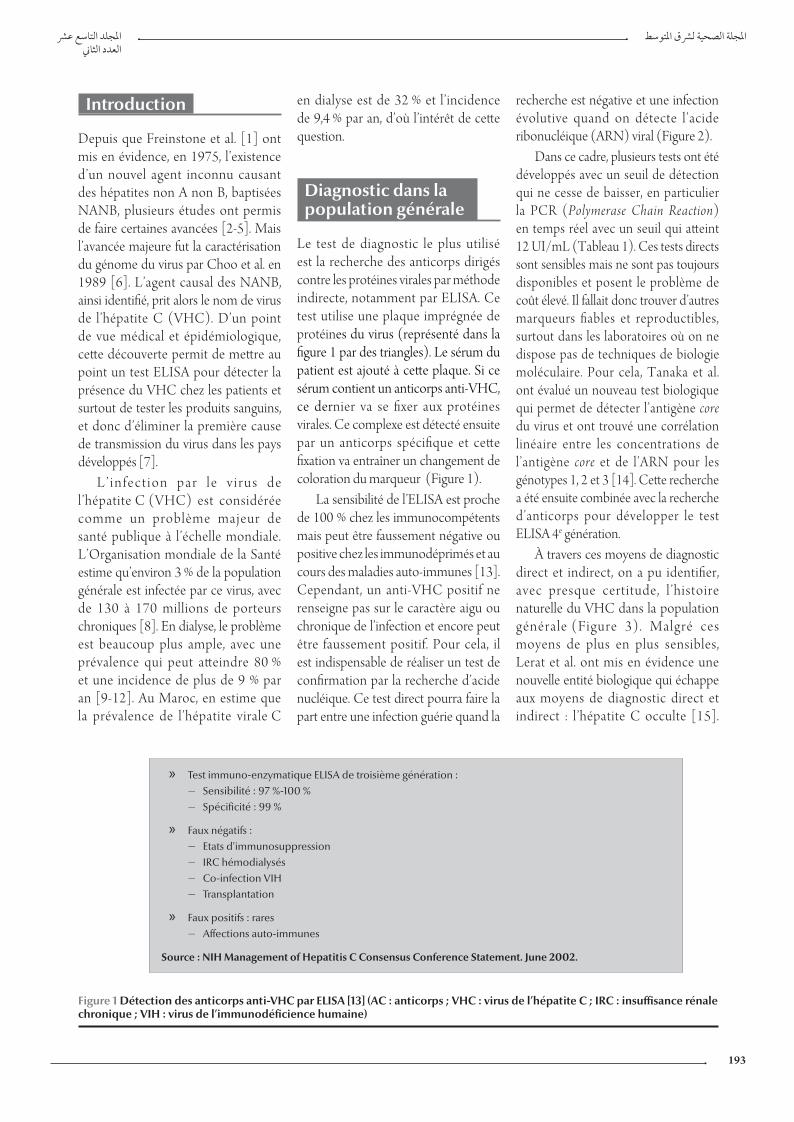
املجلد التاسع عرشاملجلة الصحية لرشق املتوسطالعدد الثاين
193
Introduction
Depuis que Freinstone et al. [1] ont mis en évidence, en 1975, l’existence d’un nouvel agent inconnu causant des hépatites non A non B, baptisées NANB, plusieurs études ont permis de faire certaines avancées [2-5]. Mais l’avancée majeure fut la caractérisation du génome du virus par Choo et al. en 1989 [6]. L’agent causal des NANB, ainsi identifié, prit alors le nom de virus de l’hépatite C (VHC). D’un point de vue médical et épidémiologique, cette découverte permit de mettre au point un test ELISA pour détecter la présence du VHC chez les patients et surtout de tester les produits sanguins, et donc d’éliminer la première cause de transmission du virus dans les pays développés [7].
L ’ i n f e c t i o n p a r l e v i r u s d e l’hépatite C (VHC) est considérée comme un problème majeur de santé publique à l’échelle mondiale. L’Organisation mondiale de la Santé estime qu’environ 3 % de la population générale est infectée par ce virus, avec de 130 à 170 millions de porteurs chroniques [8]. En dialyse, le problème est beaucoup plus ample, avec une prévalence qui peut atteindre 80 % et une incidence de plus de 9 % par an [9-12]. Au Maroc, en estime que la prévalence de l’hépatite virale C
en dialyse est de 32 % et l’incidence de 9,4 % par an, d’où l’intérêt de cette question.
Diagnostic dans la population générale
Le test de diagnostic le plus utilisé est la recherche des anticorps dirigés contre les protéines virales par méthode indirecte, notamment par ELISA. Ce test utilise une plaque imprégnée de protéines du virus (représenté dans la figure 1 par des triangles). Le sérum du patient est ajouté à cette plaque. Si ce sérum contient un anticorps anti-VHC, ce dernier va se fixer aux protéines virales. Ce complexe est détecté ensuite par un anticorps spécifique et cette fixation va entraîner un changement de coloration du marqueur (Figure 1).
La sensibilité de l’ELISA est proche de 100 % chez les immunocompétents mais peut être faussement négative ou positive chez les immunodéprimés et au cours des maladies auto-immunes [13]. Cependant, un anti-VHC positif ne renseigne pas sur le caractère aigu ou chronique de l’infection et encore peut être faussement positif. Pour cela, il est indispensable de réaliser un test de confirmation par la recherche d’acide nucléique. Ce test direct pourra faire la part entre une infection guérie quand la
recherche est négative et une infection évolutive quand on détecte l’acide ribonucléique (ARN) viral (Figure 2).
Dans ce cadre, plusieurs tests ont été développés avec un seuil de détection qui ne cesse de baisser, en particulier la PCR (Polymerase Chain Reaction) en temps réel avec un seuil qui atteint 12 UI/mL (Tableau 1). Ces tests directs sont sensibles mais ne sont pas toujours disponibles et posent le problème de coût élevé. Il fallait donc trouver d’autres marqueurs fiables et reproductibles, surtout dans les laboratoires où on ne dispose pas de techniques de biologie moléculaire. Pour cela, Tanaka et al. ont évalué un nouveau test biologique qui permet de détecter l’antigène core du virus et ont trouvé une corrélation linéaire entre les concentrations de l’antigène core et de l’ARN pour les génotypes 1, 2 et 3 [14]. Cette recherche a été ensuite combinée avec la recherche d’anticorps pour développer le test ELISA 4e génération.
À travers ces moyens de diagnostic direct et indirect, on a pu identifier, avec presque certitude, l ’histoire naturelle du VHC dans la population générale (Figure 3). Malgré ces moyens de plus en plus sensibles, Lerat et al. ont mis en évidence une nouvelle entité biologique qui échappe aux moyens de diagnostic direct et indirect : l’hépatite C occulte [15].
Figure 1 Détection des anticorps anti-VHC par ELISA [13] (AC : anticorps ; VHC : virus de l’hépatite C ; IRC : insuffisance rénale chronique ; VIH : virus de l’immunodéficience humaine)
» Test immuno-enzymatique ELISA de troisième génération : – Sensibilité : 97 %-100 % – Spécificité : 99 %
» Faux négatifs : – Etats d'immunosuppression – IRC hémodialysés – Co-infection VIH – Transplantation
» Faux positifs : rares – Affections auto-immunes
Source : NIH Management of Hepatitis C Consensus Conference Statement. June 2002.
Book 19-2.indb 193 2/21/2013 11:39:29 AM
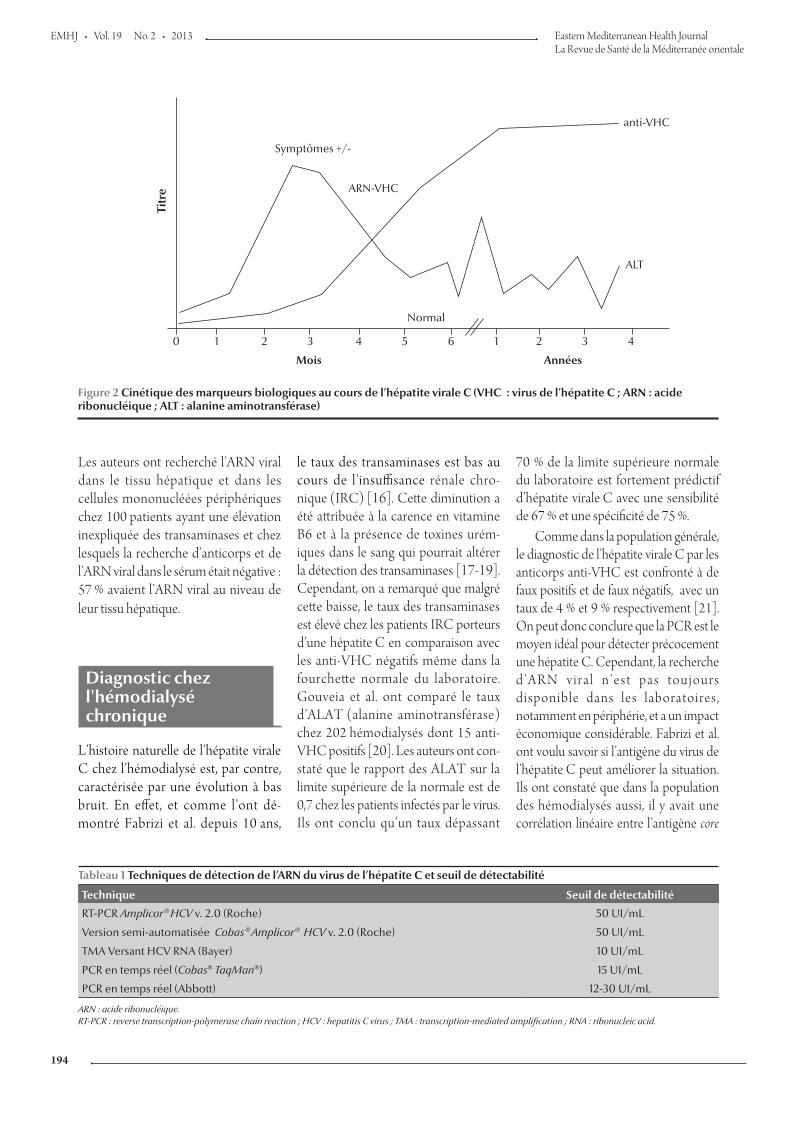
EMHJ • Vol. 19 No. 2 • 2013 Eastern Mediterranean Health JournalLa Revue de Santé de la Méditerranée orientale
194
Les auteurs ont recherché l’ARN viral dans le tissu hépatique et dans les cellules mononucléées périphériques chez 100 patients ayant une élévation inexpliquée des transaminases et chez lesquels la recherche d’anticorps et de l’ARN viral dans le sérum était négative : 57 % avaient l’ARN viral au niveau de leur tissu hépatique.
Diagnostic chez l'hémodialysé chronique
L’histoire naturelle de l’hépatite virale C chez l’hémodialysé est, par contre, caractérisée par une évolution à bas bruit. En effet, et comme l’ont dé-montré Fabrizi et al. depuis 10 ans,
le taux des transaminases est bas au cours de l’insuffisance rénale chro-nique (IRC) [16]. Cette diminution a été attribuée à la carence en vitamine B6 et à la présence de toxines urém-iques dans le sang qui pourrait altérer la détection des transaminases [17-19]. Cependant, on a remarqué que malgré cette baisse, le taux des transaminases est élevé chez les patients IRC porteurs d’une hépatite C en comparaison avec les anti-VHC négatifs même dans la fourchette normale du laboratoire. Gouveia et al. ont comparé le taux d’ALAT (alanine aminotransférase) chez 202 hémodialysés dont 15 anti-VHC positifs [20]. Les auteurs ont con-staté que le rapport des ALAT sur la limite supérieure de la normale est de 0,7 chez les patients infectés par le virus. Ils ont conclu qu’un taux dépassant
70 % de la limite supérieure normale du laboratoire est fortement prédictif d’hépatite virale C avec une sensibilité de 67 % et une spécificité de 75 %.
Comme dans la population générale, le diagnostic de l’hépatite virale C par les anticorps anti-VHC est confronté à de faux positifs et de faux négatifs, avec un taux de 4 % et 9 % respectivement [21]. On peut donc conclure que la PCR est le moyen idéal pour détecter précocement une hépatite C. Cependant, la recherche d ’ A R N v i r a l n ’ e s t p a s t o u j o u r s disponible dans les laboratoires, notamment en périphérie, et a un impact économique considérable. Fabrizi et al. ont voulu savoir si l’antigène du virus de l’hépatite C peut améliorer la situation. Ils ont constaté que dans la population des hémodialysés aussi, il y avait une corrélation linéaire entre l’antigène core
Figure 2 Cinétique des marqueurs biologiques au cours de l’hépatite virale C (VHC : virus de l’hépatite C ; ARN : acide ribonucléique ; ALT : alanine aminotransférase)
Tableau 1 Techniques de détection de l’ARN du virus de l’hépatite C et seuil de détectabilité
Technique Seuil de détectabilité
RT-PCR Amplicor® HCV v. 2.0 (Roche) 50 UI/mL
Version semi-automatisée Cobas® Amplicor® HCV v. 2.0 (Roche) 50 UI/mL
TMA Versant HCV RNA (Bayer) 10 UI/mL
PCR en temps réel (Cobas® TaqMan®) 15 UI/mL
PCR en temps réel (Abbott) 12-30 UI/mL
ARN : acide ribonucléique. RT-PCR : reverse transcription-polymerase chain reaction ; HCV : hepatitis C virus ; TMA : transcription-mediated amplification ; RNA : ribonucleic acid.
Titr
eSymptômes +/-
ARN-VHC
Normal
Mois Années
ALT
anti-VHC
0 1 2 3 4 5 6 1 2 3 4
Book 19-2.indb 194 2/21/2013 11:39:29 AM
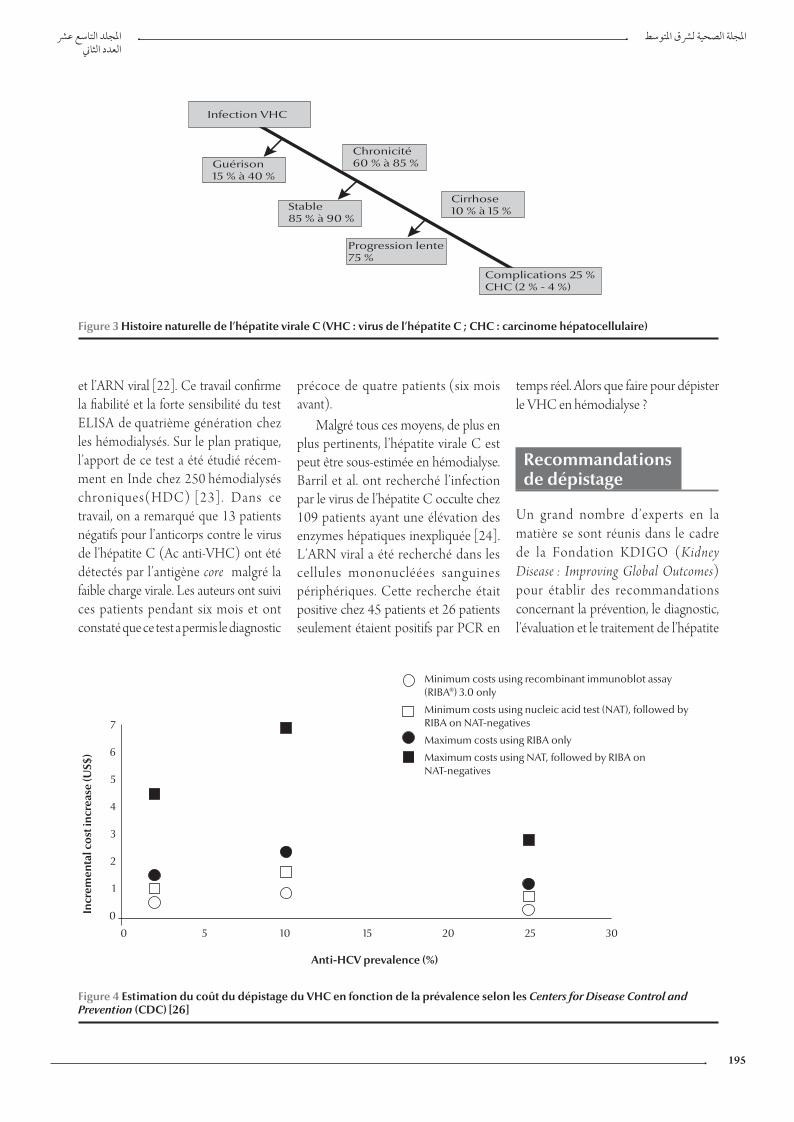
املجلد التاسع عرشاملجلة الصحية لرشق املتوسطالعدد الثاين
195
et l’ARN viral [22]. Ce travail confirme la fiabilité et la forte sensibilité du test ELISA de quatrième génération chez les hémodialysés. Sur le plan pratique, l’apport de ce test a été étudié récem-ment en Inde chez 250 hémodialysés chroniques(HDC) [23]. Dans ce travail, on a remarqué que 13 patients négatifs pour l’anticorps contre le virus de l’hépatite C (Ac anti-VHC) ont été détectés par l’antigène core malgré la faible charge virale. Les auteurs ont suivi ces patients pendant six mois et ont constaté que ce test a permis le diagnostic
précoce de quatre patients (six mois avant).
Malgré tous ces moyens, de plus en plus pertinents, l’hépatite virale C est peut être sous-estimée en hémodialyse. Barril et al. ont recherché l’infection par le virus de l’hépatite C occulte chez 109 patients ayant une élévation des enzymes hépatiques inexpliquée [24]. L’ARN viral a été recherché dans les cellules mononucléées sanguines périphériques. Cette recherche était positive chez 45 patients et 26 patients seulement étaient positifs par PCR en
temps réel. Alors que faire pour dépister le VHC en hémodialyse ?
Recommandations de dépistage
Un grand nombre d’experts en la matière se sont réunis dans le cadre de la Fondation KDIGO (Kidney Disease : Improving Global Outcomes) pour établir des recommandations concernant la prévention, le diagnostic, l’évaluation et le traitement de l’hépatite
Figure 3 Histoire naturelle de l’hépatite virale C (VHC : virus de l’hépatite C ; CHC : carcinome hépatocellulaire)
Incr
emen
tal c
ost i
ncre
ase
(US$
)
Anti-HCV prevalence (%)
7
6
5
4
3
2
1
0
0 5 10 15 20 25 30
Minimum costs using recombinant immunoblot assay (RIBA®) 3.0 only
Minimum costs using nucleic acid test (NAT), followed by RIBA on NAT-negatives
Maximum costs using RIBA only
Maximum costs using NAT, followed by RIBA on NAT-negatives
Figure 4 Estimation du coût du dépistage du VHC en fonction de la prévalence selon les Centers for Disease Control and Prevention (CDC) [26]
Infection VHC
Stable85 % à 90 %
Progression lente75 %
Guérison15 % à 40 %
Complications 25 % CHC (2 % - 4 %)
Chronicité60 % à 85 %
Cirrhose10 % à 15 %
Book 19-2.indb 195 2/21/2013 11:39:30 AM
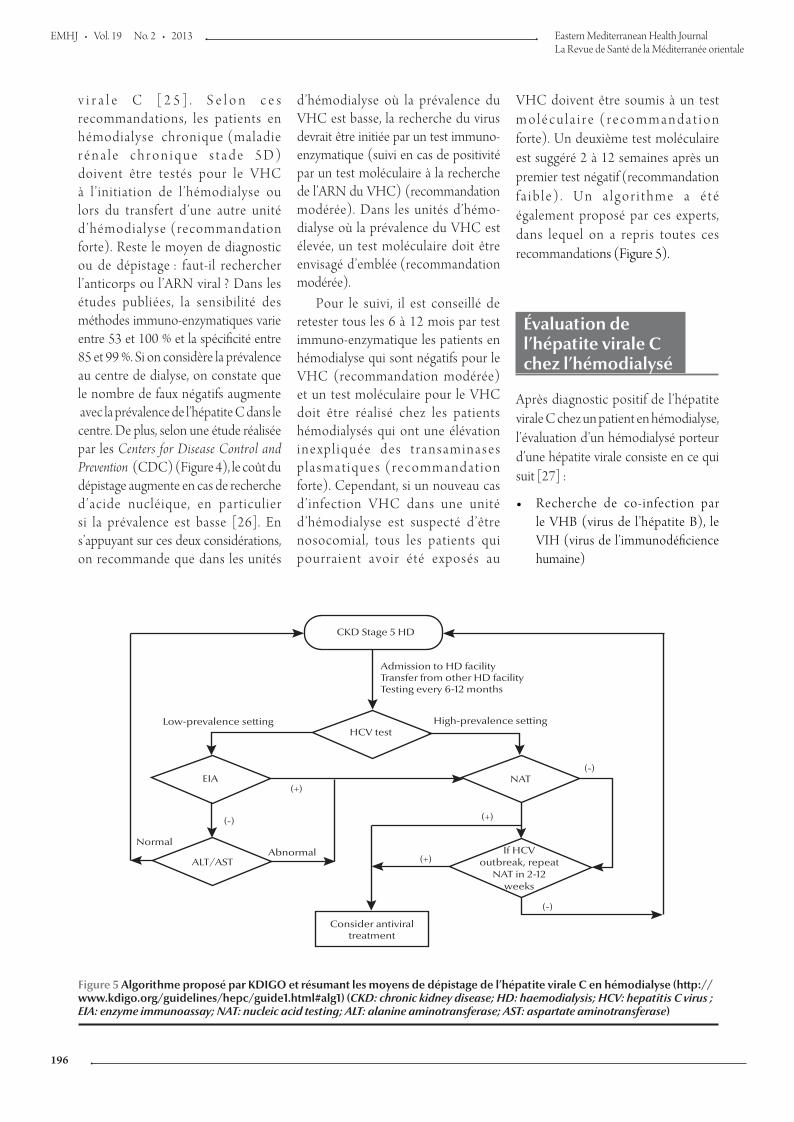
EMHJ • Vol. 19 No. 2 • 2013 Eastern Mediterranean Health JournalLa Revue de Santé de la Méditerranée orientale
196
v i r a l e C [ 2 5 ] . S e l o n c e s recommandations, les patients en hémodialyse chronique (maladie r én a l e c h ron i que s t a d e 5D) doivent être testés pour le VHC à l’initiation de l’hémodialyse ou lors du transfert d’une autre unité d’hémodialyse (recommandation forte). Reste le moyen de diagnostic ou de dépistage : faut-il rechercher l’anticorps ou l’ARN viral ? Dans les études publiées, la sensibilité des méthodes immuno-enzymatiques varie entre 53 et 100 % et la spécificité entre 85 et 99 %. Si on considère la prévalence au centre de dialyse, on constate que le nombre de faux négatifs augmente avec la prévalence de l’hépatite C dans le centre. De plus, selon une étude réalisée par les Centers for Disease Control and Prevention (CDC) (Figure 4), le coût du dépistage augmente en cas de recherche d’acide nucléique, en particulier si la prévalence est basse [26]. En s’appuyant sur ces deux considérations, on recommande que dans les unités
d’hémodialyse où la prévalence du VHC est basse, la recherche du virus devrait être initiée par un test immuno-enzymatique (suivi en cas de positivité par un test moléculaire à la recherche de l’ARN du VHC) (recommandation modérée). Dans les unités d’hémo-dialyse où la prévalence du VHC est élevée, un test moléculaire doit être envisagé d’emblée (recommandation modérée).
Pour le suivi, il est conseillé de retester tous les 6 à 12 mois par test immuno-enzymatique les patients en hémodialyse qui sont négatifs pour le VHC (recommandation modérée) et un test moléculaire pour le VHC doit être réalisé chez les patients hémodialysés qui ont une élévation i n e x p l i q u é e d e s t r a n s a m i n a s e s p l a s m a t i q u e s ( r e c o m m a n d a t i o n forte). Cependant, si un nouveau cas d’infection VHC dans une unité d’hémodialyse est suspecté d’être nosocomial, tous les patients qui pourraient avoir été exposés au
VHC doivent être soumis à un test m o l é c u l a i r e ( r e c o m m a n d a t i o n forte). Un deuxième test moléculaire est suggéré 2 à 12 semaines après un premier test négatif (recommandation f a ib l e) . Un a l go r i thme a é t é également proposé par ces experts, dans lequel on a repris toutes ces recommandations (Figure 5).
Évaluation de l’hépatite virale C chez l’hémodialysé
Après diagnostic positif de l’hépatite virale C chez un patient en hémodialyse, l’évaluation d’un hémodialysé porteur d’une hépatite virale consiste en ce qui suit [27] :
• Recherche de co-infection par le VHB (virus de l’hépatite B), le VIH (virus de l’immunodéficience humaine)
CKD Stage 5 HD
Consider antiviral treatment
HCV test
NATEIA
ALT/AST
Admission to HD facilityTransfer from other HD facilityTesting every 6-12 months
NormalAbnormal
Low-prevalence setting High-prevalence setting
If HCVoutbreak, repeat
NAT in 2-12weeks
(+)
(+)
(+)
(-)
(-)
(-)
Figure 5 Algorithme proposé par KDIGO et résumant les moyens de dépistage de l’hépatite virale C en hémodialyse (http://www.kdigo.org/guidelines/hepc/guide1.html#alg1) (CKD: chronic kidney disease; HD: haemodialysis; HCV: hepatitis C virus ; EIA: enzyme immunoassay; NAT: nucleic acid testing; ALT: alanine aminotransferase; AST: aspartate aminotransferase)
Book 19-2.indb 196 2/21/2013 11:39:30 AM
املجلد التاسع عرشاملجلة الصحية لرشق املتوسطالعدد الثاين
197
• Détermination de la charge virale par PCR-RT
• Identification du génotype
• Évaluation de la maladie hépatique
– P l a q u e tt e s , t a u x d e prothrombine (TP), bilirubine, albumine, échographie
– Ponction-biopsie hépatique/ FibroTest® et FibroScan®.
Concernant la charge virale , des précautions sont nécessaires ; notamment, les prélèvements doivent être réalisés avant le branchement car l’héparine inhibe la transcriptase inverse (reverse transcriptase- RT) et pourrait contribuer à de faux négatifs ou à réduire la charge virale. La centrifugation doit être réalisée en moins de 4 heures après prélèvement et la conservation après , de pré férence , à moins de 20 °C [26].
Le problème majeur est le suivant : comment évaluer la fibrose ? La ponction-biopsie hépatique (PBH) est la méthode de référence pour évaluer la sévérité de l’atteinte hépatique par le VHC [28]. Elle permet l’évaluation de la sévérité de l’inflammation, la recherche de maladie associée et surtout la mesure de la fibrose (stade). Pour cela, on s’est basé depuis plusieurs années sur le score de Ishak et surtout le score Métavir [29,30] qui évaluent la fibrose en quatre stades et l’activité en trois stades.
D a n s l a p o p u l a t i o n d e s hémodialysés, cet examen invasif peut aboutir à de nombreuses complications, surtout hémorragiques. Ozdogan et al . ont recensé les complications de la PBH chez 150 patients, dont 74 patients atteints d’IRC [31]. Les auteurs ont été confrontés à sept complications hémorragiques dans le groupe IRC alors qu’aucun saignement n’a été objectivé chez le groupe témoin. Mais c’est un risque potentiel puisque des études récentes ont démontré que le risque est moins important que dans
la population générale. Dans une étude randomisée, publiée il y a 2 ans, et qui incluait plus de 300 patients dont 78 hémodialysés, Pawa et al. ont démontré que la PBH était sans risque chez les hémodialysés [32].
De plus, la PBH transjugulaire reste un moyen alternatif en cas de risque hémorragique accru surtout chez les patients obèses, en présence d’ascite ou en cas de thrombopénie. Dans ce cadre, Ahmad et al. ont comparé les complications de la PBH entre deux groupes : 46 patients ayant bénéficié d’une PBH par voie transjugulaire et 32 patients d’une PBH par voie percutanée [33]. Il n’y avait aucune différence statistique entre les deux groupes. Les résultats sont surprenants p u i s q u ’ a u c u n e c o m p l i c a t i o n hémorragique n’a été recensée dans le groupe de PBH par voie transjugulaire. La différence entre les deux groupes est significative.
Le problème majeur de la PBH reste sa reproductibilité. Calès et al. ont démontré la grande variabilité du diagnostic histologique en pratique courante [34]. En effet, dans cette série de 205 hépatites chroniques C, le diagnostic initial posé par le pathologiste généraliste ou de première ligne a été comparé à celui d’une relecture par un expert du groupe Métavir. Si l’accord n’est pas mauvais aux stades extrêmes, il devient très médiocre pour les stades intermédiaires, en particulier pour le stade 2, puisque, lorsque l’expert dit stade 2, le pathologiste de première ligne peut dire 0, 1, 2, 3, ou 4 ! Ceci explique que la concordance globale en pratique courante est médiocre, donc insuffisante.
D’autres moyens biologiques pour évaluer la fibrose ont prouvé leur efficacité dans la population générale et le FibroTest® en est le chef de file. Varaut et al. ont utilisé ce test et ont retrouvé que pour 50 hémodialysés chroniques et 60 transplantés, 88 % et 77 % des patients respectivement ont
été correctement classés par rapport au score Métavir [35]. Et on remarque aussi que la valeur prédictive positive est augmentée quand le score est plus important (score > 0,6). D’autres tests biologiques ont été étudiés mais aucune corrélation n’a été retrouvée avec le degré de fibrose hépatique chez l’hémodialysé [36].
L’élastométrie impulsionnelle ultrasonore représente une nouvelle étape dans le développement de tests diagnostiques non invasifs de la fibrose hépatique. Avec un résultat instantané, une technique indolore non invasive, renouvelable et un apprentissage aisé, l ’élastométrie hépatique est véritablement le « stéthoscope h é p a t o l o g i q u e » , a v e c d é j à d e nombreuses applications.
L a v a l e u r d e l ’ é l a s t o m é t r i e impulsionnelle n’a été évaluée au cours de la maladie rénale qu’une seule fois par Alric et al. [37]. En effet, les auteurs ont démontré chez 38 transplantés que le FibroScan® a permis la classification correcte dans 90 % des cas en cas de fibrose minime (< F2). Cependant, le diagnostic est incorrect dans environ 40 % des patients avec fibrose sévère (F3/F4).
Dans un diagnostique, le FibroScan® pourrait être complémentaire des tests biologiques, chacun ayant ses propres limites. Pour cela, Castéra et al. ont étudié la sensibilité et la spécificité de l’association de ces deux moyens [38]. Les auteurs ont constaté que le stade de fibrose a été correctement établi par cette association dans 88 % et 95 % des cas de fibrose débutante et avancée respectivement. Il est donc trop tôt pour préciser la place de ces tests non invasifs par rapport à la biopsie hépatique et jusqu’à ce jour, il n’y a pas de recommandation claire concernant ce sujet. Selon l’AASLD (American Association for the Study of Liver Diseases), la ponction-biopsie hépatique chez un hémodialysé doit être discutée au cas par cas [39].
Book 19-2.indb 197 2/21/2013 11:39:30 AM
EMHJ • Vol. 19 No. 2 • 2013 Eastern Mediterranean Health JournalLa Revue de Santé de la Méditerranée orientale
198
1. Freinstone SM et al. Transfusion associated hepatitis not due to viral hepatitis A or B. New England Journal of Medicine, 1975, 292:767–770.
2. Alter HJ et al. Transmissible agent in non-A, non-B hepatitis. Lancet, 1(8062):459–463.
3. André P et al. Characterization of low- and very-low-density hepatitis C virus RNA-containing particles. Journal of virology, 2002, 76(14):6919–6928.
4. Bartenschlager R et al. Nonstructural protein 3 of the hepatitis C virus encodes a serine-type proteinase required for cleavage at the NS3/4 and NS4/5 junctions. Journal of virology, 1993, 67(7):3835–3844.
5. Behrens SE, Tomei L, De Francesco R. Identification and prop-erties of the RNA-dependent RNA polymerase of hepatitis C virus. The EMBO Journal, 1996, 15(1):12–22.
6. Choo QL et al. Isolation of a cDNA clone derived from a blood-borne non-A, non-B viral hepatitis genome. Science, 1989, 244(4902):359–362.
7. Kuo G et al. An assay for circulating antibodies to a major etiologic virus of human non-A, non-B hepatitis. Science, 1989, 244(4902):362–364.
8. Organisation mondiale de la Santé. Document WHA62/22. Hépatite virale [Viral hepatitis]. Soixante-Deuxième Assem-blée mondiale de la Santé, Genève, 2009 (http://apps.who.int/gb/ebwha/pdf_files/A62/A62_22-fr.pdf, consulté le 29 octobre 2012)
9. Fabrizi F, Poordad FF, Martin P. Infection and the patient with end-stage renal disease. Hepatology (Baltimore, Md.), 2002, 36(1):3–10.
10. Magredial (Maroc Greffe et Dialyse) Registre de l’Insuffisance rénale chronique terminale [Morocco Dialysis and Transplant « Magredial » Registry]. Rabat, Ministère de la Santé, Direction des Hôpitaux et des Soins ambulatoires (Communication orale des résultats de 2005), 2009.
11. Sekkat S et al. Prévalence des anticorps anti-VHC et incidence de séroconversion dans cinq centres d’hémodialyse au Maroc [Prevalence of anti-HCV antibodies and seroconversion inci-dence in five haemodialysis units in Morocco]. Néphrologie & Thérapeutique, 2008, 4(2):105–110.
12. Fissell RB et al. Patterns of hepatitis C prevalence and seror-conversion in hemodialysis units from three continents: The DOPPS. Kidney International, 2004, 65:2335–2342.
13. NIH Consensus Statement on Management of Hepatitis C: 2002. NIH Consensus and State-of-the-Science Statements, 2002, 19(3):1–46 (http://consensus.nih.gov/2002/2002HepatitisC2002116PDF.pdf, accessed 7 September 2012).
14. Tanaka E et al. Evaluation of a new enzyme immunoassay for hepatitis C virus (HCV) core antigen with clinical sensitivity approximating that of genomic amplification of HCV RNA. Hepatology (Baltimore, Md.), 2000, 32:388–393.
15. Lerat et al. Occult hepatitis C virus infection in patients in whom the etiology of persistently abnormal results of liver-function tests is unknown. Journal of Infectious Diseases, 2004, 189(1):3–6; 7–14.
16. Fabrizi F et al. Decreased serum aminotransferase activity in patients with chronic renal failure: Impact on the detection
of viral hepatitis. American Journal of Kidney Diseases, 2001, 38(5):1009–1015.
17. Perico N et al. Infection and Chronic Renal Diseases. Clinical Journal of the American Society of Nephrology; CJASN, 2009, 4:207–220.
18. Tang S, Lai KN. Chronic viral hepatitis in hemodialysis patients. Hemodialysis International. International Symposium on Home Hemodialysis, 2005, 9:169–179.
19. Furusyo N et al. Liver damage in hemodialysis patients with hepatitis C virus viremia: A prospective 10-year study. Digestive Diseases and Sciences, 2000, 45:2221–2228.
20. Cavalcanti Gouveia E et al. Identificacao de ponto de corte no nivel serico da alanina aminotransferase para rastrea-mento da hepatite C em pacientes com insuficiencia renal cronica em hemodialise [Identification of the cutoff value for serum alanine aminotransferase in hepatitis C screen-ing of patients with chronic renal failure on hemodialysis]. Revista da Sociedade Brasileira de Medicina Tropical, 2004, 37:18–21.
21. Hanuka N et al. Hepatitis C virus infection in renal failure patients in the absence of anti-hepatitis C virus antibodies. Journal of Viral Hepatitis, 2002, 9(2):141–145.
22. Fabrizi F et al. Novel assay using total hepatitis C Virus (HCV) core antigen quantification for diagnosis of HCV infection in dialysis patients. Journal of Clinical Microbiology, 2005, 43(1):414–420.
23. Medhi S et al. Diagnostic utility of hepatitis C virus core an-tigen in hemodialysis patients. Clinical Biochemistry, 2008, 41:447–452.
24. Barril I et al. Occult hepatitis C virus infection among hemo-dialysis patients. Journal of the American Society of Nephrology, 2008, 19:2288–2292.
25. KDIGO clinical practice guidelines for the prevention. diagno-sis, evaluation, and treatment of hepatitis C in chronic kidney disease. Kidney International. Supplement, 2008, (109):S1–S99.
26. Recommendations for preventing transmission of infections among chronic hemodialysis patients. MMWR Recommenda-tions and Reports, 2001, 50(RR–5):1–43.
27. Perico N et al. Infection and Chronic Renal Diseases. Clinical Journal of the American Society of Nephrology; CJASN, 2009, 4:207–220.
28. Saleh HA, Abu-Rashed AH. Liver biopsy remains the gold stand-ard for evaluation of chronic hepatitis and fibrosis. Journal of Gastrointestinal and Liver Disease, 2007, 16:425–426.
29. Ishak K et al. Histological grading and staging of chronic hepa-titis. Journal of Hepatology, 1995, 22:696–699.
30. Bedossa P, Poynard T. An algorithm for the grading of activity in chronic hepatitis C. The METAVIR Cooperative Study Group. Hepatology (Baltimore, Md.), 1996, 24:289–293.
31. Ozdogan M et al. H. Telatar percutaneous liver biopsy compli-cations in patients with chronic renal failure. Nephron, 1996, 74:442–443.
32. Pawa S et al. percutaneous liver biopsy is safe in chronic hepa-titis C Patients with end-stage renal disease. Clinical Gastroen-terology and Hepatology, 2007, 5(11):1316–1320.
Références
Conclusion
L’hépatite virale C constitue un souci majeur en dialyse. Les moyens
diagnostiques ont bénéficié des progrès de la biologie moléculaire, cependant beaucoup de questions restent sujets à controverse, notamment l’hépatite occulte.
Concernant l’évaluation de la fibrose hépatique, il est trop tôt pour préciser la place des tests non invasifs par rapport à la biopsie hépatique chez l’hémodialysé.
Book 19-2.indb 198 2/21/2013 11:39:30 AM
املجلد التاسع عرشاملجلة الصحية لرشق املتوسطالعدد الثاين
199
33. Ahmad A et al. Transjugular liver biopsy in patients with end-stage renal disease. Journal of Vascular and Interventional Radi-ology, 2004, 15:257–260.
34. Calès P et al. Reproductibilité des examens usuels pour la fibrose hépatique en pratique clinique : PBH, tests sanguins et Fibroscan. [Reproductibility of routine examinations for liver fibrosis in clinical practice: liver biopsy, blood tests and Fibroscan]. Communication orale présentée aux Journées francophones de pathologie digestive (JFPD) (Résumé), Paris, 2008 (http://www.biols.fr/uploads/rte/File/JFPD2008VARIOB9.pdf, consulté le 29 octobre 2012).
35. Varaut A et al. Diagnostic accuracy of the fibrotest in hemo-dialysis and renal transplant patients with chronic hepatitis C virus. Transplantation, 2005, 80(11):1550–1555.
36. Boyacioğlu S et al. Investigation of possible clinical and labo-ratory predictors of liver fibrosis in hemodialysis patients
infected with hepatitis C virus. Transplantation proceedings, 2004, 36(1):50–52.
37. Alric L et al. Comparison of liver stiffness, fibrotest and liver biopsy for the assessment of liver fibrosis in renal transplant patient with chronic viral hepatitis. Transplant International, 2009, 22(5):568–573.
38. Castéra L et al. Prospective comparison of transient elastog-raphy, fibrotest, APRI, and Liver biopsy for the assessment of fibrosis in chronic hepatitis C. Gastroenterology, 2005, 128:343–350.
39. Ghany MG et al. Diagnosis, management, and treatment of hepatitis C: an update. Hepatology (Baltimore, Md.), 2009, 49:1335–1373.
Book 19-2.indb 199 2/21/2013 11:39:31 AM
EMHJ • Vol. 19 No. 2 • 2013 Eastern Mediterranean Health JournalLa Revue de Santé de la Méditerranée orientale
200
Report
Evaluation of the national tuberculosis surveillance system in AfghanistanK.M.I. Saeed,1,3 R. Bano 2 and R.J. Asghar 3
ABSTRACT Afghanistan has 2 tuberculosis surveillance systems, the National Tuberculosis Control Programme (NTP) and the Health Management Information System (HMIS). An evaluation of these surveillance systems in January/February 2010 was done to identify their strengths and weaknesses and to formulate recommendations. Attributes of the programmes were evaluated using US Centers for Disease Control and Prevention guidelines. Usefulness and flexibility of the NTP system were good; stability, representativeness and data quality were average. Simplicity, acceptability and timeliness were poor. Reporting delays regularly exceeded 3 months. Positive predictive value and sensitivity were 11% and 70% respectively. The HMIS system was simple, acceptable and stable, with timely reporting. Reporting and feedback were good, as this system has strong government support. Flexibility, data quality and representativeness were average. Positive predictive value and sensitivity were 10% and 68% respectively. No outbreaks were detected by either system. The NTP and HMIS surveillance systems are duplicative and neither covers the private sector.
1Afghanistan National Public Health Institute, Ministry of Public Health, Kabul, Afghanistan (Correspondence to K.M.I. Saeed: [email protected]).2Communicable Disease Surveillance and Response Unit, World Health Organization Country Office, Kabul, Afghanistan.3Field Epidemiology and Laboratory Training Programme, National Institute of Health, Islamabad, Pakistan.
Received: 29/08/11; accepted: 21/02/12
د السل يف أفغانستان تقييم النظام الوطني لرتصخواجة مري إسالم سعيد، راشدة سيد بانو، رانا جواد أصغر
د السل؛ الربنامج الوطني ملكافحة السل، ونظام املعلومات لإلدارة الصحية. وقد أجرى الباحثون تقييام اخلالصـة: يوجد يف أفغانستان نظامان لرتصف عىل مواطن القوة ومكامن الضعف ولصياغة التوصيات. وتم د يف الفرتة كانون الثاين/يناير – شباط/فرباير 2010 للتعر هلذين النظامني للرتصتقييم مكونات كل نظام باستخدام الدالئل اإلرشادية ملراكز مكافحة األمراض والوقاية منها يف الواليات املتحدة األمريكية، ووجد الباحثون أن منافع ومرونة الربنامج الوطني ملكافحة السل جيدة، وأن استقراره وحسن متثيله وجودة املعطيات فيه معتدلة، أما البساطة واملقبولية ومالءمة التوقيت ر يف إصدار التقارير ثالثة أشهر، وكانت القيمة التنبؤية اإلجيابية 11% واحلساسية 70%. كام وجد الباحثون أن نظام فيه فكانت سيئة؛ إذ يتجاوز التأخاملعلومات لإلدارة الصحية بسيط ومقبول ومستقر، تعد تقاريره يف الوقت املناسب، وقد كان إعداد التقارير واإلمداد باملعلومات االرجتاعية جيدا ألن هذا النظام كان حيظى بدعم حكومي جيد. وكانت املرونة وجودة املعطيات والتمثيل معتدلة، وكانت القيمة التنبؤية اإلجيابية 10% واحلساسية %68.
د وأهنام ال يغطيان القطاع اخلاص. ومل يكشف أي من النظامني أية فاشية. واتضح للباحثني أن النظامني يمثالن ازدواجية جلهود الرتص
Évaluation du système national de surveillance de la tuberculose en Afghanistan
RÉSUMÉ L'Afghanistan dispose de deux systèmes de surveillance de la tuberculose, le Programme national de lutte antituberculeuse et le système d'information pour la gestion de la santé. Une évaluation de ces systèmes de surveillance en janvier/février 2010 a été menée afin d'identifier leurs forces et leurs faiblesses et de formuler des recommandations. Les caractéristiques des programmes ont été évaluées à l'aide des recommandations des Centers for Disease Control and Prevention américains. L'utilité et la souplesse du programme national de lutte antituberculeuse étaient satisfaisantes ; la représentativité et la qualité des données étaient moyennes. La simplicité, l'acceptabilité et la ponctualité étaient médiocres. Le retard de transmission des notifications dépassait régulièrement trois mois. La valeur prédictive positive et la sensibilité étaient respectivement de 11 % et 70 %. Le système d'information pour la gestion de la santé était simple, acceptable et stable, et transmettait les notifications en temps voulu. Les notifications et les commentaires étaient satisfaisants, car le système bénéficiait d'un appui soutenu du gouvernement. La souplesse, la qualité des données et la représentativité étaient moyennes. La valeur prédictive positive et la sensibilité étaient respectivement de 10 % et 68 %. Aucune flambée n'a été détectée par ces deux systèmes. Le programme national de lutte antituberculeuse et le système d'information pour la gestion de la santé font double emploi mais aucun ne couvre le secteur privé.
Book 19-2.indb 200 2/21/2013 11:39:31 AM
املجلد التاسع عرشاملجلة الصحية لرشق املتوسطالعدد الثاين
201
Introduction
Tuberculosis (TB) is a public health problem which is more common in de-veloping countries due to the disease’s close links to poverty, housing status and access to health services. Furthermore, the disease has been re-emerging in developed countries in recent decades. Based on World Health Organization (WHO) estimates, 9.27 million new cases of TB occurred in 2007 (139 per 100 000 population), compared with 9.24 million new cases (140 per 100 000 population) in 2006 [1].
Afghanistan is recovering from the aftermath of more than 2 decades of civil war; nevertheless, there is ongo-ing security instability and economic difficulties in the country. Control of communicable diseases is one of the highest priorities for the Ministry of Public Health (MoPH) because these account for 60%–80% of all curative outpatient visits and over half of all deaths in Afghanistan [2]. The country remains one of the TB high-burden countries with a high ratio of females to males infected (1.85:1). TB control services are an integral part of the pack-age of services delivered through the primary health care system at district and provincial levels. The sustainability of activities is unclear, however, given the unstable security situation with its current reliance on donor support.
TB control is a priority for the coun-try, being one of the main 7 compo-nents of the Basic Package of Health Services for Afghanistan [3]. TB care is provided free of charge in all public health facilities. It is very important to strengthen surveillance systems in order to find TB patients as early as possible and treat them properly. There are sur-veillance 2 systems which, in addition to other activities, are responsible for TB surveillance in Afghanistan: the Health Management Information System (HMIS) [4] and the National Tuber-culosis Control Programme (NTP). This paper is an evaluation report which
describes the national tuberculosis surveillance systems in Afghanistan, identifies strength and weakness of the systems and provides recommenda-tions for improvement.
Methods
The review was undertaken during January to February 2010. In order to evaluate the TB surveillance systems at the national level the guidelines for the evaluation of public health surveillance systems developed by the United States Centers for Disease Control and Pre-vention (CDC) [5] were used. These guidelines include the following steps:
• Engage the stakeholders in evalua-tion.
• Describe the surveillance system to be evaluated.
• Focus the evaluation design.
• Gather credible evidence regarding the performance of the surveillance system.
• Justify and state conclusions and make recommendations.
• Ensure use of evaluation findings and share lessons learned.Using the guidelines, the surveil-
lance systems for one disease were taken into acount, the sampling was purposeful and the head of depart-ments were approached to obtain nec-essary information. Both the Afghan NTP and HMIS were evaluated by ap-plying these guidelines. We did a desk review before interviewing managers in both systems. The managers of other relevant departments were also inter-viewed. We did not use any statistical tests of significance; however, selected indices were used and calculated as described in the guidelines [5]. Ten attributes (usefulness, simplicity, flex-ibility, data quality, predictive value, sensitivity, timeliness, acceptability, representativeness and stability) were evaluated in both systems. Attributes were scored based on pre-defined
criteria and ranked as poor, average or good. The main documents of each system (strategic plan, guidelines, manuals, annual reports and data-bases) were reviewed and consulta-tion with stakeholders was carried out. In addition 5 key informants from each system were interviewed from among the directors, managers and officers. Furthermore 1 or 2 staff at departments of the MoPH (research, surveillance, preventive health, policy and planning and health care service delivery) were interviewed; they were selected based on their involvement in and relevance to the TB surveillance system.
Description of the TB surveillance systems
The Afghan NTP was established in 1954 with technical and financial sup-port from WHO. The NTP is a techni-cal department of the MoPH that leads and carries out prevention, detection, diagnosis and treatment of TB patients. Its vision is a TB-free country, with elimination of the disease as a public health problem by 2050 [6]. The major objectives of the programme are to reduce the risk of infection, morbid-ity and mortality due to TB by having 100% coverage of DOTS treatment by the end of year 2015 and ensuring the cure rate and detection rate of new sputum smear-positive pulmonary TB cases at over 85% and 70% respectively. There are 13 recording and reporting forms which are used by the surveil-lance department for data management. The programme claims that data are collected, analysed and disseminated quarterly in review meetings. Originat-ing from public health facilities, the data flows to the provinces and then to regions and finally to the NTP at the national level, where multiple national indicators are calculated and reported to the MoPH and WHO Regional Office for the Eastern Mediterranean.
Book 19-2.indb 201 2/21/2013 11:39:31 AM
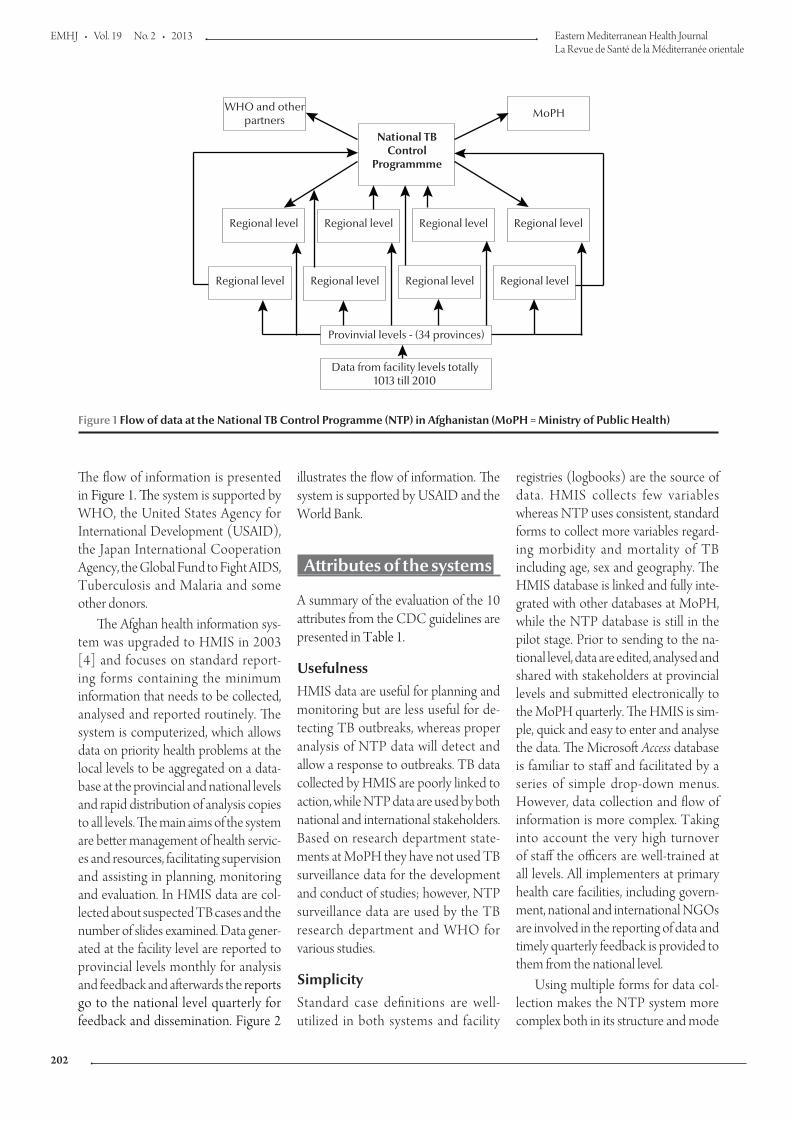
EMHJ • Vol. 19 No. 2 • 2013 Eastern Mediterranean Health JournalLa Revue de Santé de la Méditerranée orientale
202
illustrates the flow of information. The system is supported by USAID and the World Bank.
Attributes of the systems
A summary of the evaluation of the 10 attributes from the CDC guidelines are presented in Table 1.
UsefulnessHMIS data are useful for planning and monitoring but are less useful for de-tecting TB outbreaks, whereas proper analysis of NTP data will detect and allow a response to outbreaks. TB data collected by HMIS are poorly linked to action, while NTP data are used by both national and international stakeholders. Based on research department state-ments at MoPH they have not used TB surveillance data for the development and conduct of studies; however, NTP surveillance data are used by the TB research department and WHO for various studies.
SimplicityStandard case definitions are well-utilized in both systems and facility
registries (logbooks) are the source of data. HMIS collects few variables whereas NTP uses consistent, standard forms to collect more variables regard-ing morbidity and mortality of TB including age, sex and geography. The HMIS database is linked and fully inte-grated with other databases at MoPH, while the NTP database is still in the pilot stage. Prior to sending to the na-tional level, data are edited, analysed and shared with stakeholders at provincial levels and submitted electronically to the MoPH quarterly. The HMIS is sim-ple, quick and easy to enter and analyse the data. The Microsoft Access database is familiar to staff and facilitated by a series of simple drop-down menus. However, data collection and flow of information is more complex. Taking into account the very high turnover of staff the officers are well-trained at all levels. All implementers at primary health care facilities, including govern-ment, national and international NGOs are involved in the reporting of data and timely quarterly feedback is provided to them from the national level.
Using multiple forms for data col-lection makes the NTP system more complex both in its structure and mode
The flow of information is presented in Figure 1. The system is supported by WHO, the United States Agency for International Development (USAID), the Japan International Cooperation Agency, the Global Fund to Fight AIDS, Tuberculosis and Malaria and some other donors.
The Afghan health information sys-tem was upgraded to HMIS in 2003 [4] and focuses on standard report-ing forms containing the minimum information that needs to be collected, analysed and reported routinely. The system is computerized, which allows data on priority health problems at the local levels to be aggregated on a data-base at the provincial and national levels and rapid distribution of analysis copies to all levels. The main aims of the system are better management of health servic-es and resources, facilitating supervision and assisting in planning, monitoring and evaluation. In HMIS data are col-lected about suspected TB cases and the number of slides examined. Data gener-ated at the facility level are reported to provincial levels monthly for analysis and feedback and afterwards the reports go to the national level quarterly for feedback and dissemination. Figure 2
National TBControl
Programmme
WHO and otherpartners
MoPH
Regional level Regional level Regional level Regional level
Regional level Regional level Regional level Regional level
Provinvial levels - (34 provinces)
Data from facility levels totally 1013 till 2010
Figure 1 Flow of data at the National TB Control Programme (NTP) in Afghanistan (MoPH = Ministry of Public Health)
Book 19-2.indb 202 2/21/2013 11:39:31 AM
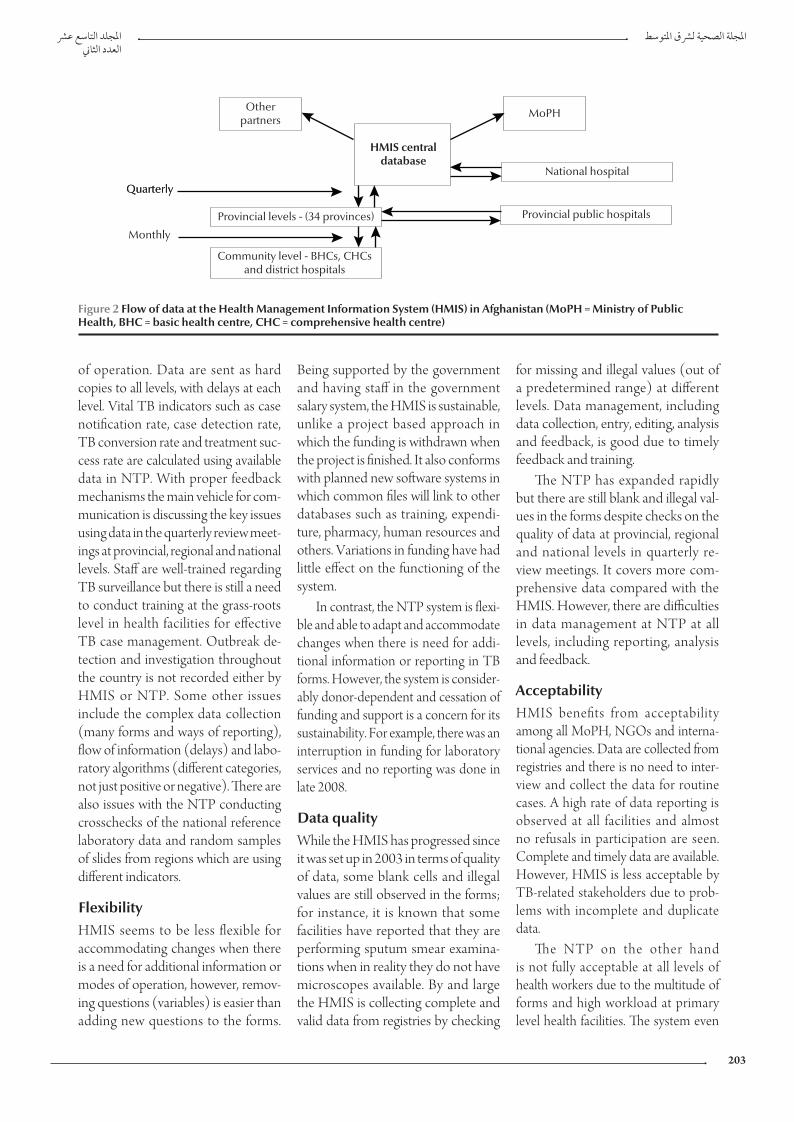
املجلد التاسع عرشاملجلة الصحية لرشق املتوسطالعدد الثاين
203
of operation. Data are sent as hard copies to all levels, with delays at each level. Vital TB indicators such as case notification rate, case detection rate, TB conversion rate and treatment suc-cess rate are calculated using available data in NTP. With proper feedback mechanisms the main vehicle for com-munication is discussing the key issues using data in the quarterly review meet-ings at provincial, regional and national levels. Staff are well-trained regarding TB surveillance but there is still a need to conduct training at the grass-roots level in health facilities for effective TB case management. Outbreak de-tection and investigation throughout the country is not recorded either by HMIS or NTP. Some other issues include the complex data collection (many forms and ways of reporting), flow of information (delays) and labo-ratory algorithms (different categories, not just positive or negative). There are also issues with the NTP conducting crosschecks of the national reference laboratory data and random samples of slides from regions which are using different indicators.
FlexibilityHMIS seems to be less flexible for accommodating changes when there is a need for additional information or modes of operation, however, remov-ing questions (variables) is easier than adding new questions to the forms.
Being supported by the government and having staff in the government salary system, the HMIS is sustainable, unlike a project based approach in which the funding is withdrawn when the project is finished. It also conforms with planned new software systems in which common files will link to other databases such as training, expendi-ture, pharmacy, human resources and others. Variations in funding have had little effect on the functioning of the system.
In contrast, the NTP system is flexi-ble and able to adapt and accommodate changes when there is need for addi-tional information or reporting in TB forms. However, the system is consider-ably donor-dependent and cessation of funding and support is a concern for its sustainability. For example, there was an interruption in funding for laboratory services and no reporting was done in late 2008.
Data qualityWhile the HMIS has progressed since it was set up in 2003 in terms of quality of data, some blank cells and illegal values are still observed in the forms; for instance, it is known that some facilities have reported that they are performing sputum smear examina-tions when in reality they do not have microscopes available. By and large the HMIS is collecting complete and valid data from registries by checking
for missing and illegal values (out of a predetermined range) at different levels. Data management, including data collection, entry, editing, analysis and feedback, is good due to timely feedback and training.
The NTP has expanded rapidly but there are still blank and illegal val-ues in the forms despite checks on the quality of data at provincial, regional and national levels in quarterly re-view meetings. It covers more com-prehensive data compared with the HMIS. However, there are difficulties in data management at NTP at all levels, including reporting, analysis and feedback.
AcceptabilityHMIS benefits from acceptability among all MoPH, NGOs and interna-tional agencies. Data are collected from registries and there is no need to inter-view and collect the data for routine cases. A high rate of data reporting is observed at all facilities and almost no refusals in participation are seen. Complete and timely data are available. However, HMIS is less acceptable by TB-related stakeholders due to prob-lems with incomplete and duplicate data.
The NTP on the other hand is not fully acceptable at all levels of health workers due to the multitude of forms and high workload at primary level health facilities. The system even
Otherpartners
MoPH
Provincial levels - (34 provinces)
Community level - BHCs, CHCs and district hospitals
HMIS centraldatabase
Quarterly
Monthly
Quarterly
National hospital
Provincial public hospitals
Figure 2 Flow of data at the Health Management Information System (HMIS) in Afghanistan (MoPH = Ministry of Public Health, BHC = basic health centre, CHC = comprehensive health centre)
Book 19-2.indb 203 2/21/2013 11:39:32 AM
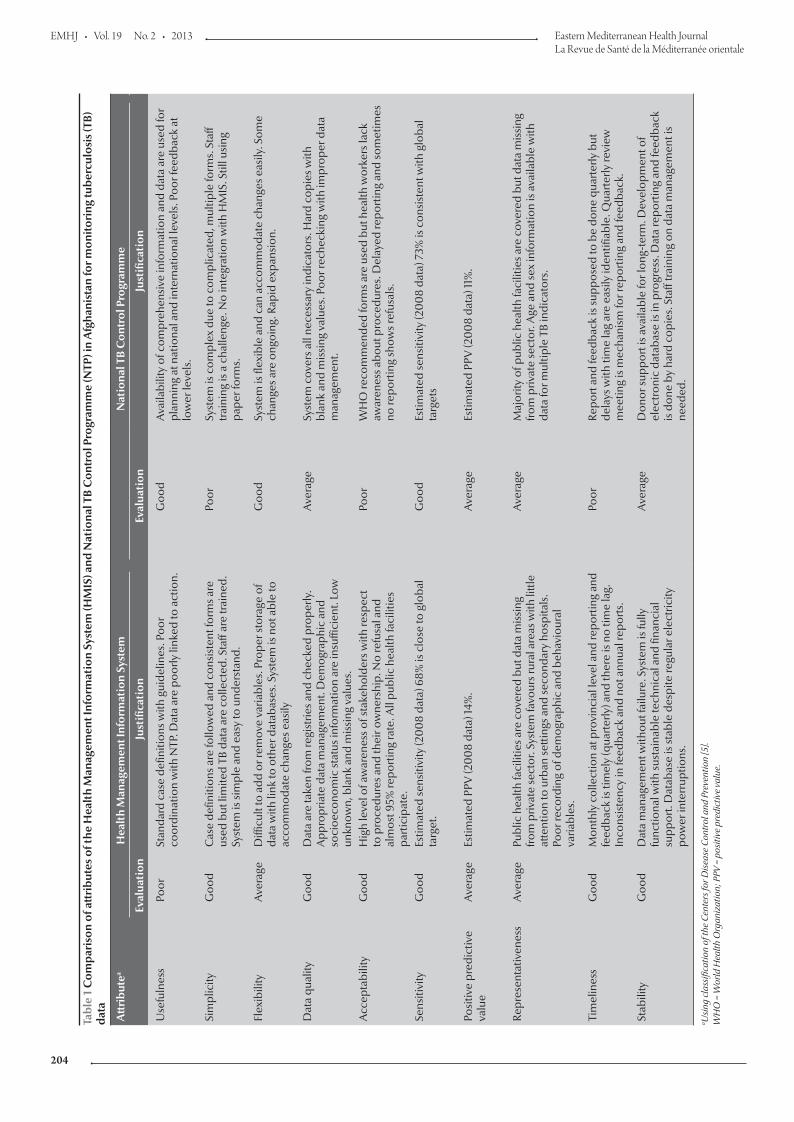
EMHJ • Vol. 19 No. 2 • 2013 Eastern Mediterranean Health JournalLa Revue de Santé de la Méditerranée orientale
204
Tabl
e 1
Com
pari
son
of a
ttri
bute
s of
the
Hea
lth
Man
agem
ent I
nfor
mat
ion
Syst
em (H
MIS
) and
Nat
iona
l TB
Con
trol
Pro
gram
me
(NTP
) in
Afg
hani
stan
for m
onito
ring
tube
rcul
osis
(TB)
da
ta
Att
ribu
tea
Hea
lth
Man
agem
ent I
nfor
mat
ion
Syst
em
Nat
iona
l TB
Con
trol
Pro
gram
me
Eval
uati
onJu
stifi
cati
onEv
alua
tion
Just
ifica
tion
Use
fuln
ess
Poor
Stan
dard
cas
e de
finiti
ons w
ith g
uide
lines
. Poo
r co
ordi
natio
n w
ith N
TP. D
ata
are
poor
ly li
nked
to a
ctio
n.G
ood
Ava
ilabi
lity
of c
ompr
ehen
sive
info
rmat
ion
and
data
are
use
d fo
r pl
anni
ng a
t nat
iona
l and
inte
rnat
iona
l lev
els.
Poo
r fee
dbac
k at
lo
wer
leve
ls.
Sim
plic
ityG
ood
Cas
e de
finiti
ons a
re fo
llow
ed a
nd c
onsi
sten
t for
ms a
re
used
but
lim
ited
TB d
ata
are
colle
cted
. Sta
ff ar
e tr
aine
d.
Syst
em is
sim
ple
and
easy
to u
nder
stan
d.
Poor
Syst
em is
com
plex
due
to c
ompl
icat
ed, m
ultip
le fo
rms.
Sta
ff tr
aini
ng is
a c
halle
nge.
No
inte
grat
ion
with
HM
IS. S
till u
sing
pa
per f
orm
s.
Flex
ibili
tyA
vera
geD
ifficu
lt to
add
or r
emov
e va
riabl
es. P
rope
r sto
rage
of
data
with
link
to o
ther
dat
abas
es. S
yste
m is
not
abl
e to
ac
com
mod
ate
chan
ges e
asily
Goo
dSy
stem
is fl
exib
le a
nd c
an a
ccom
mod
ate
chan
ges e
asily
. Som
e ch
ange
s are
ong
oing
. Rap
id e
xpan
sion
.
Dat
a qu
ality
Goo
dD
ata
are
take
n fro
m re
gist
ries a
nd c
heck
ed p
rope
rly.
App
ropr
iate
dat
a m
anag
emen
t. D
emog
raph
ic a
nd
soci
oeco
nom
ic st
atus
info
rmat
ion
are
insu
ffici
ent.
Low
un
know
n, b
lank
and
mis
sing
val
ues.
Ave
rage
Syst
em c
over
s all
nece
ssar
y in
dica
tors
. Har
d co
pies
with
bl
ank
and
mis
sing
val
ues.
Poo
r rec
heck
ing
with
impr
oper
dat
a m
anag
emen
t.
Acc
epta
bilit
yG
ood
Hig
h le
vel o
f aw
aren
ess o
f sta
keho
lder
s with
resp
ect
to p
roce
dure
s and
thei
r ow
ners
hip.
No
refu
sal a
nd
alm
ost 9
5% re
port
ing
rate
. All
publ
ic h
ealth
faci
litie
s pa
rtic
ipat
e.
Poor
WH
O re
com
men
ded
form
s are
use
d bu
t hea
lth w
orke
rs la
ck
awar
enes
s abo
ut p
roce
dure
s. D
elay
ed re
port
ing
and
som
etim
es
no re
port
ing
show
s ref
usal
s.
Sens
itivi
tyG
ood
Estim
ated
sens
itivi
ty (2
00
8 da
ta) 6
8% is
clo
se to
glo
bal
targ
et.
Goo
dEs
timat
ed se
nsiti
vity
(20
08
data
) 73%
is c
onsi
sten
t with
glo
bal
targ
ets
Posi
tive
pred
ictiv
e va
lue
Ave
rage
Estim
ated
PPV
(20
08
data
) 14%
.A
vera
geEs
timat
ed P
PV (2
00
8 da
ta) 1
1%.
Repr
esen
tativ
enes
sA
vera
gePu
blic
hea
lth fa
cilit
ies a
re c
over
ed b
ut d
ata
mis
sing
fro
m p
rivat
e se
ctor
. Sys
tem
favo
urs r
ural
are
as w
ith li
ttle
atte
ntio
n to
urb
an se
tting
s and
seco
ndar
y ho
spita
ls.
Poor
reco
rdin
g of
dem
ogra
phic
and
beh
avio
ural
va
riabl
es.
Ave
rage
Maj
ority
of p
ublic
hea
lth fa
cilit
ies a
re c
over
ed b
ut d
ata
mis
sing
fro
m p
rivat
e se
ctor
. Age
and
sex
info
rmat
ion
is a
vaila
ble
with
da
ta fo
r mul
tiple
TB
indi
cato
rs.
Tim
elin
ess
Goo
dM
onth
ly c
olle
ctio
n at
pro
vinc
ial l
evel
and
repo
rtin
g an
d fe
edba
ck is
tim
ely
(qua
rter
ly) a
nd th
ere
is n
o tim
e la
g.
Inco
nsis
tenc
y in
feed
back
and
not
ann
ual r
epor
ts.
Poor
Repo
rt a
nd fe
edba
ck is
supp
osed
to b
e do
ne q
uart
erly
but
de
lays
with
tim
e la
g ar
e ea
sily
iden
tifiab
le. Q
uart
erly
revi
ew
mee
ting
is m
echa
nism
for r
epor
ting
and
feed
back
.
Stab
ility
Goo
dD
ata
man
agem
ent w
ithou
t fai
lure
. Sys
tem
is fu
lly
func
tiona
l with
sust
aina
ble
tech
nica
l and
fina
ncia
l su
ppor
t. D
atab
ase
is st
able
des
pite
regu
lar e
lect
ricity
po
wer
inte
rrup
tions
.
Ave
rage
Don
or su
ppor
t is a
vaila
ble
for l
ong-
term
. Dev
elop
men
t of
elec
tron
ic d
atab
ase
is in
pro
gres
s. D
ata
repo
rtin
g an
d fe
edba
ck
is d
one
by h
ard
copi
es. S
taff
trai
ning
on
data
man
agem
ent i
s ne
eded
.
a Usi
ng c
lass
ifica
tion
of th
e Ce
nter
s for
Dis
ease
Con
trol
and
Pre
vent
ion
[5].
WH
O =
Wor
ld H
ealth
Org
aniz
atio
n; P
PV =
pos
itive
pre
dict
ive
valu
e.
Book 19-2.indb 204 2/21/2013 11:39:32 AM
املجلد التاسع عرشاملجلة الصحية لرشق املتوسطالعدد الثاين
205
lacks acceptability within the TB programme among those working at grass-roots levels, such as heads of health facilities. Additionally private sector acceptability is another issue. WHO, however, is more supportive of NTP and uses the data for its regional and global reports. A weak point is that quarterly data sent to the NTP for analysis are delayed and incomplete. On the other hand, quality control practices are good as laboratory slides are collected from facilities randomly for crosschecking.
Sensitivity of the surveillance systemWe defined sensitivity as the ability of the surveillance system to truly detect cases of TB in the country (sensitiv-ity = cases detected/cases existing × 100). No survey has been conducted to establish the exact burden of TB in Afghanistan and the system is using WHO estimates for case detection and other indicators.
HMIS dataBased on HMIS case definitions for TB the patient is recorded as suspect and he or she is sent for sputum examination, but the HMIS is not able to trace the contacts. The following is a calculation of the system sensitivity using data from the HMIS database for 2008:
Total TB suspected cases reported: 146 981
Total sputum smear-positive cases estimated: 17 885
Total TB sputum smear-positive cas-es detected: 12 229
Sensitivity (12 229/17 885) × 100 = 68%
NTP dataThe NTP system is collecting epide-miological and laboratory data from all facilities covered by DOTS. The contact tracing is another problem which is not done by the system and reduces its sensitivity. We calculated sensitivity just at the routine reporting level in 2008.
We can calculate sensitivity at the level of all TB cases or at the level of sputum smear-positive cases.
Total TB suspected cases (preva-lence): 40 000
Total TB suspected cases detected : 28 300
Sensitivity (first level) (28 300/40 000) × 100 = 71%
Using data from smear-positive cases shows almost the same sensitivity:
Total TB sputum smear-positive cas-es estimated: 17 885
Total TB sputum smear-positive cas-es detected: 13 136
S e n s i t i v i t y ( s e c o nd l e v e l ) (13 136/17 885) × 100 = 73%
Predictive value positive of the surveillance systemWe defined predictive value positive (PPV) as the proportion of acid-fast ba-cilli (AFB)-positive slides out all slides examined by laboratory facilities (PPV = true positives/all positives × 100).
HMIS dataAfter a review of data and interviews with HMIS staff at the central level in 2008 data at HMIS we calculated the PPV in 2 ways. First, it was based on the proportion of AFB slides that were posi-tive out of all slides examined for AFB:
Total AFB slides examined: 283 831
Total AFB slides positive: 28 951
PPV (28 951/282 831) × 100 = 10%Secondly, we can calculate the propor-tion of TB cases starting treatment (i.e. true positives) out of those identified as suspected TB:
Total TB cases suspected: 146 981
Total TB cases started treatment : 21 487
PPV (21 487/146 981) × 100 = 15%
NTP dataThere are possibilities of laboratory ex-amination for AFB at facilities but that is not possible to do culture except at the NTP reference laboratory in Kabul.
For each TB suspect a sputum sample is collected and 2 to 3 AFB slides are examined both for diagnosis and follow up. The following 2008 data from the NTP were identified:
Total AFB slides examined: 268 614
Total AFB slides positive: 30 447
PPV (30 447/268 614) ×100 = 11%
RepresentativenessHMIS covers public facilities includ-ing government and NGOs; however, 15% of the country is not covered by public health facilities and a consid-erable proportion of the population are utilizing the private sector, are not seeking medical care and/or are seeking care through other means. In addition the system is not collecting sufficient information about the demo-graphic and socioeconomic status of the population. It therefore cannot be said that the system is representative of the whole population. Nevertheless, HMIS covers fewer variables and is trying to cover the private sector and military health facilities as well in efforts towards improving the representative-ness of the data.
NTP has expanded its DOTS cov-erage exponentially and is now collect-ing data from 1013 facilities, which are almost 90% of Basic Package of Health Services facilities. The system is col-lecting sufficient information regarding age and sex of cases along with their residential areas. There are 2 sources of information: basic management units (facilities) and laboratory registries. Similar to the HMIS, the NTP misses data from private sector and military health facilities.
TimelinessTimeliness was quantified as delays more than 3 months. At the community level the amount of time it takes for cli-ents in the community to seek medical care is very difficult to determine. In HMIS data are taken from health facili-ties and sent to the provinces monthly.
Book 19-2.indb 205 2/21/2013 11:39:32 AM
EMHJ • Vol. 19 No. 2 • 2013 Eastern Mediterranean Health JournalLa Revue de Santé de la Méditerranée orientale
206
At the provincial level data are ana-lysed and shared with all stakeholders and after cleaning data are forwarded as soft copies to the national level at the end of each quarter without delays. More than 95% of facilities are sending their reports regularly. Col-lection and examination of sputum is also timely at facilities. Feedback is provided after the quarterly data col-lection from central HMIS to those facilities in which problems are identi-fied in analysis.
NTP is collecting information quarterly using laboratory and facility quarterly formats. It is also reporting treatment outcome and conversion of sputum-smear positive cases. How-ever, the quarterly reports are not sent on time from facilities to the provincial level or from the province to the regions or from the regions to the national level. Delay in reporting is therefore a concern. Furthermore, feedback is not provided timely and properly. All data are sent as hard cop-ies from the lower level to the central NTP, which is not acceptable in the current challenging conditions of Af-ghanistan. Timeliness therefore is a concern for the NTP.
StabilityThe HMIS is able to collect, manage and provide data properly without failure from all its facilities and its fully operational with its monthly report-ing at the provincial levels and quar-terly reporting at the central level. All stakeholders are entitled to receive the HMIS analysis folder for their own analysis of data including TB. The Microsoft Access database is simple and user-friendly, is well developed and few resources including human and non-human are required for its maintenance. It takes very little time to enter, edit, transfer, analyse, store and retrieve the data. Problems in extrac-tion of information do occur, however, due to occasional breakdown in the electricity power supply.
Due to delays in reporting of data timely information is not available within the NTP. Data are collected at health facilities and laboratory facilities in hard copies for each quarter and are entered into a Microsoft Excel as well as a new Access database. These databases are very simple for data entry and analysis and few resources are needed for maintenance of the database. Corruption of databases due to viruses is always a concern. The system needs to be made electronic at all levels particularly at provincial and regional levels.
Discussion
HMIS is a very good system which provides timely information through daily recording and monthly and quarterly reporting and feedback. NTP is collecting comprehensive in-formation but with delays in reporting and feedback. So timeliness, as a key surveillance system metric, is better in the HMIS than the TB surveillance system under the NTP. Unfortunately the information is only occasionally linked to action in HMIS while an-nual data is mostly used for planning at the national and international level at NTP. The HMIS system has a high de-gree of acceptability among stakehold-ers because it has been developed with the involvement and participation of various HMIS taskforces. The NTP surveillance system is less acceptable due to its complexity and multitude of forms.
HMIS is collecting fewer vari-ables regarding TB compared with the NTP. There is poor coordination or sharing of information between the 2 surveillance systems regarding TB and this causes duplication of effort, wastage of resources and in-complete information. Both systems are collecting data from all public health facilities and both are missing data from the private sector facilities
where many cases come and are managed.
Both systems have approximately equal sensitivity and PPVs. The low prevalence of smear-positive cases in the population has affected the PPV, lowering it to 10%. Both systems are able to show the seasonal and secu-lar trend of TB cases, which generate hypotheses and trigger research ques-tions.
Despite a review of the literature we could not find any similar evalu-ations for comparison, but some unpublished reports of public surveil-lance evaluations from the Field Epi-demiology and Laboratory Training Programme in Pakistan provide simi-lar results regarding TB surveillance systems.
The following points are recom-mended based on findings of this evaluation.
• Attention should be given to in-tegrate both systems in order to avoid duplication and to strengthen mechanisms for coordinating with related departments to use HMIS data for action.
• Taking the lesson learnt from ac-ceptability and sustainability of HMIS the surveillance system at NTP should search for mecha-nisms for improving its acceptability among health workers. There is a need to reconsider the variables in both the HMIS and NTP surveil-lance systems.
• The system should assess the reli-ability of data sources or triangulate the data with other data sources. Refresher training of health workers at the lower levels on guidelines and case definitions of TB will increase their skills and improve the quality of data reported.
• Better adherence to guidelines is needed in both of the systems in terms of collecting 3 samples to be sent to laboratories for confir-mation. NTP should collect infor-
Book 19-2.indb 206 2/21/2013 11:39:32 AM
املجلد التاسع عرشاملجلة الصحية لرشق املتوسطالعدد الثاين
207
mation on contacts and enhance contact tracing.
• Both systems should try to strengthen public–private partnerships and incor-porate private sector data into their systems in order to increase the utiliza-tion and representativeness of findings.
• The concept of timeliness and prompt reporting should be applied equally to both systems and for dissemina-tion of reports as well. The end users should receive the reports in hard and soft copies as soon as possible.
• Establishment and protection of data-bases from power outrages and com-puter viruses will improve the stability of the systems. Double entry of data will enhance the data quality and pre-vent missing and erroneous data. More efforts are needed to ensure the stabil-ity and sustainability of the systems.
• The general coordination, integra-tion, decentralization and expansion of activities need to be strengthened in order to avoid duplication and pro-vide information for action.
Acknowledgements
This study was supported by Field Epidemiology and Laboratory Pro-gramme, National Institute of Health, Islamabad, Pakistan. In addition the National TB Control Programme and Health Management Information System at Ministry of Public Health were supportive in the evaluation. I would like to thank all who were involved in this study in one way or another.
References
1. WHO report 2009. Global tuberculosis control: epidemiology, strategy, financing. Geneva, World Health Organization, 2009 (WHO/HTM/TB/2009.411).
2. Health Management Information System. Data analysis. Kabul, Afghanistan, Ministry of Public Health, 2009.
3. Basic Package of Health Services (BPHS). Kabul, Afghanistan, Ministry of Public Health, 2006.
4. National Health Management Information System procedures manual. Kabul, Afghanistan, Ministry of Public Health, 2006.
5. Updated guidelines for evaluating public health surveillance systems: recommendations from the guidelines working group. Morbidity and Mortality Weekly Report, 2001, 50 No. RR-3.
6. Annual report and statistics of tuberculosis in Afghanistan—2008. Afghanistan. Kabul, Afghanistan, National TB Control Program, Ministry of Public Health, 2008.
Book 19-2.indb 207 2/21/2013 11:39:32 AM

Subscriptions and Distribution Enquiries regarding subscriptions and distribution of the print edition of EMHJ should
be addressed to: Printing and Marketing of Publications at: email: [email protected]; tel: (+202) 2276 5000; fax: (+202) 2670 2492 or 2670 2494
Permissions Requests for permission to reproduce or translate articles, whether for sale or
non-commercial distribution should be addressed to EMHJ at: [email protected]
Correspondence
Editor-in-chiefEMHJ
WHO Regional Office for the Eastern MediterraneanP.O. Box 7608
Nasr City, Cairo 11371 Egypt
Tel: (+202) 2276 5000 Fax: (+202) 2670 2492/(+202) 2670 2494
Email: [email protected]
EASTERN MEDITERRANEAN HEALTH JOURNALIS the official health journal published by the Eastern Mediterranean Regional Office of the World Health Organization. It is a forum for the presentation and promotion of new policies and initiatives in health services; and for the exchange of ideas, con‑cepts, epidemiological data, research findings and other information, with special reference to the Eastern Mediterranean Region. It addresses all members of the health profession, medical and other health educational institutes, interested NGOs, WHO Col‑laborating Centres and individuals within and outside the Region.
LA REVUE DE SANTÉ DE LA MÉDITERRANÉE ORIENTALEEST une revue de santé officielle publiée par le Bureau régional de l’Organisation mondiale de la Santé pour la Méditerranée orientale. Elle offre une tribune pour la présentation et la promotion de nouvelles politiques et initiatives dans le domaine des ser‑vices de santé ainsi qu’à l’échange d’idées, de concepts, de données épidémiologiques, de résultats de recherches et d’autres informations, se rapportant plus particulièrement à la Région de la Méditerranée orientale. Elle s’adresse à tous les professionnels de la santé, aux membres des instituts médicaux et autres instituts de formation médico‑sanitaire, aux ONG, Centres collabora‑teurs de l’OMS et personnes concernés au sein et hors de la Région.
EMHJ is a trilingual, peer reviewed, open access journal and the full contents are freely available at its website: http://www/emro.who.int/emhj.htm
EMHJ is abstracted/indexed in the Index Medicus and MEDLINE (Medical Literature Analysis and Retrieval Systems on Line) and the ExtraMed‑Full text on CD‑ROM, the Cumulative Index to Nursing and Allied Health Literature (CINAHL), CAB International, Lexis Nexis, Scopus and the Index Medicus for the WHO Eastern Mediterranean Region (IMEMR).
©World Health Organization 2013 All rights reserved
Disclaimer The designations employed and the presentation of the material in this publication do not imply the expression of any opinion whatsoever on the part of the World Health Organization concerning the legal status of any country, territory, city or area or of its authorities, or concerning the delimitation of its frontiers or boundaries. Dotted lines on maps represent approximate border lines for which there may not yet be full agreement. The mention of specific companies or of certain manufacturers’ products does not imply that they are endorsed or recommended by the World Health Organization in preference to others of a similar nature that are not mentioned. All reasonable precautions have been taken by the World Health Organization to verify the information contained in this publication. However, the published material is being distributed without warranty of any kind, either express or implied. The responsibility for the interpretation and use of the material lies with the reader. In no event shall the World Health Organization be liable for damages arising from its use. The named authors alone are responsible for the views expressed in this publication.
ISSN 1020‑3397
Cover designed by Diana Tawadros Internal layout designed by Emad Marji and Diana Tawadros
Printed by WHO Regional Office for the Eastern Mediterranean
هى املجلة الرسمية التى تصدر عن املكتب اإلقليمى لرشق املتوسط بمنظمة الصحة العاملية. وهى منرب لتقديم الوبائية واملعطيات واملفاهيم اآلراء ولتبادل هلا، والرتويج الصحية اخلدمات اجلديدة ىف واملبادرات السياسات املتوسط. وهى موجهة إىل كل بإقليم رشق يتعلق منها ما املعلومات، وخاصة ونتائج األبحاث وغري ذلك من واملراكز املعنية، احلكومية املنظامت غري التعليمية، وكذا املعاهد الطبية وسائر والكليات الصحية، املهن أعضاء
املتعاونة مع منظمة الصحة العاملية واألفراد املهتمني بالصحة ىف اإلقليم وخارجه.
املجلة الصحية لرشق املتوسط
البلدان أعضاء اللجنة اإلقليمية ملنظمة الصحة العاملية لرشق املتوسط
األردن . أفغانستان . اإلمارات العربية املتحدة . باكستان . البحرين . تونس . ليبيا . مجهورية إيران اإلسالمية اجلمهورية العربية السورية . اليمن . جنوب السودان . جيبويت . السودان . الصومال . العراق . عامن . فلسطني . قطر . الكويت . لبنان . مرص
املغرب . اململكة العربية السعودية
Members of the WHO Regional Committee for the Eastern Mediterranean
Afghanistan . Bahrain . Djibouti . Egypt . Islamic Republic of Iran . Iraq . Jordan . Kuwait . Lebanon Libya . Morocco . Oman . Pakistan . Palestine . Qatar . Saudi Arabia . Somalia . South Sudan
Sudan . Syrian Arab Republic . Tunisia . United Arab Emirates . Yemen
Membres du Comité régional de l’OMS pour la Méditerranée orientale
Afghanistan . Arabie saoudite . Bahreïn . Djibouti . Égypte . Émirats arabes unis . République islamique d’Iran Iraq . Libye . Jordanie . Koweït . Liban . Maroc . Oman . Pakistan . Palestine . Qatar . République arabe syrienne
Somalie . Soudan . Soudan du Sud . Tunisie . Yémen
Cover 19-2.indd 2 2/25/2013 10:28:24 AM
Contents
Eastern MediterraneanHealth Journal
La Revue de Santé dela Méditerranée orientale
Volume 19 / No. 2February / Février 2013 املجلد التاسع عرش / عدد 2
شباط / فرباير
Volum
e 19 Num
ber 2 February 2013
Mothers and children in the Region Addressing the health of mothers and children is at the heart of the Millennium Development Goals (MDGs). With only 2 years to go to reach the targets set down in MDG 4 and 5, WHO, together with UNICEF AND UNFPA, recently held a high-level meeting to consider strategies to accelerate progress towards achieving MDGs 4 and 5 in all countries of the Region.
Acknowledgement of the work of Dr Mohammad Haytham Khayat ...........................................................................103
Editorial
Child mortality in the Eastern Mediterranean Region: challenges and opportunities ..........................................104
Research articles
Factors affecting defaulting from DOTS therapy under the national programme of tuberculosis control in Alexandria, Egypt ......................................................................................................................................107
Factors associated with patient delay in accessing pulmonary tuberculosis care, Gezira State, Sudan, 2009 .....114
Mycobacterium tuberculosis spoligotypes circulating in the Lebanese population: a retrospective study ........... 119
Health education and peer leaders’ role in improving low vaccination coverage in Akre district, Kurdistan region, Iraq ................................................................................................................................................ 125
High incidence of hepatitis B infection after treatment for paediatric cancer at a teaching hospital in Baghdad ...................................................................................................................................................130
Risk factors for human brucellosis in northern Jordan ............................................................................................ 135
Public awareness of and support for smoke-free legislation in Turkey: a national survey using the lot quality sampling technique ............................................................................................................................141
Blood lead level among Palestinian schoolchildren: a pilot study ..........................................................................151
Birth weight and risk of childhood acute leukaemia ...............................................................................................156
External cephalic version for breech presentation at term: predictors of success, and impact on the rate of caesarean section ....................................................................................................................................162
Depression among a group of elders in Alexandria, Egypt .....................................................................................167
Frequency of impaired glucose tolerance and diabetes mellitus in subjects with fasting blood glucose below 6.1 mmol/L (110 mg/dL) ................................................................................................................................. 175
Interleukins 12 and 13 levels among beta-thalassaemia major patients .................................................................. 181
Reviews
Médicaments et allaitement maternel : évaluation du risque médicamenteux chez le nourrisson ....................186
Diagnostic et évaluation de l’hépatite virale C chez l’hémodialysé .......................................................................192
Report
Evaluation of national tuberculosis surveillance system in Afghanistan ................................................................200
Cover 19-2.indd 1 2/20/2013 2:31:21 PM
hassaneinm
Typewritten Text
hassaneinm
Typewritten Text
hassaneinm
Typewritten Text
hassaneinm
Typewritten Text
e-ISSN 1687-1634 e-ISBN 9789290219293
hassaneinm
Typewritten Text
hassaneinm
Typewritten Text
hassaneinm
Typewritten Text
hassaneinm
Typewritten Text
Related Documents


