Eastern margin of the Ross Sea Rift in western Marie Byrd Land, Antarctica: Crustal structure and tectonic development Bruce P. Luyendyk Department of Geological Sciences and Institute for Crustal Studies, University of California, Santa Barbara, California 93106, USA ([email protected]) Douglas S. Wilson Department of Geological Sciences, Marine Science Institute, Institute for Crustal Studies, University of California, Santa Barbara, California 93106, USA Also at Marine Science Institute, University of California, Santa Barbara, California 93106, USA Christine S. Siddoway Department of Geology, Colorado College, Colorado Springs, Colorado 80903, USA [1] The basement rock and structures of the Ross Sea rift are exposed in coastal western Marie Byrd Land (wMBL), West Antarctica. Thinned, extended continental crust forms wMBL and the eastern Ross Sea continental shelf, where faults control the regional basin-and range-type topography at 20 km spacing. Onshore in the Ford Ranges and Rockefeller Mountains of wMBL, basement rocks consist of Early Paleozoic metagreywacke and migmatized equivalents, intruded by Devonian-Carboniferous and Cretaceous granitoids. Marine geophysical profiles suggest that these geological formations continue offshore to the west beneath the eastern Ross Sea, and are covered by glacial and glacial marine sediments. Airborne gravity and radar soundings over wMBL indicate a thicker crust and smoother basement inland to the north and east of the northern Ford Ranges. A migmatite complex near this transition, exhumed from mid crustal depths between 100 – 94 Ma, suggests a profound crustal discontinuity near the inboard limit of extended crust, 300 km northeast of the eastern Ross Sea margin. Near this limit, aeromagnetic mapping reveals an extensive region of high amplitude anomalies east of the Ford ranges that can be interpreted as a sub ice volcanic province. Modeling of gravity data suggests that extended crust in the eastern Ross Sea and wMBL is 8–9 km thinner than interior MBL (b = 1.35). Gravity modeling also outlines extensive regions of low-density (2300–2500 kg m 3 ) buried basement rock that is lighter than rock exposed at the surface. These regions are interpreted as bounded by throughgoing east-west faults with vertical separation. These buried low-density rocks are possibly a low-density facies of Early Paleozoic metagreywacke, or the low-density epizonal facies of Cretaceous granites, or felsic volcanic rocks known from moraines. These geophysical features and structures on land in the wMBL region preserve the record of middle and Late Cretaceous development of the Ross Sea rift. Thermochronology data from basement rocks and offshore stratigraphy suggest that the wMBL rift margin formed and most extension occurred in mid- and Late Cretaceous time, before seafloor spreading initiated between wMBL and the Campbell Plateau. The Cretaceous tectonic record in wMBL contrasts with the Transantarctic Mountains that form the western rift margin, where significant rift-flank relief developed in middle Tertiary time. Components: 11,444 words, 8 figures. Keywords: Ross Sea; Marie Byrd Land; Antarctica. G 3 G 3 Geochemistry Geophysics Geosystems Published by AGU and the Geochemical Society AN ELECTRONIC JOURNAL OF THE EARTH SCIENCES Geochemistry Geophysics Geosystems Characterization Volume 4, Number 10 29 October 2003 1090, doi:10.1029/2002GC000462 ISSN: 1525-2027 Copyright 2003 by the American Geophysical Union 1 of 25

Welcome message from author
This document is posted to help you gain knowledge. Please leave a comment to let me know what you think about it! Share it to your friends and learn new things together.
Transcript
Eastern margin of the RossSea Rift in western Marie ByrdLand, Antarctica: Crustal structure and tectonic development
Bruce P. LuyendykDepartment of Geological Sciences and Institute for Crustal Studies, University of California, Santa Barbara, California93106, USA ([email protected])
Douglas S. WilsonDepartment of Geological Sciences, Marine Science Institute, Institute for Crustal Studies, University of California,Santa Barbara, California 93106, USA
Also at Marine Science Institute, University of California, Santa Barbara, California 93106, USA
Christine S. SiddowayDepartment of Geology, Colorado College, Colorado Springs, Colorado 80903, USA
[1] The basement rock and structures of the Ross Sea rift are exposed in coastal western Marie Byrd Land
(wMBL), West Antarctica. Thinned, extended continental crust forms wMBL and the eastern Ross Sea
continental shelf, where faults control the regional basin-and range-type topography at �20 km spacing.
Onshore in the Ford Ranges and Rockefeller Mountains of wMBL, basement rocks consist of Early
Paleozoic metagreywacke and migmatized equivalents, intruded by Devonian-Carboniferous and
Cretaceous granitoids. Marine geophysical profiles suggest that these geological formations continue
offshore to the west beneath the eastern Ross Sea, and are covered by glacial and glacial marine sediments.
Airborne gravity and radar soundings over wMBL indicate a thicker crust and smoother basement inland to
the north and east of the northern Ford Ranges. A migmatite complex near this transition, exhumed from
mid crustal depths between 100–94 Ma, suggests a profound crustal discontinuity near the inboard limit of
extended crust, �300 km northeast of the eastern Ross Sea margin. Near this limit, aeromagnetic mapping
reveals an extensive region of high amplitude anomalies east of the Ford ranges that can be interpreted as a
sub ice volcanic province. Modeling of gravity data suggests that extended crust in the eastern Ross Sea
and wMBL is 8–9 km thinner than interior MBL (b = 1.35). Gravity modeling also outlines extensive
regions of low-density (2300–2500 kg m�3) buried basement rock that is lighter than rock exposed at the
surface. These regions are interpreted as bounded by throughgoing east-west faults with vertical separation.
These buried low-density rocks are possibly a low-density facies of Early Paleozoic metagreywacke, or the
low-density epizonal facies of Cretaceous granites, or felsic volcanic rocks known from moraines. These
geophysical features and structures on land in the wMBL region preserve the record of middle and Late
Cretaceous development of the Ross Sea rift. Thermochronology data from basement rocks and offshore
stratigraphy suggest that the wMBL rift margin formed and most extension occurred in mid- and Late
Cretaceous time, before seafloor spreading initiated between wMBL and the Campbell Plateau. The
Cretaceous tectonic record in wMBL contrasts with the Transantarctic Mountains that form the western rift
margin, where significant rift-flank relief developed in middle Tertiary time.
Components: 11,444 words, 8 figures.
Keywords: Ross Sea; Marie Byrd Land; Antarctica.
G3G3GeochemistryGeophysics
Geosystems
Published by AGU and the Geochemical Society
AN ELECTRONIC JOURNAL OF THE EARTH SCIENCES
GeochemistryGeophysics
Geosystems
Characterization
Volume 4, Number 10
29 October 2003
1090, doi:10.1029/2002GC000462
ISSN: 1525-2027
Copyright 2003 by the American Geophysical Union 1 of 25
Index Terms: 9310 Information Related to Geographic Region: Antarctica; 8109 Tectonophysics: Continental tectonics—
extensional (0905); 8105 Tectonophysics: Continental margins and sedimentary basins (1212).
Received 17 October 2002; Revised 24 April 2003; Accepted 15 August 2003; Published 29 October 2003.
Luyendyk, B. P., D. S. Wilson, and C. S. Siddoway, Eastern margin of the Ross Sea Rift in western Marie Byrd Land,
Antarctica: Crustal structure and tectonic development, Geochem. Geophys. Geosyst., 4(10), 1090,
doi:10.1029/2002GC000462, 2003.
1. Introduction
1.1. The Ross Sea Rift
[2] The Ross Sea Embayment, occupied by the
Ross Ice Shelf and the Ross Sea (Figure 1a),
defines part of the boundary zone between East
and West Antarctica. Its subsided crust constitutes
a major portion of the West Antarctic Rift system
[LeMasurier and Rex, 1990; Tessensohn and
Worner, 1991; Storey et al., 1999] an area of
extended lithosphere between the East Antarctic
craton and the microplates of Pacific West Antarc-
tica [Dalziel and Elliot, 1982]. Major tectonic
activity in the Ross Sea rift occurred in middle
(late Early to early Late) Cretaceous time [Davey
and Brancolini, 1995; Fitzgerald and Baldwin,
1997; Luyendyk et al., 2001] brought about by
the rifting of Gondwana. Activity in Cenozoic time
was focused in the western side of the rift [Cande
et al., 2000; Hamilton et al., 2001].
[3] The Ross Sea rift is bounded on the east by
western Marie Byrd Land (wMBL) and on the west
by the Transantarctic Mountains. Whereas bedrock
elevations in wMBL are rarely more than 1000 m,
the Transantarctic Mountains rise abruptly to
heights of 4000 m above the western Ross Sea.
This contrast is dramatic and indicates that the
Ross Sea rift is asymmetric in structure and tec-
tonic history. However, the actual architecture and
tectonic history of the eastern rift, and the question
whether the asymmetry developed in a single or
multiple events have been largely unknown until
recently. Deciphering the history and structural
framework for the eastern rift has been our goal in
a series of studies in wMBL over the past decade.
These studies have included geological mapping
[Luyendyk et al., 1992], thermochronology
[Richard et al., 1994], paleomagnetism [Luyendyk
et al., 1996], surface gravity [Luyendyk et al., 2003],
structural geology [Siddoway, 1999; Whitehead et
al., 1999], offshore marine geophysics [Luyendyk
et al., 2001], and most recently our airborne
geophysics [Wilson et al., 2000] that is covered in
detail here. Knowledge of wMBL evolution bears
on plate tectonic reconstructions for the southern
Pacific Ocean and New Zealand [Stock and Cande,
2002], Antarctic paleogeography, and boundary
conditions for the West Antarctic ice sheet [Dalziel
and Lawver, 2001].
1.2. Geology of Coastal Western MarieByrd Land
[4] Outcrops in coastal wMBL occur in the Rocke-
feller Mountains and scattered nunataks on Edward
VII Peninsula and in the Ford Ranges (Figures 1a,
1b, and 2a). Individual ranges reach elevations of
1000 m or more, are aligned E-W or NW-SE, and
are separated by glaciers 500 m to over 1000 m
thick. Rocks here comprise Early Paleozoic low-
grade greywacke and argillite of the Swanson
Formation, Devonian Ford Granodiorite, Creta-
ceous Byrd Coast Granite, Cretaceous mafic dikes,
and minor Neogene (Pleistocene) volcanic rocks,
primarily basalt [Bradshaw et al., 1983; Adams et
al., 1995; Pankhurst et al., 1998; Weaver et al.,
1991, 1994; Luyendyk et al., 1992; Wade et al.,
1977a, 1977b, 1977c, 1978]. Locally the
Byrd Coast Granite exhibits distinctive textures
suggestive of epizonal emplacement; namely, a
porphyritic phase with an aphanitic groundmass
(hypabyssal volcanic texture), smoky quartz crys-
tals with terminations and miarolitic pockets. The
mafic dikes throughout the Ford Ranges (Fosdick
Mountains excluded) have a regional trend of
N12W [Siddoway et al., 2003]. The Flood and
GeochemistryGeophysicsGeosystems G3G3
luyendyk et al.: eastern margin of the ross sea rift 10.1029/2002GC000462
2 of 25
Executive Committee Ranges farther east (Figure
1a) are Neogene and Quaternary volcanic centers
[LeMasurier and Rex, 1989; LeMasurier and Rex,
1990; Panter et al., 2000]. Silicic pyroclastic
volcanic rocks (rhyolite) are known from glacial
drift in the Fosdick Mountains [Cowdery and
Stone, 2001] and from erratics recovered by dredge
offshore but they do not crop out. One erratic has a40Ar/39Ar sanidine age of 930 ± 36 ka (R. P. Esser,
unpublished data report, New Mexico Geochro-
nology Research Lab, 2001).
[5] Migmatites form the Fosdick Mountains
(Figure 2a) of the northern Ford Ranges, where
cordierite-sillimanite-garnet assemblages record
metamorphic temperatures of �700�C and depths
of 16–20 km in the middle crust [Smith, 1992,
1997]. Peak metamorphism at 105 Ma [Richard et
al., 1994] was followed soon after by faulting,
tilting [Richard et al., 1994; Luyendyk et al., 1996],
and exhumation of the mid-crustal rocks between
100 and 94 Ma, based on middle Cretaceous40Ar/39Ar cooling ages [Richard et al., 1994].
Richard et al [1994] in summarizing their findings
from structural geology and thermochronology
conclude that the migmatites originated in an
extensional environment but the range lacks the
structures characteristic of a Cordilleran-type core
complex like those in the western North America.
Sub-vertical mafic dikes in the Fosdick Mountains
oriented N78E (mean; C. Siddoway observations)
record NNE stretching across the migmatite dome.
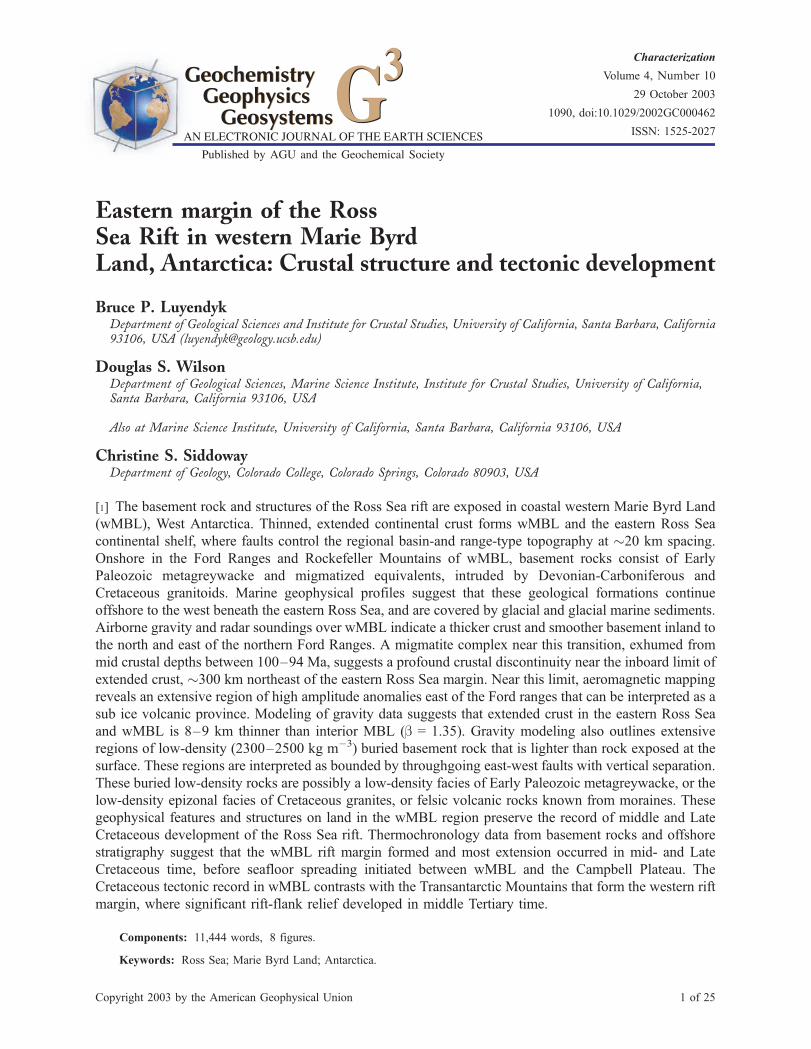
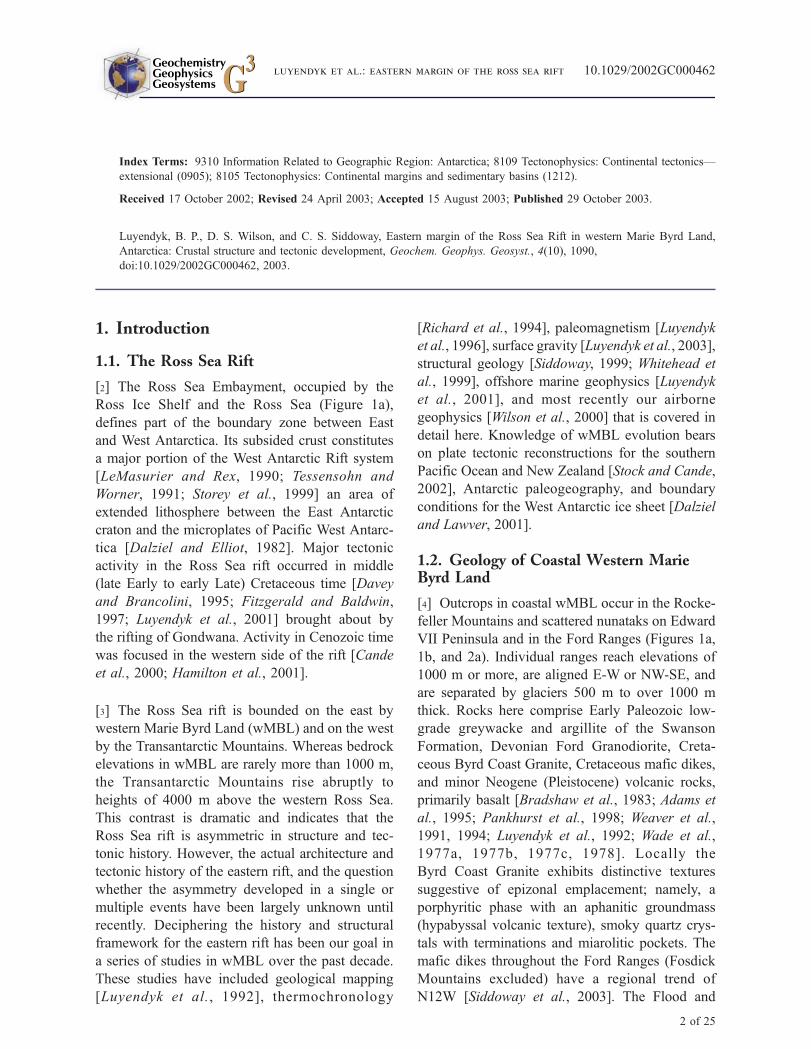
Figure 1. (a) Ross Sea region map (polar stereographic projection) showing Marie Byrd Land and the RossEmbayment (=Ross Sea plus Ross Ice Shelf), the location of our study area (Figures 1b, 2 and 4), and airbornegeophysical survey (heavy box), the airborne survey of Bell et al. (dashed box) [Bell et al., 1999], the aeromagneticsurvey of Ferraccioli et al. [2002] (GITARA), geophysical profile of Trey et al. [1999], outcrop onshore (darkshaded), Deep Sea Drilling Site 270, and the Transantarctic Mountains. AT, Adare Trough (dashed arrows indicateformer spreading directions; [Cande et al., 2000]. Major basins are outlined; VLB-TR, Victoria Land Basin includingthe Terror Rift; NB, Northern Basin; CET, Central Trough; EB, Eastern Basin; EDVII, Edward VII Peninsula; CT,Colbeck Trough; FRD, Ford Ranges; FLR, Flood Ranges; EXCOM, Executive Committee Range; RC, RuppertCoast. The West Antarctic and Ross Sea Rift system is outlined by the light shade [LeMasurier and Rex, 1990]increased in width here to include the Ford Ranges. We interpret the rift to be 1200 km wide across the RossEmbayment. (b) Elevations above sea level from our airborne radar soundings and DEM of Liu et al. [1999]. Boxoutlines location of our airborne geophysics survey. Dashed box is GITARA aeromagnetic survey of Ferraccioli et al.[2002]. Red outlines are grounding line (heavy) and ice shelf edge (orange light). Outcrops and ranges are shown inblack. Lambert conic projection. Contour interval 250 meters.
GeochemistryGeophysicsGeosystems G3G3
luyendyk et al.: eastern margin of the ross sea rift 10.1029/2002GC000462luyendyk et al.: eastern margin of the ross sea rift 10.1029/2002GC000462
3 of 25
[6] The Phillips Mountains, located immediately
north of the Fosdick Mountains (Figure 2a),
consist in part of Ford Granodiorite and Byrd
Coast Granite that show no evidence of dynamic
metamorphism. Cooling data suggest these
mountains were at a shallower crustal level than
the Fosdick range in Cretaceous time [Richard et
al., 1994]. This suggests a crustal boundary
between these two ranges and that the Phillips
Mountains form the hanging wall of a major
fault zone [Luyendyk et al., 1992; Richard et al.,
1994].
[7] Sparse gravity data imply that the region of the
Ford Ranges is underlain by thin crust [Bentley,
1973; Bentley, 1991; Behrendt et al., 1991a]. Prior
gravity studies show the densest crust to underlie the
FosdickMountain range [Beitzel, 1972; Luyendyk et
al., 2003], potentially a sign of mafic magmatism in
the lower crust [e.g., Smith, 1997].
2. Airborne Surveys
[8] During December 1998 through February
1999, the SOAR project (Support Office for Aero-
geophysical Research at the University of Texas,
Austin) flew an airborne geophysics survey of
western Marie Byrd Land (Figures 1a, 1b, and 2a)
collecting radar echo soundings to measure sur-
face elevation (Figure 1b) and ice thickness (Fig-
ure 2b), along with magnetics (Figure 2c) and
gravity (Figure 2d), over an area extending 470 km
(NE-SW) by 350 km (NW-SE). The survey in-
cluded most of Edward VII Peninsula and all of
the Ford Ranges. Track spacing over most of the
area was 5.3 or 10.6 km (Figure 2a). Bell et al.
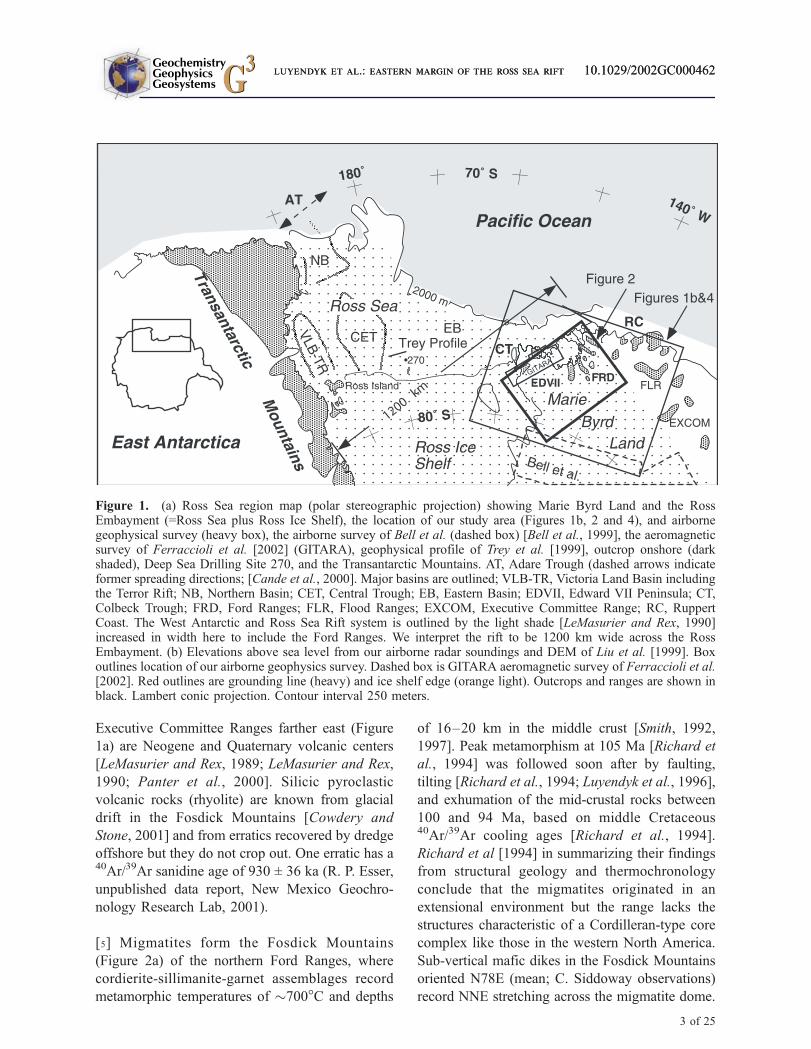
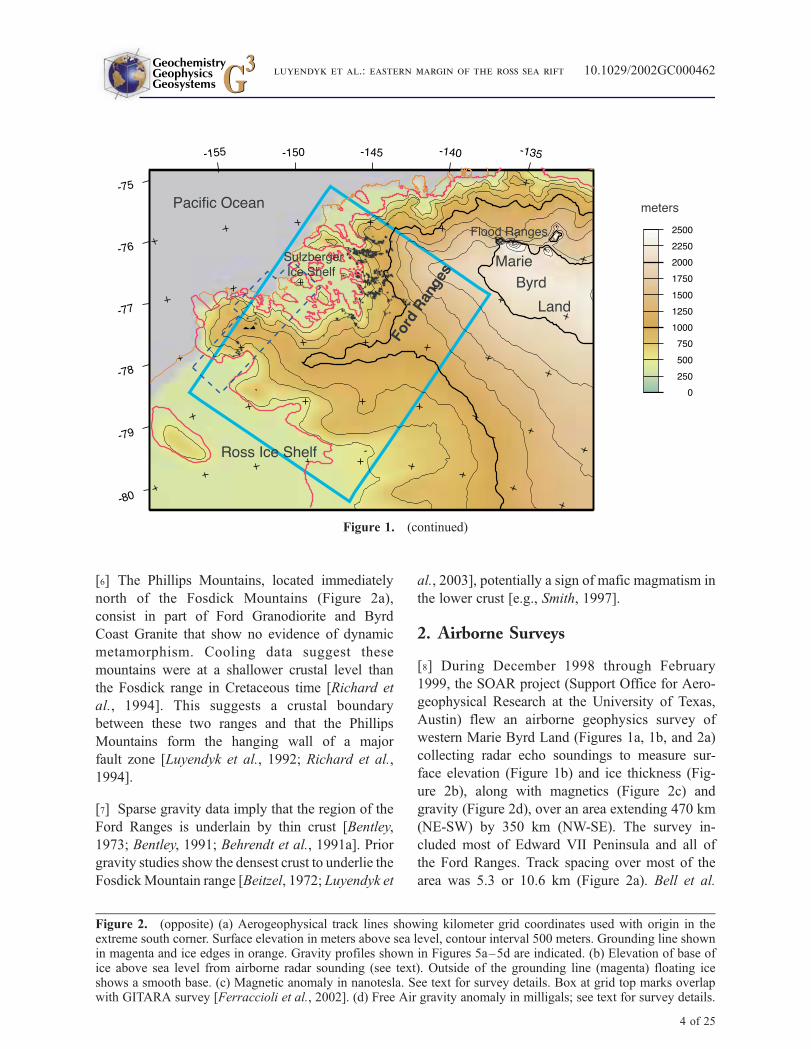
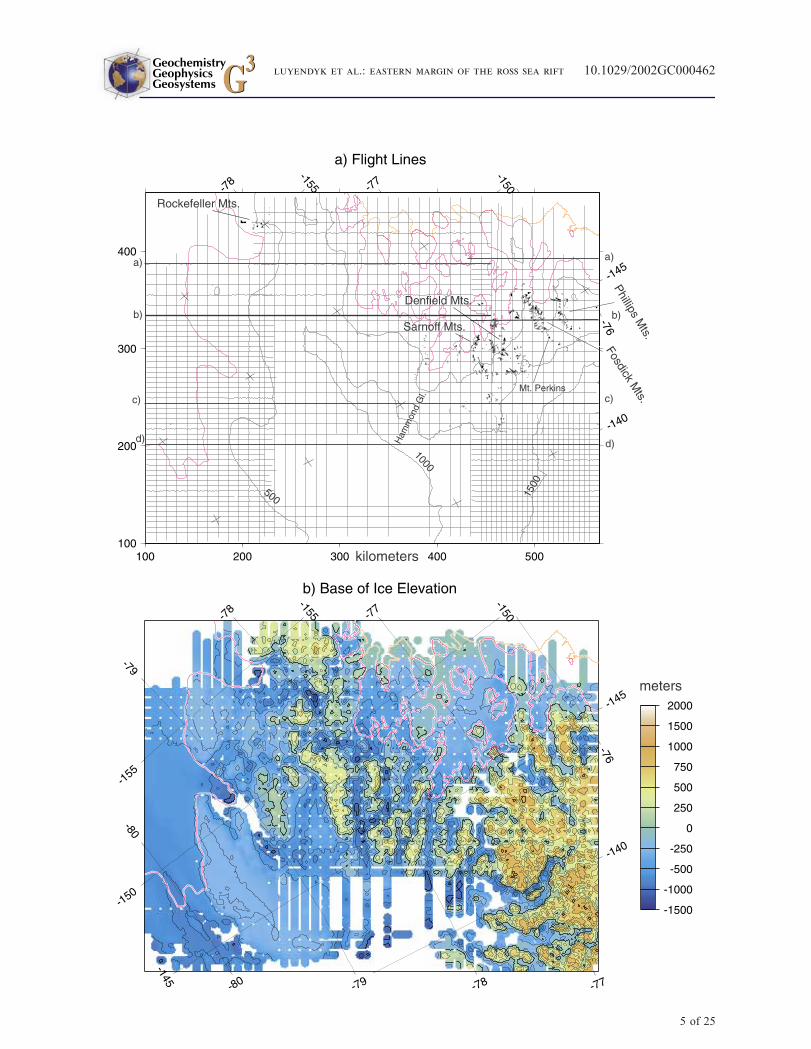
Figure 2. (opposite) (a) Aerogeophysical track lines showing kilometer grid coordinates used with origin in theextreme south corner. Surface elevation in meters above sea level, contour interval 500 meters. Grounding line shownin magenta and ice edges in orange. Gravity profiles shown in Figures 5a–5d are indicated. (b) Elevation of base ofice above sea level from airborne radar sounding (see text). Outside of the grounding line (magenta) floating iceshows a smooth base. (c) Magnetic anomaly in nanotesla. See text for survey details. Box at grid top marks overlapwith GITARA survey [Ferraccioli et al., 2002]. (d) Free Air gravity anomaly in milligals; see text for survey details.
Figure 1. (continued)
GeochemistryGeophysicsGeosystems G3G3
luyendyk et al.: eastern margin of the ross sea rift 10.1029/2002GC000462
4 of 25
GeochemistryGeophysicsGeosystems G3G3
luyendyk et al.: eastern margin of the ross sea rift 10.1029/2002GC000462
5 of 25
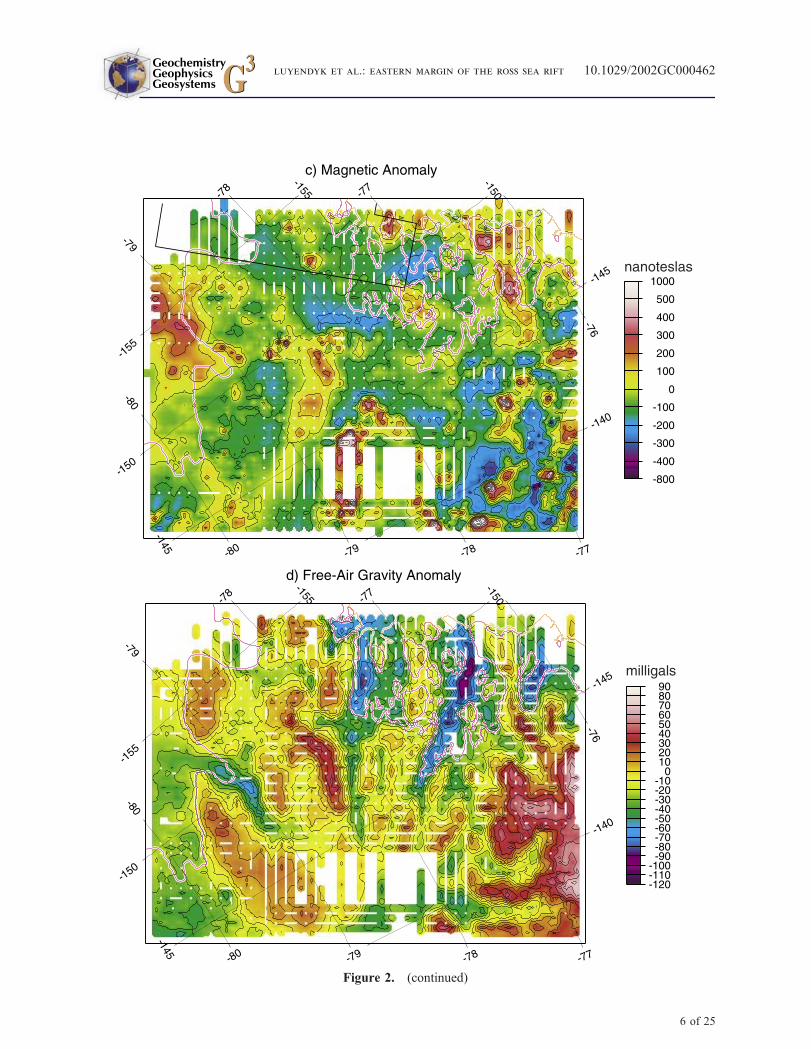
Figure 2. (continued)
GeochemistryGeophysicsGeosystems G3G3
luyendyk et al.: eastern margin of the ross sea rift 10.1029/2002GC000462
6 of 25
[1999] have described instrumentation of the
aircraft and data reduction procedures. Flight
elevation varied to maintain a minimum of 300 m
above local topography, and speed was about
130 knots (67 m/s).
2.1. Airborne Radar
[9] Radar echo soundings were averaged to an
interval of 4–5 pings per second prior to digitizing
topography and ice thickness. Ice thickness is
derived using a radar velocity of 168.4 m/ms,with an estimated correction of 10 m added for
faster velocity in firn. Quantitative analysis of the
airborne survey data is based on gridding the
observations at 1.06-km node spacing (1/5 or 1/10
of standard track spacing) with 441 � 341 nodes
total grid size.
[10] The ice surface rises gradually from just above
sea level to almost 2000 meters elevation at the
northeast side of the survey area (Figure 1b). The
bedrock surface we mapped from radar data also
rises toward the interior of wMBL from below sea
level under most of Edward VII Peninsula to 700–
1000 m (Figure 2b). Under the Ford Ranges the
bedrock topography is arranged in NW-SE and
E-W trending ranges and linear valleys occupied
by outlet glaciers. Relief is 1 km or more at a
spacing of 20 to 30 km (Figure 2b). A level bedrock
plateau at about 250 m meters below sea level
marks the boundary between wMBL and the Ross
Embayment (Figure 2b). This is interpreted as a
Late Tertiary wave-cut surface [Wilson et al., 2003].
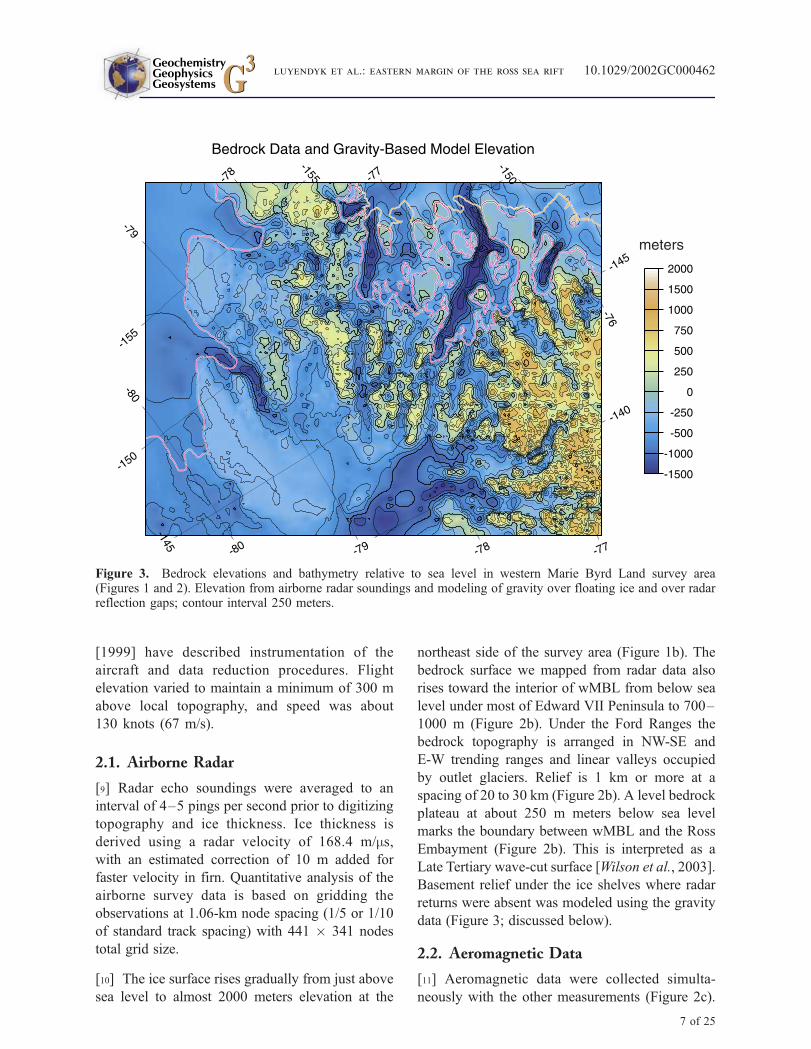
Basement relief under the ice shelves where radar
returns were absent was modeled using the gravity
data (Figure 3; discussed below).
2.2. Aeromagnetic Data
[11] Aeromagnetic data were collected simulta-
neously with the other measurements (Figure 2c).
Figure 3. Bedrock elevations and bathymetry relative to sea level in western Marie Byrd Land survey area(Figures 1 and 2). Elevation from airborne radar soundings and modeling of gravity over floating ice and over radarreflection gaps; contour interval 250 meters.
GeochemistryGeophysicsGeosystems G3G3
luyendyk et al.: eastern margin of the ross sea rift 10.1029/2002GC000462
7 of 25
GeochemistryGeophysicsGeosystems G3G3
luyendyk et al.: eastern margin of the ross sea rift 10.1029/2002GC000462
8 of 25
The data will be the subject of more in-depth
analysis in a subsequent paper. Instrumentation
was a Cesium-vapor magnetometer with a sample
rate of 1 second. Magnetic data were corrected for
diurnal variation measured at the aircraft base
camp and reduced to IGRF 1995. After crossover
correction, typical crossover error is about 15 nT.
[12] Our magnetic survey overlaps the northeast-
ern portion of the aeromagnetic survey completed
on the northern Edward VI Peninsula by
Ferraccioli et al. [2002]. Mapping reveals two
classes of anomalies (Figures 2c and 6 below).
One class is those anomalies of less than 500 nT
amplitude and wavelengths of 25 km or more
(low amplitude � low gradient). They are elon-
gate in map view. These are similar to anomalies
mapped by Ferraccioli et al. [2002] and are found
in the western half of the survey area. The other
class is shorter-wavelength anomalies of generally
higher amplitude (up to 900 nT) that are approx-
imately circular with diameters less than 20 km
(high amplitude - high gradient). These are gen-
erally located in the eastern half of the survey in
ice-covered regions (Figure 2c). The second class
is clearly caused primarily by highly magnetic
volcanic centers beneath the ice. Modeling by
Ferraccioli et al. [2002] demonstrated the likely
cause of the first type is basement magnetization
contrast between plutonic rocks. The high ampli-
tude anomalies are not likely due to plutonic
rocks because the magnetization strength of all
types of these rocks we collected is far too weak
to explain them (K < 0.001 (SI); M < 0.01 A/m).
We did measure magnetic properties of volcanic
rocks of Mount Perkins, a Pleistocene composite
cone in the eastern Fosdick Mountains (Figure 2a).
The magnetization strength of those rocks is
high (K ffi 0.01; M ffi 1.0 A/m) and consistent with
other common volcanic rocks. Therefore we infer
that the dozen or so high amplitude anomalies in the
eastern and northeastern part of the survey, east
of Mount Perkins (Figure 2a), locate a previously
unmapped volcanic province of unknown but
possibly young age now covered by the ice sheet.
2.3. Airborne Gravity Data
[13] Gravity readings need large corrections for
acceleration of the aircraft, and the data required
filtering to remove short-wavelength imperfections
in the corrections. The frequency domain filter
we used [Childers et al., 1999] passes angular
frequencies below 0.003 s�1 and cuts angular
frequencies above 0.006 s�1, cutting spatial wave-
lengths below about 10 km and passing above
about 20 km. After filtering, subjective editing is
required to remove remaining spikes that are often
correlated with the less-straight parts of the flight
lines. After crossover correction, typical (1-sigma)
crossover error is about 5 mgal. The gravity base
level was determined by crossover comparison
with five Ross Ice Shelf stations from Greischar
et al. [1992], Sulzberger Ice Shelf stations from
Luyendyk et al. [2003], and one unpublished
marine profile (NBP 94-02), in all cases at sites
where the gravity gradient is low enough that
filter effects for the airborne data are minor.
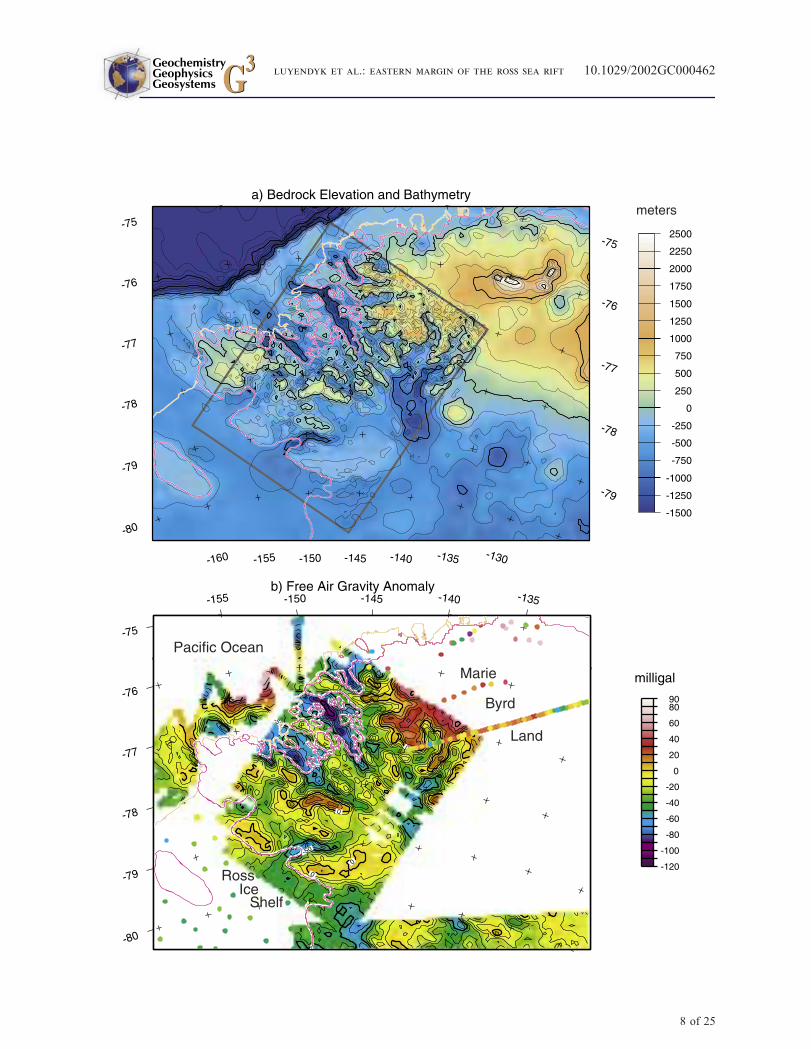
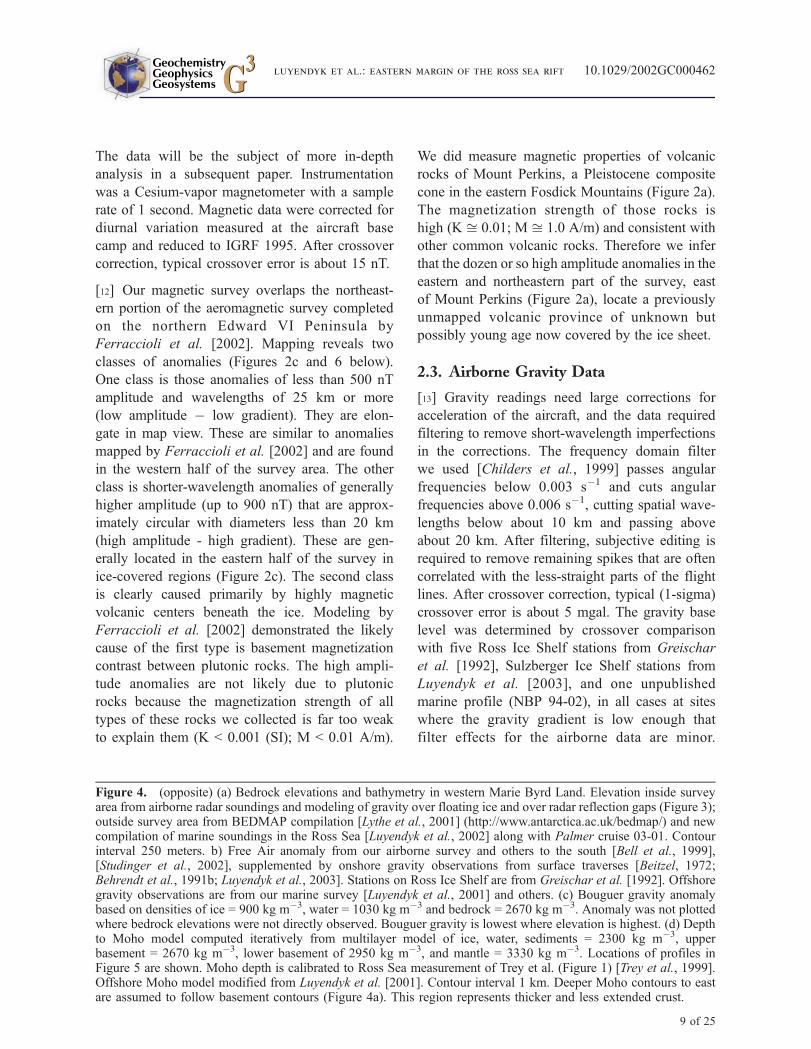
Figure 4. (opposite) (a) Bedrock elevations and bathymetry in western Marie Byrd Land. Elevation inside surveyarea from airborne radar soundings and modeling of gravity over floating ice and over radar reflection gaps (Figure 3);outside survey area from BEDMAP compilation [Lythe et al., 2001] (http://www.antarctica.ac.uk/bedmap/) and newcompilation of marine soundings in the Ross Sea [Luyendyk et al., 2002] along with Palmer cruise 03-01. Contourinterval 250 meters. b) Free Air anomaly from our airborne survey and others to the south [Bell et al., 1999],[Studinger et al., 2002], supplemented by onshore gravity observations from surface traverses [Beitzel, 1972;Behrendt et al., 1991b; Luyendyk et al., 2003]. Stations on Ross Ice Shelf are from Greischar et al. [1992]. Offshoregravity observations are from our marine survey [Luyendyk et al., 2001] and others. (c) Bouguer gravity anomalybased on densities of ice = 900 kg m�3, water = 1030 kg m�3 and bedrock = 2670 kg m�3. Anomaly was not plottedwhere bedrock elevations were not directly observed. Bouguer gravity is lowest where elevation is highest. (d) Depthto Moho model computed iteratively from multilayer model of ice, water, sediments = 2300 kg m�3, upperbasement = 2670 kg m�3, lower basement of 2950 kg m�3, and mantle = 3330 kg m�3. Locations of profiles inFigure 5 are shown. Moho depth is calibrated to Ross Sea measurement of Trey et al. (Figure 1) [Trey et al., 1999].Offshore Moho model modified from Luyendyk et al. [2001]. Contour interval 1 km. Deeper Moho contours to eastare assumed to follow basement contours (Figure 4a). This region represents thicker and less extended crust.
GeochemistryGeophysicsGeosystems G3G3
luyendyk et al.: eastern margin of the ross sea rift 10.1029/2002GC000462
9 of 25
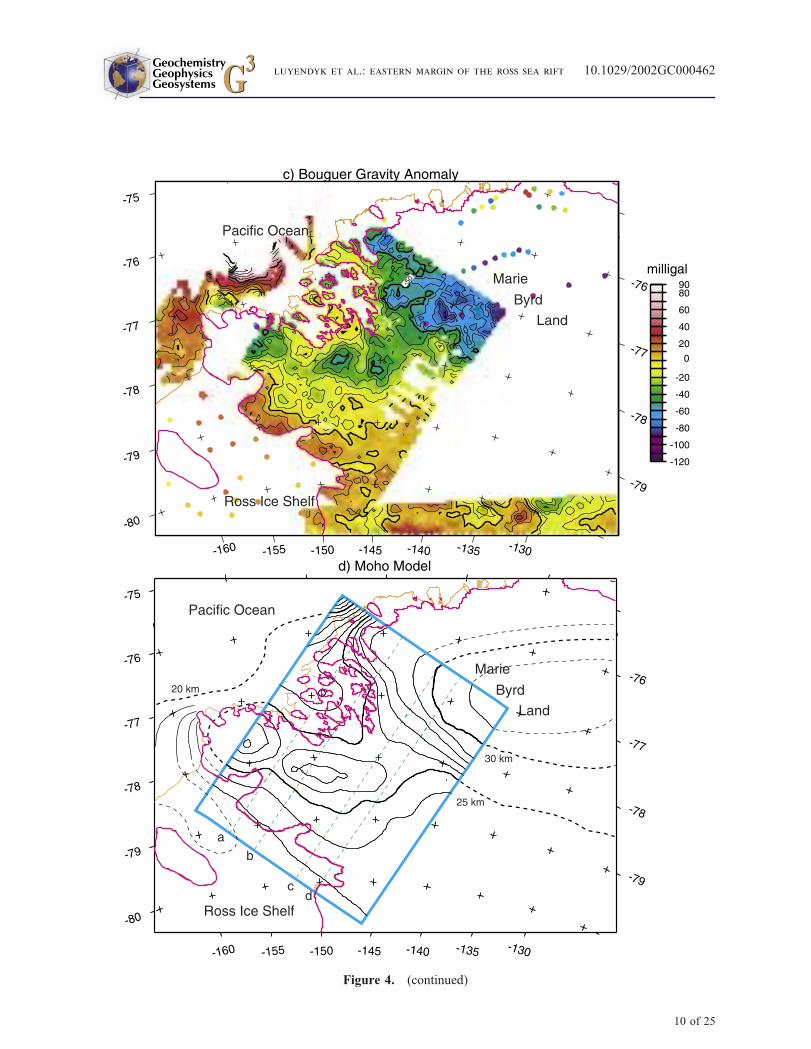
Figure 4. (continued)
GeochemistryGeophysicsGeosystems G3G3
luyendyk et al.: eastern margin of the ross sea rift 10.1029/2002GC000462
10 of 25

Elevations of surface and bed topography and of
the aircraft for the free-air gravity correction
have been adjusted from the original WGS84
reference frame to sea level using the EGM96
geoid [Lemoine et al., 1998].
[14] Free Air gravity rises to above 50 mgals
and Bouguer gravity falls to below �100 mgals
eastward from the Ford Ranges toward interior
wMBL (Figure 4). Iterative forward modeling
was performed using the gravity data to determine
crustal structure and Moho depth. We were able to
derive good estimates of several parameters that
strongly influence the gravity field, including bed
topography under floating ice (Figures 3 and 4a),
Moho topography (Figure 4d), and the distribution
of low-density bedrock and crust (Figures 5 and 6).
Gravity models were calculated in the frequency
domain using the technique of Parker [Parker,
1973] for interfaces such as air/ice and ice/base-
ment, on grids padded to 512 � 384 nodes.
Complete models are calculated adding the effects
of multiple interfaces, namely air/ice, ice/water,
water/bedrock, and Moho, with several interfaces
constrained to coincide where layers are missing,
for example at basement outcrops. Several inter-
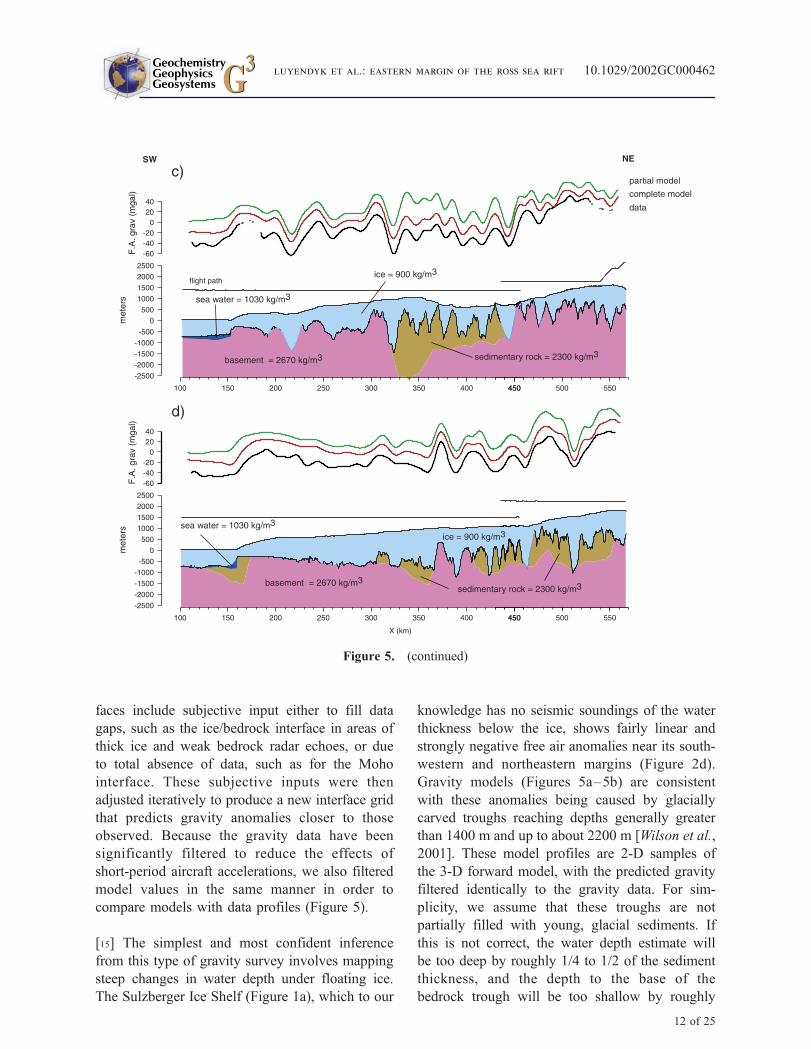
Figure 5. Free air anomaly data profiles (black lines) are compared with gravity predictions based on models withice, basement, and mantle layers (green lines), and with ice, water, sediment, basement and mantle layers (red lines).The predicted profiles have been offset upward for more convenient viewing. Cross sections show radar reflectiondata as black lines and layer types by color. Both the observed and predicted anomalies have been filtered to removewavelengths less than about 10 km. In several areas, adding water and sediment layers dramatically improves theagreement between model and data. Profile locations are shown in Figure 2a. Two observed profiles (offset of 5.3 km;Figure 2a) have been joined at their NE ends to form a single profile.
GeochemistryGeophysicsGeosystems G3G3
luyendyk et al.: eastern margin of the ross sea rift 10.1029/2002GC000462
11 of 25
faces include subjective input either to fill data
gaps, such as the ice/bedrock interface in areas of
thick ice and weak bedrock radar echoes, or due
to total absence of data, such as for the Moho
interface. These subjective inputs were then
adjusted iteratively to produce a new interface grid
that predicts gravity anomalies closer to those
observed. Because the gravity data have been
significantly filtered to reduce the effects of
short-period aircraft accelerations, we also filtered
model values in the same manner in order to
compare models with data profiles (Figure 5).
[15] The simplest and most confident inference
from this type of gravity survey involves mapping
steep changes in water depth under floating ice.
The Sulzberger Ice Shelf (Figure 1a), which to our
knowledge has no seismic soundings of the water
thickness below the ice, shows fairly linear and
strongly negative free air anomalies near its south-
western and northeastern margins (Figure 2d).
Gravity models (Figures 5a–5b) are consistent
with these anomalies being caused by glacially
carved troughs reaching depths generally greater
than 1400 m and up to about 2200 m [Wilson et al.,
2001]. These model profiles are 2-D samples of
the 3-D forward model, with the predicted gravity
filtered identically to the gravity data. For sim-
plicity, we assume that these troughs are not
partially filled with young, glacial sediments. If
this is not correct, the water depth estimate will
be too deep by roughly 1/4 to 1/2 of the sediment
thickness, and the depth to the base of the
bedrock trough will be too shallow by roughly
Figure 5. (continued)
GeochemistryGeophysicsGeosystems G3G3
luyendyk et al.: eastern margin of the ross sea rift 10.1029/2002GC000462
12 of 25
1/2 to 3/4 of the sediment thickness. Though
the inferred water depth is moderately uncertain,
the positions of the troughs (Figure 3) formerly
controlling glacial flow into Sulzberger Bay are
known with high confidence. The great depth of
the deeper trough to the northwest, downstream
from the Hammond Glacier (Figure 2a), supports
interpretations of nearly 1 km of ice removal from
the western Ford Ranges [e.g., Stone et al., 2003].
Ice thickness near the present value would not
be enough to keep ice grounded at the base of the
trough.
[16] Our basement model can be merged with the
BEDMAP project model (Figure 4a) [Lythe et al.,
2001] (http://www.antarctica.ac.uk/bedmap/). That
bedrock elevation model lacks the spatial resolu-
tion for wMBL that we show here in the coastal
regions. The model shows that the bedrock east of
our survey in the interior of wMBL is mostly at
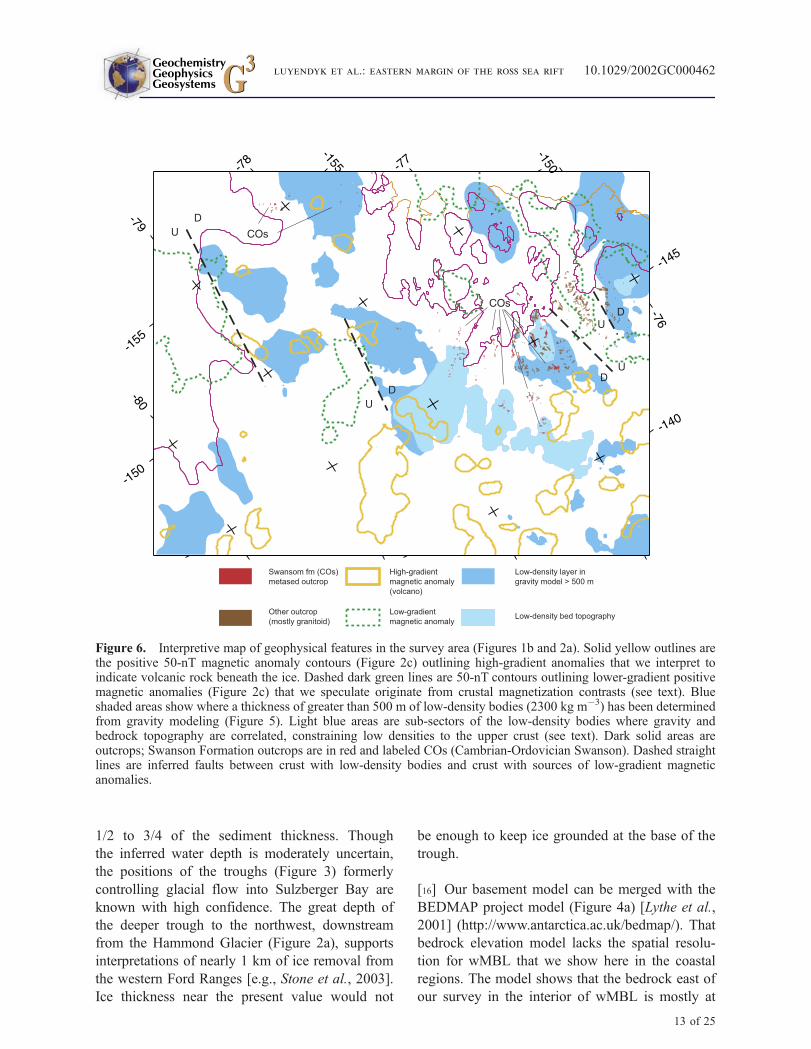
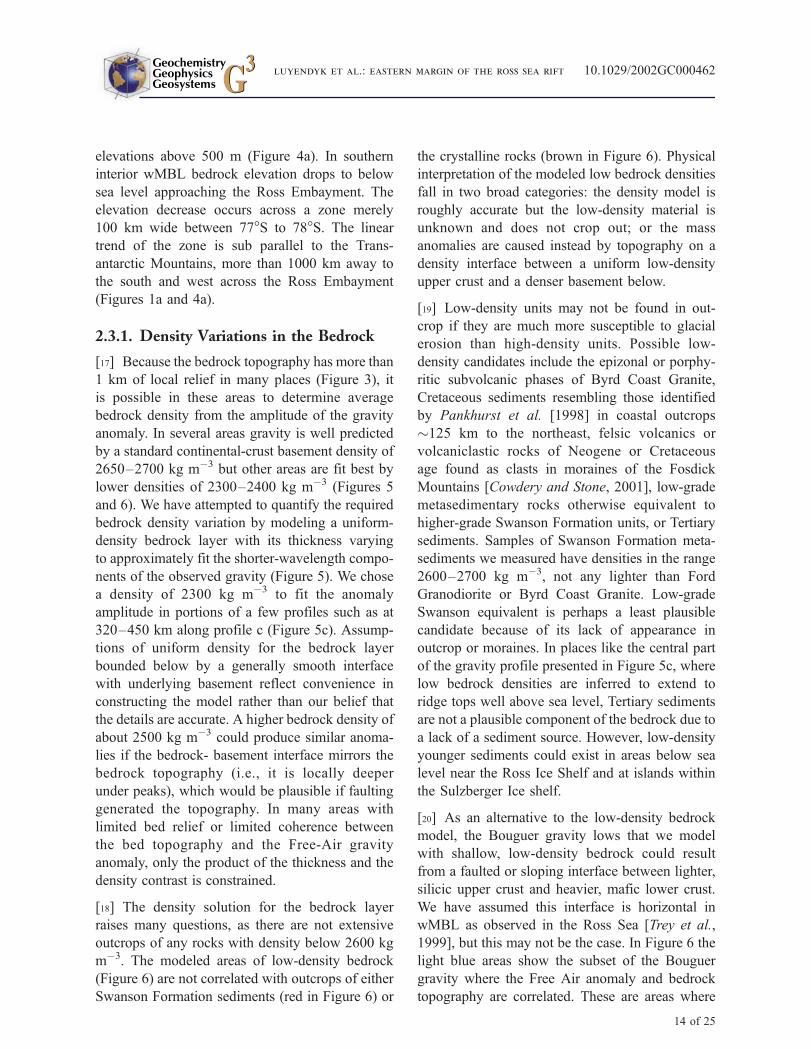
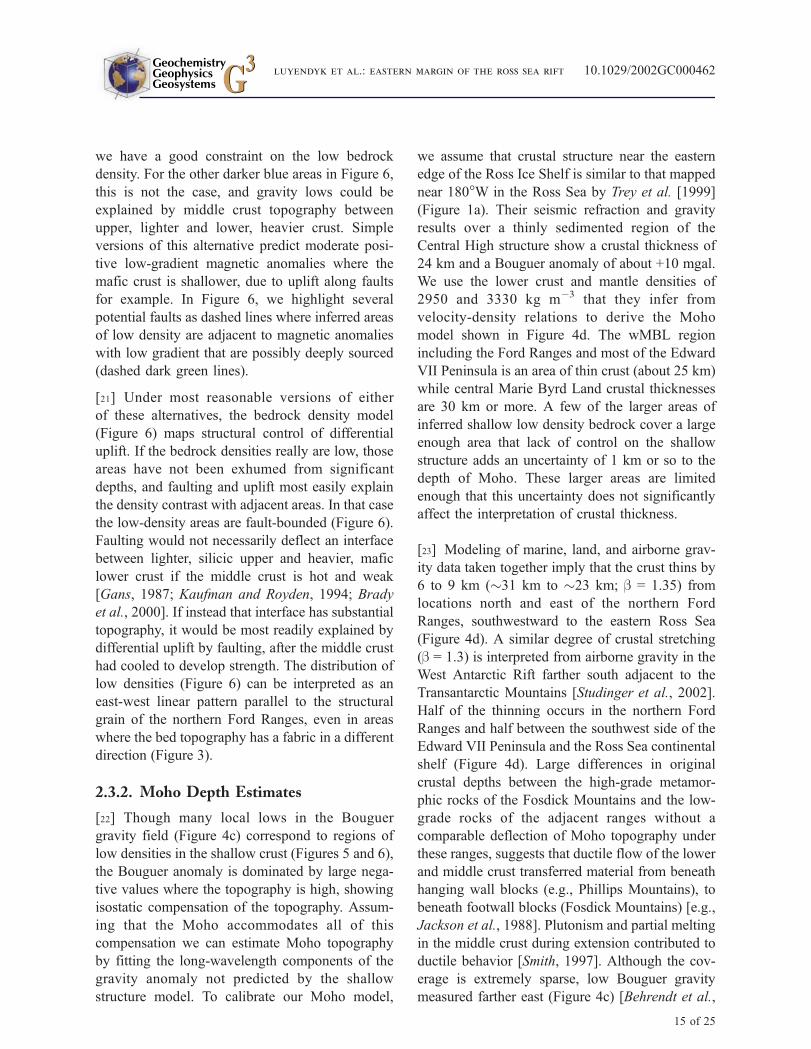
Figure 6. Interpretive map of geophysical features in the survey area (Figures 1b and 2a). Solid yellow outlines arethe positive 50-nT magnetic anomaly contours (Figure 2c) outlining high-gradient anomalies that we interpret toindicate volcanic rock beneath the ice. Dashed dark green lines are 50-nT contours outlining lower-gradient positivemagnetic anomalies (Figure 2c) that we speculate originate from crustal magnetization contrasts (see text). Blueshaded areas show where a thickness of greater than 500 m of low-density bodies (2300 kg m�3) has been determinedfrom gravity modeling (Figure 5). Light blue areas are sub-sectors of the low-density bodies where gravity andbedrock topography are correlated, constraining low densities to the upper crust (see text). Dark solid areas areoutcrops; Swanson Formation outcrops are in red and labeled COs (Cambrian-Ordovician Swanson). Dashed straightlines are inferred faults between crust with low-density bodies and crust with sources of low-gradient magneticanomalies.
GeochemistryGeophysicsGeosystems G3G3
luyendyk et al.: eastern margin of the ross sea rift 10.1029/2002GC000462
13 of 25
elevations above 500 m (Figure 4a). In southern
interior wMBL bedrock elevation drops to below
sea level approaching the Ross Embayment. The
elevation decrease occurs across a zone merely
100 km wide between 77�S to 78�S. The linear
trend of the zone is sub parallel to the Trans-
antarctic Mountains, more than 1000 km away to
the south and west across the Ross Embayment
(Figures 1a and 4a).
2.3.1. Density Variations in the Bedrock
[17] Because the bedrock topography has more than
1 km of local relief in many places (Figure 3), it
is possible in these areas to determine average
bedrock density from the amplitude of the gravity
anomaly. In several areas gravity is well predicted
by a standard continental-crust basement density of
2650–2700 kg m�3 but other areas are fit best by
lower densities of 2300–2400 kg m�3 (Figures 5
and 6). We have attempted to quantify the required
bedrock density variation by modeling a uniform-
density bedrock layer with its thickness varying
to approximately fit the shorter-wavelength compo-
nents of the observed gravity (Figure 5). We chose
a density of 2300 kg m�3 to fit the anomaly
amplitude in portions of a few profiles such as at
320–450 km along profile c (Figure 5c). Assump-
tions of uniform density for the bedrock layer
bounded below by a generally smooth interface
with underlying basement reflect convenience in
constructing the model rather than our belief that
the details are accurate. A higher bedrock density of
about 2500 kg m�3 could produce similar anoma-
lies if the bedrock- basement interface mirrors the
bedrock topography (i.e., it is locally deeper
under peaks), which would be plausible if faulting
generated the topography. In many areas with
limited bed relief or limited coherence between
the bed topography and the Free-Air gravity
anomaly, only the product of the thickness and the
density contrast is constrained.
[18] The density solution for the bedrock layer
raises many questions, as there are not extensive
outcrops of any rocks with density below 2600 kg
m�3. The modeled areas of low-density bedrock
(Figure 6) are not correlated with outcrops of either
Swanson Formation sediments (red in Figure 6) or
the crystalline rocks (brown in Figure 6). Physical
interpretation of the modeled low bedrock densities
fall in two broad categories: the density model is
roughly accurate but the low-density material is
unknown and does not crop out; or the mass
anomalies are caused instead by topography on a
density interface between a uniform low-density
upper crust and a denser basement below.
[19] Low-density units may not be found in out-
crop if they are much more susceptible to glacial
erosion than high-density units. Possible low-
density candidates include the epizonal or porphy-
ritic subvolcanic phases of Byrd Coast Granite,
Cretaceous sediments resembling those identified
by Pankhurst et al. [1998] in coastal outcrops
�125 km to the northeast, felsic volcanics or
volcaniclastic rocks of Neogene or Cretaceous
age found as clasts in moraines of the Fosdick
Mountains [Cowdery and Stone, 2001], low-grade
metasedimentary rocks otherwise equivalent to
higher-grade Swanson Formation units, or Tertiary
sediments. Samples of Swanson Formation meta-
sediments we measured have densities in the range
2600–2700 kg m�3, not any lighter than Ford
Granodiorite or Byrd Coast Granite. Low-grade
Swanson equivalent is perhaps a least plausible
candidate because of its lack of appearance in
outcrop or moraines. In places like the central part
of the gravity profile presented in Figure 5c, where
low bedrock densities are inferred to extend to
ridge tops well above sea level, Tertiary sediments
are not a plausible component of the bedrock due to
a lack of a sediment source. However, low-density
younger sediments could exist in areas below sea
level near the Ross Ice Shelf and at islands within
the Sulzberger Ice shelf.
[20] As an alternative to the low-density bedrock
model, the Bouguer gravity lows that we model
with shallow, low-density bedrock could result
from a faulted or sloping interface between lighter,
silicic upper crust and heavier, mafic lower crust.
We have assumed this interface is horizontal in
wMBL as observed in the Ross Sea [Trey et al.,
1999], but this may not be the case. In Figure 6 the
light blue areas show the subset of the Bouguer
gravity where the Free Air anomaly and bedrock
topography are correlated. These are areas where
GeochemistryGeophysicsGeosystems G3G3
luyendyk et al.: eastern margin of the ross sea rift 10.1029/2002GC000462
14 of 25
we have a good constraint on the low bedrock
density. For the other darker blue areas in Figure 6,
this is not the case, and gravity lows could be
explained by middle crust topography between
upper, lighter and lower, heavier crust. Simple
versions of this alternative predict moderate posi-
tive low-gradient magnetic anomalies where the
mafic crust is shallower, due to uplift along faults
for example. In Figure 6, we highlight several
potential faults as dashed lines where inferred areas
of low density are adjacent to magnetic anomalies
with low gradient that are possibly deeply sourced
(dashed dark green lines).
[21] Under most reasonable versions of either
of these alternatives, the bedrock density model
(Figure 6) maps structural control of differential
uplift. If the bedrock densities really are low, those
areas have not been exhumed from significant
depths, and faulting and uplift most easily explain
the density contrast with adjacent areas. In that case
the low-density areas are fault-bounded (Figure 6).
Faulting would not necessarily deflect an interface
between lighter, silicic upper and heavier, mafic
lower crust if the middle crust is hot and weak
[Gans, 1987; Kaufman and Royden, 1994; Brady
et al., 2000]. If instead that interface has substantial
topography, it would be most readily explained by
differential uplift by faulting, after the middle crust
had cooled to develop strength. The distribution of
low densities (Figure 6) can be interpreted as an
east-west linear pattern parallel to the structural
grain of the northern Ford Ranges, even in areas
where the bed topography has a fabric in a different
direction (Figure 3).
2.3.2. Moho Depth Estimates
[22] Though many local lows in the Bouguer
gravity field (Figure 4c) correspond to regions of
low densities in the shallow crust (Figures 5 and 6),
the Bouguer anomaly is dominated by large nega-
tive values where the topography is high, showing
isostatic compensation of the topography. Assum-
ing that the Moho accommodates all of this
compensation we can estimate Moho topography
by fitting the long-wavelength components of the
gravity anomaly not predicted by the shallow
structure model. To calibrate our Moho model,
we assume that crustal structure near the eastern
edge of the Ross Ice Shelf is similar to that mapped
near 180�W in the Ross Sea by Trey et al. [1999]
(Figure 1a). Their seismic refraction and gravity
results over a thinly sedimented region of the
Central High structure show a crustal thickness of
24 km and a Bouguer anomaly of about +10 mgal.
We use the lower crust and mantle densities of
2950 and 3330 kg m�3 that they infer from
velocity-density relations to derive the Moho
model shown in Figure 4d. The wMBL region
including the Ford Ranges and most of the Edward
VII Peninsula is an area of thin crust (about 25 km)
while central Marie Byrd Land crustal thicknesses
are 30 km or more. A few of the larger areas of
inferred shallow low density bedrock cover a large
enough area that lack of control on the shallow
structure adds an uncertainty of 1 km or so to the
depth of Moho. These larger areas are limited
enough that this uncertainty does not significantly
affect the interpretation of crustal thickness.
[23] Modeling of marine, land, and airborne grav-
ity data taken together imply that the crust thins by
6 to 9 km (�31 km to �23 km; b = 1.35) from
locations north and east of the northern Ford
Ranges, southwestward to the eastern Ross Sea
(Figure 4d). A similar degree of crustal stretching
(b = 1.3) is interpreted from airborne gravity in the
West Antarctic Rift farther south adjacent to the
Transantarctic Mountains [Studinger et al., 2002].
Half of the thinning occurs in the northern Ford
Ranges and half between the southwest side of the
Edward VII Peninsula and the Ross Sea continental
shelf (Figure 4d). Large differences in original
crustal depths between the high-grade metamor-
phic rocks of the Fosdick Mountains and the low-
grade rocks of the adjacent ranges without a
comparable deflection of Moho topography under
these ranges, suggests that ductile flow of the lower
and middle crust transferred material from beneath
hanging wall blocks (e.g., Phillips Mountains), to
beneath footwall blocks (Fosdick Mountains) [e.g.,
Jackson et al., 1988]. Plutonism and partial melting
in the middle crust during extension contributed to
ductile behavior [Smith, 1997]. Although the cov-
erage is extremely sparse, low Bouguer gravity
measured farther east (Figure 4c) [Behrendt et al.,
GeochemistryGeophysicsGeosystems G3G3
luyendyk et al.: eastern margin of the ross sea rift 10.1029/2002GC000462
15 of 25
1991a] supports our interpretation of thicker crust
toward the interior of wMBL.
3. On Ground Observations
3.1. Brittle Structures of the Ford Ranges
[24] Glacier ice conceals major faults in the region;
however, structural studies of brittle faults and
shear fractures in outcrop offer a means to over-
come this problem in Antarctica [e.g., Wilson,
1995]. Geometrical and kinematic data were col-
lected throughout the Ford Ranges in 1998 and
1999, with the majority of observations collected
within isotropic plutonic rocks of the Ford Grano-
diorite and Byrd Coast Granite. Sub-vertical mafic
dikes intruding the granitoids have a regionally
GeochemistryGeophysicsGeosystems G3G3
luyendyk et al.: eastern margin of the ross sea rift 10.1029/2002GC000462
16 of 25
consistent orientation of N12W (n = 81 dikes
[Siddoway et al., 2003]). Margins of undeformed
dikes sometimes exhibit slickensides, a sign that
dikes intruded faults. Elsewhere dikes are cut
by high angle faults. The mutually crosscutting
relationship suggests that the dikes and faults are
contemporaneous.
[25] In the Ford Ranges, minor faults are identified
as zones of cataclasis or gouge exceeding 15 cm
thickness and/or striated planes accommodating
>2 m offset. Shear fractures are distinguished as
discrete slickenside surfaces restricted to a single
plane, generally lacking gouge, with no truncated
marker to allow quantification of offset across the
striated surface. Few data come from faults and
shear surfaces within Swanson Formation, because
brittle shear planes typically reactivated preexisting
cleavage and slaty partings formed during early
Paleozoic orogeny [Bradshaw et al., 1983], making
the kinematic significance uncertain. The cleavage
in the Swanson Formation is related to an early
Paleozoic folding event [Bradshaw et al., 1983;
Pankhurst et al., 1998].
3.2. Fault Array, Shear Fracture Arrays,and Kinematic Analysis
[26] Three dominant populations of faults and
shear fractures exist in the Ford Ranges based
on differing structural attitude and offset sense.
These populations are oriented �ESE-WNW
(Figures 7a and 7b); NNW-SSE (Figures 7a and 7c)
and NE-SW (Figure 7d), with moderately steep
dips. North-northwest and northeast-striking struc-
tures typically cut ESE-oriented structures, so the
ESE-WNW population is interpreted to be the
oldest set of brittle structures. Kinematic criteria
associated with slickensides show down-dip
normal slip, strike slip and normal oblique slip
[Siddoway, 1999]. Some faults developed two sets
of striae. These exhibit well-developed down-dip
striae overprinted by delicate strike- to oblique-
slip striae.
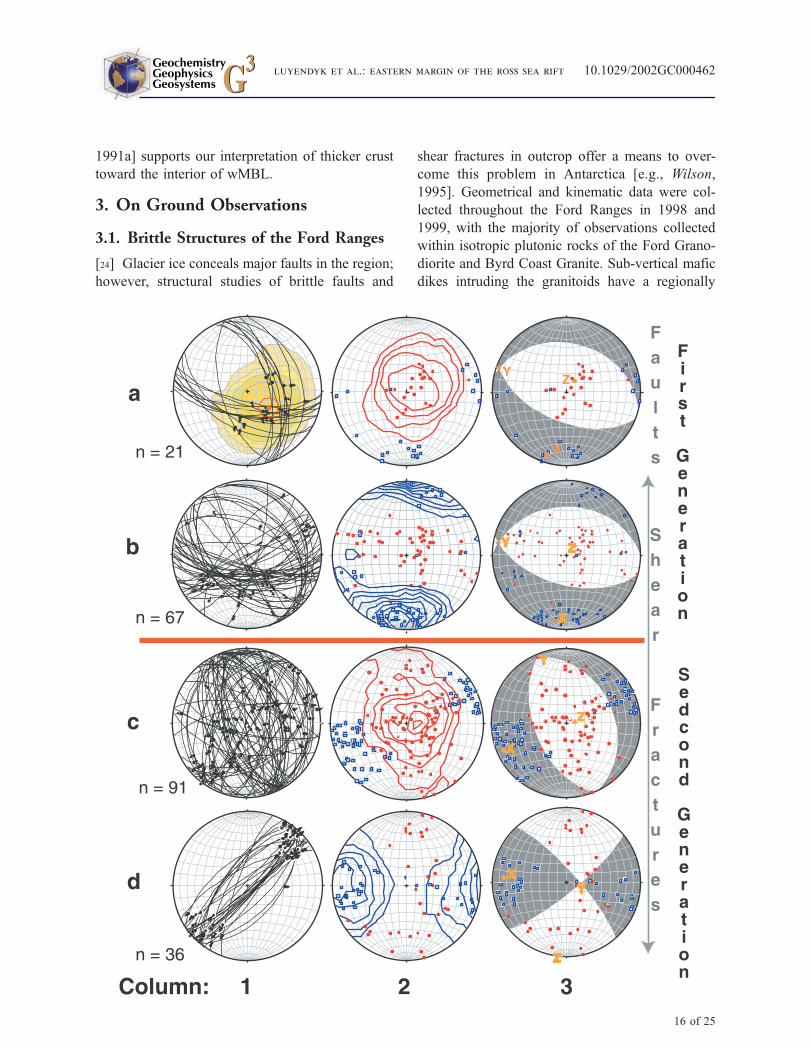
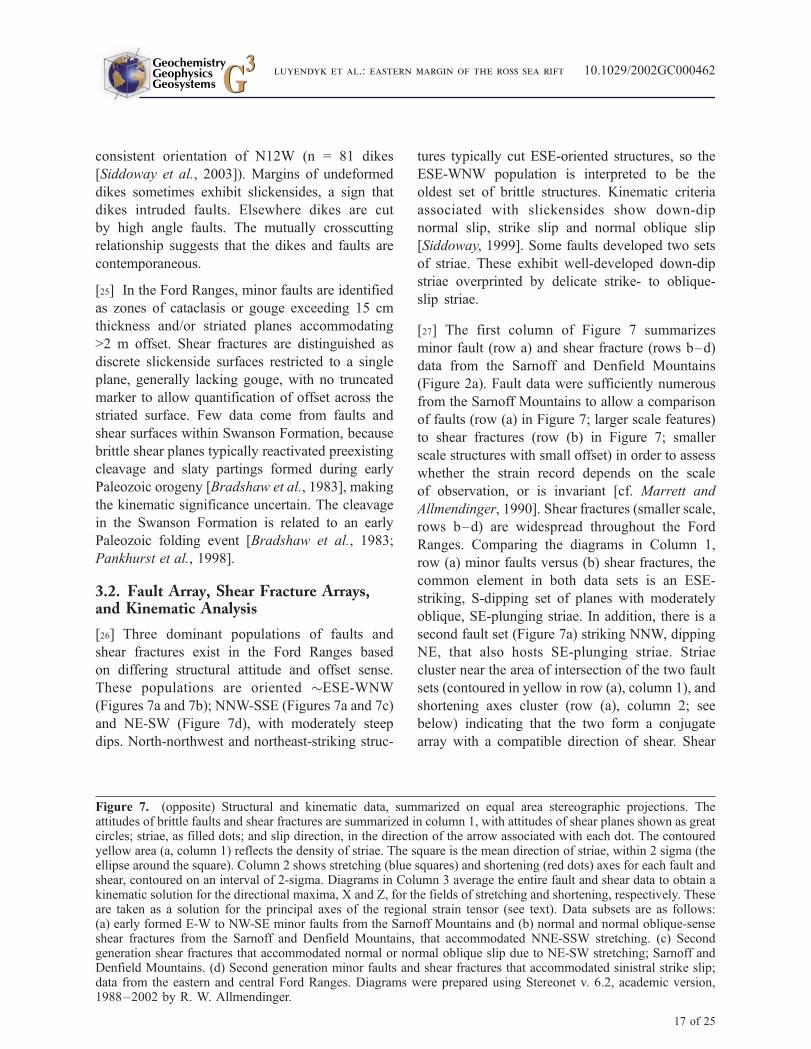
[27] The first column of Figure 7 summarizes
minor fault (row a) and shear fracture (rows b–d)
data from the Sarnoff and Denfield Mountains
(Figure 2a). Fault data were sufficiently numerous
from the Sarnoff Mountains to allow a comparison
of faults (row (a) in Figure 7; larger scale features)
to shear fractures (row (b) in Figure 7; smaller
scale structures with small offset) in order to assess
whether the strain record depends on the scale
of observation, or is invariant [cf. Marrett and
Allmendinger, 1990]. Shear fractures (smaller scale,
rows b–d) are widespread throughout the Ford
Ranges. Comparing the diagrams in Column 1,
row (a) minor faults versus (b) shear fractures, the
common element in both data sets is an ESE-
striking, S-dipping set of planes with moderately
oblique, SE-plunging striae. In addition, there is a
second fault set (Figure 7a) striking NNW, dipping
NE, that also hosts SE-plunging striae. Striae
cluster near the area of intersection of the two fault
sets (contoured in yellow in row (a), column 1), and
shortening axes cluster (row (a), column 2; see
below) indicating that the two form a conjugate
array with a compatible direction of shear. Shear
Figure 7. (opposite) Structural and kinematic data, summarized on equal area stereographic projections. Theattitudes of brittle faults and shear fractures are summarized in column 1, with attitudes of shear planes shown as greatcircles; striae, as filled dots; and slip direction, in the direction of the arrow associated with each dot. The contouredyellow area (a, column 1) reflects the density of striae. The square is the mean direction of striae, within 2 sigma (theellipse around the square). Column 2 shows stretching (blue squares) and shortening (red dots) axes for each fault andshear, contoured on an interval of 2-sigma. Diagrams in Column 3 average the entire fault and shear data to obtain akinematic solution for the directional maxima, X and Z, for the fields of stretching and shortening, respectively. Theseare taken as a solution for the principal axes of the regional strain tensor (see text). Data subsets are as follows:(a) early formed E-W to NW-SE minor faults from the Sarnoff Mountains and (b) normal and normal oblique-senseshear fractures from the Sarnoff and Denfield Mountains, that accommodated NNE-SSW stretching. (c) Secondgeneration shear fractures that accommodated normal or normal oblique slip due to NE-SW stretching; Sarnoff andDenfield Mountains. (d) Second generation minor faults and shear fractures that accommodated sinistral strike slip;data from the eastern and central Ford Ranges. Diagrams were prepared using Stereonet v. 6.2, academic version,1988–2002 by R. W. Allmendinger.
GeochemistryGeophysicsGeosystems G3G3
luyendyk et al.: eastern margin of the ross sea rift 10.1029/2002GC000462
17 of 25
fractures in row (b) exist over a range of orientations,
with dominantly down dip or oblique, moderately
plunging striae.
[28] Rows (c) and (d) in column 1, Figure 7,
provide a summary of shear fracture data from
the second generation of brittle structures in the
Sarnoff and Denfield ranges. Cross cutting
relationships at a small number of sites show that
NE- and NNW-striking shear fractures cut those
with the ESE attitude shown in Figure 7b; Thus
the arrays with NE- and NNW-strike are inter-
preted as forming during a later, second genera-
tion. The fault data in Figure 7 were divided into
subsets on the basis of orientation of striae and
kinematic sense, as follows: Column 1, row (c),
represents shear fractures that have down-dip
to oblique striae with normal- to oblique-slip
kinematics. Column 1, row (d), portrays shear
fractures with strike slip striae, distinguished by
their low rake. Importantly, this subset of data
came from a group of outcrops along the eastern
margin of the Ford Ranges, nearest to the prom-
inent NE-trending escarpment evident in the
bedrock topography (Figure 3). Kinematic criteria
consistently showed sinistral-sense offset. The
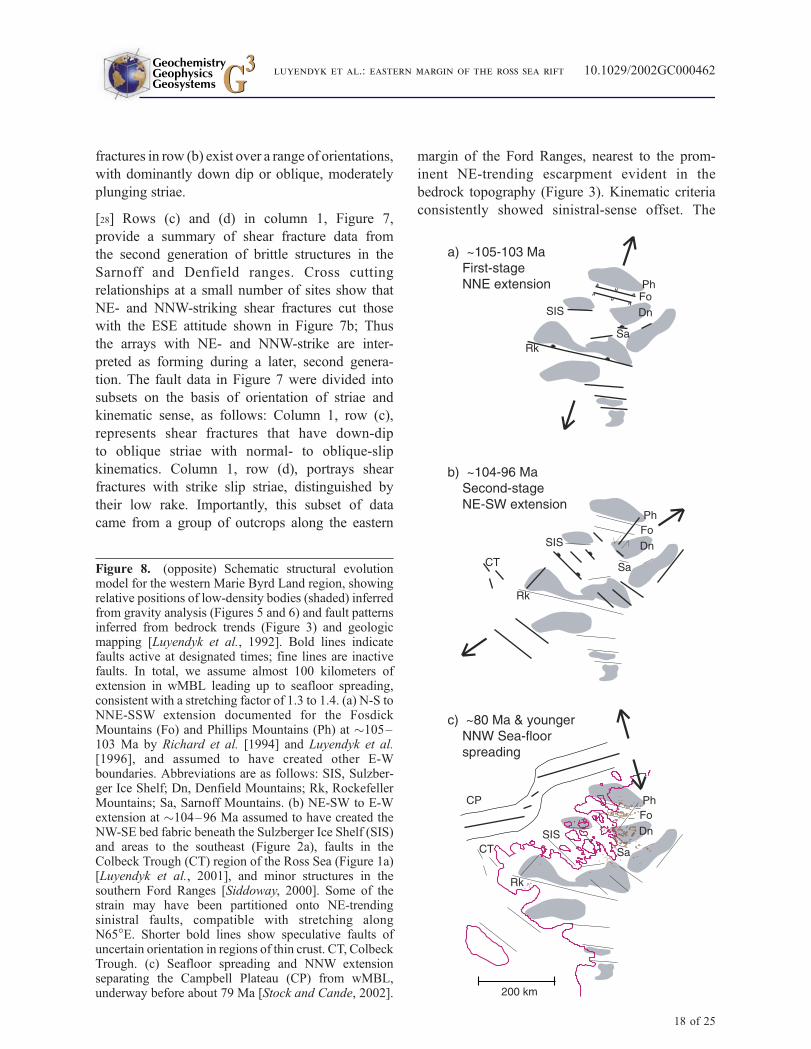
Figure 8. (opposite) Schematic structural evolutionmodel for the western Marie Byrd Land region, showingrelative positions of low-density bodies (shaded) inferredfrom gravity analysis (Figures 5 and 6) and fault patternsinferred from bedrock trends (Figure 3) and geologicmapping [Luyendyk et al., 1992]. Bold lines indicatefaults active at designated times; fine lines are inactivefaults. In total, we assume almost 100 kilometers ofextension in wMBL leading up to seafloor spreading,consistent with a stretching factor of 1.3 to 1.4. (a) N-S toNNE-SSW extension documented for the FosdickMountains (Fo) and Phillips Mountains (Ph) at �105–103 Ma by Richard et al. [1994] and Luyendyk et al.[1996], and assumed to have created other E-Wboundaries. Abbreviations are as follows: SIS, Sulzber-ger Ice Shelf; Dn, Denfield Mountains; Rk, RockefellerMountains; Sa, Sarnoff Mountains. (b) NE-SW to E-Wextension at �104–96 Ma assumed to have created theNW-SE bed fabric beneath the Sulzberger Ice Shelf (SIS)and areas to the southeast (Figure 2a), faults in theColbeck Trough (CT) region of the Ross Sea (Figure 1a)[Luyendyk et al., 2001], and minor structures in thesouthern Ford Ranges [Siddoway, 2000]. Some of thestrain may have been partitioned onto NE-trendingsinistral faults, compatible with stretching alongN65�E. Shorter bold lines show speculative faults ofuncertain orientation in regions of thin crust. CT, ColbeckTrough. (c) Seafloor spreading and NNW extensionseparating the Campbell Plateau (CP) from wMBL,underway before about 79 Ma [Stock and Cande, 2002].
GeochemistryGeophysicsGeosystems G3G3
luyendyk et al.: eastern margin of the ross sea rift 10.1029/2002GC000462
18 of 25
same sense of separation is recorded by an
interpreted strike slip fault that interrupts the
linear E-W trends of the Phillips and Fosdick
Mountains (Figure 8b, below). Apparent offset is
>5 km upon the distinctive migmatite gneiss of
the Fosdick Range. The generally east-to-west-
flowing Balchen Glacier (between Phillips and
Fosdick Mountains; Figure 2a) steps left, then
returns to east-to-west-flow along the high peaks
forming the steep north flank of the Fosdick
Mountains.
[29] Graphical and kinematic analyses of the fault
and shear slip data are presented in columns two
and three of Figure 7 respectively, according to the
methods of Marrett and Allmendinger [1990] and
using the FaultKin 4.1X program of Allmendinger
et al. Orientation data for fault and shear planes and
striae, together with sense of displacement, are
used to calculate the principal axes of shortening
(Z, red dots) and extension (X, open squares)
(column three Figures 7b, 7c, and 7d) for the
incremental strain tensor associated with each fault
and shear fracture. The orientation of the strain
axes is assumed to be oriented within the plane
containing the slickenline and the normal to the
fault or shear plane, at 45� to both. The well-
defined maxima of extension and/or shortening
axes in Figure 7, column two, indicate homogene-
ity of strain for the arrays.
[30] In column three, the average kinematic solu-
tion for each fault and shear population uses linked
Bingham statistics to calculate the directional
maxima for the field of X and Z strain axes. All
faults and shears are weighted equally and assumed
to be scale-invariant [Marrett and Allmendinger,
1990], an assumption that is validated by the
consistent kinematic solutions for both minor faults
and shear fractures (larger vs. smaller scale) of the
first generation (compare Figure 7a versus 7b,
column 3). The first generation faults (Figure 7a)
and shear fractures (Figure 7b) record extension
along �N15E, changing to regional extension
oriented �N65E (Figure 7c) during the time of
activity of the second-generation structures. During
the second event, part of the strain was partitioned
on to steep sinistral strike slip faults oriented
�N38E (Figure 7d), compatible with stretching
along N65E.
4. Discussion
4.1. Comparison of Structures WithAerogeophysical Lineaments Interpretedas Faults
[31] On the basis of parallelism of predominant
trends, we correlate the east-west-oriented mapped
faults [Luyendyk et al., 1992], linear gravity anoma-
lies, and bedrock lineaments or escarpments
(Figures 3 and 4a) with the first generation struc-
tures resulting from NNE extension and represented
by the fault array in the Sarnoff Mountains
(Figure 7a) and the shear fracture array of the
Sarnoff and Denfield Mountains (Figure 7b). The
bedrock in these ranges is Devonian Ford granodi-
orite [Weaver et al., 1991], so there is a possibility
that pre-existing major faults (concealed) influence
the geometry of the minor structures. The shorter,
less throughgoing, NNW-SSE bedrock fabric,
known in Sulzberger Bay and continuing onshore
to the southeast (Figure 3), we associate with the
secondgeneration shear fractures (Figures7c and7d)
that accommodated normal and normal oblique
fault movements during NE-SW crustal stretching.
The inferred stretching direction is generally paral-
lel with that determined from mafic dike orienta-
tions in the Ford Ranges (excluding Fosdick
migmatite dome [Siddoway, 2003]). The mutually
cross cutting relationships of faults and dikes pro-
vides a potential age constraint on timing of NE
extension of 104–96 Ma, the prevalent range of40Ar/39Ar ages for the dikes [Siddoway, 2003].
[32] During the second extension phase, a compo-
nent of strain was partitioned onto NE-SW-strik-
ing, sinistral, strike-slip faults (Figure 7d). In
addition to the NE-trending fault transecting the
Phillips and Fosdick Mountains, two NE-trending
bedrock lineaments near 140�W (Figure 3) corre-
spond with moderate gradients in the Bouguer
gravity anomaly (Figure 4c). Parallelism of these
steep bedrock features with the Phillips-Fosdick
fault and to a distinctive shear fracture array
suggests that some of the bedrock and gravity
lineaments may correspond with NE-SW, sinistral,
GeochemistryGeophysicsGeosystems G3G3
luyendyk et al.: eastern margin of the ross sea rift 10.1029/2002GC000462
19 of 25
strike-slip faults. Our interpretation is that the
features could represent transfer faults along the
eastern Ross Sea rift margin that separate domains
of predominant NE-SW stretching accommodated
on �NW-trending normal faults.
[33] The detailed aeromagnetic survey of
Ferraccioli et al. [2002] (location in Figures 1
and 2) identified lineaments oriented along
predominant �E-W, NNW, and NE trends on
Edward VII Peninsula. They inferred the �E-W-
and NNW-oriented features to be normal faults
that accommodated �N-S to NE-SW extension
[Ferraccioli et al., 2002] consistent with our
regional interpretations shown in Figures 8a
and 8b. Ferraccioli et al. [2002] interpret the
NE-trends to be either normal faults that developed
in response to NW-SE stretching or strike-slip
(transfer) faults. NW to NNW stretching could
have occurred during breakup of New Zealand/
Campbell Plateau andMarie Byrd Land (Figure 8c);
however if so, that event is not recorded in the
nearby Ford Ranges where rock outcrops are more
abundant than on Edward VII Peninsula. Similarly,
marine surveys adjacent and southwest of Edward
VII Peninsula did not identify structures that could
have resulted from NW-SE extension [Luyendyk et
al., 2001]. We favor an interpretation of the
pronounced NE-trending magnetic lineaments as
strike slip faults and hypothesize that their move-
ment was sinistral as we observe from our outcrop
data.
4.2. Structural Trends and Distributionof Low Density Regions
[34] The approximately east-west alignment of the
areas of inferred low-density rock (Figure 6) is
parallel to structure and topography in the northern
Ford Ranges [Richard et al., 1994] but oblique to
bed topography elsewhere. Thermochronology and
paleomagnetic data [Luyendyk et al., 1996] from
these ranges indicate that the first stage of roughly
NNE extension (Figure 8a) occurred 105–103 Ma.
Best documented in the northern Ford Ranges,
this event could have formed or reactivated
�E-W-striking crustal scale faults, and potentially
controlled the preservation of low-density sedimen-
tary rock if extension was fairly similar in style
across the entire study area. Areas where low-
density rock is not preserved could reflect simple
exhumation of footwall blocks if deformation was
dominated by large slip on low angle faults [cf.
Fitzgerald and Baldwin, 1997], or uplift and
erosion of footwall blocks if extension occurred
on high-angle faults (Figure 6). The lack of pene-
trative solid-state fabrics in the exposed crystalline
rocks of wMBL favors an interpretation of high-
angle faulting, but the possibility exists that shear
zones containing those fabrics are concealed by ice
or have been removed by erosion. Clastic sediments
derived from uplifted crystalline bedrock have not
been observed directly but they could make up a
portion of the low-density material required by the
gravity models. The generally east-west distribution
of modeled low-density regions is oblique to
NW-SE trends of the bed topography southeast of
the Sulzberger Ice Shelf and the NW-SE to N-S
trends of the mostly sediment-filled basement
topography in the Colbeck Trough region mapped
by Luyendyk et al. [2001]. The contrasting trends
indicate a multistage history of extension in the
eastern Ross Sea rift.
4.3. Tectonics of the Eastern Regionsof the Ross Sea Rift
[35] The findings from aerogeophysical surveys
and structural geology studies in the Ford Ranges
suggest that the crustal architecture along the
eastern margin of the Ross Sea rift developed
through NNE-SSW and NE-SW regional exten-
sion, affecting Cretaceous and older rock units.
Crustal-scale structures in the northern Ford
Ranges were produced during the earlier NNE-
SSW stretching. The extension phase oriented
N65�E–S65�W (NE extension) corresponds to
mafic dikes and second-generation brittle structures
on land in the Ford Ranges, and �N-S trending,
fault-bounded basins and ridges in the eastern Ross
Sea basement. The latter are identified by marine
geophysical surveys in the region of the Colbeck
Trough near Edward VII Peninsula where the
faulted basement is unconformably overlain by a
few hundred meters of undeformed Late Tertiary
glacial marine and glacial sediments [Luyendyk et
al., 2001]. Luyendyk et al. [2001] interpreted the
GeochemistryGeophysicsGeosystems G3G3
luyendyk et al.: eastern margin of the ross sea rift 10.1029/2002GC000462
20 of 25
faulted basement pattern offshore to be a product
of roughly east-west extension in early Late Cre-
taceous time.
[36] We correlate the offshore and onshore faults,
and infer that the 40Ar/39Ar age of the Ford Ranges
mafic dikes, in mutual crosscutting relationship
with faults on land, constrains the time of NE
extension to 104–96 Ma. The faults and dikes
trend at a high angle to the rifted continental
margin in wMBL, and the extension direction they
record is nearly orthogonal to the orientation of
seafloor spreading that initiated along the margin at
�79 Ma [Stock and Cande, 2002]. We attribute the
first and second-generation structures to intracon-
tinental extension that led to the formation of the
Ross Sea rift in the eastern Ross Sea (Figures 8a
and 8b).
[37] The areal extent of tectonism in the eastern
Ross Sea and wMBL region during this time
interval is evident from thermochronologic data.
Mylonitic gneisses derived from Byrd Coast
Granite, dredged from the inner rocky wall of
the Colbeck Trough (Figure 1a) [Siddoway et
al., 2003; Luyendyk et al., 2001] have 40Ar/39Ar
K-feldspar and biotite ages of 98 – 95 Ma
[Siddoway et al., 2003], like the Fosdick Moun-
tains migmatites [Richard et al., 1994]. Further
west at Deep Sea Drilling Project site 270 in the
Eastern Basin, basement-derived tectonites with
similar early Late Cretaceous cooling ages show
a brittle upon ductile textural overprint, interpreted
as evidence of exhumation in a detachment system
[Fitzgerald and Baldwin, 1997]. On Edward VII
Peninsula inland from the Colbeck trough, a
contrasting apatite fission track-cooling pattern
between northern and central outcrops is attributed
to mid-Cretaceous fault displacements [Adams et
al., 1995; Lisker and Olesch, 1998].
[38] In western Marie Byrd Land, the episode of
continental extension responsible for denudation
and rapid cooling across the region apparently
was distinct from the subsequent breakup with
the Campbell Plateau/New Zealand. Because rift-
related structures in the eastern Ross Sea trend at
a high angle to and are abruptly truncated at
the passive margin edge [Luyendyk et al., 2001],
we conclude that faults, ridges, and valleys
recording NE-SW to E-W extension (Figure 8b)
predate the passive margin edge, which according
to [Stock and Cande, 2002] formed at or just
before the start of seafloor spreading at 79 Ma
(Figure 8c). Since onset of spreading, little/no
deformation has occurred in the eastern Ross
Sea [Lawver and Gahagan, 1994; Luyendyk et
al., 2001], other than minor Neogene-modern
fault activity [Siddoway, 2000] and seismicity
[Anandakrishnan and Winberry, 2002] that occurs
within the contemporary West Antarctic rift
system. There are presently no data from MBL
that indicate activity in Eocene time, a time of
uplift and exhumation in the Transantarctic
Mountains [Fitzgerald, 1992]. The clear contrast
in cooling history of MBL to the Transantarctic
Mountains, on the eastern versus western margins
of the Ross Sea rift, suggests that the observed
asymmetry of the Ross Sea rift developed in
multiple events with differing ages.
[39] The record of NNE- to NE- extension in the
Ford Ranges of western MBL differs from that
in the Ruppert Coast to the east (Figure 1a), where
N-S extension is inferred from the predominant
�E-W, margin-parallel orientation of mafic dikes
[Storey et al., 1999]. Of 108–104 Ma age, the
dikes are interpreted to record onset of breakup
between MBL and New Zealand [Storey et al.,
1999]. The contrasting orientations of approxi-
mately same-aged dikes in coastal MBL, we attri-
bute to the differing tectonic character and setting
of the two regions. Pankhurst et al. [1998], distin-
guish two distinct tectonic provinces within MBL,
noting that the western Ross province including the
Ford Ranges is of continental affinity, while the
eastern Amundsen province including the Ruppert
Coast and eastern MBL has the character of
a marginal arc and close ties to New Zealand
basement geology. If a major tectonic boundary
separated the two provinces, it is possible that
differing tectonic stress environments existed in
each province during mafic dike emplacement.
Possible external influences affecting the crust in
the western MBL and the Ross Sea include onset
of extension between the Australian and Antarctic
plates [Stock and Cande, 2002] and cessation
GeochemistryGeophysicsGeosystems G3G3
luyendyk et al.: eastern margin of the ross sea rift 10.1029/2002GC000462
21 of 25

of subduction of the Phoenix plate under the
Gondwana margin [Bradshaw, 1989; Luyendyk,
1995].
5. Conclusions
[40] We propose that coastal wMBL including the
Ford Ranges and Edward VII Peninsula provides
regional exposures of the basement geology and
structure of the eastern Ross Sea rift. The com-
bined observations of bedrock topography, gravity
anomaly, and geological contrasts in the northern
Ford Ranges suggest that coastal wMBL is a region
of extended crust and that the boundary of
pronounced crustal extension is located just
beyond the northern Ford Ranges 300 to 350 km
northeast of the grounding line in the eastern Ross
Sea. A sub-ice volcanic field identified from the
magnetic anomalies is situated along or near that
boundary. Sparse gravity and bedrock elevations
from interior (east) wMBL suggest further that
the boundary of extended crust trends ESE inland
from the coast. Using a bedrock elevation of 500 m
(Figure 4a) as the mark of the extended crust
boundary we can measure the width of the Ross
Sea rift to be approximately 1200 kilometers to the
Transantarctic Mountains (Figure 1a). The exten-
sion history in our study region differs from that
to the east in the Ruppert Coast of MBL, which is
dominated by a record of crustal stretching related
to breakup with New Zealand.
[41] Differing tectonic histories also are the likely
explanation of the pronounced asymmetry in the
topography at the opposite boundaries of the Ross
Sea rift. The middle Cretaceous extension episode
is well represented in the basement geology of
wMBL where features of the Ross Sea rift are
exposed. The Transantarctic Mountains and struc-
tures such as the Terror Rift in the Victoria Land
Basin, are younger Tertiary features [Barrett et al.,
2000; Hamilton et al., 2001; Fitzgerald, 1992,
2002] that overprint or reactivate the Mesozoic
features. Eocene-Oligocene spreading in the Adare
Trough north of the western Ross Sea continental
margin [Cande et al., 2000] strongly influenced the
subsidence of the Victoria Land Basin [Hamilton et
al., 2001], whereas this had little effect in the
eastern Ross Sea and wMBL [Luyendyk et al.,
2001].
Acknowledgments
[42] We gratefully acknowledge the Support Office for Aero-
geophysical Research (SOAR) at the University of Texas,
Austin and Dr. Don Blankenship for his management of
SOAR field acquisition and preliminary processing work.
We also thank pilots Scott Lippa, Duncan Russell, Henry Perk
and Max Wenden (Ken Borek Air) who flew the aerogeophys-
ics and supported the ground party; Dave Morse and Scott
Kempf of SOAR and Bob Arko of Columbia University for
preliminary data processing; and Marcy Davis of UC Santa
Barbara and University of Texas, who assisted in the field
program. From the U.S. Antarctic Program, Steve Niles, Sarah
Harvey, and Sue Root deserve special mention along other
McMurdo support personnel. Anne Whitehead and Louis Sass
III (Colorado College) contributed to the structural geology
program, together with Mike Roberts, our mountain guide.
Dr. John Behrendt provided us with MBL land traverse data.
Sincere thanks go to Dr. Dick van der Wateren for many
stimulating discussions and his enthusiastic participation dur-
ing the first ground field season. We also wish to thank Drs.
Robin Bell, Fred Davey, Carol Finn, and Michael Studinger
for helpful comments. Research supported by National Science
Foundation Office of Polar Program grants NSF OPP 9615281
to Luyendyk and NSF OPP 9615282 to Siddoway. Contribu-
tion 518 of the Institute for Crustal Studies.
References
Adams, C. J., D. Seward, and S. D. Weaver, Geochronology
of Cretaceous granites and metasedimentary basement on
Edward VII Peninsula, Marie Byrd Land, West Antarctica,
Antarct. Sci., 7, 265–277, 1995.
Anandakrishnan, S., and P. Winberry, Results of a seismic
deployment in West Antarctica: Ice sheet effects on high
resolution imaging, Eos Trans. AGU Spring Meet. Suppl.,
82(47), Abstract U42A-11, 2002.
Barrett, P. J., M. Massimo Sarti, and S. Wise, Studies from the
Cape Roberts Project, Ross Sea, Antarctica: Initial report on
CRP-3, in Terra Antartica, pp. 209, Terra Antarctica, Siena,
Italy, 2000.
Behrendt, J. C., W. E. LeMasurier, A. K. Cooper, F. Tessensohn,
A. Trehu, and D. Damaske, Geophysical studies of the West
Antarctic Rift System, Tectonics, 10, 1257–1273, 1991a.
Behrendt, J. C., W. E. LeMasurier, A. K. Cooper, F. Tessensohn,
A. Trehu, and D. Damaske, The West Antarctic Rift System:
A review of geophysical investigations, in Contributions to
Antarctic Research II, Antarct. Res. Ser., vol. 53, edited by
D. H. Elliot, pp. 67–112, AGU, Washington, D. C., 1991b.
Beitzel, J. E., Geophysical investigations in Marie Byrd Land,
Antarctica, Ph.D. dissertation thesis, Univ. of Wisconsin,
Madison, 1972.
Bell, R. E., V. A. Childers, R. A. Arko, D. D. Blankenship, and
J. M. Brozena, Airborne Gravity and Precise Positioning for
GeochemistryGeophysicsGeosystems G3G3
luyendyk et al.: eastern margin of the ross sea rift 10.1029/2002GC000462
22 of 25
Geological Applications, J. Geophys. Res., 104(B7),
15,281–15,292, 1999.
Bentley, C. R., Crustal structure of Antarctica, Tectonophysics,
20, 229–240, 1973.
Bentley, C. R., Configuration and structure of the subglacial
crust, in The Geology of Antarctica, edited by R. J. Tingey,
pp. 335–364, Clarendon, Oxford, England, 1991.
Bradshaw, J. D., Cretaceous geotectonic patterns in the New
Zealand region, Tectonics, 8, 803–820, 1989.
Bradshaw, J. D., P. B. Andrews, and B. D. Field, Swanson
Formation and related rocks of Marie Byrd Land and a
comparison with the Robertson Bay Group of Northern
Victoria Land, in Antarctica Earth Science, edited by R. L.
Oliver et al., pp. 274–279, Aust. Acad. of Sci., Canberra,
1983.
Brady, R. J., B. P. Wernicke, M. McNutt, J. Mutter, and
G. Correa, Crustal structure of the Basin and Range to
Colorado Plateau transition in the Lake Mead region from
BARGE seismic reflection data, Geochem. Geophys. Geo-
syst., 1, Paper number 2000GC000078, 2000.
Cande, S. C., J. M. Stock, D. Muller, and T. Ishihara, Cenozoic
Motion between East and West Antarctica, Nature, 404,
145–150, 2000.
Childers, V. A., R. E. Bell, and J. M. Brozena, Airborne gravi-
metry: An investigation of filtering, Geophysics, 64, 61–69,
1999.
Cowdery, S. G., and J. O. Stone, Geological insight into the
Holocene glacial history of West Antarctica based on mo-
raine studies, petrography of erratics, and cosmogenic dat-
ing, Geol. Soc. Am. Abstr. Programs, 33(5), A-13, 2001.
Dalziel, I. W. D., and L. Lawver, The Lithospheric Setting of
the West Antarctic Icesheet, in The West Antarctic Ice Sheet:
Behavior and Environment, Antarct. Res. Ser., vol. 77, edited
by R. B. Alley and R. A. Bindschadler, pp. 29–44, AGU,
Washington, D. C., 2001.
Davey, F. J., and G. Brancolini, The Late Mesozoic and
Cenozoic structural setting of the Ross Sea region, in Geol-
ogy and Seismic Stratigraphy of the Antarctic Margin, Ant-
arct. Res. Ser., vol. 68, edited by A. K. Cooper, P. F. Barker,
and G. Brancolini, pp. 167–182, AGU, Washington, D.C.,
1995.
Ferraccioli, F., E. Bozzo, and D. Damaske, Aeromagnetic
signatures over western Marie Byrd Land provide insight
into magmatic arc basement, mafic magmatism, and struc-
ture of Eastern Ross Sea Rift flank, Tectonophysics, 347,
139–165, 2002.
Fitzgerald, P. G., The Transantarctic Mountains of Southern
Victoria Land: The application of apatite fission track
analysis to a rift shoulder uplift, Tectonics, 11, 634–662,
1992.
Fitzgerald, P. G., Tectonics and landscape evolution of the
Antarctic Plate since the breakup of Gondwana with
an emphasis on the West Antarctic Rift System and the
Transantarctic Mountains, in Antarctica at the Close of a
Millennium: Proceedings of the 8th International Symposium
on Antarctic Earth Sciences, Wellington, 1999, edited by J. A.
Gamble, D. N. B. Skinner, and S. Henrys, pp. 453–469,
Royal Soc. of New Zealand, Wellington, 2002.
Fitzgerald, P. G., and S. L. Baldwin, Detachment Fault Model
for the Evolution of the Ross Embayment, in The Antarctic
Region: Geological Evolution and Processes, edited by C. A.
Ricci, pp. 555–564, Terra Antarct., Siena, Italy, 1997.
Gans, P. B., An open system, two-layer crustal stretching
model for the eastern Great Basin, Tectonics, 6, 1–12, 1987.
Greischar, L. L., C. R. Bentley, and L. R. Whiting, An analysis
of gravity measurements on the Ross Ice Shelf, Antarctica, in
Contributions to Antarctic Research III, Antarct. Res. Ser.,
vol. 57, edited by D. H. Elliot, pp. 105–155, Am. Geophys.
Union, Washington, D. C., 1992.
Hamilton, R. J., B. P. Luyendyk, C. C. Sorlien, and L. R.
Bartek, Cenozoic Tectonics of the Cape Roberts Rift Basin,
and Transantarctic Mountains Front, Southwestern Ross Sea,
Antarctica, Tectonics, 20, 325–342, 2001.
Jackson, J. A., N. J. White, Z. Garfunkel, and H. Anderson,
Relations Between Normal Fault Geometry, Tilting and
Vertical Motions in Extensional Terrains: An Example from
the Southern Gulf of Suez, J. Struct. Geol., 10, 155–170,
1988.
Kaufman, P. S., and L. H. Royden, Lower Crustal Flow in an
Extensional Setting: Constraints from the Halloran Hills Re-
gion, Eastern Mojave Desert, California, J. Geophys. Res.,
66, 15,723–15,739, 1994.
Lawver, L. A., and L. M. Gahagan, Constraints on timing of
extension in the Ross Sea region, Terra Antarct., 1, 545–
552, 1994.
LeMasurier, W. E., and D. C. Rex, Evolution of linear volcanic
ranges in Marie Byrd Land, West Antarctica, J. Geophys.
Res., 94, 7223–7236, 1989.
LeMasurier, W. E., and D. C. Rex, Late Cenozoic volcanism
on the Antarctic Plate: An overview, in Volcanoes of the
Antarctic Plate and Southern Oceans, Antarct. Res. Ser.,
vol. 48, edited by W. E. LeMasurier and J. W. Thompson,
pp. 1–17, Am. Geophys. Union, Washington, D. C., 1990.
Lemoine, F. G., et al., The development of the joint NASA
GSFC and the National Imagery and Mapping Agency
(NIMA) geopotential model EGM96, NASA, Greenbelt,
Md., 1998.
Lisker, F., and M. Olesch, Cooling and denudation history of
Edward VII Peninsula, Marie Byrd Land, based on apatite
fission tracks, in Advances in Fission-Track Geochronology,
edited by P. Van den haute and F. De Corte, pp. 225–240,
Kluwer Acad., Norwell, Mass., 1998.
Liu, H., K. C. Jezek, and B. Li, Development of an Antarctic
digital elevation model by integrating cartographic and
remotely sensed data: A geographic information system
based approach, J. Geophys. Res., 104, 23,199–23,213,
1999.
Luyendyk, B. P., Hypothesis for Cretaceous rifting of east
Gondwana caused by subducted slab capture, Geology, 23,
373–376, 1995.
Luyendyk, B. P., S. M. Richard, C. H. Smith, and D. L.
Kimbrough, Geological and geophysical investigations
in the northern Ford Ranges, Marie Byrd Land, West
Antarctica, in Recent Progress in Antarctic Earth Science:
Proceedings of the 6th Symposium on Antarctic Earth
Science, Saitama, Japan, 1991, edited by Y. Yoshida,
GeochemistryGeophysicsGeosystems G3G3
luyendyk et al.: eastern margin of the ross sea rift 10.1029/2002GC000462
23 of 25
K. Kaminuma, and K. Shiraishi, pp. 279–288, Terra Sci.,
Tokyo, Japan, 1992.
Luyendyk, B. P., S. Cisowski, C. H. Smith, S. M. Richard, and
D. L. Kimbrough, Paleomagnetic study of the northern Ford
Ranges, western Marie Byrd Land, West Antarctica: A mid-
dle Cretaceous pole, and motion between West and East
Antarctica?, Tectonics, 15, 122–141, 1996.
Luyendyk, B. P., C. C. Sorlien, D. S. Wilson, L. R. Bartek, and
C. H. Siddoway, Structural and tectonic evolution of the
Ross Sea rift in the Cape Colbeck region, Eastern Ross
Sea, Antarctica, Tectonics, 20, 933–958, 2001.
Luyendyk, B. P., D. S. Wilson, and R. Decesari, New Maps of
Gravity and Bedrock-Bathymetry of the Ross Sea Sector of
Antarctica, Eos Trans. AGU, Fall Meet. Suppl., 83(47),
F1357, 2002.
Luyendyk, B. P., C. H. Smith, and G. Druivenga, Gravity
measurements on King Edward VII Peninsula, Marie Byrd
Land, West Antarctica, during GANOVEX VII, Geol.
Jahrb., B95, 101–126, 2003.
Lythe, M. B., et al., BEDMAP: A new ice thickness and sub-
glacial topographic model of Antarctica, J. Geophys. Res.,
106, 11,335–11,351, 2001.
Marrett, R. A., and R. W. Allmendinger, Kinematic analysis of
fault-slip data, J. Struct. Geol., 12, 973–986, 1990.
Pankhurst, R. J., S. D. Weaver, J. D. Bradshaw, B. C. Storey,
and T. R. Ireland, Geochronology and geochemistry of
pre-Jurassic superterranes in Marie Byrd Land, Antarctica,
J. Geophys. Res., 103, 2529–2547, 1998.
Panter, K. S., S. R. Hart, P. R. Kyle, J. Blusztanjn, and T. I.
Wilch, Geochemistry of late Cenozoic basalts from the Crary
Mountains: Characterization of mantle sources in eastern
Marie Byrd Land, Antarctica, Chem. Geol., 165, 215–241,
2000.
Parker, R. L., The rapid calculation of potential anomalies,
Geophys. J. R. Astron. Soc., 31, 447–455, 1973.
Richard, S. M., C. H. Smith, D. L. Kimbrough, P. G. Fitzgerald,
B. P. Luyendyk, and M. O. McWilliams, Cooling history of
the northern Ford Ranges, Marie Byrd Land, West Antarctica,
Tectonics, 13, 837–857, 1994.
Siddoway, C. H., Structural evolution of the Ford Ranges,Marie
Byrd Land, from brittle kinematic analysis, paper presented
at 9th International Symposium on Antarctic Earth Sciences,
Sci. Comm. on Antarctic Res., Potsdam, Germany, 2003.
Siddoway, C. S., Late Cretaceous-Cenozoic Structural Evolu-
tion of western Marie Byrd Land (abstract), in 8th Interna-
tional Symposium on Antarctic Earth Sciences, edited by
D. N. B. Skinner, pp. 281, Victoria Univ., Wellington,
New Zealand, 1999.
Siddoway, C. S., Tectonic evolution of Marie Byrd Land, West
Antarctica: Disassembly of the Mesozoic margin and
Cenozoic activity related to the West Antarctic Rift System
[extended abstract on CD-ROM], paper presented at 31st
International Geological Congress, Int. Union of Geol.
Sci., Rio de Janeiro, August 7–16 , 2000.
Siddoway, C. S., S. L. Baldwin, P. G. Fitzgerald, C. M.
Fanning, and B. P. Luyendyk, Ross Sea mylonites and
the timing of continental extension between East and West
Antarctica, Geology, in press, 2003.
Smith, C. H., Migmatites at the amphibole-granulite transition,
Fosdick Metamorphic Complex, West Antarctica, in Recent
Progress in Antarctic Earth Science: Proceedings of the 6th
Symposium on Antarctic Earth Science, Saitama, Japan,
1991, edited by Y. Yoshida, K. Kaminuma, and K. Shiraishi,
pp. 295–301, Terra Sci., Tokyo, Japan, 1992.
Smith, C. H., Mid-Crustal Processes During Cretaceous Rift-
ing, Fosdick Mountains, Marie Byrd Land, in The Antarctic
Region Geological Evolution and Processes, edited by
C. A. Ricci, pp. 313–320, Terra Antart., Siena, Italy,
1997.
Stock, J. M., and S. C. Cande, Tectonic History of Antarctic
Seafloor in the Australia-New Zealand-South Pacific Sector:
Implications for Antarctic Continental Tectonics, in Antarc-
tica at the Close of a Millennium: Proceedings of the 8th
International Symposium on Antarctic Earth Sciences, Well-
ington, 1999, edited by J. A. Gamble, D. N. B. Skinner, and
S. Henrys, pp. 251–259, R. Soc. of New Zealand, Welling-
ton, 2002.
Stone, J. O., G. A. Balco, D. E. Sugden, M. W. Caffee, L. C.
Sass III, S. G. Cowdery, and C. Siddoway, Holocene degla-
ciation of Marie Byrd Land, West Antarctica, Science, 299,
99–102, 2003.
Storey, B. C., P. T. Leat, S. D. Weaver, R. J. Pankhurst, J. D.
Bradshaw, and S. Kelley, Mantle Plumes and Antarctica-
New Zealand rifting: Evidence from mid-Cretaceous mafic
dykes, J. Geol. Soc. London, 156, 659–671, 1999.
Studinger, M., R. E. Bell, C. A. Finn, and D. D. Blankenship,
Mesozoic and Cenozoic extensional tectonics of the West
Antarctic rift system from high-resolution airborne geophys-
ical mapping, in Antarctica at the Close of a Millennium:
Proceedings of the 8th International Symposium on Antarctic
Earth Sciences, Wellington, 1999, edited by J. Gamble, D. N.
B. Skinner, and S. A. Henrys, pp. 563–569, The R. Soc. of
New Zealand, Wellington, New Zealand, 2002.
Tessensohn, F., and G. Worner, The Ross Sea rift system,
Antarctica: Structure, evolution, and analogs, in Geological
Evolution of Antarctica, edited by M. R. A. Thompson, J. A.
Crame, and J. W. Thompson, pp. 273–278, Cambridge
Univ. Press, New York, 1991.
Trey, H., A. K. Cooper, G. Pellis, B. Della Vedova, G. Cochrane,
G. Brancolini, and J. Makris, Transect across the West
Antarctic rift system in the Ross Sea, Antarctica, Tectono-
physics, 301, 61–74, 1999.
Wade, F. A., C. A. Cathey, and J. B. Oldham, Reconnaissance
geologic map of the Guest Peninsula quadrangle, Marie Byrd
Land, Antarctica, Map A-7, U. S. Antarc. Res. Program,
Reston, Va., 1977a.
Wade, F. A., C. A. Cathey, and J. B. Oldham, Reconnaissance
geologic map of the Boyd Glacier quadrangle, Marie Byrd
Land, Antarctica, Map A-6., U. S. Antarc. Res. Program,
Reston, Va., 1977b.
Wade, F. A., C. A. Cathey, and J. B. Oldham, Reconnaissance
geologic map of the Alexandra Mountains quadrangle, Marie
Byrd Land, Antarctica, Map A-5, U. S. Antarc. Res. Pro-
gram, Reston, Va., 1977c.
Wade, F. A., C. A. Cathey, and J. B. Oldham, Reconnaissance
geologic map of the Gutenko Nunataks quadrangle, Marie
GeochemistryGeophysicsGeosystems G3G3
luyendyk et al.: eastern margin of the ross sea rift 10.1029/2002GC000462
24 of 25
Byrd Land, Antarctica, Map A-11, U. S. Antarc. Res. Pro-
gram, Reston, Va., 1978.
Weaver, S. D., J. D. Bradshaw, and C. J. Adams, Granitoids of
the Ford Ranges, Marie Byrd Land, Antarctica, in Geologi-
cal Evolution of Antarctica, edited by M. R. A. Thompson et
al., pp. 345–351, Cambridge Univ. Press, Cambridge,
Mass., 1991.
Weaver, S. D., B. C. Storey, R. J. Pankhurst, S. B. Mukasa,
V. J. DiVenere, and J. D. Bradshaw, Antarctica-New Zealand
rifting and Marie Byrd Land lithospheric magmatism linked
to ridge subduction and mantle plume activity, Geology, 22,
811–814, 1994.
Whitehead, A. L., C. S. Siddoway, and F. W. van der Wateren,
Kinematic Analysis of Small-Scale Brittle Structures in the
Ford Ranges, Marie Byrd Land (abstract), in 8th Interna-
tional Symposium on Antarctic Earth Sciences, July 5–9,
1999, edited by D. N. B. Skinner, pp. 316, Victoria Univ.,
Wellington, New Zealand, 1999.
Wilson, D. S., B. P. Luyendyk, C. S. Siddoway, and M. Davis,
Preliminary Results From an Aerogeophysical Survey of
Western Marie Byrd Land, Antarctica, Eos Trans. AGU, Fall
Meet. Suppl., 81(48), F405, 2000.
Wilson, D. S., B. P. Luyendyk, C. C. Sorlien, and J. Stone,
Geophysical Observations Supporting Significant Varia-
tion in ice Thickness of Western Marie Byrd Land, Ant-
arctica, Eos Trans. AGU, Fall Meet. Suppl., 82(42), F793,
2001.
Wilson, D. S., B. P. Luyendyk, and C. C. Sorlien, Formation of
Bedrock Plateaus within the Ross Sea Embayment, Antarc-
tica, by Marine Erosion in Late Tertiary Time, paper pre-
sented at 9th International Symposium on Antarctic Earth
Sciences, Sci. Comm. on Antarctic Res., Potsdam, Germany,
2003.
Wilson, T., Cenozoic transtension along the Transantarctic
Mountains-West Antarctic rift boundary, southern Victoria
Land, Antarctica, Tectonics, 14, 531–545, 1995.
GeochemistryGeophysicsGeosystems G3G3
luyendyk et al.: eastern margin of the ross sea rift 10.1029/2002GC000462
25 of 25
Related Documents


![Transient rift opening in response to multiple dike ... · Macdonald, 1982; Smith and Cann, 1999]. Normal faulting also plays a role in accommodating crustal extension, but the largely](https://static.cupdf.com/doc/110x72/5f1f455b3223440cae0fb9dd/transient-rift-opening-in-response-to-multiple-dike-macdonald-1982-smith-and.jpg)


