East Sussex Downs & Weald PCT Hastings & Rother PCT

Welcome message from author
This document is posted to help you gain knowledge. Please leave a comment to let me know what you think about it! Share it to your friends and learn new things together.
Transcript
East Sussex Downs & Weald PCT Hastings & Rother PCT

Eastbourne
Introduction
3
This document provides an abstract of the data available for Eastbourne borough from the Director of Public Health Annual Report 2010/11 – Reducing Health Inequalities in East Sussex. These quick reference summaries are designed to provide information about health inequalities in these areas, for use by those working in, and commissioning for, these specific districts and boroughs. However, the main report should be accessed at:
http://www.esdw.nhs.uk/http://www.hastingsandrother.nhs.uk/
to explain the information contained in this document. The figure numbering in this document is taken from the main report, to enable you to easily relate back to the main report for further information and commentary on any particular figure. Throughout the main report, the districts and boroughs are colour coded in the same colours, to enable the local information to be easily spotted.
Introduction

Eastbourne
Table 1: Life Expectancy and disability-free life expectancy among males at birth, 2001
Table 2: Life Expectancy and disability-free life expectancy among females at birth, 2001
Note: The higher the Index of Multiple Deprivation Score the more deprived.
Note: The higher the Index of Multiple Deprivation Score the more deprived.
Index of Multiple Deprivation 2007 Score
Life expectancy (yrs)
Disability-free life expectancy (yrs)
Difference (yrs)
Eastbourne 23.36 75.3 61.2 14.1
Hastings 32.21 74.2 58.3 15.9
Lewes 14.79 78.7 65.1 13.6
Rother 17.85 77.4 63.5 13.9
Wealden 10.86 78.3 66.0 12.3
Index of Multiple Deprivation 2007 Score
Life expectancy (yrs)
Disability-free life expectancy (yrs)
Difference (yrs)
Eastbourne 23.36 81.7 65.2 16.5
Hastings 32.21 79.6 62.2 17.4
Lewes 14.79 82.3 66.8 15.5
Rother 17.85 81.4 66.3 15.1
Wealden 10.86 83.1 68.5 14.6

Source: 2001 Census and ONS mortality data
Source: 2001 Census and ONS mortality data
Figure 2: Difference between life expectancy and disability-free life expectancy among males at birth, East Sussex districts and boroughs, 2001
Figure 3: Difference between life expectancy and disability-free life expectancy among females at birth, East Sussex districts and boroughs, 2001
14.1 15.9
13.6 13.9
12.3
50
55
60
65
70
75
80
85
Eastbourne Hastings Lewes Rother Wealden
Year
s
16.5 17.4
15.5 15.1 14.6
50
55
60
65
70
75
80
85
Eastbourne Hastings Lewes Rother Wealden
Year
s

Eastbourne
Source: Index of Multiple Deprivation 2007
Figure 4: Index of Multiple Deprivation 2007 scores by LSOA grouped by East Sussex districts and boroughs
0
10
20
30
40
50
60
70
80
Eastbourne Hastings Lewes Rother Wealden
IMD
200
7 sc
ore
Table 4: IMD 2007 score and rank for districts and boroughs in East Sussex
Local authority
Average score across LSOAs within local authority
National rank of average score (1 = most deprived 354 = least deprived)
Number of LSOAs
Minimum LSOA score
Maximum LSOA score
Eastbourne 23.4 104 59 5.8 46.2
Hastings 32.2 31 53 10.3 71.0
Lewes 14.8 218 62 2.0 32.5
Rother 17.9 166 58 5.6 44.8
Wealden 10.9 284 95 1.6 37.8
Source: Index of Multiple Deprivation 2007
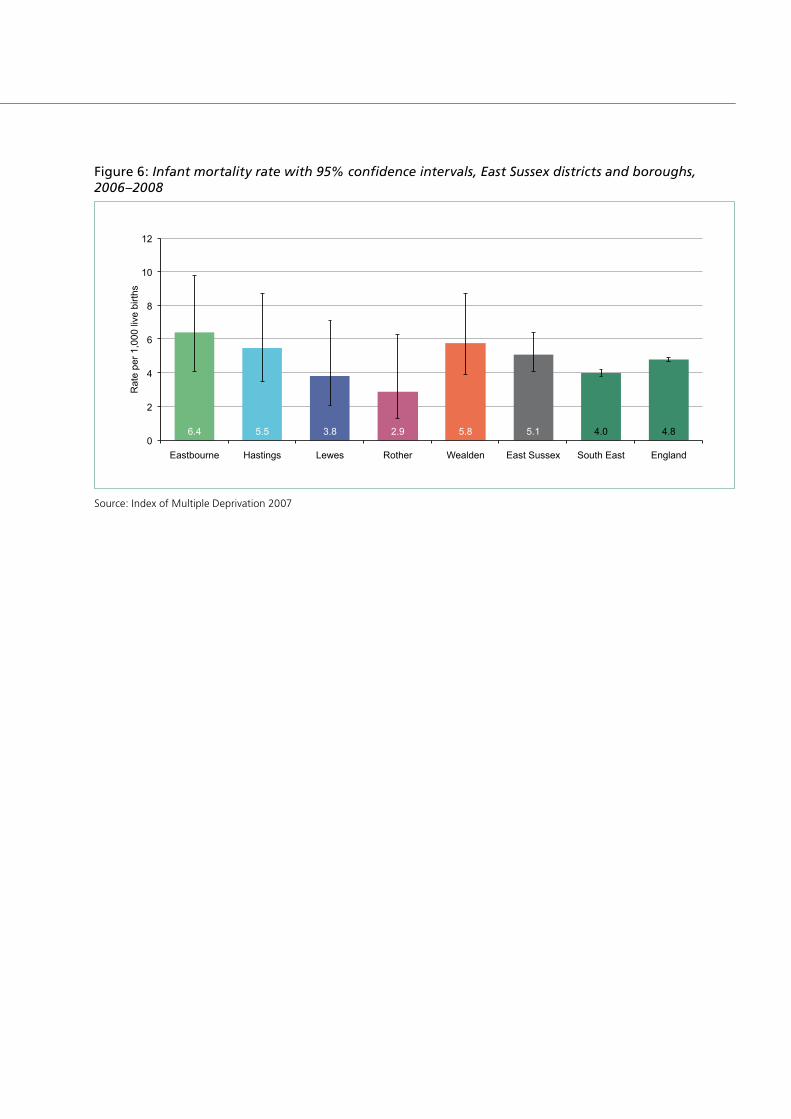
Figure 6: Infant mortality rate with 95% confidence intervals, East Sussex districts and boroughs, 2006–2008
6.4 5.5 3.8 2.9 5.8 5.1 4.0 4.8 0
2
4
6
8
10
12
Eastbourne Hastings Lewes Rother Wealden East Sussex South East England
Rat
e pe
r 1,0
00 li
ve b
irths
Eastbourne
Source: Compendium of Clinical and Health Indicators
Source: Compendium of Clinical and Health Indicators
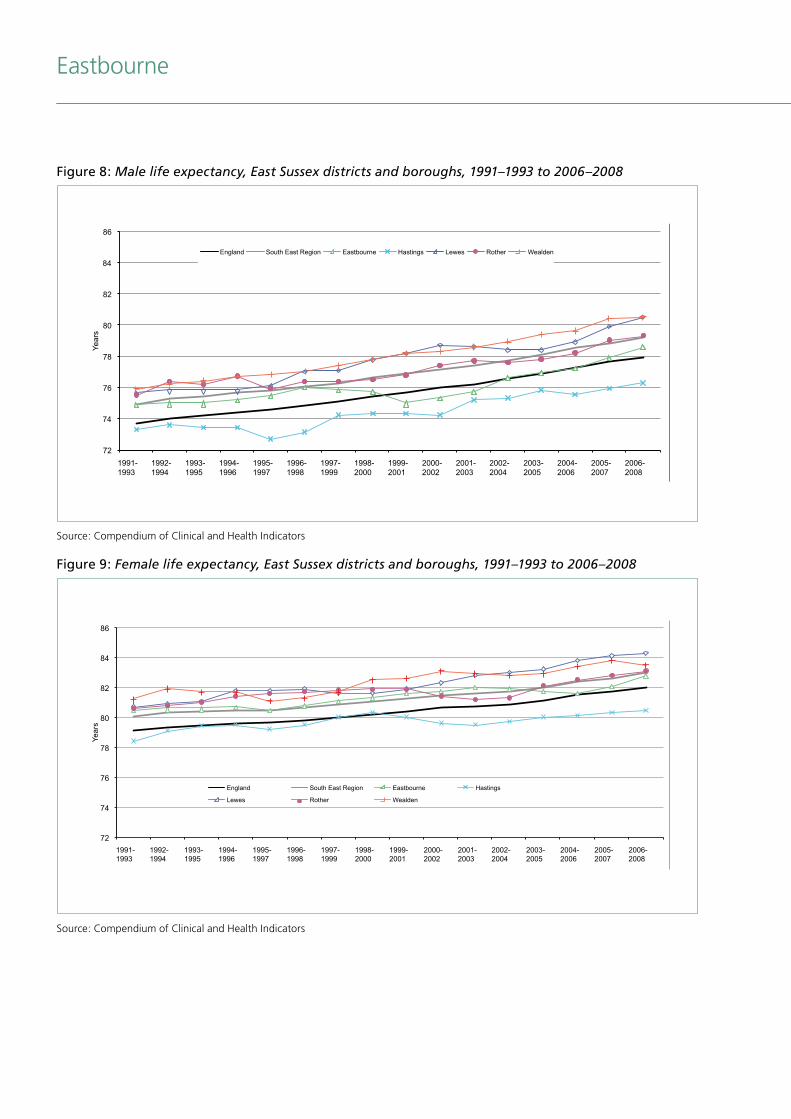
Figure 8: Male life expectancy, East Sussex districts and boroughs, 1991–1993 to 2006–2008
Figure 9: Female life expectancy, East Sussex districts and boroughs, 1991–1993 to 2006–2008
72
74
76
78
80
82
84
86
1991-1993
1992-1994
1993-1995
1994-1996
1995-1997
1996-1998
1997-1999
1998-2000
1999-2001
2000-2002
2001-2003
2002-2004
2003-2005
2004-2006
2005-2007
2006-2008
Year
s
England South East Region Eastbourne Hastings Lewes Rother Wealden
72
74
76
78
80
82
84
86
1991-1993
1992-1994
1993-1995
1994-1996
1995-1997
1996-1998
1997-1999
1998-2000
1999-2001
2000-2002
2001-2003
2002-2004
2003-2005
2004-2006
2005-2007
2006-2008
Year
s
England South East Region Eastbourne Hastings
Lewes Rother Wealden
Source: Compendium of Clinical and Health Indicators
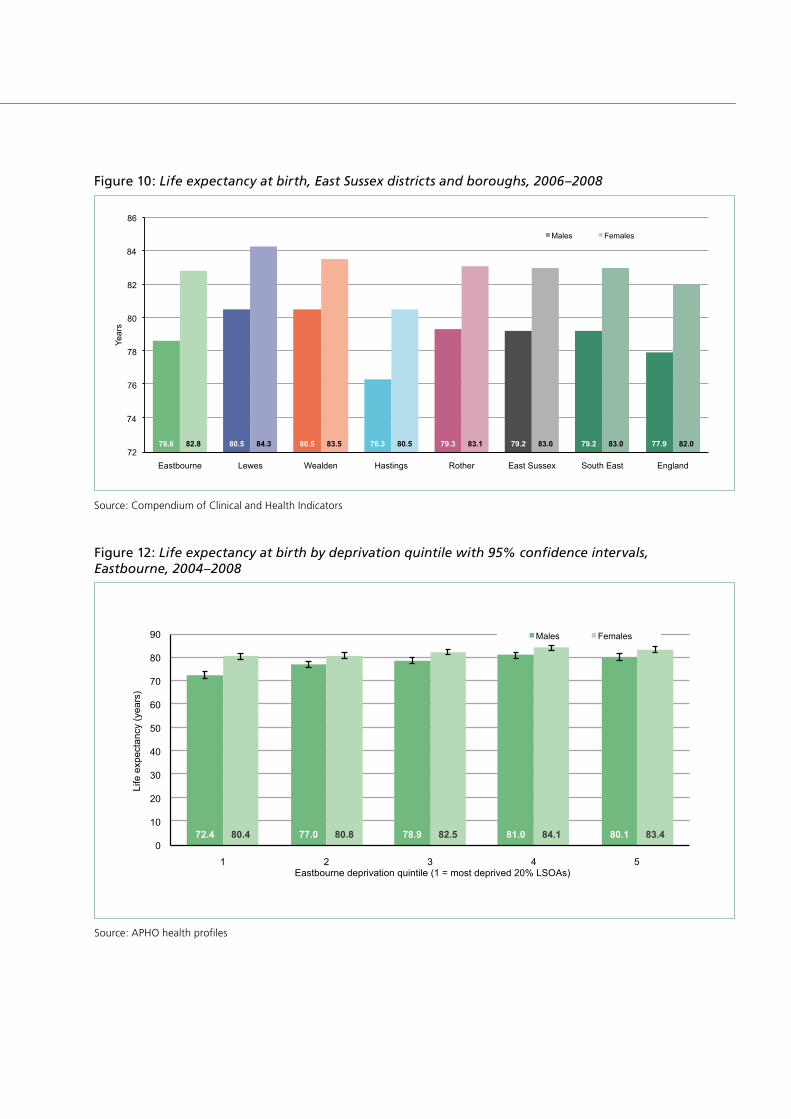
Figure 10: Life expectancy at birth, East Sussex districts and boroughs, 2006–2008
78.6 80.5 80.5 76.3 79.3 79.2 79.2 77.9 82.8 84.3 83.5 80.5 83.1 83.0 83.0 82.0 72
74
76
78
80
82
84
86
Eastbourne Lewes Wealden Hastings Rother East Sussex South East England
Year
s
Males Females
Source: APHO health profiles
Figure 12: Life expectancy at birth by deprivation quintile with 95% confidence intervals, Eastbourne, 2004–2008
72.4 77.0 78.9 81.0 80.1 80.4 80.8 82.5 84.1 83.4 0
10
20
30
40
50
60
70
80
90
1 2 3 4 5
Life
exp
ecta
ncy
(yea
rs)
Eastbourne deprivation quintile (1 = most deprived 20% LSOAs)
Males Females
Eastbourne
Other; 16% Other; 21%
External; 18% External; 9%
Digestive; 8% Digestive; 10%
Respiratory; 12% Respiratory; 17%
All cancers; 18%
All cancers; 20%
All circulatory; 26% All circulatory; 17%
0%
10%
20%
30%
40%
50%
60%
70%
80%
90%
100% Males Females
All circulatory
All cancers
Respiratory
Digestive
External
Infections
Other
Neonatal
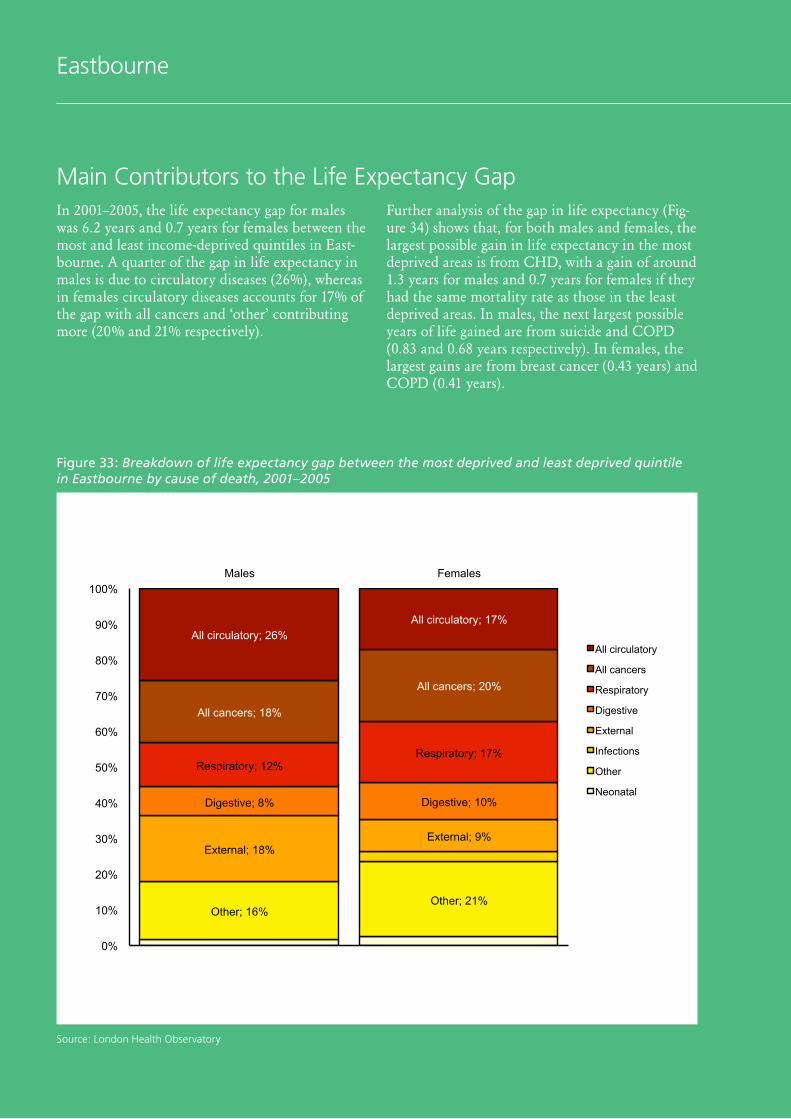
Figure 33: Breakdown of life expectancy gap between the most deprived and least deprived quintile in Eastbourne by cause of death, 2001–2005
Source: London Health Observatory
Eastbourne
In 2001–2005, the life expectancy gap for males was 6.2 years and 0.7 years for females between the most and least income-deprived quintiles in East-bourne. A quarter of the gap in life expectancy in males is due to circulatory diseases (26%), whereas in females circulatory diseases accounts for 17% of the gap with all cancers and ‘other’ contributing more (20% and 21% respectively).
Further analysis of the gap in life expectancy (Fig-ure 34) shows that, for both males and females, the largest possible gain in life expectancy in the most deprived areas is from CHD, with a gain of around 1.3 years for males and 0.7 years for females if they had the same mortality rate as those in the least deprived areas. In males, the next largest possible years of life gained are from suicide and COPD (0.83 and 0.68 years respectively). In females, the largest gains are from breast cancer (0.43 years) and COPD (0.41 years).
Main Contributors to the Life Expectancy Gap

1.4 1.2 1.0 0.8 0.6 0.4 0.2 0.0
Coronary Heart Disease Heart failure Stroke Other cardiovascular disease
Oesophageal cancer Stomach cancer Colorectal cancer Lung cancer Breast cancer Other cancers
Pneumonia Chronic obstructive airways disease Other respiratory disease
Stomach/duodenum ulcer Chronic cirrhosis of the liver Other digestive diseases
Road traffic accidents Other accidents Suicide and undetermined injury Other external causes
Infectious and parasitic diseases
Endocrine, nutritional, metabolic diseases Mental and behavioural disorders Diseases of nervous system Musculoskeletal diseases Genitourinary diseases Perinatal conditions Congenital anomolies Ill defined conditions Other
All causes <28 days
Males 0.0 0.2 0.4 0.6 0.8 1.0 1.2 1.4 Females
Figure 34: Possible gain in life expectancy in Eastbourne, 2001–2005
Source: London Health Observatory
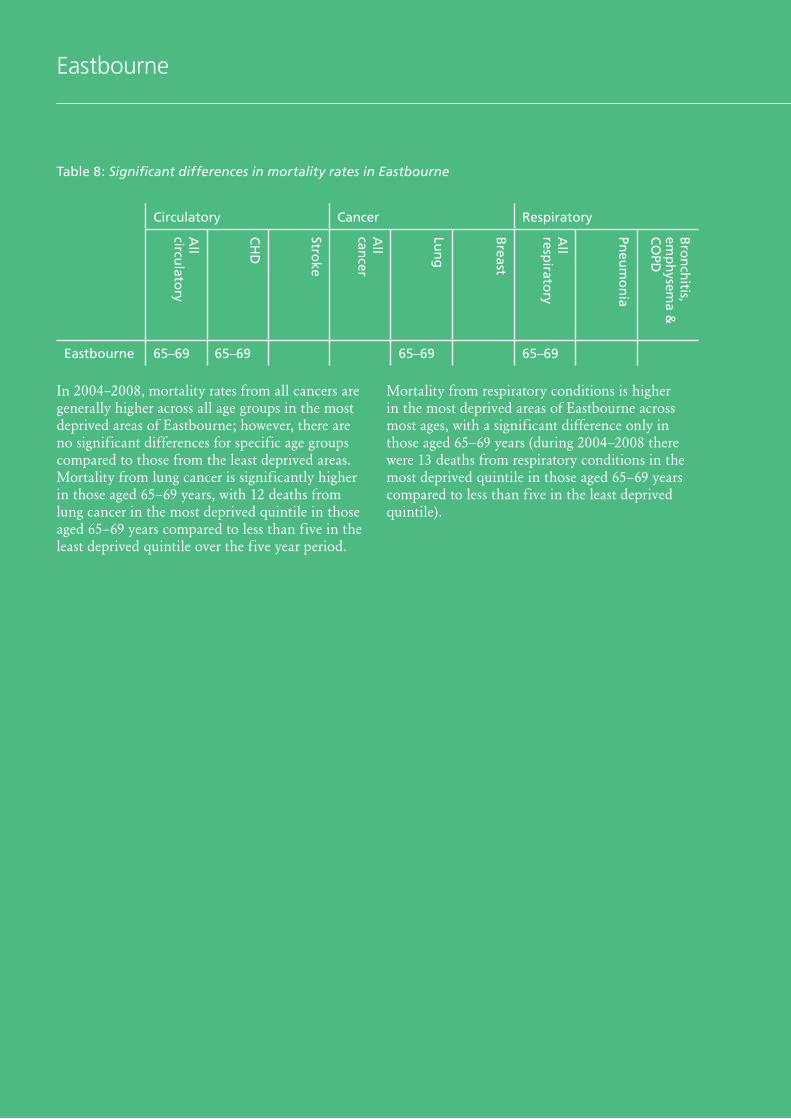
Table 8 shows the age groups in which there are significant differences in mortality rates for circulatory, cancer and respiratory conditions between the most and least deprived areas of Eastbourne.
Mortality from circulatory diseases is higher in the most deprived quintile in Eastbourne compared to the least deprived across all ages for 2004–2008, except people aged 85 years or over. Mortality from circulatory diseases is significantly higher in those aged 65–69 years in the most deprived quintile, and this can also be seen in mortality from CHD. Over a five year period, there were 24 deaths from CHD in the most deprived quintile in people aged 65–69 years compared to six in the least deprived quintile.
EastbourneEastbourne
In 2004–2008, mortality rates from all cancers are generally higher across all age groups in the most deprived areas of Eastbourne; however, there are no significant differences for specific age groups compared to those from the least deprived areas. Mortality from lung cancer is significantly higher in those aged 65–69 years, with 12 deaths from lung cancer in the most deprived quintile in those aged 65–69 years compared to less than five in the least deprived quintile over the five year period.
Mortality from respiratory conditions is higher in the most deprived areas of Eastbourne across most ages, with a significant difference only in those aged 65–69 years (during 2004–2008 there were 13 deaths from respiratory conditions in the most deprived quintile in those aged 65–69 years compared to less than five in the least deprived quintile).
Table 8: Significant differences in mortality rates in Eastbourne
Circulatory Cancer Respiratory
All
circulato
ry
CH
D
Stroke
All
cancer
Lun
g
Breast
All
respirato
ry
Pneu
mo
nia
Bro
nch
itis, em
ph
ysema &
C
OPD
Eastbourne 65–69 65–69 65–69 65–69
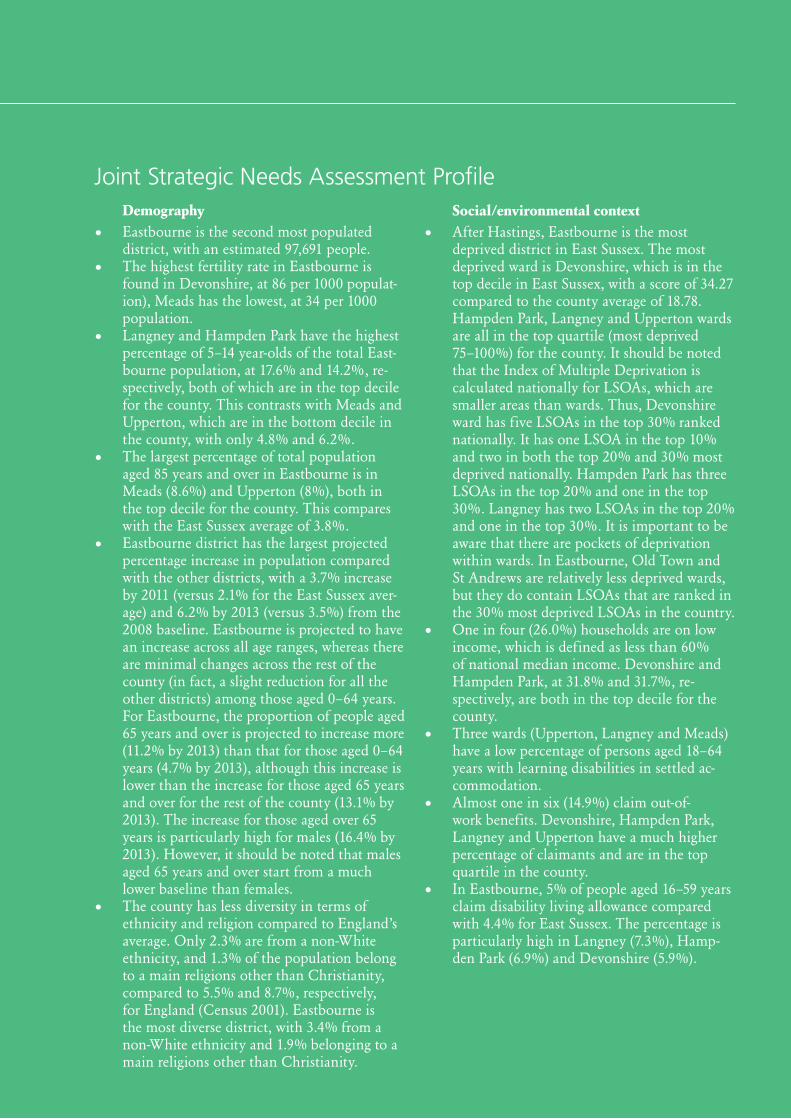
DemographyEastbourne is the second most populated district, with an estimated 97,691 people.The highest fertility rate in Eastbourne is found in Devonshire, at 86 per 1000 populat-ion), Meads has the lowest, at 34 per 1000 population.Langney and Hampden Park have the highest percentage of 5–14 year-olds of the total East-bourne population, at 17.6% and 14.2%, re-spectively, both of which are in the top decile for the county. This contrasts with Meads and Upperton, which are in the bottom decile in the county, with only 4.8% and 6.2%.The largest percentage of total population aged 85 years and over in Eastbourne is in Meads (8.6%) and Upperton (8%), both in the top decile for the county. This compares with the East Sussex average of 3.8%.Eastbourne district has the largest projected percentage increase in population compared with the other districts, with a 3.7% increase by 2011 (versus 2.1% for the East Sussex aver-age) and 6.2% by 2013 (versus 3.5%) from the 2008 baseline. Eastbourne is projected to have an increase across all age ranges, whereas there are minimal changes across the rest of the county (in fact, a slight reduction for all the other districts) among those aged 0–64 years. For Eastbourne, the proportion of people aged 65 years and over is projected to increase more (11.2% by 2013) than that for those aged 0–64 years (4.7% by 2013), although this increase is lower than the increase for those aged 65 years and over for the rest of the county (13.1% by 2013). The increase for those aged over 65 years is particularly high for males (16.4% by 2013). However, it should be noted that males aged 65 years and over start from a much lower baseline than females.The county has less diversity in terms of ethnicity and religion compared to England’s average. Only 2.3% are from a non-White ethnicity, and 1.3% of the population belong to a main religions other than Christianity, compared to 5.5% and 8.7%, respectively, for England (Census 2001). Eastbourne is the most diverse district, with 3.4% from a non-White ethnicity and 1.9% belonging to a main religions other than Christianity.
•
•
•
•
•
•
•
•
•
•
•
Social/environmental contextAfter Hastings, Eastbourne is the most deprived district in East Sussex. The most deprived ward is Devonshire, which is in the top decile in East Sussex, with a score of 34.27 compared to the county average of 18.78. Hampden Park, Langney and Upperton wards are all in the top quartile (most deprived 75–100%) for the county. It should be noted that the Index of Multiple Deprivation is calculated nationally for LSOAs, which are smaller areas than wards. Thus, Devonshire ward has five LSOAs in the top 30% ranked nationally. It has one LSOA in the top 10% and two in both the top 20% and 30% most deprived nationally. Hampden Park has three LSOAs in the top 20% and one in the top 30%. Langney has two LSOAs in the top 20% and one in the top 30%. It is important to be aware that there are pockets of deprivation within wards. In Eastbourne, Old Town and St Andrews are relatively less deprived wards, but they do contain LSOAs that are ranked in the 30% most deprived LSOAs in the country. One in four (26.0%) households are on low income, which is defined as less than 60% of national median income. Devonshire and Hampden Park, at 31.8% and 31.7%, re-spectively, are both in the top decile for the county.Three wards (Upperton, Langney and Meads) have a low percentage of persons aged 18–64 years with learning disabilities in settled ac-commodation.Almost one in six (14.9%) claim out-of-work benefits. Devonshire, Hampden Park, Langney and Upperton have a much higher percentage of claimants and are in the top quartile in the county.In Eastbourne, 5% of people aged 16–59 years claim disability living allowance compared with 4.4% for East Sussex. The percentage is particularly high in Langney (7.3%), Hamp-den Park (6.9%) and Devonshire (5.9%).
Joint Strategic Needs Assessment Profile

EastbourneEastbourne
The 2001 Census showed that, in Meads, 53% of households owned their house outright and, in Ratton, the proportion was 49%. In Hampden Park, 21.4% of households and 23.2% of those in Langney were rented from the council/local authority. Old Town and St Anthony’s both also have a high proportion (10.6% and 11%) of households rented from council/local authority. In Hampden Park, 14.8% of households are rented from housing association/registered social landlord. Devon-shire, Upperton and Meads were all in the top decile for the county, with 26.3%, 21.7% and 19.6% of households rented from a private landlord.In Eastbourne, 8.6% lived in overcrowded households (the highest rate in East Sussex), with one in 10 under-18s in overcrowded homes. (Census 2001)One in three households (31.7%) have no access to a car or van, rising to 43.8% in Devonshire, 41.7% in Upperton and 38.2% in Meads. (Census 2001)Nearly two in five (37%) older people aged 65 years and over live alone. In Devonshire, this rises to 48% and in Upperton 43%. (Census 2001)Three in five children travel to primary school by car/van or taxi in Old Town and Upper-ton ward, compared to two in five children in Eastbourne. For secondary school pupils, the highest percentage of those travelling to secondary school by car/van or taxi is Meads (46%), St Anthony’s (37%) and Sovereign ward (35%), compared to 25% for Eastbourne.
Lifestyle and risk factors75% of mothers start breastfeeding, but this falls to 48% at six-to-eight weeks of age. In Hampden Park, only 62% of mothers start breastfeeding and this reduces to 40% at six to eight weeks. Similar results are found in St Anthony’s and Sovereign wards. In Langney, 71% start breastfeeding but only 35% are still breastfeeding at six-to-eight weeks.
•
•
•
•
•
•
•
•
•
••
•
•
•
•
•
23% of Eastbourne Reception Year children are overweight or obese. This compares to 20% for East Sussex. Sovereign ward has the highest figure in East Sussex, at 39%. The figure for Year 6 pupils for Eastbourne is 27%, which is slightly less than the county average of 28%. Sovereign is the highest in Eastbourne, at 34%. For adults, less than one in five (19%) participate in sport and active recreation. The estimated adult level of obesity is 22%.One in five mothers are known to smoke at the time of delivery. This rises to 30% for Langney and 27% for Hampden Park.Teenage pregnancies (46 per 1000 population in 15–17-year-olds) are much higher than the county average (37 per 1000 population). In Ratton, the rate is only 12 per 1000 population.25% of adults smoke.78% of people report their health as either good or very good. However, for Langney, this figure is only 66%.
Burden of ill-healthEastbourne has a Mental Illness Needs Index 2000 of 1.03, which suggests 3% more illness in the area than the country as a whole. Devonshire has an index of 1.32, or 32% more illness severe enough to need hospital treat-ment from time to time. The Index of Common Mental Illness shows that, in the most deprived wards in East-bourne, all are in the top quartile for the county for incidence of both neurotic symp-toms and depression.
Burden of ill-health – mortalityLife expectancy at birth in Eastbourne, at 81, matches the East Sussex average. This is substantially lower for Devonshire and Hampden Park, at 77.All age, all cause, age-standardised mortality is 3% above the East Sussex average. It is significantly higher in Hampden Park (33%), St Anthony’s (30%) and Upperton (22%).The under-75s (age-standardised) deaths from circulatory diseases are 8% higher than in the county as a whole. Rates are 80% in Hamp-den Park and 68% higher in Devonshire.

Age-standardised cancer mortality in the under-75s is 9% above the East Sussex average, it is 33% higher in Devonshire and 30% higher in Hampden Park.COPD mortality is only 6% above the East Sussex average. Again, there are large dispari-ties with Devonshire, Hampden Park and St Anthony’s more than 50% above this level.Mortality from causes considered amenable to healthcare is 72% higher than the county average in Hampden Park and 59% in Devonshire.Mortality from suicide in Devonshire is over double the county average.
Burden of ill-health – primary careGP-reported cancer prevalence is lower than the county average in all areas except Lang-ney. For Eastbourne, the prevalence is 48% greater than expected.GP-recorded CHD is lower than the county average but 22% lower than the expected prevalence. Heart failure is reported at 33% of the expected level and hypertension at 52% of the expected level.Diabetes mellitus is reported at only 72% of the expected level.Reporting of dementia is only 26% of expected level.Mental illness is reported at over two times the expected level.
Burden of ill-health – hospital careA&E attendances in under-fours are 181 per 1000 population. The East Sussex average is 153 per 1000 population. The rates in central Devonshire (243 per 1000 population), Upperton (237 per 1000 population) and Meads (225 per 1000 population) are well above average.Above average A&E attendances persist through childhood, at both 5–9 years and 10–19 years.The overall age-standardised A&E attendances for Eastbourne are 17% above the East Sussex average (range -–5% in Meads to 42% in Hampden Park).
Emergency hospital admissions for persons aged 1–4 years are 195 per 1000 population, compared to the county rate of 169 per 1000 population. The highest rates in Eastbourne are found in Devonshire (268 per 1000 popu-lation), Upperton (259 per 1000 population) and Langney (211 per 1000 population), all of which are in the upper quartile range).Well-above-average emergency hospital admissions persist for children aged 5–9 years and 10–19 years in the Devonshire ward.Emergency hospital admissions due to symp-toms and signs without a definitive diagnosis for persons aged 0–4 years are very high for Eastbourne 56 per 1000 population, which is in the top decile for the county. All wards are high and Devonshire is particularly high, with the second highest rate for a ward in the county. The rate is still very high for Eastbourne for persons aged 5–19 years. All elective admissions (age-standardised) are 14% above East Sussex average levels.Emergency (age-standardised) admissions for CHD are 4% lower than expected, while elective admissions are 13% higher. However, emergency admissions from Hampden Park are 56% above the level expected.Total hospital admissions due to cancer are 18% more than expected for Eastbourne.Emergency admissions (age-standardised) due to respiratory diseases are 11% above the level for East Sussex as a whole, rising substantially in Hampden Park, Devonshire, Upperton, St Anthony’s and Devonshire. COPD emergency admissions are 19% above the East Sussex average, rising to over double in Hampden Park.Emergency hospital admissions due to pneumonia are particularly high for Hampden Park, St Anthony’s, Upperton and Langney – all are in the top quartile, ranging from 43–33% more admissions than expected.
•
•
•
•
•
•
•
•
•
•
•
•
•
•
•
•
•
•
•
•
EastbourneEastbourne
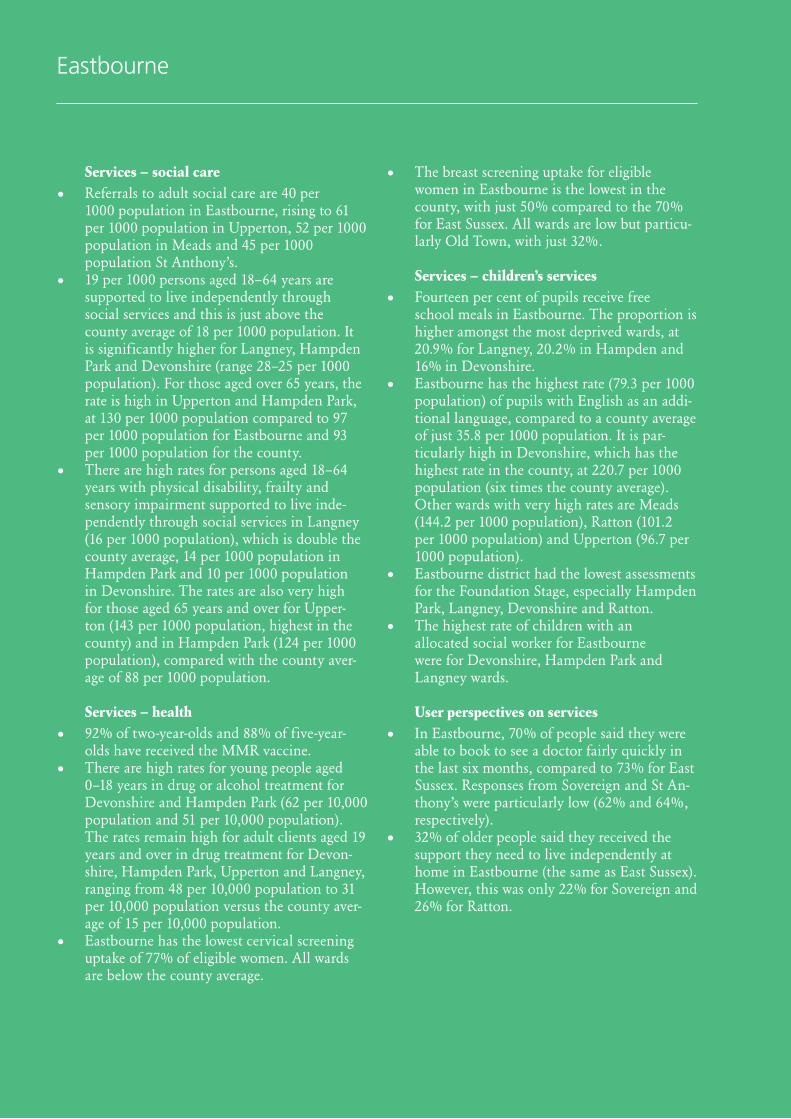
Services – social careReferrals to adult social care are 40 per 1000 population in Eastbourne, rising to 61 per 1000 population in Upperton, 52 per 1000 population in Meads and 45 per 1000 population St Anthony’s.19 per 1000 persons aged 18–64 years are supported to live independently through social services and this is just above the county average of 18 per 1000 population. It is significantly higher for Langney, Hampden Park and Devonshire (range 28–25 per 1000 population). For those aged over 65 years, the rate is high in Upperton and Hampden Park, at 130 per 1000 population compared to 97 per 1000 population for Eastbourne and 93 per 1000 population for the county. There are high rates for persons aged 18–64 years with physical disability, frailty and sensory impairment supported to live inde-pendently through social services in Langney (16 per 1000 population), which is double the county average, 14 per 1000 population in Hampden Park and 10 per 1000 population in Devonshire. The rates are also very high for those aged 65 years and over for Upper-ton (143 per 1000 population, highest in the county) and in Hampden Park (124 per 1000 population), compared with the county aver-age of 88 per 1000 population.
Services – health92% of two-year-olds and 88% of five-year-olds have received the MMR vaccine.There are high rates for young people aged 0–18 years in drug or alcohol treatment for Devonshire and Hampden Park (62 per 10,000 population and 51 per 10,000 population). The rates remain high for adult clients aged 19 years and over in drug treatment for Devon-shire, Hampden Park, Upperton and Langney, ranging from 48 per 10,000 population to 31 per 10,000 population versus the county aver-age of 15 per 10,000 population.Eastbourne has the lowest cervical screening uptake of 77% of eligible women. All wards are below the county average.
The breast screening uptake for eligible women in Eastbourne is the lowest in the county, with just 50% compared to the 70% for East Sussex. All wards are low but particu-larly Old Town, with just 32%.
Services – children’s servicesFourteen per cent of pupils receive free school meals in Eastbourne. The proportion is higher amongst the most deprived wards, at 20.9% for Langney, 20.2% in Hampden and 16% in Devonshire.Eastbourne has the highest rate (79.3 per 1000 population) of pupils with English as an addi-tional language, compared to a county average of just 35.8 per 1000 population. It is par-ticularly high in Devonshire, which has the highest rate in the county, at 220.7 per 1000 population (six times the county average). Other wards with very high rates are Meads (144.2 per 1000 population), Ratton (101.2 per 1000 population) and Upperton (96.7 per 1000 population).Eastbourne district had the lowest assessments for the Foundation Stage, especially Hampden Park, Langney, Devonshire and Ratton.The highest rate of children with an allocated social worker for Eastbourne were for Devonshire, Hampden Park and Langney wards.
User perspectives on servicesIn Eastbourne, 70% of people said they were able to book to see a doctor fairly quickly in the last six months, compared to 73% for East Sussex. Responses from Sovereign and St An-thony’s were particularly low (62% and 64%, respectively).32% of older people said they received the support they need to live independently at home in Eastbourne (the same as East Sussex). However, this was only 22% for Sovereign and 26% for Ratton.
•
•
•
•
•
•
•
•
•
•
•
•
•

2001 2007
Ethnic groups
BME BME inc White Irish and White other
BME BME inc White Irish and White other
Number % Number % Number % Number %
Hastings 2,500 2.9 5,100 6.0 5,200 5.0 9,600 10.0
Rother 1,600 1.9 3,900 4.6 3,500 4.0 6,400 7.3
East-bourne
2,900 3.2 6,700 7.5 5,900 6.2 9,900 10.4
Lewes 1,900 2.1 4,400 4.8 4,600 4.9 8,100 8.6
Wealden 2,300 1.6 5,700 4.8 6,100 4.2 11,500 8.0
East Sussex
12,000 2.4 27,600 5.6 26,500 5.2 45,700 9.0
South East
400,200 5.0 707,400 8.8 661,200 8.0 1,062,300 12.8
England 4,552,800 9.2 6,523,900 13.2 6,009,100 11.8 8,355,900 16.4
Source: Office of National Statistics
Table 13: Numbers and percentages of the black and minority ethnic populations by local authority, 2001 and 2007, ONS
Source: ONS
Figure 45: International in-migrant GP registrations, East Sussex districts and boroughs, 2000/01–2007/08
0
200
400
600
800
1,000
1,200
2000/01 2001/02 2002/03 2003/04 2004/05 2005/06 2006/07 2007/08
Num
ber
Eastbourne Hastings Lewes Rother Wealden
Eastbourne
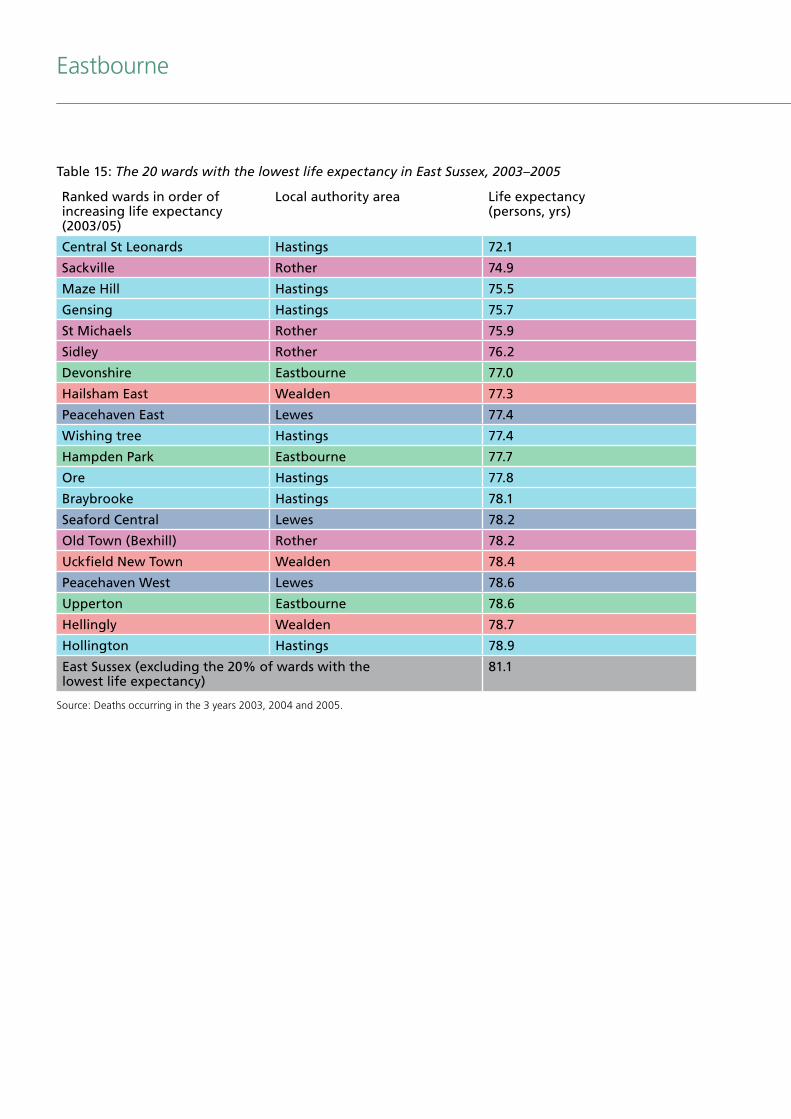
Ranked wards in order of increasing life expectancy (2003/05)
Local authority area Life expectancy (persons, yrs)
Central St Leonards Hastings 72.1
Sackville Rother 74.9
Maze Hill Hastings 75.5
Gensing Hastings 75.7
St Michaels Rother 75.9
Sidley Rother 76.2
Devonshire Eastbourne 77.0
Hailsham East Wealden 77.3
Peacehaven East Lewes 77.4
Wishing tree Hastings 77.4
Hampden Park Eastbourne 77.7
Ore Hastings 77.8
Braybrooke Hastings 78.1
Seaford Central Lewes 78.2
Old Town (Bexhill) Rother 78.2
Uckfield New Town Wealden 78.4
Peacehaven West Lewes 78.6
Upperton Eastbourne 78.6
Hellingly Wealden 78.7
Hollington Hastings 78.9
East Sussex (excluding the 20% of wards with the lowest life expectancy)
81.1
Source: Deaths occurring in the 3 years 2003, 2004 and 2005.
Table 15: The 20 wards with the lowest life expectancy in East Sussex, 2003–2005
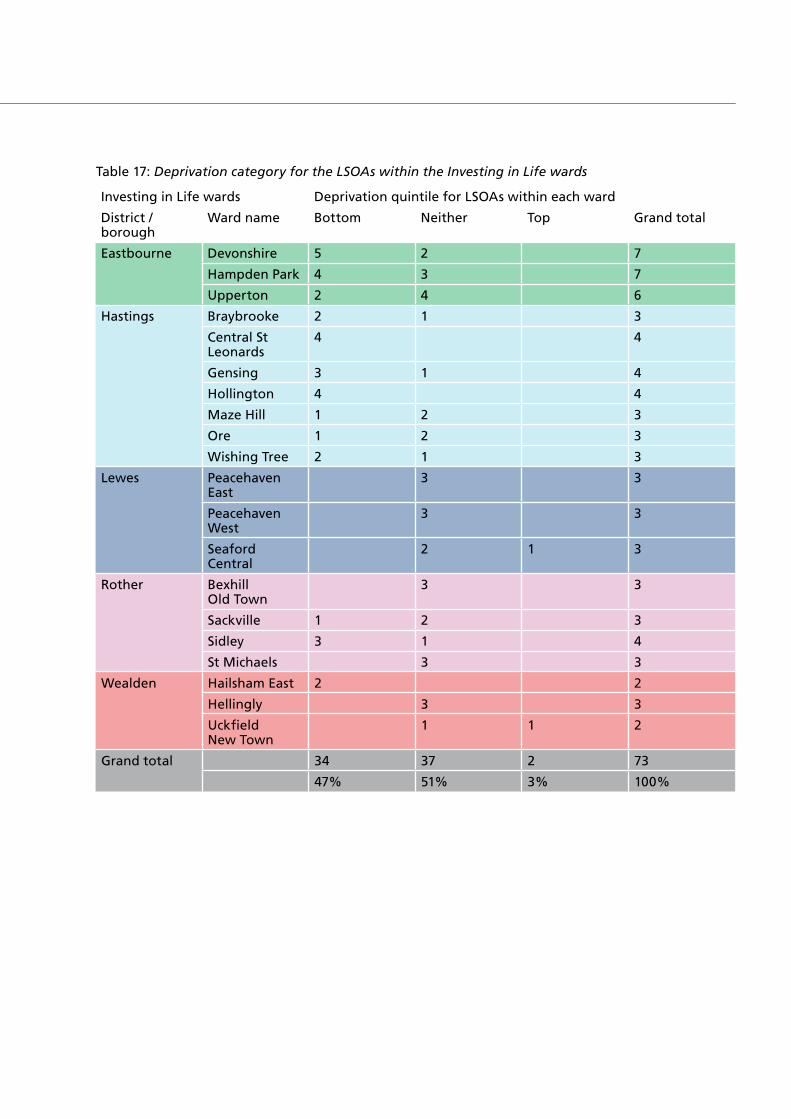
Investing in Life wards Deprivation quintile for LSOAs within each ward
District / borough
Ward name Bottom Neither Top Grand total
Eastbourne Devonshire 5 2 7
Hampden Park 4 3 7
Upperton 2 4 6
Hastings Braybrooke 2 1 3
Central St Leonards
4 4
Gensing 3 1 4
Hollington 4 4
Maze Hill 1 2 3
Ore 1 2 3
Wishing Tree 2 1 3
Lewes Peacehaven East
3 3
Peacehaven West
3 3
Seaford Central
2 1 3
Rother Bexhill Old Town
3 3
Sackville 1 2 3
Sidley 3 1 4
St Michaels 3 3
Wealden Hailsham East 2 2
Hellingly 3 3
Uckfield New Town
1 1 2
Grand total 34 37 2 73
47% 51% 3% 100%
Table 17: Deprivation category for the LSOAs within the Investing in Life wards
Eastbourne
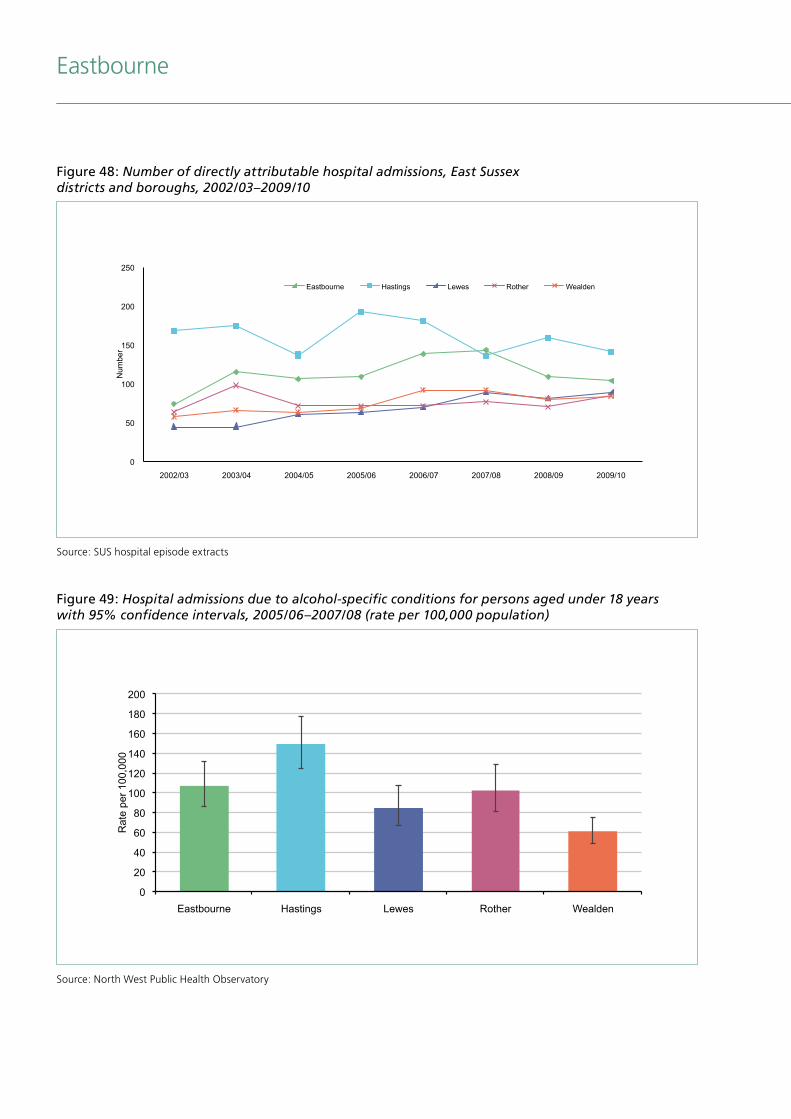
Source: SUS hospital episode extracts
Figure 48: Number of directly attributable hospital admissions, East Sussex districts and boroughs, 2002/03–2009/10
0
50
100
150
200
250
2002/03 2003/04 2004/05 2005/06 2006/07 2007/08 2008/09 2009/10
Num
ber
Eastbourne Hastings Lewes Rother Wealden
Source: North West Public Health Observatory
Figure 49: Hospital admissions due to alcohol-specific conditions for persons aged under 18 years with 95% confidence intervals, 2005/06–2007/08 (rate per 100,000 population)
0
20
40
60
80
100
120
140
160
180
200
Eastbourne Hastings Lewes Rother Wealden
Rat
e pe
r 100
,000
Source: APHO Health Profiles
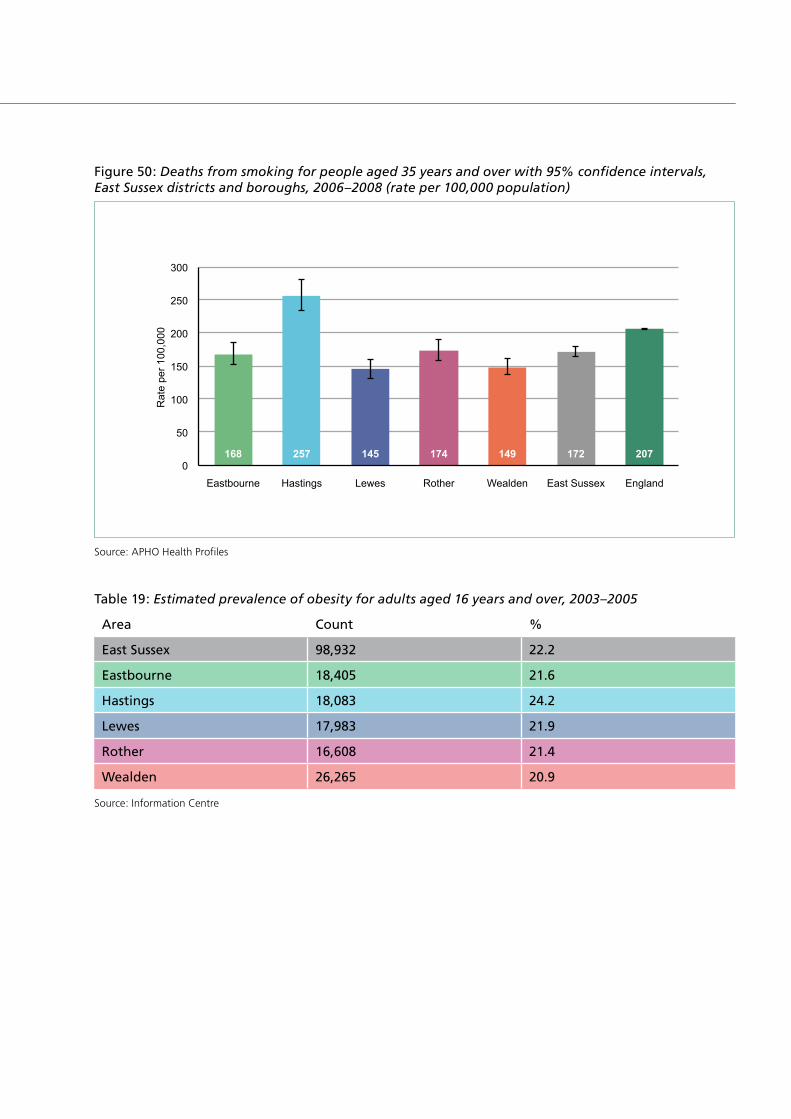
Figure 50: Deaths from smoking for people aged 35 years and over with 95% confidence intervals, East Sussex districts and boroughs, 2006–2008 (rate per 100,000 population)
168 257 145 174 149 172 207 0
50
100
150
200
250
300
Eastbourne Hastings Lewes Rother Wealden East Sussex England
Rat
e pe
r 100
,000
Area Count %
East Sussex 98,932 22.2
Eastbourne 18,405 21.6
Hastings 18,083 24.2
Lewes 17,983 21.9
Rother 16,608 21.4
Wealden 26,265 20.9
Source: Information Centre
Table 19: Estimated prevalence of obesity for adults aged 16 years and over, 2003–2005
Eastbourne
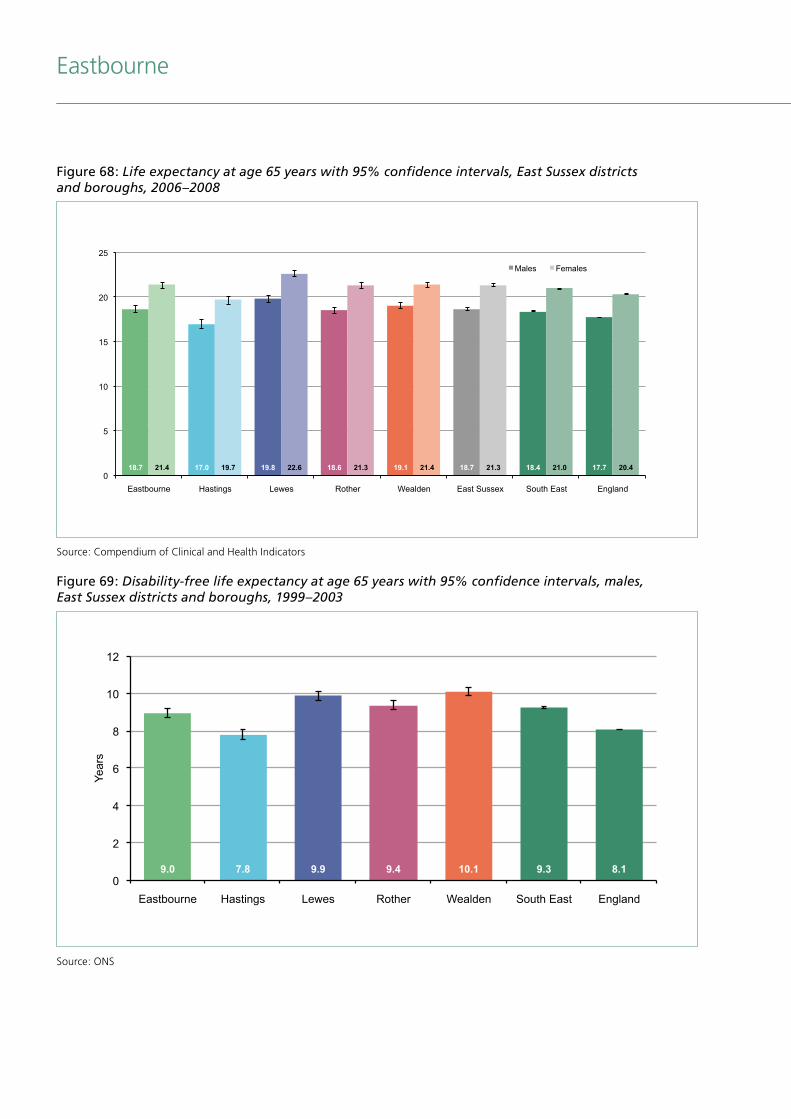
Source: Compendium of Clinical and Health Indicators
Source: ONS
Figure 68: Life expectancy at age 65 years with 95% confidence intervals, East Sussex districts and boroughs, 2006–2008
Figure 69: Disability-free life expectancy at age 65 years with 95% confidence intervals, males, East Sussex districts and boroughs, 1999–2003
18.7 17.0 19.8 18.6 19.1 18.7 18.4 17.7 21.4 19.7 22.6 21.3 21.4 21.3 21.0 20.4 0
5
10
15
20
25
Eastbourne Hastings Lewes Rother Wealden East Sussex South East England
Males Females
9.0 7.8 9.9 9.4 10.1 9.3 8.1 0
2
4
6
8
10
12
Eastbourne Hastings Lewes Rother Wealden South East England
Year
s
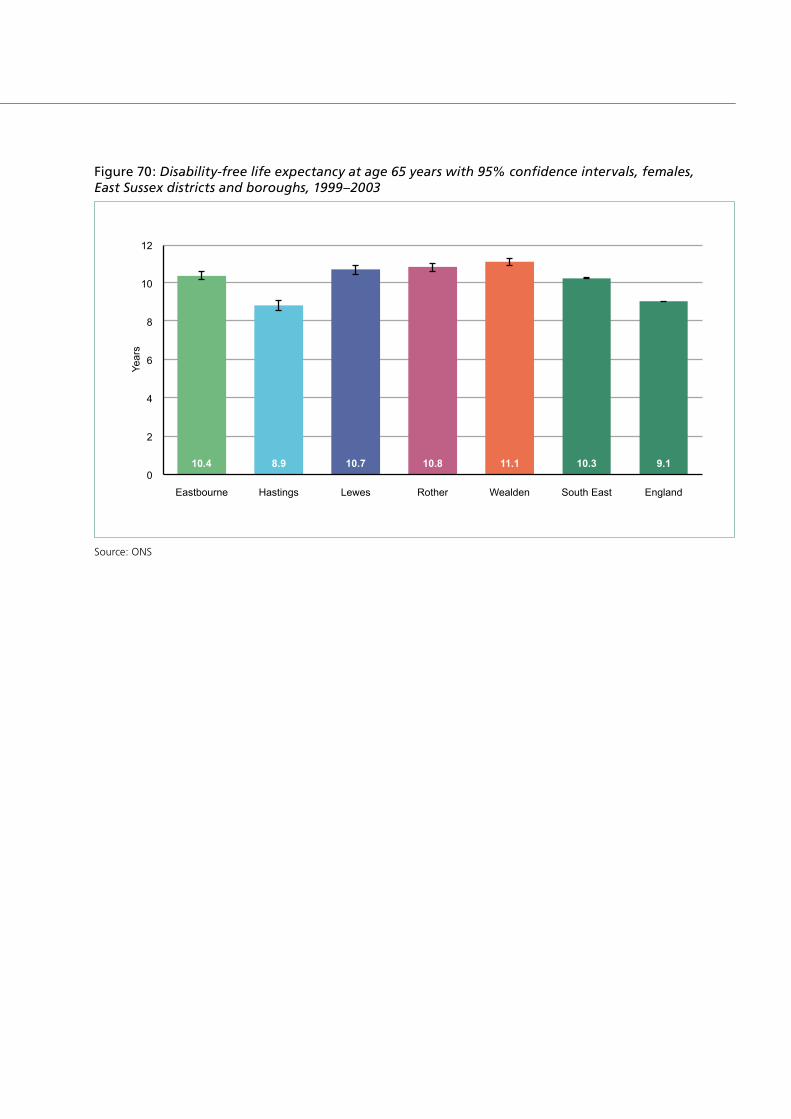
Source: ONS
Figure 70: Disability-free life expectancy at age 65 years with 95% confidence intervals, females, East Sussex districts and boroughs, 1999–2003
10.4 8.9 10.7 10.8 11.1 10.3 9.1 0
2
4
6
8
10
12
Eastbourne Hastings Lewes Rother Wealden South East England
Year
s

Related Documents


