i East Africa Logistics Performance Survey 2012 Cost, Time and Complexity of the East African Logistics Chain Second Edition An Annual Publication of the Shippers Council of Eastern Africa July 2013

Welcome message from author
This document is posted to help you gain knowledge. Please leave a comment to let me know what you think about it! Share it to your friends and learn new things together.
Transcript

i
East Africa Logistics Performance Survey 2012
Cost, Time and Complexity of the East African Logistics Chain
Second Edition
An Annual Publication of the Shippers Council of Eastern Africa
July 2013

ii
Foreword
The 2012 East African Logistics Performance survey reveals significant improvement in port and
corridor efficiency. Ongoing reforms and infrastructure improvements at the port of Mombasa have
yielded significant results as cargo dwell time has dropped from an average 6.5 days in 2011 to 5
days in 2012. At the port of Dar – es – Salaam, cargo dwell time averaged 10 days in 2012. Despite
these improvements, the efficiency at these two ports is still below the internationally acceptable
standards of a maximum 3 days dwell time.
Compared to 2011, corridor efficiency has slightly improved resulting from concerted efforts by
EAC governments to upgrade regional road infrastructure and eliminate non – tariff barriers.
Despite these initiatives, truck turnaround times remain low as an average truck records less than
5,000 KMs per month against an industry practice of 9,000 to 12,000 KMs per month. Corridor
efficiency is still affected by the high regulatory burden of the road transport sector, with numerous
checkpoints (weighbridges, customs and police checks) along the transport corridor. This situation is
compounded by congestion in urban areas along the transport corridor and less than adequate
investment in the rail network to effectively complement the road transport system.
Border crossing times have significantly improved with average border crossing time reducing from
27 hours in 2011 to 3 hours in 2012 at Malaba border post. However, the fruits of these
improvements will not be fully reaped unless there are concerted efforts to harmonize laws and
regulations governing cross border trade and also improve the efficiency of clearance procedures at
border stations by up scaling of ICT infrastructure to enable information sharing on customs data
between the revenue authorities of EAC states.
With regard to East African ports, it is important to note that the efficiency of these ports and the
entire logistics chain is not wholly dependent on the management structure or ports authorities –
KPA and TPA in the case. There exist a number of public and private sector players who have a
role to play in the goods clearance process and the efficiency with which they execute their
obligations plays a critical role in the overall efficiency of ports. Clearing and forwarding agents,
shipping lines, transporters, revenue authorities, standards bodies, the police and inspection agencies
among other entities have in one way or another been an impediment to the smooth clearance of
goods. Cargo owners are not spared either, as their readiness to effectively and efficiently engage in
international trade transactions has also affected the efficiency of the goods clearance process.

iii
By tracking a set of indicators on logistics performance over a six months period, this survey report
attempts to identify specific bottlenecks on the logistics chain and the factors and/or entities
responsible for these bottlenecks. It is evident that such bottlenecks have a huge impact on the cost
of doing business and by extension the competitiveness of the EAC region on the international
market. Unlike in the 2011 edition where focus was mainly on the cost, time and complexity
indicators, the 2012 report has been modified to include a perception indicator which we believe is
necessary in ascertaining the key soft areas that players in the logistics industry believe must be
addressed alongside the conventional bottlenecks.
As we continue to use this report in executing our role as a business advocacy group in logistics and
trade facilitation matters, I acknowledge that the many challenges that affect the efficiency of our
logistics chain manifest themselves as a double edged sword where there exist inefficiencies caused
by logistics service providers (both government and private sector providers such as customs, port
authorities, clearing agents, transporters etc) and those caused by the lack of preparedness by
shippers to effectively fulfill their obligations in international trade. Initiatives to address these
challenges therefore call for concerted efforts and collaboration between the public and private
sectors.
Each year we seek to improve the quality of this report and we therefore call for your views and
comments on how best we can improve this initiative in order to have it effectively serve its purpose
of assisting both public and private sector to make quality policy and business decisions that will
result in an efficient and cost effective logistics environment in East Africa.
Gilbert Langat, CEO

iv
Acknowledgement
The Shippers Council of Eastern Africa (SCEA) gratefully acknowledges the financial support
received from TradeMark East Africa (TMEA) towards preparing this report. In the course of
administering the survey, a number of organizations in the logistics industry supplied useful data that
has formed an integral part of our analysis. Appreciation goes to shipping lines and ship agents,
specifically the Kenya Ships Agents Association, MEARSK Ltd and CMA – CGM who provided
useful insights on port efficiency during the survey. EAC National freight forwarder associations of
and their members including KIFWA (Kenya), UFFA (Uganda), TAFFA (Tanzania), ADR
(Rwanda) and ABADT (Burundi) were very useful in providing cross border transit data.
Transporters and customs offices among others agencies operating at ports, airports and border
stations very kindly provided us with useful data through their willingness to complete the survey
questionnaires. We would like to thank all these organizations for their generosity in supplying this
data, without which this report could not have been written. Lastly, credit goes to the team of
Decoprom Consultants and their leader Constantine Barasa, for the technical input they gave in
developing this report.

v
List of Tables and Figures
Tables Table 3.1 International maritime freight charges and related costs for importing to East Africa Table 3.2 Comparing Dar – es – Salaam and Mombasa port charges Table 3.3 Typical air freight air freight rates for major trade routes Table 3.4 Average cost of transportation to various destinations within East Africa Table 3.5 Incentive based rail freight rates by RVR for the Mombasa Nairobi route Table 3.6 Comparative performance across East African ports Table 3.7 Average truck turnaround time to various destinations in East Africa Table 3.8 Checkpoints per 100 KMs for EAC Partner States Table 3.9 Average border crossing times for popular EAC borders
Figures Figure 3.1 Dar – es – Salaam and Mombasa container throughput Figure 3.2 Contributors to dwell time by percentage Figure 3.3 Checkpoints per 100 kilometers – EAC States Figure 3.4 Average border crossing times for popular EAC borders Figure 3.5 Respondents rating on the efficiency of the goods clearance process Figure 3.6 Level of physical inspection Figure 3.7 Perception of shippers on quality of transport and ICT infrastructure Figure 3.8 Respondents ranking on the quality and competence of logistics services Figure 3.9 Ease with which shippers are able to track their shipment Figure 3.10 Choice of Method of Tracking Shipments Figure 3.11 Delay incidences Figure 3.12 Manner with which disputes with government agencies are handled Figure 3.13 Shippers Perception on Fairness of Customs Valuations Figure 3.14 Percentage respondents who indicate they receive accurate and timely information
when regulations change Figure 3.15 Respondents rating on whether efforts to improve compliance yielded benefits in
expedited customs clearance Figure 3.16 Indication of how often shippers encounter incidences of corruption Figure 3.17 Agencies that are recipients of irregular payments
vi
Abbreviations ADABT Association Burundaise des Agences en Douaneet Transitaires ADR Rwanda Private Sector Federation AEO Authorized Economic Operator CFS Container Freight Station COMESA Common Market for East, Central and Southern Africa DPC Documents Processing Centre EAC East African Community EACCMA East African Community Customs Management Act EACFFPC East Africa Customs and Freight Forwarding Practicing Certificate ECTS Electronic Cargo Tracking Systems FEU Forty Foot Equivalent Units IATA International Air Transport Association ICT Information Communication Technology JKIA Jomo Kenyatta International Airport KEPHIS Kenya Plant Health Inspectorate Services KIFWA Kenya International Freight and Warehousing Association KPA Kenya Ports Authority KSC Kenya Shippers Council LPI Logistics Performance Index MPH Moves per Hour NCTTCA Northern Corridor Transit Transport Coordination Authority NESWS National Electronic Single Window System NTB Non Tariff Barriers OSBP One Stop border Post PTP Port of Tanjung Pelepas in Malaysis RMG Rail Mounted Gantry Crane RTG Rubber Tired Gantry Crane RVR Rift Valley Railways SADC South Africa Development Corporation SCEA Shippers Council of Eastern Africa STS Ship to Shore Gantry Crane TACT Air Cargo Tariffs TAFFA Tanzania Freight Forwarders Association TEU Twenty Foot Equivalent Units TPA Tanzania Ports Authority UFFA Uganda Freight Forwarders Association USD United States Dollar

vii
Contents Foreword ....................................................................................................................................................... ii
Acknowledgement......................................................................................................................................... iv
List of Tables and Figures .............................................................................................................................. v
Abbreviations ................................................................................................................................................ vi
Findings in Brief ............................................................................................................................................ 1
1. About SCEA and the LPI ...................................................................................................................... 5
2. Approach in Measuring Logistics Performance ...................................................................................... 7
3. Key Factors Affecting Logistics Performance ......................................................................................... 8
3.1 Rates and Cost Indicators ................................................................................................................... 8
3.1.1 Maritime Transport ............................................................................................................................ 8
3.1.2 Air Transport ................................................................................................................................... 10
3.1.3 Road Transport ................................................................................................................................ 11
3.1.4 Rail Transport .................................................................................................................................. 12
3.2 Efficiency and Time Indicators ........................................................................................................ 13
3.2.1 East African Ports ............................................................................................................................ 13
3.2.2 Dwell Time ...................................................................................................................................... 15
3.2.3 Truck turnaround time to major destinations in East Africa ............................................................. 17
3.3 Complexity Indicators ...................................................................................................................... 21
3.3.1 Complexity of clearance procedures ................................................................................................. 21
3.3.2 Physical Inspection ........................................................................................................................... 22
3.4 Perception Indicators ....................................................................................................................... 23
3.4.1 Quality of Transport and ICT Infrastructure .................................................................................... 23
3.4.2 Competence and quality of logistics services ..................................................................................... 24
3.4.4 Timely delivery of Shipments ........................................................................................................... 26
3.4.5 Dispute Resolution ........................................................................................................................... 26
3.4.6 Customs Valuations ......................................................................................................................... 27
3.4.7 Access to Timely and Accurate Trade Information ........................................................................... 28
3.4.8 Rewards for Compliance .................................................................................................................. 29
3.4.9 Corruption and Rent Seeking ........................................................................................................... 30
4 Proposals for Reform ........................................................................................................................... 32
5 References ............................................................................................................................................ 36
Annex – List of Respondents .................................................................................................................... 37
1
Findings in Brief
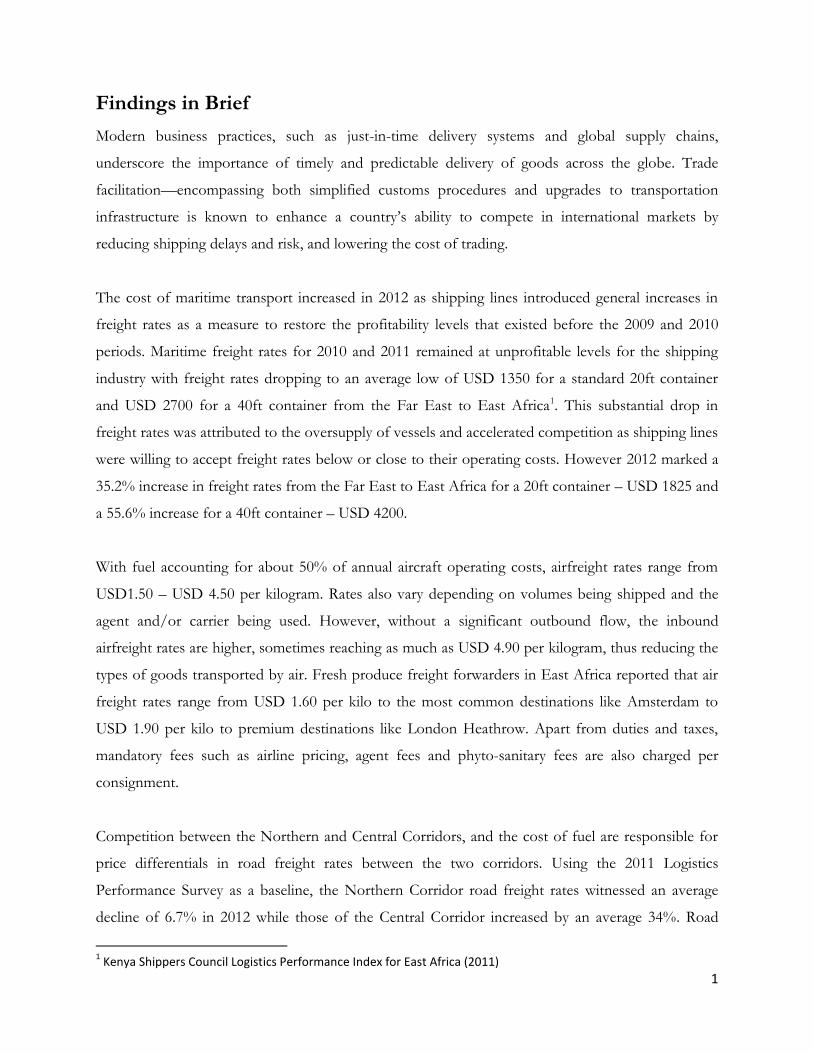
Modern business practices, such as just-in-time delivery systems and global supply chains,
underscore the importance of timely and predictable delivery of goods across the globe. Trade
facilitation—encompassing both simplified customs procedures and upgrades to transportation
infrastructure is known to enhance a country’s ability to compete in international markets by
reducing shipping delays and risk, and lowering the cost of trading.
The cost of maritime transport increased in 2012 as shipping lines introduced general increases in
freight rates as a measure to restore the profitability levels that existed before the 2009 and 2010
periods. Maritime freight rates for 2010 and 2011 remained at unprofitable levels for the shipping
industry with freight rates dropping to an average low of USD 1350 for a standard 20ft container
and USD 2700 for a 40ft container from the Far East to East Africa1. This substantial drop in
freight rates was attributed to the oversupply of vessels and accelerated competition as shipping lines
were willing to accept freight rates below or close to their operating costs. However 2012 marked a
35.2% increase in freight rates from the Far East to East Africa for a 20ft container – USD 1825 and
a 55.6% increase for a 40ft container – USD 4200.
With fuel accounting for about 50% of annual aircraft operating costs, airfreight rates range from
USD1.50 – USD 4.50 per kilogram. Rates also vary depending on volumes being shipped and the
agent and/or carrier being used. However, without a significant outbound flow, the inbound
airfreight rates are higher, sometimes reaching as much as USD 4.90 per kilogram, thus reducing the
types of goods transported by air. Fresh produce freight forwarders in East Africa reported that air
freight rates range from USD 1.60 per kilo to the most common destinations like Amsterdam to
USD 1.90 per kilo to premium destinations like London Heathrow. Apart from duties and taxes,
mandatory fees such as airline pricing, agent fees and phyto-sanitary fees are also charged per
consignment.
Competition between the Northern and Central Corridors, and the cost of fuel are responsible for
price differentials in road freight rates between the two corridors. Using the 2011 Logistics
Performance Survey as a baseline, the Northern Corridor road freight rates witnessed an average
decline of 6.7% in 2012 while those of the Central Corridor increased by an average 34%. Road
1 Kenya Shippers Council Logistics Performance Index for East Africa (2011)

2
freight rates from Mombasa to Juba witnessed the highest decline of 26.5%, followed by Mombasa
to Kigali which recorded a decline of 24.6% and Mombasa – Goma which declined by 21.1%. The
steep decline in road freight rates to Juba is attributed to stiff competition amongst transport
companies who are jostling for South Sudan bound transit cargo which has increased by 83.8%
between 2011 and 2012 at the port of Mombasa2. It is not possible to attribute the reduction in road
freight rates to Rwanda to any significant factor as the share of transit cargo destined for Rwanda at
Mombasa port has fluctuated over the past decade reaching an all time high of 294,000 in 2008 and
subsequently declining over the years except for 2010. On the contrary, the Mombasa Bujumbura,
Mombasa Kampala and Mombasa Nairobi witnessed average increases of 12.5%, 11.8% and 7.7%
respectively.
On the Central Corridor, the highest increase in road freight rates was recorded on the Dar – es –
Salaam Kampala route – 83.5%, while the Kigali – Goma and Kigali – Bujumbura routes witnessed a
28.2% and 27.1% increase respectively. Freight rates on the Dar – es – Salaam – Bujumbura route
declined by an average 3% compared to a similar period in 2011.
The 2012 East African Logistics Performance Index shows significant improvement in logistics
performance. Port and corridor efficiency has drastically improved due to ongoing reforms and
infrastructure improvements at the key East African ports of Mombasa and Dar – es – Salaam. Most
notably, cargo dwell time at the port of Mombasa has dropped from an average 6.4 days in 2011 to 5
days in 2012. At the port of Dar – es – Salaam, cargo dwell time averaged 10 days in 2012. Despite
these improvements, the efficiency at these two ports is still below the internationally acceptable
standards.
Corridor efficiency has significantly improved, with concerted efforts put in place by EAC
governments and its development partners in the upgrading of road infrastructure, establishing One
Stop Border Posts (OSBPs) and implementing a mechanism to eliminate non – tariff barriers.
Despite these initiatives, there have not been any significant improvements in truck turnaround
times as an average truck recorded between 5,000 – 6,000 KMs per month against an international
average of between 9,000 to 12,000 KMs per month. Logistics bottlenecks responsible for this poor
truck turnaround time include inefficiencies at loading and delivery points, traffic congestion within
cities that lie of key transport corridors, bureaucratic processes that are manifest in numerous
2 Kenya Ports Authority Annual Review and Bulletin of Statistics 2012 pp 10
3
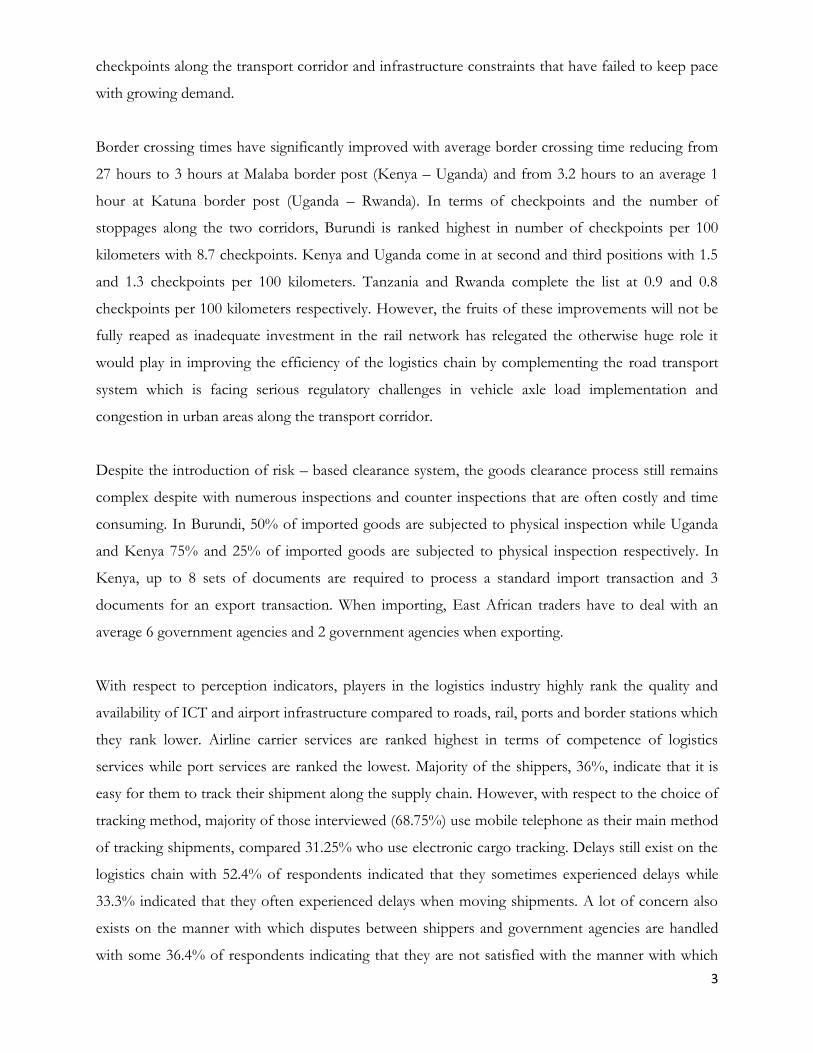
checkpoints along the transport corridor and infrastructure constraints that have failed to keep pace
with growing demand.
Border crossing times have significantly improved with average border crossing time reducing from
27 hours to 3 hours at Malaba border post (Kenya – Uganda) and from 3.2 hours to an average 1
hour at Katuna border post (Uganda – Rwanda). In terms of checkpoints and the number of
stoppages along the two corridors, Burundi is ranked highest in number of checkpoints per 100
kilometers with 8.7 checkpoints. Kenya and Uganda come in at second and third positions with 1.5
and 1.3 checkpoints per 100 kilometers. Tanzania and Rwanda complete the list at 0.9 and 0.8
checkpoints per 100 kilometers respectively. However, the fruits of these improvements will not be
fully reaped as inadequate investment in the rail network has relegated the otherwise huge role it
would play in improving the efficiency of the logistics chain by complementing the road transport
system which is facing serious regulatory challenges in vehicle axle load implementation and
congestion in urban areas along the transport corridor.
Despite the introduction of risk – based clearance system, the goods clearance process still remains
complex despite with numerous inspections and counter inspections that are often costly and time
consuming. In Burundi, 50% of imported goods are subjected to physical inspection while Uganda
and Kenya 75% and 25% of imported goods are subjected to physical inspection respectively. In
Kenya, up to 8 sets of documents are required to process a standard import transaction and 3
documents for an export transaction. When importing, East African traders have to deal with an
average 6 government agencies and 2 government agencies when exporting.
With respect to perception indicators, players in the logistics industry highly rank the quality and
availability of ICT and airport infrastructure compared to roads, rail, ports and border stations which
they rank lower. Airline carrier services are ranked highest in terms of competence of logistics
services while port services are ranked the lowest. Majority of the shippers, 36%, indicate that it is
easy for them to track their shipment along the supply chain. However, with respect to the choice of
tracking method, majority of those interviewed (68.75%) use mobile telephone as their main method
of tracking shipments, compared 31.25% who use electronic cargo tracking. Delays still exist on the
logistics chain with 52.4% of respondents indicated that they sometimes experienced delays while
33.3% indicated that they often experienced delays when moving shipments. A lot of concern also
exists on the manner with which disputes between shippers and government agencies are handled
with some 36.4% of respondents indicating that they are not satisfied with the manner with which

4
complains and disputes are handled. The trading community does not receive adequate and timely
information when regulations change with 56.5% of respondents indicating they rarely receive
accurate and timely information when regulations change. Last but not least, efforts by traders to
become and remain compliant are not adequately being rewarded by regulatory authorities with 75%
of companies interviewed indicating that their efforts to remain compliant are not yielding any
benefits as they are still subjected to the numerous customs procedures. Lastly, the age old problem
of corruption still exists as 61% of respondents revealed they often encountered incidences of
corruption and rent seeking.
Based on the above findings, a number of policy options to improve the performance of the
logistics chain in East Africa are proposed. Among other things, measures to improve efficiency at
ports should not only target the current infrastructure upgrades but also key initiatives to improve
managerial decision making, labor productivity and optimum use of equipment and infrastructure.
Corridor efficiency can be improved through initiatives such as introduction of a risk – based
customs clearance system, infrastructure upgrades to alleviate traffic congestion in major cities along
the transport corridor, implementation of single window systems to eliminate paper processes at
ports and border stations, upscale use of ICT for both government and business and education and
sensitization targeting shippers to encourage them to ensure they are ready to fulfill their tax and
regulatory obligations whenever they commence their international trading activities.

5
1. About SCEA and the LPI
The Shippers Council of Eastern Africa (SCEA) is the umbrella body representing cargo owners in
Eastern Africa. SCEA advocates for a reliable logistics environment that will translate to reduced
cost of doing business to improve the competitiveness of business entities in Eastern Africa. SCEA
provides a platform for shippers to articulate their concerns and demands to logistics service
providers and government regulatory institutions. SCEA, as a private sector body, focuses
exclusively on the development of freight transport policies that will not only be beneficial to the
Kenyan economy but also to the entire EAC economy for growth and development.
The quality and cost of freight transport services play a critical role in the competitiveness of a
country and by extension its economy. A recent study on the efficiency of the Northern Corridor
found out that logistics costs in East Africa account for about 42% of the total value of imports,
making it the region with the highest transport and logistics costs in the world3. Apart from the
direct cost of transportation services, the report highlighted the numerous, often complex and time
consuming trade transactions at ports and border stations that are major contributors to the high
logistics costs in the region.
The World Bank Logistics Performance Index – a global ranking of the logistics performance of
countries along six key indicators, indicates the relative ease and efficiency with which goods can be
moved into and out of a country or region4. Singapore, Hong Kong and Finland are the most
efficient and highest ranked LPI countries at positions 1, 2 and 3 in the 2012 LPI. In Africa, South
Africa, Tunisia and Egypt are the most consistent and highest ranked in logistics performance at
positions 23, 41 and 57 respectively. East African countries have had mixed rankings with Tanzania
ranked the highest at position 88 while Kenya dropped in ranking to position 122. Rwanda and
Burundi followed closely at positions 139 and 155 respectively.
The East Africa Logistics survey targets the perception of users and providers of freight transport
services on the cost, efficiency and complexity of the logistics environment in East African. Unlike
the global LPI ranking of the World Bank, the East Africa logistics survey is designed to identify
specific bottlenecks on the logistics chain, including operational challenges that impede the seamless
flow of goods on the logistics chain. The survey proposes both operational and policy measures that
should be addressed in order to realize an efficient and cost effective logistics environment. 3 Analytical Comparative Transport Cost Study for the Northern Corridor 2010
4 Connecting to Compete. The World Bank Logistics Performance Index 2012
6
If conclusively addressed, the proposals included in this report will result in significant reduction in
transport and logistics related costs and translate to increased competitiveness for the trading
community in East Africa. The survey borrows from the World Bank LPI and seeks to track the
performance of the logistics chain based on key cost, time and complexity indicators. Cost indicators
include international freight and shipping rates, road and rail freight rates from major maritime ports
to the hinterland. Time indicators include dwell time at ports and airports, truck turnaround time
from maritime ports to major destinations in east Africa and border crossing time for selected
borders. Time indicators measure the efficiency of the logistics chain. Complexity indicators
measure the ease and/or difficulty with which trade transactions are undertaken. They include the
number of trade documentation required to fulfill a standard import or export transaction, the
number of government agencies that traders have to deal with for a standard import or export
transaction and the percentage of time that shipments are physically inspected. The survey also rates
the performance of the logistics chain through the perceptions of users and providers of freight
transport services in key logistics services such as the quality of ICT and transport related
infrastructure, the competence and quality of logistics services, ease with which consignments can be
tracked and relative occurrence of delays.
This report provides further analyses on the key factors that affect the logistics performance. Based
on the survey results, an array of policy options are proposed whose successful implementation
would not only result in significant improvement in the performance of the logistics chain in East
Africa, but also translate to reduced trade logistics costs, increased competitiveness of international
trade, increased investment, more employment opportunities and improved livelihoods for the
people of East Africa.
7
2. Approach in Measuring Logistics Performance
A lot has been written and studied about the logistics and trade facilitation environment in East
Africa. In developing the 2012 Logistics Performance Index for East Africa, reference was made to
a number of similar initiatives developed elsewhere. Such initiatives include the World Bank
Logistics Performance Index, the 2011 KSC Logistics Performance Index for East Africa, the
Business Climate Index and the World Bank country economic updates for East Africa.
The World Bank Logistics Performance Index, which compares and ranks 155 countries on their
performance of trade logistics, was a major tool of reference for this survey. While the World Bank
LPI identifies key factors affecting logistics performance, it does not zero in on country specific
factors. Hence the methodology designed for measuring the logistics performance of East Africa is
designed to fill this information gap.
The methodology of the 2012 East Africa LPI is designed to identify the cost time and complexity
of doing business on the logistics chain in East Africa. Out of the targeted a sample size of 200
respondents from East Africa, the survey managed a 34.5% response rate – which widely acceptable
in research to give a global representation. This response rate was affected by low response levels in
Rwanda and Burundi, typically because of language barriers that had to be overcome. Respondents
included freight forwarders, shipping agents, customs brokers, transporters logistics managers and
airline carriers. The survey also sought to gain a perspective on the perception of respondents on the
logistics environment in East Africa.
The results are presented in this report as indicators of cost, efficiency and time indicators,
indicators of complexity and assessment of the logistics environment based on perceptions of users
and providers of freight transport services. The survey proposes key policy recommendations that
East African countries can pursue to improve their logistics performance and boost trade.

8
3. Key Factors Affecting Logistics Performance
The findings of this survey reveal an array of factors that are responsible for the efficiency and cost
structure of the East African Logistics Chain. These findings are presented in the form of cost
indicators, which measure freight charges and other logistics costs; efficiency and time indicators,
which the report limits to the measure of time related to vessel waiting time, port dwell time, truck
turnaround time, complexity indicators which measure the level of complexity in undertaking trade
transactions and perception indicators.
3.1 Rates and Cost Indicators
3.1.1 Maritime Transport
Maritime freight rates for 2010 and 2011 remained at unprofitable levels for the shipping industry
with freight rates dropping to an average low of USD 1350 for a standard 20ft container and USD
2700 for a 40ft container from the Far East to East Africa5. This substantial drop in freight rates was
attributed to the oversupply of vessels and accelerated competition as shipping lines were willing to
accept freight rates below or close to their operating costs. However in 2012, there was a general
increase in freight rates as shipping lines sought to restore the freight rates to the profitable levels
that existed before 2009 and 2010. This marked a 35.2% increase in freight rates from the Far East
to East Africa for a 20ft container – USD 1825 and a 55.6% increase for a 40ft container – USD
4200.
Table 3.1. Typical maritime freight charges and related costs for importing into East Africa – Data
was not available for North and South America
Origin Sea Freight Charges (USD per Container)
Port Charges (USD per Container)
Agent Fees (USD)
Shipping Line Charges (USD)
TEU FEU TEU FEU
North America (USA, Canada, Mexico)
- 4900 160 240 200 250
South America (Brazil, Chile, Argentina)
- 4100 160 240 200 250
Asia Pacific (India, China, Japan, Korea, etc)
1825 4200 160 240 200 250
Europe (Britain, Holland, European Union)
1950 3400 160 240 200 250
Middle East and Africa 1450 2600 160 240 200 250
Source: Leading Liners – MEARSK Line, Ocean Freight and CMA CGM
5 Kenya Shippers Council Logistics Performance Index for East Africa (2011)

9
Port Charges and Fees As table 3.1 indicates, other than the freight rates, there also exist a two component port charge of
shore handling and wharfage payable by shippers when importing and exporting. Mombasa port
charges for imports increased from 150 in 2010 to 160 in 2012 for a standard 20ft container and
from 225 in 2010 to 240 in 2012 for a 40ft container. This change is reflective of an increase in
wharfage charges from USD 60 to USD 70 for a 20ft container and USD 90 to USD 105 for a 40ft
container.
Both the two ports of Dar – es – Salaam and Mombasa retained the same levies in shore handling
charges which at USD 90 for a 20ft container and USD 135 for a 40ft container. However, the
official port fees for Dar – es – Salaam port are on average 74% higher than in Mombasa, due to
higher wharfage charges at Dar – es - Salaam, which are charged at 1.6% of the merchandise value
while they are a flat fee in Mombasa (Table 3.2). The World Bank estimates that the total extra direct
monetary cost of importing through the Dar – es – Salaam port is approximately USD 16 per ton
for container import compared to Mombasa.
Dar – es – Salaam Port Charges (USD/Container) Mombasa Port Charges (USD per Container)
TEU FEU TEU FEU
Wharfage Shore handing
Wharfage Shore handing
Wharfage Shore handing
Wharfage Shore handing
1.6% Ad Valorem
90 1.6% Ad Valorem
135 70 90 105 135
Table 3.2. Comparing Dar – es – Salaam and Mombasa port charges
With respect to exports, Mombasa port charges are USD 45 for a 20ft container and USD 68 for a
40ft container at Mombasa, while at Dar – es – Salaam they remain the same as those of table 3.2
above, with shore handling maintained at USD 90 for a 20ft and USD 135 for a 40ft container.
Shippers also pay an average agent fee of USD 200 and another USD 250 in shipping line charges
when importing and exporting through the two ports. The Kenya Ports Authority (KPA) levies a
stevedoring charge of USD 90 for 20ft container and USD 135 for 40ft container to shipping lines,
while the Tanzania Ports Authority (TPA) charges a stevedoring fee of USD 5.50 per tonne. This
brings the total cost of importing an average shipment worth USD. 15,000 to Mombasa from a
popular port of origin to USD 2435 for a 20ft container and USD 4890 for a 40ft container, while
importing the same shipment to Dar – es – Salaam from the same origin would cost on average
USD 2605 for a 20ft container and USD 5025 for a 40ft container

10
Other Maritime Transport Costs Shippers in East Africa have questioned the legality of the following maritime transport charges and
levies that they believe are adding to the cost of doing business at the port of Mombasa.
a) Verification fee of USD 80 per 20ft container and USD 120 per 40ft container
b) Storage and demurrage fees resulting from inefficiencies on the part of government
regulatory agencies
c) Re - marshalling charge of USD 100 for a 20ft container and USD 150 for a 40ft container
upon the expiry of the 4 days free days period for domestics cargo and 9 days for transit
cargo
d) Port to CFS transfer charge of USD 120 per container that is payable to CFSs operators for
moving domestic cargo from the port to the CFS
On top of the freight charges, some shipping lines also levy a number of charges and surcharges
such as bunker adjustment fee, carrier security charge, documentation fee, emergency risk surcharge,
handling charge and submission of cargo declaration among others. The total average cost of such
charges and surcharges amounts to USD 950 depending on the shipping line and the route taken.
3.1.2 Air Transport
Air Freight Rates
The cost and availability of air freight cargo space is a major determinant of the competitiveness of
horticultural exports from East Africa. As a result of the recent increase in fuel prices, fuel now
accounts for about 50% of the annual cost of operating an aircraft. Because fuel consumption is
roughly proportional to the aircraft weight and the distance flown, the marginal cost for carrying
cargo is computed based on size, weight and the final world destination of the shipment. Rates also
vary depending on volumes being shipped and the agent and/or carrier being used. Since airfreight
rates range from USD1.00 – USD 4.50 per kilogram, the value of air cargo typically exceeds USD
4.00 per kilogram.
The principal exports shipped by air from East African countries are cut flowers, fresh fruits and
vegetables, and electronic parts. Imports shipped by air include a range of high value consumer
goods. However, without a significant outbound flow, the inbound airfreight rates are higher,
sometimes reaching as much as USD 4.90 per kilogram, thus reducing the types of goods
transported by air. Despite the existence of air cargo tariff guidelines (TACT) published by IATA,
pricing of air cargo remains largely dependent on market conditions due to increasing competition
11
amongst carriers. The ability of larger exporters to often negotiate for Blocked Space Agreements
(BSAs) has resulted in cheaper rates and guaranteed uplift of cargo especially for fresh produce
exporters in East Africa. The disadvantage of such agreements however, is that they can lead to dead
freight charges which will be imposed on exporters if space is not fully utilized.
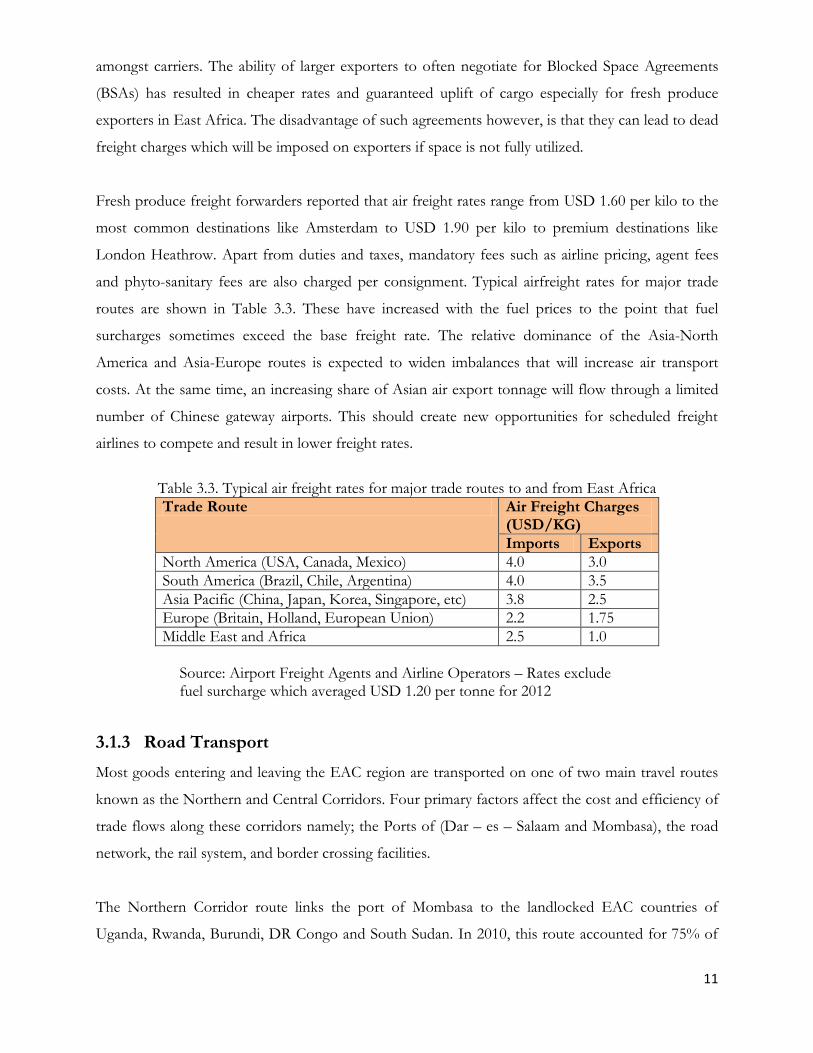
Fresh produce freight forwarders reported that air freight rates range from USD 1.60 per kilo to the
most common destinations like Amsterdam to USD 1.90 per kilo to premium destinations like
London Heathrow. Apart from duties and taxes, mandatory fees such as airline pricing, agent fees
and phyto-sanitary fees are also charged per consignment. Typical airfreight rates for major trade
routes are shown in Table 3.3. These have increased with the fuel prices to the point that fuel
surcharges sometimes exceed the base freight rate. The relative dominance of the Asia-North
America and Asia-Europe routes is expected to widen imbalances that will increase air transport
costs. At the same time, an increasing share of Asian air export tonnage will flow through a limited
number of Chinese gateway airports. This should create new opportunities for scheduled freight
airlines to compete and result in lower freight rates.
Table 3.3. Typical air freight rates for major trade routes to and from East Africa
Trade Route Air Freight Charges (USD/KG)
Imports Exports
North America (USA, Canada, Mexico) 4.0 3.0
South America (Brazil, Chile, Argentina) 4.0 3.5
Asia Pacific (China, Japan, Korea, Singapore, etc) 3.8 2.5
Europe (Britain, Holland, European Union) 2.2 1.75
Middle East and Africa 2.5 1.0
Source: Airport Freight Agents and Airline Operators – Rates exclude fuel surcharge which averaged USD 1.20 per tonne for 2012
3.1.3 Road Transport
Most goods entering and leaving the EAC region are transported on one of two main travel routes
known as the Northern and Central Corridors. Four primary factors affect the cost and efficiency of
trade flows along these corridors namely; the Ports of (Dar – es – Salaam and Mombasa), the road
network, the rail system, and border crossing facilities.
The Northern Corridor route links the port of Mombasa to the landlocked EAC countries of
Uganda, Rwanda, Burundi, DR Congo and South Sudan. In 2010, this route accounted for 75% of
12
the total EAC trade volume. This figure may have changed in recent times based on the
independence of South Sudan and infrastructure improvements in the region. The study was not
able to obtain such data. The Central Corridor connects the Dar – es – Salaam port to the western
and Lake Victoria regions of Tanzania, Burundi and Rwanda.
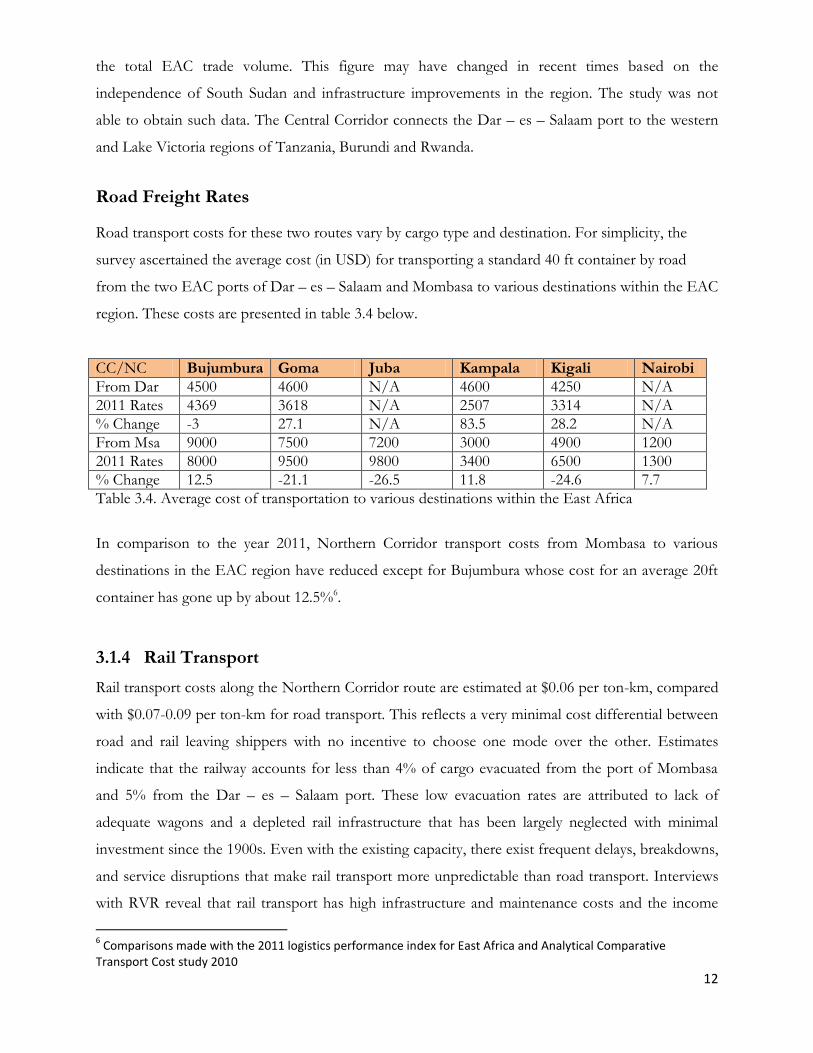
Road Freight Rates
Road transport costs for these two routes vary by cargo type and destination. For simplicity, the
survey ascertained the average cost (in USD) for transporting a standard 40 ft container by road
from the two EAC ports of Dar – es – Salaam and Mombasa to various destinations within the EAC
region. These costs are presented in table 3.4 below.
CC/NC Bujumbura Goma Juba Kampala Kigali Nairobi
From Dar 4500 4600 N/A 4600 4250 N/A
2011 Rates 4369 3618 N/A 2507 3314 N/A
% Change -3 27.1 N/A 83.5 28.2 N/A
From Msa 9000 7500 7200 3000 4900 1200
2011 Rates 8000 9500 9800 3400 6500 1300
% Change 12.5 -21.1 -26.5 11.8 -24.6 7.7
Table 3.4. Average cost of transportation to various destinations within the East Africa
In comparison to the year 2011, Northern Corridor transport costs from Mombasa to various
destinations in the EAC region have reduced except for Bujumbura whose cost for an average 20ft
container has gone up by about 12.5%6.
3.1.4 Rail Transport
Rail transport costs along the Northern Corridor route are estimated at $0.06 per ton-km, compared
with $0.07-0.09 per ton-km for road transport. This reflects a very minimal cost differential between
road and rail leaving shippers with no incentive to choose one mode over the other. Estimates
indicate that the railway accounts for less than 4% of cargo evacuated from the port of Mombasa
and 5% from the Dar – es – Salaam port. These low evacuation rates are attributed to lack of
adequate wagons and a depleted rail infrastructure that has been largely neglected with minimal
investment since the 1900s. Even with the existing capacity, there exist frequent delays, breakdowns,
and service disruptions that make rail transport more unpredictable than road transport. Interviews
with RVR reveal that rail transport has high infrastructure and maintenance costs and the income
6 Comparisons made with the 2011 logistics performance index for East Africa and Analytical Comparative
Transport Cost study 2010

13
from operations is artificially low, because freight rates are restricted to low levels due to politically
assisted competition from the road freight transport sector.
In many advanced economies, the railway is the most dependable means of evacuating cargo from
the port largely due it its reliability and cost. Table 3.5 indicates an incentive based rail freight rates
system being implemented by the Rift Valley Railways (RVR) on the Mombasa – Nairobi route.
Container Category Standard Rate Incentive Rate
20 ft light – (less than 14mt) 675 700
20 ft medium – (14-22mt) 790 800
20 ft heavy – (more than 22mt) 1450 1100
40 ft 1350 1100
Table 3.5. Incentive based rail freight rates by RVR for the Mombasa Nairobi route
3.2 Efficiency and Time Indicators
3.2.1 East African Ports
Over the past decade, the East African ports of Mombasa and Dar – es – Salaam have witnessed
substantial increase in container traffic between. The annual average growth rate of container traffic
through these ports was 12.9% for Dar – es – Salaam and 11.1% for Mombasa per year. Figure 3.1
shows the annual container throughput for these two ports.
Figure 3.1. Dar-es-Salaam and Mombasa ports throughput: 2012 Figures for Dar-es-Salaam are projections
0
100
200
300
400
500
600
700
800
900
1000
2001 2002 2003 2004 2005 2006 2007 2008 2009 2010 2011 2012
Dar-es-Salaam
Mombasa
Thro
ugh
pu
t in
TEU
s

14
Despite this growth in cargo traffic and the growing importance of the two ports in regional and
international trade, the East African ports do not compare favorably with those of Southern Africa,
and even less so with global best practice, in terms of performance (see Table 3.6). The services
provided by East African ports are nearly twice as expensive as those in other global ports.
Performance Indicator Djibouti Mombasa Dar-es-Salaam
Durban PTP Malaysia
Global Standard
Vessel Waiting Time - 0 9 0 0 0
Dwell Time 8 5 10 4 4 3
Truck Turnaround Time in Port (Hrs)
12 6 6 12 0.8 1
Crane Productivity (MPH/Crane)
17 18 14 24 32 25 – 30
Table 3.6. Comparative performance across East African ports
The Performance of individual ports in East Africa varies with Mombasa and Dar-es-Salaam
exhibiting generally good performance that is within global best practices on some indicators.
Mombasa port has shown significant improvement in efficiency with no vessel waiters recorded,
while the Dar – es – Salaam port recorded an average vessel waiting time of 9 days with actual
recordings reaching as high as 25 days as interviews with shipping lines revealed. The capacity
constraints faced at the ports of Mombasa and Dar es Salaam in 2011 and before, coupled with
extremely lengthy import and export procedures, add considerably to the time required to clear
goods. The long detention of goods in ports has become a major obstacle to trade facilitation.
Drivers of Port Productivity
Productivity at the two major East African ports is affected by the following key factors as identified
by respondents:
Equipment Utilization and Labor productivity
For Mombasa, labor productivity still remains low despite heavy investment in equipment
modernization and infrastructure development over the past five years. For instance, ship to shore
gantry cranes recorded an average 18 mph in Mombasa and 14 mph in Dar – es – Salaam against an
internationally acceptable standard of 25 – 30 mph. It is evident that dock workers are not making
the best use of the recently acquired modern and more efficient equipment. In order to improve
berth productivity at Mombasa, some shipping lines have been forced to implement an independent
bonus scheme for dock workers in order to improve vessel turnaround time.

15
Equipment reliability
The Kenya Ports Authority indicates an average equipment reliability rate of 93% for the year 2012
based on the performance of its STS (89.4%), RTGs (89.8%) and RMGs (97.8%). However, this
reliability rate differs with what shipping lines and transporters say. They argue that equipment
breakdown is high. Observations reveal that there is no room for equipment breakdown at the
container terminal since a slight delay of as much as 1 hour of equipment breakdown can cause a
vessel to spend an extra day at the berth. Shipping lines indicate that it cost between USD 20,000
and 30,000 per day to have a vessel delayed for one extra day at the port.
Optimal use of Available Infrastructure
Recent infrastructure developments at Mombasa such as the new container terminal and a new berth
have not necessarily resulted in improved productivity at the container terminal. There still exists
poor yard planning and it is not easy for importers of bulk containers to trace their cargo easily.
Poor traffic flow within the port area occasioned by poor gate operations has resulted in an increase
in truck turnaround within the port area. Entry and exit is now taking as much as 6 hours.
Customs procedures within the port area
Excessive customs procedures within the port area with respect to exports are greatly affecting
vessel turnaround time. The many processes that export containers need to undergo within the port
area means that cut – off times are not strictly being adhered to, thereby affecting the vessel
turnaround time. Exporters and shipping lines have expressed their frustration at the requirement
that all export containers have to undergo scanning despite the fact that stuffing is always supervised
by a customs officer. Clearly, this is a duplication of procedures.
3.2.2 Dwell Time
The dwell time can be defined as the measure of the time elapsed from the time the importer’s or
exporter’s cargo arrives within the port area to the time the goods leave the port area. During the
survey period, Dar – es – Salaam reported an average port dwell time of 10 days while Mombasa
recorded a dwell time of 4 days. Average port dwell time is still much higher than the free day’s
clearance period provided for imports meaning that importers still have to incur storage related
costs. The major factors affecting port dwell time as revealed by the survey include the following:
a) System reliability for ports and customs authorities which is affecting the passing of customs
entries and issuance of release orders. Assuming no system downtime, that the correct
16
declaration is made, and shipper pays duty on time, the survey revealed that entries are
passed on average 30mins. However, the process of using the passed entry to get your cargo
out of the port takes 3-5 days. In efficient ports, this process usually takes less than 1 day.
b) Rigidity of the clearance process means that any errors in declarations and manifests are
heavily punished as shippers who complete a form C11 for rectifying such errors have to
content with an average 7 days to have their entries passed, at which point their cargo has
already started to incur storage and demurrage charges.
c) Complexity in fulfilling documentation for transit related cargo
d) Too many government agencies involved in the goods clearance process
The survey and related literature also reveals that customer behavior, commonly known as the
behavior of shippers (importers and exporters) also plays a major role in port dwell time. The survey
reveals that shippers are often indifferent to long dwell times and that the dwell times recorded in
are mostly related to factors that are dependent on shippers. The demand by importers for longer
dwell time seems to be related to the private sector’s inventory management and business model –
including informal practices, where depending on the product and market conditions, importers
have a strong incentive to use ports as storage farcicalities in order to support predatory pricing
mechanisms. Such factors include the following:
e) Low logistics expertise and cash constrains also explain why some importers have no reason
to reduce their cargo dwell times
f) Some port operators earn large revenues from storage and have no willingness to fight for
reduced dwell time because the inefficiency is charged to the importer and eventually to the
consumer – A strong barrier to entry for international traders
g) Cost minimization and profit maximization may explain such irrational behaviors as
deliberately delaying pick – up of cargo from the port; Especially when the financial cost of
clearing cargo from the port immediately is higher than the potential cost of storage in a
third party facility
h) Monopolist firms are not affected by high logistic costs especially in cases where demand is
inelastic to price and will therefore make no effort to reduce dwell time – Cyclical demand
patterns such as food supplies, cooking gas and sugar
i) Opportunistic pricing where adverse logistics conditions allows a company to justify higher
markups or hold inventories to speculate on higher sale prices

17
Agencies that Contribute to Dwell Time
Figure 3.2 is an indication of the percentage contribution to dwell time by selected agencies
responsible for trade facilitation. Customs and ports authorities are still ranked as the greatest
contributors to cargo dwell time representing 35.1% and 19% respectively.
Figure 3.2. Contributors to port dwell time
3.2.3 Truck Turnaround Time to Major Destinations in East Africa
The survey sought to measure corridor efficiency by ascertaining the truck turnaround time which is
a measure of the time it takes (in days) for a truck to reach various destinations in the EAC region
and return to the original port of loading, Mombasa and Dar – es – Salaam in this case. Key findings
of the survey are that EAC trucks are doing an average 5,000 kilometers per truck per month on
assumption of no breakdown and minimum stoppages along the highway for a well serviced truck.
This means that an average truck can only make 2 trips per month from Mombasa to Kampala,
when the potential to make 3.5 trips is available. In economies with sufficient infrastructure and
efficient trade facilitation systems, the average truck records 12,000 to 15,000 kilometers per month.
The average truck turnaround times to various destinations in East Africa are provided in table 3.7.
Bujumbura Dodoma Goma Juba Kampala Kigali Nairobi
From Dar 12 2.3 22 N/A N/A 11 N/A
From Mombasa
14 4 15 15 10 12 1.2
Table 3.7. Average truck turnaround time to various destinations in East Africa
0
5
10
15
20
25
30
35
40
Sh
ipp
ers
Sh
ipp
ing
lines
Po
lice
Cust
om
s
Insp
ecti
on
age
nci
es
Tra
nsp
ort
ers
Po
rts
Auth
ori
ty
Oth
ers
Per
cen
tage
co
ntr
ibu
tio
n
18
Factors Responsible for Truck Turnaround Time
According to the survey, several factors responsible for the recorded truck turnaround time along
the transport corridor include the following:
Official Checkpoints
There are 8 weighbridges between Mombasa and Kampala on the Northern Corridor, 7 in Kenya
and 1 in Uganda. Besides this, there are numerous other checkpoints related to police and customs
checks. The latest status of elimination of NTBs in the EAC region indicate that Kenya has
committed to reduce road blocks from 36 to 9, Rwanda has removed all road blocks, Uganda has 9
roadblocks between Malaba and Gatuna/Katuna, Tanzania has committed to reduce from 30 to 15
road block between Dar – es – Salaam and Rusumo falls and Burundi has committed to remove all
roadblocks.
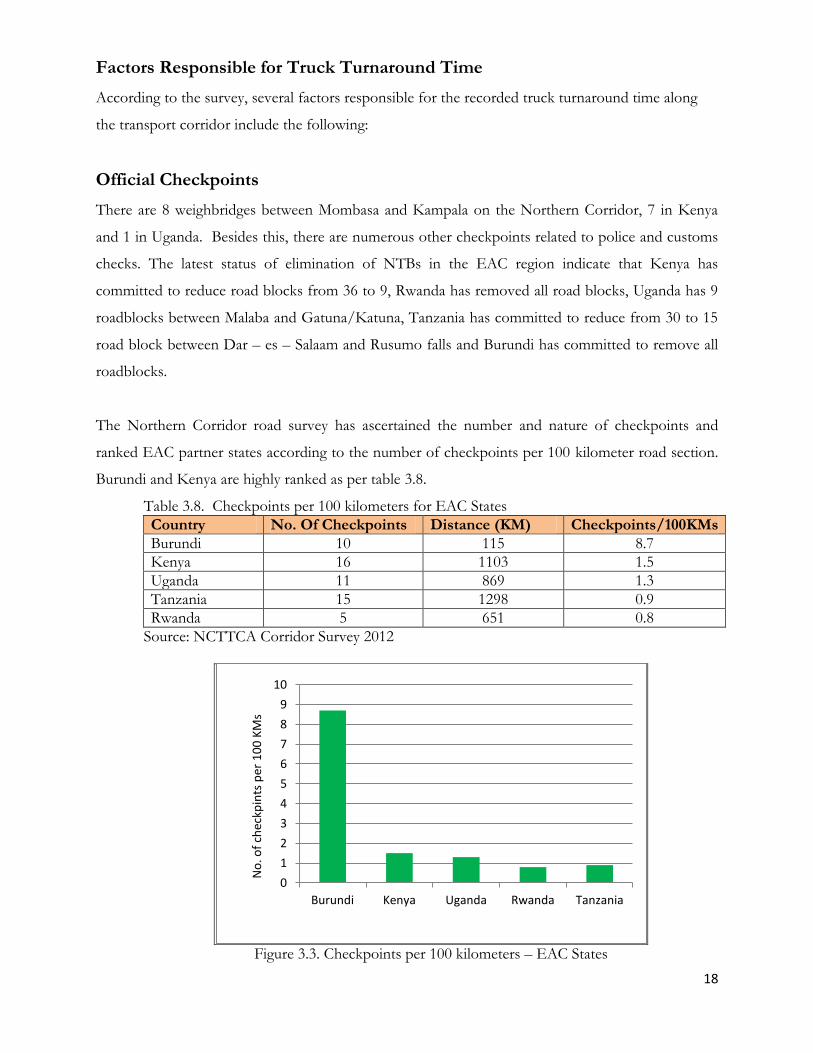
The Northern Corridor road survey has ascertained the number and nature of checkpoints and
ranked EAC partner states according to the number of checkpoints per 100 kilometer road section.
Burundi and Kenya are highly ranked as per table 3.8.
Table 3.8. Checkpoints per 100 kilometers for EAC States
Country No. Of Checkpoints Distance (KM) Checkpoints/100KMs
Burundi 10 115 8.7
Kenya 16 1103 1.5
Uganda 11 869 1.3
Tanzania 15 1298 0.9
Rwanda 5 651 0.8
Source: NCTTCA Corridor Survey 2012
Figure 3.3. Checkpoints per 100 kilometers – EAC States
0
1
2
3
4
5
6
7
8
9
10
Burundi Kenya Uganda Rwanda Tanzania
No
. of
chec
kpin
ts p
er 1
00
KM
s
19
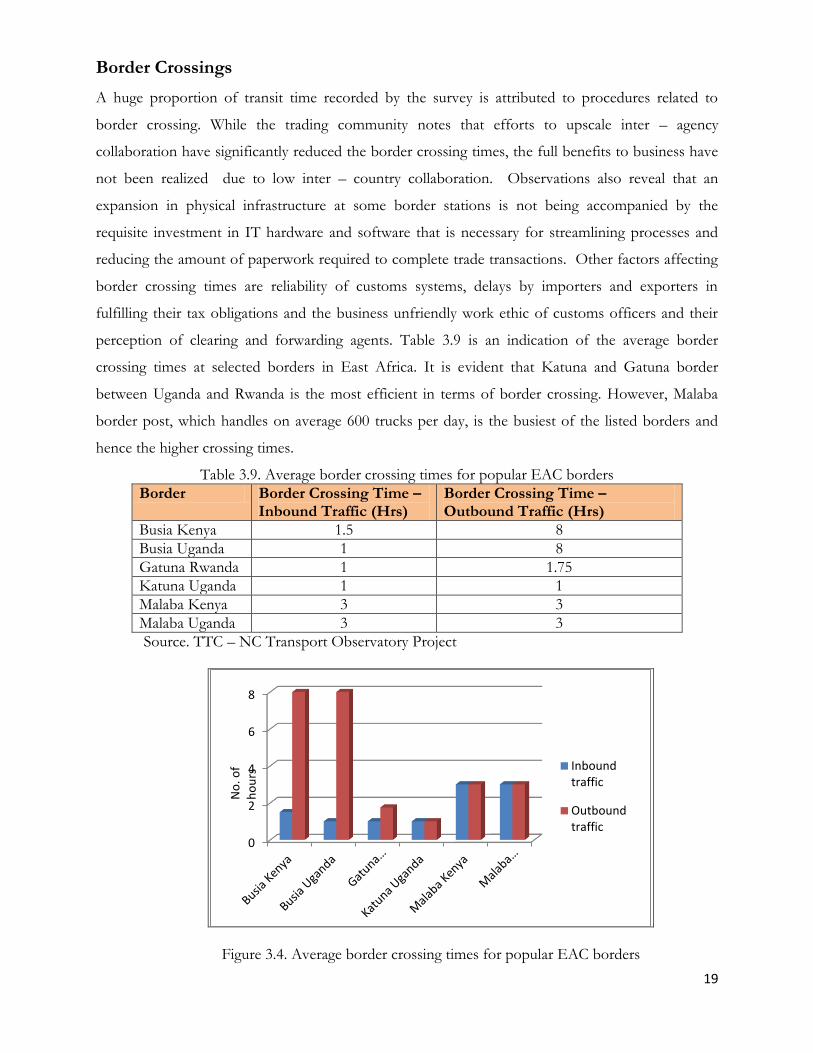
Border Crossings
A huge proportion of transit time recorded by the survey is attributed to procedures related to
border crossing. While the trading community notes that efforts to upscale inter – agency
collaboration have significantly reduced the border crossing times, the full benefits to business have
not been realized due to low inter – country collaboration. Observations also reveal that an
expansion in physical infrastructure at some border stations is not being accompanied by the
requisite investment in IT hardware and software that is necessary for streamlining processes and
reducing the amount of paperwork required to complete trade transactions. Other factors affecting
border crossing times are reliability of customs systems, delays by importers and exporters in
fulfilling their tax obligations and the business unfriendly work ethic of customs officers and their
perception of clearing and forwarding agents. Table 3.9 is an indication of the average border
crossing times at selected borders in East Africa. It is evident that Katuna and Gatuna border
between Uganda and Rwanda is the most efficient in terms of border crossing. However, Malaba
border post, which handles on average 600 trucks per day, is the busiest of the listed borders and
hence the higher crossing times.
Table 3.9. Average border crossing times for popular EAC borders
Border Border Crossing Time – Inbound Traffic (Hrs)
Border Crossing Time – Outbound Traffic (Hrs)
Busia Kenya 1.5 8
Busia Uganda 1 8
Gatuna Rwanda 1 1.75
Katuna Uganda 1 1
Malaba Kenya 3 3
Malaba Uganda 3 3
Source. TTC – NC Transport Observatory Project
Figure 3.4. Average border crossing times for popular EAC borders
0
2
4
6
8
Inbound traffic
Outbound traffic
No
. of
ho
urs

20
Loading Point Inefficiencies
When it comes to loading within the port, trucks are spending up to 6 hours to load for
containerized cargo and 2 days for bulk and conventional cargo. For instance, most of the loading at
the grain bulk handling facility (GBHL) happens at night when the customs department is closed
and transporters have to wait until the following day to load.
Traffic Congestion within Port Cities and Cities along the Transport Corridor
Both the cities of Dar – es – Salaam and Mombasa are heavily congested with huge volumes of truck
traffic entering and leaving the ports. In Mombasa, the heavy traffic between the port exit gates and
Mariakani means that trucks are spending as much as 6 hours to navigate through a 30KMs stretch,
which ordinarily would take 30 minutes. The situation is compounded by narrow roads and single
lane roads between Changamwe and Miritini.
As for cities along the corridor, Nairobi and Eldoret and Kampala are the most notorious in terms
of traffics congestion. Lack of bypass roads in these cities, coupled with single lane roads passing
through Eldoret town mean that trucks are spending an average 5 hours to transit through these
cities at peak hours. Such infrastructure constraints within the port area and major cities along the
transport corridor are responsible for the long truck turnaround times recorded in this survey
Delays related to delivery at destination points
It is taking up to two days for trucks to off load cargo at destination points. This is common for
local and other transit cargo that is destined for bonded warehouses where importers have failed to
fulfill their tax and regulatory obligations when cargo crosses borders and thus trucks experience
unnecessary delays as they await customs clearance.
Transit time within the Port Area
Transit time within port area is a measure of the time when the release order is issued to when the
cargo leaves the port. The survey reveals that transit time within the port area approximately 24
hours with trucks spending as much as 6 hours to enter and leave the port for pickup and delivery.
Importers attribute this long transit time to lengthy documentation procedures and inefficient gate
operations.
21
Bond cancellation for transit cargo
While the use of transit bonds and or guarantees in the EAC central and northern corridors are vital
to deter dumping or to prevent diversion and all other risks associated with movement of transit
goods, the survey reveals that the bond cancellation and acquittal processes are long and
cumbersome taking anything from a few days to months. Such delays leads to loss of business when
a general bond is exhausted and hasn’t been acquitted as the importer or agent can’t cover any more
transit operations.
3.3 Complexity Indicators
Complexity indicators measure the efficiency of the clearing process by the number of documents
required per trade transaction, the number of agencies that shippers have to deal with per trade
transaction and the percentage of shipments that are physically inspected.
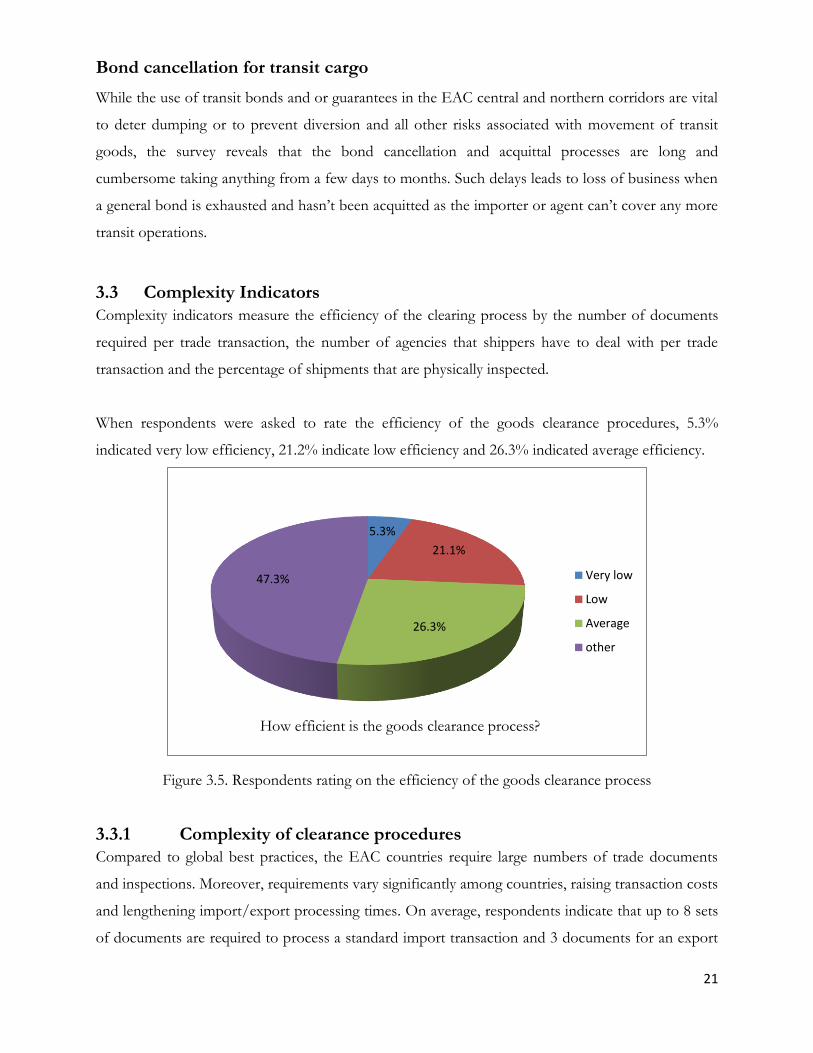
When respondents were asked to rate the efficiency of the goods clearance procedures, 5.3%
indicated very low efficiency, 21.2% indicate low efficiency and 26.3% indicated average efficiency.
Figure 3.5. Respondents rating on the efficiency of the goods clearance process
3.3.1 Complexity of clearance procedures
Compared to global best practices, the EAC countries require large numbers of trade documents
and inspections. Moreover, requirements vary significantly among countries, raising transaction costs
and lengthening import/export processing times. On average, respondents indicate that up to 8 sets
of documents are required to process a standard import transaction and 3 documents for an export
5.3%
21.1%
26.3%
47.3% Very low
Low
Average
other
How efficient is the goods clearance process?
22
transaction. Importers have to deal with an average of 6 government agencies to conclude their
import transactions while exporters have to deal with an average 2 government agencies. In all of
these cases an average triplicate set of documents is required for submission.
Further, the survey also reveals that some government agencies at border stations have the
tendencies to overstep their mandates with the intention to rent seek. A perfect example is the
police department where importers indicate they have often overstepped their mandate by
purporting to perform customs related work.
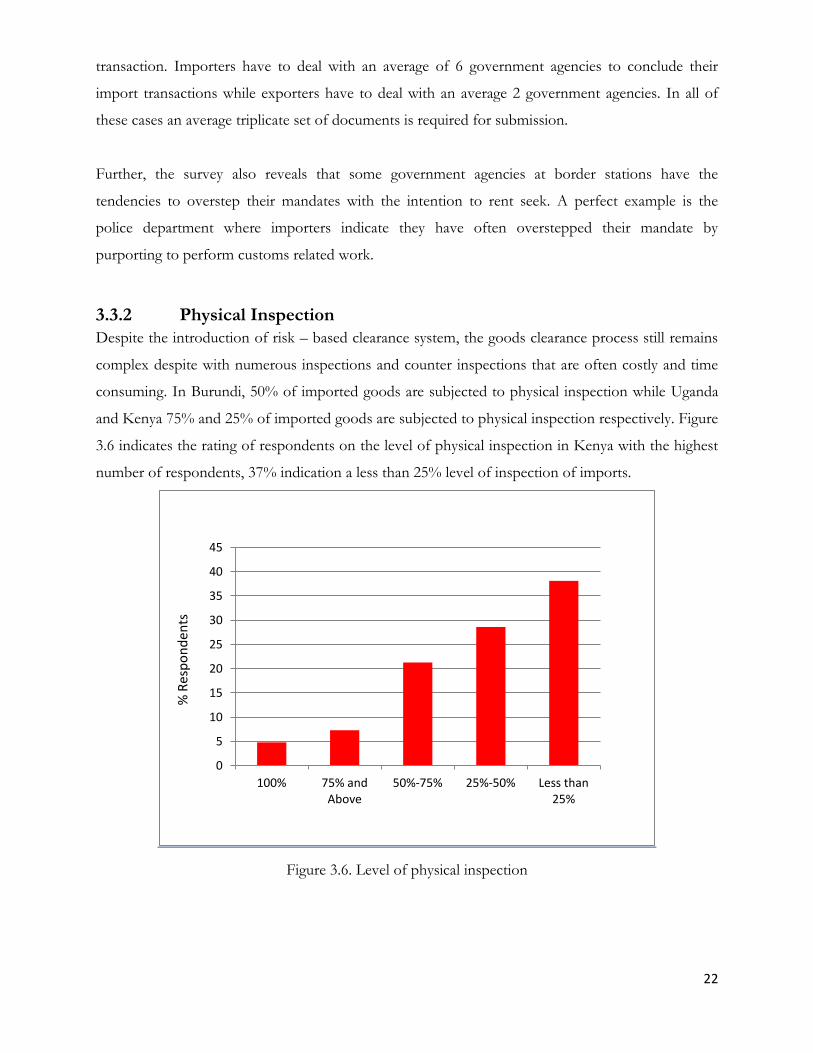
3.3.2 Physical Inspection
Despite the introduction of risk – based clearance system, the goods clearance process still remains
complex despite with numerous inspections and counter inspections that are often costly and time
consuming. In Burundi, 50% of imported goods are subjected to physical inspection while Uganda
and Kenya 75% and 25% of imported goods are subjected to physical inspection respectively. Figure
3.6 indicates the rating of respondents on the level of physical inspection in Kenya with the highest
number of respondents, 37% indication a less than 25% level of inspection of imports.
Figure 3.6. Level of physical inspection
0
5
10
15
20
25
30
35
40
45
100% 75% and Above
50%-75% 25%-50% Less than 25%
% R
esp
on
den
ts
23
3.4 Perception Indicators
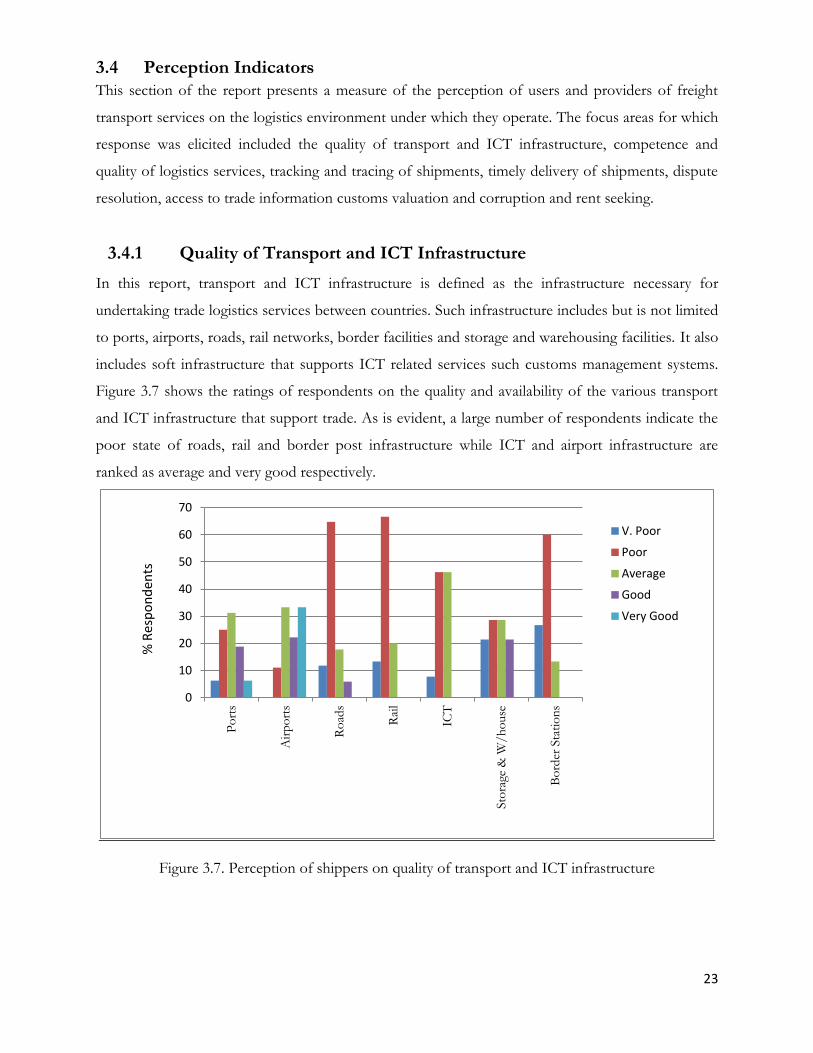
This section of the report presents a measure of the perception of users and providers of freight
transport services on the logistics environment under which they operate. The focus areas for which
response was elicited included the quality of transport and ICT infrastructure, competence and
quality of logistics services, tracking and tracing of shipments, timely delivery of shipments, dispute
resolution, access to trade information customs valuation and corruption and rent seeking.
3.4.1 Quality of Transport and ICT Infrastructure
In this report, transport and ICT infrastructure is defined as the infrastructure necessary for
undertaking trade logistics services between countries. Such infrastructure includes but is not limited
to ports, airports, roads, rail networks, border facilities and storage and warehousing facilities. It also
includes soft infrastructure that supports ICT related services such customs management systems.
Figure 3.7 shows the ratings of respondents on the quality and availability of the various transport
and ICT infrastructure that support trade. As is evident, a large number of respondents indicate the
poor state of roads, rail and border post infrastructure while ICT and airport infrastructure are
ranked as average and very good respectively.
Figure 3.7. Perception of shippers on quality of transport and ICT infrastructure
0
10
20
30
40
50
60
70
Po
rts
Air
po
rts
Ro
ads
Rai
l
ICT
Sto
rage
& W
/h
ouse
Bo
rder
Sta
tio
ns
V. Poor
Poor
Average
Good
Very Good
% R
esp
on
den
ts

24
3.4.2 Competence and quality of logistics services
A country’s ability to trade globally will highly depend on the extent to which its international traders have
access to competent and high quality logistics services. Majority of the respondents ranked the quality of
logistics services in East Africa as average. When responses zero in on mode of transport and or logistics
services, airline operators are ranked highly in term of their competence and quality of services as 58% of the
respondents rank their services as high. Port and rail services are ranked highest in terms of their low quality
and competence in service delivery. Figure 3.8 is a ranking on the quality and competence of logistics services
in East Africa.
Figure 3.8. Respondents ranking on the quality and competence of logistics services
3.4.3 Tracking and Tracing Shipments
Security of cargo on the logistics chain is a major concern for shippers. In order to have the security
of their cargo ascertained and guaranteed at every point on the supply chain, shippers not only
insure their cargo under transit but also use tracking mechanisms. The ability of importers and
exporters to track and trace shipments from the point of loading to discharge therefore becomes a
vital component of shipping.
Respondents were asked to indicate the ease with which they could track their shipments while in
transit. Majority of the respondents, 36%, indicate that it is easy for them to track their shipment
0
10
20
30
40
50
60
70
80
90
Ship
pin
g lin
e se
rvic
es
Cle
arin
g an
d F
orw
ard
ing
Rai
l Ser
vice
s
Po
rt S
ervi
ces
Air
line
Car
rier
Ser
vice
s
Ro
ad T
ran
spo
rt S
ervi
ces
Low
Average
High
Per
cen
tage
of
resp
on
den
ts

25
along the supply chain as indicated in figure 3.9. However, with respect to the choice of tracking
method, majority of those interviewed (68.75%) use telephone as their main method of tracking
shipments, against a 31.25% who use electronic cargo tracking.
The high cost of installation and maintenance is responsible for the low adoption and utilization of
electronic cargo tracking systems is. Shippers are using more of cell phones to communicate with
service providers as they track their cargo because this is a more readily available and cost effective
mode of communication. However, this mode of communication is doing little to promote trade in
the region due to the high cross border calling rates. Figure 3.10 is an indication of the share of
choice of tracking modes by shipper.
Figure 3.9. Ease with which shippers are able to track their shipment
Figure 3.10. Choice of Method of Tracking Shipments
0
5
10
15
20
25
30
35
40
Very Easy Easy Fairly Easy Not Easy
Per
cen
tage
of
resp
on
den
ts
31.25%
68.75%
Electronic cargo tracking
Telephone

26
3.4.4 Timely delivery of Shipments
Apart from the cost of freight transport, shippers are increasingly using timely delivery of shipments
as an important factor in making their decision on choice of service providers. In modern
international trade, a supplier’s reputation highly depends on his/her ability to deliver products to
clients in timely fashion. In this survey, 52.4% of respondents indicated that they sometimes
experienced delays while 33.3% indicated that they often experienced delays when moving
shipments (Figure 3.11). The reasons for delays as identified by respondents included the following:
Customs officers are poorly facilitated to allow them effectively discharge their duties. For
instance, clearing agents in most cases have to provide transport to customs officers to
enable them go to the site and perform verifications
Less than readily available pre – shipment inspection services at ports of origin with
respondents indicating it sometimes takes up to a month for importers to have their
shipment inspected.
Figure 3.11. Delay incidences
3.4.5 Dispute Resolution
More than 36.4% of respondents indicate that they are not satisfied with the manner with which
complains and disputes are handled. The current customs arbitration system/process is lengthy and
cumbersome and often results in unnecessary cost of demurrage as shippers await decisions to be
reached. In order to avoid storage and demurrage costs, shippers are faced with no choice but to pay
0
10
20
30
40
50
60
Never Rarely Sometines Often Always
Per
cen
tage
of
resp
on
den
ts
27
the required taxes and wait for a refund incase the decision goes their way, but in most cases
customs authorities takes too long to pay such refunds.
The current dispute resolution mechanism is insufficient as it only considers disputes related to
customs valuations (the tax tribunal) and not disputes with other government agencies and logistics
service providers such as KPA, CFS operators, KEPHIS and so on. There is need for an acceptable
and faster dispute resolution mechanism
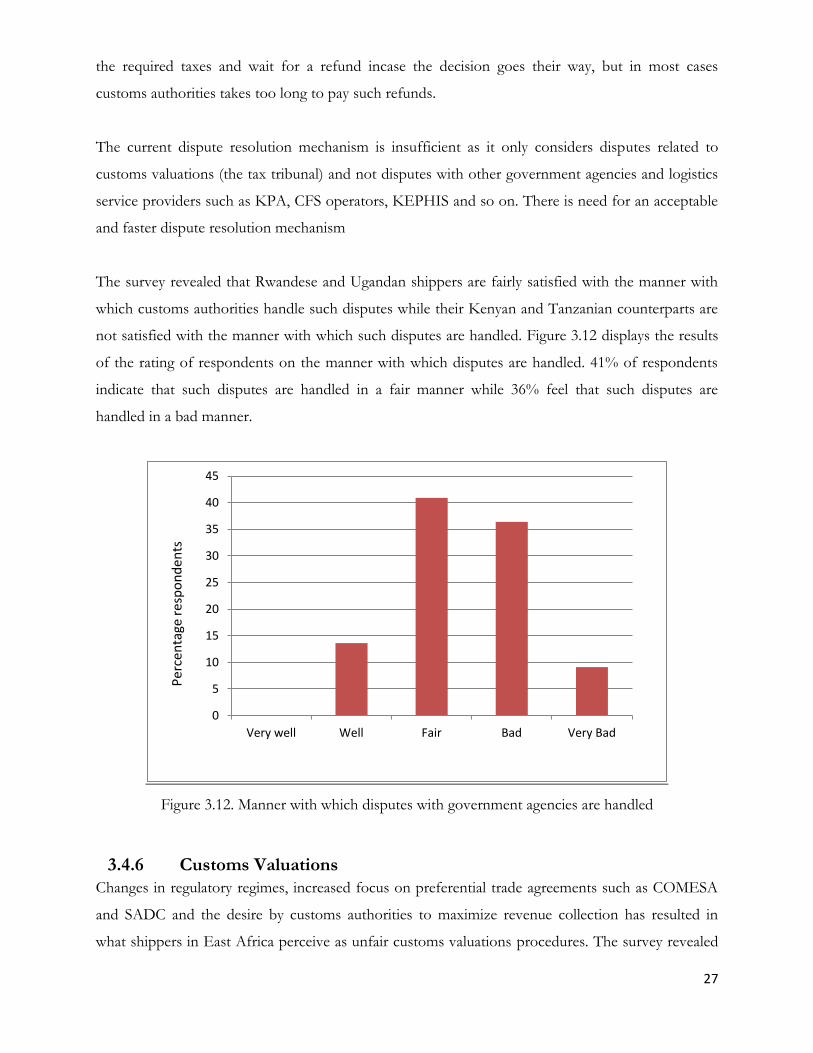
The survey revealed that Rwandese and Ugandan shippers are fairly satisfied with the manner with
which customs authorities handle such disputes while their Kenyan and Tanzanian counterparts are
not satisfied with the manner with which such disputes are handled. Figure 3.12 displays the results
of the rating of respondents on the manner with which disputes are handled. 41% of respondents
indicate that such disputes are handled in a fair manner while 36% feel that such disputes are
handled in a bad manner.
Figure 3.12. Manner with which disputes with government agencies are handled
3.4.6 Customs Valuations
Changes in regulatory regimes, increased focus on preferential trade agreements such as COMESA
and SADC and the desire by customs authorities to maximize revenue collection has resulted in
what shippers in East Africa perceive as unfair customs valuations procedures. The survey revealed
0
5
10
15
20
25
30
35
40
45
Very well Well Fair Bad Very Bad
Per
cen
tage
res
po
nd
ents

28
that customs valuations are done against no known benchmarks making it difficult for the trading
community to know if it is a fair valuation. As figure 3.13 will show, a paltry 4.6% of respondents
believe that customs valuations are always conducted in a fair manner, while 50% and 27.3% of
respondents believe that such valuations are sometimes and/or rarely conducted in a fair manner.
Figure 3.13. Shippers Perception on Fairness of Customs Valuations
3.4.7 Access to Timely and Accurate Trade Information
The survey sought to find out how compliance to trade regulations by the trading community is
affected by their access to information on regulations and formalities such as documentation
requirements for trade and fee schedules for permits and other trade logistics services.
The findings reveal that majority of the EAC institutions publish trade related information on their
websites and supplement this through public notices in the print media, at their offices, entry and
exit ports and border stations. However with all these initiatives, majority of the trading community
in East Africa still lack sufficient access to trade information that is crucial to assist them fully
comply with regulations. Moreover, the trading community does not receive adequate and timely
information when such regulations change as 56.5% of respondents indicate they rarely receive
accurate and timely information when regulations change. Figure 3.14 displays this in detail.
0
10
20
30
40
50
60
Always Often Sometimes Rarely Never
Per
cen
tage
of
resp
on
den
ts

29
Figure 3.14. Percentage respondents who indicate they receive accurate and timely information when
regulations change
3.4.8 Rewards for Compliance
Programmes that are geared towards streamlining trade processes through effective risk
management techniques have been known to yield significant benefits to both government and
business. Such techniques separate importers into compliant and non – compliant categories which
allows the customs authorities to focus scarce resources to potentially unsafe and high risk entities
and individuals, thereby effectively protecting a country’s border while maximizing revenue
collection.
Implementation of such a system also allows business to have a working partnership with customs
while improving compliance and trade facilitation. It is therefore in the interest of business to put in
place measures to enhance compliance to trade rules and regulations in order to reap the benefits of
faster clearance of goods. However, in this survey, when asked if efforts to demonstrate high levels
of compliance yielded benefits in terms of expedited customs clearance, 75% of the respondents
said no as indicated in figure 3.15 below.
0
10
20
30
40
50
60
Always Often Sometimes Rarely Never
Per
cen
tage
of
resp
on
den
ts
30
Figure 3.15. Respondents rating on whether efforts to improve compliance yielded benefits in
expedited customs clearance
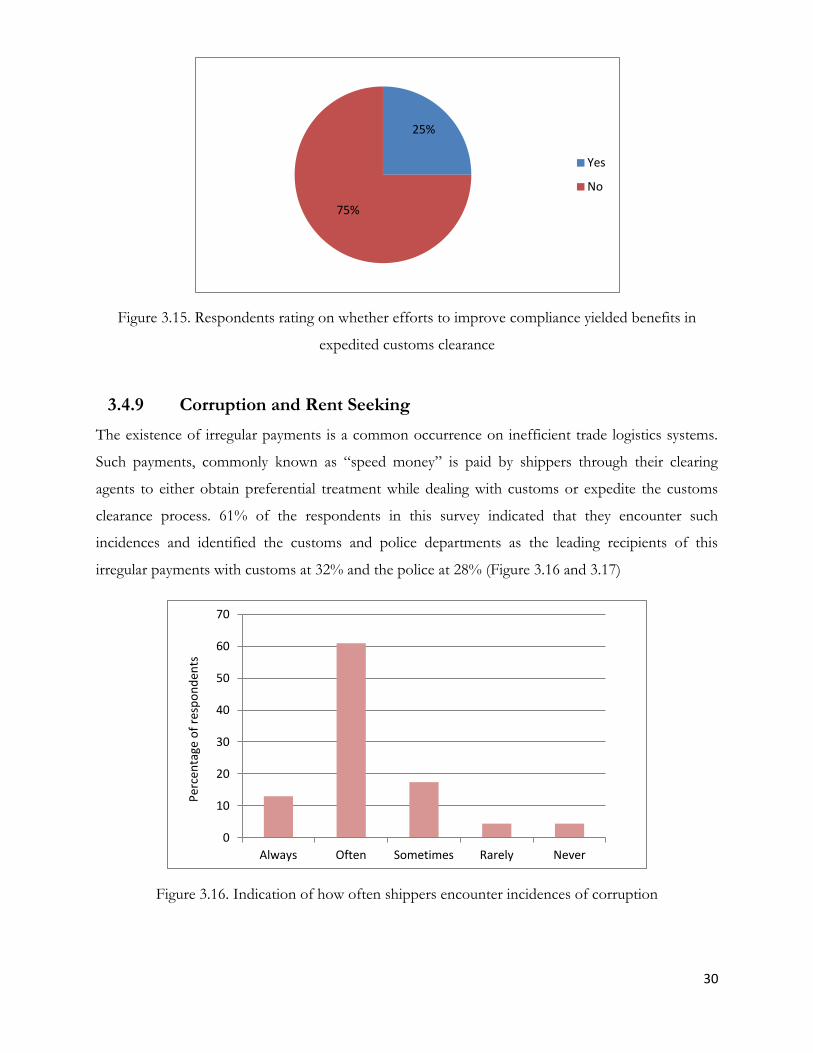
3.4.9 Corruption and Rent Seeking
The existence of irregular payments is a common occurrence on inefficient trade logistics systems.
Such payments, commonly known as “speed money” is paid by shippers through their clearing
agents to either obtain preferential treatment while dealing with customs or expedite the customs
clearance process. 61% of the respondents in this survey indicated that they encounter such
incidences and identified the customs and police departments as the leading recipients of this
irregular payments with customs at 32% and the police at 28% (Figure 3.16 and 3.17)
Figure 3.16. Indication of how often shippers encounter incidences of corruption
25%
75%
Yes
No
0
10
20
30
40
50
60
70
Always Often Sometimes Rarely Never
Per
cen
tage
of
resp
on
den
ts

31
Figure 3.17. Agencies that are recipients of irregular payments
0
5
10
15
20
25
30
35
Per
cen
tage
of
resp
on
den
ts

32
4 Proposals for Reform
Efficient port operations are critical to improving the movement of goods in and out of countries.
Inefficient ports are known to raise trading costs and weaken the export competitiveness of
domestic firms on international markets. Adequate infrastructure, such as berthing facilities,
wharves, and cranes, are also main determinant of the efficiency of port operations. To improve
productivity in the EAC ports of Dar – es – Salaam and Mombasa based on the findings of this
survey, EAC governments need to pursue the following measures:
Productivity at Ports
Increased investment in infrastructure and port equipment should be complemented by targeted
efforts to improve labor productivity through the following measures:
a) Appropriate and relevant training targeting terminal managers and dock workers to institute
a culture change attitude that will enable them view their ports as national and regional assets
that can be used to spur growth and eliminate poverty and suffering.
b) Implement a rewards and sanctions programme that recognizes terminal managers and dock
workers with exceptional performance and sanctions non – performers.
c) Implement the best practices model of a Port Manager to whom all port operators will
report in order to ensure efficiency and accountability in service delivery
d) Re – engineer the current KPA – CFS business model to ensure that CFSs get a fair share of
the terminal handling charges that KPA levies. This will improve efficiency and discourage
CFSs from devising unfair practices of revenue generation
e) Automate container terminal operations to realize efficient yard operations.
f) Implement an integrated port security system that will eliminate unnecessary procedures
required at pick – up and delivery points within ports
Corridor Efficiency
a) Implement an affordable and easily available Electronic Cargo Tracking System that will
eliminate the need for stopping trucks for physical customs checks along the transport
corridor. This can be complemented by giving truck owners the incentive to invest in ECTS.
b) Consider the option of managing axle weight limits by implementing a standards system to
be complied with at the port of loading to ensure all cargo arriving at the port is within the
regulated weight limits. This will eliminate the need for multiple weighbridges along the
corridor.

33
c) Upscale infrastructure developments within major cities on the transport corridor that are
targeted at easing traffic congestion. Construction of by – passes will eliminate the need for
transit trucks to pass through major on the Northern Corridor. Dualing the section between
Changamwe and Miritini in Mombasa would be one such initiative to decongest the city of
Mombasa
d) Fast track implementation of a National Electronic Single Window System (NESWS) to
eliminate the need for escorts and customs checkpoints along the corridor for transit cargo.
e) Upgrade ICT infrastructure for trade that is targeted at improving system stability of national
revenue authorities while also providing a platform to upscale exchange of revenue
information between national revenue authorities. This will significantly reduce border
crossing times and transit times within territories.
f) Put in place measures to support 24/7 operation at ports, and border stations. Such
measures include security and availability of private sectors services such as banking and
insurance services.
g) Education and sensitization targeting shippers to encourage them to ensure they are ready to
fulfill their tax and regulatory obligations whenever they commence their international
trading activities
h) Promoting better coordination among border agencies, introducing mandatory pre-arrival
customs declarations, and establishing enabling IT systems are some of the steps
recommended to improve efficiency of border crossing and for lowering the cost of trade
logistics.
Goods Clearance Process
Improve the goods clearance process by implementing the following measures.
a) There is need to establish and implement an elaborate risk management system that will not
only allow for faster clearance for compliant shippers but also eliminate the need for physical
inspection.
b) There is a need to put in place a dispute resolution mechanism that is not only widely
acceptable by industry players but also one which is independent and efficient in discharging
outcomes in order to avoid the many storage charges incurred by shippers when disputes are
being resolved. A permanent solution to disputes is the enactment of a Tax Appeals
Tribunal Act to replace the current Tax Arbitration Committees at treasury. This should be
complemented by well documented procedures and guidelines for settlement of tax disputes.

34
c) Allow for pre-arrival customs declaration and processing at ports and border stations to
promote customs declarations prior to cargo arrival. This will require amendment to section
34 of the East African Community Customs Management Act (EACCMA) to facilitate pre –
arrival declarations.
d) To facilitate faster decision making, crucial customs services must be removed from the
DPC at customs headquarters in Nairobi and decentralized to ports and other entry and exit
points.
e) Open Access for Rail – Open access means giving any suitably qualified railway operator the
chance to provide a service over anyone’s route. Allowing open access is known to remove
the image of monopoly which railways have carried for a long time and stimulate
competition, which should drive down prices and improve service quality and reliability.
Other recommendations necessary for improving the logistics environment will include the
following:
Customs Valuation
Improve transparency in customs valuation by investing in an import compliance software system
which is a web based software tool that provides worldwide access for import classification
information. Such software is also designed to enable electronic auditing of import entries and
facilitates timely post entry amendments, if required. In addition, it provides a link to customs
brokers thereby enabling real time exchange of accurate information. This can be complemented by
implementing effective internal controls mechanisms such as appropriate training targeting both
business and customs officers to ensure they speak the same business language and develop local
accountability.
Shaping Customer Behavior to Increase Compliance
Effective solutions to logistics efficiency will be achieved when customs reforms and infrastructure
developments are supported and complemented by efforts to break the private sectors short term
collusive strategies and providing incentives for government authorities in trade facilitation to reduce
delays. Private sector associations such as the Shippers Council of Eastern Africa (SCEA) can
complement these efforts by sensitizing their members and the larger trading community on the
importance of logistics efficiency and the proper calculation of total logistics costs.
35
Recognizing and Rewarding Compliant Traders
Customs authorities and by extension EAC governments have a lot to gain through increased
compliance by the trading community. Not only will authorities reduce the time and resources spent
on inspections but also revenue collection will be increased through faster and more efficient
clearance processes that will boost trade. However before this can be reached, compliant traders
must be seen to benefit from their efforts by being allowed expedited customs clearance devoid of
time consuming inspections.
Corruption and Rent Seeking
Providing easy access to documentation requirements and tariff schedules can significantly reduce
transaction costs for importing and exporting by reducing cases of rent seeking in situations where
the trader does not have sufficient knowledge of his/her obligations. Simple, accountable and
efficient trade procedures are necessary to promote trade, support economic growth, create jobs and
attract private investment in East Africa.
Risk – based Inspections
The requirement for imports and exports to undergo inspection is based on tax, security,
environment, health and safety regulations among others. But the manner with which such
inspections are carried out can turn out to be a serious obstacle to trade. Modern customs
administrators have developed systems for establishing risk profiles that help them determine the
nature and extent of physical inspections. This means that physical inspections are applied
depending on the potential risk of consignments. Despite the investment in equipment such as
scanners, to allow of such an arrangement, a lot of time and resources are still being spent on
physical inspection and the requirement for 100% scanning. EAC governments must adopt the
principal of risk – based inspection if they are to reduce the time spent in clearing goods at ports and
border stations, to ensure that the level of physical inspection is reduced to an international best
practise of 5%.

36
5 References 1. Africa Development Bank. State of Infrastructure in East Africa. April 2013
2. Business Climate Index
3. Connecting to Compete. World Bank Logistics Performance Index 2012
4. Kenya Ports Authority Annual Review and Bulletin of Statistics 2012
5. Northern Corridor Transport Observatory Project. NCTTCA 2012
6. Tanzania Ports Authority Tariff Book of Port Dues Charges 2012
7. The 2011 Logistics Performance Index for East Africa. A Kenya Shippers Council
Publication. 2012
8. United States International Trade Commission. Trade Facilitation in the East African
Community. Recent Developments and Potential Benefits. July 2012
9. World Bank Africa Trade Policy Notes. Policy Note No. 35. February 2013
10. World Bank country economic updates for East Africa
11. World Bank Group. Air Freight: A Market Study with Implications for Landlocked
Countries. 2010
12. www.eastafricancorridors.org

37
Annex – List of Respondents
Name Institution Contact Details
Kenya
1. Charles Kogambi Interfreight East Africa [email protected]
2. Brian Ngwiri East African Tea Trade Association [email protected]
3. Job Kemboi Sigino Group [email protected]
4. Willy Kidima Ugandan Rep at Mombasa Port [email protected]
5. Josepho Weloba Inchcape Shipping Services [email protected]
6. Imtiaz Dada Airflo Ltd [email protected]
7. Phoebe Aboke Mezaal Logistics Ltd [email protected]
8. Habil Kalasani Kenya Transport Association [email protected]
9. Jacqueline Chege Kuehne Nagel [email protected]
10. Philip Mainga Kenya Railways Corporation [email protected]
11. Thierry Mutombo COMESA Secretariat [email protected]
12. Patricia Odida Kenya Airways Cargo [email protected]
13. Nandan Warrier PIL Kenya Ltd [email protected]
14. Sreeni Prabhu CMA CGM [email protected]
15. Moses Mulama DB Schenker [email protected]
16. Ruth Musyoka Blue Seal Freighters [email protected]
17. Gerald Kusienya Rai Plywoods [email protected]
18. Steve Felder MEARSK Ltd [email protected]
19. Boaz Makomere KIFFWA [email protected]
20. Munir Tabith Mombasa Maize Millers [email protected]
Uganda
21. Twinomugisha Ben Twin and Sons Ltd [email protected]
22. Uganda National Transporters Association (+256)414 254652
23. Anthony Mukiibi MTN Ltd [email protected]
24. Duncan Tumwikize Alfa Forwarders [email protected]
25. Benjamin Olaktan Havala Clearing and Forwarding Ltd [email protected]
26. Eliud Paul Agility Logistics +256 772490957
27. Maramu Charles Care Agencies +254 772643728
28. Bernard Kasigwa Uganda Freight Forwarders Assoc [email protected]
Tanzania
29. Ally Alexander EAC Secretariat [email protected]
30. DB SChenker Tanzania [email protected]
31. Hussein Wandwi Tanzania Transport Operators Assoc [email protected]
32. Waheed Saudin Sami Agencies Ltd [email protected]
33. Margaret Juliet Mupeki Haluliers [email protected]
34. Dickson Mwansasu Arya Logistics Ltd +255714133997
35. Cun Alberto Tanzania Freight Forwarders Assoc +255 754264365
Rwanda
36. New Preference Clearing Agency +250 788481030
37. All Port Freight Ltd +250 788303418
38. Kenlloyd Logistics [email protected]
39. Rwanda Freight Forwarders – ADR [email protected]
40. Swift Freight International (Burundi) SA [email protected]
41. Rapid Cargo Services [email protected]
42. Exrol Logistics Rwanda SARL [email protected]

38
Burundi
43. Swift Freight International (Burundi) SA +257 217750
44. Tanganyika Freight Agency Ltd +257 22256100
45. Spedag Burundi Sarl +257 22222092
46. Brucargo Airfreight Burundi +257 22242715
47. Freight in Time (BU) Ltd +250 5510-4587
48. Al Heelam (BU) Ltd +257 242646
49. Association Burundaise des Agences en Douaneet Transitaires (ABADT)
Related Documents