U.S. Department of Health and Human Services Assistant Secretary for Planning and Evaluation Office of Disability, Aging and Long-Term Care Policy EASING THE BURDEN OF CAREGIVING: THE IMPACT OF CONSUMER DIRECTION ON PRIMARY INFORMAL CAREGIVERS IN ARKANSAS August 2003

Welcome message from author
This document is posted to help you gain knowledge. Please leave a comment to let me know what you think about it! Share it to your friends and learn new things together.
Transcript
U.S. Department of Health and Human ServicesAssistant Secretary for Planning and EvaluationOffice of Disability, Aging and Long-Term Care Policy
EASING THE BURDEN OFCAREGIVING:
THE IMPACT OF CONSUMERDIRECTION ON PRIMARY
INFORMAL CAREGIVERS INARKANSAS
August 2003

Office of the Assistant Secretary for Planning and Evaluation
The Office of the Assistant Secretary for Planning and Evaluation (ASPE) is theprincipal advisor to the Secretary of the Department of Health and Human Services(HHS) on policy development issues, and is responsible for major activities in the areasof legislative and budget development, strategic planning, policy research andevaluation, and economic analysis.
The office develops or reviews issues from the viewpoint of the Secretary, providing aperspective that is broader in scope than the specific focus of the various operatingagencies. ASPE also works closely with the HHS operating divisions. It assists theseagencies in developing policies, and planning policy research, evaluation and datacollection within broad HHS and administration initiatives. ASPE often serves acoordinating role for crosscutting policy and administrative activities.
ASPE plans and conducts evaluations and research–both in-house and through supportof projects by external researchers–of current and proposed programs and topics ofparticular interest to the Secretary, the Administration and the Congress.
Office of Disability, Aging and Long-Term Care Policy
The Office of Disability, Aging and Long-Term Care Policy (DALTCP) is responsible forthe development, coordination, analysis, research and evaluation of HHS policies andprograms which support the independence, health and long-term care of persons withdisabilities–children, working age adults, and older persons. The office is alsoresponsible for policy coordination and research to promote the economic and socialwell-being of the elderly.
In particular, the office addresses policies concerning: nursing home and community-based services, informal caregiving, the integration of acute and long-term care,Medicare post-acute services and home care, managed care for people with disabilities,long-term rehabilitation services, children’s disability, and linkages between employmentand health policies. These activities are carried out through policy planning, policy andprogram analysis, regulatory reviews, formulation of legislative proposals, policyresearch, evaluation and data planning.
This report was prepared under contract #HHS-100-95-0046 between the U.S.Department of Health and Human Services, Office of the Assistant Secretary forPlanning and Evaluation, Office of Disability, Aging and Long-Term Care Policy and theUniversity of Maryland. For additional information about this subject, you can visit theDALTCP home page at http://aspe.hhs.gov/daltcp/home.shtml or contact the ASPEProject Officer, Pamela Doty, at HHS/ASPE/DALTCP, Room 424E, H.H. HumphreyBuilding, 200 Independence Avenue, S.W., Washington, D.C. 20201. Her e-mailaddress is: [email protected].
EASING THE BURDEN OF CAREGIVING:THE IMPACT OF CONSUMER DIRECTION ON PRIMARY
INFORMAL CAREGIVERS IN ARKANSAS
Leslie FosterRandall BrownBarbara Phillips
Barbara Lepidus Carlson
Mathematica Policy Research, Inc.
August 2003
Prepared forOffice of Disability, Aging, and Long-Term Care Policy
Office of the Assistant Secretary for Planning and EvaluationU.S. Department of Health and Human Services
Contract #HHS-100-95-0046
i
ACKNOWLEDGMENTS
Numerous individuals at Mathematica Policy Research, Inc. (MPR) made thispaper possible. Nora Paxton and Amy Zambrowski programmed the analysis, andValerie Cheh provided thoughtful comments on an earlier draft. Walter Brower editedthe paper, and William Garrett produced it.
The paper has also benefited greatly from the thoughtful comments andsuggestions of individuals outside MPR. In particular, we appreciate input from theCash and the Counseling Demonstration and Evaluation management team, includingKevin Mahoney, Mark Meiners, Lori Simon-Rusinowitz, and Marguerite Schervish andothers at the Centers for Medicare & Medicaid Services (CMS); and external reviewersA.E. Benjamin (UCLA School of Social Welfare), Rosalie Kane (University of MinnesotaSchool of Public Health), and Robyn Stone (Institute for the Future of Aging Services).
The opinions presented here are those of the authors and do not necessarilyreflect those of the funders (The Robert Wood Johnson Foundation, and the U.S.Department of Health and Human Services, Office of the Assistant Secretary forPlanning and Evaluation), the Cash and Counseling National Program Office, thedemonstration states, or CMS.

ii
EXECUTIVE SUMMARY
Informal caregivers provide vital personal care and other supportive services toMedicaid beneficiaries who have physical dependencies, so promoting their well-beingis an important policy objective. Caregiver well-being could be greatly affected by theamount, types, and quality of paid supportive services that beneficiaries receive inaddition to informal help. This study compares the experiences of informal caregiversunder two models of paid supportive services that were tested in the Arkansas Cashand Counseling demonstration. Under the experimental model, Medicaid beneficiariescould receive an allowance to direct their own services. Under the traditional model,beneficiaries relied on home care agencies for services.
A Rigorous Design and Comprehensive Survey Data Provided DefinitiveEvidence.
Our analysis included 1,433 caregivers who were providing the most informalassistance to their care recipients when recipients were randomly assigned to directtheir own personal care services as treatment group members, or to rely on agencyservices as control group members. Care recipients in the treatment group could altertheir service use and potentially affect their primary informal caregivers by hiring themas workers (as over half did); by using them as representative decision makers; byadjusting the amount, timing, and types of services they used; by buying assistivedevices or home modifications; and by using the program’s counseling and fiscalservices to varying extents.
We constructed outcome variables from computer-assisted telephone interviewsthat were conducted with caregivers between February 2000 and April 2002, about 10months after random assignment. We asked caregivers, who typically were related totheir care recipients, factual questions about the frequency, amounts, timing, and typesof the assistance they provided, and about their labor force participation and income. We asked for their opinions about the quality of their relationships with care recipients;their satisfaction with care recipients’ personal care services; and their own emotional,financial, and physical well-being, and health. To estimate program effects, wecompared these outcomes for caregivers of treatment group members with those for thecaregivers of control group members, while controlling for care recipient and caregivercharacteristics.
Caregivers Reported Greater Well-Being Under Consumer Direction.
On average, the caregivers of self-directing care recipients (treatment groupmembers) provided fewer hours of assistance than their control group counterparts

iii
provided, and they were less likely to report high levels of physical, financial, andemotional strain. Moreover, the caregivers of self-directing care recipients worried lessabout insufficient care and safety and were more likely to be very satisfied withrecipients’ overall care arrangements. These caregivers were also less likely to reportthat caregiving impinged on their privacy, social lives, and job performance. Comparedwith control group caregivers, those who helped self-directing care recipients said theythemselves were in better health and were less likely to report that their health washarmed by caregiving. Not surprisingly, these caregivers were also much more likelythan their control group counterparts to be very satisfied with their own lives.
These findings indicate that when Medicaid beneficiaries wish to direct theirpersonal care services and do so, both they and their primary informal caregiversbenefit markedly. Improvement comes about because some informal caregiversbecome paid workers and because beneficiaries make service arrangements that seemto alleviate caregiver burden. In both cases, the benefits to caregivers, Medicaidbeneficiaries, and perhaps the Medicaid program, are substantial.
1
INTRODUCTION
Most adult Medicaid beneficiaries who have physical dependencies receive far more support with activities such as eating, bathing, housekeeping, and shopping from family members and other informal caregivers than they receive from paid sources (U.S. Department of Health and Human Services 2002). Though informal caregiving is often inherently rewarding for those who provide it, it can also be emotionally, physically, and financially burdensome. If caregiver burden becomes debilitating, it could imperil caregivers’ health, hasten Medicaid beneficiaries’ entry into nursing homes, and increase public costs (Doty 1997).
The amount, types, and quality of personal care and other “supportive services”
that Medicaid beneficiaries receive from paid sources, such as government-licensed home care agencies, is likely to have a major impact on caregiver burden and well-being. If agencies do not provide enough services to beneficiaries, the responsibility to do so may fall to informal caregivers. If agency services are unreliable or inconveniently timed, providing back-up assistance may curtail caregivers’ labor force participation, privacy, and free time. Caregivers may also experience emotional strain if they worry about beneficiaries’ safety and security while agency workers are in their homes.
Consumer-directed programs, in which Medicaid beneficiaries control the budget
for their supportive services, could profoundly affect the informal caregivers who help them most. Whether those effects are for good or ill is of great interest to policymakers. This is particularly true as the Federal Government and states seek to avoid unnecessary nursing home placements, an endeavor that informal caregivers help make possible by supplying more supportive services than government could afford.
Cash and Counseling, an innovative model of consumer direction, has been
implemented as a three-state demonstration designed to weigh the advantages and disadvantages of allowing Medicaid beneficiaries to assume more responsibility for the supportive services they may need. This paper presents estimates of program effects on primary informal caregivers (those providing the most unpaid supportive services at baseline) from Arkansas’s Cash and Counseling demonstration, the first of three such demonstrations to enroll and randomly assign Medicaid beneficiaries to direct their own services or to rely on agencies as usual. Arkansas’s consumer-directed program, known as IndependentChoices, was designed for elderly and nonelderly adults.
2
BACKGROUND
A New Model of Medicaid Personal Assistance About 1.2 million people receive supportive services in their homes through state
Medicaid plans or home- and community-based waiver services programs (LeBlanc et al. 2001; and Kitchener and Harrington 2001).1 Under state plans, services are restricted largely to human assistance with personal care and homemaking and typically are provided by licensed home care agencies. These agencies recruit, train, schedule, and supervise the aides or attendants who assist beneficiaries. Under waiver programs, a variety of other services, such as adult day care, assistive devices, and home modifications, can be offered in addition to in-home aide services. However, coverage of these additional services is often limited, and someone other than the beneficiary (namely, a case manager) decides whether they are needed. In contrast to these traditional service models, states are increasingly offering Medicaid beneficiaries and their families the opportunity to obtain personal care from individual providers (Velgouse and Dize 2000). This alternative is known as “consumer-directed” care, as Medicaid beneficiaries who use individual providers assume the employer’s role of hiring, managing, and possibly terminating their workers (Eustis 2000).
Cash and Counseling is an expanded model of consumer-directed care in that it
provides a flexible monthly allowance that Medicaid beneficiaries, as consumers, can use to hire their choice of workers, including relatives, and to purchase other services and goods as states permit. Cash and Counseling requires consumers to develop plans showing how they would use the allowance to meet their personal care needs and provides counseling and fiscal assistance to help them plan and manage their responsibilities. Consumers who are unable or unwilling to develop spending plans or manage their care themselves may designate a representative, such as a family member, to help them or do it for them. These features make Cash and Counseling adaptable to consumers of all ages and with all types of impairments.
With funding from The Robert Wood Johnson Foundation and the Office of the
Assistant Secretary for Planning and Evaluation of the U.S. Department of Health and Human Services, and with waivers from the Centers for Medicare & Medicaid Services, the Cash and Counseling Demonstration and Evaluation was implemented in three states--Arkansas, Florida, and New Jersey. Because their Medicaid programs and political environments differed considerably from each other’s, the demonstration states were not required to implement a standardized intervention, but they had to adhere to the basic Cash and Counseling tenets summarized above. The resulting programs differed in their particulars, so each is being evaluated separately, by Mathematica Policy Research, Inc. (MPR).
1 Because some people receive services from more than one program, the total number of users may be overestimated.
3
Cash and Counseling in Arkansas
Arkansas designed IndependentChoices as a voluntary demonstration for adults aged 18 or older who were eligible for personal care services (PCS) under the state’s Medicaid plan.2 It implemented the demonstration to assess the demand for and practicability of consumer-directed personal assistance in the state. It also hoped the program would be better than agencies were at serving beneficiaries during non-business hours and in rural parts of the state, where agencies and workers were scarce (Phillips and Schneider 2002). To permit a rigorous evaluation of the program’s impacts, all eligible and interested beneficiaries were randomly assigned either to the demonstration’s treatment group to direct their own services as IndependentChoices consumers, or to its control group to rely on agency services. Enrollment and random assignment began in December 1998 and continued until the evaluation target of 2,000 enrollees (about 11 percent of Arkansas PCS users) was met, in April 2001.
While they were deciding whether to participate in the demonstration, interested
beneficiaries were told what their monthly allowance would be should they be assigned to the treatment group, and those who would use a representative decision maker were asked to name one. (The average allowance was $320 a month, based on care plans recommending an average of 47 hours of paid services.) In addition, Arkansas required beneficiaries to agree that they would use agency services should they be assigned to the control group. Those who decided to enroll completed a baseline telephone interview and were then randomly assigned by MPR.
After random assignment, the experiences of the treatment and control groups
diverged. Control group members continued relying on agency services or, if newly eligible for Medicaid PCS, received a list of home care agencies to contact for first-time services. Treatment group members were contacted by an IndependentChoices counselor, who helped them develop acceptable written plans for spending their allowance.
As IndependentChoices consumers, treatment group members could use their
allowance to hire workers (except spouses or representatives) and to purchase other services or goods related to their personal care needs, such as supplies, assistive devices, and home modifications. They were required to keep receipts for all but incidental expenditures, which could not exceed 10 percent of the allowance. With very few exceptions, IndependentChoices consumers chose to have the program’s fiscal agents maintain their accounts, write checks, withhold taxes, and file their tax returns.
2 To receive Medicaid PCS, an Arkansan must (1) be categorically eligible for Medicaid; (2) live in his or her own residence or a community-based residence, group or boarding home, or residential care facility; and (3) have physical dependency needs related to the activities of daily living and a physician’s prescription for personal care (Arkansas Medicaid Program 1998). Slightly more than 18,000 Medicaid beneficiaries received personal care services in Arkansas in 1998, when Cash and Counseling was introduced (Nawrocki and Gregory 2000).

4
Many also called upon program counselors for advice about recruiting, training, and supervising workers. In addition to helping consumers or their representatives manage these responsibilities, counselors monitored consumer satisfaction, safety, and use of funds through initial home visits, monthly telephone calls, semiannual reassessments, and reviews of spending plans, receipts, and workers’ time sheets (Schore and Phillips 2002).3
3 Counselors were authorized to approve spending plans that adhered to the state’s list of pre-approved goods and services. For other goods and services, counselors sought special state approval on consumers’ behalf.
5
EXPECTED EFFECTS OF INDEPENDENTCHOICES ON PRIMARY INFORMAL CAREGIVERS
To our knowledge, no recent empirical research has examined the effects of consumer direction on informal caregivers. Existing literature describes the population of informal caregivers and their care recipients, examines associations between caregiver burden and the characteristics of caregivers and care recipients, or evaluates the use and effectiveness of various caregiver support programs. A study of one such program, in California, found that informal caregivers who chose to hire their own respite workers were more satisfied with the quality of their respite care than were caregivers who opted for agency-based respite (Feinberg and Whitlach 1997). Unlike that study, this one uses an experimental design and examines caregiver outcomes when care recipients exercise choice.
Under Cash and Counseling, care recipients could change their PCS use in a
number of ways that could affect their primary informal caregivers. They could hire their primary informal caregivers as paid workers or designate them as representatives. They could adjust the amount and timing of assistance provided by all or any of their paid and unpaid caregivers, as well as purchase assistive devices and home modifications. Finally, they could use the counseling and fiscal services offered by the demonstration program to varying extents. These changes, in turn, could affect:
• The amount, timing, and types of assistance provided by primary informal caregivers
• Caregivers’ relationships with care recipients • Caregivers’ satisfaction with their care recipients’ PCS • Caregivers’ own emotional, physical, and financial well-being
These outcomes could be positively affected if, as IndependentChoices
consumers, care recipients began paying their primary informal caregivers and lessened caregivers’ financial burden; if they began paying other caregivers and required less-frequent, less-inconvenient, or fewer hours of assistance from their primary informal caregivers; if they replaced agency workers who may have been unsatisfactory with caregivers of their choice; or if they purchased assistive devices that increased their independence and eased caregivers’ physical strain.
On the other hand, IndependentChoices could make matters worse rather than
better for primary informal caregivers. Negative effects could arise if having to perform activities previously carried out by agency workers creates stress or hardship, or if caregivers become paid workers and find that payment strains their relationships with care recipients. Caregivers may also suffer if they become representatives and find that managing the monthly allowance is burdensome and that the program’s counseling or fiscal services are inadequate. Finally, if they remain unpaid, informal caregivers might resent that others were hired or might object to how others perform their duties.

6
METHODS Data Collection and Sample
Data for this analysis were collected through two computer-assisted telephone surveys. The first survey was conducted with Medicaid beneficiaries who participated in the demonstration, the second with their primary informal caregivers. Between December 1998 and April 2001, the 2,008 Arkansas demonstration participants (or their proxy respondents) completed a baseline interview immediately before they were randomly assigned to the treatment or control group. We used this baseline interview to identify the informal caregivers eligible to be subjects for this analysis. To do so, we asked participants who had informal caregivers to name the one who provided the most unpaid help in the week before the interview. About 10 months later, between February 2000 and April 2002, we attempted to interview these “primary informal caregivers.” Caregiver interviews were completed by 1,433 people--84 percent of the eligible caregivers associated with treatment group members, and 82 percent of the eligible caregivers associated with control group members. To preserve the comparability of the two groups of caregivers and obtain a complete picture of their experiences, we conducted interviews with caregivers even if their care recipients were deceased or, in treatment group cases, disenrolled from IndependentChoices.4 We did not allow proxies to respond to the caregiver interview.
Outcome Measures and Control Variables Outcome measures, drawn from the caregiver interviews, were both objective and
subjective. We asked caregivers factual questions about the frequency, amounts, timing, and types of the assistance they provided, job choice and performance, and household income. We asked for their opinions about (1) the quality of their relationships with care recipients, (2) their satisfaction with care recipients’ PCS, and (3) their own emotional, financial, and physical well-being and health. Table A.1 presents a complete list of the outcome measures we examined.
As described below, our analysis of caregiver outcomes controls for numerous
care recipient and caregiver characteristics. We used data from the baseline survey to control for care recipients’ demographic characteristics, health and functioning, use of supportive services, satisfaction with care and life, unmet needs, reasons for and month of enrollment, work and community activities, whether they used a proxy respondent for all or most of the baseline survey, and whether they appointed a representative to help
4 About 14 percent of respondents’ care recipients were deceased by the time of the caregiver interviews. In addition, 13 percent of treatment group caregivers (95 out of 721) were assisting care recipients who said they were disenrolled from IndependentChoices during nine-month follow-up interviews. Disenrollment is a topic we will explore fully in future reports.

7
make decisions about managing the monthly allowance (shown in Table A.2). We also asked care recipients whether and how they were related to their primary informal caregiver, whether that person was employed, and whether he or she had ever expressed interest in being paid for caregiving. During the caregiver interviews, we collected selected demographic data and asked respondents whether they lived with their care recipients at baseline (also shown in Table A.2).
Estimation of Program Effects We used logit models to estimate program effects on categorical outcomes, an
ordered logit to estimate effects on caregivers’ level of household income, and ordinary-least-squares models to estimate effects on the frequency and amount of assistance. Because care recipients were randomly assigned to the treatment or control groups, we could have obtained unbiased impact estimates simply by comparing unadjusted means for treatment and control group caregivers. However, a few minor differences in mean characteristics arose by chance or because of possible differences in patterns of nonresponse for the two groups. To account for these differences and provide more efficient estimates, our models controlled for the baseline care recipient and caregiver characteristics described above.
Many of our outcome measures were derived from survey questions with four-point
scales (for example, degree of satisfaction). To reduce the number of parameters estimated and simplify the presentation and interpretation of results, we converted each scale into two binary outcome measures, rather than analyze it with multinomial logit models. We constructed one measure that was set equal to 1 only if the respondent gave the most favorable rating (very satisfied), with all other ratings set to 0. We constructed a second measure that was set equal to 1 only if the respondent gave an unfavorable rating (somewhat or very dissatisfied), with all other ratings set to 0.5 By examining effects on the ends of each scale, we could infer whether consumer direction increased the proportion of highly satisfied caregivers, decreased the proportion of dissatisfied caregivers, or had both effects.6,7
5 The caregiver survey also included several questions with five-point scales. In these cases, respondents rated the level of strain they experienced, with 1 representing little or no strain and 5 representing a great deal of strain. We again converted each scale into two binary measures. The first was set equal to 1 only if the respondent gave a rating of 1; the other was set equal to 1 only for ratings of 4 or 5.
6 We chose to measure impacts by estimating straightforward binary logit models on individual outcomes, rather than to create and analyze indexes that combine various measures. We did this for several reasons: (1) the meaning of what is being measured is clearer when responses to actual survey questions are examined, (2) the magnitude of impacts is easier for nontechnical readers to grasp, (3) indexes assign arbitrary weights to component measures and treat ordinal measures as if they were cardinal, and (4) indexes sometimes mask important effects on component measures. 7As a preliminary step, we estimated separate models for caregivers of elderly and nonelderly care recipients to assess whether caregivers’ outcomes differed substantially by the age of those they cared for. Having determined this was not so for the vast majority of outcomes, we conducted the analysis using a pooled sample, but we present the preliminary subgroup results for key outcomes in the appendix.

8
With the exception of treatment-control differences in the amount of care provided
(which were estimated with least squares regression), we measured program impacts by using the estimated coefficients from the logit models to calculate the treatment-control difference in average predicted probabilities that the binary dependent variable took a value of 1. The p-values of the estimated coefficients on the treatment status variable are reported in the tables and were used to test whether treatment-control differences were significantly different from zero.
With 1,433 primary informal caregivers in the analysis sample, we had 80 percent
power to detect impacts of 6.6 percentage points for binary outcome variables with means of .50, assuming two-tailed tests at the .05 significance level (Table A.3). For binary variables with a mean of .10 or .90, the detectable difference was 3.9 percentage points. For the 643 live-in caregivers who reported the number of hours of (unpaid and paid) care they provided during a specific two-week period, a continuous variable, we had 80 percent power to detect impacts of 13.7 hours on total hours of care (about 9 percent of the mean), again assuming a two-tailed test at the .05 significance level.8
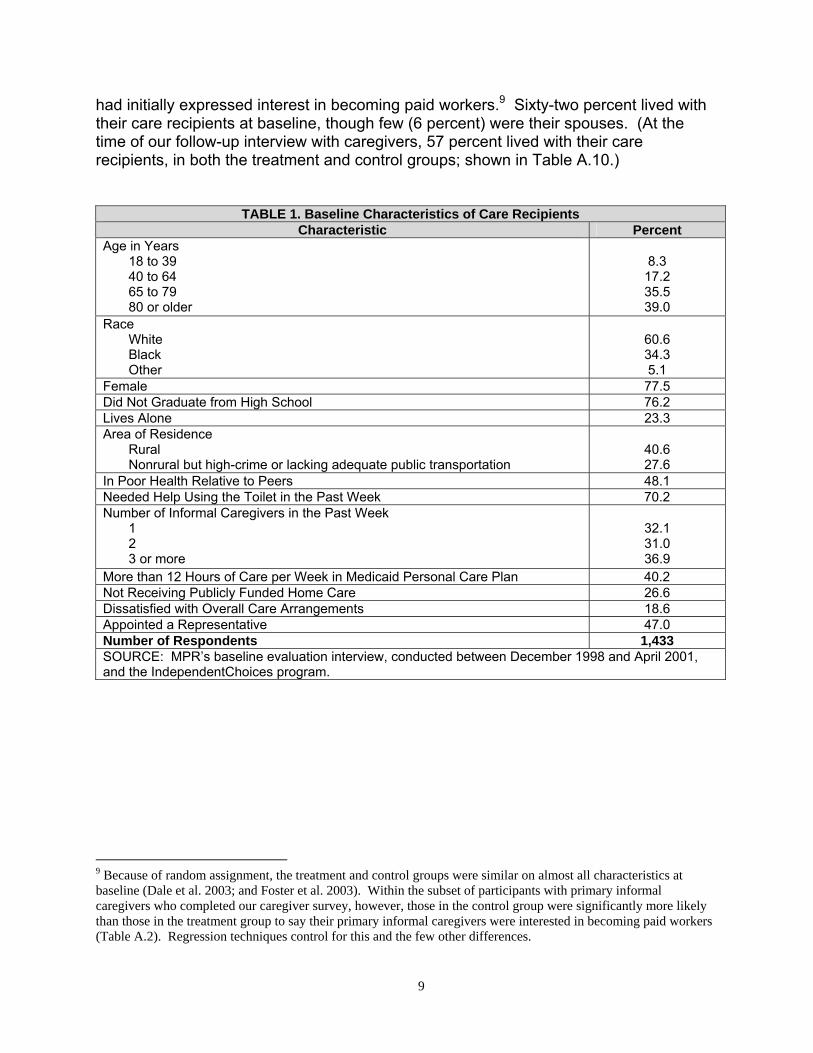
Baseline Characteristics of Care Recipients and Their Primary Informal Caregivers
The demonstration participants who received assistance from the caregivers in our
sample were typically white, female, and of limited education (Table 1). At baseline, nearly a quarter lived alone. Almost half said they were in poor health, 70 percent could not use the toilet by themselves without great difficulty, and many were allotted more than 12 hours of care per week in their Medicaid care plans, approaching Arkansas’s 16-hour maximum for most beneficiaries. Their poor health and level of need suggest that the care recipients relied heavily on informal care. About one-third of care recipients had only one informal caregiver at baseline, roughly equal to the proportions reporting two informal caregivers, or three or more. Forty-seven percent of care recipients named a representative (quite possibly their primary informal caregiver) who would help them manage the monthly allowance if they were assigned to receive it. Finally, a substantial minority of care recipients (19 percent) were dissatisfied with their overall care arrangements at baseline.
For their part, the caregivers that made up our analysis sample tended to be
female relatives of their care recipients (Table 2). Nearly two-thirds of caregivers were between the ages of 40 and 64, and about 30 percent had dependent children. Most had at least a high-school education, 38 percent were employed at baseline, and a third
8 We describe our approach to measuring hours of assistance in the appendix and Table A.4.
9
had initially expressed interest in becoming paid workers.9 Sixty-two percent lived with their care recipients at baseline, though few (6 percent) were their spouses. (At the time of our follow-up interview with caregivers, 57 percent lived with their care recipients, in both the treatment and control groups; shown in Table A.10.)
TABLE 1. Baseline Characteristics of Care Recipients Characteristic Percent
Age in Years 18 to 39 40 to 64 65 to 79 80 or older
8.3 17.2 35.5 39.0
Race White Black Other
60.6 34.3 5.1
Female 77.5 Did Not Graduate from High School 76.2 Lives Alone 23.3 Area of Residence
Rural Nonrural but high-crime or lacking adequate public transportation
40.6 27.6
In Poor Health Relative to Peers 48.1 Needed Help Using the Toilet in the Past Week 70.2 Number of Informal Caregivers in the Past Week
1 2 3 or more
32.1 31.0 36.9
More than 12 Hours of Care per Week in Medicaid Personal Care Plan 40.2 Not Receiving Publicly Funded Home Care 26.6 Dissatisfied with Overall Care Arrangements 18.6 Appointed a Representative 47.0 Number of Respondents 1,433 SOURCE: MPR’s baseline evaluation interview, conducted between December 1998 and April 2001, and the IndependentChoices program.
9 Because of random assignment, the treatment and control groups were similar on almost all characteristics at baseline (Dale et al. 2003; and Foster et al. 2003). Within the subset of participants with primary informal caregivers who completed our caregiver survey, however, those in the control group were significantly more likely than those in the treatment group to say their primary informal caregivers were interested in becoming paid workers (Table A.2). Regression techniques control for this and the few other differences.
10
TABLE 2. Characteristics of Primary Informal Caregivers
Characteristic Percent Age in Years
39 or younger 40 to 64 65 or older
22.4 64.1 13.5
Female 86.0 White 61.0 Did Not Graduate from High School 31.0 Married 55.3 Has Child(ren) Younger than Age 18 29.3 Relationship to Care Recipient
Spouse Parent Daughter or son Other relative Nonrelative
5.5 7.0 62.3 17.7 7.4
Lived with Care Recipient at Baseline 61.7 Was Employed at Baselinea 37.7 Expressed Interest in Becoming a Paid Workera 35.8 Number of Respondents 1,433 SOURCE: MPR’s caregiver interview, conducted between February 2000 and April 2002, and baseline interview with care recipients, conducted between December 1998 and April 2001. NOTE: Primary informal caregivers are those providing the most unpaid care to care recipients at baseline. a. As reported by care recipients during baseline interviews.
11
RESULTS Although this analysis focuses on people who were primary informal caregivers at
baseline, it was expected that some proportion of caregivers in the treatment group would not be strictly informal during the follow-up period. In fact:
• Fifty-six percent of caregivers in the treatment group were paid for caregiving at
least some of the time their care recipients were enrolled in IndependentChoices. On average, they were paid for about 11 hours of care per week and earned $6 an hour (not shown).
• Most paid treatment group caregivers (71 percent) were the only paid workers
assisting their care recipients during the two-week period we asked about.10 • Only 6 percent of treatment group caregivers were assisting care recipients who
had no paid workers during the period we asked about. In contrast, a much larger proportion of caregivers in the control group (25 percent) were assisting care recipients who had no paid workers during that period.
In the following presentation of results, we focus on straightforward (regression-
adjusted) treatment-control differences for the full sample of caregivers, regardless of payment. However, because payment was a program effect, it and its influence on other outcomes are important to measure. Thus, after presenting the overall treatment-control differences, we then briefly examine the extent to which payment seemed to affect those differences.
Frequency, Amount, and Timing of Assistance The caregivers of treatment group members (IndependentChoices consumers)
provided assistance as frequently as control group caregivers did, but they provided somewhat fewer hours of assistance and did so at slightly different times. On average, caregivers in both evaluation groups provided care on 12 of the 14 days we asked about (Table 3).11 During that time, control group caregivers provided about 117 hours of assistance, and treatment group caregivers provided about 107 hours. This equals a difference of 10 hours in two weeks, or under one hour a day. This overall impact was driven by a 13-hour treatment-control difference in care provided by live-in caregivers (who made up 57 percent of the analysis sample), including a 9-hour difference in the time they spent on activities that benefited the entire household, such as cleaning.
10 Calculated with data from MPR’s nine-month follow-up interview with demonstration participants, which included questions about paid care received during a two-week period shortly before that interview.
11 All else equal, about 92 percent of caregivers in both evaluation groups said they provided assistance during the two-week reference period (shown in Table A.10).
12
(Differences in live-in care hours that benefited care recipients exclusively, such as help eating, and in care hours provided by visiting caregivers were not statistically significant.) In addition, caregivers of treatment group members were slightly less likely than their control group counterparts to provide care after 6 P.M. on weekdays. (The program did not affect care provided at other times.)
TABLE 3. Estimated Effects of IndependentChoices on Patterns of Care Provided by Primary Informal Caregivers
Outcome Predicted Treatment Group Mean
Predicted Control Group Mean
Estimated Effect (p-Value)
Frequency of Care Provided in Recent Two Weeksa
Number of Days Provided Care (N = 1,124)
12.4 12.2 0.2 (.371)
Amount of Care Provided in Recent Two Weeksa
Hours of Care Provided by All Caregivers (n = 1,063)b
106.6 117.0 -10.4* (.089)
By live-in caregivers (n = 643):
Hours that benefited care recipient onlyc
Hours that benefited entire householdd
140.1
64.8
75.4
153.0
68.2
84.8
-12.9** (.035) -3.5
(.364) -9.4** (.012)
By visiting caregivers (n = 420) 61.9 68.9 -7.0 (.164)
Timing of Care Provided in Recent Two Weeksa
Percent Providing Care (n = 1,130) Before 8 A.M. weekdays After 6 P.M. weekdays
59.6
84.0
62.5
87.5
-3.0
(.264) -3.5* (.081)
SOURCE: MPR’s caregiver interview, conducted between February 2000 and April 2002. NOTES: Primary informal caregivers are those providing the most unpaid care to care recipients at baseline. Includes those who became paid workers for care recipients randomly assigned to the treatment group. a. The most recent two weeks the care recipient lived in the home or community during the two
months before the interview. b. The estimates for total hours are constructed as weighted averages of the estimates for caregivers
who are live-ins and those who are visiting, with the weights being the proportion of all caregivers who were live-in or visiting at followup, or .571 and .429, respectively. The variance of the estimated effect used to construct the t-statistic and corresponding p-value is var = (.571)2 * σL
2+ (.429)2 * σV
2, where σL2 and σV
2 are the variances of the estimated coefficients on treatment status from the regressions on live-in and visiting caregivers, respectively. This approach ensures that the impact on total hours is a weighted average of the impacts on live-in and visiting caregivers.
c. Includes routine health care, personal care, and transportation. d. Includes preparing meals, housework, laundry, shopping, and yard work to meet the needs of all
household members. * Significantly different from zero at the .10 level, two-tailed test. ** Significantly different from zero at the .05 level, two-tailed test.

13
Relationships with Care Recipients IndependentChoices seemed not to affect overall relationships between caregivers
and care recipients, but it may have improved the quality of their care-related interactions. Over 85 percent of caregivers in each evaluation group said they got along very well with care recipients, and about one-fourth of each group said their relationships had improved since their care recipients enrolled in the demonstration (Table 4).12 However, in an indication that treatment group caregivers took the concept of consumer direction to heart, they were significantly more likely than control group caregivers (22 versus 14 percent) to consult care recipients directly with questions about their personal care. Perhaps as a result, treatment group caregivers were also significantly less likely than their control group counterparts to say their care recipients refused to cooperate when they tried to help (29 versus 35 percent). Satisfaction with Care Arrangements
Compared with control group caregivers, those in the treatment group were
substantially more satisfied with care recipients’ overall care arrangements and were less prone to worrying about insufficient care, safety, or theft (though many still worried). Specifically, 60 percent of treatment group caregivers were very satisfied with overall care arrangements, compared with about 40 percent of control group caregivers (Table 5). In addition, the proportion of dissatisfied treatment group caregivers was less than half that of control group caregivers (9.1 ÷ 22.8 = .40). Much smaller proportions of treatment group caregivers said they worried quite a lot that, in their absence, care recipients were not getting enough care (36 versus 54 percent), that care recipients’ safety was at risk (40 versus 53 percent), or that someone would take care recipients’ money or other belongings (14 versus 20 percent). In addition to there being fewer treatment than control group caregivers who worried a lot about these matters, there were more who worried only rarely or not at all.
12 Three percent of caregivers in each evaluation group said their relationships had worsened since enrollment (not shown).
14
TABLE 4. Estimated Effects of IndependentChoices on Caregiver-Care Recipient Relationships Outcome
(n = 1,337) Predicted Treatment
Group Mean (Percent)
Predicted Control Group Mean
(Percent)
Estimated Effect (p-Value)
Caregiver and Care Recipient Get Along Very Well
87.5 86.1 1.4 (.467)
Current Relationship Is Better than at Enrollment
27.9 26.7 1.2 (.619)
Caregiver Consults Care Recipient with Personal Care Questionsa
21.9 13.7 8.2*** (.000)
Care Recipient Refuses to Cooperate When Caregiver Tries to Help
28.6 34.5 -5.9** (.019)
SOURCE: MPR’s caregiver interview, conducted between February 2000 and April 2002. a. The sample size for this outcome was 1,034. It was measured only for caregivers who provided
assistance with activities of daily living, such as eating, bathing, and using the toilet. ** Significantly different from zero at the .05 level, two-tailed test. *** Significantly different from zero at the .01 level, two-tailed test.
TABLE 5. Estimated Effects of IndependentChoices on Primary Informal Caregivers’ Satisfaction with Care Quality
Outcome (n = 1,428)
Predicted Treatment Group Mean
(Percent)
Predicted Control Group Mean
(Percent)
Estimated Effect (p-Value)
How Satisfied with Care Recipient’s Overall Care Arrangements Very satisfied 60.8 42.7 18.1***
(.000) Dissatisfied 9.1 22.8 -13.7***
(.000) When Not with Care Recipient, How Often Worries That
Care Recipient Does Not Have Enough Help
Rarely or not at all Quite a lot
35.6
5.8
20.2
53.5
15.4*** (.000)
-17.6*** (.000)
Care Recipient’s Safety Is at Risk Rarely or not at all Quite a lot
31.8
39.3
21.9
53.4
9.9*** (.000)
-14.1*** (.000)
Someone Will Take Care Recipient’s Money or Other Belongings
Rarely or not at all Quite a lot
69.4
14.0
62.7
20.3
6.8*** (.007) -6.3*** (.001)
SOURCE: MPR’s caregiver interview, conducted between February 2000 and April 2002. NOTES: Primary informal caregivers are those providing the most unpaid care to care recipients at baseline. Includes those who became paid workers for care recipients randomly assigned to the treatment group. * Significantly different from zero at the .10 level, two-tailed test. ** Significantly different from zero at the .05 level, two-tailed test. *** Significantly different from zero at the .01 level, two-tailed test.

15
Emotional Well-Being and Satisfaction with Life Compared with caregivers whose care recipients relied on agency services, those
who assisted IndependentChoices consumers (1) were less likely to report that caregiving infringed on their personal lives, (2) enjoyed better emotional well-being, and (3) felt more satisfied with life. Smaller proportions of treatment group than control group caregivers said caregiving interfered with their privacy (39 versus 53 percent; Table 6) and with their free time and social lives (53 versus 64 percent). Compared with control group caregivers, those in the treatment group were less likely (by 8 percentage points) to report a great deal of emotional strain and more likely (by 6 percentage points) to report little or no strain. Treatment group caregivers were also 11 percentage points more likely to be very satisfied, and 10 points less likely to be dissatisfied, with the way they were spending their own lives. These improvements seemed to be accompanied by a modest reduction in the proportion of caregivers who said their care recipients required almost constant attention from them.
TABLE 6. Estimated Effects of IndependentChoices on Primary Informal Caregivers’ Emotional Well-Being and Satisfaction With Life
Outcome (n = 1,429)
Predicted Treatment Group Mean
(Percent)
Predicted Control Group Mean
(Percent)
Estimated Effect (p-Value)
Caregiving Limits Privacy Free time or social life
38.7
52.5
52.7
63.8
-14.1*** (.000)
-11.3*** (.000)
Level of Emotional Strain as a Result of Caregiving
Little or none A great deal
41.0
26.8
35.0
34.3
6.0** (.015) -7.5*** (.002)
Current Satisfaction with Life Very satisfied Dissatisfied
51.3
13.1
39.9
23.2
11.4*** (.000)
-10.1*** (.000)
Care Recipient Requires Almost Constant Attention from Informal Caregiver
52.6 57.2 -4.6* (.054)
SOURCE: MPR’s caregiver interview, conducted between February 2000 and May 2002. NOTES: Primary informal caregivers are those providing the most unpaid care to care recipients at baseline. Includes those who became paid workers for care recipients randomly assigned to the treatment group. * Significantly different from zero at the .10 level, two-tailed test. ** Significantly different from zero at the .05 level, two-tailed test. *** Significantly different from zero at the .01 level, two-tailed test.
16
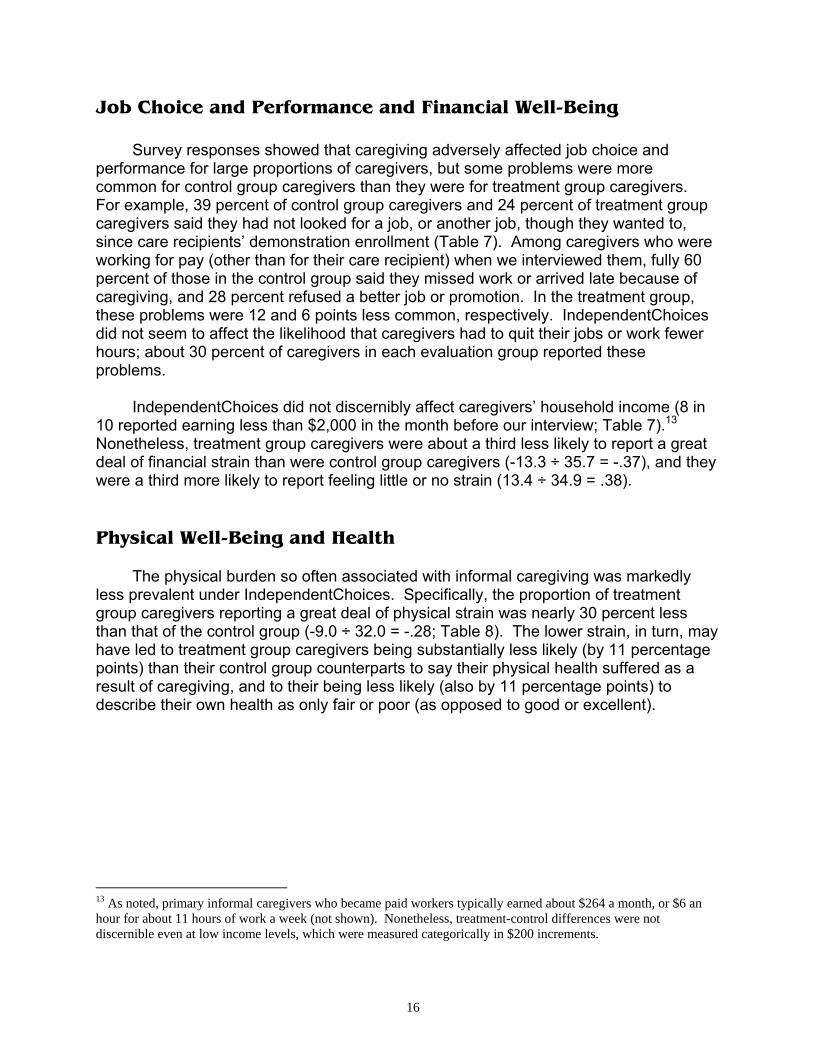
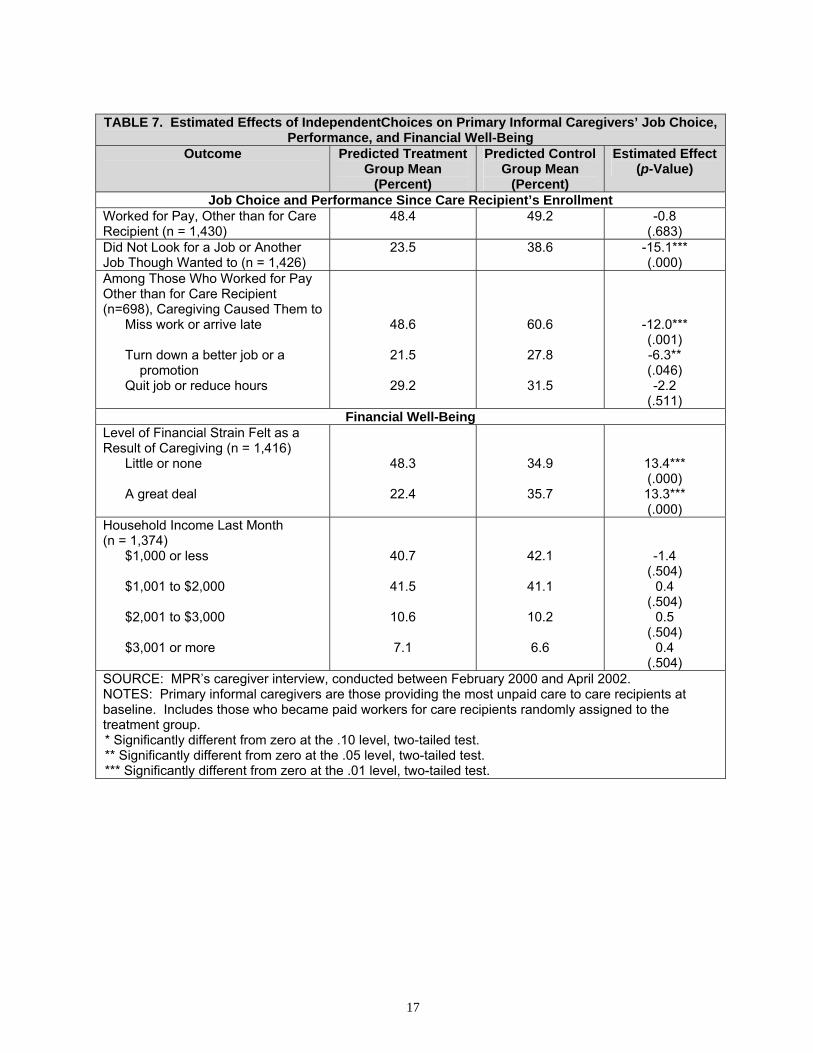
Job Choice and Performance and Financial Well-Being
Survey responses showed that caregiving adversely affected job choice and performance for large proportions of caregivers, but some problems were more common for control group caregivers than they were for treatment group caregivers. For example, 39 percent of control group caregivers and 24 percent of treatment group caregivers said they had not looked for a job, or another job, though they wanted to, since care recipients’ demonstration enrollment (Table 7). Among caregivers who were working for pay (other than for their care recipient) when we interviewed them, fully 60 percent of those in the control group said they missed work or arrived late because of caregiving, and 28 percent refused a better job or promotion. In the treatment group, these problems were 12 and 6 points less common, respectively. IndependentChoices did not seem to affect the likelihood that caregivers had to quit their jobs or work fewer hours; about 30 percent of caregivers in each evaluation group reported these problems.
IndependentChoices did not discernibly affect caregivers’ household income (8 in
10 reported earning less than $2,000 in the month before our interview; Table 7).13 Nonetheless, treatment group caregivers were about a third less likely to report a great deal of financial strain than were control group caregivers (-13.3 ÷ 35.7 = -.37), and they were a third more likely to report feeling little or no strain (13.4 ÷ 34.9 = .38).
Physical Well-Being and Health The physical burden so often associated with informal caregiving was markedly
less prevalent under IndependentChoices. Specifically, the proportion of treatment group caregivers reporting a great deal of physical strain was nearly 30 percent less than that of the control group (-9.0 ÷ 32.0 = -.28; Table 8). The lower strain, in turn, may have led to treatment group caregivers being substantially less likely (by 11 percentage points) than their control group counterparts to say their physical health suffered as a result of caregiving, and to their being less likely (also by 11 percentage points) to describe their own health as only fair or poor (as opposed to good or excellent).
13 As noted, primary informal caregivers who became paid workers typically earned about $264 a month, or $6 an hour for about 11 hours of work a week (not shown). Nonetheless, treatment-control differences were not discernible even at low income levels, which were measured categorically in $200 increments.
17
TABLE 7. Estimated Effects of IndependentChoices on Primary Informal Caregivers’ Job Choice,
Performance, and Financial Well-Being Outcome Predicted Treatment
Group Mean (Percent)
Predicted Control Group Mean
(Percent)
Estimated Effect (p-Value)
Job Choice and Performance Since Care Recipient’s Enrollment Worked for Pay, Other than for Care Recipient (n = 1,430)
48.4 49.2 -0.8 (.683)
Did Not Look for a Job or Another Job Though Wanted to (n = 1,426)
23.5 38.6 -15.1*** (.000)
Among Those Who Worked for Pay Other than for Care Recipient (n=698), Caregiving Caused Them to
Miss work or arrive late Turn down a better job or a
promotion Quit job or reduce hours
48.6
21.5
29.2
60.6
27.8
31.5
-12.0*** (.001) -6.3** (.046) -2.2
(.511) Financial Well-Being
Level of Financial Strain Felt as a Result of Caregiving (n = 1,416)
Little or none A great deal
48.3
22.4
34.9
35.7
13.4*** (.000) 13.3*** (.000)
Household Income Last Month (n = 1,374)
$1,000 or less $1,001 to $2,000 $2,001 to $3,000 $3,001 or more
40.7
41.5
10.6
7.1
42.1
41.1
10.2
6.6
-1.4 (.504)
0.4 (.504)
0.5 (.504)
0.4 (.504)
SOURCE: MPR’s caregiver interview, conducted between February 2000 and April 2002. NOTES: Primary informal caregivers are those providing the most unpaid care to care recipients at baseline. Includes those who became paid workers for care recipients randomly assigned to the treatment group. * Significantly different from zero at the .10 level, two-tailed test. ** Significantly different from zero at the .05 level, two-tailed test. *** Significantly different from zero at the .01 level, two-tailed test.

18
TABLE 8. Estimated Effects of IndependentChoices on Primary Informal Caregivers’ Physical
Well-Being and Health Outcome
(n = 1,426) Predicted Treatment
Group Mean (Percent)
Predicted Control Group Mean
(Percent)
Estimated Effect (p-Value)
Level of Physical Strain as a Result of Caregiving
Little or none A great deal
37.6
23.0
30.6
32.0
7.0*** (.004) -9.0*** (.000)
Physical Health Has Suffered as a Result of Caregiving
23.6 34.3 -10.7*** (.000)
Current Health Is Fair or Poor Relative to That of Peers
35.5 46.7 -11.2*** (.000)
SOURCE: MPR’s caregiver interview, conducted between February 2000 and April 2002. NOTES: Primary informal caregivers are those providing the most unpaid care to care recipients at baseline. Includes those who became paid workers for care recipients randomly assigned to the treatment group. * Significantly different from zero at the .10 level, two-tailed test. ** Significantly different from zero at the .05 level, two-tailed test. *** Significantly different from zero at the .01 level, two-tailed test.
Estimated Effects of Paying Primary Informal Caregivers
To explore whether impact estimates relating to satisfaction with care and well-
being may have been driven by the fact that over half the caregivers in the treatment group became paid workers under IndependentChoices, we estimated logit models to compare predicted outcomes separately for control group caregivers with those of treatment group caregivers who (1) became paid workers and (2) remained unpaid. For 10 of 15 outcomes examined, paid and unpaid treatment group caregivers both fared significantly better than did control group caregivers (Table A.5). However, for all but two of these 10 outcomes, estimated program effects were substantially larger for the group that became paid than they were for the group that remained unpaid. Together, these finding suggest that estimated program impacts were not driven solely by a “payment effect,” but that payment did contribute to the large magnitude of the impacts. This was true for outcomes pertaining to satisfaction with overall care arrangements, worrying about insufficient care, pursuing desired jobs, experiencing financial strain, and limitations on privacy and free time.
For the remaining five satisfaction and well-being outcomes, treatment group
caregivers who became paid had significantly better outcomes than those in the control group, but treatment group caregivers who remained unpaid had outcomes that were very similar to those of caregivers in the control group. Specifically, only treatment group caregivers who became paid fared better than control group caregivers with respect to emotional strain, physical health, being very satisfied with life, and whether care recipients cooperated when caregivers tried to help. Because we do not have data to control for baseline measures of these variables, we cannot make inferences about the causal relationships between payment and outcomes. It could be that payment induced care recipients to cooperate more with caregivers who once helped them

19
entirely for free. It is also quite possible that caregivers who became paid workers were those who already enjoyed cooperative relationships with care recipients or who experienced less emotional strain before becoming paid.
The satisfaction and well-being of some unpaid treatment group members might
also be explained, in part, by their reasons for remaining unpaid. For example, 55 out of 87 (63 percent) treatment group caregivers who said they did not become paid workers because they helped their care recipient out of love or tradition were very satisfied with overall care arrangements (not shown).14 Their level of satisfaction mirrors that of treatment group caregivers as a whole. In contrast, only 11 of 25 (44 percent) caregivers who were not paid workers because their care recipient disenrolled from IndependentChoices were very satisfied with the recipient’s overall care. This mirrors the experience of control group caregivers as a whole. In between, 38 of 66 (58 percent) treatment group caregivers who were not allowed to become paid workers (because they were the spouse or representative of their care recipient) were very satisfied with overall care arrangements. Although we cannot draw conclusions from the experiences of so few caregivers, this same pattern held for measures of emotional, financial, and physical well-being. That is, unpaid treatment group caregivers who helped out of love or tradition had better outcomes than those who could not be paid because of program rules, and both these groups fared better than did the unpaid caregivers of disenrollees (not shown).
We also examined whether program impacts on the amount of care provided by
caregivers may have stemmed from a payment effect. We found that treatment group caregivers who became paid workers provided care on more days than did control group caregivers, while those who did not become paid provided care on fewer days (Table A.7). Again, we cannot infer that payment led to this difference, because it may be that the caregivers who became paid were those who helped most frequently in the first place. We also found that, among live-in caregivers, those in the treatment group provided fewer hours of care than those in the control group regardless of whether they became paid workers. This was not true among visiting caregivers, however, where those in the treatment group provided fewer hours of assistance than those in the control group only if they remained unpaid.
14 We asked treatment group caregivers who remained unpaid why they did so. Nearly 30 percent said it was because they helped care recipients out of love, devotion, or family tradition (Table A.6). Twenty-two percent said they could not be paid under program rules. Others were not able to perform all the tasks care recipients required, lived too far from them, or had other obligations. Still others did not know they could be paid or deemed the allowance insufficient, and some never became paid because their care recipient disenrolled from IndependentChoices. (A regression analysis did not point to noteworthy relationships between care recipient and caregiver characteristics and whether caregivers became paid.)

20
Other Sensitivity Tests While only 6 percent of treatment group caregivers were assisting care recipients
who had no paid workers nine months after random assignment, 25 percent of control group caregivers were in this situation. However, sensitivity tests showed that the lack of paid assistance within the control group did not drive the favorable impacts seen for the caregivers of treatment group members. Even when the sample is restricted to caregivers whose care recipients had paid caregivers at that time, treatment group caregivers still have much better outcomes, on average, than control group caregivers have (Table A.8).
21
DISCUSSION
Under IndependentChoices, caregivers had a slight reprieve in care hours, were more satisfied with care arrangements, and enjoyed greater well-being.
Our results indicate that treatment group caregivers, whose care recipients could
receive an allowance to direct their own personal care services, fared better than did control group caregivers, whose care recipients relied on agency services. Although both groups provided copious amounts of care, those who helped self-directing care recipients provided about one less hour of care a day than did those in the control group. They withstood less physical, emotional, and financial strain, and were also less likely to report that caregiving impinged on their privacy, social lives, or job performance. They were substantially less prone to worrying about insufficient care and safety, and were more likely to be very satisfied with their care recipient’s overall care arrangements. Not surprisingly, treatment group caregivers were also much more likely than their control group counterparts to be very satisfied with their own lives.
These findings support our hypothesis that consumer direction would affect
primary informal caregivers, and they resolve the question as to whether the effects would be for better or worse. The observed reduction in live-in care hours (in itself a positive result) may suggest that, when care recipients started directing their own PCS, they shifted hours across paid and unpaid caregivers in order to ease the workloads of those who had been helping them most without pay.15 Likewise, the slightly smaller percentage of treatment group caregivers who provided after-hours assistance may suggest that some of their care recipients hired workers expressly for this time of day, while control group caregivers may have had no option but to provide assistance when agency workers did not. Differences in the amounts and timing of care may have contributed, in turn, to treatment group caregivers’ reported increases in free time and privacy, and to decreases in emotional and physical strain. Reductions in financial strain may have stemmed from caregivers’ being hired as workers, and from treatment group members using their monthly allowance to pay for care-related items that their caregivers might have paid for previously. In addition, the fact that relatively small proportions of treatment group caregivers said that caregiving hampered their performance or choice of jobs, or caused emotional stress and worry, may have
15 We considered the possibility that treatment-control difference in care hours was not a true program effect, but rather a reflection of differences in the accuracy with which each group reported these data. In particular, one could hypothesize that treatment group data would be more accurate than control group data because more than half the treatment group caregivers were completing time sheets for paid hours. We have no formal way to test this possibility, but several factors seem to refute it. First, caregivers who became paid workers continued to provide far more unpaid than paid hours during the follow-up period. Because the hours they recorded on their time sheets were only a fraction of total hours provided, completing time sheets probably did not greatly improve the accuracy of their estimates overall. Second, if treatment group caregivers had not provided fewer hours of care than their control group counterparts, it would be hard to explain their reported gains in free time (see Table 6 and Table A.5). Finally, in nine-month interviews with demonstration enrollees, those in the treatment group reported receiving fewer hours of care than those in the control group received, which corroborates the data caregivers reported.

22
stemmed from care recipients’ hiring workers whom they and their caregivers already knew personally and who were more reliable than agency workers.
Finally, our assessment of the effects of payment on caregiver outcomes
suggested that primary informal caregivers who became paid workers--earning about $6 an hour for 11 of the 55 hours of assistance they provided in a typical week--did derive substantial benefit from their change of status. Caregivers who remained unpaid also clearly benefited from consumer direction, but to a somewhat lesser extent, on average, than did those who became paid. We cannot determine whether the reason for the larger estimated differences for those who became paid was due to their being paid, or to reasons that affected both their outcomes and the likelihood of becoming paid in the first place.
Consumer benefits did not come at the expense of primary informal caregivers. As the Federal Government and states seek to increase Medicaid beneficiaries’
ability to remain in the community, it is important to pay close attention to the burden society places on informal caregivers. Expanding the availability of home- and community-based services through President Bush’s New Freedom Initiative and federal Systems Change Grants will likely benefit informal caregivers. The results presented here suggest that another way to ease caregiver burden is to give interested Medicaid beneficiaries more control over their personal care services.
Given these circumstances, an important implication of this study is that when Medicaid beneficiaries want to direct their supportive services and do so, both they and the caregivers who were helping them most benefit substantially. As sensitivity tests showed, many benefits accrued to caregivers, most of whom were related to their care recipients, whether or not they became paid workers. The fact that both approaches succeeded from caregivers’ perspectives illustrates that IndependentChoices consumers used their monthly allowance as best befitted their particular circumstances. Our findings might help dispel expectations that paying family members strains relations between caregivers and care recipients. Furthermore, the findings may counter arguments that it is wasteful for government to pay family caregivers for some of the care they had been providing for free. Inasmuch as the greatly reduced strain observed under IndependentChoices might enable informal caregivers to continue in their roles for longer periods, Medicaid beneficiaries’ nursing home use and associated costs to the public could be delayed or reduced.

23
Study limitations do not compromise our findings. This analysis was based on a randomized design and yielded estimated program
effects that were quite large and consistent across numerous types of measures.16 Nonetheless, a few caveats are warranted about study duration, generalizability, possible reporting bias, care recipients’ participation in other programs, and the desirability of additional data.
First, given the relatively short duration of our follow-up period, we do not know if
the positive effects observed for treatment group caregivers would persist. For example, if the reduction in care hours were not sustainable, if the novelty of getting paid for caregiving were to diminish, or if care recipients made service arrangements that were short-term or otherwise unstable (say, by hiring young relatives who later went away to school), then improvements in the satisfaction and well-being of their caregivers might deteriorate. Second, because our findings are based on a new consumer-directed program in one state, they may not be generalizable to other programs in other states. Third, we cannot rule out that some treatment group members might have inflated reports on a few outcomes, such as their own health and functioning, because IndependentChoices brought them other benefits and they wanted the program to continue.
Our estimated program effects must also be considered in light of the fact that
some care recipients participated in Medicaid home- and community-based waiver services programs during the evaluation followup, which could have affected the experiences of their caregivers. Specifically, 47 percent of the caregivers in this analysis were assisting individuals who were enrolled in Arkansas’s ElderChoices program for at least part of the follow-up period. ElderChoices provides nurse-supervised homemaker, chore, and respite services to elders qualified for nursing-home level care. Thus, it is possible that the presence of ElderChoices workers led treatment group caregivers to worry more about safety and theft than they would have otherwise. Conversely, the program’s nurse supervision could have made caregivers of ElderChoices participants feel more secure than those of nonparticipants. In fact, the sensitivity tests we used to explore these hypotheses showed that, for all but two key outcomes, estimated effects were larger for caregivers whose care recipients did not participate in ElderChoices than they were for caregivers of participants (Table A.9). The larger impacts resulted from the combination of control group caregivers having better outcomes if their care recipients participated in ElderChoices, and of treatment group caregivers having worse ones. (In other words, it appears ElderChoices was a boon to caregivers whose care recipients were relying on agency services, but a
16 While the p-values on the individual coefficients may overstate the overall statistical significance of the estimates, given the multiple hypotheses being tested, jointly testing the hypotheses for the outcomes presented in our tables with the Bonferroni method would not change our assessment of significance. The great majority of the estimated coefficients on treatment status are significant at the .001 level, which illustrates the robustness of the results.

24
detriment to caregivers of self-directing care recipients.) This suggests that, were consumer direction introduced in states without programs like ElderChoices, even larger caregiver impacts might be expected.
In Arkansas, program effects might also be slightly attenuated because 6 percent
of control group caregivers reported being paid for caregiving since their care recipient’s enrollment. (This could occur through Arkansas’s Alternatives program, in which a Medicaid beneficiary’s relatives and friends may become certified providers, or under a state policy that permits local health departments to pay family caregivers.) In other words, having an experience akin to consumer direction might have improved outcomes for these control group caregivers, which would narrow the observed treatment-control differences.
Finally, having data on additional caregiver characteristics would enrich our
analysis. For example, with data on caregivers’ baseline health status and levels of strain, we could have determined how IndependentChoices affected subgroups of caregivers defined by these characteristics. In addition, without such data, we have limited ability to assess the extent to which overall treatment-control differences were driven by the fact that over half the treatment group caregivers became paid workers. As noted, our comparison of the physical strain experienced by paid and unpaid treatment group caregivers, for example, may be due more to differences in the two groups’ baseline health status (or other unobserved characteristics) than to whether they became paid. Companion analyses corroborate caregiver findings.
The favorable effects observed for primary informal caregivers are consistent with
our findings from surveys with demonstration participants, in which we asked about their service use and perceptions of care quality. For example, compared with demonstration participants in the control group, those in the treatment group were much more satisfied with their overall care arrangements and with various aspects of their paid workers’ performances (Foster et al. 2003). Likewise, treatment group caregivers were happier with their care recipients’ care arrangements and were less prone to worry over insufficient care (even if they themselves did not become paid). In addition, treatment-control differences in hours of care provided by caregivers were very similar to those reported by demonstration participants (Dale et al. 2003), which speaks to the reliability of these data. The finding that nonelderly IndependentChoices consumers bought more assistive devices and home modifications than their control group counterparts (Dale et al. 2003) seems to support caregivers’ reports of reduced physical strain.
Moreover, Medicaid claims data bolster the suggestion that easing caregiver
burden could help reduce nursing home use. For nonelderly consumers in the year after enrollment, Medicaid spending on nursing facilities was significantly lower for the treatment group than it was for the control group (Dale et al. 2003).

25
A more complete picture of the Arkansas Cash and Counseling demonstration will emerge as our evaluation continues. Other survey-based reports examine the experiences of workers employed by agencies and consumers (an analysis sample that overlaps with the one studied here) and program implementation. Further analyses of claims data will examine how IndependentChoices affected public expenditures for personal care services, and acute and long-term care. Finally, we will assess the robustness and generalizability of the Arkansas findings by comparing them with impacts in the two other study states, Florida and New Jersey. Meanwhile, this study illustrates that Cash and Counseling can benefit not only Medicaid beneficiaries who want more control over their personal care services, but also the family and friends who help them live independently, in their homes and communities, for as long as possible.

26
REFERENCES
Arkansas Medicaid Program. Arkansas Medicaid Manual: Personal Care. Revised 1998. Available at [http://www.medicaid.state.ar.us/arkansasmedicaid/manuals/manlmain.htm]. Accessed on March 25, 2002.
Dale, Stacy, Randall Brown, Barbara Phillips, Jennifer Schore, and Barbara Carlson.
“The Effect of Consumer Direction on Personal Assistance Received in Arkansas.” Princeton, NJ: Mathematica Policy Research, Inc., April 2003. [http://aspe.hhs.gov/daltcp/reports/Arkpa.htm]
Doty, Pamela. “Informal Caregiver ‘Burnout’: Predictors and Prevention.” ASPE
Research Notes. Washington, DC: U.S. Department of Health and Human Services, April 22, 1997. [http://aspe.hhs.gov/daltcp/reports/rn05.htm]
Eustis, Nancy N. “Consumer-Directed Long-Term Care Services: Evolving
Perspectives and Alliances.” Generations, vol. 20, no. 3, 2000, pp. 10-15.
Feinberg, Lynn Friss, and Carol Whitlach. “Family Caregivers and Consumer Choice: Options for In-Home Respite Care.” San Francisco, CA: Family Caregiver Alliance, February 1997. Available at [http://www.caregiver.org/research/respiteC.html]. Accessed on June 26, 2002.
Foster, Leslie, Randall Brown, Barbara Phillips, Jennifer Schore, and Barbara Carlson.
“Improving the Quality of Medicaid Personal Assistance Through Consumer Direction: Findings from the Arkansas Cash and Counseling Demonstration.” Princeton, NJ: Mathematica Policy Research, Inc., February 2003.
Kitchener, Martin, and Charlene Harrington. “Medicaid 1915(c) Home and Community
Based Waivers: Program Data: 1992-1999.” San Francisco, CA: University of California, San Francisco, August 2001.
LeBlanc, Allen, Christine Tonner, and Charlene Harrington. “State Medicaid Programs
Offering Personal Care Services.” Health Care Financing Review, vol. 22, no. 4, summer 2001, pp. 155-173.
Nawrocki, Heather, and Steven R. Gregory. Across the States 2000: Profiles of Long-
Term Care Systems. Washington, DC: AARP, 2000.
Phillips, Barbara, and Barbara Schneider. “Moving to IndependentChoices: The Implementation of the Cash and Counseling Demonstration in Arkansas.” Princeton, NJ: Mathematica Policy Research, Inc., June 2002. [http://aspe.hhs.gov/daltcp/reports/movingic.htm]
27
Schore, Jennifer, and Barbara Phillips. “Putting Consumer Direction into Practice: Implementing the Arkansas IndependentChoices Program.” Draft report. Princeton, NJ: Mathematica Policy Research, Inc., December 2002.
U.S. Department of Health and Human Services. “Delivering on the Promise:
Preliminary Report on the New Freedom Initiative.” Washington, DC: U.S. Department of Health and Human Services, April 2002. Available at [http://www.hhs.gov/newfreedom/prelim/cargive.html]. Accessed on October 22, 2002.
Velgouse, Linda, and Virginia Dize. “A Review of State Initiates in Consumer-Directed
Long-Term Care.” Generations, vol. 24, no. 3, fall 2000, pp. 28-33.

28
APPENDIX: METHODS AND ADDITIONAL RESULTS In this appendix we present tables and describe methods and results that are not
included in the body of the report. As noted, Table A.1 provides a complete list of the outcome measures used in the analysis, Table A.2 shows the distribution of control variables for the treatment and control groups, and Table A.3 shows the minimum effects we could confidently detect. Our approaches to imputing missing values for control variables, using logit models, and measuring care hours are described in detail below (the last is also illustrated in Table A.4). Tables A.5 through A.13 present additional impact estimates and the results of sensitivity tests. Any results not reported in the body of this paper are discussed below.
METHODS Imputing Missing Values for Control Variables
When care recipients or caregivers were missing data on one or two control
variables (shown in Table A.2), we imputed the sample mean of the missing variable(s) to keep the case in the analysis. Overall, few survey respondents refused to answer any given question or did not know the answer; no variables had missing values for more than 2 percent of cases.17
Use of Logit Models
As noted in the body of the report, we measured most of IndependentChoices’s
impacts on primary informal caregivers by using the estimated coefficients from logit models to calculate the treatment-control difference in average predicted probabilities that the binary dependent variables took a value of 1. That is, we calculated two predicted probabilities that Y=1 (for example, whether very satisfied with life) for each primary informal caregiver in the sample--first assuming the case was in the treatment
17 A different imputation procedure was used for a handful of variables when the proxy respondent was the sample member’s representative. For such cases, the baseline survey asked the representatives about four of their own characteristics related to consumer direction (education, and experience with work, hiring, and supervising). However, for all other sample members with representatives, whether the respondent was a sample member or a proxy who was not the representative, the survey collected information on the sample members’ characteristics. To provide consistently defined variables, we have replaced the values for these variables for those cases where the representative was the respondent. We replaced them with imputed values designed to represent sample members’ values, rather than representatives’ values. The imputed values were drawn from a “donor” group--those cases who had both a representative and a proxy respondent at baseline, but for whom the proxy was not the representative. For each case for which imputation was required (those where the respondent was the representative), we selected at random a case from the donor group who fell into the same demographic cell defined by age, race, and sex. That donor case’s values for the four variables were imputed to the case requiring imputation.

29
group, then assuming it was in the control group--then calculated the mean probability for these two series to get predicted treatment and control values, and the difference between these means. This approach provides a more intuitive measure of the size and importance of the impact than would the traditional odds ratio, which is obtained by exponentiating the logit coefficient on the treatment status variable.
Measuring Outcomes Derived from Scales
As noted in the body of the report, we converted outcome measures derived from
survey questions with four- or five-point scales into two binary measures--one for the most favorable rating and one for an unfavorable rating. We then estimated impacts on each of these two measures. Although we could have measured both impacts with one multinomial logit model, such estimates would be less precise because of the relatively large number of parameters estimated. Ordered logit models are designed for such outcome measures, but may mask important nonlinear patterns of impacts. Thus, after examining simple frequencies and determining that using two binary measures would not obscure important results, we proceeded with this approach.
Statistical Power
With 1,433 primary informal caregivers in our sample, we had 80 percent power to
detect impacts of the sizes listed in Table A.3 for binary outcome measures with a mean of 50, 30, or 10 percent, assuming two-tailed test at the .05 significance level.
Measuring Hours of Assistance Provided
Data on hours of assistance were collected for live-in and visiting primary informal
caregivers who provided any help with routine health care, daily living activities, or tasks around the house or community during a two-week reference period (the last two weeks in the month before the caregiver interview during which the care recipient lived at home, and not in a hospital or nursing home).
For visiting caregivers, we asked for the number of hours spent actively helping
care recipients during the reference period, excluding purely social visits, or time spent on paperwork or travel to and from care recipients’ homes. For live-in caregivers, we separately asked for (1) the number of hours spent helping care recipients with daily living activities, routine health care, or transportation; and (2) the number spent on other things around the house and community. We did this to distinguish hours that benefited care recipients exclusively from those that may also have benefited others in the household.
For live-in caregivers, we then calculated the total hours of assistance by adding
these “care recipient hours” and “household hours.” In 26 cases (11 in the treatment group and 15 in the control) where total reported hours exceeded 336, the total number of hours in the two-week reference period, we made the following adjustments, so that no case had more than 336 total:
30
• If the caregiver reported the same number of hours for time spent helping the care recipient as for time spent on other tasks around the house and community, we divided both types of hours in half, and summed the halved amounts (for example, see case 1, Table A.4).
• Otherwise, if the caregiver reported that care recipient hours equaled 336 and
household hours were less than 336, then we kept the household value, decreased the care recipient value by that amount, and summed those values (case 2).
• Otherwise, if the caregiver reported different totals for care recipient hours and
household hours, then we kept the lesser value, decreased the greater value by that amount, and summed those values (case 3).
Before these adjustments, the 15 control group caregivers each had an excess of
136 reported hours on average, while the 11 treatment group caregivers had an excess of 74 reported hours on average. The adjustments reduced these control group outliers’ total hours by an average of 209 and treatment group outliers’ total hours by an average of 127. These changes make treatment-control differences in average hours of care less sensitive to these outliers, for which the raw data reported were clearly inaccurate.
ADDITIONAL RESULTS
Estimated Effects of Paying Primary Informal Caregivers Tables A.5 through A.7 present (1) the results of sensitivity tests discussed in the
body of this report, and (2) the percentages of treatment group caregivers who cited various reasons for not becoming paid workers under IndependentChoices.
Other Sensitivity Tests
Tables A.8 and A.9 present the results of other sensitivity tests discussed in the
body of this report.
Living Arrangements and Assistance Provided Treatment and control group caregivers were equally likely to live with or near their
care recipients at the time of the caregiver interview (Table A.10). Although informal caregivers might eventually alter their living arrangements under consumer direction, it is not surprising that they did not do so within the first 10 months of a potentially temporary program.
IndependentChoices did not affect the types of assistance primary informal
caregivers provided during the two-week period we asked about, or whether they provided any assistance at all. Regardless of evaluation status, roughly 9 in 10
31
caregivers helped with daily living activities and with routine health care. Nearly all provided help around the house, and nearly all kept care recipients company.
Knowledge and Preparedness
Under IndependentChoices, larger proportions of treatment than control group
caregivers said they felt well informed about their care recipient’s condition and services and fully prepared to meet expectations while helping (Table A.11). Regardless of evaluation status, very few caregivers said they were poorly informed.
Functional Impairments
Smaller proportions of caregivers for IndependentChoices consumers said that
illness or disability made it difficult to perform instrumental or basic activities of daily living (Table A.12). This improvement might be related to their providing fewer hours of assistance and enduring less physical strain.
Caregiver Effects by Care Recipients’ Age Group
Regardless of whether the primary informal caregiver was assisting an elderly or
nonelderly care recipient, those in the treatment group fared better than those in the control group on most key outcomes (Table A.13). In both care recipient age groups, treatment group caregivers who lived with their care recipients provided fewer hours of care than their control group counterparts. (The program did not seem to affect visiting caregivers’ hours in either age group.) In addition, regardless of care recipients’ age, treatment group caregivers were more likely than control group caregivers to be very satisfied with care recipients’ overall care arrangements, and less likely to report that caregiving caused them a great deal of emotional, financial, or physical strain, or that it prevented them from looking for a job if they wanted to.

32
TABLE A.1. Outcome Measures for Primary Informal Caregivers, by Type
Living Arrangements and Types of Assistance Provided in Recent Two Weeks Whether lived with care recipient Whether lived within 10 minutes’ travel time of care recipient Whether provided assistance Among those providing assistance: Helped with daily living
activities Helped with household
tasks Helped with routine health
care Kept care recipient
company
Frequency, Amount, and Timing of Care Provided in Recent Two Weeks Mean number of days provided care Among live-in caregivers: Mean hours of care that
benefited care recipient only
Mean hours of care that benefited entire household
Total mean hours of care Among visiting caregivers: Mean hours of care per day
Whether provided care: Before 8 A.M. weekdays After 9 P.M. weekdays
Job Choice and Performance Since Enrollment Whether worked for pay, other than for care recipient Whether did not look for a job, or another job, though wanted to Among those who did, whether caregiving caused them to: Miss work or arrive late Turn down a better job or
promotion Quit job or reduce hours
Caregiver’s Quality of Life Whether caregiving limits: Privacy Free time or social life
Whether care recipient requires almost constant attention from caregiver
Level of emotional strain as a result of caregiving
How satisfied with life in general
Caregiver-Care Recipient Relationship How well caregiver and care recipient get along Whether relationship is better or worse than it was at enrollment Whether care recipient refuses to cooperate when caregiver tries to help
Knowledge, Preparedness, and Consulting Others Whether feels well-informed about care recipient’s condition and services Whether feels fully prepared to meet expectations in helping care recipient Whether consults care recipients with personal care questions
Perception of Care Quality How satisfied with care recipient’s overall care arrangements When caregiver is not with care recipient, how often worries about: Care recipient not getting
enough care Care recipient’s safety Someone taking care
recipient’s money or other belongings
Health and Functioning Current health status relative to that of peers Whether illness or disability cause problems with: Preparing meals, doing
housework, laundry, shopping, taking medicine, or managing money
Eating, getting out of bed or a chair, dressing, bathing, or using the toilet
Financial Well-being Level of financial strain as a result of caregiving Household income last month
Physical Well-being Whether physical health suffered as a result of caregiving Level of physical strain as a result of caregiving
NOTE: Primary informal caregivers are those providing the most unpaid care to care recipients at baseline. Outcomes were measured about 10 months after baseline.
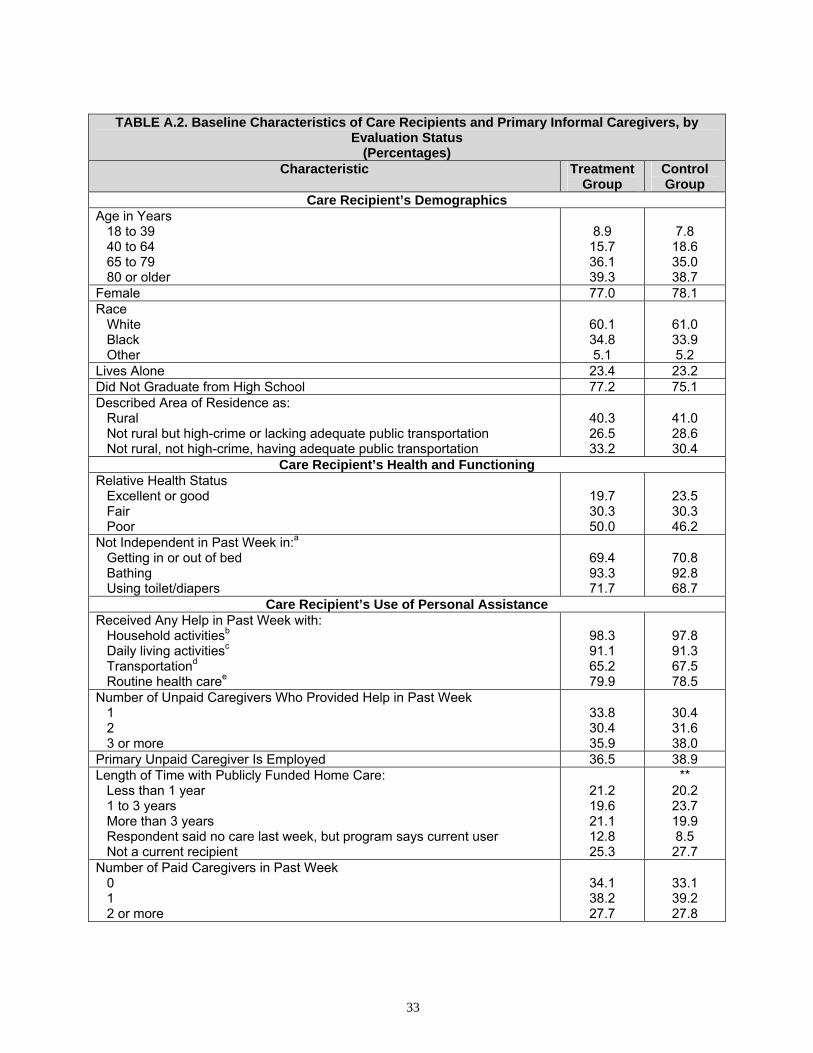
33
TABLE A.2. Baseline Characteristics of Care Recipients and Primary Informal Caregivers, by
Evaluation Status (Percentages)
Characteristic Treatment Group
Control Group
Care Recipient’s Demographics Age in Years
18 to 39 40 to 64 65 to 79 80 or older
8.9
15.7 36.1 39.3
7.8 18.6 35.0 38.7
Female 77.0 78.1 Race
White Black Other
60.1 34.8 5.1
61.0 33.9 5.2
Lives Alone 23.4 23.2 Did Not Graduate from High School 77.2 75.1 Described Area of Residence as:
Rural Not rural but high-crime or lacking adequate public transportation Not rural, not high-crime, having adequate public transportation
40.3 26.5 33.2
41.0 28.6 30.4
Care Recipient’s Health and Functioning Relative Health Status
Excellent or good Fair Poor
19.7 30.3 50.0
23.5 30.3 46.2
Not Independent in Past Week in:aGetting in or out of bed Bathing Using toilet/diapers
69.4 93.3 71.7
70.8 92.8 68.7
Care Recipient’s Use of Personal Assistance Received Any Help in Past Week with:
Household activitiesb
Daily living activitiesc
Transportationd
Routine health caree
98.3 91.1 65.2 79.9
97.8 91.3 67.5 78.5
Number of Unpaid Caregivers Who Provided Help in Past Week 1 2 3 or more
33.8 30.4 35.9
30.4 31.6 38.0
Primary Unpaid Caregiver Is Employed 36.5 38.9 Length of Time with Publicly Funded Home Care:
Less than 1 year 1 to 3 years More than 3 years Respondent said no care last week, but program says current user Not a current recipient
21.2 19.6 21.1 12.8 25.3
** 20.2 23.7 19.9 8.5 27.7
Number of Paid Caregivers in Past Week 0 1 2 or more
34.1 38.2 27.7
33.1 39.2 27.8

34
TABLE A.2. (Continued) Characteristic Treatment
Group Control Group
Number of Hours per Week in Medicaid Care Plan 1 to 6 7 to 11 12 to 15
24.7 34.8 40.5
22.5 37.6 39.9
Care Recipients’ Satisfaction with Care and Unmet Needs How Satisfied with Overall Care Arrangements
Very satisfied Satisfied Dissatisfied No paid services or goods in past week
42.7 30.9 14.7 11.7
** 40.3 32.6 18.8 8.3
Not Getting Enough Help with: Household activitiesb
Daily living activitiesc
Transportationd
65.0 61.0 43.4
65.4 65.7* 46.9
Care Recipients’ Attitude Toward IndependentChoices Being Allowed to Pay Family Members or Friends Was Very Important 88.1 86.7 Having a Choice About Paid Workers’ Schedule Was Very Important 81.7 82.1 Having a Choice About Types of Services Received Was Very Important 86.8 87.4 Primary Informal Caregiver Expressed Interest in Being Paid 32.1 39.5***
Care Recipients’ Work Experience and Other Characteristics Ever Supervised Someone 27.8 27.4 Ever Hired Someone Privately 31.2 29.8 Ever Worked for Pay 83.5 83.3 Proxy Completed All or Most of Baseline Survey 52.7 53.0 Appointed a Representative at Enrollment 45.2 48.7 Enrollment Month Was in:
1998 or 1999 2000 or 2001
51.0 49.0
51.7 48.3
Primary Informal Caregivers’ Characteristics Age in Years
39 or younger 40 to 64 65 or older
21.9 66.0 12.1
22.9 62.3 14.8
Female 85.1 87.7 Relationship to Care Recipient
Spouse Parent Daughter or son Other relative Nonrelative
5.1 7.6
64.1 17.1 6.2
6.0 6.5 60.6 18.3 8.6
White 61.3 60.7 Married 53.5 57.2 Has Child(ren) Younger than Age 18 28.4 30.2

35
TABLE A.2. (Continued) Characteristic Treatment
Group Control Group
Highest Level of Education 8 years or less 9 to 12 years, but no high school diploma or GED High school diploma or GED At least some college
11.1 18.1 39.8 31.0
12.4 20.5 40.5 26.7
Sample Size 712 721 SOURCE: MPR’s baseline evaluation interview, conducted between December 1998 and April 2001; caregiver interview, conducted between February 2000 and April 2002; and the IndependentChoices Program. a. Needed hands-on or standby help or did not perform activity at all. b. Household activities include meal preparation, laundry, housework, and yard work. c. Daily living activities include eating, dressing, and bathing. d. Transportation includes trips to a doctor’s office, shopping, school, work, social, and recreational
activities. e. Routine health care includes checking blood pressure, and help taking medicine or doing exercises. * Difference between treatment and control groups significantly different from 0 at the .10 level, two-tailed test. ** Difference between treatment and control groups significantly different from zero at the .05 level, two-tailed test. *** Difference between treatment and control groups significantly different from zero at the .01 level, two-tailed test.
TABLE A.3. Minimum Detectable Effects
Binary Variable Mean Detectable Effect
(Percentage Points) .50 6.57 .30 or .70 6.02 .10 or .90 3.94
TABLE A.4. Examples of Adjustments to Hours of Care Provided Reported Adjusted Case
Care Recipient
Hours
Household Hours
Total Hours
Care Recipient
Hours
Household Hours
Total Hours
1 252 252 504 126 126 252 2 336 84 420 252 84 336 3 168 224 392 168 56 224
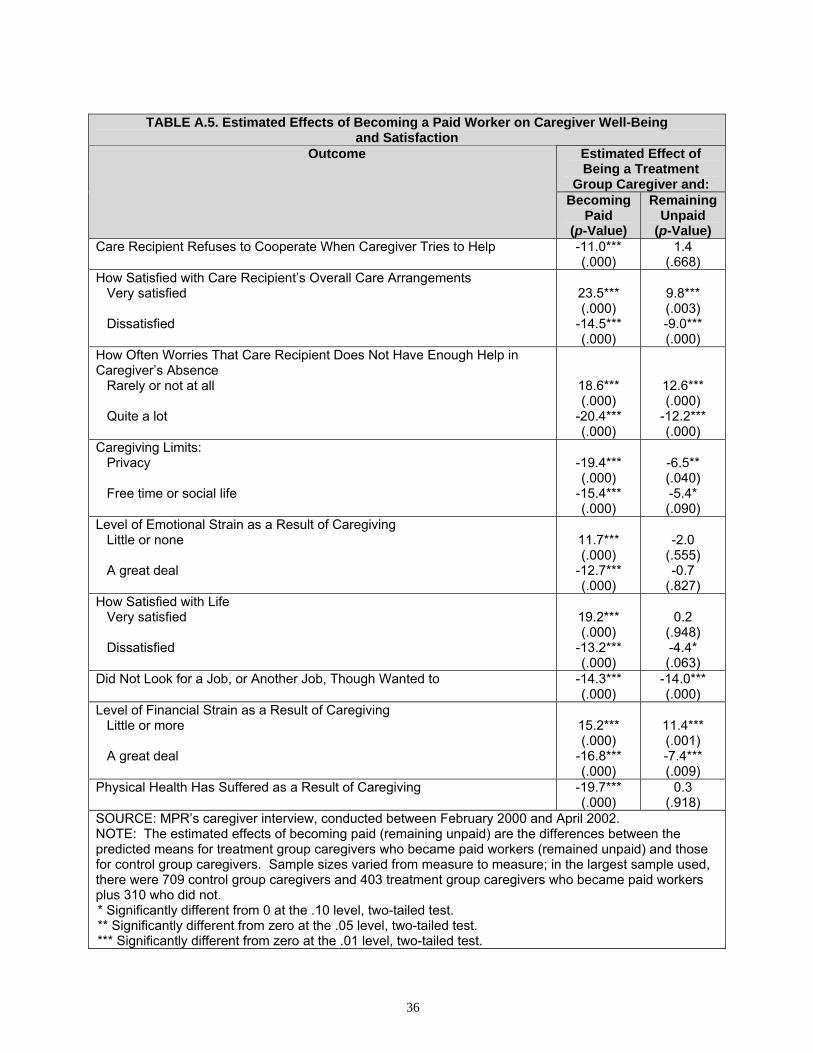
36
TABLE A.5. Estimated Effects of Becoming a Paid Worker on Caregiver Well-Being
and Satisfaction Estimated Effect of Being a Treatment
Group Caregiver and:
Outcome
Becoming Paid
(p-Value)
Remaining Unpaid
(p-Value) Care Recipient Refuses to Cooperate When Caregiver Tries to Help -11.0***
(.000) 1.4
(.668) How Satisfied with Care Recipient’s Overall Care Arrangements
Very satisfied Dissatisfied
23.5*** (.000)
-14.5*** (.000)
9.8*** (.003) -9.0*** (.000)
How Often Worries That Care Recipient Does Not Have Enough Help in Caregiver’s Absence
Rarely or not at all Quite a lot
18.6*** (.000)
-20.4*** (.000)
12.6*** (.000)
-12.2*** (.000)
Caregiving Limits: Privacy Free time or social life
-19.4*** (.000)
-15.4*** (.000)
-6.5** (.040) -5.4* (.090)
Level of Emotional Strain as a Result of Caregiving Little or none A great deal
11.7*** (.000)
-12.7*** (.000)
-2.0
(.555) -0.7
(.827) How Satisfied with Life
Very satisfied Dissatisfied
19.2*** (.000)
-13.2*** (.000)
0.2
(.948) -4.4* (.063)
Did Not Look for a Job, or Another Job, Though Wanted to -14.3*** (.000)
-14.0*** (.000)
Level of Financial Strain as a Result of Caregiving Little or more A great deal
15.2*** (.000)
-16.8*** (.000)
11.4*** (.001) -7.4*** (.009)
Physical Health Has Suffered as a Result of Caregiving -19.7*** (.000)
0.3 (.918)
SOURCE: MPR’s caregiver interview, conducted between February 2000 and April 2002. NOTE: The estimated effects of becoming paid (remaining unpaid) are the differences between the predicted means for treatment group caregivers who became paid workers (remained unpaid) and those for control group caregivers. Sample sizes varied from measure to measure; in the largest sample used, there were 709 control group caregivers and 403 treatment group caregivers who became paid workers plus 310 who did not. * Significantly different from 0 at the .10 level, two-tailed test. ** Significantly different from zero at the .05 level, two-tailed test. *** Significantly different from zero at the .01 level, two-tailed test.

37
TABLE A.6. Reasons Treatment Group Caregivers Did Not Become Paid Workers Reason Percentage
Helped out of love, devotion, or family tradition 28.4 Not allowed to be paid under the programa 22.2 Not able to perform all tasks, or lived far away/has other obligations, or care recipient had someone else in mind
15.0
Benefit not enough to pay me and others or was needed for other things 10.5 Did not know could get paid or program made an error 8.8 Care recipient disenrolled from the program 8.2 Did not need or want the money 3.9 Other 2.9 Number of Respondents 306 SOURCE: MPR’s caregiver interview, conducted between February 2000 and April 2002. NOTE: Treatment group caregivers are those identified at baseline as the primary informal caregivers of care recipients who were randomly assigned to IndependentChoices. a. For example, because the caregiver was the care recipient’s spouse or representative.
TABLE A.7. Estimated Effects of Becoming a Paid Worker on Amount of Assistance Provided Estimated Effect of Being a Treatment
Group Caregiver and:
Outcome
Becoming Paid
(p-Value)
Remaining Unpaid
(p-Value) Number of Days Provided Care 0.7***
(.001) -0.7*** (.003)
Hours of Care Provided by Live-in and Visiting Caregivers -3.1 (.537)
-14.8** (.014)
By live-in caregivers
Hours that benefited care recipient only Hours that benefited entire household
-12.9* (.069) -5.8
(.196) -7.1
(.103)
-12.7 (.127)
0.1 (.986) -12.8** (.013)
By visiting caregivers -0.2 (.977)
-19.9*** (.004)
SOURCE: MPR’s caregiver interview, conducted between February 2000 and April 2002. NOTE: The estimated effects of becoming paid (remaining unpaid) are the differences between the predicted means for treatment group caregivers who became paid workers (remained unpaid) and those for control group caregivers. Sample sizes varied from measure to measure; in the largest sample used, there were 558 control group caregivers and 341 treatment group caregivers who became paid workers plus 225 who did not. * Significantly different from 0 at the .10 level, two-tailed test. ** Significantly different from zero at the .05 level, two-tailed test. *** Significantly different from zero at the .01 level, two-tailed test.
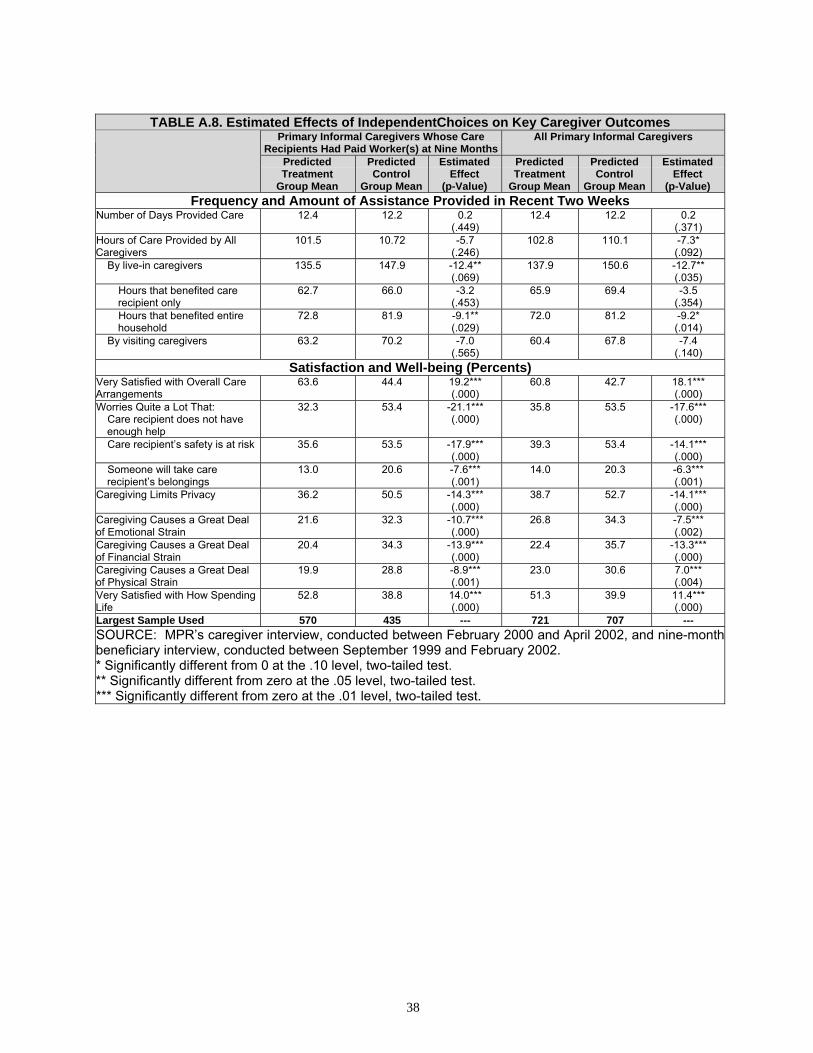
38
TABLE A.8. Estimated Effects of IndependentChoices on Key Caregiver Outcomes
Primary Informal Caregivers Whose Care Recipients Had Paid Worker(s) at Nine Months
All Primary Informal Caregivers
Predicted Treatment
Group Mean
Predicted Control
Group Mean
Estimated Effect
(p-Value)
Predicted Treatment
Group Mean
Predicted Control
Group Mean
Estimated Effect
(p-Value) Frequency and Amount of Assistance Provided in Recent Two Weeks
Number of Days Provided Care 12.4 12.2 0.2 (.449)
12.4 12.2 0.2 (.371)
Hours of Care Provided by All Caregivers
101.5 10.72 -5.7 (.246)
102.8 110.1 -7.3* (.092)
By live-in caregivers 135.5 147.9 -12.4** (.069)
137.9 150.6 -12.7** (.035)
Hours that benefited care recipient only
62.7 66.0 -3.2 (.453)
65.9 69.4 -3.5 (.354)
Hours that benefited entire household
72.8 81.9 -9.1** (.029)
72.0 81.2 -9.2* (.014)
By visiting caregivers 63.2 70.2 -7.0 (.565)
60.4 67.8 -7.4 (.140)
Satisfaction and Well-being (Percents) Very Satisfied with Overall Care Arrangements
63.6 44.4 19.2*** (.000)
60.8 42.7 18.1*** (.000)
Worries Quite a Lot That: Care recipient does not have enough help
32.3 53.4 -21.1*** (.000)
35.8 53.5 -17.6*** (.000)
Care recipient’s safety is at risk 35.6 53.5 -17.9*** (.000)
39.3 53.4 -14.1*** (.000)
Someone will take care recipient’s belongings
13.0 20.6 -7.6*** (.001)
14.0 20.3 -6.3*** (.001)
Caregiving Limits Privacy 36.2 50.5 -14.3*** (.000)
38.7 52.7 -14.1*** (.000)
Caregiving Causes a Great Deal of Emotional Strain
21.6 32.3 -10.7*** (.000)
26.8 34.3 -7.5*** (.002)
Caregiving Causes a Great Deal of Financial Strain
20.4 34.3 -13.9*** (.000)
22.4 35.7 -13.3*** (.000)
Caregiving Causes a Great Deal of Physical Strain
19.9 28.8 -8.9*** (.001)
23.0 30.6 7.0*** (.004)
Very Satisfied with How Spending Life
52.8 38.8 14.0*** (.000)
51.3 39.9 11.4*** (.000)
Largest Sample Used 570 435 --- 721 707 --- SOURCE: MPR’s caregiver interview, conducted between February 2000 and April 2002, and nine-month beneficiary interview, conducted between September 1999 and February 2002. * Significantly different from 0 at the .10 level, two-tailed test. ** Significantly different from zero at the .05 level, two-tailed test. *** Significantly different from zero at the .01 level, two-tailed test.
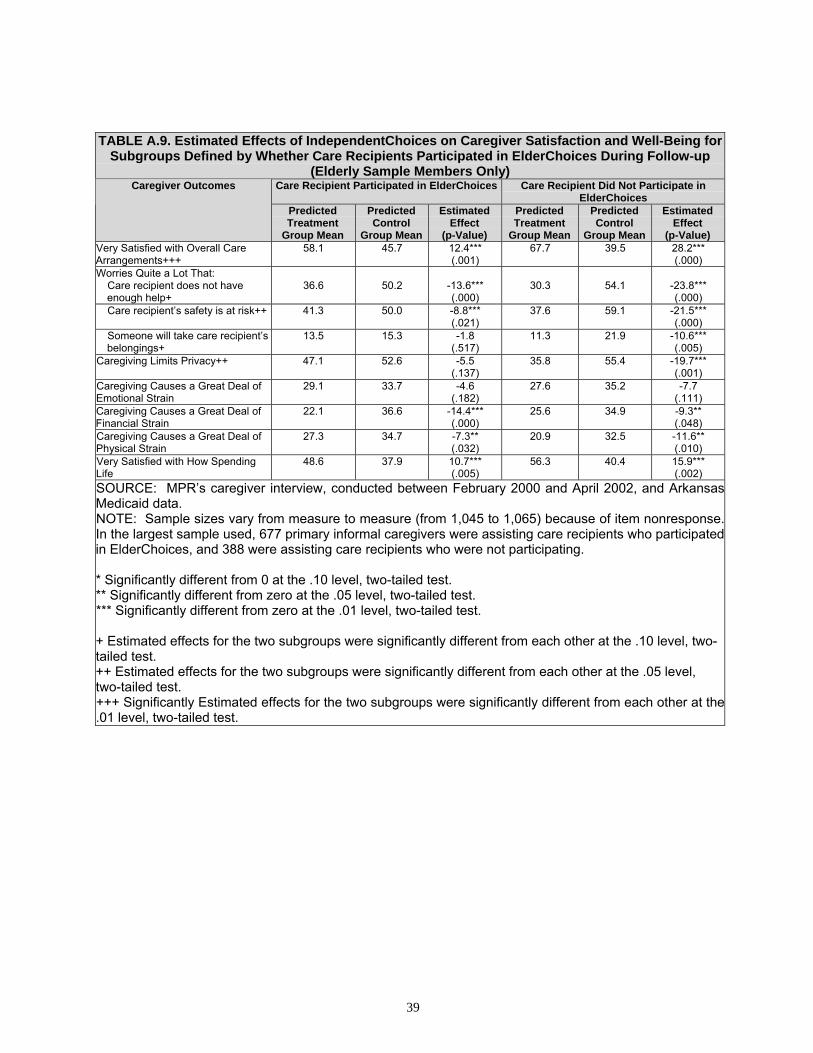
39
TABLE A.9. Estimated Effects of IndependentChoices on Caregiver Satisfaction and Well-Being for Subgroups Defined by Whether Care Recipients Participated in ElderChoices During Follow-up
(Elderly Sample Members Only) Care Recipient Participated in ElderChoices Care Recipient Did Not Participate in
ElderChoices Caregiver Outcomes
Predicted Treatment
Group Mean
Predicted Control
Group Mean
Estimated Effect
(p-Value)
Predicted Treatment
Group Mean
Predicted Control
Group Mean
Estimated Effect
(p-Value) Very Satisfied with Overall Care Arrangements+++
58.1 45.7 12.4*** (.001)
67.7 39.5 28.2*** (.000)
Worries Quite a Lot That: Care recipient does not have enough help+
36.6
50.2
-13.6*** (.000)
30.3
54.1
-23.8*** (.000)
Care recipient’s safety is at risk++ 41.3 50.0 -8.8*** (.021)
37.6 59.1 -21.5*** (.000)
Someone will take care recipient’s belongings+
13.5 15.3 -1.8 (.517)
11.3 21.9 -10.6*** (.005)
Caregiving Limits Privacy++ 47.1 52.6 -5.5 (.137)
35.8 55.4 -19.7*** (.001)
Caregiving Causes a Great Deal of Emotional Strain
29.1 33.7 -4.6 (.182)
27.6 35.2 -7.7 (.111)
Caregiving Causes a Great Deal of Financial Strain
22.1 36.6 -14.4*** (.000)
25.6 34.9 -9.3** (.048)
Caregiving Causes a Great Deal of Physical Strain
27.3 34.7 -7.3** (.032)
20.9 32.5 -11.6** (.010)
Very Satisfied with How Spending Life
48.6 37.9 10.7*** (.005)
56.3 40.4 15.9*** (.002)
SOURCE: MPR’s caregiver interview, conducted between February 2000 and April 2002, and Arkansas Medicaid data. NOTE: Sample sizes vary from measure to measure (from 1,045 to 1,065) because of item nonresponse.In the largest sample used, 677 primary informal caregivers were assisting care recipients who participatedin ElderChoices, and 388 were assisting care recipients who were not participating. * Significantly different from 0 at the .10 level, two-tailed test. ** Significantly different from zero at the .05 level, two-tailed test. *** Significantly different from zero at the .01 level, two-tailed test. + Estimated effects for the two subgroups were significantly different from each other at the .10 level, two-tailed test. ++ Estimated effects for the two subgroups were significantly different from each other at the .05 level, two-tailed test. +++ Significantly Estimated effects for the two subgroups were significantly different from each other at the.01 level, two-tailed test.

40
TABLE A.10. Estimated Effects of IndependentChoices on Living Arrangements of and Assistance Provided by Primary Informal Caregivers
Outcome Predicted Treatment Group Mean
(Percent)
Predicted Control Group Mean
(Percent)
Estimated Effect (p-Value)
Living Arrangements in Recent Two Weeksa
Lived with Care Recipient 57.3 56.8 0.6 (.719)
Lived Within 10 Minutes’ Travel Time of Care Recipient
32.0 31.9 0.1 (.969)
Assistance Provided in Recent Two Weeksa
Provided Any Assistance 93.1 91.2 1.9 (.197)
Among Those Providing Assistance: Helped with daily living activities Helped with household activitiesb
Helped with routine health care Socialized with or kept care
recipient company
92.5
98.1
90.7
96.9
89.7
99.1
90.4
97.9
2.8*
(.077) -1.0
(.144) 0.2
(.882) -1.0
(.309) SOURCE: MPR’s caregiver interview, conducted between February 2000 and April 2002. NOTE: Primary informal caregivers are those providing the most unpaid care to care recipients at baseline. Includes those who became paid workers for care recipients randomly assigned to the treatment group. a. The most recent two weeks the care recipient lived in the home or community during the two
months before the interview. b. Impacts could not be estimated with the logit model. Results presented are the unadjusted control
group means and treatment-control differences. * Significantly different from zero at the .10 level, two-tailed test. ** Significantly different from zero at the .05 level, two-tailed test. *** Significantly different from zero at the .01 level, two-tailed test.
41
TABLE A.11. Estimated Effect of IndependentChoices on Primary Informal Caregivers’ Knowledge and Preparedness
Outcome Predicted Treatment Group Mean
(Percent)
Predicted Control Group Mean
(Percent)
Estimated Effect (p-Value)
Feels Well-Informed About Care Recipient’s Condition and Services
Strongly agrees Disagrees
84.9
3.4
76.5
7.2
8.4*** (.000) -3.8*** (.002)
Feels Fully Prepared to Meet Expectations in Helping Care Recipient
Strongly agrees Disagreesa
90.2
1.8
84.3
3.4
5.9*** (.001) -1.6* (.061)
SOURCE: MPR’s caregiver interview, conducted between February 2000 and April 2002. NOTE: Primary informal caregivers are those providing the most unpaid care to care recipients at baseline. Includes those who became paid workers for care recipients randomly assigned to the treatment group. a. Impacts could not be estimated with the logit model. Results presented are the unadjusted control
group means and treatment-control differences. * Significantly different from zero at the .10 level, two-tailed test. ** Significantly different from zero at the .05 level, two-tailed test. *** Significantly different from zero at the .01 level, two-tailed test.
TABLE A.12. Estimated Effect of IndependentChoices on Primary Informal Caregivers’ Physical Functioning
Outcome Predicted Treatment Group Mean
(Percent)
Predicted Control Group Mean
(Percent)
Estimated Effect (p-Value)
Because of Illness or Disability, Has Problems with at Least One:
Instrumental activity of daily livinga
Activity of daily livingb
11.4
4.9
18.3
7.0
-6.9*** (.000) -2.2* (.091)
SOURCE: MPR’s caregiver interview, conducted between February 2000 and April 2002. NOTES: Primary informal caregivers are those providing the most unpaid care to care recipients at baseline. Includes those who became paid workers for care recipients randomly assigned to the treatment group. a. Includes meal preparation, housework, shopping, taking medication, and managing money. b. Includes eating, getting in or out of bed or chairs, dressing, bathing, or using the toilet. * Significantly different from zero at the .10 level, two-tailed test. ** Significantly different from zero at the .05 level, two-tailed test. *** Significantly different from zero at the .01 level, two-tailed test.
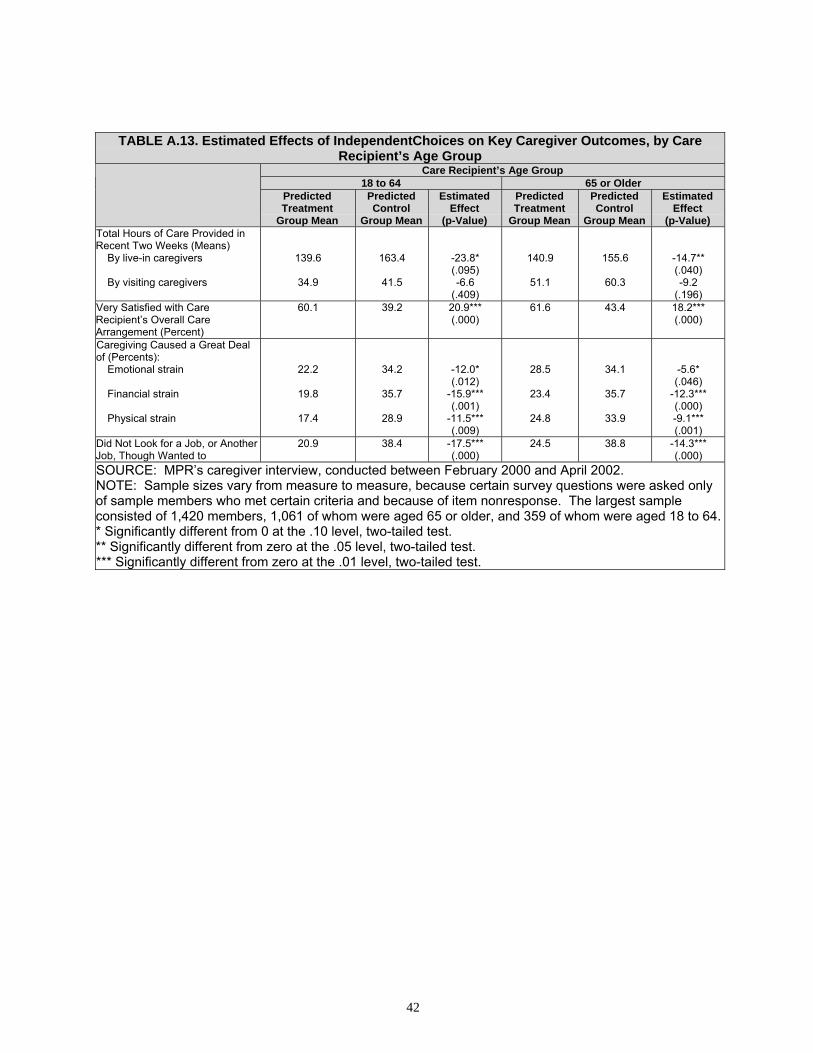
42
TABLE A.13. Estimated Effects of IndependentChoices on Key Caregiver Outcomes, by Care Recipient’s Age Group
Care Recipient’s Age Group 18 to 64 65 or Older
Predicted Treatment
Group Mean
Predicted Control
Group Mean
Estimated Effect
(p-Value)
Predicted Treatment
Group Mean
Predicted Control
Group Mean
Estimated Effect
(p-Value) Total Hours of Care Provided in Recent Two Weeks (Means)
By live-in caregivers By visiting caregivers
139.6
34.9
163.4
41.5
-23.8* (.095) -6.6
(.409)
140.9
51.1
155.6
60.3
-14.7** (.040) -9.2
(.196) Very Satisfied with Care Recipient’s Overall Care Arrangement (Percent)
60.1 39.2 20.9*** (.000)
61.6 43.4 18.2*** (.000)
Caregiving Caused a Great Deal of (Percents):
Emotional strain Financial strain Physical strain
22.2
19.8
17.4
34.2
35.7
28.9
-12.0* (.012)
-15.9*** (.001)
-11.5*** (.009)
28.5
23.4
24.8
34.1
35.7
33.9
-5.6* (.046)
-12.3*** (.000) -9.1*** (.001)
Did Not Look for a Job, or Another Job, Though Wanted to
20.9 38.4 -17.5*** (.000)
24.5 38.8 -14.3*** (.000)
SOURCE: MPR’s caregiver interview, conducted between February 2000 and April 2002. NOTE: Sample sizes vary from measure to measure, because certain survey questions were asked only of sample members who met certain criteria and because of item nonresponse. The largest sample consisted of 1,420 members, 1,061 of whom were aged 65 or older, and 359 of whom were aged 18 to 64.* Significantly different from 0 at the .10 level, two-tailed test. ** Significantly different from zero at the .05 level, two-tailed test. *** Significantly different from zero at the .01 level, two-tailed test.
Related Documents