SHRP 2 Reliability Project R07 Earthwork Performance Specification Integrating Proof Mapping and Alternative In Situ Testing

Welcome message from author
This document is posted to help you gain knowledge. Please leave a comment to let me know what you think about it! Share it to your friends and learn new things together.
Transcript

SHRP 2 Reliability Project R07
Earthwork Performance Specification Integrating Proof Mapping and Alternative In Situ
Testing

SHRP 2 Reliability Project R07
Earthwork Performance Specification Integrating Proof Mapping and Alternative In
Situ Testing
TRANSPORTATION RESEARCH BOARD Washington, D.C.
2014 www.TRB.org

© 2014 National Academy of Sciences. All rights reserved. ACKNOWLEDGMENT This work was sponsored by the Federal Highway Administration in cooperation with the American Association of State Highway and Transportation Officials. It was conducted in the second Strategic Highway Research Program, which is administered by the Transportation Research Board of the National Academies. COPYRIGHT INFORMATION Authors herein are responsible for the authenticity of their materials and for obtaining written permissions from publishers or persons who own the copyright to any previously published or copyrighted material used herein. The second Strategic Highway Research Program grants permission to reproduce material in this publication for classroom and not-for-profit purposes. Permission is given with the understanding that none of the material will be used to imply TRB, AASHTO, or FHWA endorsement of a particular product, method, or practice. It is expected that those reproducing material in this document for educational and not-for-profit purposes will give appropriate acknowledgment of the source of any reprinted or reproduced material. For other uses of the material, request permission from SHRP 2. NOTICE The project that is the subject of this document was a part of the second Strategic Highway Research Program, conducted by the Transportation Research Board with the approval of the Governing Board of the National Research Council. The Transportation Research Board of the National Academies, the National Research Council, and the sponsors of the second Strategic Highway Research Program do not endorse products or manufacturers. Trade or manufacturers’ names appear herein solely because they are considered essential to the object of the report. DISCLAIMER The opinions and conclusions expressed or implied in this document are those of the researchers who performed the research. They are not necessarily those of the second Strategic Highway Research Program, the Transportation Research Board, the National Research Council, or the program sponsors. The information contained in this document was taken directly from the submission of the authors. This material has not been edited by the Transportation Research Board. SPECIAL NOTE: This document IS NOT an official publication of the second Strategic Highway Research Program, the Transportation Research Board, the National Research Council, or the National Academies.

The National Academy of Sciences is a private, nonprofit, self-perpetuating society of distinguished scholars engaged in scientific and engineering research, dedicated to the furtherance of science and technology and to their use for the general welfare. On the authority of the charter granted to it by Congress in 1863, the Academy has a mandate that requires it to advise the federal government on scientific and technical matters. Dr. Ralph J. Cicerone is president of the National Academy of Sciences.
The National Academy of Engineering was established in 1964, under the charter of the National Academy of Sciences, as a parallel organization of outstanding engineers. It is autonomous in its administration and in the selection of its members, sharing with the National Academy of Sciences the responsibility for advising the federal government. The National Academy of Engineering also sponsors engineering programs aimed at meeting national needs, encourages education and research, and recognizes the superior achievements of engineers. Dr. C. D. (Dan) Mote, Jr., is president of the National Academy of Engineering.
The Institute of Medicine was established in 1970 by the National Academy of Sciences to secure the services of eminent members of appropriate professions in the examination of policy matters pertaining to the health of the public. The Institute acts under the responsibility given to the National Academy of Sciences by its congressional charter to be an adviser to the federal government and, upon its own initiative, to identify issues of medical care, research, and education. Dr. Victor J. Dzau is president of the Institute of Medicine.
The National Research Council was organized by the National Academy of Sciences in 1916 to associate the broad community of science and technology with the Academy’s purposes of furthering knowledge and advising the federal government. Functioning in accordance with general policies determined by the Academy, the Council has become the principal operating agency of both the National Academy of Sciences and the National Academy of Engineering in providing services to the government, the public, and the scientific and engineering communities. The Council is administered jointly by both Academies and the Institute of Medicine. Dr. Ralph J. Cicerone and Dr. C.D. (Dan) Mote, Jr., are chair and vice chair, respectively, of the National Research Council.
The Transportation Research Board is one of six major divisions of the National Research Council. The mission of the Transportation Research Board is to provide leadership in transportation innovation and progress through research and information exchange, conducted within a setting that is objective, interdisciplinary, and multimodal. The Board’s varied activities annually engage about 7,000 engineers, scientists, and other transportation researchers and practitioners from the public and private sectors and academia, all of whom contribute their expertise in the public interest. The program is supported by state transportation departments, federal agencies including the component administrations of the U.S. Department of Transportation, and other organizations and individuals interested in the development of transportation. www.TRB.org
www.national-academies.org

EARTHWORK PERFORMANCE SPECIFICATIONINTEGRATING PROOF MAPPING AND
ALTERNATIVE IN SITU TESTING
Demonstration Project Report: SHRP 2 R07 MoDOT Hwy 141, Chesterfield, MO
November 2010 – December 2011
Prepared By
David J. White, Ph.D.
May 2013


TABLE OF CONTENTS
ACKNOWLEDGMENTS
INTRODUCTION
BACKGROUND
Machine Drive Power (MDP) Value Compaction Meter Value (CMV) and Resonant Meter Value (RMV)
REGRESSION ANALYSIS METHODS
EXPERIMENTAL TESTING
Description of Test Areas Material Properties In situ Testing Methods
EXPERIMENTAL TEST RESULTS
Test Area #2: CS-563E – Type 5 Aggregate Base Test Area #3: CS-563E – Backfill Adjacent to Double Box Culvert Test Area #5: CS-563E – MSE Wall Backfill Test Area #6: CS-563E – Type 5 Subbase at Tuador Road Test Area #7 through 11Subgrade Proof Mapping and Calibration Comparison of Project Level QA/QC Results.
EXIT INTERVIEWS
SUMMARY AND CONCLUSION
REFERENCES
3

Acknowledgments
This study was funded as part of the SHRP2 R07 research effort to develop geotechnical guide
performance specifications. William Stone, Mike Fritz, Joseph Jones, Jesse Jonas, Christopher Cruse,
and Nancy Lerone, from Missouri DOT provided assistance with field coordination and testing. Justin
Zimpfer, Kellan Comte, Dave Dwiggins, Ross Adams, and Dan Gruen with Fred Weber Inc. provided
roller operators and assistance with GPS. Caterpillar Inc. provided IC rollers. Allen DeClerk and Dean
Potts with Caterpillar provided field support on the IC rollers. Lashonda Neal with ABNA Engineering
Inc. provided assistance with QC testing. All their assistance and interest is greatly appreciated.

Introduction
Earthwork and pavement foundation construction are high impact opportunities for development of
performance specifications. Moving in this direction is consistent with some of the European practices for
road building, is in-line with results from interviewing contractors and state agency personnel, and is
consistent with feedback collected from the intelligent compaction workshops (e.g., White and
Vennapusa 2012). The SHRP 2 R07 team developed a pilot study program in partnership with
Missouri Department of Transportation (MoDOT) to investigate effectiveness and impacts of
incorporating selected quality assurance/quality control (QA/QC) testing technologies that provide
performance measurements. The focus of the pilot study was to develop and evaluate performance
specifications for proof mapping prepared subgrade with intelligent compaction and to use modulus
and strength based in situ testing for QA/QC operations for embankment construction. Two
guide specifications were developed and refined based on this project and are provided separate from
this project data report. This report presents results from the pilot investigation conducted on the US-141 highway project
in Chesterfield, Missouri, to evaluate new concepts for geotechnical performance specifications involving
embankment and pavement foundation construction. Alternative in situ testing methods and use of
prototype intelligent compaction (IC) technologies were investigated and compared to traditional QA/QC
testing involving nuclear density/moisture testing. The intelligent compaction systems used on this project
included a Caterpillar CS-563E self-propelled smooth drum roller equipped with machine drive power
(MDP) and compaction meter value (CMV) measurement technologies and an 815F impact roller
equipped with MDP technology. The machines were equipped with real time kinematic (RTK) global
positioning system (GPS) and onboard display and documentation systems. The high accuracy RTK-GPS
provided the opportunity to determine compacted lift thicknesses.
The project involved constructing and testing several test areas consisting of silty clay
embankment fill and crushed limestone aggregate used for mechanically stabilized earth (MSE) wall
backfill or pavement subbase (i.e. Type 5 base). The intelligent compaction measurement values (IC-
MVs) were evaluated by conducting nuclear density/moisture content tests, dynamic cone penetration
tests to determine the California bearing ratio (CBR), plate load tests to determine the modulus of
subgrade reaction, and rut depth from proof rolling with a loaded tandem axle dump truck. MoDOT field
personnel, contractor’s personnel (Fred Weber Inc.), representatives from the IC roller manufacturer
(Caterpillar), and SHRP R07 research team participated in the field testing phase of the project.
The overall goals of the pilot project were to
1

• Identify suitable QA/QC testing technologies to improve test frequency and construction process control;
• Develop effective reporting, analysis, and evaluation protocols;
• Link the design approach with construction monitoring and develop performance models that include a long-term performance aspect;
• Study the impact of two alternative performance specifications on the responsibilities and actions of parties involved; and
• Assess the cost/benefit of implementing the performance specification.
The research plan was geared toward achieving the goals defined above. The plan involved four
primary tasks provided below:
• Develop pilot specifications (a proof mapping specification and a more comprehensive embankment specification)
• Develop onsite training plans
• Develop experimental plans and conduct field testing
• Conduct data analysis and submit final report
These tasks were completed working closely with MoDOT to identify a suitable project and
developing pilot specifications. The initial phase of the project involved field demonstration to provide
experience to the contractor and MoDOT. Near the completion of the project, the QA/QC operations and
IC roller operations were turned over completely to the project personnel.
The results described in this report present an exciting advancement with performance
specifications for earthworks and pavement foundations. One of the significant outcomes of this project
was using intelligent compaction and mechanistic related QA/QC testing methods that were evaluated on
a full-scale project. Effective implementation of these innovative construction technologies have the
potential to provide the contractors and project owners improved job safety, faster construction, greater
cost savings, and improved performance and life-cycle cost of the pavements.
In the project planning phase of this effort Table 1 was develop to provide a list of how the
current constraints in development and implementation of geotechnical performance specifications could
be mitigated as an outcome of this project. As presented in the table, several of the mitigation strategies
were investigated. There remains significant work to fully implement the technologies studied in this
research. As presented in the exit interviews, however, there is generally positive feedback from all
2

involved to continue to investigate ways to implement and benefit from intelligent compaction and in situ
performance measurements.
Table 1: Mitigation strategies for improved performance specifications for earthwork and pavement foundations
No. Constraints Mitigation Strategies
1 Lack of information to quantify variability and reliability for design
Use statistically robust methods to better quantify uncertainty in measurement systems and their relationships to mechanistic parameters, and use IC measurements to address variability.
2 Poor understanding of mechanism(s) of the system or lack of suitable design methodology
Integrate 100% coverage IC data correlated with mechanistic parameters along with long-term performance data to calibrate numerical models and further the understanding of the behavior of pavement systems.
3 Poorly understood or lack of suitable QA/QC testing technologies
Obtain QA/QC measurements that are mechanistically related, e.g., stiffness/modulus and shear strength.
4 Lack of understanding of material behavior in the long term
Conduct resilient modulus/ repeated loading triaxial testing (to determine resilient and permanent deformation properties) on representative samples with anticipated in situ moisture contents/densities (during construction), and on samples in different environmental conditions (e.g., following freeze/thaw cycles, saturation, etc.).
5 Undocumented long-term durability/performance
Monitor some select sections of the project over a period of 5+ years with periodic falling weight deflectometer (FWD) testing, pavement condition surveys, ground water and temperature fluctuations in the foundation layers, and in-ground stresses.
6 Need for greater frequency of testing for design and construction
Calibrate IC measurement values to mechanistic parameter values and use the 100% coverage information.
7 Requirement for more upfront laboratory work and field test sections
Conduct laboratory testing on materials at different moisture-density combinations on foundation layer materials.
8 No suitable cost/benefit of life-cycle cost analysis model
Document project cost information and integrate long-term performance data as it becomes available to develop a reliable life-cycle cost analysis model. Provide a rational basis to set pay factors.
This report presents brief background information for the IC-MVs evaluated in this study (MDP,
and CMV), documents the results and analysis from the field testing, and documents the field
demonstration activities. Geostatistical methods were used to quantify QA/QC results of the embankment
subgrade and subbase materials. Regression analysis was performed to evaluate correlations between IC-
MVs and in situ soil properties determined using point-MVs. The correlation results were used to
establish target values. Density and moisture content tests were performed using nuclear gauges at several
locations independently by the QC and QA inspectors. Plate load test (PLTs) and dynamic cone
penetrometers were used to evaluate stiffness and strength properties.
The results and correlations provided in this report should be of significant interest to the
pavement, geotechnical, and construction engineering community and are anticipated to serve as a good
3

knowledge base for implementation of IC compaction monitoring technologies and various new in situ
testing methods into earthwork construction practice.
4

Background
Roller compaction monitoring technologies with GPS documentation offer 100% coverage information
with real-time data visualization of compaction data, a significant improvement over traditional quality
control/assurance (QA/QC) procedures involving tests at discrete point locations. Several equipment
manufacturers have been developing these technologies applicable to both earthwork and hot-mix asphalt
materials over the past 30+ years. By making the compaction machine a measuring device, the
compaction process can potentially be managed and controlled to improve quality, reduce rework,
maximize productivity, and minimize costs. With data provided in real time, process control parameters
(e.g., moisture control, lift thickness, and so on) can be altered to insure acceptance requirements are met
the first time. Project schedules are thereby reduced and delays for post-process inspections can be
avoided.
To date, results from research and demonstration projects have shown promise in application of
the intelligent compaction technologies for earthwork construction, although results are somewhat
limited. A few pilot specifications have and are being developed by state agencies in the United States
(e.g., MnDOT) and a few specifications exists from European countries. A review of these specifications
indicates a weakness in that they are technology and material specific, and there are no widely accepted
specifications in the United States. Lack of experience and proper education/training materials,
correlations on a wide range of materials between roller measurement values and traditionally used
QA/QC testing tools, poor database and documentation of existing data/case histories, standard protocols
for data analysis/management, and standardized specifications inclusive of various intelligent compaction
technologies are major obstacles for successful implementation of the intelligent compaction
technologies. This proposal identifies tasks to make advancements in these areas for more effective
implementation and use of the technologies for MoDOT.
As an example, Figure 1 shows spatial maps of roller compaction values from a padfoot roller on
a clay subgrade material from pass 1 to 8 over a test section of approximately 180 m in length (red
indicates low stiffness and dark green indicates high stiffness). In the past, research studies, were
performed to validate roller measurements and correlate results with a variety of in situ test devices
measuring relative compaction, moisture content, stiffness/modulus, and shear strength. Some commonly
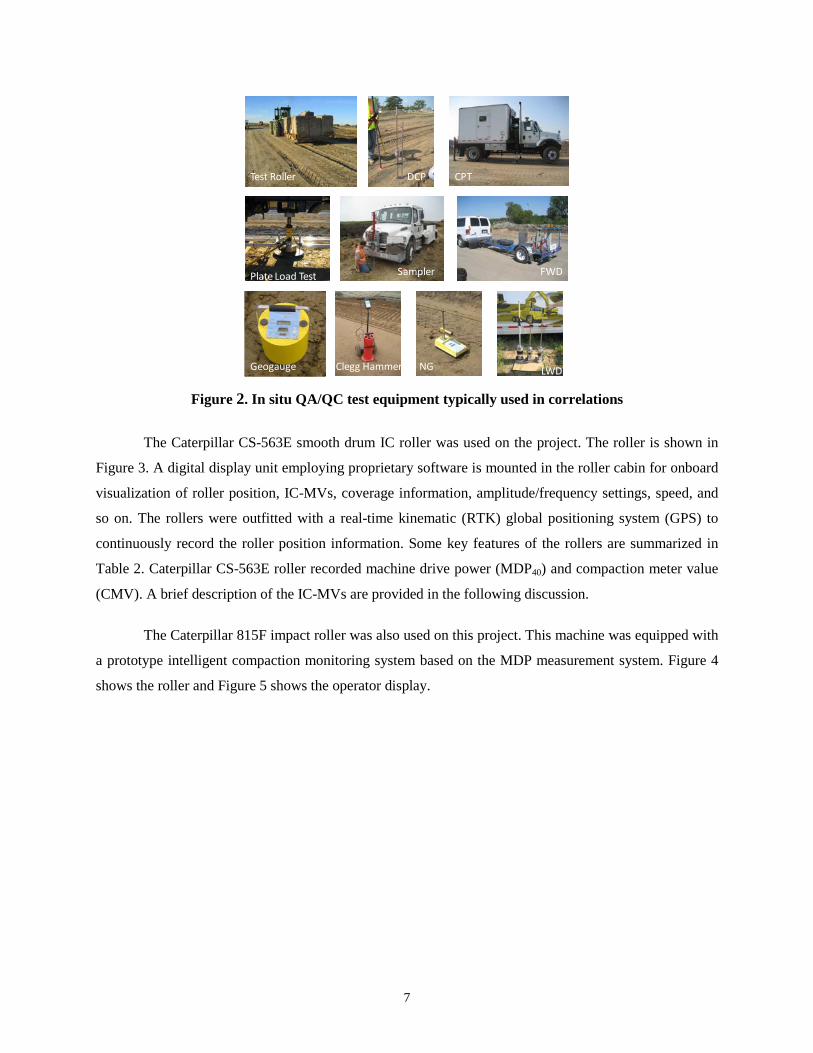
used in situ test devices are shown in Figure 2. The correlations are typically obtained by constructing test
sections and conducting in situ test measurements at discrete point locations in conjunction with roller
compaction operations and correlate with spatially referenced roller measurement values. Results
indicated that roller measurement values can be empirically correlated to dry density measurements but
5

generally require multiple regression analysis, particularly for cohesive soils (Thompson and White
2008). While density and moisture content measurements are widely accepted measures of compaction,
these physical property measurements are not necessarily direct measures of performance. There has
been growing interest in obtaining in situ measurements that provide mechanistic parameters (e.g.,
stiffness/modulus, strength, and so on) as an alternative to traditional moisture-dry density measurements
(see White et al. 2007a, 2009). Some of the new emerging technologies that measure mechanistic
properties in situ include light weight deflectometer (LWD) and falling weight deflectometer (FWD).
By comparing roller compaction measurements with mechanistic measurements, performance
attributes in terms of an assessment of the design stiffness values and the spatial variability are captured.
This approach will surely improve construction process control and provide assurance that the “quality
statements” described earlier have been achieved.
Source: White et al. 2008a
Figure 1. Padfoot roller measurement color coded maps for different passes on a cohesive clay subgrade from Texas.
6
Test Roller DCP
LWD
CPT
SamplerPlate Load Test
NGClegg HammerGeogauge
FWD
Figure 2. In situ QA/QC test equipment typically used in correlations
The Caterpillar CS-563E smooth drum IC roller was used on the project. The roller is shown in
Figure 3. A digital display unit employing proprietary software is mounted in the roller cabin for onboard
visualization of roller position, IC-MVs, coverage information, amplitude/frequency settings, speed, and
so on. The rollers were outfitted with a real-time kinematic (RTK) global positioning system (GPS) to
continuously record the roller position information. Some key features of the rollers are summarized in
Table 2. Caterpillar CS-563E roller recorded machine drive power (MDP40) and compaction meter value
(CMV). A brief description of the IC-MVs are provided in the following discussion.
The Caterpillar 815F impact roller was also used on this project. This machine was equipped with
a prototype intelligent compaction monitoring system based on the MDP measurement system. Figure 4
shows the roller and Figure 5 shows the operator display.
7

Figure 3. Caterpillar CS-563E Smooth drum roller.
Figure 4. Caterpillar 815F impact roller.
8

Figure 5. Caterpillar roller operator display.
9

Table 2. Key features of the IC rollers used on the project
Feature Caterpillar CS-563E and 815F Rollers Drum Type CS563E – Smooth drum; 815F impact foot configurations Frequency ( f ) CS563E - 30 Hz; 815F static only Amplitude (a) Settings
Static, 0.90 mm (low amplitude), and 1.80 mm (high amplitude)
IC-MV MDP40 (shown as CCV in the output) and CMV and RMV (CS-563E ony)
Display Software AccuGrade® GPS coordinates Based on local arbitrary coordinates at the base station
Output Documentation
Date/Time, Location (Northing/Easting/Elevation of left and right ends of the roller drum), Speed, CCV, CMV, RMV, Frequency, Amplitude (theoretical), Direction (forward/ backward), Vibration (On/Off)
Data frequency About every 0.2 m at the center of the drum (for a nominal v = 4 km/h)
Output Export File *.csv Automatic Feedback Control (AFC) No
Machine Drive Power (MDP) Value
MDP technology relates mechanical performance of the roller during compaction to the
properties of the compacted soil. Detailed background information on the MDP system is provided by
White et al. (2005). Controlled field studies documented by White and Thompson (2008), Thompson and
White (2008), and Vennapusa et al. (2009) verified that MDP values are empirically related to soil
compaction characteristics (e.g., density, stiffness, and strength). MDP is calculated using Eq. 1.
( )bmvg
'ASinWvPMDP g +−
+α−= (1)
Where MDP = machine drive power (kJ/s), Pg = gross power needed to move the machine (kJ/s),
W = roller weight (kN), A’ = machine acceleration (m/s2), g = acceleration of gravity (m/s2), α = slope
angle (roller pitch from a sensor), v = roller velocity (m/s), and m (kJ/m) and b (kJ/s) = machine internal
loss coefficients specific to a particular machine (White et al. 2005). MDP is a relative value referencing
the material properties of the calibration surface, which is generally a hard compacted surface (MDP = 0
kJ/s). Positive MDP values therefore indicate material that is less compact than the calibration surface,
while negative MDP values indicate material that is more compacted than the calibration surface (i.e. less
roller drum sinkage). The MDP values obtained from the machine were recalculated to range between 1
10

and 150 using Eq. 2 (referred to as MDP40). In Eq. 3, the calibration surface with MDP = 0 kJ/s was
scaled to MDP40 = 150 and a soft surface with MDP = 54.23 kJ/s (40000 lb-ft/s) was scaled to MDP40 = 1.
)MDP(77.2150MDP40 −= (2)
Compaction Meter Value (CMV) and Resonant Meter Value (RMV)
CMV is a dimensionless compaction parameter developed by Geodynamik that depends on roller
dimensions, (i.e., drum diameter and weight) and roller operation parameters (e.g., frequency, amplitude,
speed), and is determined using the dynamic roller response (Sandström 1994). It is calculated using Eq.
3, where C is a constant (300), A2Ω = the acceleration of the first harmonic component of the vibration,
AΩ = the acceleration of the fundamental component of the vibration (Sandström and Pettersson 2004).
Correlation studies relating CMV to soil dry unit weight, strength, and stiffness are documented in the
literature (e.g., Floss et al. 1983, Samaras et al. 1991, Brandl and Adam 1997, Thompson and White
2008, White and Thompson 2008).
Ω
Ω⋅=AA
C CMV 2 (3)
RMV provides an indication of the drum behavior (e.g. continuous contact, partial uplift, double
jump, rocking motion, and chaotic motion) and is calculated using Eq. 4, where A0.5Ω = subharmonic
acceleration amplitude caused by jumping (the drum skips every other cycle). It is important to note that
the drum behavior affects the CMV measurements (Brandl and Adam 1997) and therefore must be
interpreted in conjunction with the RMV measurements (Vennapusa et al. 2010).
Ω
Ω⋅=A
AC RMV 0.5
(4)
11

regression Analysis Methods
Simple linear and non-linear regression relationships between IC-MVs and in-situ point measurement
values (Point MVs) were developed by spatially pairing the data obtained from the test beds. The analysis
was performed by considering point-MVs as “true” independent variables and IC-MVs as dependent
variables using the models shown in Eqs. 7 to 8, where b0 = intercept and b1, b2 = regression parameters.
Linear model: MVintPobbMVIC 10 ⋅+=− (5) Non-linear power model: 2b
1 )MVintPo(bMVIC =− (6)
Statistical significance of the independent variable was assessed based on p- and t-values. The
selected criteria for identifying the significance of a parameter included: p-value < 0.05 = significant, <
0.10 = possibly significant, > 0.10 = not significant, and t-value < -2 or > +2 = significant. The best fit
model is determined based on the strength of the regression relationships assessed by the coefficient of
determination (i.e., R2) values. For the analysis and discussion in this report, an R2 value ≥ 0.5 is
considered acceptable following the guidelines from European specifications. A statistical prediction
interval approach for determining “target” values from the regression relationships would account for R2
values in the relationships (see NCHRP 21-09, 2010). A regression relationship with lower R2 values
would result in higher target value and a regression relationship with higher R2 value will result in lower
target values.
12

Experimental Testing
Description of Test Areas
A total of eleven test areas including embankment subgrade materials silty clay), pavement subbase Type
5 crushed limestone, and MSE wall backfill were studied. Data on material index properties and Standard
Proctor compaction values were provided by MoDOT. A summary of test beds with material conditions
and tests performed is provided in Table 3. A summary of material index properties is provided in Table
4. Details regarding construction and testing of each test bed are provided in the discussion later. The
following specific objectives were targeted for the different test beds evaluated in this study:
• Capture data over wide measurement range to develop IC-MV and different in-situ point-MV correlations
• Demonstrate the usefulness of using IC-MV maps for selection of QA test locations
• Explore analysis methods to quantify and characterize spatial non-uniformity of embankment materials.
• Compare IC-MVs for two different roller configurations.
Figure 6 shows the Hwy 141 project layout.
13

Figure 6: Hwy 141 pilot project layout (courtesy of MoDOT)
14
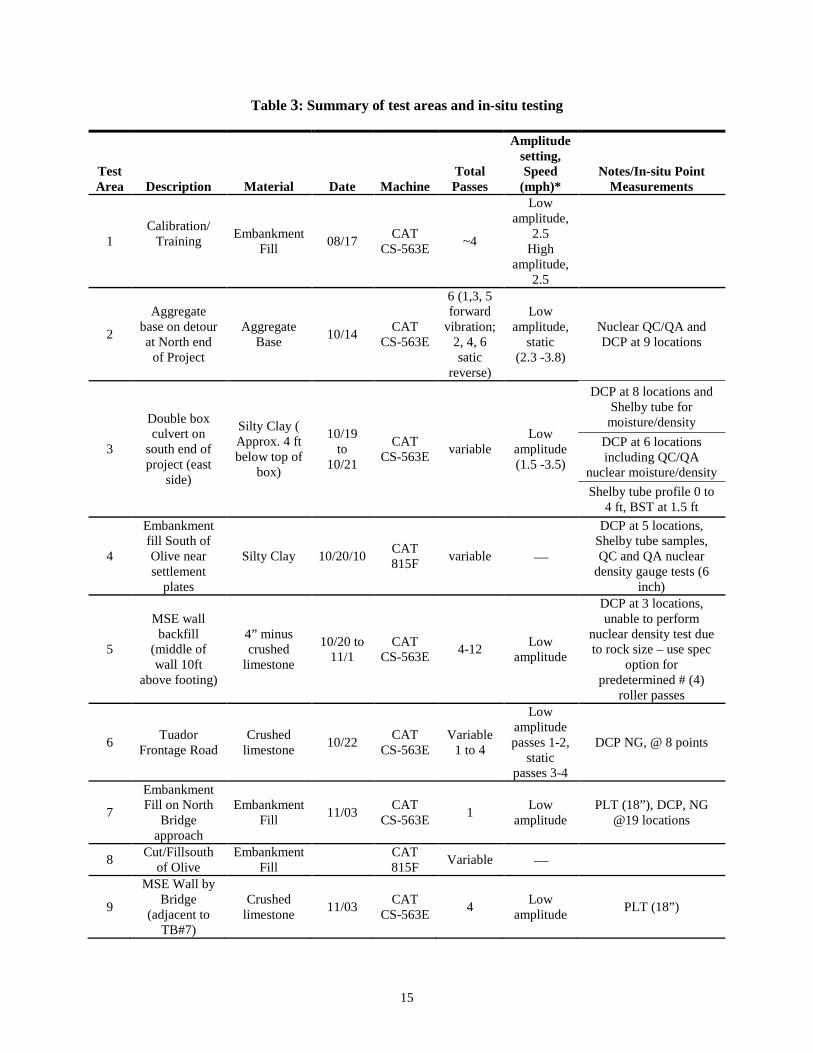
Table 3: Summary of test areas and in-situ testing
Test Area Description Material Date Machine
Total Passes
Amplitude setting, Speed
(mph)* Notes/In-situ Point
Measurements
1 Calibration/
Training
Embankment Fill 08/17 CAT
CS-563E ~4
Low amplitude,
2.5 High
amplitude, 2.5
2
Aggregate base on detour at North end
of Project
Aggregate Base 10/14 CAT
CS-563E
6 (1,3, 5 forward
vibration; 2, 4, 6 satic
reverse)
Low amplitude,
static (2.3 -3.8)
Nuclear QC/QA and DCP at 9 locations
3
Double box culvert on
south end of project (east
side)
Silty Clay ( Approx. 4 ft below top of
box)
10/19 to
10/21
CAT CS-563E variable
Low amplitude (1.5 -3.5)
DCP at 8 locations and Shelby tube for
moisture/density DCP at 6 locations including QC/QA
nuclear moisture/density Shelby tube profile 0 to
4 ft, BST at 1.5 ft
4
Embankment fill South of Olive near settlement
plates
Silty Clay 10/20/10 CAT 815F variable
DCP at 5 locations, Shelby tube samples, QC and QA nuclear
density gauge tests (6 inch)
5
MSE wall backfill
(middle of wall 10ft
above footing)
4” minus crushed
limestone
10/20 to 11/1
CAT CS-563E 4-12 Low
amplitude
DCP at 3 locations, unable to perform
nuclear density test due to rock size – use spec
option for predetermined # (4)
roller passes
6 Tuador Frontage Road
Crushed limestone 10/22 CAT
CS-563E Variable
1 to 4
Low amplitude passes 1-2,
static passes 3-4
DCP NG, @ 8 points
7
Embankment Fill on North
Bridge approach
Embankment Fill 11/03 CAT
CS-563E 1 Low amplitude
PLT (18”), DCP, NG @19 locations
8 Cut/Fillsouth of Olive
Embankment Fill CAT
815F Variable
9
MSE Wall by Bridge
(adjacent to TB#7)
Crushed limestone 11/03 CAT
CS-563E 4 Low amplitude PLT (18”)
15

Test Area Description Material Date Machine
Total Passes
Amplitude setting, Speed
(mph)* Notes/In-situ Point
Measurements
10
Production Area
Compaction between box culverts on south end
Silty clay embankment
fill CAT
815F Variable NG
11 Embankment Fill – by old
barn area
Silty clay embankment
fill CAT
815F Variable NG
Material Properties
Laboratory testing results were provided for two primary materials used on the project. The results are
summarized in Table 3. Figure 8 shows the silty clay embankment fill material.
Table 4: Summary of material index properties
Parameter Embankment Fill Base Standard Proctor Test Results (ASTM D698-00a)
γdmax (pcf) 106.0 130.8 wopt 17.0 10.2 Atterberg Limits Test Results (ASTM D4318-05) Liquid Limit, LL (%) 33
― Plasticity Index, PI (%) 7
Figure 7: Silty clay embankment fill material
16

InSitu Testing Methods
Three different in situ testing methods were used in this study to evaluate the in situ soil engineering
properties (Figure 8): (a) plate load testing (b) Dynamic Cone Penetrometer (DCP) to determine
California bearing Ratio (CBR), and (c) calibrated Humboldt nuclear gauge (NG)to measure moisture
content (w) and dry unit weight (γd).
DCP tests were performed in accordance with ASTM D6951-03 to determine dynamic cone
penetration index (DPI) and calculate CBR using Eq. 10. The DCP test results are presented in this report
as CBR point values or CBR depth profiles. When the data is presented as point values, the data
represents a weighted average CBR of the top 300 mm depth.
12.1DPI292CBR = (10)
Figure 9 shows the equipment used in this study.
17

(a) (b)
(c) (d)
Figure 8: In situ testing methods used on the project: (a) nuclear density gauges, (b) plate load test, (c) dynamic cone penetrometer, and (d) rutting measurement via proof rolling
18

Experimental Test Results
The results of the field investigation are organized by presenting results from the CS-563E intelligent
compaction roller and then the 815F roller. For each roller several test areas were compacted along the
length of the project involving the silty clay embankment fill, Type 5 aggregate base, and MSE wall
backfill. For each of the test areas, pictures of the field conditions are provided where available along
with color-coded IC roller maps and results from in situ point measurements. Key finding are highlighted
for each of the analyzed test areas. For both rollers, Test Area #1 was designated as an initial setup and
training opportunity and the results are not presented.
Test Area #2: CS-563E – Type 5 Aggregate Base
This test area was located on the north end of the project and involved compacting Type 5 aggregate base
over a silty clay subgrade. Figure 9 shows the roller and Figure 10 shows the test area aggregate and
subgrade. As shown in Figure 11, the test areas was rolled with 6 passes (3 forward and 3 reverse).
Figures 11and 12 shows the CVM and MDP IC-MVs, respectively. Figure 13 shows the MDP map for
the last pass with the point locations for QC/QA testing and the corresponding CBR profiles. The
combined DCP and CBR profiles in Figures 14 and 15 shows that the Type 5 subbase was about 6 inches
thick and that the underlying subgrade was relatively weak with a CBR value ranging from about 1 to 3.
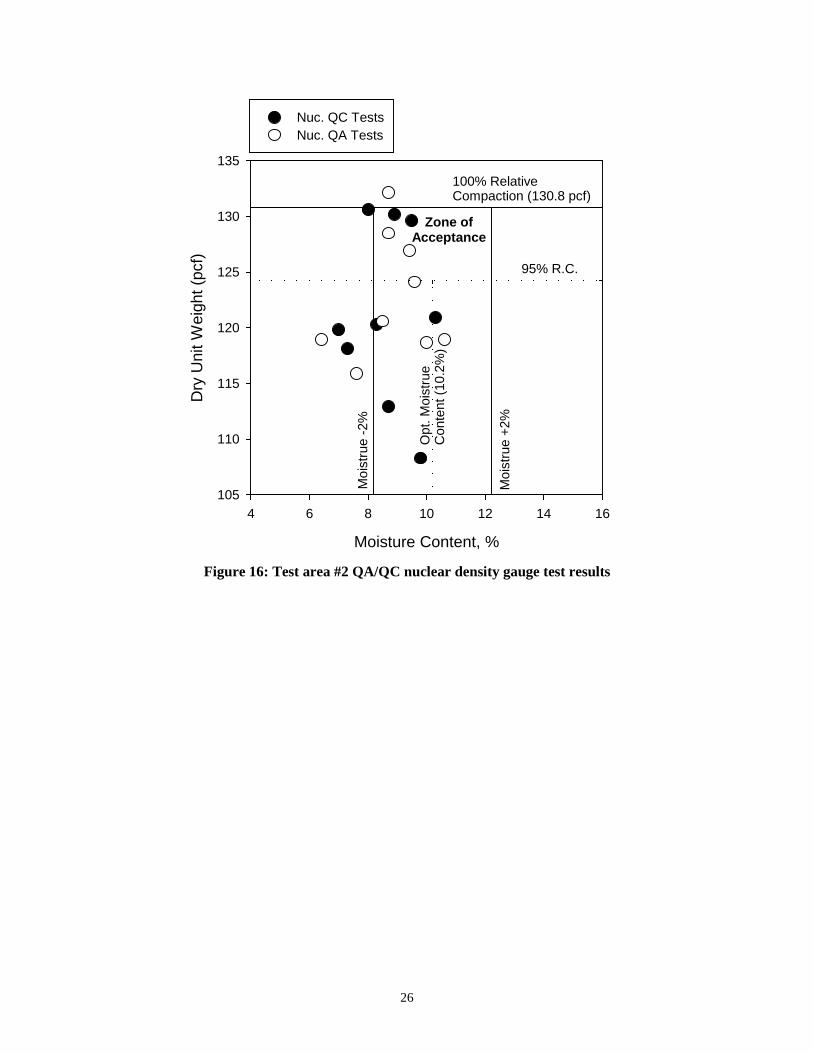
The low CMV values are attributed to the weak subgrade support conditions. Figure 16 shows the
moisture-density zone of acceptance and the corresponding QC/QA test results. Several of the test point
fall outside the defined acceptable zone.
19
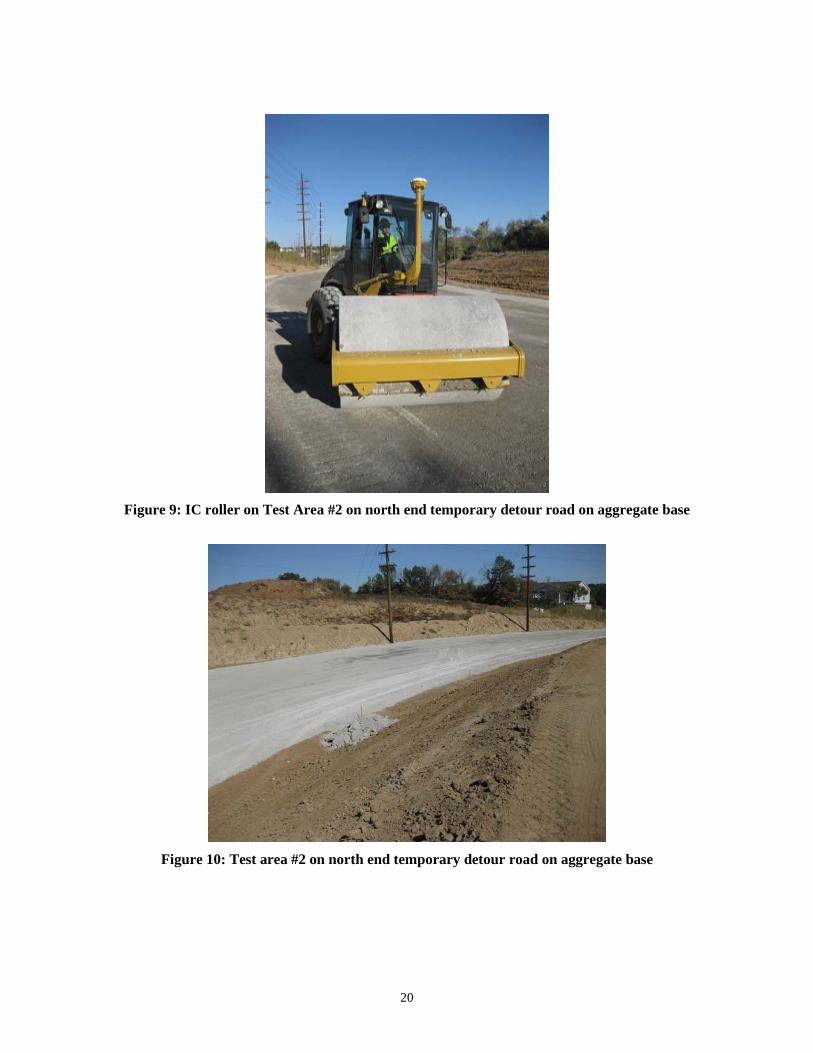
Figure 9: IC roller on Test Area #2 on north end temporary detour road on aggregate base
Figure 10: Test area #2 on north end temporary detour road on aggregate base
20

Figure 11: Test area #2 pass coverage
21

Figure 12: Test area #2 CMV results showing relatively low values reflecting the low strength
underlying subgrade
22

Figure 13: Test area #2 showing MDP values and DPC test locations and results
23
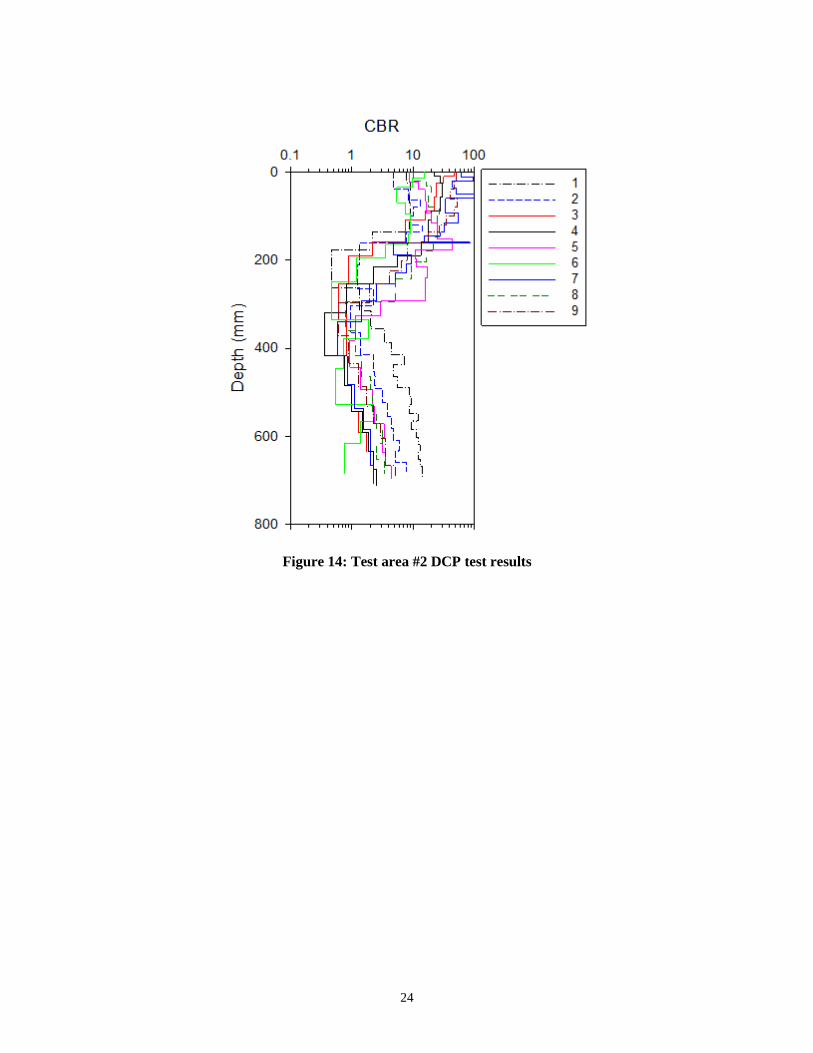
Figure 14: Test area #2 DCP test results
24

CBR0.1 1 10 100
Dep
th (m
m)
0
200
400
600
800
9
Cummulative Drops and CBR0 10 20 30 40 50 60
0
200
400
600
800
Depth to layer boundary = 150 mm
Type 5 base
Silty Clay Subgrade
Figure 15: Test area #2 DCP test for no. 9 showing thickness determination
for Type 5 aggregate base
25
Moisture Content, %
4 6 8 10 12 14 16
Dry
Uni
t Wei
ght (
pcf)
105
110
115
120
125
130
135
Nuc. QC TestsNuc. QA Tests
100% Relative Compaction (130.8 pcf)
95% R.C.
Opt
. Moi
stru
e C
onte
nt (1
0.2%
)
Moi
stru
e +2
%
Moi
stru
e -2
%
Zone ofAcceptance
Figure 16: Test area #2 QA/QC nuclear density gauge test results
26

Test Area #3: CS-563E – Backfill Adjacent to Double Box Culvert
A double box culvert was being constructed near the south end of the project. This provided the
opportunity to evaluate the IC roller and fill conditions in what is typically a difficult compaction area
because the box creates an obstacle, compaction close to the box, and generally poorer foundation support
conditions. Figure 17 shows the test area conditions.
Figures 18 and 19 show the plan view, cross sectional view, and profile view (east side) using the
RTK-GPS position information and IC-MVs. Figure 20 shows the east side DCP test locations. Tests
performed at this elevation coincided with approximately the bottom of the box culvert (Figure 21). The
DCP tests show that the CBR values are generally about 1 to 10 to a depth of about 2 ft. Figure 22 shows
the IC-MVs map on a compacted layer about 2 ft below the top of the box. The corresponding DCP tests
shown in Figure 23 revealed that the compacted backfill CBR values range from 0.5 to 2, which is
considered a very weak condition.
Figures 24 to 30 show the time history of MDP values and layer lift thicknesses. Using RTK-
GPS allows for a relatively accurate assessment of compacted lift thickness. Figure 31 shows the results
of detailed analysis of the compaction history in this area. For 42 measurement points analysis the
average lift thickness was 0.88 ft and the average number of roller passes was 5. Both parameters,
however, have significant variation. This result is particularly interesting because lift thickness and pass
coverage are extensively used in current specifications, but often with great difficulty to document and
measure. Here the IC system provided a great deal of data and only required relatively simple
investigation on a computer to determine field values.
Figure 32 shows the moisture-density zone of acceptance for QC/QA nuclear density testing
independent Shelby tube samples collected by the research team. The results show relatively high
moisture content and confirm the low CBR as determined form the DCP tests. In one of the Shelby tube
holes, an in situ borehole shear test (BST) was performed to measure the effective stress shear strength
parameters values. Figure 33 shows that the friction angle was 23.5 degrees and the cohesion was about 4
kPa. Figure 34 shows real-time display of the coverage area for a pass.
27

Figure 17: Test Area #3 at double box culvert at south end of project
28
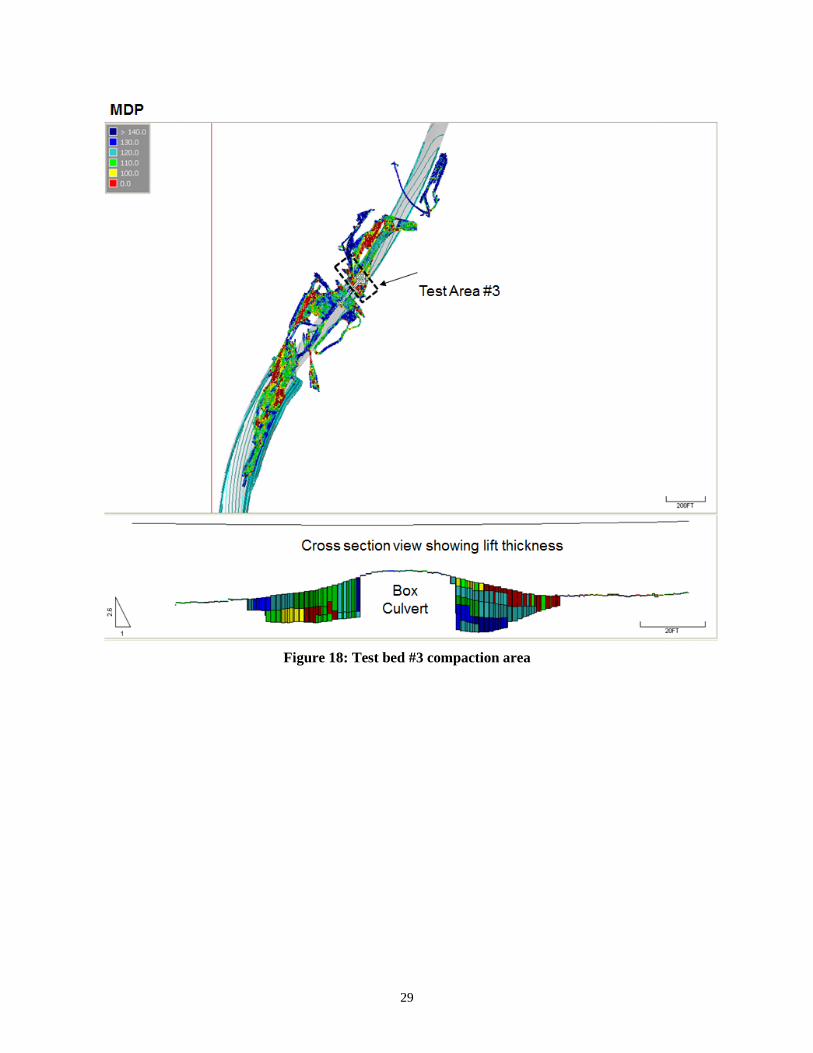
Figure 18: Test bed #3 compaction area
29

Figure 19: Test bed #3 compaction area
30
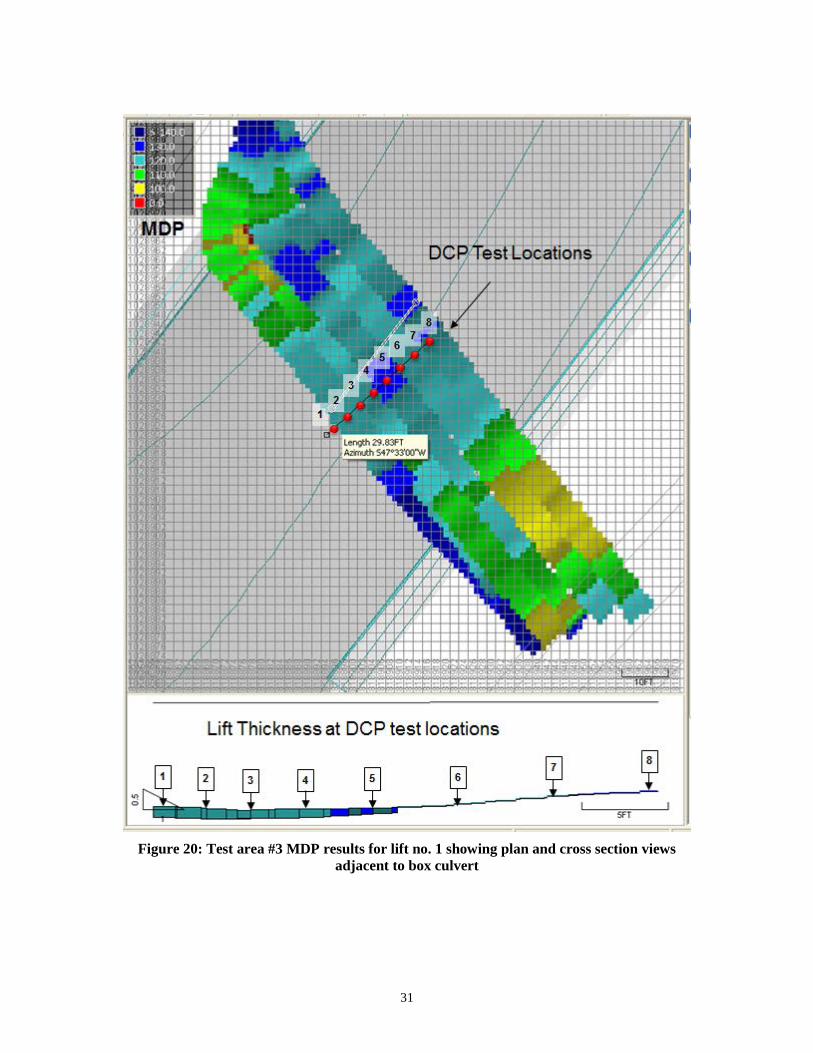
Figure 20: Test area #3 MDP results for lift no. 1 showing plan and cross section views
adjacent to box culvert
31

Figure 21: DCP test results for lift no. 1 adjacent to box culvert
32
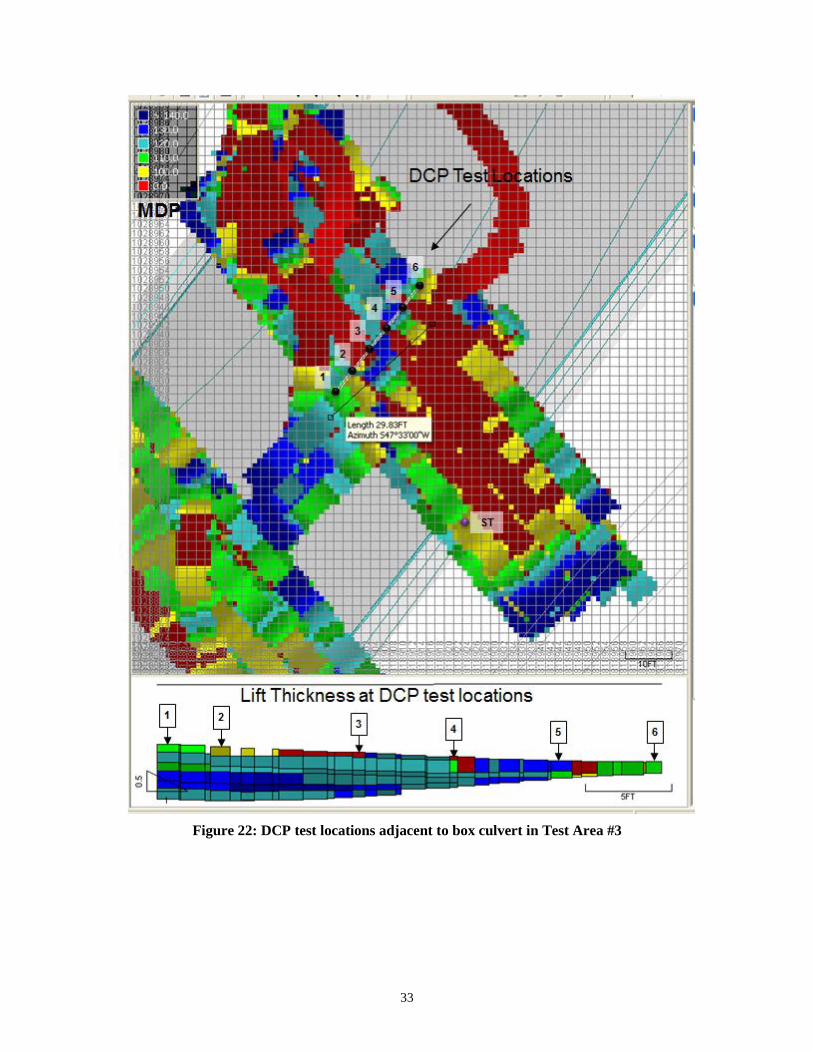
Figure 22: DCP test locations adjacent to box culvert in Test Area #3
33

Figure 23: DCP test results for final lift adjacent to box culvert
34

Figure 24: Initial mapping Test Area #3
35
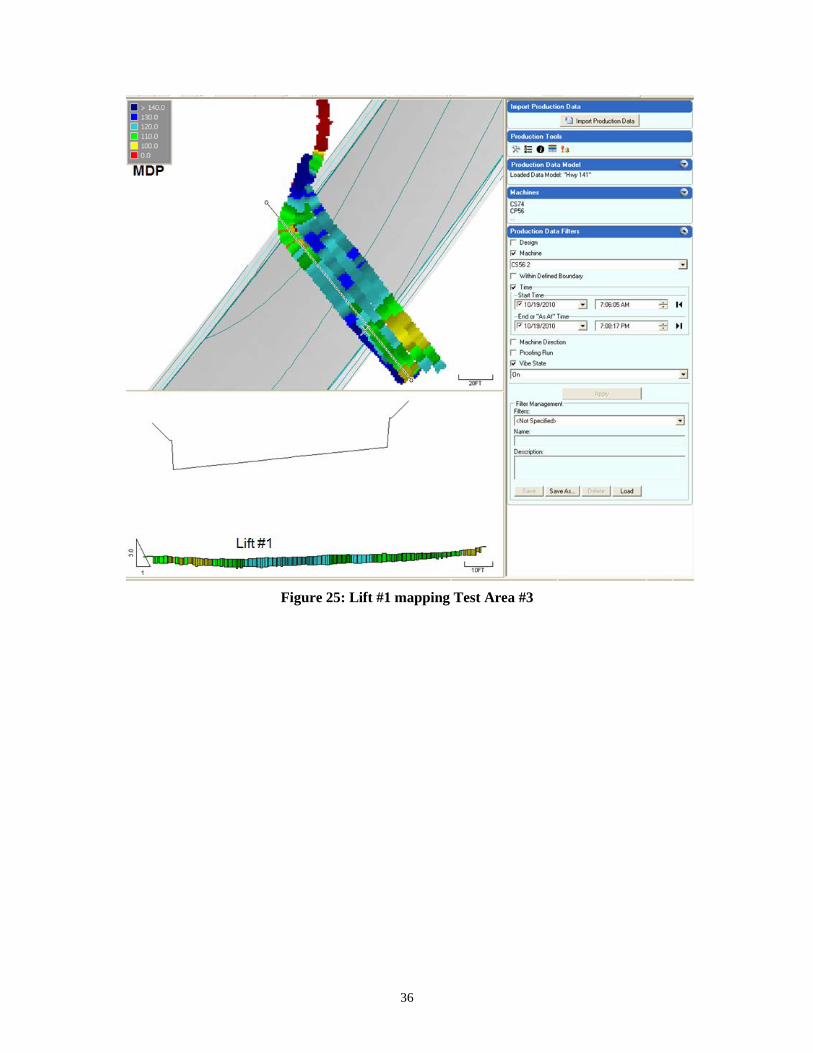
Figure 25: Lift #1 mapping Test Area #3
36

Figure 26: Lift #2 mapping Test Area #3
37

Figure 27: Lift #3 mapping Test Area #3
38

Figure 28: Lift #4 mapping Test Area #3
39
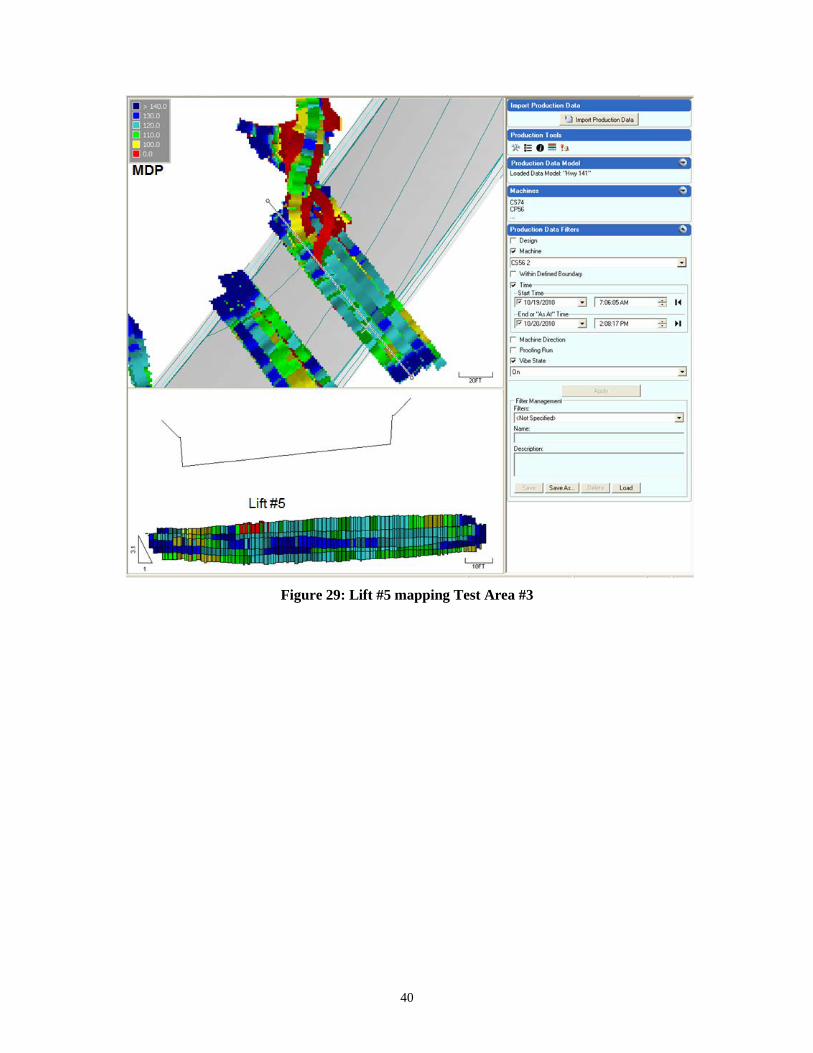
Figure 29: Lift #5 mapping Test Area #3
40

Figure 30: Lift #6 mapping Test Area #3 and summary of time filters for each lift
41

Compacted Lift Thickness (feet)
0.0 0.2 0.4 0.6 0.8 1.0 1.2 1.4 1.6 1.8
Cou
nt
0
2
4
6
8
10
12
14
16
Number of Roller Passes
0 2 4 6 8 10 12 14 16
Cou
nt
0
2
4
6
8
10
12
14
16
Average = 0.88 ftCOV = 36%n = 42
Average = 5.0 passesCOV = 60%n = 42
Figure 31: Results of compacted lift thickness and number of roller passes at several locations in box culvert fill
42

Moisture Content, %
14 16 18 20 22 24 26
Dry
Uni
t Wei
ght (
pcf)
90
95
100
105
110
Nuc. QC TestsNuc. QA TestsST Sample (fill)ST Sample (foundation)
100% Relative Compaction (106.0 pcf)
90% R.C.
Opt
. Moi
stru
e C
onte
nt (1
7%)
Moi
stru
e +2
%
Moi
stru
e -2
%
Zone ofAcceptance
1ft 2 ft 3 ft
4.5 ft
Figure 32: Tets area #3 results from QC/QA nuclear gauge tests and independent Shelby tube samples adjacent to box culvert
43

Normal Stress (kPa)
0 20 40 60 80 100 120 140 160 180
She
ar S
tress
(kP
a)
0
20
40
60
80Friction angle, ' = 23.6 degreesCohesion, c' = 4.5 kPaR2 = 0.999
Figure 33: In situ borehole shear test (BST) in compated box cuvlert backfill
44

Plan view
N
Passes
Cross sectional view
Box Culvert Test Area
Figure 34: Example of roller operator using the real-time display to carefully control the pass coverage
45
Test Area #5: CS-563E – MSE Wall Backfill
The tier MSE wall near the south end of the project also provided an interesting opportunity to evaluate
IC technology. This particular wall was constructed with a larger crushed limestone aggregate that makes
direct transmission nuclear density gauge testing extremely difficult. Ordinarily a method specification is
therefore used (i.e., specified roller passes). Further compaction equipment are normally not allowed with
a distance of about 3 feet to prevent high lateral stresses from moving the facing panel out of plumb
during construction. For both of these prescriptive roller operating conditions, the IC documentation
system provided useful information. Figures 35, 36 and 37 show the MSE wall construction.
Figures 38, 39, and 40 8 shows IC results from CMV and RMV (resonant meter value)
measurements and locations of dynamic cone penetration (DCP) tests. The CMV results in this area were
generally high and ranged from 25 to 70. In portions of this area, the RMV values were high (> 6)
indicating that the the vibratory roller was starting to bounce, which is a result of very stiff to hard well
compacted material. The DCP results (Figure 41) show that the area within 3 ft of the MSE wall is less
compact (based on the CBR profile) compared to the material subjected to rolling, where CBR values
where > 50 at depths of 8 inches (200 mm) and deeper. Application of IC to MSE wall backfill
compaction provided value in terms of pass coverage and location information and indicating the
strength/stiffness of the compacted material.
46

Figure 35: Test area #5 Two-tiered retainaing wall backfill
47

Figure 36: Test area #5 Mutliple tiered MSE wall construction
Figure 37: Upper MSE wall tier after IC roller compaction and mapping
48

Figure 38: Test are #5 MSE wall – plan and cross sectional view
49

Figure 39: Test are #5 MSE wall – plan and prifile view
50

Figure 40: Comparison of Test Area #5 IC compaction MVs
51

CBR1 10 100
Dep
th (m
m)
0
200
400
600
800
1 ft (pt. 1)7 ft (pt. 2)13 ft (pt. 3)
Light equipment only allowed within 3 ft of wall.
Figure 41: DCP test results for test are #5 at differnet distances form the MSE wall
52
Test Area #6: CS-563E – Type 5 Subbase at Tuador Road
Figure 42 shows the test area and compacted Type 5 base. Figure 43 shows the pass coverage
information with passes from about 1 to 5 depending on location. The MDP values shows in Figure 44
indicate that the values were generally at the high end of the scale, while CMV values were generally low
(Figure 45). It is believed that the CMV values were reflecting the low stiffness of the underlying
subgrade layer. The CBR profile from DCP testing in this location are shown in Figure 46. Results shows
that CBR values were variable ranging from about 2 to 40 in the Type 5 layer and about 10 in the
subgrade. Nuclear gauge density-moisture QA/QC test results in this area are shown in Figure 47. All of
the measurements indicated that the results were outside the acceptance zone for moisture content (i.e. too
dry in this case).
53
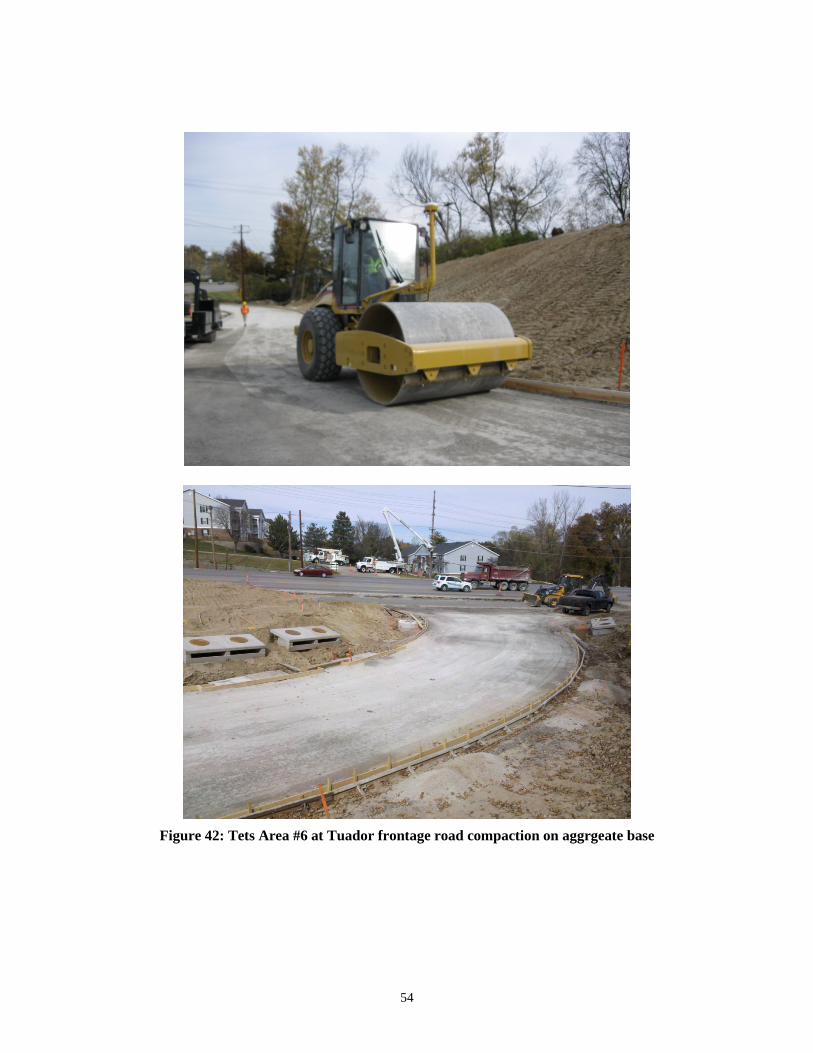
Figure 42: Tets Area #6 at Tuador frontage road compaction on aggrgeate base
54
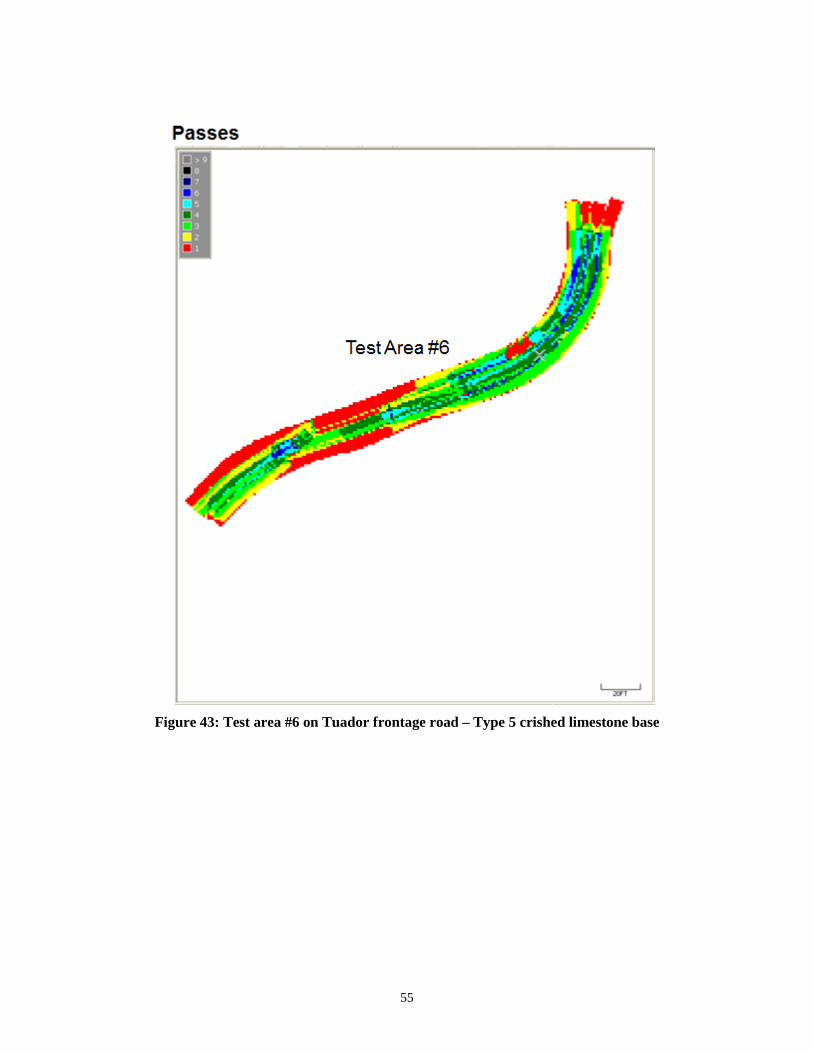
Figure 43: Test area #6 on Tuador frontage road – Type 5 crished limestone base
55

Test Area #6
MDP
1
23
4
5
67
8
DCP Test Locations
Figure 444: Test area #6 showsing MDP results
56

Test Area #6
CMV
Figure 455: Test area #6 showsing CMV results
57

CBR1 10 100
Dep
th (m
m)
0
200
400
600
800
12345678
Figure 466: Test area #6 DCP test results in Type 5 aggrgeate base
58

Moisture Content, %
4 6 8 10 12 14 16
Dry
Uni
t Wei
ght (
pcf)
105
110
115
120
125
130
135
Nuc. QC TestsNuc. QA Tests
100% Relative Compaction (130.8 pcf)
95% R.C.
Opt
. Moi
stru
e C
onte
nt (1
0.2%
)
Moi
stru
e +2
%
Moi
stru
e -2
%
Zone ofAcceptance
Figure 477: Test area #6 nuclear density gauge QA/QC results
59

Test Area #7 through 11Subgrade Proof Mapping and Calibration
Several tests areas within the silty clay embankment fill areas were compacted with the CS-563E and
815F rollers. Near the south end of the project, a large area (Figure 48) was mapped with both IC rollers
and various QA/QC tests were performed to evaluate the ability of the IC machines to identify areas of
non-compliance (i.e., areas of wet fill material). Figures 49 through 54 show an area approximately 70 ft
wide by about 700 ft long that was mapped with the CS-563E IC roller. Figure 55 shows the results of
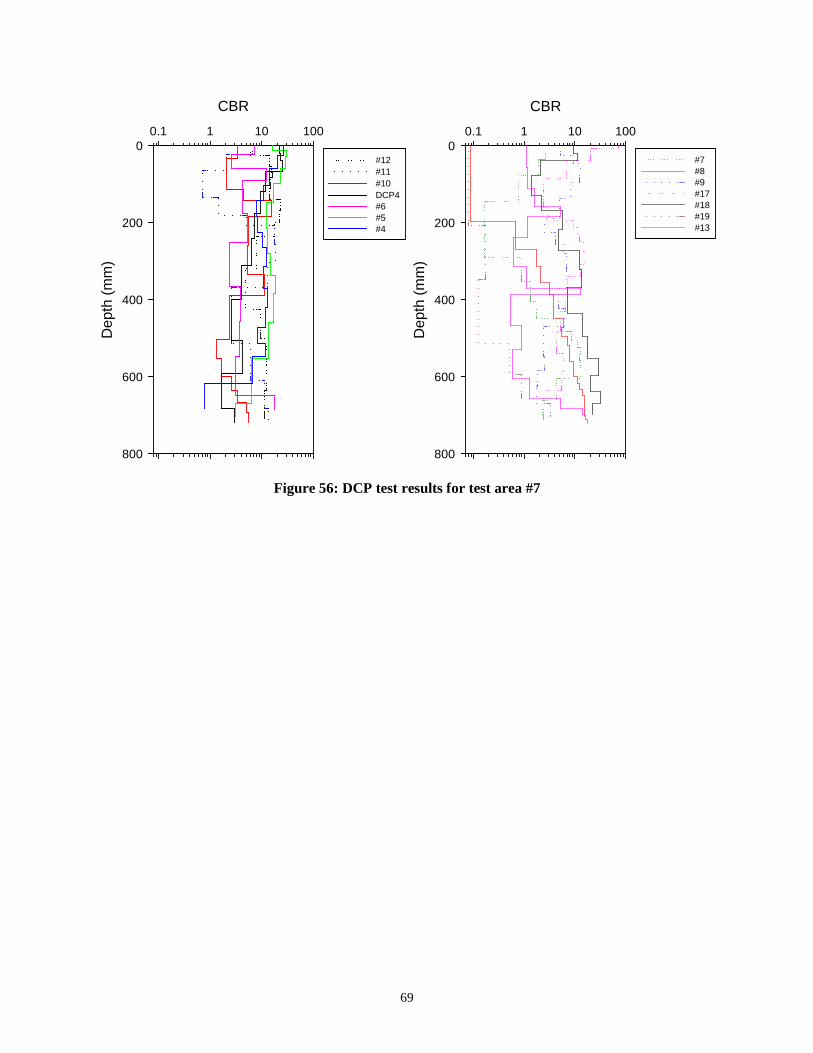
nuclear gauge density-moisture tests in this area. DCP tests show that the CBR values in this area were
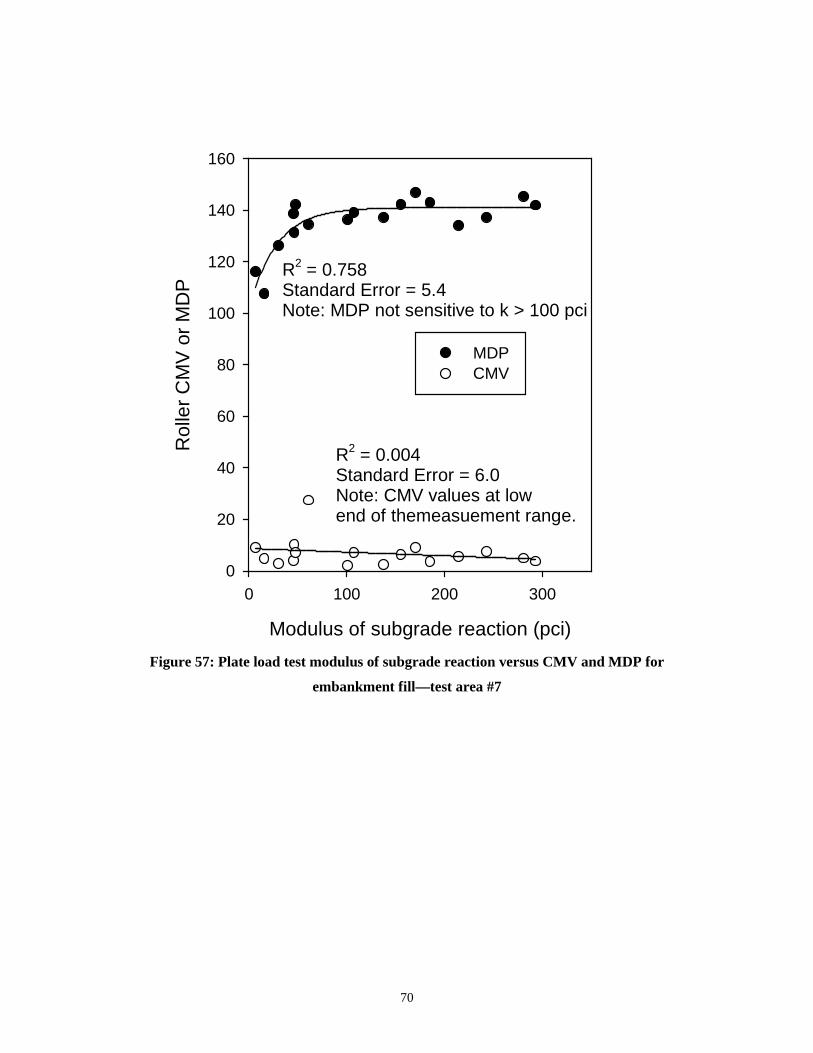
variable between 0.1 and about 20 (Figure 56). Correlations analysis using MDP and CMV versus PLT
modulus of subgrade reaction tests are reported in Figure 57. Results correlation analysis of plate load test
results in this area showed that the MDP values for the CS-563 demonstrated that a positive correlation
for k-values less than about 100 pci is possible. In contrast, the CMV values were not sensitive to
variations in k- values. The lack of correlation for CMV to k-values is primarily due to the material being
at the low end of the CMV measurement range (i.e., CMV values less than about 10). Other studies have
shown that for CMV values greater than about 10, correlations do exist between CMV and plate load test
results (White et al. 2011).
The 815F roller (Figures 58 and 59) also mapped this area and the results are shown in Figure 60
and 61. The variation in color of the MDP values helped identify areas of wet soil conditions (see MDP
scale in upper left corner and notes on w%). Static plate load tests were conducted in this test area (see
Figures 62 and 63) at several locations based on the variations observed on the MDP map and confirmed
soft and wet areas of noncompliance. Figure 64 shows that some rolling operations occurred in what were
later determined to be cut areas. Figure 65 shows the embankment geometry and location of the test area
being rolled. Compared to the CS-563E roller IC-MVs. The 815F MDP map shows similar geospatial
variations in ground stiffness.
To better understand how the 815F results relate to traditional proof rolling with a loaded tandem
axle dump truck (Figure 66), several areas along the extent of the project were proof rolled and compared
to the MDP results at selected locations. Figure 69 shows the project areas selected for proof testing. The
results from this exercise demonstrated that the MDP values can be correlated to both rut depth (Figures
68 and 71) and k-values (Figure 70). A MDP target value of 123 was determined from the rut depth
(Figure 71) and CBR test results (Figure 72) for IC production mapping conducted by the contractor.
Compared to the QA/QC nuclear moisture-density-moisture results however, the MDP values were
poorly correlated (Figures 73 and 74).
60

To field assess the effectiveness of the MDP target value to field control of compaction quality,
the contractor operated the machine for several months and used these target values to create compaction
reports. Figures 75 and 76 are examples of a compaction report showing isolated areas of non-
compliance (i.e., MDP values < 123). In this production area, the compaction report provided the
following information: (1) 77% of the area met the minimum requirement; (2) the compaction area was
17,092 ft2 ; and (3) the compaction map in this area was completed in approximately 111 minutes. Similar
analyses were performed in other test areas (see Figures 77 to 82).
Figure 48: Test area #7 Subgrade proof mapping metzer4
61

Figure 49: MDP results for test area #7 embankment fill #9 MSE ramp—crushed limestone
aggregate backfill
62

Figure 50: Pass count results for test area #7 embankment fill #9 MSE ramp—crushed limestone
aggregate backfill
63

Figure 51: CMV results for test area #7 embankment fill #9 MSE ramp—crushed limestone
aggregate backfill
64

Figure 52: RMV results for test area #7 embankment fill #9 MSE ramp—crushed limestone
aggregate backfill
65

Figure 53: CMV map for test area #7 showing test point locations
66

Figure 54: MDP map for test area #7 showing test point locations
67

Figure 55: Test area 7 embankment fill QA/QC nuclear density gauge results
68
CBR0.1 1 10 100
Dep
th (m
m)
0
200
400
600
800
#7#8#9#17#18#19#13
CBR0.1 1 10 100
Dep
th (m
m)
0
200
400
600
800
#12#11#10DCP4#6#5#4
Figure 56: DCP test results for test area #7
69
Modulus of subgrade reaction (pci)
0 100 200 300
Rol
ler C
MV
or M
DP
0
20
40
60
80
100
120
140
160
MDP CMV
R2 = 0.758Standard Error = 5.4Note: MDP not sensitive to k > 100 pci
R2 = 0.004Standard Error = 6.0Note: CMV values at low end of themeasuement range.
Figure 57: Plate load test modulus of subgrade reaction versus CMV and MDP for
embankment fill—test area #7
70

Figure 58: Caterpillar 815F RICM Equipped Roller
Figure 59: 815F operator display
71

Figure 60: Results from test area #11 variations in IC-MVs, moisture content, and PLT deflection
72

Figure 581: Results from test area #11 showing soft area related to high moisture content
73
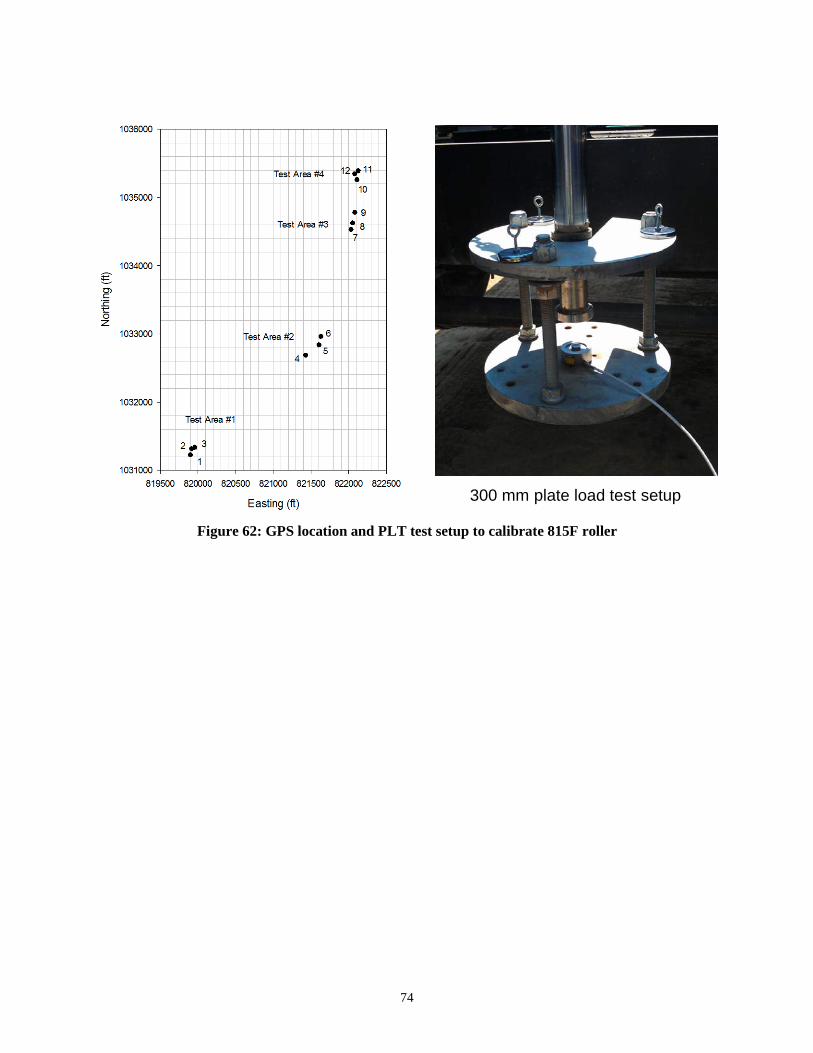
300 mm plate load test setup
Figure 62: GPS location and PLT test setup to calibrate 815F roller
74

Figure 63: PLT test measurements used in calibration of 815F roller
75

Figure 594: MDP IC-MV results for 815F in test area #8
76

Figure 605: MDP IC-MV results for 815F in test area #11
77

Figure 616: Loaded dump truck for traditional proof roll to determine rut depth
Figure 67: Test area #2—significant rutting
78

Figure 68: Test area #2—rut measurement
79

Figure 69: Project level proof mapping with 815F IC Roller
80

Figure 620: Correlation analysis for 815F impact roller for plate load test modulus of subgrade reaction
81
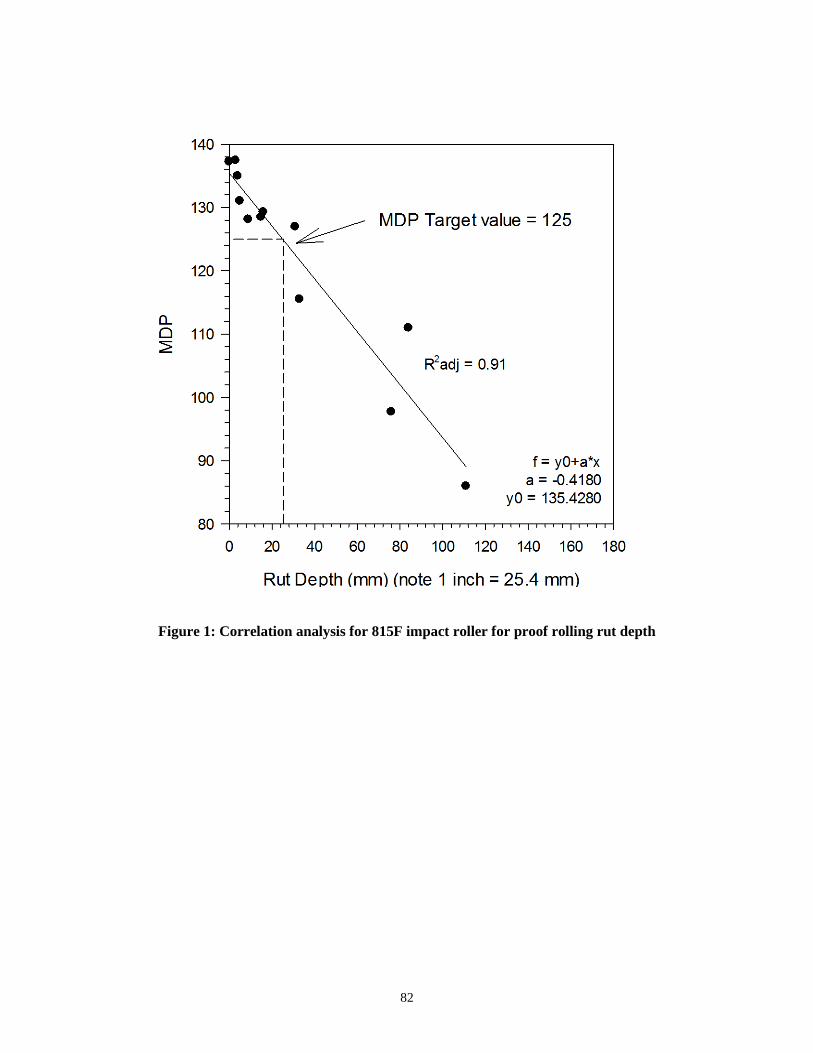
Figure 1: Correlation analysis for 815F impact roller for proof rolling rut depth
82
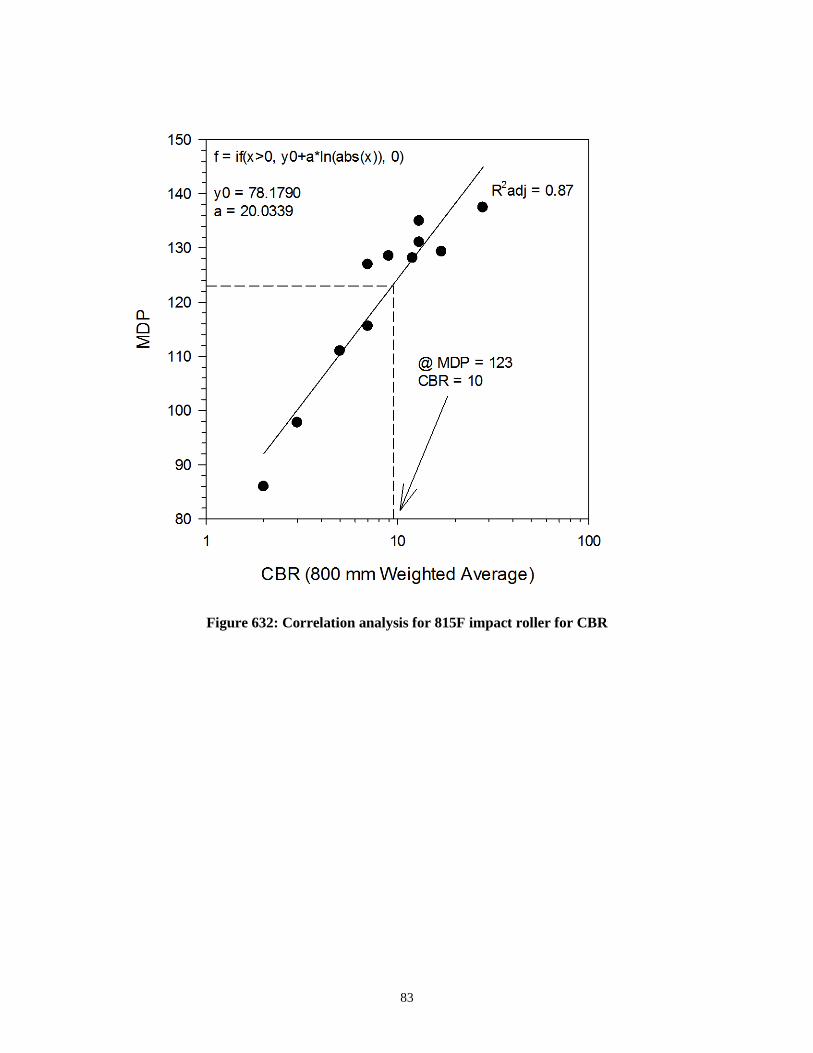
Figure 632: Correlation analysis for 815F impact roller for CBR
83

Percent Compaction (%)
85 90 95 100 105 110 115
MD
P
80
90
100
110
120
130
140
150
QAQC
RC Target = 90% or 95%
R2adj = 0.59
R2adj = 0.55
Figure 73: Correlation analysis for 815F impact roller for percent compaction
84

Figure 644: Correlation analysis for 815F impact roller for moisture content
85

Figure 65: Production level analysis near Test Area #4 showing percentage meeting target value
86

Figure 66: Production level analysis near test area #10 showing proof map with limited red areas indicating noncompliance
87

Test Area #2 QC Proof Map0% ≥ RICM-TV = 123
Figure 77: Production level analysis near test area #4 generally low IC-MVs
88
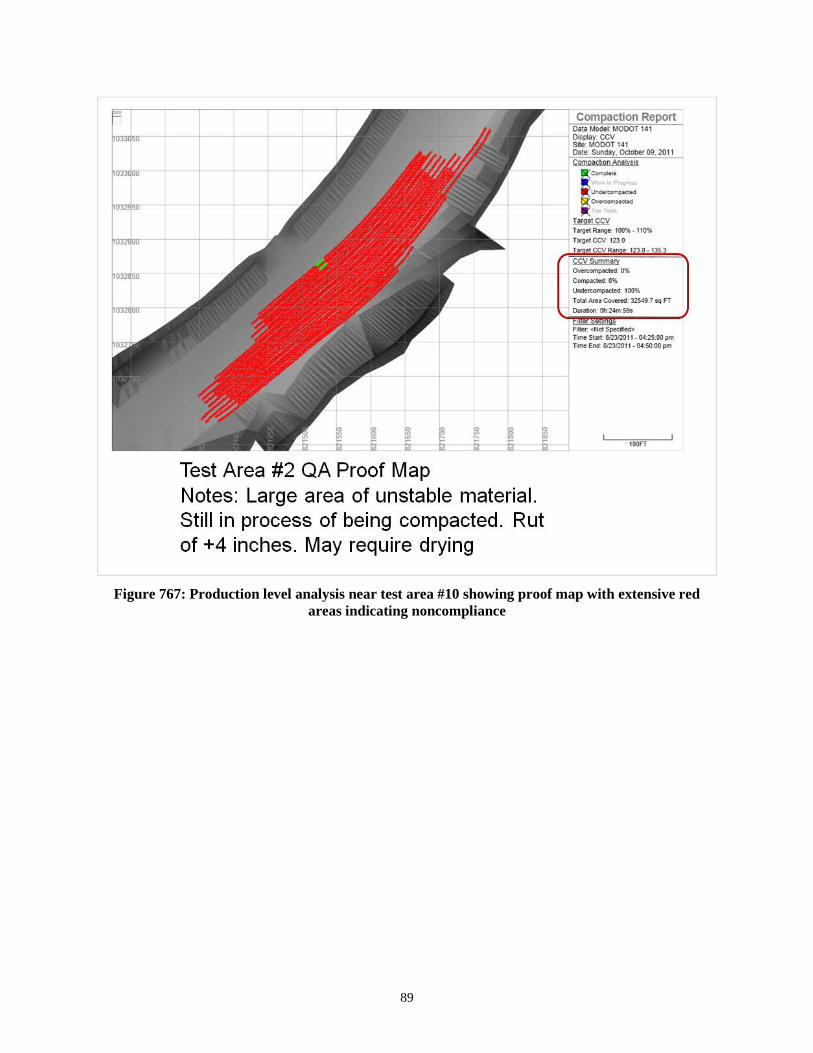
Figure 767: Production level analysis near test area #10 showing proof map with extensive red
areas indicating noncompliance
89

Figure 79: Production level analysis near test area #10 variable IC-MVs
90

Figure 68: Production level analysis near test area #10 showing proof map with extensive red areas
indicating noncompliance
91

Figure 69: Production level analysis near test area #4 variable IC-MVs
92

Figure 70: Production level analysis near test area #4 showing proof map
with red areas indicating non-compliance
Comparison of Project Level QA/QC Results.
This project provided an excellent opportunity to analyze the measurement error of side-by-side nuclear
density gauge results for QA and QC. Special effort was put into a testing plan by the inspectors to
generate sufficient data to perform a statistical analysis of the results. The QA/QC data also provided the
opportunity to characterize the reproducibility of results between QC and QA. Figure 83 shows the field
equipment and effort to perform these side-by-side tests. Figure 84 shows the project level maps of IC
values. Figure 85 shows a comparison between QA and QC in terms of wet density, moisture content, and
percent compaction. All tests were performed using the direct transmission method and using the same
probe penetration depth and measurement duration. Analysis of the difference between side-by-side
measurements shows that the root mean square error (RMSE) of wet density, moisture content, and
percent compaction for these measurements equals 4.2 pcf, 2.4% (dry soil basis), and 2.7% (relative to
93

standard Proctor), respectively. These results should be considered when developing proper statistical
analysis and sampling methods. For reference, ASTM D6938-10 presents reports a combined
repeatability and reproducibility error for wet density as 0.74 pcf and 0.90 pcf for ML and CL soils,
respectively, and 0.7% for moisture content for both CL and ML.
Figure 83: QA/QC operations to conduct nuclear density tests
94

Figure 714: Overall coverage areas by CS-563E Smooth drum roller on south end of project
95

QC Wet Unit Weight (pcf)
80 100 120 140
QA
Wet
Uni
t Wei
ght (
pcf)
80
100
120
140R2 = 0.812Standard Error = 4.3 pcf RMSE = 4.2 pcf
QA = 10.34+0.93*QC
95% Prediction Intervals
(a)
96

QC Relative Compaction (%)
70 80 90 100 110
QA
Rel
ativ
e C
ompa
ctio
n (%
)
70
80
90
100
110R2 = 0.686Standard Error = 2.8%RMSE = 2.7%
QA = 30.48+0.68*QC
95% Prediction Intervals
(c)
Figure 85: Comparison and calculation of standard error for QA/QC nuclear density gauge results
for CS-563E test areas
97

Exit Interviews
On November 12, 2010, the SHRP R07 research team setup exit interviews to gain knowledge of how
QC/QA field personnel and roller operators involved viewed the use of IC technology and alternative in
situ testing technologies. The following captures the results of the interview.
Questions:
1. What is your experience/impression of using the IC equipment to date? 2. How do you see the IC information being used in a Q/C plan?
Dave Dwiggins: 815 operator for Fred Weber Inc.
1. I like the technology. It helps me know where to focus where more compaction work is needed as well as knowing when it is good.
2. It could speed up operations by not having to guess on what is going to pass. Ross Adams: Roadway Superintendent for Fred Weber Inc.
1. I like the concept if the results correlate with the acceptance criteria. 2. It could eliminate nuclear tests on the contractors Q/C plan.
Nancy Leroney: Project inspector for MoDOT
1. Neat thing to be involved with new tests. I find it very interesting. 2. It could save time and money by knowing when the soil passes. I would love to eliminate
the nuclear testing. Lashonda Neal: ABNA Engineering-QC Inspector
1. Great learning experience with the new technology and approaches. I liked being part of the whole experience.
2. It could save time. With the nuclear test you actually test a very small area versus the larger area with the new tests being demonstrated.
Dan Gruen: 563 operator for Weber Fred Weber Inc. 1. Good experience. Good to know what compaction results are as you roll. A nuclear test
could pass and a short distance away could fail. 2. The IC roller could replace Q/C nuclear testing. Also with the IC roller you can test the
rock backfill at the MSE walls which is not tested now.
98

SUMMARY AND CONCLUSIONS
Results from a field study conducted on the Hwy 141 project in Chesterfield, MO in 2010 and 2011 are
presented in this report. The project involved evaluating a Caterpillar CS-563E smooth drum and a
Caterpillar 815F impact roller. Several test areas were evaluated using the intelligent compaction systems
in materials including silty clay embankment fill and, type 5 aggregate subbase, and MSE wall backfill.
Test areas involving calibration and production operations were constructed by obtaining IC-MVs in
conjunction with various in-situ point-MVs. IC-MVs maps on the on-board computer display unit were
utilized in selecting field QA test locations in production areas.
Results obtained from various test beds contributed to developing empirical relationships between
IC-MVs and various in-situ point-MVs. Empirical correlations between IC-MVs and different point-MVs
sometimes showed weak correlations when evaluated independently for each test bed, because of the
narrow measurement range. The correlations improved when data are combined for site-wide correlations
with a wide measurement range. IC-MVs generally correlated better with modulus based in-situ point-
MVs (i.e., ELWD-Z3, EFWD-K3, EV1, and EV2) and CBR point MVs than with dry density point-MVs.
Correlations between IC-MVs and EFWD-K3, and IC-MVs and EV1 showed strongest correlation
coefficients.
The results for the IC-MV mapping operations were as follows:
• RICM Target Value (MDP) = 123. MDP = 123 is correlated to CBR = 10 based on
800 mm (32 inch) weighted average. Correlations to rut depth and modulus of subgrade
reaction confirmed the target value.
• Based on the project conditions, it IC criteria was changed from 90% of coverage area ≥
RICM-TV to 80% ≥ RICM-TV in the specifications.
• The CS-563E IC system setup with RTK-GPS provided useful information to determine
lift thicknesses and pass coverage.
• Lift thickness and pass coverage are generally highly variable for earthwork construction
operations, without using IC measurement systems.
• Allowing the operators to use the on-board display improved the uniformity of pass
coverage.
99
• The IC-MVs can be correlated to rut depth from proof rolling, modulus of subgrade
reaction from plate load testing, and CBR profiles from DCP testing. The k-values
determined from plate load test provide highest degree of correlation to RICM-MVs (R2
= 0.93). RICM-TV analysis for plate load testing and actual rut depth measurements
produced similar results.
• Areas of non-compliance based on the IC maps were primarily areas of high moisture
content.
• The RICM-MVs are not well correlated to percent relative compaction or moisture
content, particularly compared to percent compaction from nuclear moisture-density
gauge testing.
• Comparison between QC/QA nuclear moisture-density test results were used to quantify
the reproducibility measurement error.
• The results from this study provided new information with application of IC-MVs in
conjunction with various QA test devices on cement treated subgrade and base materials,
which to the authors’ knowledge, has not been previously documented in the United
States. The study demonstrated several potential advantages of implementing IC roller
operations and various in-situ testing methods into earthwork construction QC/QA
practice.
100

References
ASTM D6951-03. (2003). “Standard test method for use of the dynamic cone penetrometer in shallow pavement application.” American Standards for Testing Methods (ASTM), West Conshohocken, Pennsylvania. ASTM D698-07e1. (2007). “Standard test method for laboratory compaction characteristics of soil using standard effort.” American Standards for Testing Methods (ASTM), West Conshohocken, Pennsylvania. ASTM D422-63. (2007). “Standard test method for particle-size analysis of soils.” American Standards for Testing Methods (ASTM), West Conshohocken, Pennsylvania. ASTM D4318-05 (2005). “Standard test methods for liquid limit, plastic limit, and plasticity index of soils.” American Standards for Testing Methods (ASTM), West Conshohocken, Pennsylvania. ASTM D3282-09. (2009). “Standard practice for classification of soils and soil-aggregate mixtures for high construction purposes.” American Standards for Testing Methods (ASTM), West Conshohocken, Pennsylvania. ASTM D2487-10. (2010). “Standard practice for classification of soils for engineering purposes (unified soil classification system).” American Standards for Testing Methods (ASTM), West Conshohocken, Pennsylvania. Brandl, H., and Adam, D. (1997). “Sophisticated continuous compaction control of soils and granular materials.” Proc. 14th Intl. Conf. Soil Mech. and Found. Engrg., Hamburg, Germany, 1–6. Chilès, J-P., and Delfiner, P. (1999). Geostatistics – Modeling Spatial Uncertainty. John Wiley & Sons, Inc., New York. Clark, I., and Harper, W. (2002). Practical geostatistics 2000. 3rd reprint, Ecosse North America Llc, Columbus, Ohio. Isaaks, E. H., and Srivastava, R. M. (1989). An introduction to applied geostatistics. Oxford University Press, New York. NCHRP 21-09. (2010). Intelligent soil compaction systems – NCHRP 21-09, National Cooperative Highway Research Program, Transportation Research Board, Washington, D.C. (in print). Samaras, A.A., Lamm, R., Treiterer, J. (1991). “Application of continuous dynamic compaction control for earthworks in railroad construction.” Transp. Res. Rec., 1309, Journal of the Transportation Research Board, Washington, D.C., 42–46.
101

Sandström, Å. (1994). Numerical simulation of a vibratory roller on cohesionless soil, Internal Report, Geodynamik, Stockholm, Sweden. Sandström Å., and Pettersson, C. B., (2004). “Intelligent systems for QA/QC in soil compaction”, Proc. TRB 2004 Annual Meeting (CD-ROM), Transportation Research Board, Washington, D. C. Thompson, M., and White, D. (2008). “Estimating compaction of cohesive soils from machine drive power.” J. of Geotech. and Geoenv. Engrg., ASCE, 134(12), 1771-1777. Vennapusa, P., White, D.J., and Gieselman, H. (2009). “Influence of support conditions on roller-integrated machine drive power measurements for granular base.”, Intl. Found. Cong. and Equip. Expo (IFCEE) 2009, 15-19 March, Orlando, Florida. Vennapusa, P., and White, D. J. (2009). “Comparison of light weight deflectometer measurements for pavement foundation materials.” Geotech.Test. J., ASTM, 32(3), 239-251. Vennapusa, P., White, D.J., Morris, M. (2010). “Geostatistical analysis for spatially referenced roller-integrated compaction measurements, J. of Geotech. and Geoenv. Engrg., ASCE, (in print). White, D. J., Jaselskis, E., Schaefer, V., Cackler, T. (2005). “Real-time compaction monitoring in cohesive soils from machine response.” Transp. Res. Rec., 1936, Journal of the Transportation Research Board, Washington D.C., 173–180. White, D.J., and Thompson, M. (2008). Relationships between in situ and roller-integrated compaction measurements for granular soils. J. of Geotech. and Geoenv. Engrg., ASCE, 134(2), 1763-1770. White, D., Thopmson, M., Vennapusa, P., and Siekmeier, J. (2008). “Implementing intelligent compaction specifications on Minnesota TH 64: Synopsis of measurement values, data management, and geostatistical analysis.” Transp. Res. Rec., 2045, Journal of the Transportation Research Board, Washington, D.C, 1-9. White, D.J., Vennapusa, P., Gieselman, H., Johanson, L., Siekmeier, J. (2009). “Alternatives to heavy test rolling for cohesive subgrade assessment,” Eighth Intl. Conf. on the Bearing Capacity of Roads, Railways, and Airfields (BCR2A’09), June 29 – July 2, Champaign, Illinois. White, D., and Vennapusa, P. (2012). Report of the 2nd Workshop for Technology Transfer for Intelligent Compaction Consortium, Transportation Pooled Fund Study Number TPF-5(233), March 6–7. http://www.intrans.iastate.edu/research/documents/research-reports/2012_2nd_TTICCworkshop_report.pdf
102
Related Documents


