Record 2018/31 | eCat 123048 Earthquake sources of the Australian plate margin Revised models for the 2018 national tsunami and earthquake hazard assessments J. Griffin and G.Davies APPLYING GEOSCIENCE TO AUSTRALIA’S MOST IMPORTANT CHALLENGES www.ga.gov.au

Welcome message from author
This document is posted to help you gain knowledge. Please leave a comment to let me know what you think about it! Share it to your friends and learn new things together.
Transcript
Record 2018/31 | eCat 123048
Earthquake sources of the Australian plate marginRevised models for the 2018 national tsunami and earthquake hazard assessments
J. Griffin and G.Davies
APPLYING GEOSCIENCE TO AUSTRALIA’S MOST IMPORTANT CHALLENGES www.ga.gov.au


Earthquake sources of the Australian plate margin iii
Earthquake sources of the Australian plate margin
Revised models for the 2018 national tsunami and earthquake hazard assessments
GEOSCIENCE AUSTRALIA
RECORD 2018/31
Jonathan Griffin1 and Gareth Davies
1
1. Geoscience Australia

iv Insert document title here
Department of Industry, Innovation and Science
Minister for Resources and Northern Australia: Senator the Hon Matthew Canavan
Secretary: Dr Heather Smith PSM
Geoscience Australia
Chief Executive Officer: Dr James Johnson
This paper is published with the permission of the CEO, Geoscience Australia
© Commonwealth of Australia (Geoscience Australia) 2018
With the exception of the Commonwealth Coat of Arms and where otherwise noted, this product is
provided under a Creative Commons Attribution 4.0 International Licence.
(http://creativecommons.org/licenses/by/4.0/legalcode)
Geoscience Australia has tried to make the information in this product as accurate as possible.
However, it does not guarantee that the information is totally accurate or complete. Therefore, you
should not solely rely on this information when making a commercial decision.
Geoscience Australia is committed to providing web accessible content wherever possible. If you are
having difficulties with accessing this document please email [email protected].
ISSN 2201-702X (PDF)
ISBN 978-1-925848-04-5 (PDF)
eCat 123048
Bibliographic reference: Griffin, J. D. and Davies, G. 2018. Earthquake sources of the Australian
plate margin: revised models for the 2018 national tsunami and earthquake hazard assessments.
Record 2018/31. Geoscience Australia, Canberra. http://dx.doi.org/10.11636/Record.2018.031
Earthquake sources of the Australian plate margin v
Contents
1 Executive Summary ............................................................................................................................... 1
2 Introduction ............................................................................................................................................ 3
3 Revised submarine fault source models ............................................................................................... 5
3.1 Central and Eastern Indonesia ........................................................................................................ 5
3.1.1 Molucca Sea (Sangihe Thrust, Sangihe Backthrust and Halmahera Forearc Thrust) ............... 6
3.1.2 Cotabato Trench ......................................................................................................................... 7
3.1.3 North Sulawesi (Minahasa) Trench ............................................................................................ 7
3.1.4 Parigi and Malino Faults ............................................................................................................. 7
3.1.5 Tolo Thrust ................................................................................................................................. 8
3.1.6 Makassar Thrust ......................................................................................................................... 8
3.1.7 Banda Detachment ..................................................................................................................... 8
3.1.8 Flores Thrust .............................................................................................................................. 9
3.1.9 Timor Trough ............................................................................................................................10
3.1.10 Semau Fault ...........................................................................................................................11
3.1.11 Tanimbar Trough ....................................................................................................................11
3.1.12 Aru Trough .............................................................................................................................12
3.1.13 Seram Thrust ..........................................................................................................................12
3.1.14 Manokwari Trench ..................................................................................................................12
3.2 Papua New Guinea region .............................................................................................................13
3.2.1 New Guinea Trench .................................................................................................................13
3.2.2 Manus Trench ..........................................................................................................................13
3.2.3 Mussau Trench .........................................................................................................................14
3.2.4 Trobriand Trough ......................................................................................................................14
3.2.5 Moresby (Aure) Trough ............................................................................................................14
3.3 New Zealand – Macquarie Island region .......................................................................................15
3.3.1 West South Island faults ...........................................................................................................16
3.3.2 Puysegur Trench ......................................................................................................................16
3.3.3 North Macquarie Ridge ............................................................................................................16
3.3.4 Hjort Trench ..............................................................................................................................17
3.4 Outer-rise events ...........................................................................................................................17
3.5 Accompanying data files and summary of fault sources ...............................................................18
4 Plate boundary and continental margin seismic source characterisation for NSHA18 .......................20
4.1 Indonesian shallow crustal sources ...............................................................................................21
4.1.1 Tarera-Aiduna Fault System ....................................................................................................21
4.1.2 Wapoga ....................................................................................................................................21
4.1.3 Wandamen-Ransiki Fault Zone ................................................................................................21
4.1.4 Lengguru ..................................................................................................................................21
4.1.5 Cendrawasih ............................................................................................................................21
4.1.6 Waropen ...................................................................................................................................22
4.1.7 Nusa Tenggara Shallow ...........................................................................................................22
4.1.8 Banda Sea ................................................................................................................................22
4.1.9 West Banda Sea ......................................................................................................................22

vi Insert document title here
4.1.10 Tanimbar ................................................................................................................................22
4.2 PNG shallow crustal sources .........................................................................................................24
4.3 Intraslab sources ............................................................................................................................25
4.3.1 Indonesia ..................................................................................................................................25
4.3.2 PNG ..........................................................................................................................................26
4.3.3 Intraslab parameterisation ........................................................................................................27
4.4 Extended margin and oceanic sources ..........................................................................................27
4.5 Stitching of plate boundary model to Australian source models ....................................................28
5 Summary .............................................................................................................................................30
6 Acknowledgements .............................................................................................................................31
7 References ..........................................................................................................................................32
Earthquake sources of the Australian plate margin 1
1 Executive Summary
Located within an intraplate setting, continental Australia has a relatively low rate of seismicity
compared with its surrounding plate boundary regions. However, the plate boundaries to the north and
east of Australia host significant earthquakes that can impact Australia. Large plate boundary
earthquakes have historically generated damaging ground shaking in northern Australia, including
Darwin. Large submarine earthquakes have historically generated tsunami impacting the coastline of
Australia.
Previous studies of tsunami hazard in Australia have focussed on the threat from major subduction
zones such as the Sunda and Kermadec Arcs. Although still subject to uncertainty, our understanding
of the location, geometry and convergence rates of these subduction zones is established by global
tectonic models. Conversely, actively deforming regions in central and eastern Indonesia, the Papua
New Guinea region and the Macquarie Ridge region are less well defined, with deformation being
more continuous and less easily partitioned onto discrete known structures. A number of recently
published geological, geodetic and seismological studies are providing new insights into present-day
active tectonics of these regions, providing a basis for updating earthquake source models for
earthquake and tsunami hazard assessment.
This report details updates to earthquake source models in active tectonic regions along the Australian
plate boundary, with a primary focus on regions to the north of Australia, and a subsidiary focus on the
Puyesgur-Macquarie Ridge-Hjort plate boundary south of New Zealand. The motivation for updating
these source models is threefold:
1. To update regional source models for the 2018 revision of the Australian probabilistic tsunami
hazard assessment (PTHA18);
2. To update regional source models for the 2018 revision of the Australian national seismic
hazard assessment (NSHA18); and
3. To provide an updated database of earthquake source models for tsunami hazard
assessment in central and eastern Indonesia, in support of work funded through the
Department of Foreign Affairs and Trade (DFAT) DMInnovation program.
This report presents the geological, geodetic and seismological evidence for each earthquake
source’s existence, geometry, style of faulting and slip-rate, resulting in inclusion of a number of fault
sources not considered in previous PTHAs for Australia. Accompanying shapefiles provide source
traces and a basic parameterisation of dip, style of faulting and slip-rate. Along with the submarine
fault systems relevant to tsunami hazard assessment, area source zones are developed to capture
background seismicity for inclusion in the NSHA18 source model. Background zones include sources
for shallow active tectonic regions that are not covered by the fault source model; intraslab sources
that capture intermediate depth to deep seismicity within subducted oceanic crust; and source zones
for continental margin and oceanic regions extending from the plate boundary to the edge of seismic
source models developed for the Australian continent.
The representation of the sources in PTHA18 and NSHA18 necessarily involves a degree of
schematisation to be suitable for modelling. This report does not present these schematisations, as in
each case these are dependent on the respective hazard modelling frameworks used. Rather, the
intention of this report is to describe the major features of each source and the evidence for its
2 Earthquake sources of the Australian plate margin
seismogenic potential, providing a base level parameterisation from which the PTHA18 and NSHA18
source models are developed. Details of model implementation, including schematisation of fault
geometries and calculation of earthquake magnitude-frequency distributions, are contained in the
relevant PTHA18 and NSHA18 reports (Davies & Griffin, 2018; Allen et al., 2018).
A key difference between the source model developed for PTHA18 and that used for previous PTHAs
in the region is greater inclusion of non-subduction-megathrust sources. This includes large-scale
extensional faults associated with subduction rollback, such as the Banda Detachment in eastern
Indonesia, that have the potential to host large earthquakes that can cause significant vertical
deformation of the ocean floor and therefore generate tsunami. Transpressional systems, such as
Macquarie Ridge, may also generate tsunami and are included in a schematised manner.
Furthermore, outer-rise normal faulting earthquakes are considered in a systematic manner for
subduction zones nearby Australia, the first time such a model has been developed for a PTHA.
NSHA18 is the first national seismic hazard assessment of Australia to include a detailed
representation of earthquake sources for plate boundary regions to the north of Australia, including
separation of sources for active shallow crustal faults, subduction interface and subduction intraslab
earthquakes. In contrast, the 2012 National Seismic Hazard Model (NSHM12) only included three
broad sources zone encompassing the plate boundary region, and did not discriminate between deep
and shallow sources. An improved representation of these sources is expected to result in more
accurate hazard assessments for northern Australia.

Earthquake sources of the Australian plate margin 3
2 Introduction
The plate boundary regions to the north of Australia are complex and defy subdivision into easily
defined tectonic plates (Hall, 2018). Similarly, the Macquarie Ridge region exhibits a broad zone of
tectonic deformation rather than being a simple plate boundary structure (Hayes et al., 2009).
Nevertheless, a body of recent geological, geodetic and seismological studies is providing insights into
the tectonics of these regions, resulting in a revision of earthquake source models compared with
previous PTHA (Burbidge et al., 2008a; 2008b; Horspool et al., 2014; Davies et al., 2017). While major
subduction zones, such as the Sunda and Kermadec Arcs, are defined by global datasets (i.e. Bird
2003; Hayes et al. 2012; Berryman et al. 2015, Hayes et al. 2018) and are not discussed in this report,
many less significant structures have either only recently been identified, or have been subject to
conflicting interpretations. The updated earthquake source model presented here includes a number
of faults not included in past earthquake and tsunami hazard assessments undertaken in the region,
including extensional systems such as the recently identified Banda Detachment and transpressional
systems such as the Macquarie Ridge. Slip-rates for a number of faults are updated based on recent
geodetic studies. For the purposes of tsunami hazard assessment, for the first time outer-rise
earthquakes are considered for all major subduction zones surrounding Australia.
It should be noted that in some regions, in particular the Banda Sea and the Solomon Sea regions,
existing tectonic models still contain a high degree of uncertainty about the major structures
accommodating plate motions, and alternative models provided by different authors may not be
compatible. It is not the purpose of this study to resolve these outstanding issues; however, as we rely
on a wide range of models presented in the literature, in some cases our model contains fault source
models that conflict with each other in terms of style of faulting and sense of slip. Of particular note,
connections between the convergent Flores-Wetar Thrust and the extensional Banda Detachment are
unknown, and the fault sources provided here contain a geologically unlikely juxtaposition of
convergent and extensional systems. Further work will be needed to provide a more coherent tectonic
model for this region.
This report begins with a description of the updated fault source models, focusing on the geometry,
sense of faulting and slip-rates of submarine faults relevant to tsunami hazard assessment (Section
3). This is primarily based on a review of existing literature providing the evidence for the
interpretations used to develop our source models. Where available, Euler Poles reported from
geodetic studies are used to calculate relative slip-rates along strike of each fault. Base level data of
the fault trace, dip and slip-rate are provided in shapefiles accompanying this report. These fault
source models are further schematised to develop inputs for earthquake and tsunami hazard
assessment within the PTHA18 and NSHA18 projects. A summary of which faults are included in
these hazard assessments is presented in Section 3.5. For further details of these schematisations,
the reader is directed to the respective PTHA18 and NSHA18 reports (Davies & Griffin, 2018; Allen et
al., 2018). This is followed by development of area source models, including onshore and deep
(intraslab) earthquake sources, to be used to model regional earthquake sources for NSHA18 (Section
4). In Section 4 area source models covering continental margin and oceanic regions are also
described, followed by an outline of the methodology used to stitch offshore sources to the various
source models defined for continental Australia to avoid gaps and overlaps in source model coverage.
During the final stages of preparation of this report, Hayes et al., (2018) released the Slab2 model of
global subduction zones. This model included slab geometries for a number of subduction zones not
included in Slab 1.0 (Hayes et al. 2012), including the North Sulawesi, Timor, New Guinea and

4 Earthquake sources of the Australian plate margin
Puysegur subduction zones. The Slab2 models can be expected to provide better constraints on the
geometry of these sources than those provided within in this report, particularly for North Sulawesi,
New Guinea and Puysegur, and should provide a basis for future updates to this model. For Timor,
issues of whether the megathrust interface is seismogenic, or whether thin-skinned thrusting is
occurring instead (see Section 3.1.9), need to be resolved before direct application of the Slab2
model. It is also noted that Slab2 includes a model for the Molucca Sea Plate (Halmahera Slab in their
schematisation), however this slab is completely subducted and does not include the thrust interfaces
described in Section 3.1.1.
Earthquake sources of the Australian plate margin 5
3 Revised submarine fault source models
3.1 Central and Eastern Indonesia
Despite the sequence of great earthquakes on the Sumatran segment of the Sunda Subduction zone
since 2004, the historical record shows that tsunamis causing fatalities have occurred twice as
frequently in eastern Indonesia compared with the Sunda Arc (Latief et al., 2000). The complexity of
fault systems in central and eastern Indonesia means there are numerous faults capable of generating
locally significant tsunami. Proximity of the region to northern Australia, and the complex bathymetry of
the region, argue for careful consideration of the region for tsunami hazard assessment for both
Australia and Indonesia.
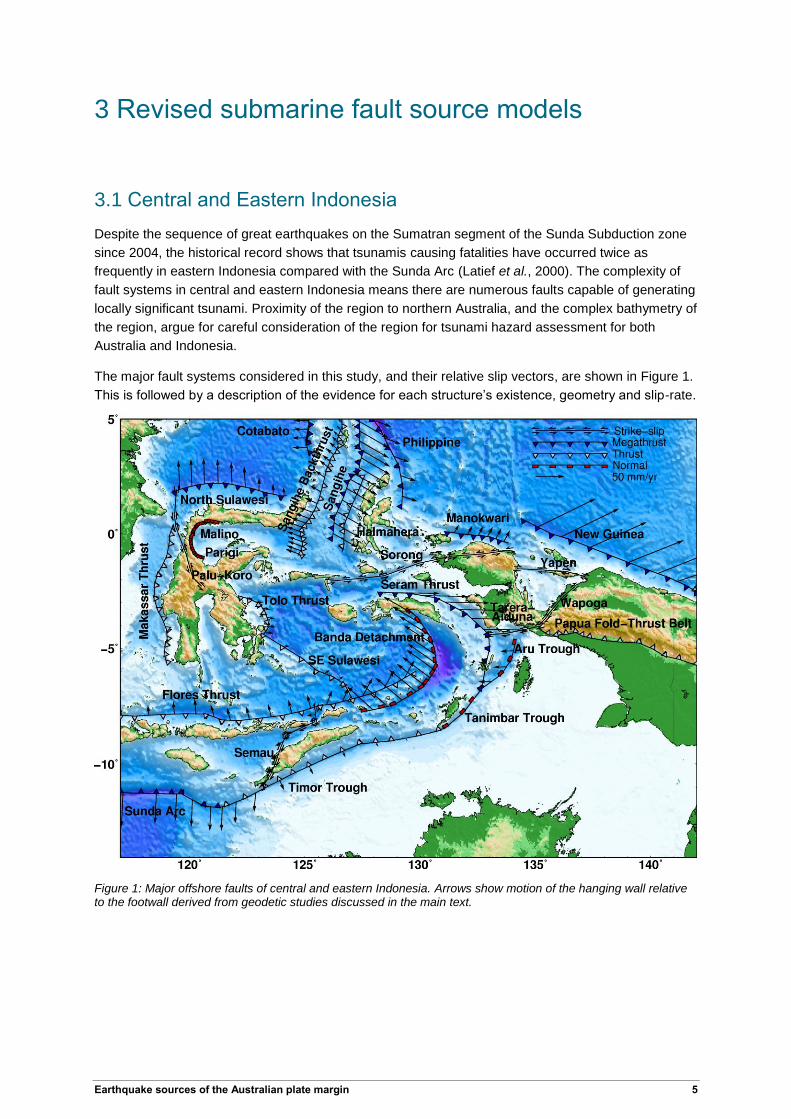
The major fault systems considered in this study, and their relative slip vectors, are shown in Figure 1.
This is followed by a description of the evidence for each structure’s existence, geometry and slip-rate.
Figure 1: Major offshore faults of central and eastern Indonesia. Arrows show motion of the hanging wall relative to the footwall derived from geodetic studies discussed in the main text.

6 Earthquake sources of the Australian plate margin
3.1.1 Molucca Sea (Sangihe Thrust, Sangihe Backthrust and Halmahera Forearc Thrust)
Double subduction of the Molucca Sea Plate beneath the Sangihe Arc to the west and the Halmahera
Arc to the east has seen the two accretionary wedges collide in the Molucca Sea Collision Complex,
with the Molucca Sea Plate being completely subducted and the Sangihe Forearc being thrust
eastwards over the Halmahera Forearc (Silver & Moore, 1978; Moore & Silver, 1983; Rangin & Silver,
1990; Hall & Smyth, 2008; Rangin et al., 1996; Lallemand et al., 1998). Very high seismicity rates are
observed at both shallow and deep depths, with shallow seismicity concentrated through the central
part of the collision zone (McCaffrey, 1982). Various interpretations of the main structural features
have been made; previous PSHAs (Irsyam et al., 2010) and PTHAs (Horspool et al., 2014) have
modelled seismicity on two opposing thrusts following bathymetric lows on the west and east margins
of the Molucca Sea and dipping towards the centre of the system, and appear to be based on early
interpretations that suggested the colliding accretionary wedges of the two arcs were being thrust back
onto their respective forearcs (Silver & Moore, 1978; Moore & Silver, 1983). Interpretations aided by
additional geomorphic and geological data (Rangin et al., 1996; Lallemand et al., 1998; Hall & Smyth,
2008) suggest that the bulk of the convergence is accommodated by subduction of the Halmahera Arc
beneath the Sangihe Arc; additional thrusts occur to the west, where parts of the Sangihe accretionary
wedge are being backthrust onto the Sangihe Forearc, and to the east thrusting also occurs within the
Halmahera Forearc south of ~3°N. To the north near the Snellius Ridge, the Halmahera Arc is almost
completely subducted. Other less significant thrusts are visible in swath bathymetry (Rangin et al.,
1996).
The system accommodates 80 mm/yr of the 105 mm/yr convergence between the Philippine Sea
Plate and Sundaland (Rangin et al., 1999). It is unclear how the convergence is accommodated within
the collision zone between the two main thrusts, other related thrust faults, and the Philippine and
Cotabato Trenches to the east and west respectively. Interpretations of bathymetric data, seismic
reflection profiles and seismicity suggest that convergence within the collision zone decreases north of
4°N and is increasingly accommodated by the Cotabato and Philippine Subduction Zones (Moore et
al., 1981; Rangin et al., 1996; Lallemand et al., 1998). Geodetic results from Tabei et al. (2008)
reported in Ohkura et al. (2015) give a rate of 26 mm/yr on the southern segment of their West
Molucca Thrust (our Sangihe Backthrust) decreasing to 17 mm/yr to the north, and a rate of 58 mm/yr
on their East Molucca Thrust (our Sangihe Thrust and Halmahera Thrust). Unfortunately the original
results (Tabei et al., 2008) are not available, therefore we estimate the convergence azimuth from
figures presented in Ohkura et al. (2015). We assume slip-rates on the Sangihe Backthrust continue to
decrease further north as convergence is accommodated on the Cotabato Thrust. As the bulk of
seismicity appears to be occurring on the Sangihe Thrust, and very little is associated with the
Halmahera Thrust, we put the bulk of the convergence (53 mm/yr) on the Sangihe Thrust and the
remainder (5 mm/yr) on the Halmahera Thrust. Furthermore, as the main crustal structure, we extend
the seismogenic depth of the Sangihe Thrust to 40 km while the Sangihe Backthrust and Halmahera
Thrust have seismogenic depths of 30 km. It is noted that due to uncertainty in earthquake locations
and difficulty discriminating earthquakes occurring within the folded Molucca Sea Plate from those on
the thrust faults of interest, these depths are estimates only. Due to its relatively small size, low slip-
rate and location far from Australia, the Halmahera Thrust is not included in the PTHA18 source
model.
Sediments from the colliding wedges are being extruded to the south (Silver & Moore, 1978; Moore &
Silver, 1983) and show a chaotic structure indicative of continuous deformation distributed across
many small faults and folds rather than localised on large crustal structures (Watkinson et al., 2011).
Tsunamigenic earthquakes are likely to happen here too. However, as there are no large scale
structures it is expected to be of limited significance for Australian tsunami hazard.
Earthquake sources of the Australian plate margin 7
3.1.2 Cotabato Trench
The Cotabato Trench has formed recently in response to completion of collision of the northern part of
the Sangihe and Talaud/Halmahera Arcs (especially around Mindanao) with convergence now being
accommodated on the Cotabato Trench to the west and the Philippine Trench to the east (Moore et
al., 1981). Subduction is established to the north while incipient subduction occurs at the southern end
of the trench to about the latitude of Sangihe Island (Silver & Moore, 1978). Slip rates of 25 mm/yr
across an east-west azimuth are taken from the results of Tabei et al. (2008) presented in Ohkura et
al. (2015). A concave down megathrust geometry with a maximum seismogenic depth of 40 km is
assumed. This is a conservative estimate, and the true seismogenic depth of the interface may be
shallower, particularly in the south, as subduction has only been initiated relatively recently and
seismic reflection profiles don’t show a clearly defined megathrust interface extending to depth
(Schlüter & Fritsch, 1985; Hall, 2018). However, seismicity show the slab extends to depths of < 100
km, providing some support for our choice (Hall, 2018). Seismic reflection profiles suggest sub-
horizontal dip at shallow depths, increasing with depth (concave down) but with dip being poorly
constrained. This source is considered unlikely to generate a tsunami with significant impacts on the
Australian coastline, and so is not included in the PTHA18.
3.1.3 North Sulawesi (Minahasa) Trench
The North Sulawesi Trench marks the subduction of the Sulu Sea beneath the north arm of Sulawesi.
The north arm is rotating rapidly clockwise relative to the stable Sunda Block and there are large
variations in slip-rate and dip along strike (Silver et al., 1983a;1983b; Socquet et al., 2006; Cipta et al.,
2016). Furthermore, the northern arm of Sulawesi can be divided into two rigid blocks separated by
the strike-slip Gorontalo Fault (Socquet et al., 2006) As noted by Cipta et al. (2016) contemporary
seismicity is located down-dip 50-100 km south of the bathymetric expression of the trench. However,
they caution against assuming the shallow dipping up-dip portion of the megathrust is aseismic.
Therefore we allow rupture all the way to the trench and vary slip-rate along the strike of the
megathrust using the Euler poles of Socquet et al. (2006). Dip at a depth of 20 km (18-24°) is
estimated from Cipta et al.'s (2016) analysis of earthquake focal mechanisms while dips near the
trench (2-16°) are taken from Silver et al.'s (1983b) analysis of seismic reflection profiles. Dip steepens
to the east. A maximum locking depth of 50 km is used and slip-rate decreases from 50 mm/yr in the
west to 15 mm/yr in the east (Socquet et al., 2006). The westerly junction with the Palu-Koro Fault and
the Makassar Thrust is poorly defined, and the boundary likely complex, therefore for local tsunami
hazard assessment additional thrust sources would need to be defined to capture historical events
such as the Mw 7.8 1996 Toli-Toli earthquake that generated a locally significant tsunami and occurred
shoreward of the mapped megathrust (Pelinovsky, 1996).
3.1.4 Parigi and Malino Faults
North-directed subduction rollback of the North Sulawesi Trench is accompanied by high rates of
extension across the Gulf of Tomini (Advokaat et al., 2017; Hall, 2018). This extension has generated
dramatic variations in topography ranging from 2-3 km high mountains along the northern arm and
neck of Sulawesi to depths approaching 2 km in the Gulf of Tomini over distances on the order of 50
km (Hall, 2011). Extension is accommodated on gently dipping detachments in Central Sulawesi
(Spencer, 2011), and the Parigi and Malino Faults bounding the south-west and north-west coasts of
the Gulf of Tomini respectively (Watkinson & Hall, 2016). The strike-slip Tambarana Fault runs sub-
parallel to the Palu-Koro Fault, between the Parigi and Malino Faults (Watkinson & Hall, 2016;
Advokaat et al., 2017). Normal faulting on the Parigi and Malino Faults is expected to be locally

8 Earthquake sources of the Australian plate margin
significant for tsunami hazard, but not to pose a threat to the Australian coastline. Therefore these
sources are not included in the source model for the PTHA18.
A Mw 7.7 earthquake on 20 May 1938 generated a local tsunami of up to 3 m height at Parigi, on the
east coast of the neck of Sulawesi, and is thought to have occurred on the Parigi Fault (Griffin et al.,
2017). In the absence of further information on their structure, both the Parigi and Malino Faults are
modelled as shallow dipping (30°) normal faults with listric geometry, extending to a maximum
seismogenic depth of 25 km.
3.1.5 Tolo Thrust
The Tolo Thrust is offshore of the south-east margin of Sulawesi. Greatest deformation occurs in the
centre of the structure, tapering to either end (Silver et al., 1983b). The northern end appears to link
structurally to the onshore Matano strike-slip fault (Silver et al., 1983b). The Tolo Thrust has been
proposed to represent incipient subduction by Hall (2018). Seismic reflection profiles show an
extensional detachment on the landward side of the structure, with detached crust then thrust over
oceanic crust of the western edge of the North Banda Sea (Hall, 2018). We model the structure as a
simple thrust fault with a dip of 30° and maximum depth of 30 km. Using the results of (Koulali et al.,
2016) we model a slip-rate of 14 mm/yr with an azimuth of 100°. This results in near fault-normal
compression in the southern part of the Tolo Thrust transitioning to left-lateral strike-slip motion as the
thrust curves in transition to the Matano Fault. We note that further work is required to better consider
potential tsunamigenesis from the rotational extensional-detachment-to-thrust structures shown in
seismic reflection profiles (Hall, 2018).
3.1.6 Makassar Thrust
Seismic reflection profiles show a series of thrust faults running north-south offshore of the west coast
of Sulawesi that appear to extend and connect with the Palu-Koro Fault and North Sulawesi
Subduction Zone in the north (Puspita et al., 2005). It is unclear if the Makassar Thrust should be
modelled as one structure, or a series of thrusts. In this study we follow Cipta et al. (2016) who model
the fault as a single thrust fault accommodating 9 mm/yr of convergence between Sulawesi and
Borneo on 30° dipping thrust faults. This source is considered unlikely to generate a tsunami with
significant impacts on the Australian coastline, and so is not included in the PTHA18.
3.1.7 Banda Detachment
Although for some time it had been hypothesised that the 7.2 km deep Weber Deep had formed due
to forearc extension related to subduction rollback (e.g. Charlton et al. 1991; Spakman & Hall 2010;
Hall 2011), only recently has the acquisition of industry multi-beam bathymetry data allowed for the
identification of the Banda Detachment, a major crustal scale normal fault along which the Weber
Deep opened (Pownall et al., 2016). This ~450 km long fault is a low angle detachment with the
footwall forming the eastern slopes of the Weber Deep. The hanging wall is ~120 km to the west
forming the western boundary of the basin, and it is the largest bathymetric expression of any normal
fault in the world’s oceans (Pownall et al., 2016). To the north the detachment steepens and
transitions into the predominantly strike-slip Kawa Shear Zone, with the orientation of the shear zone
aligning with linear grooves trending 120-130° observed on the footwall of the main detachment
(Pownall et al., 2016). It is assumed based on GEBCO 2014 bathymetry grid (www.gebco.net) and
seismicity that the southern end of the detachment also transitions to a strike-slip system, although
this is not confirmed. Low angle (~12°) fault planes in south-east Seram and Pulau Fadol are
Earthquake sources of the Australian plate margin 9
interpreted as the surface expression of the Banda Detachment (Pownall et al., 2016). We interpret
the detachment interface to be a low-angle normal fault in the centre of the basin, steepening to
oblique strike-slip structures to the north and south. Due to the consistent sub-parallel orientation of
fault plane grooves and the Kawa Shear Zone we model slip azimuth increasing over the range 120-
130° from north to south. Subduction rollback along this orientation since ~2 Ma has opened the basin
by 120 km, implying an average 60 mm/yr slip-rate over this period.
Thin sedimentary cover within the basin suggest it is very young and that rapid subsidence has
occurred (Pownall et al., 2016). There is no instrumental seismicity to indicate whether the Banda
Detachment is active. However historical reports of two large earthquakes and tsunami that struck the
Banda Sea (including the Banda Islands and Ambon) in 1649 and 1852 note the creation of new
islands in the Kei Islands (Wichmann, 1918), which are located on the surface expression of the
footwall. Although further work needs to be undertaken to determine conclusively if these earthquakes
did occur on the Banda Detachment, this evidence suggests that coseismic uplift of the exposed
footwall up-dip of the seismogenic zone may occur, which in turn would be expected to contribute to
tsunami generation. Furthermore, due to the steep slopes of the basin and the low angle of the fault
plane, horizontal coseismic deformation may also be a significant for tsunamigenesis.
High heat flow and thinned crust within the basin is expected to limit the seismogenic depth. We
estimate a maximum seismogenic depth of 15 km at the centre of the basin, and 20 km to the north
and south where the fault transitions into a dominantly strike-slip environment. Listric geometry is
assumed and dips at 10 km depth estimated. However, in the final PTHA18 and NSHA18
schematisations, this geometry is simplified due to constraints on modelling faults with strongly curved
fault geometries and varying seismogenic depths.
Related to the Banda Detachment, multibeam bathymetry shows large (up to 100 km scale)
submarine mass failure scars along the slopes bounding the Weber Deep. Although it is unknown if
these scars represent single or multiple events, large scale submarine mass failures are another major
source of tsunami hazard in this region. It is worth noting that the largest observable scar, at 135.5° E,
5.0° S, is located directly above the estimated hypocentre of the 1938 Mw 8.6 moderate depth (60 km)
earthquake (Okal & Reymond, 2003). Other earthquakes in the Global Centroid-Moment-Tensor
(GCMT) catalogue (Ekström et al., 2012)) occur in this region along a NE trend at similar depths. We
speculate that this may be a localised region of heightened deformation within the subducted
Australian slab beneath the Banda Sea, and that these earthquakes on occasion may trigger
submarine mass failures; that only a small tsunami was observed in 1938 (Okal & Reymond, 2003)
suggests that for this event large mass failures did not occur.
3.1.8 Flores Thrust
The Flores Thrust refers to the full extent of the back-arc thrust extending from east Java, north of Bali,
Lombok, Sumbawa, Flores and further east to the north of Wetar. It incorporates faults previously
defined as separate segments in varying configurations, including the Kendeng Thrust Belt on east
Java and extending offshore, the North Bali Back-Arc, the Flores Thrust, the Alor Thrust, the Wetar
Thrust, and a number of additional smaller thrust structures (e.g. Breen et al. 1989; Silver et al. 1983;
Irsyam et al. 2010; Horspool et al. 2014). Linking all of these structures together is based on geodetic
block modelling (Koulali et al., 2016) and a lack of obvious structural boundaries that would prevent
rupture across previously mapped back-arc segments, although fault mapping demonstrates that the
back-arc is clearly structurally segmented and more complex than is practical to treat for assessing
earthquake and tsunami hazard for Australia (Breen et al., 1989; Irsyam et al., 2010; 2017). Source
models for the largest instrumentally recorded earthquake on this structure, the 1992 Mw 7.9 Flores

10 Earthquake sources of the Australian plate margin
earthquake and tsunami, show that this earthquake occurred further south than the incipient trench
where the Flores Thrust is mapped, further demonstrating the complexity of the region (Beckers & Lay,
1995; Hidayat et al., 1995; Imamura et al., 1995; Griffin et al., 2015). Similarly, locations for the 2018
Lombok sequence of earthquakes (28 July Mw 6.4, 5 August Mw 6.9 and 19 August Mw 6.9) are located
south of the surface trace of the Flores Thrust. However modelling the back-arc as a single structure
both simplifies the modelling process and allows for the very real possibility of multi-segment ruptures
(e.g. considering the 2016 Mw 7.8 Kaikoura, New Zealand earthquake that ruptured at least 12 major
faults; Hamling et al. 2017). A maximum locking depth of 20 km is estimated by Koulali et al. (2016),
however a recent inversion for the 1992 Flores earthquake allow some slip to 30 km (Ignatius Ryan
Pranantyo pers. comm.). Furthermore, United States Geological Survey locations for the 2018 Lombok
sequence also range in depth from 14-31 km, and therefore we use a maximum seismogenic depth of
30 km. Slip-rates are taken from Koulali et al. (2016). Seismic reflection profiles show a mix of
thrusting styles, with listric, linear and concave downward fault planes being imaged (Silver et al.,
1983c; Breen et al., 1989; Snyder et al., 1996), again reflecting the complex nature of the region. High
resolution seismic reflection images from more recent studies do not exist (or are unknown to us).
Maximum magnitudes can be expected to be limited by the relatively shallow locking depth compared
with true subduction zones, although are likely higher than the Mw 7.8 used by Irsyam et al. (2013).
Horspool et al. (2014) used a maximum Mmax of Mw 8.5, while Nguyen et al. (2015) and Griffin et al. (in
review) estimate a moment magnitude of up to 8.4 for an earthquake that occurred on the Flores
Thrust in 1820 resulting in destruction of buildings and forts due to strong ground shaking and tsunami
inundation in Sumbawa and South Sulawesi (Wichmann, 1918).
3.1.9 Timor Trough
The Timor Trough marks the collision between Australian continental crust and the Sunda-Banda Arc.
The geometry of the main fault plate is poorly constrained. Seismic imaging shows thin-skinned
deformation in the Timor fold-thrust belt linking into a low angle decollement (Saqab et al., 2017),
which possibly steepens again at depth (Snyder et al., 1996). The deformation front is characterised
by steep shallow thrusts (~30° dip) that link into a shallow decollement (~10° dip) at depths of around
5 km (Saqab et al., 2017; Hughes et al., 1996). There are few constraints beyond this depth, however
a model developed by Snyder et al. (1996) on the basis of deep seismic reflection and refraction data
suggests steepening of the decollement again at depths greater than 10 km. Due to the poor
constraints this geometry is simplified to a constant 25° dipping fault plane for PTHA18. A maximum
seismogenic depth of 25 km is used, based on the interpretation that deformation is primarily thin-
skinned, rather than subduction. A number of focal depths within the ISC-GEM catalogue (Storchak et
al., 2013) also extend to these depths. Due to its relative proximity to northern Australia, it is
recommended that further work be undertaken to constrain the geometry of the Timor Trough, in
particular if more industry-acquired seismic reflection data (e.g. Baillie and Milne, 2014) becomes
publically available.
It has been contentious as to whether significant convergence is still being accommodated at the
Timor Trough. Although Baillie and Milne (2014) argue on the basis of seismic reflection profiles that
the deformation front has not been active since ~4 Ma, Saqab et al. (2017) have reinterpreted these
data along with additional seismic reflection data to conclude that there is ongoing activity at the
deformation front. This is consistent with geodetic studies showing convergence of ~ 30 mm/yr in the
west decreasing to ~10 mm/yr to the east of Timor (Bock et al., 2003; Koulali et al., 2016).
Furthermore, Saqab et al. (2017) show evidence for episodic earthquake behaviour since 6 Ma and
argue that present seismic quiescence should not be interpreted as low seismic hazard. Consistent
with this interpretation, temporal variations in uplift rate since the Pliocene have been observed on the
island of Timor (Nguyen et al., 2013). Based on this evidence we apply the slip-rates from Koulali et al.
Earthquake sources of the Australian plate margin 11
(2016) along the margin. Further east along the Timor Trough relative motion becomes increasingly
oblique and slip-rates decrease to insignificant values, before transitioning to the Tanimbar Trough in
a low slip-rate, obliquely extensional regime (see Section 3.1.11 for more details). To the west we
place the boundary with the Sunda Arc subduction zone at 121.6° E, as an approximation of where
Australian continental crust is colliding with the trench based on interpretation of bathymetry. To the
west of the boundary, Australian oceanic crust is subducted beneath the Sumba Block (being
Australian continental crust accreted to Sundaland during the Late Cretaceous) while to the east thin-
skinned deformation is occurring in the foreland basin resulting from Miocene collision of the
Australian continent (Timor) with the Sunda-Banda Arc (Hall & Sevastjanova, 2012; Saqab et al.,
2017). The exact location of the boundary is poorly determined. To the east, the intersection of the
Semau Fault (123° E), marking the boundary between the Sumba and Timor blocks defined by Koulali
et al. (2016), could instead mark the transition from subduction to thin-skinned deformation. Further to
the west the depth of the trough increases, and the boundary could alternatively be placed south of
Sumba (at ~120° E), as here depths reach typical Java Trench depths of greater than 5000 m and
there is increased seismic activity.
Saqab et al. (2017) also found that there is ongoing extensional deformation due to flexural bending of
the Australian plate to the south of the Timor Trough. Although these faults are found in much
shallower water than the Timor Trough, the potential for outer-rise earthquakes as a source of tsunami
hazard may also need to be considered.
3.1.10 Semau Fault
This fault marks the boundary between the Sumba and Timor blocks in Koulali et al.'s (2016) geodetic
model. As it is predominantly a strike-slip fault, with the majority of the fault located onshore in West
Timor and to the north of Timor in the Ombai Strait, it is not considered significant for tsunami
generation for Australia, and therefore not included in PTHA18, while for NSHA18 this source is
included within an area source zone.
3.1.11 Tanimbar Trough
Structurally the Tanimbar Trough is the north-eastward continuation of the Timor Trough however it is
separated due to a transition from convergence to divergence evidenced by interpretation of seismic
reflection profiles, focal mechanisms and consideration of regional tectonics (Schlüter & Fritsch, 1985;
Charlton et al., 1991). Divergence is re-activating thrusts formed before the cessation of subduction.
Recent geodetic studies suggest left-lateral strike-slip motion with oblique convergence in the
southern segment and extension in the north (Koulali et al., 2016). Motion is poorly constrained with
the island of Tual moving relative to Australia at an insignificant rate of 1.0 +/- 1.7 mm/yr, meaning
extension in the southern segment is still consistent with geodetic data. The oblique motion transitions
to predominantly extensional in the Aru Trough to the north (Charlton et al., 1991). The most up-dip
region near the trough is mostly aseismic for the instrumental period; a few moderate-magnitude
earthquakes have occurred at depths of 20-40 km. The GCMT catalogue shows a transition from
thrust dominant to mostly normal mechanisms east of about 131° E. The weight of evidence therefore
supports modelling the feature as divergent rather than convergent, with low slip-rates, and
recognising that there is a significant strike-slip component of motion. For this study the Tanimbar
Trough is modelled as a ~145 km long segment with the extensional component of the oblique slip
considered tsunamigenic, and having low slip-rates of < 2 mm/yr. The boundary between the Timor
and Tanimbar Trough segments is put at 130.7° E, the approximate location of changes in fault
orientation and focal mechanism. It is assumed following the interpretation of seismic lines from
12 Earthquake sources of the Australian plate margin
Schlüter & Fritsch (1985) presented in (Charlton et al., 1991) that earthquakes occur on thrusts within
the accretionary wedge reactivated as low-angle normal faults, rather than the low angle former
megathrust. Therefore a listric geometry is assumed with a 30° dip at the surface and a 5° dip at 20
km depth. We note that our interpretation conflicts with Liu and Harris (2014) who attribute the
destructive 1852 Banda Sea Tsunami to a large megathrust earthquake on the Tanimbar Trough; in
our opinion other structures such as the Banda Detachment may be more plausible sources for this
event, although work to resolve this problem is ongoing.
3.1.12 Aru Trough
The Aru Trough is a zone of approximately east-west extension bounded to the north by the Tarera-
Aiduna Fault System and linking to the south to the Tanimbar Trough segment of the Timor
Trough/Banda Arc. Charlton et al. (1991) interpret the active zone of extension to be on the eastern
side of the trough due to the concentration of seismicity. They estimate 35 km of extension since the
Pliocene. If we assume that extension initiated ~ 2.5 Ma then we can estimate a long-term slip-rate of
14 mm/yr. Geodetic measurements from Bock et al. (2003) and Stevens et al. (2013) provide a further
constraint with extension rates of 17.6 mm/yr, azimuth 85.7°and 22.5 mm/yr, azimuth 88.0°
respectively. We favour the use of the Stevens et al. (2013) solution as this has the longest period of
geodetic observations available. Seismic reflection profiles show high angle normal faults bounding
the trough (Jongsma et al., 1989) and extending to depths of more than 10 km (Granath et al., 2010),
without resolution of the faults at greater depths. We place our source on the eastern side of the
trough and assume a dip of 60° to the west. Earthquakes have been observed from shallow crustal to
upper mantle depths (Sloan & Jackson, 2012). For the purpose of the PTHA18 we assume a
maximum seismogenic depth of 32 km, consistent with estimates of crustal thickness (Jacobson et al.,
1979), as deeper earthquakes in the upper mantle are not expected to be significant for tsunami
generation. A constant dip of 60° places the downdip limit of the fault approximately in the centre of
the ~35 km wide Trough and is a reasonable approximation to the fault geometry, although the dip
may well be shallower at depth.
3.1.13 Seram Thrust
The Seram Fold Thrust belt accommodates ~20 mm/yr convergence (Rangin et al., 1999; Stevens et
al., 2002). Youthful folds on the north coast of Seram are consistent with S-dipping thrusts and are
interpreted by Watkinson and Hall (2016) as consistent with the presence of an offshore megathrust.
3.1.14 Manokwari Trench
The Manokwari Trench is the western-most segment of the New Guinea Trench, offset by a transform
fault ~125 km to the south of the western-most extent of the main New Guinea Trench. Seismic
reflection profiles show evidence of subduction and thrusting but are not of sufficient resolution to
provide good constraints on the fault geometry (Milsom et al., 1992). Analysis of the 3 January 2009
Mw 7.6 and Mw 7.4 doublet show dips of 31° and 28° and focal depths of 15 and 12 km respectively
(Poiata et al., 2010). We assume a typical concave down subduction geometry. Okal (1999) suggests
a magnitude ~8 earthquake in 1914 that generated a tsunami causing significant damage in West
Papua, and also observed in Hawaii, was most likely generated on the Manokwari Trench.
Earthquake sources of the Australian plate margin 13
3.2 Papua New Guinea region
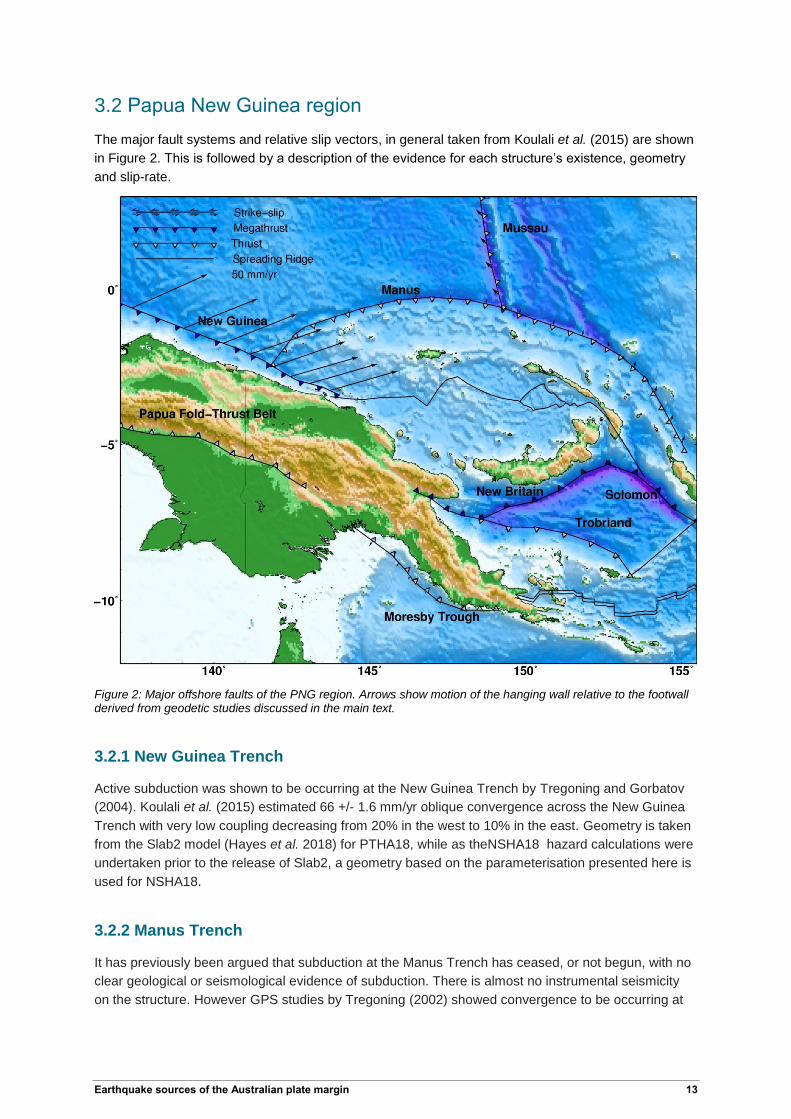
The major fault systems and relative slip vectors, in general taken from Koulali et al. (2015) are shown
in Figure 2. This is followed by a description of the evidence for each structure’s existence, geometry
and slip-rate.
Figure 2: Major offshore faults of the PNG region. Arrows show motion of the hanging wall relative to the footwall derived from geodetic studies discussed in the main text.
3.2.1 New Guinea Trench
Active subduction was shown to be occurring at the New Guinea Trench by Tregoning and Gorbatov
(2004). Koulali et al. (2015) estimated 66 +/- 1.6 mm/yr oblique convergence across the New Guinea
Trench with very low coupling decreasing from 20% in the west to 10% in the east. Geometry is taken
from the Slab2 model (Hayes et al. 2018) for PTHA18, while as theNSHA18 hazard calculations were
undertaken prior to the release of Slab2, a geometry based on the parameterisation presented here is
used for NSHA18.
3.2.2 Manus Trench
It has previously been argued that subduction at the Manus Trench has ceased, or not begun, with no
clear geological or seismological evidence of subduction. There is almost no instrumental seismicity
on the structure. However GPS studies by Tregoning (2002) showed convergence to be occurring at
14 Earthquake sources of the Australian plate margin
the Manus Trench, and a more recent study by Koulali et al. (2015) has confirmed that a small
component of convergence between the North Bismark Plate and the Pacific Plate is accommodated
on this structure. Euler Poles from the block model of Koulali et al. (2015) suggest oblique relative
plate motion increasing from 3 mm/yr in the west to 10 mm/yr in the east. Koulali et al. (2015) suggest
slip-rates of < 10 mm/yr, based on observations that a GPS site on Manus Island has a velocity of ~6
mm/yr relative to the Pacific Plate, with convergence from 3-5 +/- 1.4 mm/yr across the trench; we
calculate a maximum convergence of ~ 7 mm/yr based on Koulali et al.'s (2015) Euler Pole. The
absence of a volcanic arc and seismicity at depth suggests that subduction is either not occurring or
not well-established at the trench; based on this interpretation we limit the seismogenic depth to 25
km, although it could be shallower, and assume a linear down-dip geometry with 30° dip.
3.2.3 Mussau Trench
The Mussau Trench is a zone of low slip-rate oblique convergence between the Caroline Sea and
Pacific Plates. Oblique slip-rates of 12 mm/yr are taken from Bird (2003). Earthquake focal
mechanisms show large right-lateral strike-slip components with minor thrust components, which
combined with the low slip-rates across this boundary led McCaffrey (1996) to argue that the Mussau
Trench may be a zone of local deformation but not a plate boundary. Absence of an active volcanic
arc support interpretation that subduction is not presently occurring. With little other information
available, we model the source as a thrust fault with linear down-dip geometry with 30° dip, and a
maximum seismogenic depth of 25 km.
3.2.4 Trobriand Trough
Some tectonic models of the eastern New Guinea region have interpreted the Trobriand Trough as
forming the southern boundary of the Solomon Sea Plate, resulting in a separate Woodlark Plate to
the south (e.g. Bird, 2003). Seismic reflection profiles show that subduction was occurring up until the
recent past however does not show evidence that subduction is still occurring (Lock et al., 1987). Due
to the entirely submarine location of the Trobriand Trough, GPS studies have not been able to
measure relative motion between the proposed Solomon Sea and Woodlark Plates, however Wallace
et al. (2014) are better able to fit their GPS data without placing a boundary along the Trobriand
Trough, and suggest if there is convergence here, that slip-rates are less than 2 mm/yr. Lack of
seismicity and the lack of a well-defined Benioff zone further strengthens the case that subduction has
ceased within the Trobriand Trough, although we cannot rule out that deformation still occurs on this
structure. Therefore we include the Trobriand Trough in our source model as a crustal thrust fault with
an estimated slip-rate of 1 mm/yr and maximum seismogenic depth of 30 km, in contrast to the
previous Australia PTHA (Burbidge et al., 2008b) that used the Bird (2003) plate model as the basis
for its source model. A linear down-dip geometry with 30° dip is assumed.
3.2.5 Moresby (Aure) Trough
The first geodetic evidence for convergence between the Papuan Peninsula and Australia across the
Moresby Trough has been recently published by Koulali et al. (2015), who reported convergence on
the order of 5-7 mm/yr. Further supporting its interpretation as a convergent setting, seismic reflection
profiles presented by Ott and Mann (2015) show evidence of Miocene to Recent thrusting across the
Moresby Trough. To the east, the Moresby Trough connects topographically with the Pocklington
Trough, however a lack of seismicity has led to this feature being interpreted as a passive margin (Ott
& Mann, 2015; Abers et al., 2016), or possibly undergoing slow extension due to rotation of the
Earthquake sources of the Australian plate margin 15
Woodlark Microplate (Wallace et al., 2014; Ott & Mann, 2015). Based on this evidence we include the
Moresby Trough with the slip-rates of Koulali et al. (2015) in our hazard assessments, but consider the
Pocklington Trough inactive and do not include this structure as a seismogenic sources. A listric
geometry with maximum seismogenic depth of 30 km is assumed.
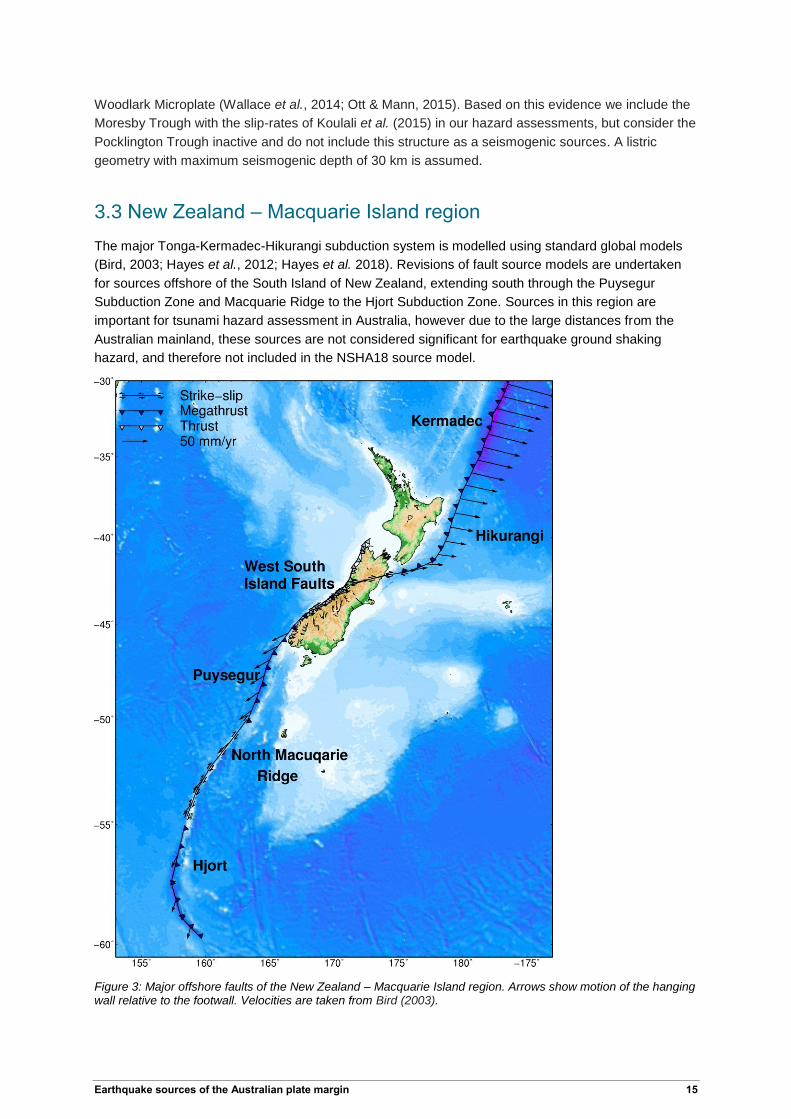
3.3 New Zealand – Macquarie Island region
The major Tonga-Kermadec-Hikurangi subduction system is modelled using standard global models
(Bird, 2003; Hayes et al., 2012; Hayes et al. 2018). Revisions of fault source models are undertaken
for sources offshore of the South Island of New Zealand, extending south through the Puysegur
Subduction Zone and Macquarie Ridge to the Hjort Subduction Zone. Sources in this region are
important for tsunami hazard assessment in Australia, however due to the large distances from the
Australian mainland, these sources are not considered significant for earthquake ground shaking
hazard, and therefore not included in the NSHA18 source model.
Figure 3: Major offshore faults of the New Zealand – Macquarie Island region. Arrows show motion of the hanging wall relative to the footwall. Velocities are taken from Bird (2003).

16 Earthquake sources of the Australian plate margin
3.3.1 West South Island faults
A series of thrust faults running just offshore of the west coast of the South Island of New Zealand
have been included in recent tsunami hazard assessments for New Zealand (Power, 2013; Power et
al., 2017). These faults (Barn, South Westland, Cape Foulwind, Kongahu and Kahurangi) dip to the
south-east, meaning the down-dip projection of the fault plane extends onshore, reducing the
tsunamigenic potential. They are modelled by Power (2013) with a characteristic magnitude of 7.6 and
maximum magnitude of 8.0. Slip-rates are all ≤ 2 mm/yr. As the bulk of the vertical surface
deformation from earthquakes on these faults will occur onshore, with minor components offshore,
they are not considered significant for tsunami hazard in Australia and therefore not included in the
PTHA18 source model.
3.3.2 Puysegur Trench
Hayes et al. (2009) and Hayes and Furlong (2010) have shown that subduction at the Puysegur
Trench occurs in the direction of relative plate motion between the Australia and Pacific Plates, and
therefore obliquely to the axis of the trench. This conclusion is supported by: the orientation of
earthquake slip vectors; contours of the subducted slab being normal to the direction of relative plate
motion, rather than the trench axis; and a lack of obvious structures onto which trench-parallel plate
motion could be accommodated. High seismicity rates within the Puysegur Block, a ~150 km wide
component of deforming Australian oceanic crust located to the west of the Puysegur Trench, are
evidence of deformation due to locking of the wide, shallow dipping subduction interface, in part driven
by subduction of young (20-40 Ma), relatively buoyant, oceanic crust (Hayes et al., 2009). Seismicity
within the Puysegur Block includes the Mw 8.1 23 December 2004 strike-slip earthquake. This block is
thought to be bounded to the west by a propagating tear within the Australian plate linking to the
Alpine Fault in the South Island of New Zealand (Lebrun et al., 2003; Malservisi et al., 2003; Hayes et
al., 2009). For the PTHA18, slip vectors are taken from Hayes and Furlong (2010), while the Slab2
model (Hayes et al., 2018) is used for the fault interface geometry.
3.3.3 North Macquarie Ridge
Between Macquarie Island and the Puysegur Trench, the boundary between the Australian and Pacific
Plates exhibits a dual mode of rupture (Ruff et al., 1989), with predominant strike-slip faulting combined with
occasional thrust events (Massell et al., 2000). For instance, in the GCMT catalogue (1976-2016; Ekström
et al., 2012), 15 of 18 earthquakes with Mw > 6.0 in this region show a strike-slip focal mechanism, including
the two largest earthquakes with Mw ~ 8.1; while the remaining three events have reverse or oblique reverse
focal mechanisms, dipping towards the Australian plate at 34-52°. Two of the latter events have depths of
10 km, while the third is recorded as 33 km which is interpreted as being poorly constrained. These events
are interpreted to represent thrusting along transpressional flower structures. This earthquake history is
consistent with plate tectonic models that indicate oblique (predominantly transverse) plate motion with a
convergent component of around 5-10 mm/year, and deformation concentrated on the Australian side of the
plate boundary (Bird, 2003; Kreemer et al., 2014). McCue (2008) highlighted the potential for this region to
host a tsunamigenic thrust earthquake, and Greenslade et al. (2009) included tsunami sources in this
region to support the Bureau of Meteorology’s T2 scenario database for the Joint Australian Tsunami Early
Warning Centre. In order to model a representative geometry of this transpressional system, we model
thrust events in this region with a steeply-dipping linear source-zone geometry, having a dip of 50° towards
the Australian Plate, and a maximum depth below the trench of 20 km consistent with typical oceanic
lithosphere thickness.

Earthquake sources of the Australian plate margin 17
3.3.4 Hjort Trench
Incipient easterly directed subduction of the Australian Plate beneath the Pacific Plate is occurring at
the Hjort Trench. Meckel et al. (2003) have demonstrated that seismogenesis is limited to a maximum
depth of 20 km. To the north, the trench transitions to the Macquarie Ridge and relative motion is
increasingly oblique. We model a concave down parabolic fault plane with a dip of 10° at the surface
steepening to 20° at 15 km depth. Slip-rates and fault trace are taken from global models (Bird, 2003).
3.4 Outer-rise events
Outer-rise events refer to those events that occur within the fore-arc bulge of the subducting oceanic
plate due to bending and flexure of the plate as it subducts. Relatively little is known about these
events, including their maximum magnitudes and recurrence intervals, compared with megathrust
events. Outer-rise earthquakes may have normal fault mechanisms due to extension caused by
bending of the plate and pull of the subducted slab; however thrust earthquakes also occur, and are
thought to be linked to locking at the subduction interface (Christensen & Ruff, 1988). In some cases,
outer-rise events may be associated in time with megathrust events (Lay et al., 2010; Lay et al., 2009).
A Mw 8.3 outer-rise earthquake occurred to the south of Sumba in 1977 (Lynnes & Lay, 1988; Gusman
et al., 2009) generating a tsunami with 6 m wave heights observed in Western Australia (Goff &
Chague-Goff, 2014). Source models for the 1977 Sumba event suggest ruptures could have extended
from depths of 50 km to the surface, given total rupture widths of ~70 km based on a 45° dip (Lynnes
& Lay, 1988; Gusman et al., 2009). Seismic reflection profiles reported by Saqab et al. (2017) suggest
that active normal faulting also occurs within the Australian continental crust to the south of the Timor
Trough. Multi-beam bathymetry over the Java Trench shows numerous surface features in the oceanic
Australian plate that are interpreted as normal faults due to plate bending (Kopp et al., 2006).
Although Satake and Tanioka (1999) argue that outer-rise events should be included in tsunami
hazard assessments, it appears in practice this is rarely done, and standard methods do not exist for
characterising maximum magnitudes and recurrence rates for outer-rise events. Burbidge et al.
(2008a) include a normal fault source near the location of the 1977 Sumba earthquake with alternative
maximum magnitudes of 8.5 and 9.0, but do not consider outer-rise events elsewhere. Sleep (2012)
uses plate kinematics to argue that the rate of moment release for outer-rise events on a particular
part of the Japan trench should be 0.45% that of the corresponding megathrust. This is in part based
on an assumed maximum seismogenic depth of 30 km, which is shallower than sources models for
the Sumba earthquake, with maximum depths of 50 km (Gusman et al., 2009; Lynnes & Lay, 1988),
and the 1933 Sanriku earthquake, with a maximum depth of 70 km (Kanamori, 1971). Our analysis of
the GCMT catalogue shows large variations in the ratio of the rate of outer-rise to megathrust events
(Davies & Griffin, 2018). Maximum magnitudes are highly uncertain; the largest recorded outer-rise
event is the Mw 8.5 1933 Sanriku earthquake (Okal et al., 2016). However, magnitudes could
presumably be at least as high as the maximum observed magnitude to have occured within oceanic
lithosphere (i.e. the Mw 8.6 April 11 2012 Wharton Basin Earthquake).
Outer-rise source models are included for the major subduction zones surrounding Australia: the
Sunda Arc, Timor Trough, Solomons Arc, New Hebrides Arc and Tonga-Kermadec Arc. For the
Puysegur Subduction Zone we only include an outer-rise source near the main trench, and don’t
extend it further north (i.e. towards the Fiordland segment of the subduction zone) due to the highly
oblique nature of subduction here (Hayes et al., 2009). The surface traces of the outer-rise sources
were determined by taking the surface trace of the megathrust (i.e. the trench) and moving this slightly
seaward (on the order of ~10 km). Dips of 45° and maximum depths of 50 km are assumed based on
source models for the 1977 Sumba earthquake (Lynnes & Lay, 1988; Gusman et al., 2009).
18 Earthquake sources of the Australian plate margin
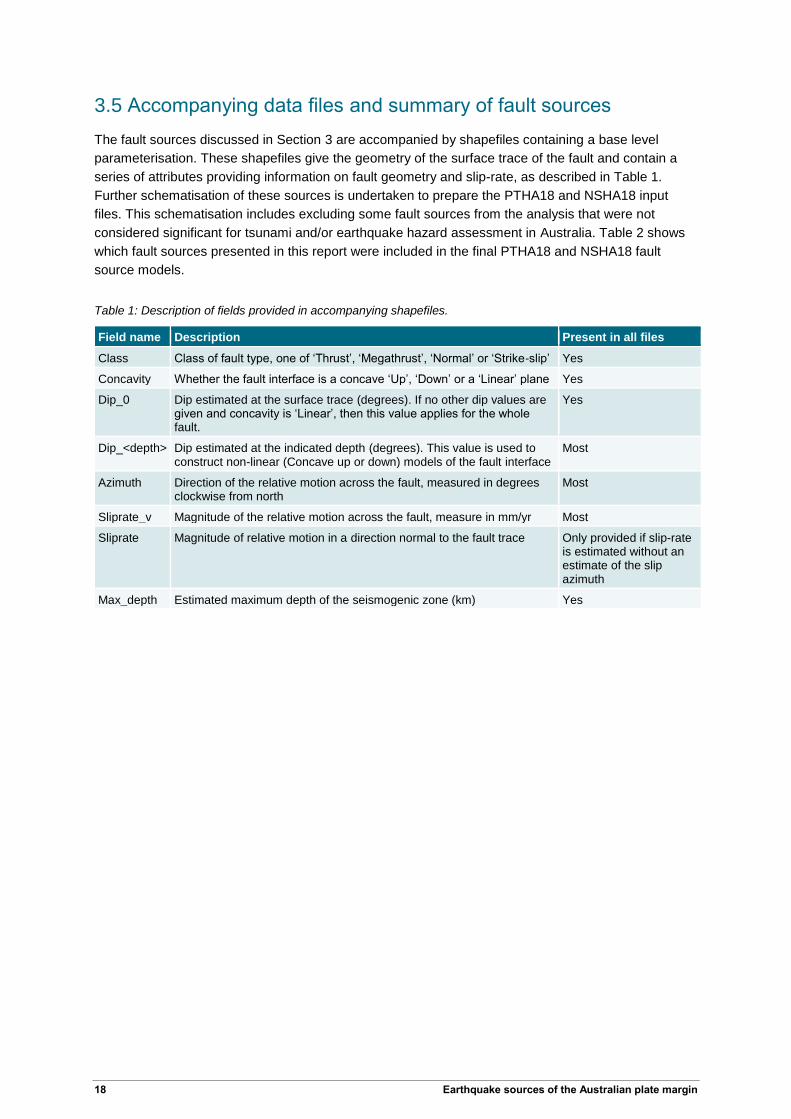
3.5 Accompanying data files and summary of fault sources
The fault sources discussed in Section 3 are accompanied by shapefiles containing a base level
parameterisation. These shapefiles give the geometry of the surface trace of the fault and contain a
series of attributes providing information on fault geometry and slip-rate, as described in Table 1.
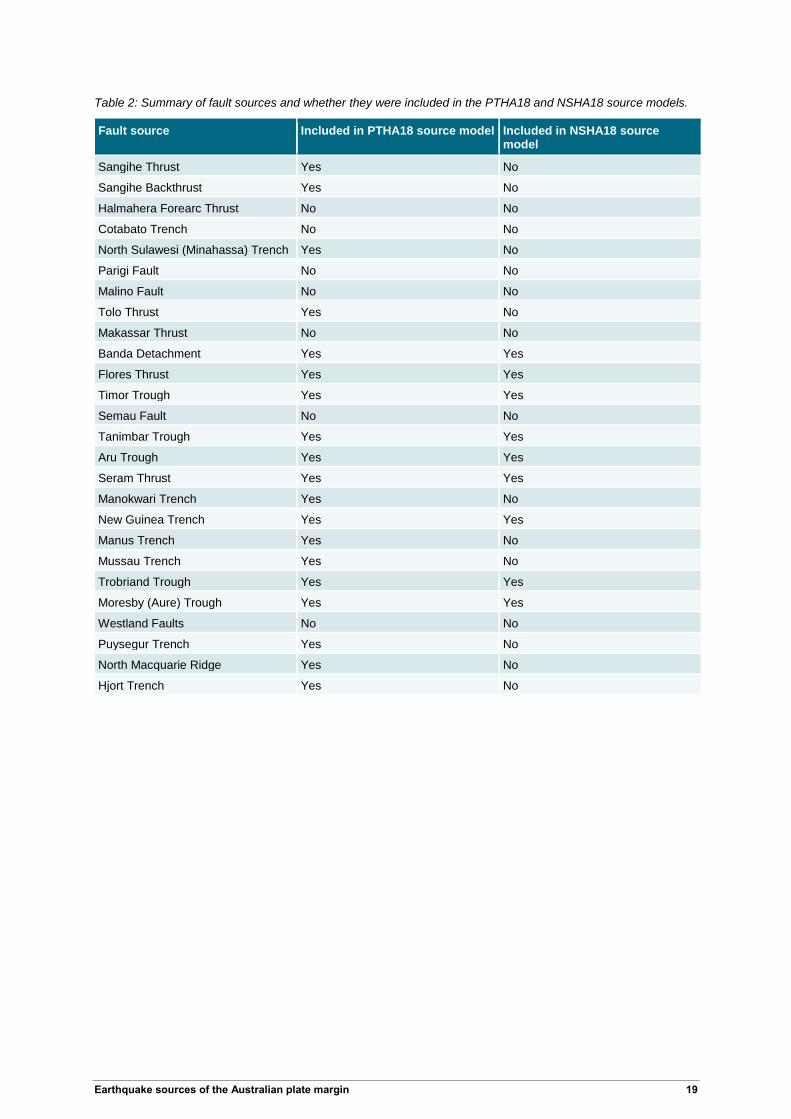
Further schematisation of these sources is undertaken to prepare the PTHA18 and NSHA18 input
files. This schematisation includes excluding some fault sources from the analysis that were not
considered significant for tsunami and/or earthquake hazard assessment in Australia. Table 2 shows
which fault sources presented in this report were included in the final PTHA18 and NSHA18 fault
source models.
Table 1: Description of fields provided in accompanying shapefiles.
Field name Description Present in all files
Class Class of fault type, one of ‘Thrust’, ‘Megathrust’, ‘Normal’ or ‘Strike-slip’ Yes
Concavity Whether the fault interface is a concave ‘Up’, ‘Down’ or a ‘Linear’ plane Yes
Dip_0 Dip estimated at the surface trace (degrees). If no other dip values are given and concavity is ‘Linear’, then this value applies for the whole fault.
Yes
Dip_<depth> Dip estimated at the indicated depth (degrees). This value is used to construct non-linear (Concave up or down) models of the fault interface
Most
Azimuth Direction of the relative motion across the fault, measured in degrees clockwise from north
Most
Sliprate_v Magnitude of the relative motion across the fault, measure in mm/yr Most
Sliprate Magnitude of relative motion in a direction normal to the fault trace Only provided if slip-rate is estimated without an estimate of the slip azimuth
Max_depth Estimated maximum depth of the seismogenic zone (km) Yes
Earthquake sources of the Australian plate margin 19
Table 2: Summary of fault sources and whether they were included in the PTHA18 and NSHA18 source models.
Fault source Included in PTHA18 source model Included in NSHA18 source model
Sangihe Thrust Yes No
Sangihe Backthrust Yes No
Halmahera Forearc Thrust No No
Cotabato Trench No No
North Sulawesi (Minahassa) Trench Yes No
Parigi Fault No No
Malino Fault No No
Tolo Thrust Yes No
Makassar Thrust No No
Banda Detachment Yes Yes
Flores Thrust Yes Yes
Timor Trough Yes Yes
Semau Fault No No
Tanimbar Trough Yes Yes
Aru Trough Yes Yes
Seram Thrust Yes Yes
Manokwari Trench Yes No
New Guinea Trench Yes Yes
Manus Trench Yes No
Mussau Trench Yes No
Trobriand Trough Yes Yes
Moresby (Aure) Trough Yes Yes
Westland Faults No No
Puysegur Trench Yes No
North Macquarie Ridge Yes No
Hjort Trench Yes No
20 Earthquake sources of the Australian plate margin
4 Plate boundary and continental margin seismic source characterisation for NSHA18
Earthquakes to the north of Australia in the eastern Indonesia and Papua New Guinea regions have
the potential to generate significant shaking in northern Australia. This has particular significance for
Darwin, with several large earthquakes several hundred kilometres away in the Banda Sea having
caused minor ground shaking related damage in Darwin over the historical period (Hearn & Webb,
1984; McCue, 2013). For plate boundary sources, the expert elicitation panel for NSHA18
recommended ground motions be considered for source to site distances of up to 800 km (Griffin et
al., 2018). In this section active tectonic earthquake models within 800 km of onshore Australian
territory are considered, excluding remote territories such as Christmas and Macquarie Islands, which
will be treated in subsequent studies.
Major submarine fault systems are modelled using fault source models. Geometries and earthquake
magnitude-frequency distributions are the same as those used for PTHA18. To ensure complete
spatial coverage, area source models are defined for regions not covered by the major fault sources.
Shallow area source zones are adapted and simplified from the 2017 Indonesian national seismic
hazard assessment’s source model for eastern Indonesia (Irsyam et al. 2017; Section 4.1); seismic
source models for PNG are taken from Ghasemi et al.'s (2016) national seismic hazard assessment
for PNG with minor modifications (Section 4.2); and deep sources for intraslab earthquakes are
schematized (Section 4.3).
For NSHA18, a panel of experts was used to define various uncertain model parameters through a
structured expert elicitation process (Griffin et al., 2018). This panel recommended ground motions be
calculated for source to site distances of up to 400 km for cratonic, non-cratonic and extended tectonic
region types. The seismic source model for NSHA18 is composed of a number of different seismic
source models for continental Australia, each with slightly different spatial extents, many of which do
not extend their source zonation to a distance of 400 km offshore. Therefore sources for the Australian
extended and oceanic margins are added (Section 4.4), and then individually stitched to each
Australian seismic source model used in NSHA18 to ensure each model had complete coverage
without any overlaps. Similarly, plate boundary sources to the north of Australia also need to be
stitched to each source model. This stitching process is described in Section 4.5.
While this section describes the geometry of the seismic source models, the earthquake catalogue
and methodology used to calculate recurrence statistics is described in the NSHA18 final report (Allen
et al., 2018). Full parameterisation of the sources can be found in the NSHA18 Github repository for:
1. Area source models for plate boundary regions
https://github.com/GeoscienceAustralia/NSHA2018/tree/master/source_models/zones/2018_
mw/Java_Banda_PNG/shapefiles;
2. Fault source models for plate boundary regions
https://github.com/GeoscienceAustralia/NSHA2018/tree/master/source_models/banda; and
3. Area source models for continental margin and oceanic regions, stitched to the neotectonic
domains model (for example)
https://github.com/GeoscienceAustralia/NSHA2018/tree/master/source_models/zones/2018_
mw/Domains_multi_mc/shapefiles.

Earthquake sources of the Australian plate margin 21
4.1 Indonesian shallow crustal sources
Shallow crustal area source zones for the Indonesian region are adapted and simplified from the
Indonesian PSHA (Irsyam et al., 2017), with some guidance taken from Badan Geologi’s models for
Papua and West Papua (Omang et al., 2011; Sulaeman & Cipta, 2012). The Indonesian PSHA has a
detailed fault source model that includes 250 individual fault segments; given the large source to site
distances for Australian hazard, it is not considered necessary to implement this model at this level of
detail. Instead, source zones are drawn encompassing the main fault zones defined by Irsyam et al.
2017, with guidance taken from the source zonation in Badan Geologi’s Papua and West Papua
models (Omang et al., 2011; Sulaeman & Cipta, 2012). Maximum magnitude and fault geometry
parameters for the zone are, in general, taken from Irsyam et al.’s (2017) parameterisation of the
largest crustal fault contained in the zone, along with some reference to GCMT focal mechanisms.
Shallow crustal area sources, and included fault sources, are shown in Figure 4. All values of
maximum magnitude referred to below are expressed in terms of moment magnitude, MW.
4.1.1 Tarera-Aiduna Fault System
The Tarera-Aiduna Fault System (TAFS) accommodates a significant component of the oblique
motion between the Australian and Pacific Plates, linking the Wapengo Fault System, Aru Trough and
Seram Thrust. A maximum magnitude of 7.8 is taken from the fault source in the Indonesian PSHA,
which extends across the majority of the source zone. Following the Indonesian PSHA, the motion is
strike-slip and our simplified model has a strike of 78°.
4.1.2 Wapoga
The strike-slip Wapoga Fault dominates this source zone. It has an average strike of 42° and a
maximum magnitude of 7.9 is taken from the Indonesia PSHA.
4.1.3 Wandamen-Ransiki Fault Zone
This Wandamen-Ransiki Fault Zone (WRFZ) envelops both the Wandamen and Ransiki Faults; in the
Indonesian PSHA fault source model there are a number of strands to the Wandaman Fault. The
largest maximum magnitude is 7.2 for the Ransiki Fault. We model this zone as vertical strike-slip
faulting along a strike of 160°; this is more consistent with the Ransiki fault, and we note that normal
faulting occurs within the Wandaman Fault Zone.
4.1.4 Lengguru
The maximum magnitude of this zone is 7.0 based on the largest contained fault in the Indonesian
PSHA (Wandamen-Kaimana). We model this zone as normal faulting based on this fault and nearby
GCMT mechanisms, although thrust and strike-slip faults also occur in this zone. The zone is
extended to form the NW boundary of the source model.
4.1.5 Cendrawasih
This zone contains the Cendrawasih Thrust, with parameters taken from this fault. This zone has a
maximum magnitude of 7.6, and earthquakes are modelled as thrust events with a strike of 50° and
dip of 40°.
22 Earthquake sources of the Australian plate margin
4.1.6 Waropen
The Indonesian PSHA does not contain any mapped faults within this zone. For the purposes of
NSHA18, we assume a maximum magnitude of 7.8 and model thrust faults striking at 97°, parallel to
range fronts. We consider it most likely that strike-slip faulting occurs in the north of the zone.
4.1.7 Nusa Tenggara Shallow
A number of crustal faults are mapped within this source, which is bounded by the Flores-Wetar Thrust
to the north and the Sunda Arc and Timor Trough to the south. The largest fault intersecting the zone
is the strike-slip Semau Fault, from which representative parameters are taken with a maximum
magnitude of 8.0 and strike of 10°.
4.1.8 Banda Sea
This zone encompasses the exposed footwall of the Banda Detachment. Although the main Banda
Detachment is modelled as a fault source, it is assumed that normal faulting earthquakes could also
occur within the footwall crust, and therefore we model this zone with normal faults dipping to west
and striking 225°. A maximum magnitude of 8.0 is assumed.
4.1.9 West Banda Sea
This zone encompasses a broad region of the Banda Sea west of the Banda Detachment. The only
mapped fault is the South Buru Fault, which is modelled as a thrust fault in the Indonesian PSHA.
Focal mechanisms in the north (near Seram) and south (near Wetar Thrust) also show thrust faulting
mechanisms, however in this tectonically complicated and poorly understand region all mechanisms
could be possible. We assume a maximum magnitude of 8.0 and model thrust faults with strike 90°
and dip 30°.
4.1.10 Tanimbar
For this source zone we model thrust faults striking 225° with a maximum magnitude of 8.0, based on
the Tanimbar Thrust fault source in the Indonesian PSHA. As discussed above, these faults may more
likely be thrust faults re-activated as normal faults; however for the purposes of modelling far-field
ground motions for PSHA, the sense of faulting is not significant.
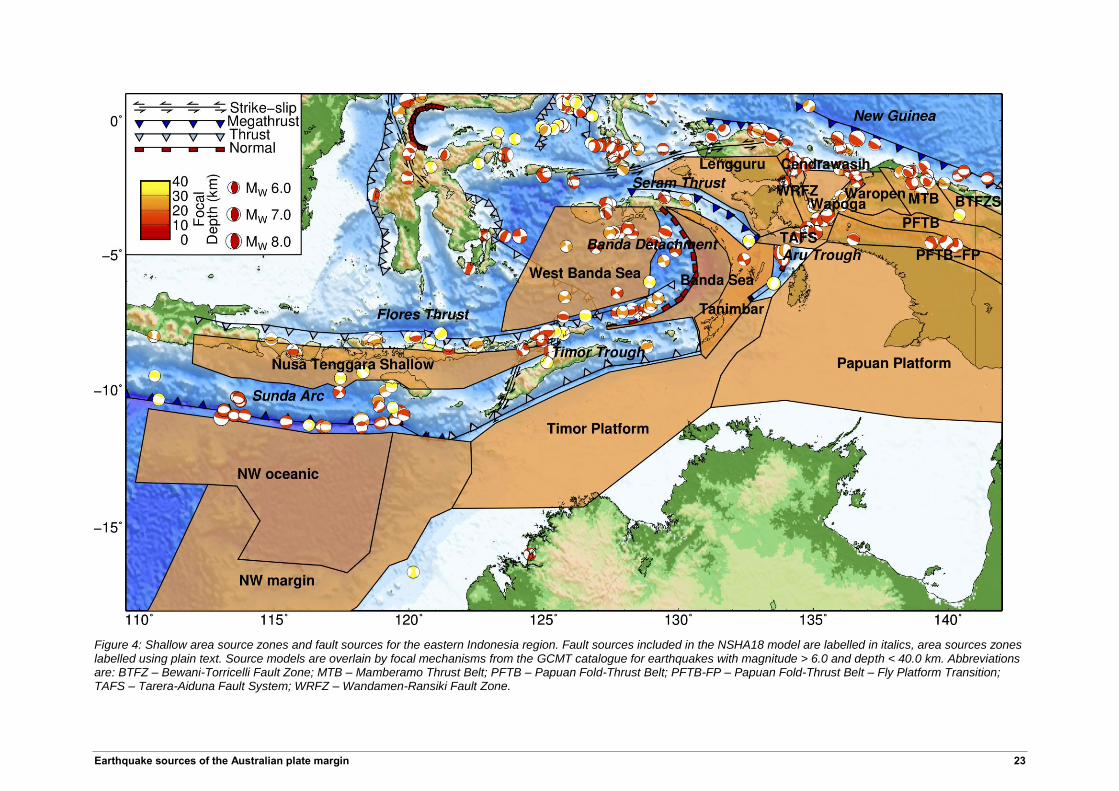
Earthquake sources of the Australian plate margin 23
Figure 4: Shallow area source zones and fault sources for the eastern Indonesia region. Fault sources included in the NSHA18 model are labelled in italics, area sources zones labelled using plain text. Source models are overlain by focal mechanisms from the GCMT catalogue for earthquakes with magnitude > 6.0 and depth < 40.0 km. Abbreviations are: BTFZ – Bewani-Torricelli Fault Zone; MTB – Mamberamo Thrust Belt; PFTB – Papuan Fold-Thrust Belt; PFTB-FP – Papuan Fold-Thrust Belt – Fly Platform Transition; TAFS – Tarera-Aiduna Fault System; WRFZ – Wandamen-Ransiki Fault Zone.

24 Earthquake sources of the Australian plate margin
4.2 PNG shallow crustal sources
Source zones for PNG, and some surrounding regions including parts of the Indonesian province of
Papua, are taken directly from the PNG national seismic hazard assessment developed by Ghasemi
et al. (2016). Minor adjustments to source zone boundaries are made in order to stitch with sources in
Indonesian Papua, and to allow inclusion of the Moresby Trough as a fault source model. Note that
unlike the other major submarine faults, we model the New Britain Trench as an area source, rather
than a fault source model taken from PTHA18. This is because there are significant changes in
geometry and sliprate along this fault as included in PTHA18 (Figure 2), which are not easily modelled
with OpenQuake software (Pagani et al., 2014). Furthermore, we only require one segment of the
structure for NSHA18, as the remainder is beyond the maximum cut-off distance for calculating ground
motions.
Figure 5: Shallow area source zones and fault sources for the Papua New Guinea region. Fault sources included in the NSHA18 model are labelled in italics, area sources zones labelled using plain text. Source models are overlain by focal mechanisms from the GCMT catalogue for earthquakes with magnitude > 6.0 and depth < 40.0 km. Abbreviations are: BSSL – Bismarck Sea Seismic Lineament; BTFZ – Bewani-Torricelli Fault Zone; MTB – Mamberamo Thrust Belt; PFTB – Papuan Fold-Thrust Belt; PFTB-FP – Papuan Fold-Thrust Belt – Fly Platform Transition.
Earthquake sources of the Australian plate margin 25
4.3 Intraslab sources
Earthquakes occurring within subducted oceanic slabs related to the Sunda-Banda Arc and the North
Papua Subduction Zone are significant for seismic hazard in Australia. In particular, ground motions
generated by earthquakes within the eastern Banda Arc slab propagate efficiently through the crust to
northern Australia (Fishwick et al. 2005; Kennett & Abdullah, 2011; Wei et al. 2017), and have
historically caused damage (McCue, 2013).
4.3.1 Indonesia
The Sunda-Banda Slab curves in an arc formed by subduction rollback of the Banda Arc into an
embayment of the Australian continent that began ~15 Ma (Spakman & Hall, 2010; Pownall et al.,
2016). Tight folding of the slab may be related to localised high rates of intermediate depth seismicity
(Spakman & Hall, 2010), most pronounced to the north-east of Timor.
The geometry of the subducted slab was approximated by area source zones stepped in 100 km
depth increments from 40 – 600 km depth. Definition of these zones was based on contours from the
Slab 1.0 model (Hayes et al. 2012; only available for the Sunda Arc) and earthquake focal depths from
the GCMT and ISC-GEM catalogues. For the shallower intraslab sources (40 – 400 km depth) the
subducted Banda Slab is split spatially into Nusa Tenggara, Banda, Timor and Seram zones. Some of
these zones did not have a sufficient number of earthquakes to robustly calculate recurrence statistics.
Therefore earthquakes from all intraslab zones from 40 – 400 km depth were aggregated for
calculation of recurrence statistics, with the exception of the Banda zones as these zones have a
higher seismicity rate. Area-normalised recurrence rates were then applied to each individual zone, as
described in more detail in Allen et al. (2018). Seismicity rates decrease further at depths greater than
400 km, and therefore we model two deeper zones (400-500 and 500-600 km) for the entire Banda
Sea region. Recurrence statistics are calculated from aggregated seismicity from these two zones,
with area-normalised rates again applied to each zone.
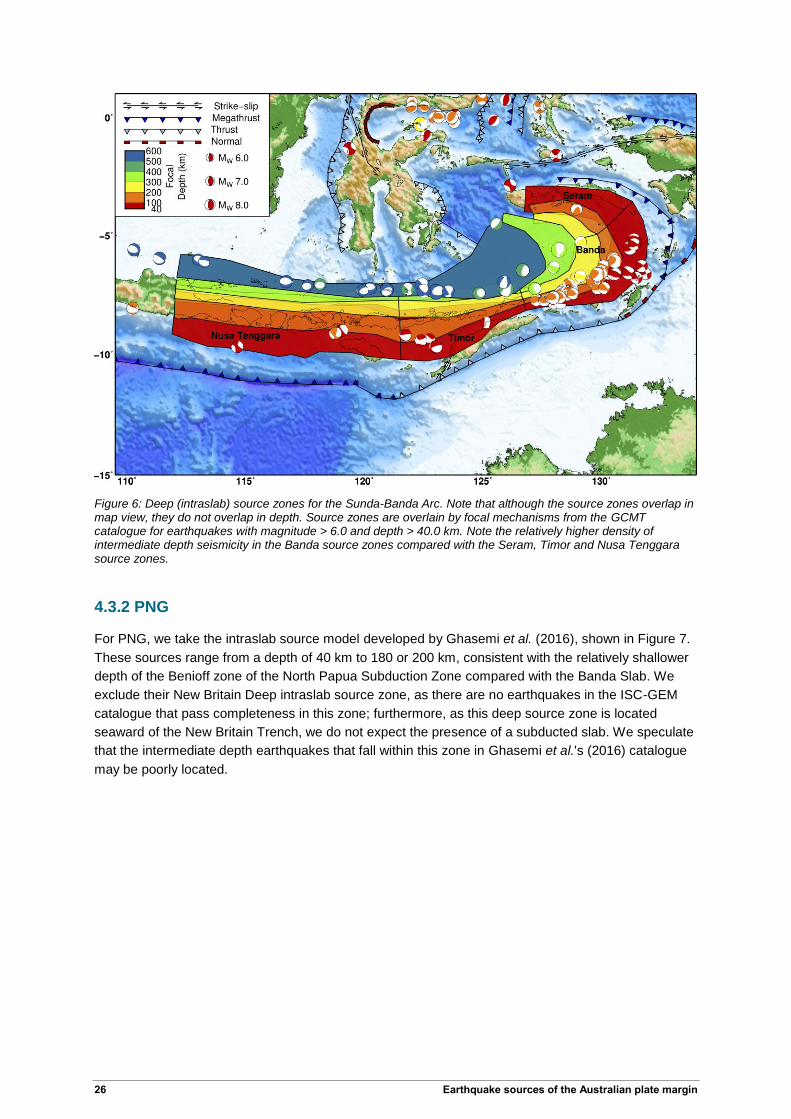
26 Earthquake sources of the Australian plate margin
Figure 6: Deep (intraslab) source zones for the Sunda-Banda Arc. Note that although the source zones overlap in map view, they do not overlap in depth. Source zones are overlain by focal mechanisms from the GCMT catalogue for earthquakes with magnitude > 6.0 and depth > 40.0 km. Note the relatively higher density of intermediate depth seismicity in the Banda source zones compared with the Seram, Timor and Nusa Tenggara source zones.
4.3.2 PNG
For PNG, we take the intraslab source model developed by Ghasemi et al. (2016), shown in Figure 7.
These sources range from a depth of 40 km to 180 or 200 km, consistent with the relatively shallower
depth of the Benioff zone of the North Papua Subduction Zone compared with the Banda Slab. We
exclude their New Britain Deep intraslab source zone, as there are no earthquakes in the ISC-GEM
catalogue that pass completeness in this zone; furthermore, as this deep source zone is located
seaward of the New Britain Trench, we do not expect the presence of a subducted slab. We speculate
that the intermediate depth earthquakes that fall within this zone in Ghasemi et al.'s (2016) catalogue
may be poorly located.
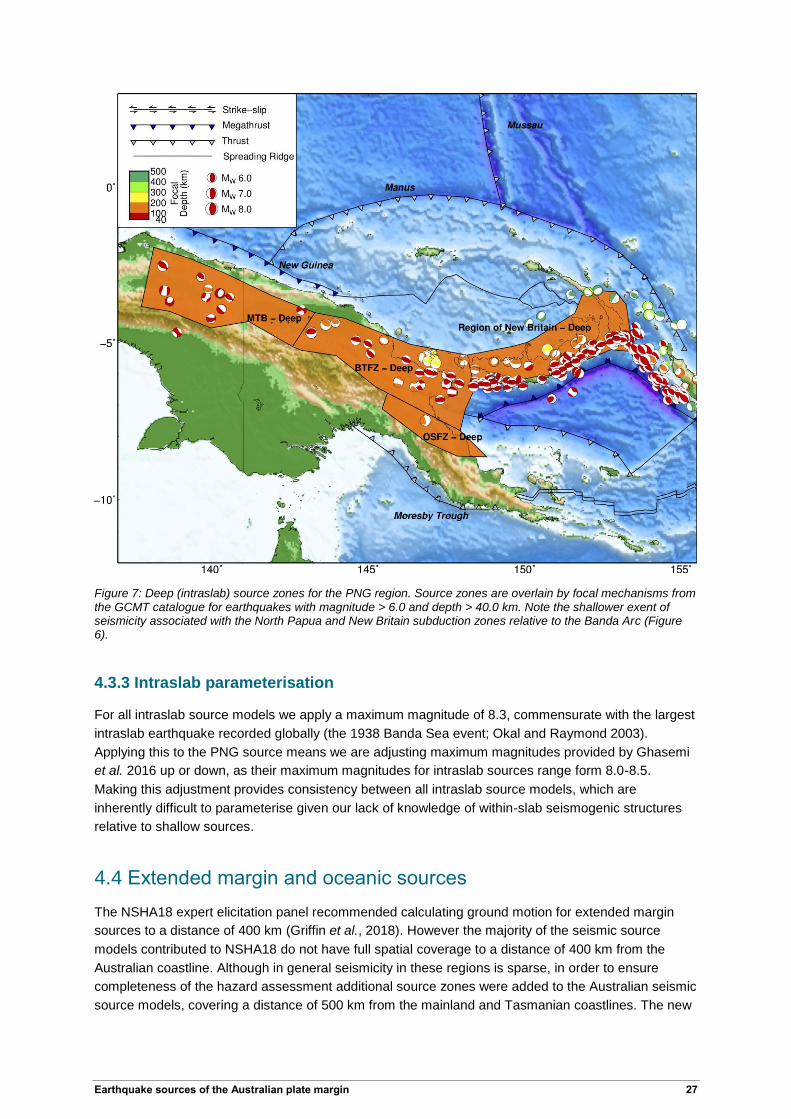
Earthquake sources of the Australian plate margin 27
Figure 7: Deep (intraslab) source zones for the PNG region. Source zones are overlain by focal mechanisms from the GCMT catalogue for earthquakes with magnitude > 6.0 and depth > 40.0 km. Note the shallower exent of seismicity associated with the North Papua and New Britain subduction zones relative to the Banda Arc (Figure 6).
4.3.3 Intraslab parameterisation
For all intraslab source models we apply a maximum magnitude of 8.3, commensurate with the largest
intraslab earthquake recorded globally (the 1938 Banda Sea event; Okal and Raymond 2003).
Applying this to the PNG source means we are adjusting maximum magnitudes provided by Ghasemi
et al. 2016 up or down, as their maximum magnitudes for intraslab sources range form 8.0-8.5.
Making this adjustment provides consistency between all intraslab source models, which are
inherently difficult to parameterise given our lack of knowledge of within-slab seismogenic structures
relative to shallow sources.
4.4 Extended margin and oceanic sources
The NSHA18 expert elicitation panel recommended calculating ground motion for extended margin
sources to a distance of 400 km (Griffin et al., 2018). However the majority of the seismic source
models contributed to NSHA18 do not have full spatial coverage to a distance of 400 km from the
Australian coastline. Although in general seismicity in these regions is sparse, in order to ensure
completeness of the hazard assessment additional source zones were added to the Australian seismic
source models, covering a distance of 500 km from the mainland and Tasmanian coastlines. The new

28 Earthquake sources of the Australian plate margin
source zones were based on fundamental tectonic region types (extended crust, oceanic crust)
sourced from the Neotectonic Domains Model (Clark et al., 2012), and the Australian Geological
Provinces Database (Raymond, 2018) for regions extending beyond the extent of the Domains model.
Figure 8 shows the additional offshore soures as integrated with the neotectonic domains source
model. As some of these zones contained an insufficient number of earthquakes to calculate
recurrence statistics robustly, earthquakes from neighbouring source zones were aggregated for the
purpose of calculating recurrence statistics, in some cases mixing extended and oceanic tectonic
region types.
Figure 8: Source zonation for the modified neotectonic domains model, showing the addition of continental margin and oceanic sources (coloured in shades of blue). The northernmost source models are extended to meet the plate boundary sources, ensuring complete coverage. Abbreviations are: MLFR – Mount Lofty and Flinders Ranges; OGS Basins – Otway, Gippsland and Sorel Basins.
4.5 Stitching of plate boundary model to Australian source models
The source model for regions north of Australia was merged with the source models for Australia to
form multiple stitched models. The Australian models were given precedence where spatial overlap
between the two source models was present. Changes to the source zones for regions north of

Earthquake sources of the Australian plate margin 29
Australia as a result of clipping overlapping areas occasionally created source zones that were too
small to robustly calculate recurrence statistics. In these cases, these source zones were merged into
the neighbouring source zones from the Australian models.
30 Earthquake sources of the Australian plate margin
5 Summary
This report outlines the rationale and evidence supporting the revision of earthquake source models
for plate boundary regions to the north and east of Australia to underpin the 2018 Australian PTHA
and NSHA, and to support tsunami hazard assessment in Indonesia. The new model draws on recent
literature that improves our understanding of the active tectonics of the region and includes a number
of fault sources not considered in previous PTHA. The new model includes non-subduction tectonic
sources with the potential to generate tsunami and/or ground shaking hazard impacting Australia that
were not fully considered in previous hazard assessments, including the Banda Detachment, Aru
Trough, Moresby Trough and Macquarie Ridge. For the first time, outer-rise source models for all
major subduction zones are also considered in a systematic manner.
For seismic hazard assessment, area source models are developed for active tectonic regions based
on simplifications of recent updates to national seismic hazard assessments for Indonesia (Irsyam et
al., 2017) and PNG (Ghasemi et al., 2016). Area source models are also developed for continental
and oceanic margins of the Australian continent, and a model with complete and non-overlapping
coverage developed.
The tectonic complexity of the region means we can expect the interpretations presented herein to
change as future studies are undertaken. Therefore future tsunami and earthquake hazard
assessments undertaken for the region should consider revision of the earthquake sources models
presented in this study.
Earthquake sources of the Australian plate margin 31
6 Acknowledgements
The authors are grateful to Masyhur Irsyam for sharing the earthquake source model for the 2017
Indonesian PSHA. The authors thank Matthew Gale for GIS assistance preparing the Australian
continental and oceanic margin sources and stitching them to the continental and active region
models. Discussions with Ignatius Ryan Pranantyo and Phil Cummins assisted interpretation of source
models in eastern Indonesia. Hadi Ghasemi assisted with interpretation of the 2014 PNG seismic
hazard assessment. Trevor Allen and Dan Clark provided advice on development of continental
margin and intraslab sources. Trevor Allen, Phil Cummins, Jane Sexton and Leesa Carson provided
helpful reviews of the final report.
32 Earthquake sources of the Australian plate margin
7 References
Abers, G. A., Z. Eilon, J. B. Gaherty, G. Jin, Y. Kim, M. Obrebski and C. Dieck (2016). Southeast
Papuan crustal tectonics: Imaging extension and buoyancy of an active rift, J. Geophys. Res. Solid
Earth, 121, no. 2, 951–971.
Advokaat, E. L., R. Hall, L. T. White, I. M. Watkinson, A. Rudyawan and M. K. BouDagher-Fadel
(2017). Miocene to recent extension in NW Sulawesi, Indonesia, J. Asian Earth Sci., 147, no.
February, 378–401.
Allen, T., J. Griffin, M. Leonard, D. Clark, and H. Ghasemi (2018). The 2018 National Seismic Hazard
Assessment for Australia: model overview, Geoscience Australia Record 2018/27, Canberra, doi:
10.11636/Record.2018.027.
Baillie, P. and C. Milne (2014). New Insights Into Prospectivity and Tectonic Evolution of the Banda
Arc: Evidence from Broadband Seismic Data, in Proceedings, Indonesian Petroleum Association
Thirty-Eighth Annual Convention & Exhibition, May 2014, Indonesian Petroleum Association.
Beckers, J. and T. Lay (1995). Very broadband seismic analysis of the 1992 Flores, Indonesia,
earthquake (Mw = 7.9), J. Geophys. Res. Solid Earth, 100, no. B9, 18179–18193.
Berryman, K., L. Wallace, G. Hayes, P. Bird, K. Wang, R. Basili, T. Lay, R. S. Stein, T. Sagiya, a. M.
Rubin, S. Barrientos, C. Kreemer, N. Litchfield, M. Pagani, K. Gledhill, K. Haller and C. Costa
(2015). The GEM Faulted Earth Subduction Characterisation Project (Version 2.0),.
Bird, P. (2003). An updated digital model of plate boundaries, Geochemistry, Geophys. Geosystems,
4, no. 3.
Bock, Y., L. Prawirodirdjo, J. F. Genrich, C. W. Stevens, R. McCaffrey, C. Subarya, S. S. O.
Puntodewo and E. Calais (2003). Crustal motion in Indonesia from Global Positioning System
measurements, J. Geophys. Res., 108, no. B8, 2367.
Breen, N. A., E. A. Silver and S. Roof (1989). The Wetar Back Arc Thrust Belt, eastern Indonesia: The
effect of accretion against an irregularly shaped arc, Tectonics, 8, no. 1, 85–98.
Burbidge, D., P. R. Cummins, R. Mleczko and H. K. Thio (2008)(a). A Probabilistic Tsunami Hazard
Assessment for Western Australia, in Tsunami Science Four Years after the 2004 Indian Ocean
Tsunami, Birkhäuser Basel, Basel, 2059–2088.
Burbidge, D., R. Mleczko, C. Thomas, P. Cummins, O. Nielsen and T. Dhu (2008)(b). A Probabilistic
Tsunami Hazard Assessment for Australia, Geoscience Australia Professional Opinion 2008/04.
Charlton, T. R., S. J. Kaye and H. Samodra (1991). Geology of the Kai Islands : implications for the
evolution of the Aru Trough and Weber Basin, Banda Arc, Indonesia, Mar. Pet. Geol., 8.
Christensen, D. H. and L. J. Ruff (1988). Seismic coupling and outer rise earthquakes, J. Geophys.
Res. Solid Earth, 93, no. B11, 13421–13444.
Cipta, A., R. Robiana, J. D. Griffin, N. Horspool, S. Hidayati and P. Cummins (2016). A probabilistic
seismic hazard assessment for Sulawesi, Indonesia, Geol. Soc. London, Spec. Publ., SP441.6.
Clark, D., A. McPherson and R. Van Dissen (2012). Long-term behaviour of Australian stable
continental region (SCR) faults, Tectonophysics, 566–567, 1–30.
Davies, G. and J. Griffin (2018). The 2018 Australian Probabilistic Tsunami Hazard Assessment:
Hazard from earthquake generated tsunamis, Geoscience Australia Record 2018/XX.
Davies, G., J. Griffin, F. Løvholt, S. Glimsdal, C. Harbitz, H. K. Thio, S. Lorito, R. Basili, J. Selva, E.
Geist and M. A. Baptista (2017). A global probabilistic tsunami hazard assessment from
earthquake sources, Geol. Soc. London, Spec. Publ., 456.
Ekström, G., M. Nettles and A. M. Dziewoński (2012). The global CMT project 2004–2010: Centroid-
moment tensors for 13,017 earthquakes, Phys. Earth Planet. Inter., 200–201, 1–9.
Fishwick, S., B. L. N. Kennett, and A. M. Reading (2005). Contrasts in lithospheric structure within the
Australian craton—insights from surface wave tomography, Earth Planet. Sci. Lett. 231, 163– 176,
doi: 10.1016/j.epsl.2005.01.009.

Earthquake sources of the Australian plate margin 33
Ghasemi, H., C. McKee, M. Leonard, P. Cummins, M. Moihoi, S. Spiro, F. Taranu and E. Buri (2016).
Probabilistic seismic hazard map of Papua New Guinea, Nat. Hazards, 81, no. 2, 1003–1025.
Goff, J. and C. Chague-Goff (2014). The Australian Tsunami Database: A review, Prog. Phys. Geogr.
Granath, J. W., J. M. Christ, P. A. Emmet and M. G. Dinkelman (2010). Insights Into the Tectonics of
Eastern Indonesia From Arafuraspan, a Long-Offset Long-Record 2D Seismic Reflection Dataset,
Proceedings of Indonesian Petroleum Association, Proceedings 34th annual convention.
Greenslade, D. J. M., M. A. Simanjuntak and S. C. R. Allen (2009). An Enhanced Tsunami Scenario
Database:T2, CAWCR Technical Report No. 014. Melbourne.
Griffin, J., M. Gerstenberger, T. Allen, D. Clark, R. Cuthbertson, V.-A. Dimas, G. Gibson, H. Ghasemi,
R. Hoult, N. Lam, M. Leonard, T. Mote, M. Quigley, P. Somerville, C. Sinadinovski, M. Stirling, and
S. Venkatesan (2018). Expert elicitation of model parameters for the 2018 National Seismic Hazard
Assessment: Summary of workshop, methodology and outcomes, Geoscience Australia Record
2018/28, Canberra, doi: 10.11636/Record.2018.028.
Griffin, J. D., I. R. Pranantyo, P. R. Cummins, G. Davies and H. Latief (2017). A revised model of
tsunami sources in eastern Indonesia and the role of extensional fault systems, in International
Tsunami Symposium, Bali.
Griffin, J.D., H. Latief, W. Kongko, S. Harig, N. Horspool, R. Hanung, A. Rojali, N. Maher, A. Fuchs, J.
Hossen and others (2015). An evaluation of onshore digital elevation models for modeling tsunami
inundation zones, Front. Earth Sci., 3.
Griffin, J.D., Nguyen, N., Cummins, P. and Cipta, A. (in review). Historical earthquakes of the eastern
Sunda Arc: Source mechanism and intensity-based testing of Indonesia's national seismic hazard
assessment. Submitted to Bull. Seismol. Soc. Am.
Gusman, A. R., Y. Tanioka, H. Matsumoto and S.-I. Iwasaki (2009). Analysis of the Tsunami
Generated by the Great 1977 Sumba Earthquake that Occurred in Indonesia, Bull. Seismol. Soc.
Am., 99, no. 4, 2169–2179.
Hall, R. (2011). Australia-SE Asia collision: plate tectonics and crustal flow, Geol. Soc. London, Spec.
Publ., 355, no. 1, 75–109.
Hall, R. (2018). The subduction initiation stage of the Wilson cycle, Geol. Soc. London, Spec. Publ.,
470, SP470.3.
Hall, R. and I. Sevastjanova (2012). Australian crust in Indonesia, Aust. J. Earth Sci., 59, no. 6, 827–
844.
Hall, R. and H. R. Smyth (2008). Cenozoic arc processes in Indonesia: Identification of the key
influences on the stratigraphic record in active volcanic arcs, in Special Paper 436: Formation and
Applications of the Sedimentary Record in Arc Collision Zones, Geological Society of America, 27–
54.
Hamling, I. J., S. Hreinsdóttir, K. Clark, J. Elliott, C. Liang, E. Fielding, N. Litchfield, P. Villamor, L.
Wallace, T. J. Wright, E. D’Anastasio, S. Bannister, D. Burbidge, P. Denys, P. Gentle, J. Howarth,
C. Mueller, N. Palmer, C. Pearson, W. Power, P. Barnes, D. J. A. Barrell, R. Van Dissen, R.
Langridge, T. Little, A. Nicol, J. Pettinga, J. Rowland and M. Stirling (2017). Complex multifault
rupture during the 2016 M w 7.8 Kaikōura earthquake, New Zealand, Science (80).
Hayes, G. P. and K. P. Furlong (2010). Quantifying potential tsunami hazard in the Puysegur
subduction zone, south of New Zealand, Geophys. J. Int., 183, no. 3, 1512–1524.
Hayes, G. P., K. P. Furlong and C. J. Ammon (2009). Intraplate deformation adjacent to the Macquarie
Ridge south of New Zealand—The tectonic evolution of a complex plate boundary,
Tectonophysics, 463, no. 1, 1–14.
Hayes, G. P., G. L. Moore, D. E. Portner, M. Hearne, H. Flamme, M. Furtney and G. M. Smoczyk
(2018). Slab2, a comprehensive subduction zone geometry model., Science
10.1126/science.aat4723.
Hayes, G. P., D. J. Wald and R. L. Johnson (2012). Slab1.0: A three-dimensional model of global
subduction zone geometries, J. Geophys. Res. Solid Earth, 117, no. 1, 1–15.
Hearn, S. J. and J. P. Webb (1984). Continental-scale felt effects of the large Banda Sea earthquake
of 4 November 1963, Bull. Seismol. Soc. Am., 74, no. 1, 349–351.
34 Earthquake sources of the Australian plate margin
Hidayat, D., J. S. Barker and K. Satake (1995). Modeling the Seismic Source and Tsunami Generation
of the December 12, 1992 Flores Island, Indonesia, Earthquake, in Tsunamis: 1992–1994,
Birkhäuser Basel, Basel, 537–554.
Horspool, N., I. Pranantyo, J. Griffin, H. Latief, D. H. Natawidjaja, W. Kongko, A. Cipta, B. Bustaman,
S. D. Anugrah and H. K. Thio (2014). A probabilistic tsunami hazard assessment for Indonesia,
Nat. Hazards Earth Syst. Sci., 14, no. 11, 3105–3122.
Hughes, B. D., K. Baxter, R. A. Clark and D. B. Snyder (1996). Detailed processing of seismic
reflection data from the frontal part of the Timor trough accretionary wedge, eastern Indonesia,
Geol. Soc. London, Spec. Publ., 106, no. 1, 75–83.
Imamura, F., E. Gica, T. Takahashi and N. Shuto (1995). Numerical Simulation of the 1992 Flores
Tsunami: Interpretation of Tsunami Phenomena in Northeastern Flores Island and Damage at Babi
Island, in Tsunamis: 1992–1994, Birkhäuser Basel, Basel, 555–568.
Irsyam, M., M. Asrurifak, M. Ridwan, F. Aldiamar, I. Wayan Sengara, S. Widiyantoro, W. Triyoso, D.
Hilman, E. Kertapati, I. Meilano, Suhardjono, Hendriyawan, P. T. Simatupang, I. Muhammad, D.
Murjanto and M. Hasan (2013). Development of Map of Maximum Considered Earthquake
Geometric Mean ( MCE G ) PGA for Earthquake Resistance Building Design in Indonesia, in
Proceedings of the 18th International Conference on Soil Mechanics and Geotechnical
Engineering, Paris 2013, Paris, 1495–1498.
Irsyam, M., W. Sengara, F. Aldiamar, S. Widiyantoro, W. Triyoso, D. Hilman, E. Kertapati, I. Meilano,
Suhardjono, M. Asrurifak and M. Ridwan (2010). Development of seismic hazard maps of
Indonesia for revision of seismic hazard map in SNI 03-1726-2002, reseach report submited to the
Ministry of Public Works by Team for Revision of Seismic Hazard Maps of Indonesia.
Irsyam, M., S. Widiyantoro, D. Natawidjaja, I. Meilano, A. Rudyanto, S. Hidayati, W. Triyoso, N.
Hanifa, D. Djarwadi, L. Faizal and S. Sunarjito (2017). Peta Sumber & Bahaya Gempa Indonesia
tahun 2017 [Maps of Earthquake Sources and Hazard, Indonesia], Bandung.
Jacobson, R. S., G. G. J. Shor, R. M. Kieckhefer and G. M. Purdy (1979). Seismic Refraction and
Reflection Studies in the Timor-Aru Trough System and Australian Continental Shelf: Convergent
Margins, in Geological and Geophysical Investigations of Continental Margins, AAPG Special
Volumes Memoir 29, 209–222.
Jongsma, D., W. Huson, J. M. Woodside, S. Suparka, T. Sumantri and A. J. Barber (1989).
Bathymetry and geophysics of the Snellius-II triple junction and tentative seismic stratigraphy and
neotectonics of the northern Aru Trough, Netherlands J. Sea Res., 24, no. 2–3, 231–250.
Kanamori, H. (1971). Seismological evidence for a lithospheric normal faulting — the Sanriku
earthquake of 1933, Phys. Earth Planet. Inter., 4, no. 4, 289–300.
Kennett, B. L. N., and A. Abdullah (2011). Seismic wave attenuation beneath the Australasian region,
Aust. J. Earth. Sci. 58, 285–295, DOI: 10.1080/08120099.2011.550318.
Kopp, H., E. Flueh, C. Petersen, W. Weinrebe, A. Wittwer and Meramex Scientists (2006). The Java
margin revisited: Evidence for subduction erosion off Java, Earth Planet. Sci. Lett., 242, no. 1–2,
130–142.
Koulali, A., S. Susilo, S. McClusky, I. Meilano, P. Cummins, P. Tregoning, G. Lister, J. Efendi and M.
A. Syafi’i (2016). Crustal strain partitioning and the associated earthquake hazard in the eastern
Sunda-Banda Arc, Geophys. Res. Lett., 43, no. 5, 1943–1949.
Koulali, A., P. Tregoning, S. McClusky, R. Stanaway, L. Wallace and G. Lister (2015). New Insights
into the present-day kinematics of the central and western Papua New Guinea from GPS,
Geophys. J. Int., 202, no. 2, 993–1004.
Kreemer, C., G. Blewitt and E. C. Klein (2014). A geodetic plate motion and Global Strain Rate Model,
Geochemistry, Geophys. Geosystems, 15, no. 10, 3849–3889.
Lallemand, S. E., M. Popoff, J.-P. Cadet, A.-G. Bader, M. Pubellier, C. Rangin and B. Deffontaines
(1998). Genetic relations between the central and southern Philippine Trench and the Sangihe
Trench, J. Geophys. Res. Solid Earth, 103, no. B1, 933–950.
Latief, H., N. T. Puspito and F. Imamura (2000). Tsunami catalog and zones in Indonesia, J. Nat.
Disaster Sci., 22, no. 1, 25–43.
Lay, T., C. J. Ammon, H. Kanamori, L. Rivera, K. D. Koper and A. R. Hutko (2010). The 2009 Samoa-
Tonga great earthquake triggered doublet, Nature, 466, no. 7309, 964–968.

Earthquake sources of the Australian plate margin 35
Lay, T., H. Kanamori, C. J. Ammon, A. R. Hutko, K. Furlong and L. Rivera (2009). The 2006–2007
Kuril Islands great earthquake sequence, J. Geophys. Res., 114, no. B11, B11308.
Lebrun, J.-F., G. Lamarche and J.-Y. Collot (2003). Subduction initiation at a strike-slip plate
boundary: The Cenozoic Pacific-Australian plate boundary, south of New Zealand, J. Geophys.
Res. Solid Earth, 108, no. B9.
Liu, Z. Y. C. and R. a. Harris (2014). Discovery of possible mega-thrust earthquake along the Seram
Trough from records of 1629 tsunami in eastern Indonesian region, Nat. Hazards, 72, no. 3, 1311–
1328.
Lock, J., H. L. Davies, D. L. Tiffin, F. Murakami and K. Kisimoto (1987). The Trobriand Subduction
System in the Western Solomon Sea, Geo-Marine Lett., 7, no. 3, 129–134.
Lynnes, C. S. and T. Lay (1988). Source Process of the Great 1977 Sumba Earthquake, J. Geophys.
Res. Solid Earth, 93, no. B11, 13407–13420.
Malservisi, R., K. P. Furlong and H. Anderson (2003). Dynamic uplift in a transpressional regime:
numerical model of the subduction area of Fiordland, New Zealand, Earth Planet. Sci. Lett., 206,
no. 3, 349–364.
Massell, C., M. F. Coffin, P. Mann, S. Mosher, C. Frohlich, C. S. Duncan, G. Karner, D. Ramsay and
J.-F. Lebrun (2000). Neotectonics of the Macquarie Ridge Complex, Australia-Pacific plate
boundary, J. Geophys. Res. Solid Earth, 105, no. B6, 13457–13480.
Mccaffrey, R. (1996). Slip partitioning at convergent plate boundaries of SE Asia, in R Hall & D
Blundell (eds), Tectonic Evolution of Southeast Asia,3–18.
McCaffrey, R. (1982). Lithospheric deformation within the Molucca Sea arc-arc collision: Evidence
from shallow and intermediate earthquake activity, J. Geophys. Res., 87, no. B5, 3663.
McCue, K. (2008). Short-term increase in earthquake risk at Macquarie Island, in Proceedings of the
Australian Earthquake Engineering Society 2008 Conference.
McCue, K. (2013). Historical earthquakes in the Northern Territory, Australian Earthquake Engineering
Society, 45.
Meckel, T. A., M. F. Coffin, S. Mosher, P. Symonds, G. Bernardel and P. Mann (2003). Underthrusting
at the Hjort Trench, Australian-Pacific plate boundary: Incipient subduction?, Geochemistry,
Geophys. Geosystems, 4, no. 12.
Milsom, J., D. Masson, G. Nichols, N. Sikumbang, B. Dwiyanto, L. Parson and H. Kallagher (1992).
The Manokwari Trough and the western end of the New Guinea Trench, Tectonics, 11, no. 1, 145–
153.
Moore, G. F., D. Kadarisman, C. A. Evans and J. W. Hawkins (1981). Geology of the Talaud Islands,
molucca sea collision zone, northeast Indonesia, J. Struct. Geol., 3, no. 4, 467–475.
Moore, G. F. and E. A. Silver (1983). Collision processes in the northern Molucca Sea, in The Tectonic
and Geologic Evolution of Southeast Asian Seas and Islands Part 2, American Geophysical Union,
360–372.
Nguyen, N., B. Duffy, J. Shulmeister and M. Quigley (2013). Rapid Pliocene uplift of Timor, Geology,
41, no. 2, 179–182.
Nguyen, N., J. Griffin, A. Cipta and P. R. Cummins (2015). Indonesia’s Historical Earthquakes:
Modelled examples for improving the national hazard map, Geoscience Australia, Canberra.
Ohkura, T., T. Tabei, F. Kimata, T. C. Bacolcol, Y. Nakamura, A. C. Luis, A. Pelicano, R. Jorgio, M.
Tabigue, M. Abrahan, E. Jorgio and E. Gunawan (2015). Plate Convergence and Block Motions in
Mindanao Island , Philippine as Derived from Campaign GPS Observations We conducted yearly
Global Positioning System ( GPS ) campaigns in the eastern part of Mindanao from, J. Disaster
Res., 10, no. 1.
Okal, E. A. (1999). Historical seismicity and seismotectonic context of the great 1979 Yapen and 1996
Biak, Irian Jaya earthquakes, Pure Appl. Geophys., 154, 633–675.
Okal, E. A., S. H. Kirby and N. Kalligeris (2016). The Showa Sanriku earthquake of 1933 March 2: a
global seismological reassessment, Geophys. J. Int., 206, no. 3, 1492–1514.
Okal, E. A. and D. Reymond (2003). The mechanism of great Banda Sea earthquake of 1 February
1938: applying the method of preliminary determination of focal mechanism to a historical event,
Earth Planet. Sci. Lett., 216, no. 1, 1–15.
36 Earthquake sources of the Australian plate margin
Omang, A., A. Solikhin and A. Cipta (2011). Peta Kawasan Rawan Bencana Gempabumi Provinsi
Papua Barat [Map of earthquake disaster prone regions for West Papua Province], Bandung.
Ott, B. and P. Mann (2015). Late Miocene to Recent formation of the Aure-Moresby fold-thrust belt
and foreland basin as a consequence of Woodlark microplate rotation, Papua New Guinea,
Geochemistry, Geophys. Geosystems, 16, no. 6, 1988–2004.
Pagani, M., D. Monelli, G. Weatherill, L. Danciu, H. Crowley, V. Silva, P. Henshaw, L. Butler, M.
Nastasi, L. Panzeri, M. Simionato and D. Vigano (2014). OpenQuake Engine: An Open Hazard
(and Risk) Software for the Global Earthquake Model, Seismol. Res. Lett., 85, no. 3, 692–702.
Pelinovsky, E. (1996). Tsunami of 1 January 1996 in Indonesia, in RL Heathcote, C Cuttler, & J Koetz
(eds), Conference on Natural Disaster Reduction 1996, Institution of Engineers, Australia, Barton,
A.C.T, Australia, 307–312.
Poiata, N., K. Koketsu and M. Hiroe (2010). Source processes of the 2009 Irian Jaya, Indonesia,
earthquake doublet, Earth, Planets Sp., 62, 475–481.
Power, W. (2013). Review of Tsunami Hazard in New Zealand (2013 update), GNS Science. Lower
Hutt.
Power, W., X. Wang, L. Wallace, K. Clark and C. Mueller (2017). The New Zealand Probabilistic
Tsunami Hazard Model: development and implementation of a methodology for estimating tsunami
hazard nationwide, Geol. Soc. London, Spec. Publ., 456, SP456.6.
Pownall, J. M., R. Hall and G. S. Lister (2016). Rolling open Earth’s deepest forearc basin, Geology,
44, no. 11, 947–950.
Puspita, S. D., R. Hall and C. F. Elders (2005). Structural Styles of the Offshore West Sulawesi Fold
Belt, North Makassar Straits, Indonesia, Proceedings, Indonesian Petroleum Association, 30th
Annual Convention & Exhibition, August 2005.
Rangin, C., D. Dahrin, R. Quebral and T. M. S. Party (1996). Collision and strike-slip faulting in the
northern Molucca Sea (Philippines and Indonesia): preliminary results of a morphotectonic study,
Geol. Soc. London, Spec. Publ., 106, no. 1, 29–46.
Rangin, C., X. Le Pichon, S. Mazzotti, M. Pubellier, N. Chamot-Rooke, M. Aurelio, A. Walpersdorf and
R. Quebral (1999). Plate convergence measured by GPS across the Sundaland/Philippine Sea
Plate deformed boundary: the Philippines and eastern Indonesia, Geophys. J. Int., 139, no. 2, 296–
316.
Rangin, C. and E. Silver (1990). Geological setting of the Celebes and Sulu Seas, in C Rangin, E
Silver, & MT von Breymann (eds), Proceedings of the Ocean Drilling Program, Initial Reports,.
Raymond, O. (2018). Australian Geological Provinces 2018.01 edition.
Ruff, L. J., J. W. Given, C. O. Sanders and C. M. Sperber (1989). Large earthquakes in the macquarie
ridge complex: Transitional tectonics and subduction initiation, Pure Appl. Geophys., 129, no. 1–2,
71–129.
Saqab, M. M., J. Bourget, J. Trotter and M. Keep (2017). New constraints on the timing of flexural
deformation along the northern Australian margin: Implications for arc-continent collision and the
development of the Timor Trough, Tectonophysics, 696–697, 14–36.
Satake, K. and Y. Tanioka (1999). Sources of Tsunami and Tsunamigenic Earthquakes in Subduction
Zones, Pure Appl. Geophys., 154, no. 3–4, 467–483.
Schlüter, H. U. and J. Fritsch (1985). Geology and tectonics of the Banda Arc between Tanimbar
Island and Aru Island (Indonesia): Results of R/V Sonne Cruise SO-16.
Silver, E. A., R. McCaffrey, Y. Joyodiwiryo and S. Stevens (1983)(a). Ophiolite emplacement by
collision between the Sula Platform and the Sulawesi Island Arc, Indonesia, J. Geophys. Res. Solid
Earth, 88, no. B11, 9419–9435.
Silver, E. A., R. McCaffrey and R. B. Smith (1983)(b). Collision, rotation, and the initiation of
subduction in the evolution of Sulawesi, Indonesia, J. Geophys. Res. Solid Earth, 88, no. B11,
9407–9418.
Silver, E. A. and J. C. Moore (1978). The Molucca Sea Collision Zone, Indonesia, J. Geophys. Res.
Solid Earth, 83, no. B4, 1681–1691.

Earthquake sources of the Australian plate margin 37
Silver, E. A., D. Reed, R. McCaffrey and Y. Joyodiwiryo (1983)(c). Back arc thrusting in the Eastern
Sunda Arc, Indonesia: A consequence of arc-continent collision, J. Geophys. Res. Solid Earth, 88,
no. B9, 7429–7448.
Sleep, N. H. (2012). Constraint on the recurrence of great outer-rise earthquakes from seafloor
bathymetry, Earth Planets Sp., 64, 1245–1246.
Sloan, R. A. and J. A. Jackson (2012). Upper-mantle earthquakes beneath the Arafura Sea and south
Aru Trough: Implications for continental rheology, J. Geophys. Res. Solid Earth, 117, no. B5.
Snyder, D. B., H. Prasetyo, D. J. Blundell, C. J. Pigram, A. J. Barber, A. Richardson and S.
Tjokosaproetro (1996). A dual doubly vergent orogen in the Banda Arc continent-arc collision zone
as observed on deep seismic reflection profiles, Tectonics, 15, no. 1, 34–53.
Socquet, A., W. Simons, C. Vigny, R. McCaffrey, C. Subarya, D. Sarsito, B. Ambrosius and W.
Spakman (2006). Microblock rotations and fault coupling in SE Asia triple junction (Sulawesi,
Indonesia) from GPS and earthquake slip vector data, J. Geophys. Res., 111, no. B8, B08409.
Spakman, W. and R. Hall (2010). Surface deformation and slab–mantle interaction during Banda arc
subduction rollback, Nat. Geosci., 3, no. 8, 562–566.
Spencer, J. E. (2011). Gently dipping normal faults identified with Space Shuttle radar topography
data in central Sulawesi, Indonesia, and some implications for fault mechanics, Earth Planet. Sci.
Lett., 308, no. 3–4, 267–276.
Stevens, C. W., R. Mccaffrey, Y. Bock, J. F. Genrich, M. Pubellier and C. Subarya (2002). Evidence
for Block Rotations and Basal Shear in the World’s Fastest Slipping Continental Shear Zone in NW
New Guinea, in S Stein & JT Freymuller (eds), Plate Boundary Zones, American Geophysical
Union, 87–99.
Storchak, D.A., D. Di Giacomo, I. Bondár, E. R. Engdahl, J. Harris, W.H.K. Lee, A. Villaseñor and P.
Bormann (2013). Public Release of the ISC-GEM Global Instrumental Earthquake Catalogue
(1900-2009). Seism. Res. Lett., 84, 5, 810-815, doi: 10.1785/0220130034.
Sulaeman, C. and A. Cipta (2012). Peta Kawasan Rawan Bencana Gempabumi Provinsi Papua [Map
of earthquake disaster prone regions of Papua Province], Bandung.
Tabei, T., F. Kimata and T. Ohkura (2008). Estimation of plate convergent rates in the Philippines-
eastern Indonesia deformation zone from GPS results, in Abstracts of Japan Geoscience Union
Meeting,T229-006.
Tregoning, P. (2002). Plate kinematics in the western Pacific derived from geodetic observations, J.
Geophys. Res. Solid Earth, 107, no. B1.
Tregoning, P. and A. Gorbatov (2004). Evidence for active subduction at the New Guinea Trench,
Geophys. Res. Lett., 31, no. 13.
Wallace, L. M., S. Ellis, T. Little, P. Tregoning, N. Palmer, R. Rosa, R. Stanaway, J. Oa, E. Nidkombu
and J. Kwazi (2014). Continental breakup and UHP rock exhumation in action: GPS results from
the Woodlark Rift, Papua New Guinea, Geochemistry, Geophys. Geosystems, 15, no. 11, 4267–
4290.
Watkinson, I. M. and R. Hall (2016). Fault systems of the eastern Indonesian triple junction: evaluation
of Quaternary activity and implications for seismic hazards, Geol. Soc. London, Spec. Publ., 441,
SP441.8.
Watkinson, I. M., R. Hall and F. Ferdian (2011). Tectonic re-interpretation of the Banggai-Sula–
Molucca Sea margin, Indonesia, Geol. Soc. London, Spec. Publ., 355, no. 1, 203–224.
Wei, Z., B. L. N. Kennett, and L.-F. Zhao (2017). Lg-wave attenuation in the Australian crust,
Tectonophys. 717, 413-424, doi: 10.1016/j.tecto.2017.08.022.
Wichmann, A. (1918). Die Erdbeben des Indischen Archipels bis zum Jahre 1857, Verh. der K. Akad.
van Wet. te Amsterdam, 20, no. 4, 193.
Related Documents


