Earthquake forecasting using earthquake catalogs

Earthquake forecasting using earthquake catalogs.
Jan 03, 2016
Welcome message from author
This document is posted to help you gain knowledge. Please leave a comment to let me know what you think about it! Share it to your friends and learn new things together.
Transcript
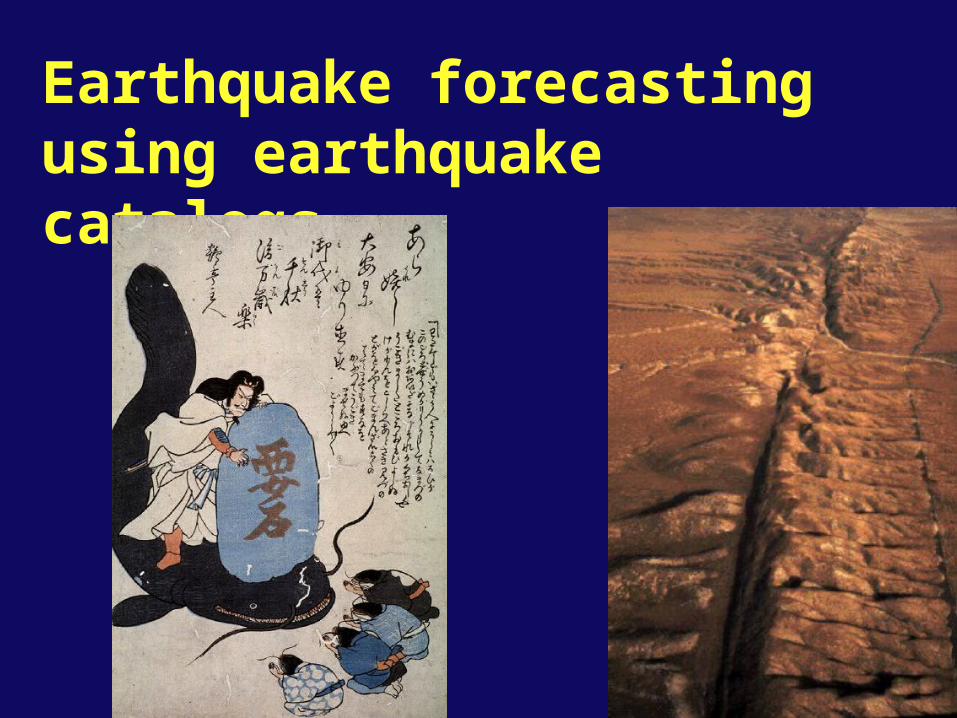
Earthquake forecasting using earthquake catalogs
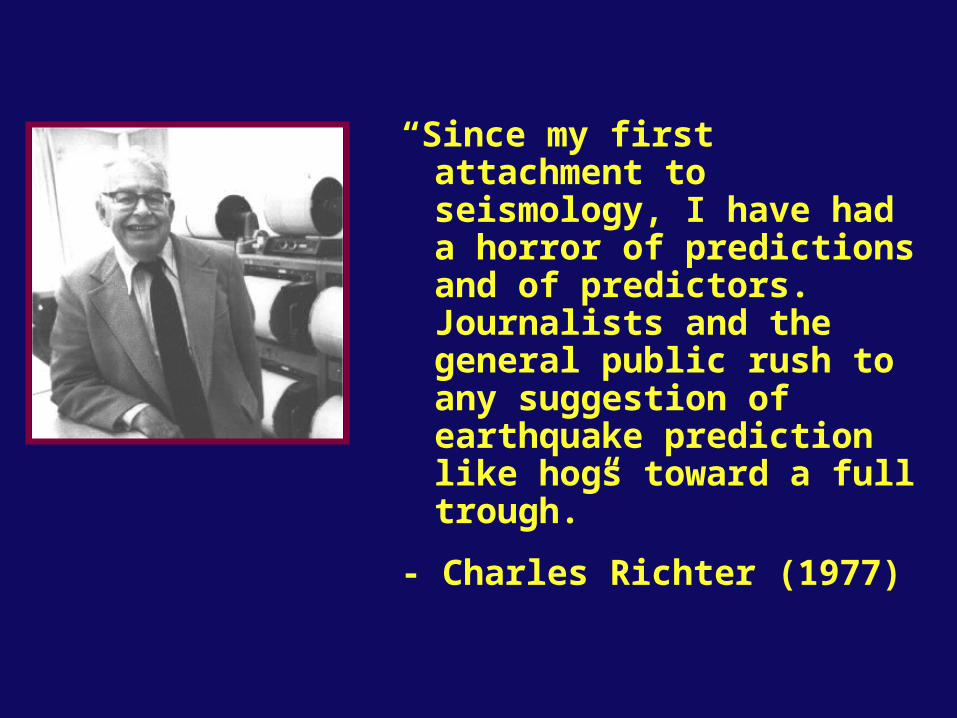
“Since my first attachment to seismology, I have had a horror of predictions and of predictors. Journalists and the general public rush to any suggestion of earthquake prediction like hogs toward a full trough.”
- Charles Richter (1977)
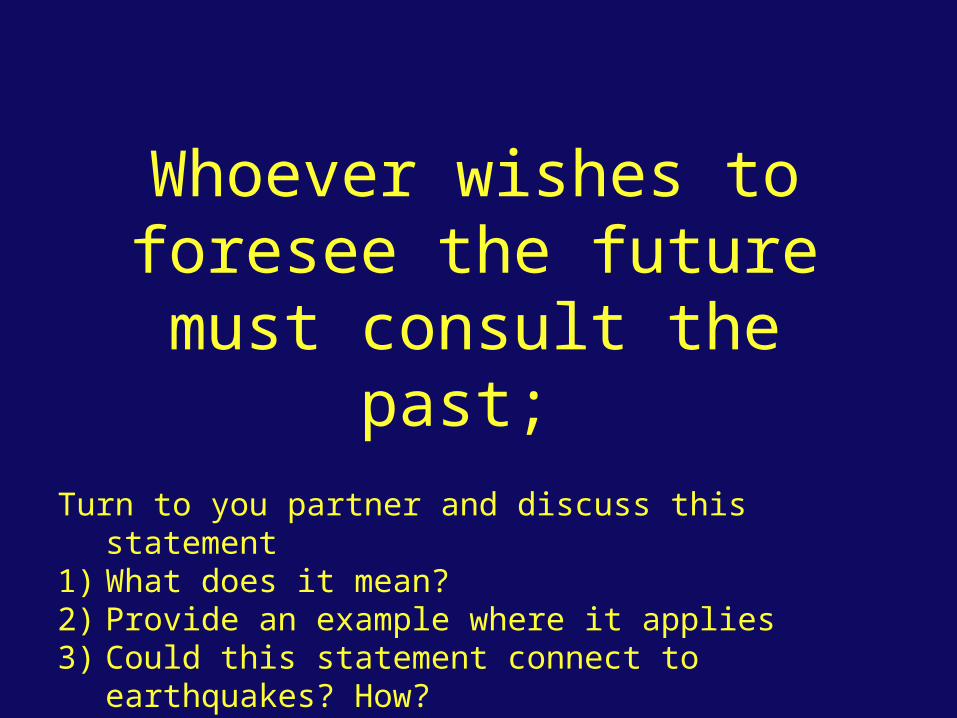
Whoever wishes to foresee the future must consult the
past; Turn to you partner and discuss this statement1) What does it mean?2) Provide an example where it applies3) Could this statement connect to earthquakes? How?
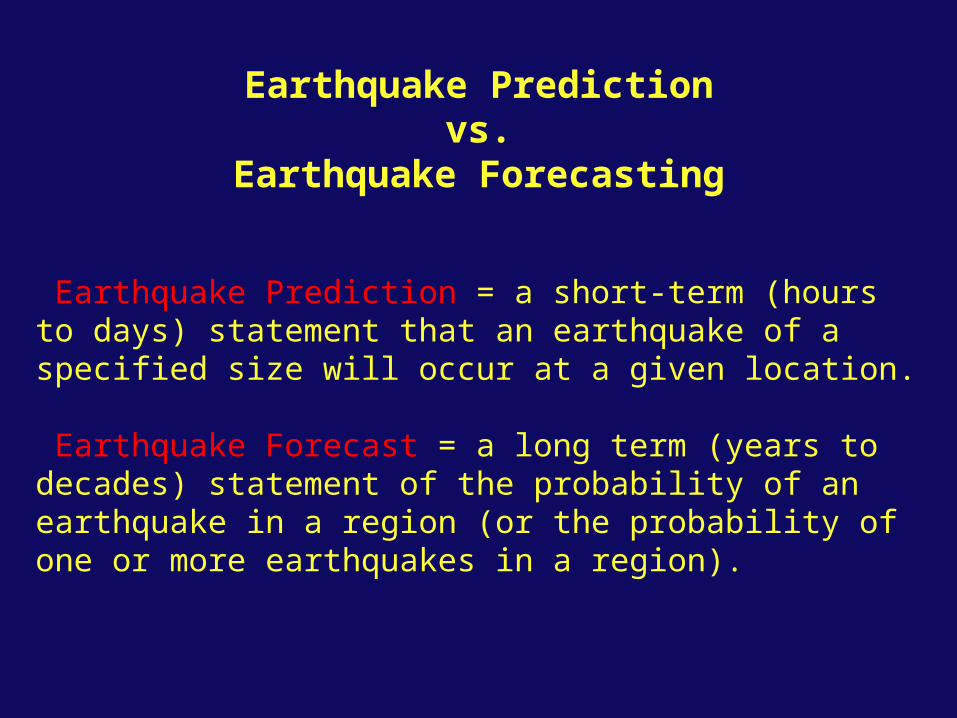
Earthquake Predictionvs.
Earthquake Forecasting
Earthquake Prediction = a short-term (hours to days) statement that an earthquake of a specified size will occur at a given location.
Earthquake Forecast = a long term (years to decades) statement of the probability of an earthquake in a region (or the probability of one or more earthquakes in a region).

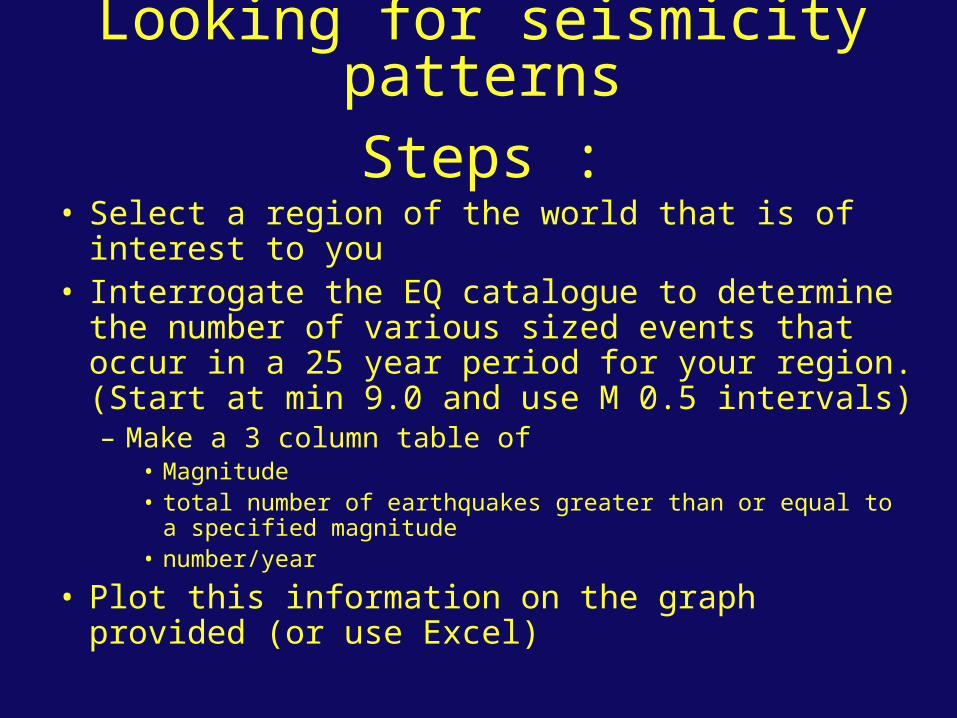
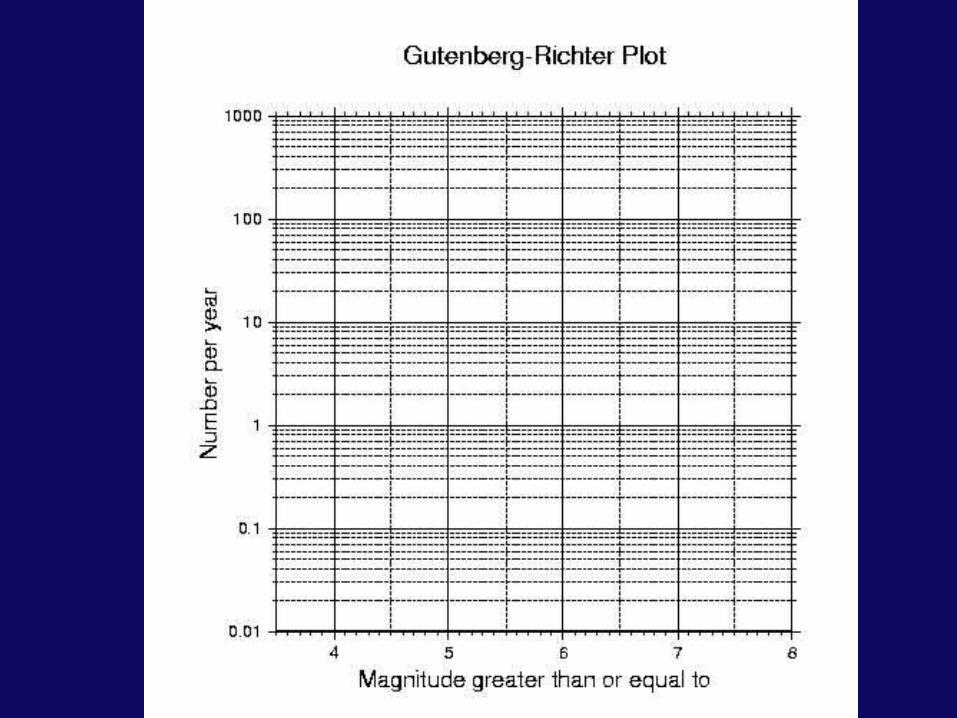
Looking for seismicity patternsSteps :
• Select a region of the world that is of interest to you
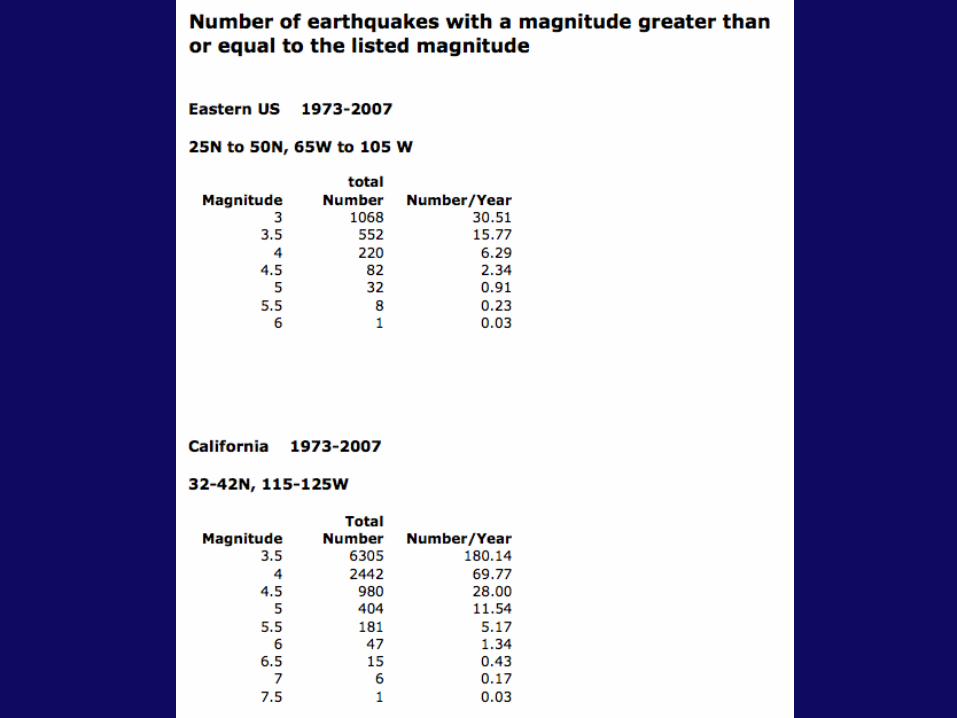
• Interrogate the EQ catalogue to determine the number of various sized events that occur in a 25 year period for your region. (Start at min 9.0 and use M 0.5 intervals)– Make a 3 column table of
• Magnitude• total number of earthquakes greater than or equal to a specified magnitude
• number/year
• Plot this information on the graph provided (or use Excel)
Looking for seismicity patternsSteps :
• Select a region of the world that is of interest to you
• Interrogate the EQ catalogue to determine the number of various sized events that occur in a 25 year period for your region. (Start at min 9.0 and use M 0.5 intervals)– Make a 3 column table of
• Magnitude• total number of earthquakes greater than or equal to a specified magnitude
• number/year
• Plot this information on the graph provided (or use Excel)
How might this information help to forecast future earthquakes?
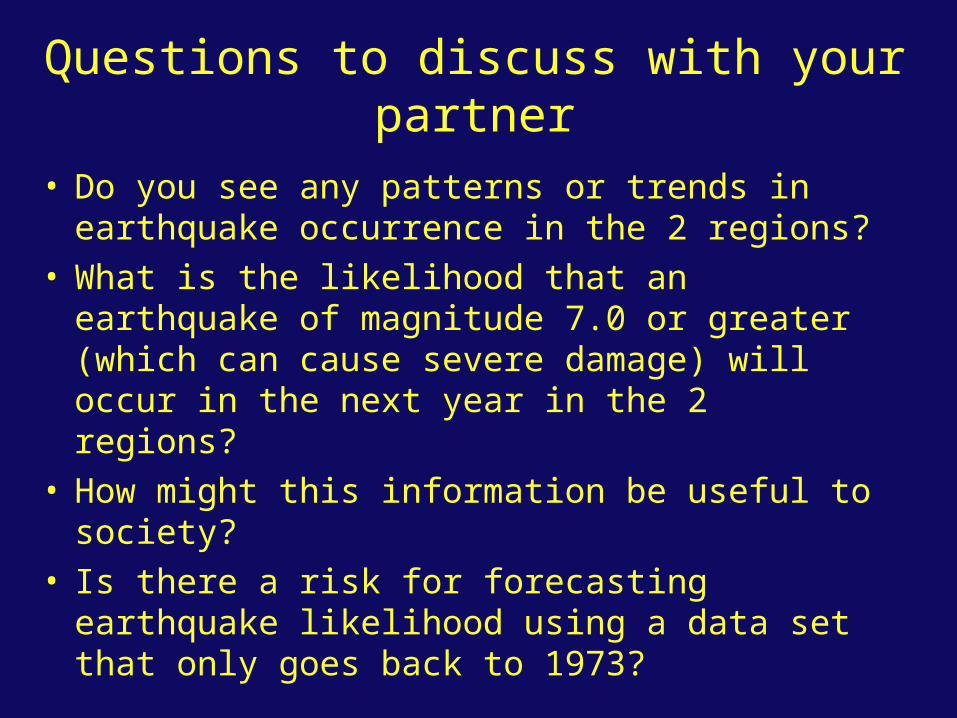
Questions to discuss with your partner
• Do you see any patterns or trends in earthquake occurrence in the 2 regions?
• What is the likelihood that an earthquake of magnitude 7.0 or greater (which can cause severe damage) will occur in the next year in the 2 regions?
• How might this information be useful to society?
• Is there a risk for forecasting earthquake likelihood using a data set that only goes back to 1973?
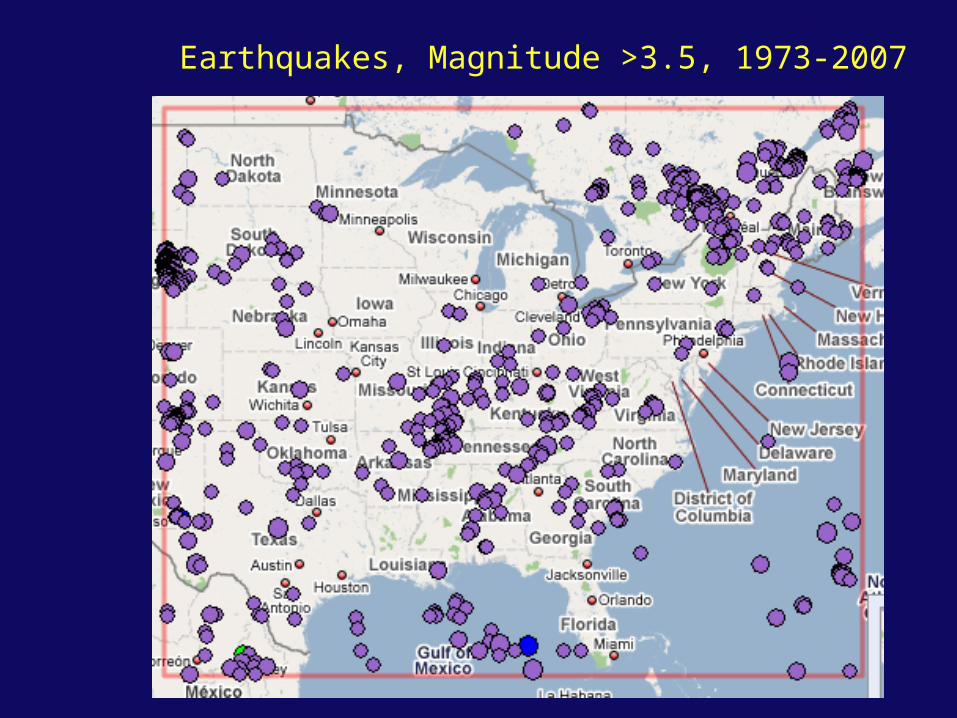
Earthquakes, Magnitude >3.5, 1973-2007
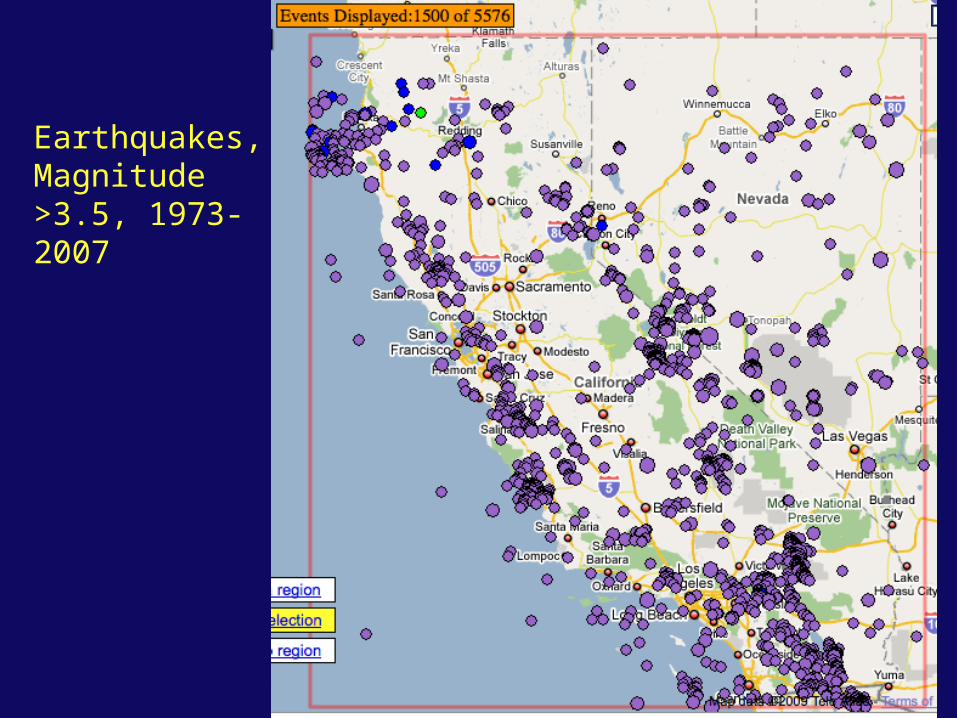
Earthquakes, Magnitude >3.5, 1973-2007
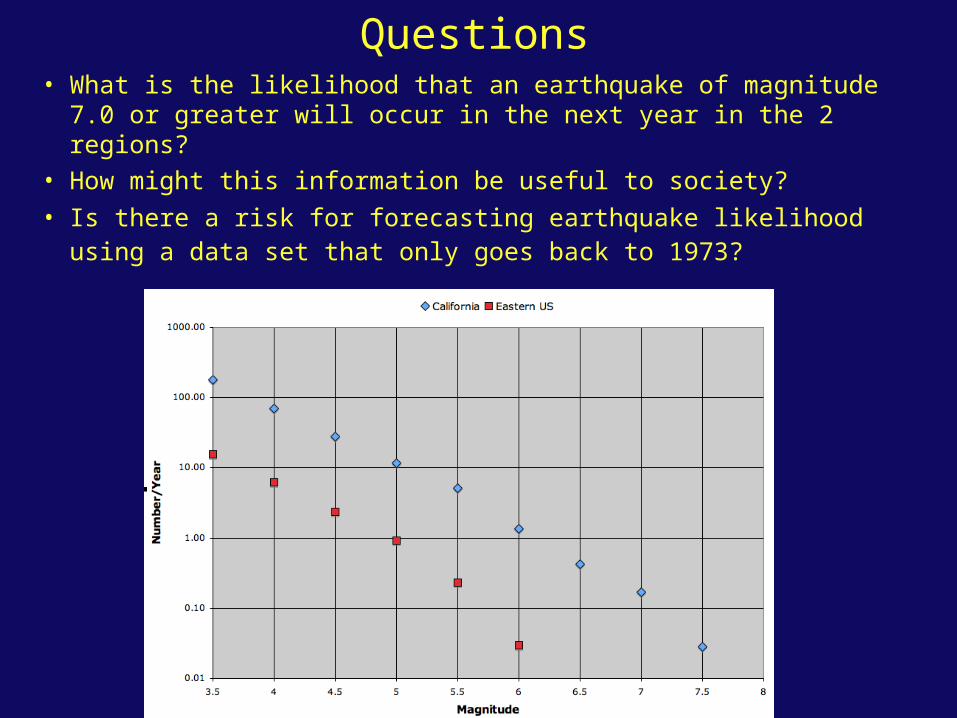
Questions• What is the likelihood that an earthquake of magnitude 7.0 or greater will occur in the next year in the 2 regions?
• How might this information be useful to society?• Is there a risk for forecasting earthquake likelihood using a data set that only goes back to 1973?
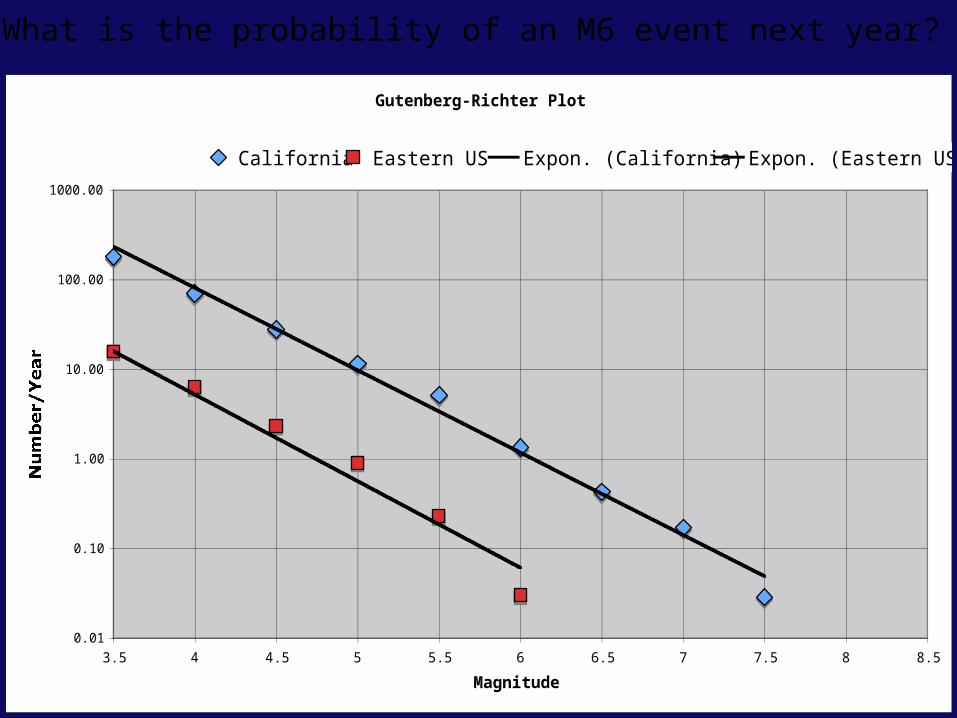
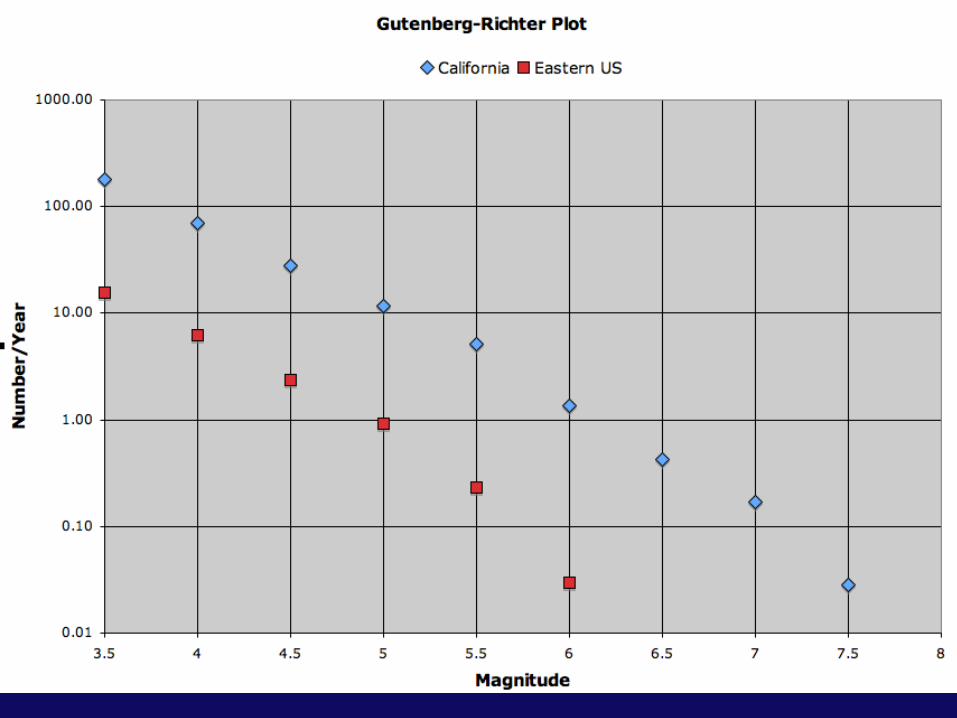
Gutenberg-Richter Plot
0.01
0.10
1.00
10.00
100.00
1000.00
3.5 4 4.5 5 5.5 6 6.5 7 7.5 8 8.5
Magnitude
Number/Year
California Eastern US Expon. (California) Expon. (Eastern US)
What is the probability of an M6 event next year?
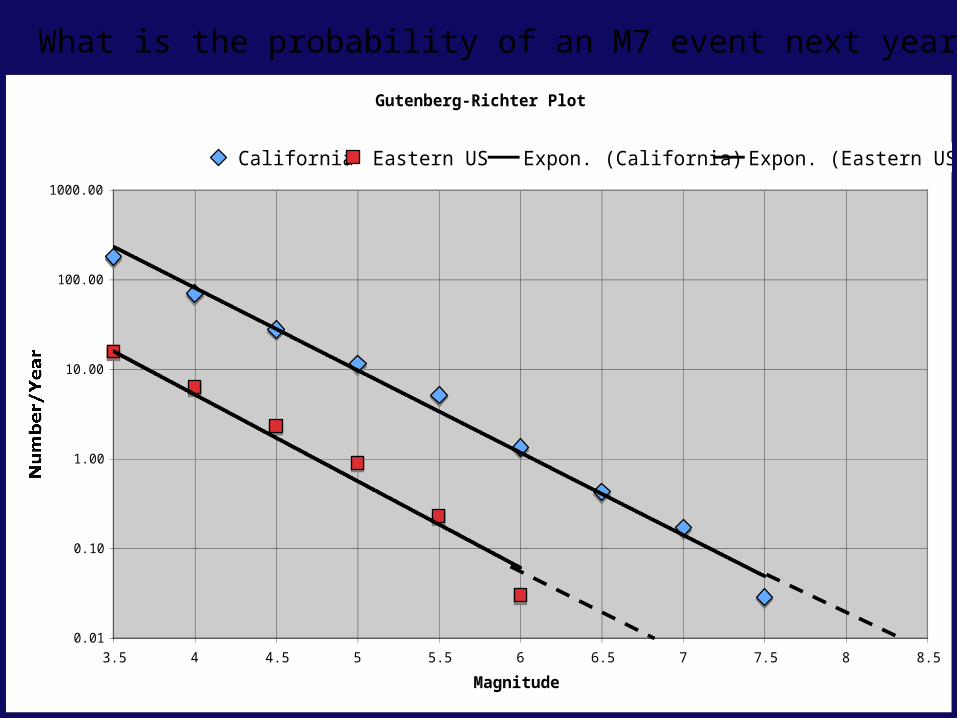
Gutenberg-Richter Plot
0.01
0.10
1.00
10.00
100.00
1000.00
3.5 4 4.5 5 5.5 6 6.5 7 7.5 8 8.5
Magnitude
Number/Year
California Eastern US Expon. (California) Expon. (Eastern US)
What is the probability of an M7 event next year?
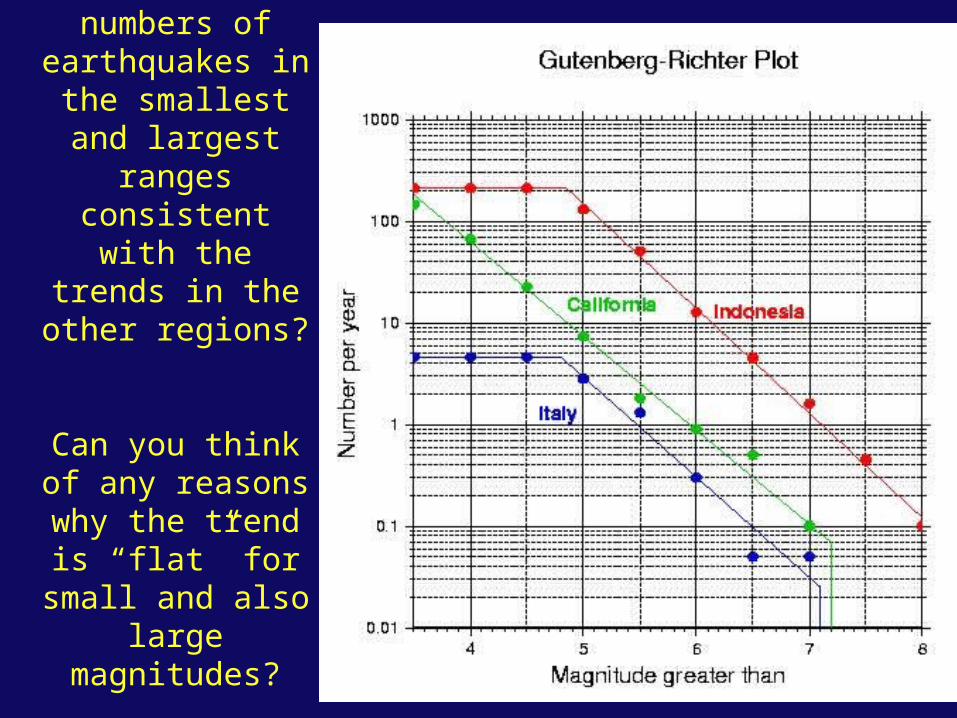
Are the numbers of
earthquakes in the smallest and largest
ranges consistent with the
trends in the other regions?
Can you think of any reasons why the trend is “flat” for small and also
large magnitudes?
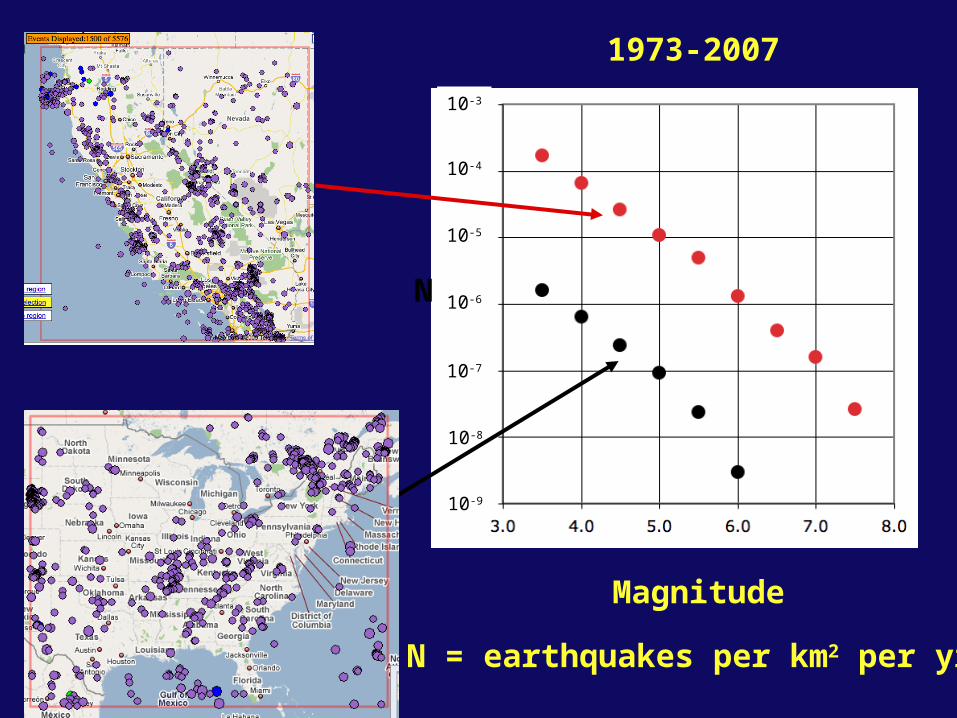
1973-2007
Magnitude
N
N = earthquakes per km2 per yr
10-9
10-8
10-7
10-6
10-5
10-4
10-3
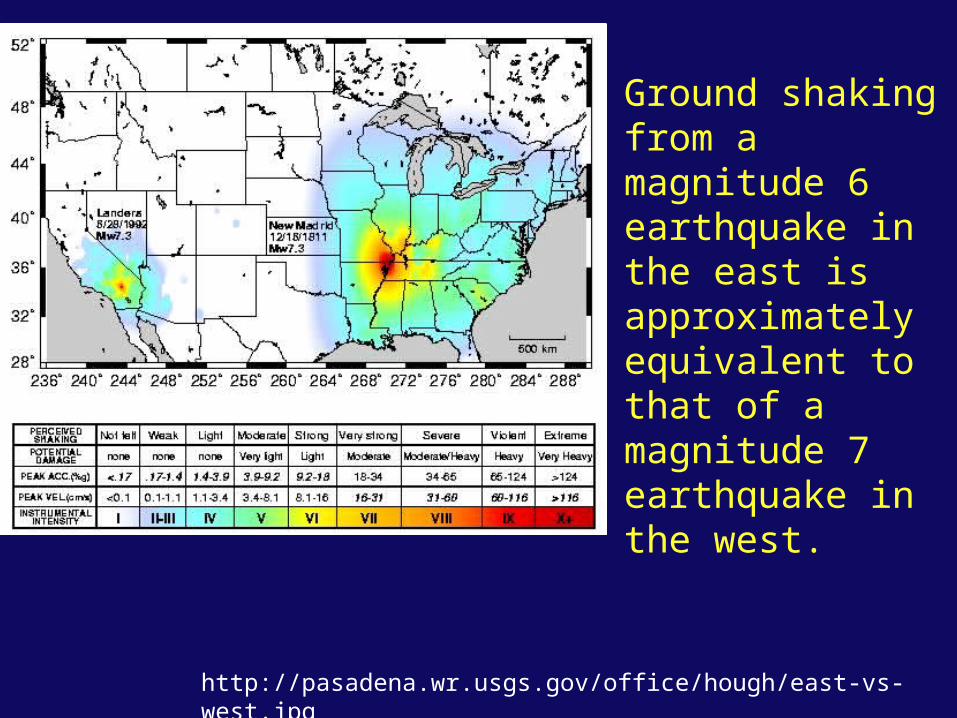
http://pasadena.wr.usgs.gov/office/hough/east-vs-west.jpg
Ground shaking from a magnitude 6 earthquake in the east is approximately equivalent to that of a magnitude 7 earthquake in the west.
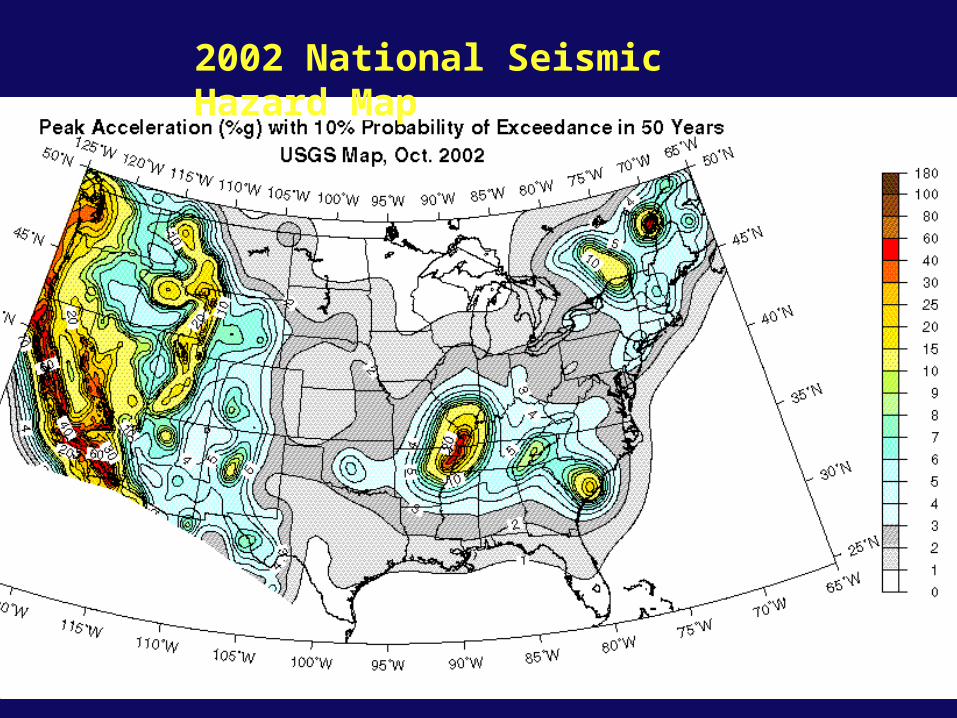
2002 National Seismic Hazard Map
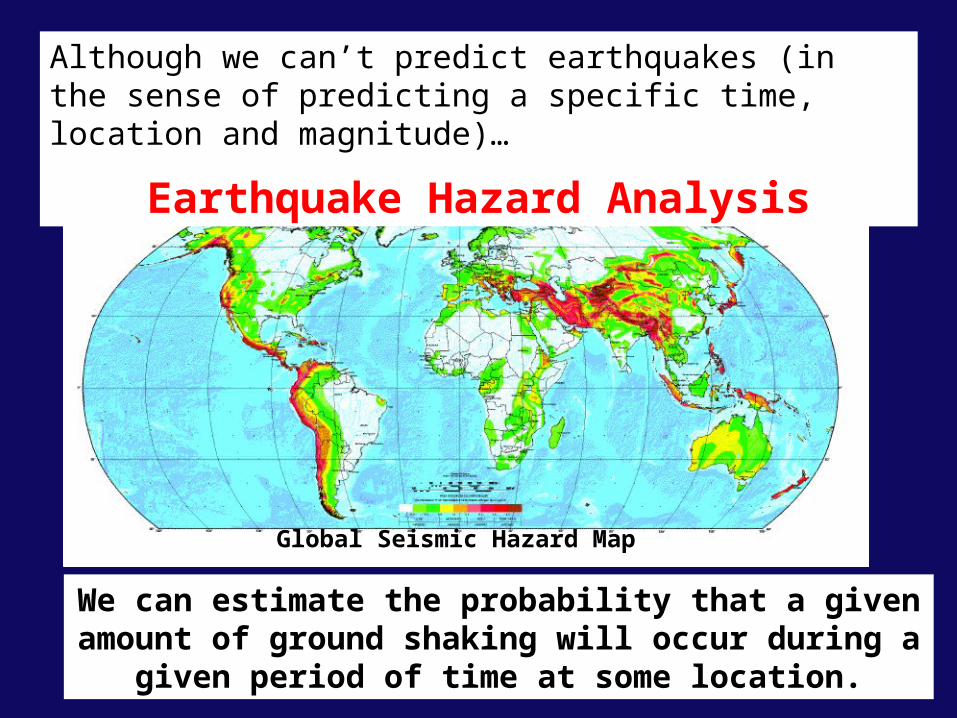
Although we can’t predict earthquakes (in the sense of predicting a specific time, location and magnitude)…
Earthquake Hazard Analysis
Global Seismic Hazard Map
We can estimate the probability that a given amount of ground shaking will occur during a
given period of time at some location.
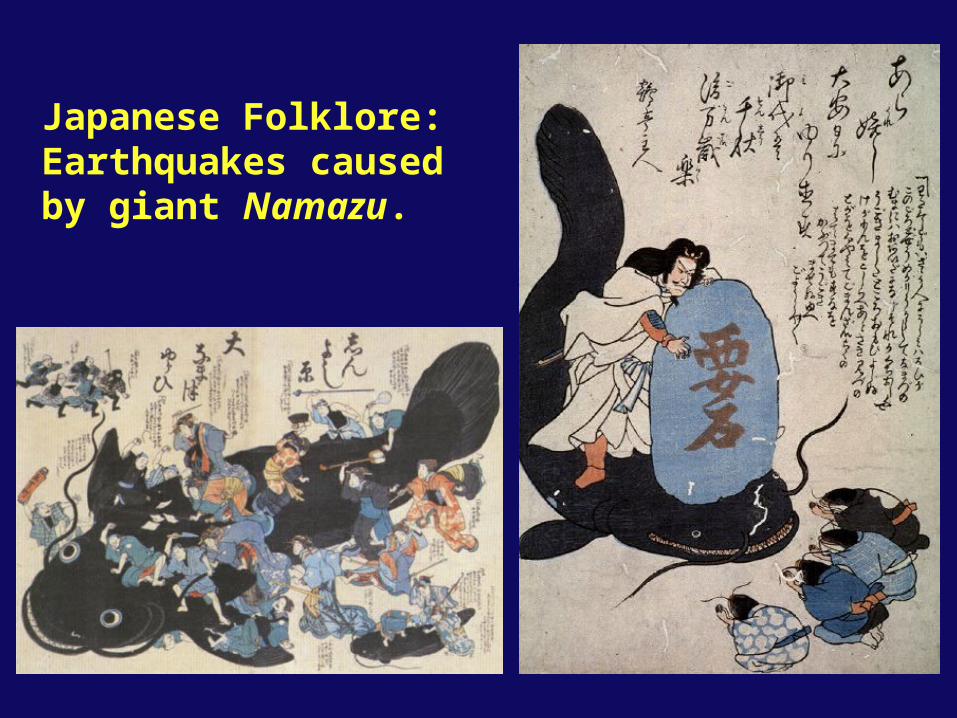
Japanese Folklore: Earthquakes caused by giant Namazu.
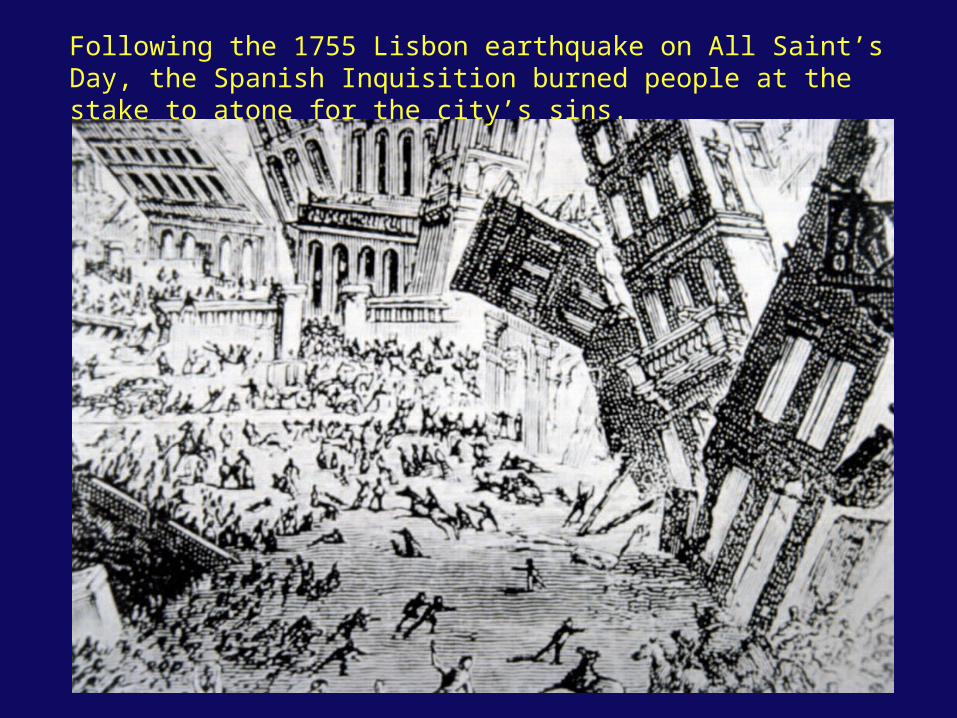
Following the 1755 Lisbon earthquake on All Saint’s Day, the Spanish Inquisition burned people at the stake to atone for the city’s sins.
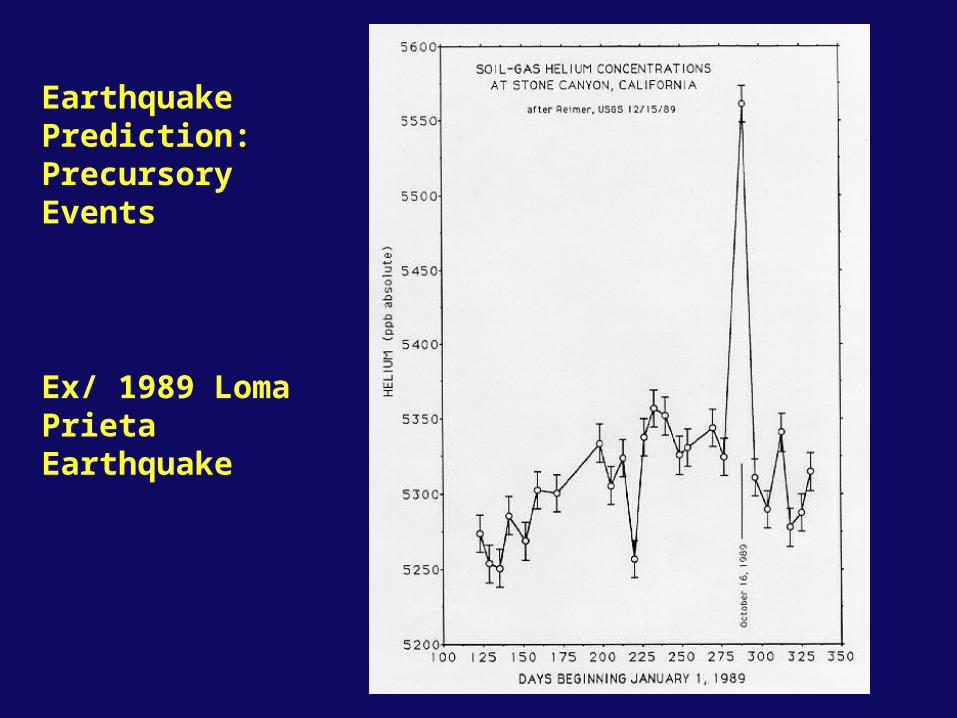
Earthquake Prediction: Precursory Events
Ex/ 1989 Loma Prieta Earthquake
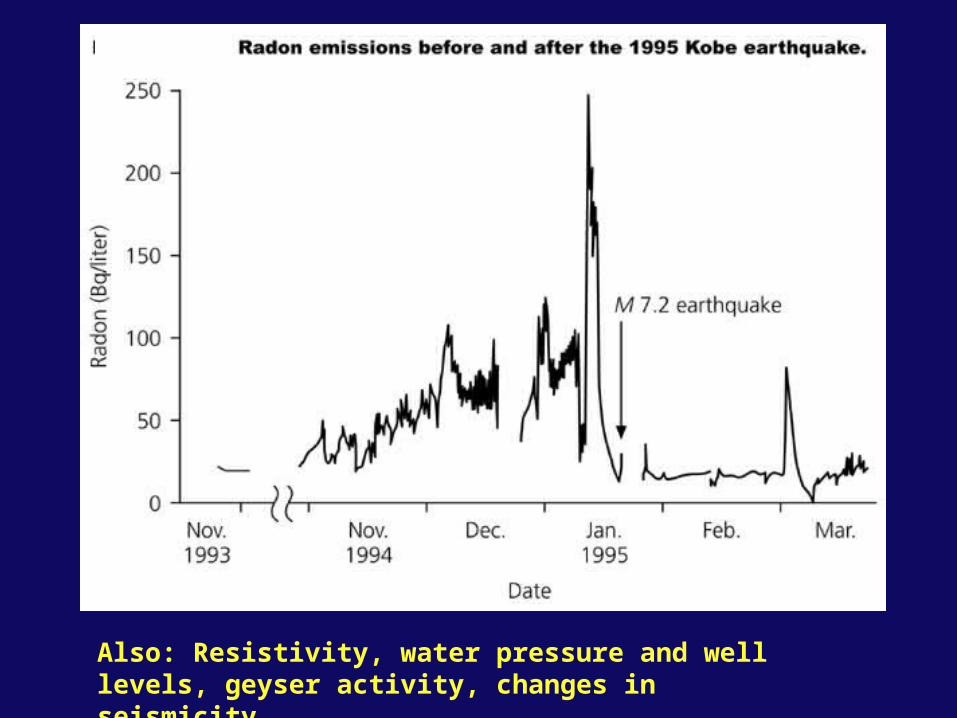
Also: Resistivity, water pressure and well levels, geyser activity, changes in seismicity
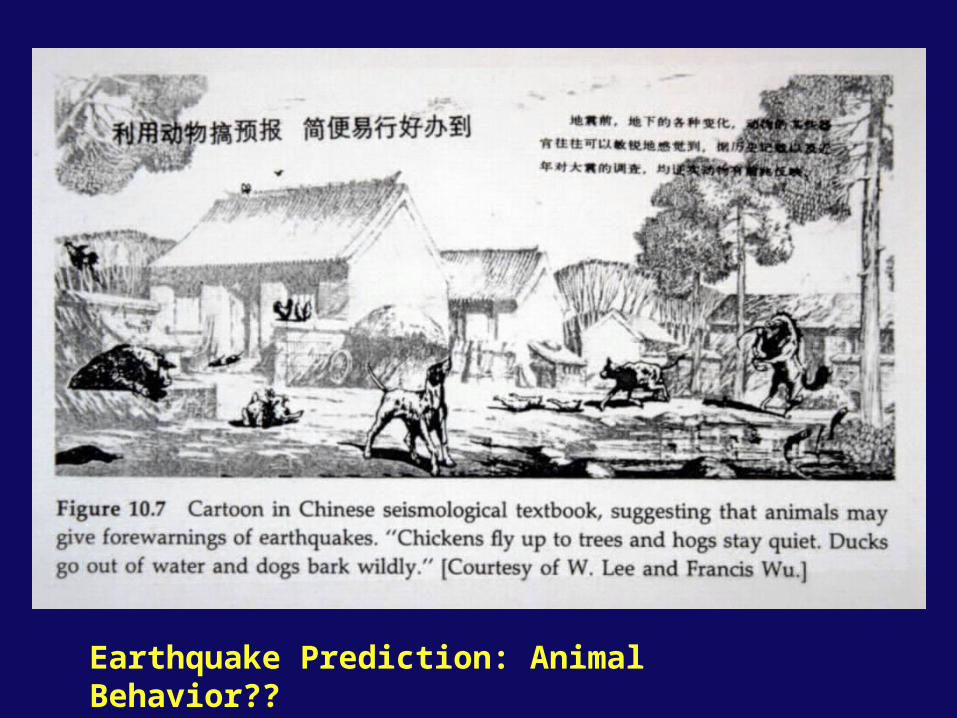
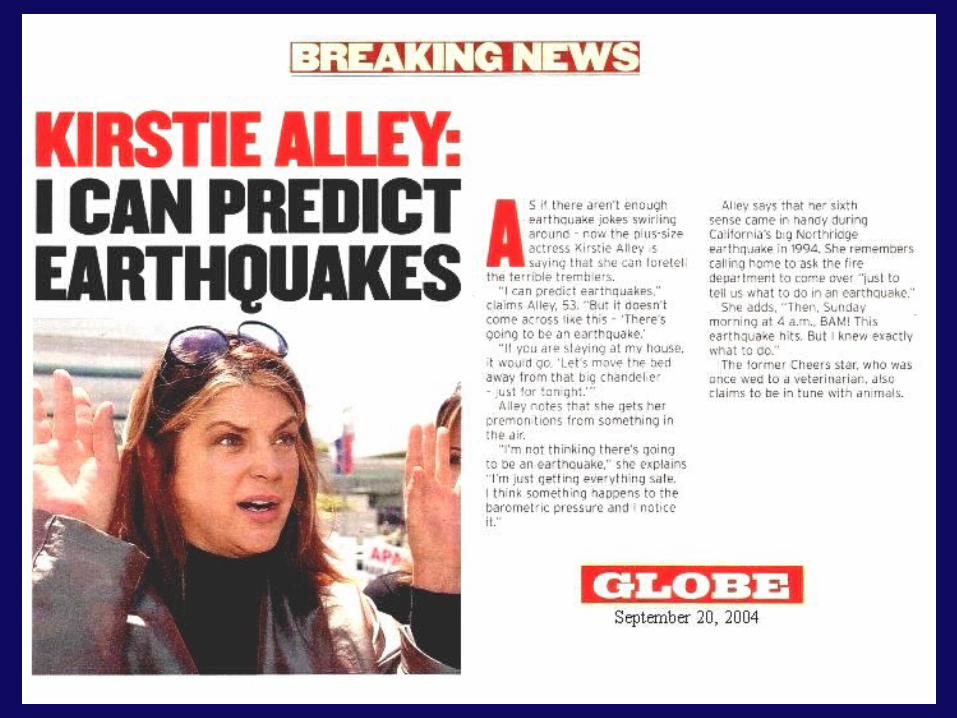
Earthquake Prediction: Animal Behavior??
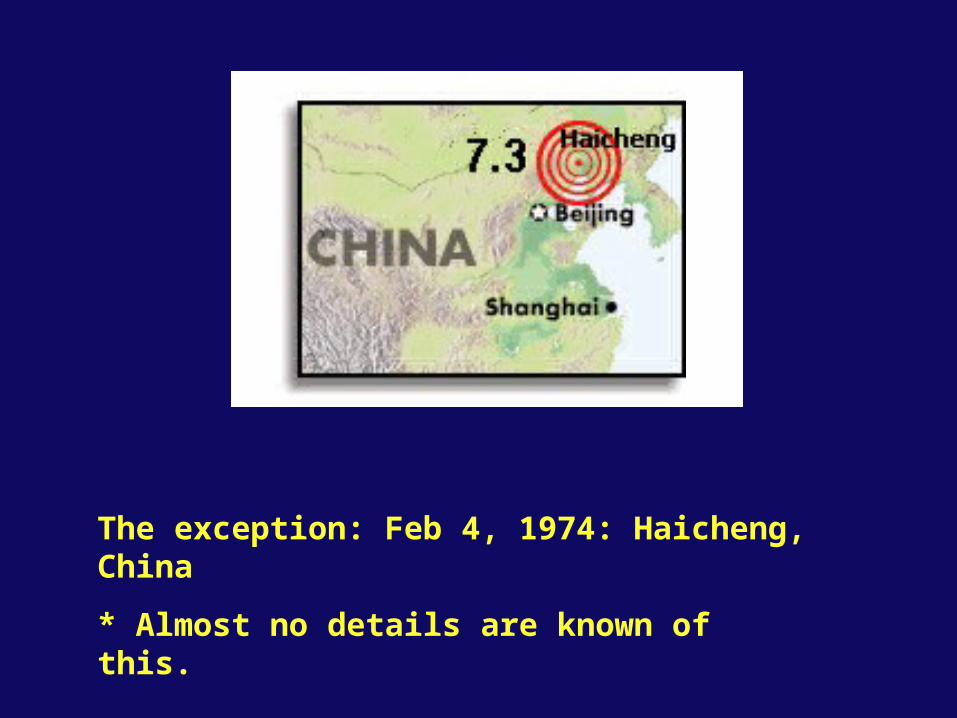
The exception: Feb 4, 1974: Haicheng, China
* Almost no details are known of this.
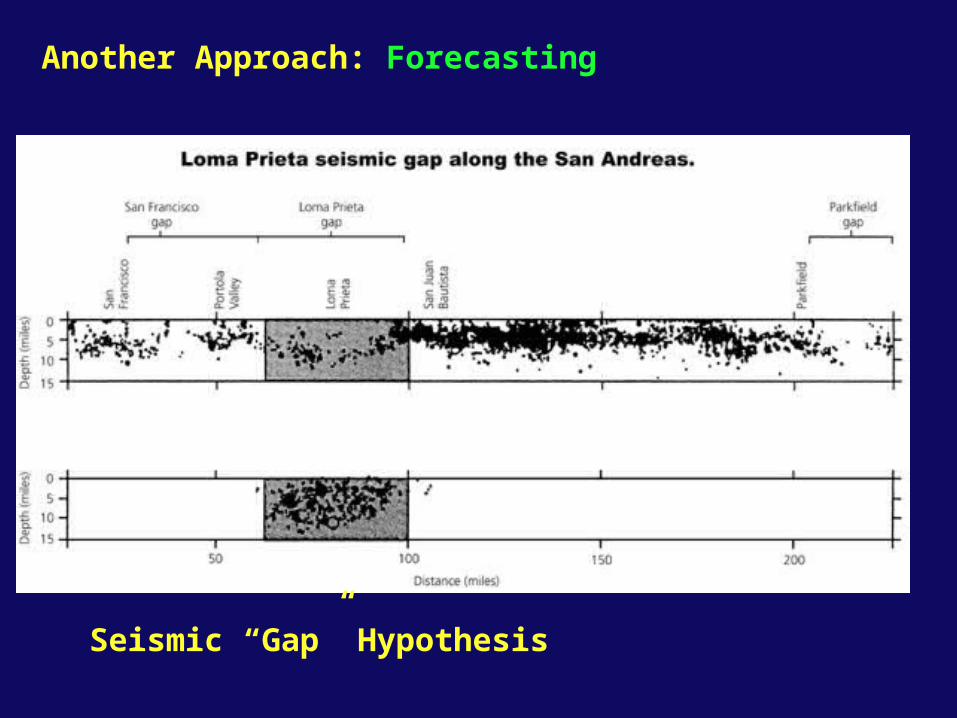
Seismic “Gap” Hypothesis
Another Approach: Forecasting
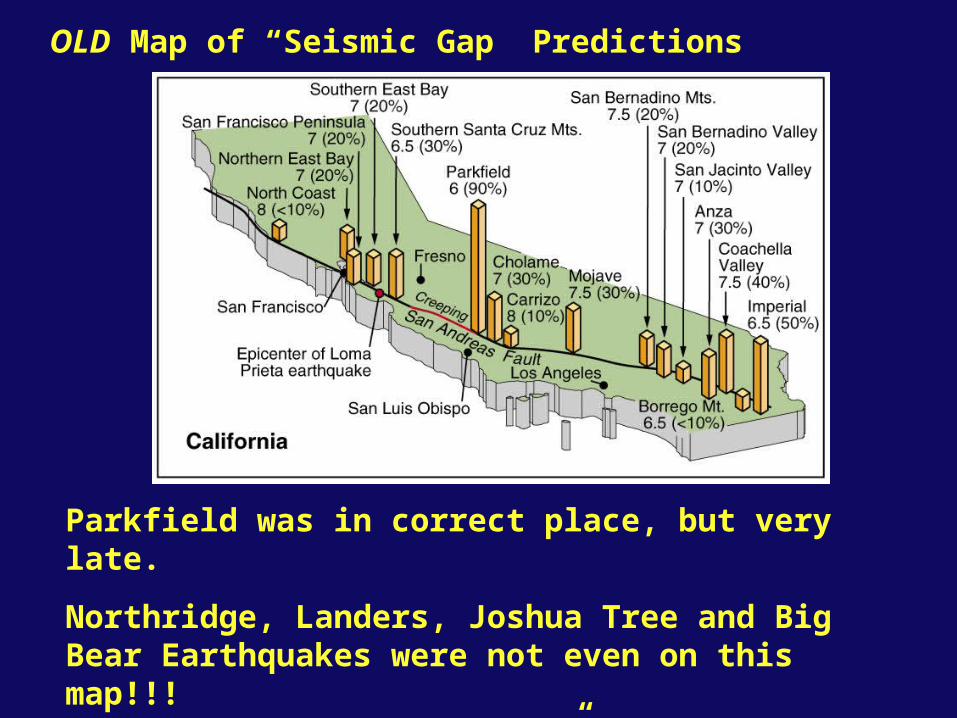
OLD Map of “Seismic Gap” Predictions
Parkfield was in correct place, but very late.
Northridge, Landers, Joshua Tree and Big Bear Earthquakes were not even on this map!!!
“New York City Bear Gap” Hypothesis
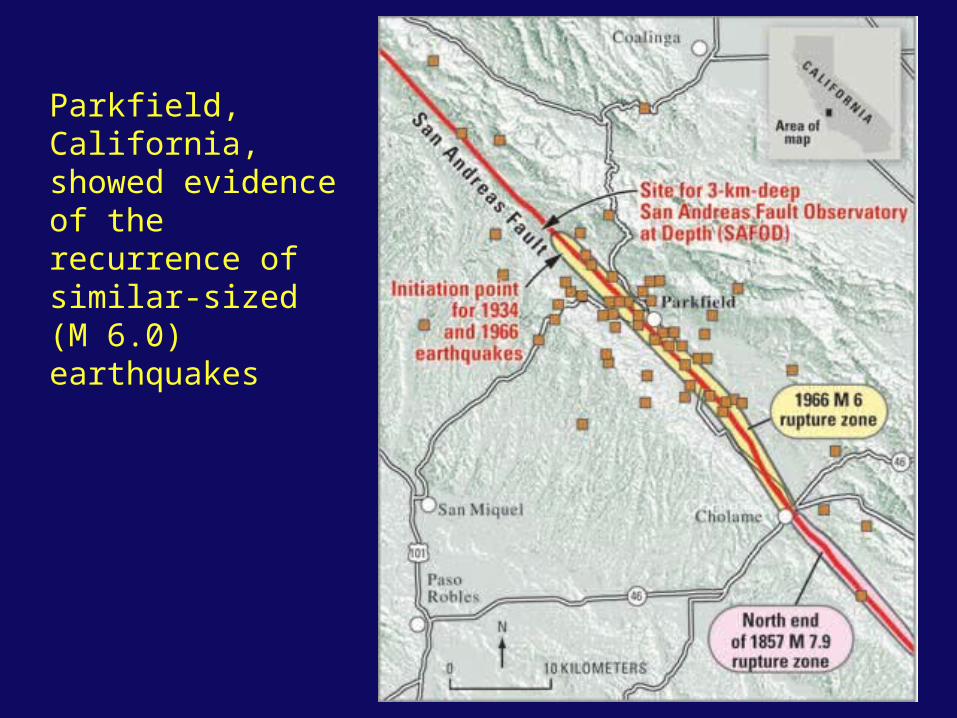
Parkfield, California, showed evidence of the recurrence of similar-sized (M 6.0) earthquakes
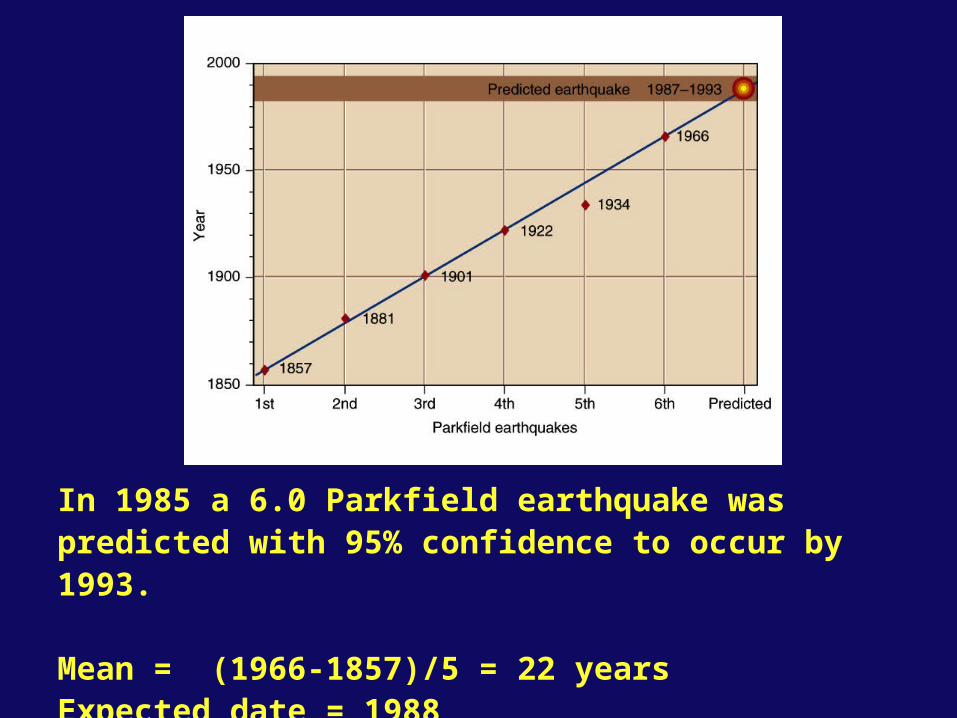
In 1985 a 6.0 Parkfield earthquake was predicted with 95% confidence to occur by 1993.
Mean = (1966-1857)/5 = 22 yearsExpected date = 1988
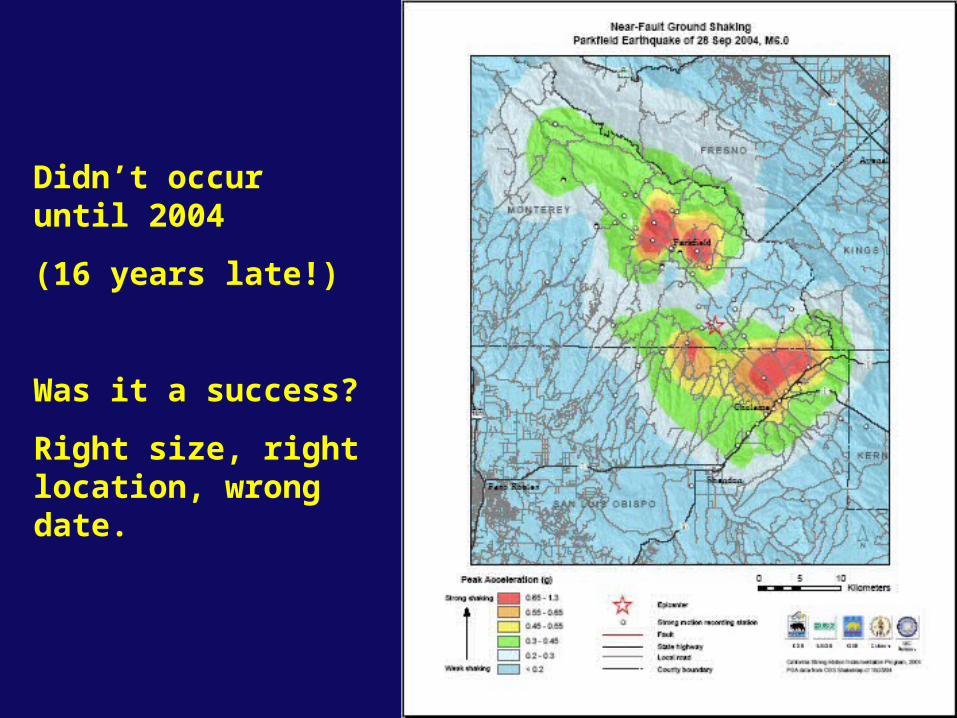
Didn’t occur until 2004
(16 years late!)
Was it a success?
Right size, right location, wrong date.
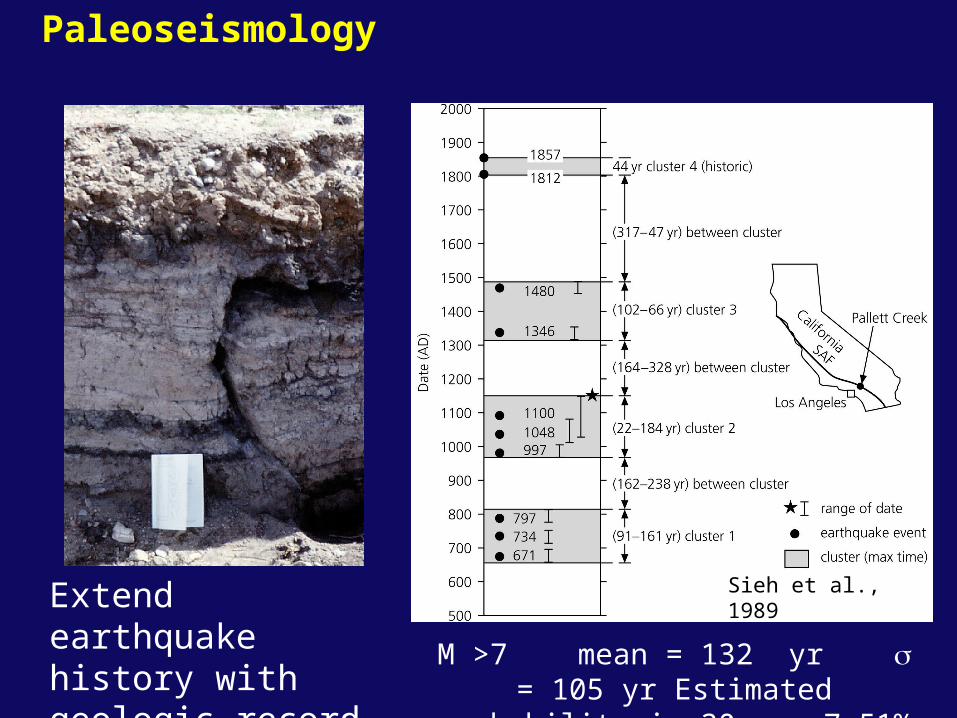
Paleoseismology
M >7 mean = 132 yr = 105 yr Estimated
probability in 30 yrs 7-51%
Sieh et al., 1989Extend
earthquake history with geologic record
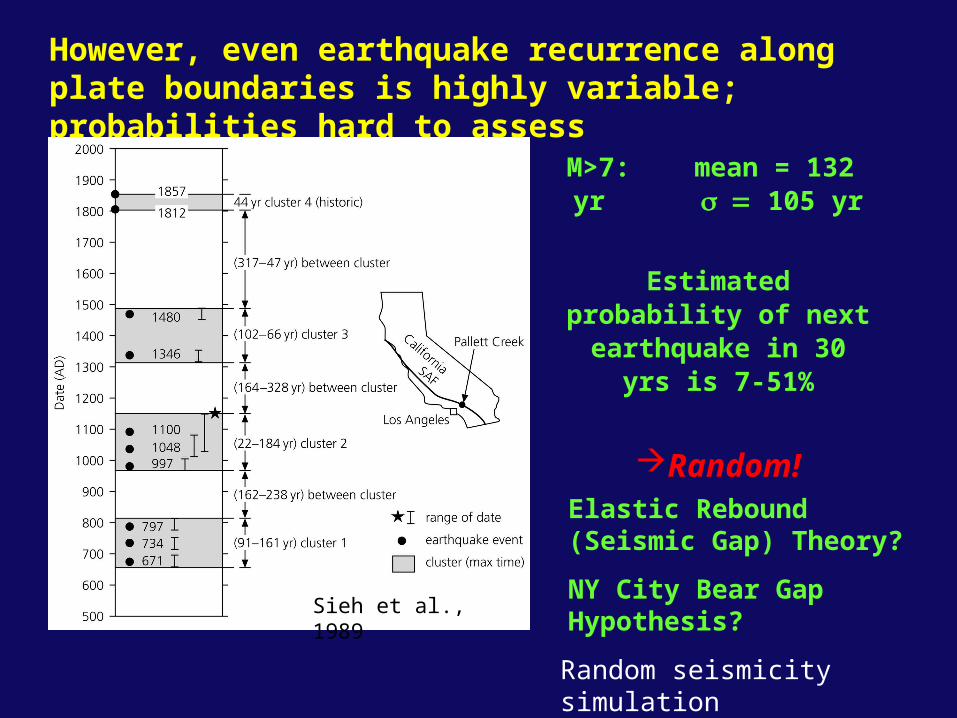
However, even earthquake recurrence along plate boundaries is highly variable; probabilities hard to assess
M>7: mean = 132 yr 105 yr
Estimated probability of next earthquake in 30
yrs is 7-51%
Random!
Sieh et al., 1989
Random seismicity simulation
Elastic Rebound (Seismic Gap) Theory?
NY City Bear Gap Hypothesis?
Related Documents