Earthquake Early Warning System in Southern Italy E 2395 of wave travel times via impulse response functions. Soil Dyn Earthq Eng 21(5):387–404. doi:10.1016/j.soildyn.2007.07.001 55. Todorovska MI, Trifunac MD (2008) Earthquake damage de- tection in the Imperial County Services Building II: analysis of novelties via wavelets. Struct Control Health Monit (submit- ted for publication) 56. Todorovska MI, Trifunac MD, Ivanovi´ c SS (2001) Wave prop- agation in a seven-story reinforced concrete building, Part I: theoretical models. Soil Dyn Earthq Eng 21(3):211–223 57. Todorovska MI, Trifunac MD, Ivanovi´ c SS (2001) Wave prop- agation in a seven-story reinforced concrete building, Part II: observed wave numbers. Soil Dyn Earthq Eng 21(3):225– 236 58. Trifunac MD (2007) Early History of the Response Spectrum Method, Dept. of Civil Engineering, Report CE 07-01. Univ. Southern California, Los Angeles, California 59. Trifunac MD, Todorovska MI (2001) A note on the useable dynamic range of accelerographs recording translation. Soil Dyn Earthq Eng 21(4):275–286 60. Trifunac MD, Todorovska MI (2001) Evolution of accelero- graphs, data processing, strong motion arrays and amplitude and spatial resolution in recording strong earthquake mo- tion. Soil Dyn Earthq Eng 21(6):537–555 61. Trifunac MD, Todorovska MI (2001) Recording and interpret- ing earthquake response of full-scale structures: In Erdik M, Celebi M, Mihailov V, Apaydin N (eds) Proc. of the NATO Ad- vanced Research Workshop on Strong-Motion Instrumenta- tion for Civil Engineering Structures, 2–5 June, 1999. Kluwer, Istanbul, p 24 62. Trifunac MD, Ivanovic SS, Todorovska MI (1999) Experimental evidence for flexibility of a building foundation supported by concrete friction piles. Soil Dyn Earthq Eng 18(3):169–187 63. Trifunac MD, Todorovska MI, Hao TY (2001) Full-scale exper- imental studies of soil-structure interaction – a review. Proc. of the 2nd US Japan Workshop on Soil-Structure Interaction, 6–8 March, 2001. Tsukuba City, Japan, pp 52 64. Trifunac MD, Ivanovi´ c SS, Todorovska MI (2003). Wave prop- agation in a seven-story reinforced concrete building, Part III: damage detection via changes in wave numbers. Soil Dyn Earthq Eng 23(1):65–75 65. Trifunac MD, Todorovska MI, Mani´ c MI, Bulaji´ c BÐ (2008) Vari- ability of the fixed-base and soil-structure system frequencies of a building – the case of Borik-2 building. Struct Control Health Monit (in press). doi:10.1002/stc.277 66. Udwadia FE, Jerath N (1980) Time variations of structural properties during strong ground shaking. J Eng Mech Div ASCE 106(EM1):111–121 67. Udwadia FE, Marmarelis PZ (1976) The identification of build- ing structural systems I. The linear case. Bull Seism Soc Am 66(1):125–151 68. Udwadia FE, Marmarelis PZ (1976) The identification of build- ing structural systems II. The nonlinear case. Bull Seism Soc Am 66(1):153–171 69. Udwadia FE, Trifunac MD (1974) Time and amplitude depen- dent response of structures. Earthq Eng Struct Dyn 2:359–378 70. Ward HS, Crawford R (1966) Wind induced vibrations and building modes. Bull Seism Soc Am 56(4):793–813 71. Wong HL, Trifunac MD, Luco JE (1988) A comparison of soil- structure interaction calculations with results of full-scale forced vibration tests. Soil Dyn Earthq Eng 7(1):22–31 Earthquake Early Warning System in Southern Italy ALDO ZOLLO 1 ,GIOVANNI IANNACCONE 2 , VINCENZO CONVERTITO 2 ,LUCA ELIA 2 , IUNIO IERVOLINO 3 ,MARIA LANCIERI 2 , ANTHONY LOMAX 4 ,CLAUDIO MARTINO 1 , CLAUDIO SATRIANO 1 ,EMANUEL WEBER 2 , PAOLO GASPARINI 1 1 Dipartimento di Scienze Fisiche, Università di Napoli “Federico II” (RISSC-Lab), Napoli, Italy 2 Osservatorio Vesuviano, Istituto Nazionale di Geofisica e Vulcanologia (RISSC-Lab), Napoli, Italy 3 Dipartimento di Ingegneria Strutturale, Università di Napoli “Federico II”, Napoli, Italy 4 Alomax Scientific, Mouans-Sartoux, France Article Outline Glossary Definition of the Subject Introduction Earthquake Potential and Seismic Risk in the Campania Region Seismic Network Architecture and Components Real-Time Data Transmission System Network Management and Data Archiving Real-Time Earthquake Location and Magnitude Estimation Real-Time Hazard Analysis for Earthquake Early Warning Future Directions Bibliography Glossary Data transmission system A multi-component device aimed at the transmission of seismic signals over a dis- tance, also denoted as a telecommunication system. Each data transmission system consists of two basic el- ements: a transmitter that takes information and con- verts it to an electromagnetic signal and a receiver that receives the signal and converts it back into usable in- formation. Modern telecommunication systems are two-way and a single device, a transceiver, acts as both a transmitter and receiver. Transmitted signals can either be ana- logue or digital. In an analogue signal, the signal is varied continuously with respect to the information. In a digital signal, the information is encoded as a set of discrete, binary values. During transmission, the in-

Welcome message from author
This document is posted to help you gain knowledge. Please leave a comment to let me know what you think about it! Share it to your friends and learn new things together.
Transcript
Earthquake Early Warning System in Southern Italy E 2395
of wave travel times via impulse response functions. Soil DynEarthq Eng 21(5):387–404. doi:10.1016/j.soildyn.2007.07.001
55. Todorovska MI, Trifunac MD (2008) Earthquake damage de-tection in the Imperial County Services Building II: analysis ofnovelties via wavelets. Struct Control Health Monit (submit-ted for publication)
56. Todorovska MI, Trifunac MD, Ivanovic SS (2001) Wave prop-agation in a seven-story reinforced concrete building, Part I:theoretical models. Soil Dyn Earthq Eng 21(3):211–223
57. Todorovska MI, Trifunac MD, Ivanovic SS (2001) Wave prop-agation in a seven-story reinforced concrete building, PartII: observed wave numbers. Soil Dyn Earthq Eng 21(3):225–236
58. Trifunac MD (2007) Early History of the Response SpectrumMethod, Dept. of Civil Engineering, Report CE 07-01. Univ.Southern California, Los Angeles, California
59. Trifunac MD, Todorovska MI (2001) A note on the useabledynamic range of accelerographs recording translation. SoilDyn Earthq Eng 21(4):275–286
60. Trifunac MD, Todorovska MI (2001) Evolution of accelero-graphs, data processing, strongmotion arrays and amplitudeand spatial resolution in recording strong earthquake mo-tion. Soil Dyn Earthq Eng 21(6):537–555
61. Trifunac MD, Todorovska MI (2001) Recording and interpret-ing earthquake response of full-scale structures: In Erdik M,Celebi M, Mihailov V, Apaydin N (eds) Proc. of the NATO Ad-vanced Research Workshop on Strong-Motion Instrumenta-tion for Civil Engineering Structures, 2–5 June, 1999. Kluwer,Istanbul, p 24
62. Trifunac MD, Ivanovic SS, Todorovska MI (1999) Experimentalevidence for flexibility of a building foundation supported byconcrete friction piles. Soil Dyn Earthq Eng 18(3):169–187
63. Trifunac MD, Todorovska MI, Hao TY (2001) Full-scale exper-imental studies of soil-structure interaction – a review. Proc.of the 2nd US Japan Workshop on Soil-Structure Interaction,6–8 March, 2001. Tsukuba City, Japan, pp 52
64. Trifunac MD, Ivanovic SS, Todorovska MI (2003). Wave prop-agation in a seven-story reinforced concrete building, Part III:damage detection via changes in wave numbers. Soil DynEarthq Eng 23(1):65–75
65. Trifunac MD, Todorovska MI, Manic MI, Bulajic BÐ (2008) Vari-ability of the fixed-base and soil-structure system frequenciesof a building – the case of Borik-2 building. Struct ControlHealth Monit (in press). doi:10.1002/stc.277
66. Udwadia FE, Jerath N (1980) Time variations of structuralproperties during strong ground shaking. J Eng Mech DivASCE 106(EM1):111–121
67. Udwadia FE, Marmarelis PZ (1976) The identification of build-ing structural systems I. The linear case. Bull Seism Soc Am66(1):125–151
68. Udwadia FE, Marmarelis PZ (1976) The identification of build-ing structural systems II. The nonlinear case. Bull Seism SocAm 66(1):153–171
69. Udwadia FE, Trifunac MD (1974) Time and amplitude depen-dent response of structures. Earthq Eng Struct Dyn 2:359–378
70. Ward HS, Crawford R (1966) Wind induced vibrations andbuildingmodes. Bull Seism Soc Am 56(4):793–813
71. Wong HL, Trifunac MD, Luco JE (1988) A comparison of soil-structure interaction calculations with results of full-scaleforced vibration tests. Soil Dyn Earthq Eng 7(1):22–31
Earthquake EarlyWarning System inSouthern ItalyALDO ZOLLO1, GIOVANNI IANNACCONE2,VINCENZO CONVERTITO2, LUCA ELIA2,IUNIO IERVOLINO3, MARIA LANCIERI2,ANTHONY LOMAX4, CLAUDIO MARTINO1,CLAUDIO SATRIANO1, EMANUEL WEBER2,PAOLO GASPARINI11 Dipartimento di Scienze Fisiche, Università di Napoli“Federico II” (RISSC-Lab), Napoli, Italy
2 Osservatorio Vesuviano, Istituto Nazionale di Geofisicae Vulcanologia (RISSC-Lab), Napoli, Italy
3 Dipartimento di Ingegneria Strutturale, Università diNapoli “Federico II”, Napoli, Italy
4 Alomax Scientific, Mouans-Sartoux, France
Article Outline
GlossaryDefinition of the SubjectIntroductionEarthquake Potential and Seismic Risk
in the Campania RegionSeismic Network Architecture and ComponentsReal-Time Data Transmission SystemNetwork Management and Data ArchivingReal-Time Earthquake Location
and Magnitude EstimationReal-Time Hazard Analysis
for Earthquake Early WarningFuture DirectionsBibliography
Glossary
Data transmission system A multi-component deviceaimed at the transmission of seismic signals over a dis-tance, also denoted as a telecommunication system.Each data transmission system consists of two basic el-ements: a transmitter that takes information and con-verts it to an electromagnetic signal and a receiver thatreceives the signal and converts it back into usable in-formation.Modern telecommunication systems are two-way anda single device, a transceiver, acts as both a transmitterand receiver. Transmitted signals can either be ana-logue or digital. In an analogue signal, the signal isvaried continuously with respect to the information.In a digital signal, the information is encoded as a setof discrete, binary values. During transmission, the in-
2396 E Earthquake Early Warning System in Southern Italy
formation contained in analogue signals will be de-graded by noise, while, unless the noise exceeds a cer-tain threshold, the information contained in digitalsignals will remain intact. This represents a key ad-vantage of digital signals over analogue signals. A col-lection of transmitters, receivers or transceivers thatcommunicate with each other is a telecommunicationnetwork. Digital networks may consist of one or morerouters that route data to the correct user.
Earthquake early warning system (EEWS)A real-time, modern information system that is ableto provide rapid notification of the potential damag-ing effects of an impending earthquake, through rapidtelemetry and processing of data from dense instru-ment arrays deployed in the source region of the eventof concern (regional EEWS) or surrounding the tar-get infrastructure (site-specific EEWS). A “regional”EEWS is based on a dense sensor network coveringa portion or the entirety of an area that is threatenedby earthquakes. The relevant source parameters (eventlocation and magnitude) are estimated from the earlyportion of recorded signals and are used to predict,with a quantified confidence, a ground motion inten-sity measure at a distant site where a target structure ofinterest is located. On the other hand, a “site-specific”EEWS consists of a single sensor or an array of sen-sors deployed in the proximity of the target structurethat is to be alerted, and whose measurements of am-plitude and predominant period on the initial P-wavemotion are used to predict the ensuing peak groundmotion (mainly related to the arrival of S and surfacewaves) at the same site.
Earthquake location An earthquake location specifiesthe spatial position and time of occurrence for anearthquake. The location may refer to the earthquakehypocenter and corresponding origin time, a mean orcentroid of some spatial or temporal characteristic ofthe earthquake, or another property of the earthquakethat can be spatially and temporally localized.
Earthquake magnitude The magnitude is a parameterused by seismologists to quantify the earthquake size.The Richter magnitude scale, or more correctly, lo-cal magnitude ML scale, assigns a single number toquantify the amount of seismic energy released by anearthquake. It is a base-10 logarithmic scale obtainedby calculating the logarithm of the combined horizon-tal amplitude of the largest displacement from zero ona seismometer output. Measurements have no limitsand can be either positive or negative.Introduced by the Japanese seismologist Aki in 1962,the seismic moment is the present-day physical pa-
rameter used to characterize the earthquake strength.It represents the scalar moment of one the couples offorces producing the dislocation at an earthquake faultand it is measured from the asymptotic DC level ondisplacement Fourier spectra of recorded seismic sig-nals.
Probability density function – PDF A function in one ormore dimensional space X that (i) when integratedover some interval �x in X gives a probability of oc-currence of any event within �x, and (ii) has unit in-tegral over space X, where X represents a space of pos-sible events.
Seismic data-logger A core element of a digital seismicstation, whose aim is to record the analogue signalsfrom seismic sensors and convert them in digital formwith an assigned sampling frequency. Ground motionsignals acquired by seismic sensors are pre-amplifiedand anti-aliasing filtered in a data-logger before theyare digitalized through an AD (analog-to-digital) con-verter. The main technical features of a modern data-logger are the number of available channels, the al-lowed sampling frequencies, the dynamic range, thedigitizer clock type, the storage capacity (PCMCIA, in-ternal flash and/or hard disk, USB, . . . ), network inter-faces (ethernet, wireless lan, or ppp) and power con-sumption.
Seismic hazard The probability that at a given site,a strong motion parameter (generally the peak groundacceleration) exceeds an assigned value in a fixed timeperiod. When the seismic hazard is computed for anextended region it is generally represented as a map.The hazard map is commonly computed for a constantprobability level (10%, 5% or 2%) and a given timewindow (50 years). It represents the spatial variation ofthe peak ground acceleration (expressed in percentageof gravity g) to be exceeded in the given period withthe chosen probability level.Earthquake early warning systems can provide a meanfor the evaluation of real-time hazard maps whichevolve with time, as new information about source lo-cation, magnitude and predicted peak ground motionparameters are available soon after the earthquake oc-currence.
Seismic sensors Instruments used to record the groundvibration produced by natural and artificial sources,generally denoted as seismometers. A seismometermeasures the relative motion between its frame anda suspended mass. Early seismometers used optics, ormotion-amplifying mechanical linkages. The motionwas recorded as scratches on smoked glass, or expo-sures of light beams on photographic paper. Inmodern
Earthquake Early Warning System in Southern Italy E 2397
instruments the proof mass is held motionless by anelectronic negative feedback loop that drives a coil. Thedistance moved, speed and acceleration of the massare directly measured. Most modern seismometers arebroadband, working on a wide range of frequencies(0.01–100Hz). Another type of seismometer is a digitalstrong-motion seismometer, or accelerometer, whichmeasures soil acceleration. Due to its relatively highdynamic range, the accelerometer can record unsatu-rated strong amplitude signals at close distances froma large earthquake. This data is essential to understandhow an earthquake affects human structures.
Definition of the Subject
The origin of the term “early warning” probably goesback to the first decades of the last century. However, thefirst practical use of an “early warning” strategy was mil-itary and it was developed during the “cold war” yearsas a countermeasure to the potential threat from inter-continental ballistic missiles. The objective of these sys-tems was to give an alert to target areas as soon as a mis-sile was detected by a radar system or a launch was de-tected by a satellite system. In this context the term “leadtime” was defined as the time elapsing between the de-tection of the missile and the estimated impact on thetarget.
In the last decades the use of the term “early warn-ing” greatly expanded. It is used with small, but significant,variations in various types of risks, from epidemiological,to economic, social, and of course all the types of naturaland environmental risks.
In fact, in these contexts, including some natural riskssuch as hydro-geological and volcanic, the warning is notgiven at the onset of the catastrophic phenomenon, but af-ter the occurrence of some precursory phenomena whichcan trigger a catastrophic event (for instance intensiverainfall for hydrological risk, earthquakes and/or grounddeformation for volcanic risk). The main consequence ofthis difference is an increase in the probability of issuingfalse alarms.
The case of earthquake early warning is similar to mis-sile early warning. The alert is given after an earthquakeis detected by a network of seismometers. An earthquakeearly warning is based on the fact that most of the radiatedenergy is contained in the slower traveling phases ( S- andsurface waves traveling at about 3.5 km/s or less) which ar-rive at any location with a delay with respect to small am-plitude higher velocity phases (P-waves, travelling at about6–7 km/s) or to an electromagnetically transmitted (EM)signal giving the warning.
Introduction
Many regions in the world are affected by natural hazardssuch as earthquakes, tsunamis, volcanoes, floods, storms,landslides, etc., each of which can have devastating so-cio-economic impacts. Among these natural events, earth-quakes, have been among the most recurrent and dam-aging hazards during last few decades, resulting in largenumbers of casualties, and massive economic losses [30].
The problem of earthquake risk mitigation is faced us-ing different approaches, depending upon the time scalebeing considered. Whilst over time scales of decades it isof utmost importance that land use regulations and build-ing/infrastructure codes are continuously updated and im-proved, for time scales of a few years, the main risk mit-igation actions are at the level of information and edu-cation in order to increase individual and social commu-nity awareness about potentially damaging hazards. Overshorter time scales (months to hours), it would naturallybe of great benefit to society as a whole if the capability toaccurately predict the time, location and size of a poten-tially catastrophic natural event were available. However,due to the great complexity of the natural processes of con-cern, such predictions are currently not possible.
On the other hand, on very short time scales (secondsto minutes), new strategies for earthquake risk mitigationare being conceived and are under development world-wide, based on real-time information about natural eventsthat is provided by advanced monitoring infrastructures,denoted as “early warning systems”.
Regional and On-site EarlyWarning Systems
Earthquake Early Warning Systems (EEWS) are modern,real-time information systems that are able to providerapid notification of the potential damaging effects of animpending earthquake through the rapid telemetry andprocessing of data from dense instrument arrays deployedin the source region of the event of concern. Such systemsallow mitigating actions to be taken before strong shakingand can significantly shorten the time necessary for emer-gency response and the recovery of critical facilities suchas roads and communication lines.
Advances have been made towards the implementa-tion of operational systems in Japan, Taiwan, and Mex-ico using two different approaches, i. e., “regional warn-ing” and “onsite warning” [25]. A regional warning systemis based on a dense sensor network covering a portion orthe entire area that is threatened by earthquakes. The rel-evant source parameters (earthquake location and magni-tude) are estimated from the early portion of recorded sig-nals and are used to predict, with a quantified confidence,
2398 E Earthquake Early Warning System in Southern Italy
a ground motion intensity measure at a distant site wherea target structure of interest is located. Alternatively, “on-site warning” systems consist of a single sensor or an arrayof sensors deployed in the proximity of the target struc-ture that is to be alerted, and whose measurements on theinitial P-wave motion are used to predict the ensuing peakground motion (mainly related to the arrival of S and sur-face waves) at the same site.
Implementation of EarlyWarning Systems Worldwide
In Japan, since the 1965, the JNR (Japanese National Rail-way) has developed and operated the Urgent EarthquakeDetection and Alarm System (UrEDAS), which is an on-site warning system along the Shinkansen (bullet train)railway. UrEDAS is based on seismic stations deployedalong the Japanese Railway with an average distance of20 km. An alert is issued if the horizontal ground ac-celeration exceeds 40 cm/s2. In the 1996, the UrEDASwas combined with a new seismometer called “compactUrEDAS” [31,32,33].
On the other hand, for about one decade the JapaneseMeteorological Agency (JMA) has been developing andexperimenting with a mixed single station and networkbased early warning system to generate immediate alertsafter earthquakes with JMA Intensity greater than “lower5” (approximately M > 6) [24]. During a testing periodfrom February 2004 to July 2006, the JMA sent out 855earthquake early warnings, only 26 of which were recog-nized as false alarms [40]. On October 1, 2007 the broad-cast early warning system developed by the JapaneseMete-orological Agency (JMA) became operative. In this system,the first warning is issued 2 s after the first P phase detec-tion, if the maximum acceleration amplitude exceeds thethreshold of 100 cm/s2.
In the United States the first prototype of an earlywarning system was proposed by Bakun et al. [4] anddeveloped for mitigating earthquake effects in Califor-nia. It was designed to rapidly detect the Loma Prietaaftershocks and send an alert when the estimated mag-nitude was greater than 3.7, in order to reduce the riskof the crews working in the damaged area. The systemis composed of four components: ground motion sen-sors deployed in the epicentral area, a central receiver, ra-dio repeaters and radio receivers. The prototypical systemworked for 6months, during which time 19 events withM > 3:5 occurred, 12 alerts were issuedwith only 2missedtriggers and 1 false alarm.
Based on pioneering work by Allen and Kanamori [2]seismologists across California are currently planningreal-time testing of earthquake early warning across the
state using the ElarmS (Earthquake Alarms Systems)methodology [1]. The approach uses a network of seismicinstruments to detect the first-arriving energy at the sur-face, the P-waves, and translate the information containedin these low amplitude waves into a prediction of the peakground shaking that follows.Wurman et al. [47] illustratedthe first implementation of ElarmS in an automated, non-interactive setting, and the results of 8months of non-in-teractive operation in northern California.
Since 1989, in Mexico, the civil association CIRES(Centro de Instrumentacion y REgistro Sismico) with thesupport of Mexico City Government Authorities, devel-oped and implemented the Mexican Seismic Alert System(SAS) [15]. The SAS is composed of (a) a seismic detec-tion network, 12 digital strong motion stations deployedalong 300 km of the Guerrero coast, (b) a dual commu-nication system: a VHF central radio relay station andthree UHF radio relay stations, (c) a central control systemwhich continuously controls the operational status of theseismic detection and communication system and, whenan event is detected, automatically determines the magni-tude and issues the alarm, and (d) a radio warning systemfor broadcast dissemination of the alarm to end users. Af-ter 11 years, the SAS system recorded 1373 events in theGuerrero coast, it issued 12 alerts in Mexico city, with onlyone false alarm.
In Taiwan, the Taiwan Central Weather Bureau(CWB) developed an early warning system based ona seismic network consisting of 79 strong motion sta-tions installed across Taiwan and covering an area of100 � 300 km2 [44]. Since 1995 the network has been ableto report event information (location, size, strong motionmap) within 1min after an earthquake occurrence [39].To reduce the report time, Wu and Teng [44] introducedthe concept of a virtual sub-network: as soon as an eventis triggered by at least seven stations, the signals comingfrom the stations less distant than 60 km from the esti-mated epicenter are used to characterize the event. Thissystem successfully characterized all the 54 events occurrdduring a test period of 7 months (December 2000 – June2001), with an average reporting time of 22 s.
In Europe, the development and testing of EEWS is be-ing carried out in several active seismic regions. Europe iscovered by numerous high-quality seismic networks, man-aged by national and European agencies, including somelocal networks specifically designed for seismic early warn-ing around, for example, Bucharest, Cairo, Istanbul andNaples.
In Turkey, an EEWS is operative, called PreSEIS (pre-seismic shaking), to provide rapid alert for Istanbul andsurrounding areas. It consists of 10 strong motion sta-
Earthquake Early Warning System in Southern Italy E 2399
tions located along the border of the Marmara sea alongan arc of about 100 km, close to the seismogenetic zone ofthe Great Marmara Fault Zone with real time data trans-mission to Kandilli-Oservatory [7,14]. An alarm is issuedwhen a threshold amplitude level is exceeded.
In Romania, the EEWS is based on three tri-axialstrong motion sensors deployed in the Vrancea area witha satellite communication link to the Romanian Data Cen-ter at NIEP in Bucharest [7,42]. The system is based onfirst P wave detection and prediction of the peak hor-izontal acceleration recorded in Bucharest, allowing fora warning time of about 25 s.
On 2006 the European Union launched the 3-yearproject SAFER (Seismic EarlyWarning for Europe), whichis a cooperative scientific program aimed at developingtechnological and methodological tools that exploit thepossibilities offered by real-time analysis of signals com-ing from these networks for a wide range of actions, per-formed over time intervals of a few seconds to some tensof minutes. The project includes the participation of 23 re-search groups from several countries of Europe. The pri-mary aim of SAFER is to develop tools that can be used bydisaster management authorities for effective earthquakeearly warning in Europe and, in particular, its densely pop-ulated cities.
The Development of an EarlyWarning Systemin Campania Region, Southern Italy
The present article is focused on the description of tech-nologies and methodologies developed for the EEWS un-der construction in southern Italy.
With about 6 million inhabitants, and a large num-ber of industrial plants, the Campania region (southernItaly), is a zone of high seismic risk, due to a moderate tolarge magnitude earthquake on active fault systems in theApenninic belt. The 1980,M D 6:9 Irpinia earthquake, themost recent destructive earthquake to occur in the region,caused more than 3000 causalities and major, widespreaddamage to buildings and infrastructure throughout the re-gion.
In the framework of an ongoing project financed bythe Regional Department of Civil Protection, a prototypesystem for seismic early and post-event warning is beingdeveloped and tested, based on a dense, wide dynamic seis-mic network under installation in the Apenninic belt re-gion (ISNet, Irpinia Seismic Network).
Considering an earthquake warning window rangingfrom tens of seconds before to hundred of seconds afteran earthquake, many public infrastructures and buildingsof strategic relevance (hospitals, gas pipelines, railways,
railroads, . . . ) in the Campania region can be consideredas potential EEWS target-sites for experimenting with in-novative technologies for data acquisition, processing andtransmission based on ISNet. The expected time delay tothese targets for the first energetic S wave train is around30 s at about 100 km from a crustal earthquake occurringin the source region. The latter is the typical time windowavailable for mitigating earthquake effects through earlywarning in the city of Naples (about 2 million inhabitants,including suburbs).
This article illustrates the system architecture and op-erating principles of the EEWS in the Campania region,focusing on its innovative technological and methodolog-ical aspects. These are relevant for a reliable real-time es-timation of earthquake location and magnitude which areused to predict, with quantified confidence, ground mo-tion intensity at a distant target site.
The system that we describe in this article uses an in-tegrated approach from real time determination of sourceparameters to estimation of expected losses.
This problem must be dealt in an evolutionary(i. e., time-dependent) and probabilistic framework whereprobability density functions (PDFs) for earthquake loca-tion, magnitude and attenuation parameters are combinedto perform a real-time probabilistic seismic hazard analy-sis.
Earthquake Potential and Seismic Riskin the Campania Region
The southern Apennines are an active tectonic region ofItaly that accommodates the differential motions betweenthe Adria and Tyrrhenian microplates [23]. The major-ity of the seismicity in this region can be ascribed to thismotion. These earthquakes mainly occur in a narrow beltalong the Apennine chain and are associated with youngfaults, with lengths ranging from 30 to 50 km, and mainlyconfined to the upper 20 km of the crust [28,41].
Recent stress and seismic data analyzed by [29] usingearthquake locations and fault mechanisms show that thesouthern Apennines are characterized by an extensionalstress regime and normal-fault earthquakes. However, theoccurrence of recent (e. g., 5 May, 1990, Potenza, M 5.4;31 October – 1 November, 2002, Molise, M 5.4) and his-toric (e. g., 5 December, 1456, M 6.5) earthquakes do notexclude other mechanisms such as strike-slip faulting.
There have been numerous large and disastrous eventsin the southern Apennines, including those which oc-curred in 1694, 1851, 1857 and 1930. The location of his-torical earthquakes retrieved from the CFTI (Catalogo deiForti Terremoti in Italia, Catalogue of Strong Earthquakes
2400 E Earthquake Early Warning System in Southern Italy
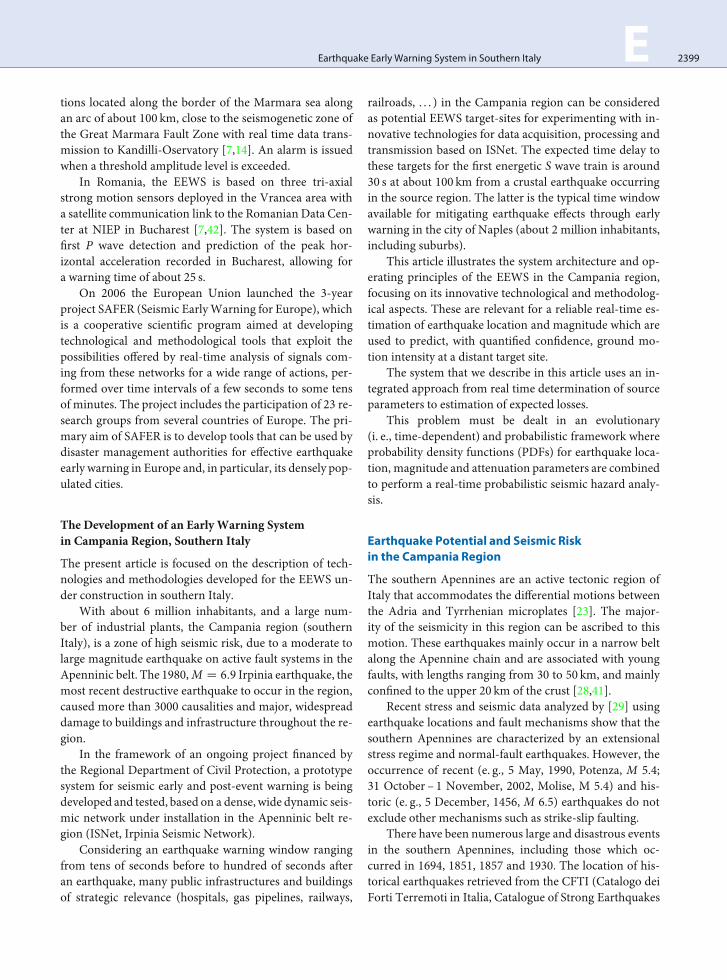
Earthquake Early Warning System in Southern Italy, Figure 1Location of the main historic earthquakes retrieved from the CFTI database using as region of interest that defined by the externalrectangle. The box dimensions are proportional to magnitude. The best constrained historic earthquakes are reported along withtheir date of occurrence
in Italy) database [6] is shown in Fig. 1. The most recentand well documented event is the complex normal-fault-ingM 6.9 Irpinia earthquake of 23 November, 1980 [5,43].
As recently indicated in the study by Cinti et al. [9],the southern Apennines has a high earthquake potentialwith an increasing probability of occurrence for M � 5:5earthquakes in the next decade. The new national haz-ard map (Gruppo di lavoro MPS, 2004), indicates that themain towns of the region fall in a high seismic hazard area,where it is expected that a peak ground acceleration valueranging between 0.15 and 0.25 g will be exceeded in 475years.
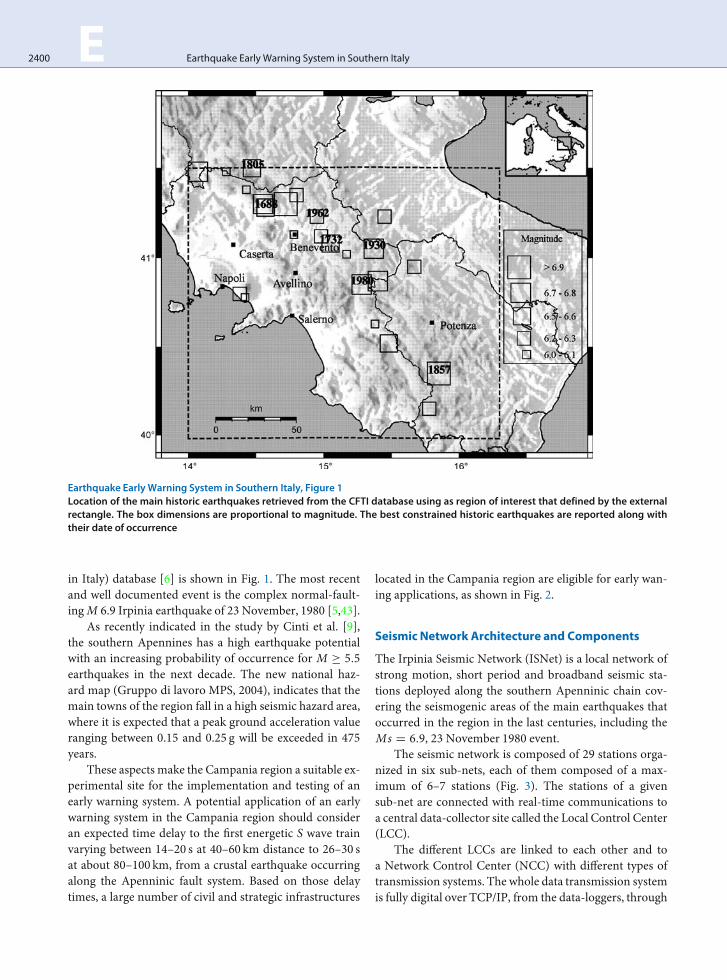
These aspects make the Campania region a suitable ex-perimental site for the implementation and testing of anearly warning system. A potential application of an earlywarning system in the Campania region should consideran expected time delay to the first energetic S wave trainvarying between 14–20 s at 40–60 km distance to 26–30 sat about 80–100 km, from a crustal earthquake occurringalong the Apenninic fault system. Based on those delaytimes, a large number of civil and strategic infrastructures
located in the Campania region are eligible for early wan-ing applications, as shown in Fig. 2.
Seismic Network Architecture and Components
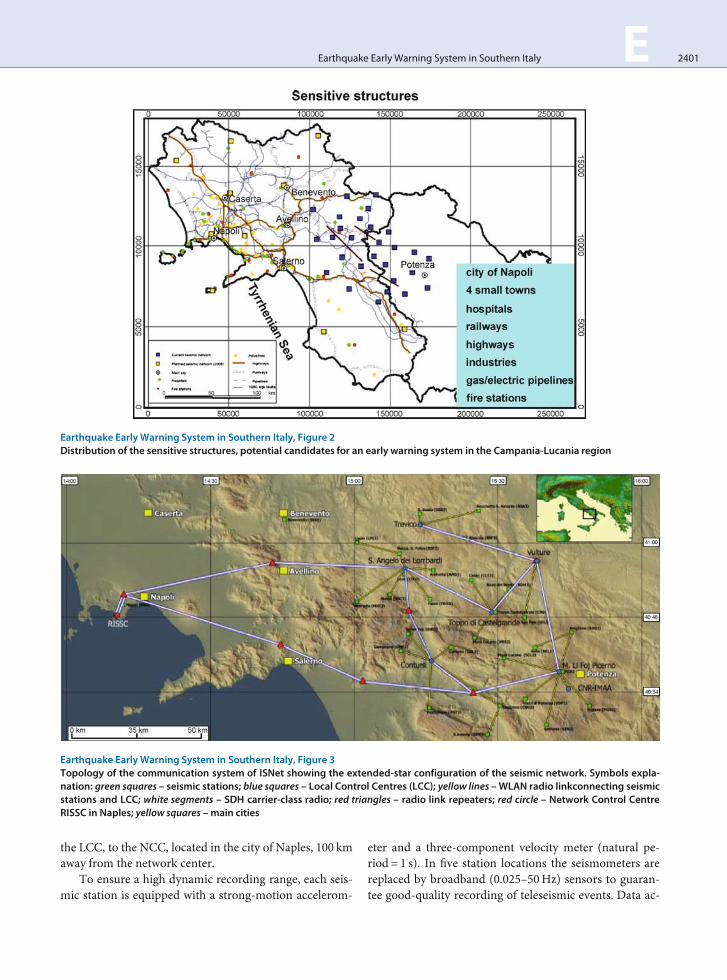
The Irpinia Seismic Network (ISNet) is a local network ofstrong motion, short period and broadband seismic sta-tions deployed along the southern Apenninic chain cov-ering the seismogenic areas of the main earthquakes thatoccurred in the region in the last centuries, including theMs D 6:9, 23 November 1980 event.
The seismic network is composed of 29 stations orga-nized in six sub-nets, each of them composed of a max-imum of 6–7 stations (Fig. 3). The stations of a givensub-net are connected with real-time communications toa central data-collector site called the Local Control Center(LCC).
The different LCCs are linked to each other and toa Network Control Center (NCC) with different types oftransmission systems. The whole data transmission systemis fully digital over TCP/IP, from the data-loggers, through
Earthquake Early Warning System in Southern Italy E 2401
Earthquake EarlyWarning System in Southern Italy, Figure 2Distribution of the sensitive structures, potential candidates for an early warning system in the Campania-Lucania region
Earthquake EarlyWarning System in Southern Italy, Figure 3Topology of the communication system of ISNet showing the extended-star configuration of the seismic network. Symbols expla-nation: green squares – seismic stations; blue squares – Local Control Centres (LCC); yellow lines – WLAN radio linkconnecting seismicstations and LCC; white segments – SDH carrier-class radio; red triangles – radio link repeaters; red circle – Network Control CentreRISSC in Naples; yellow squares – main cities
the LCC, to the NCC, located in the city of Naples, 100 kmaway from the network center.
To ensure a high dynamic recording range, each seis-mic station is equipped with a strong-motion accelerom-
eter and a three-component velocity meter (natural pe-riod = 1 s). In five station locations the seismometers arereplaced by broadband (0.025–50Hz) sensors to guaran-tee good-quality recording of teleseismic events. Data ac-
2402 E Earthquake Early Warning System in Southern Italy
quisition at the seismic stations is performed by the inno-vative data-logger Osiris-6, produced by Agecodagis sarl.The hardware/software characteristics of the system allowit to install self-developed routines to perform real timespecific analysis.
The data-loggers are remotely controlled througha configuration tool accessible via TCP/IP, managing sam-pling rate, gain, application of calibration signal to the re-sets of disks, GPS, etc. Furthermore, a complete stationhealth status is available, which helps in the diagnosis ofcomponent failure or data-logger malfunction. The data-loggers store the data locally or send it to each LCC wherethe real-time data management system Earthworm (devel-oped at USGS-United State Geological Survey) is operat-ing.
A calibration unit is installed at each seismic station toautomatically provide a periodic calibration signal to seis-mic sensors in order to verify the correct response curve ofthe overall acquisition chain.
The power supply of the seismic station is providedby two solar panels (120W peak, with 480Wh/day), two130Ah gel cell batteries, and a custom switching cir-cuit board between the batteries. With this configura-tion, 72-h autonomy is ensured for the seismic and ra-dio communication equipment. Each site is also equippedwith a GSM/GPRS programmable control/alarm systemconnected to several environmental sensors and throughwhich the site status is known in real time. With SMS(Short Message Service) and through the programmable
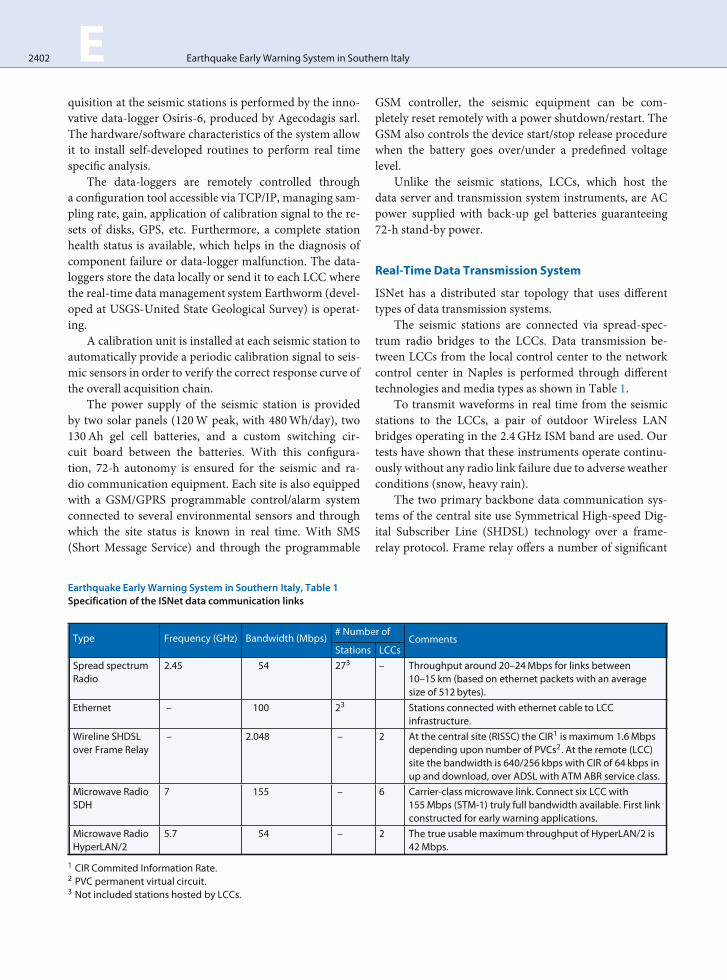
Earthquake Early Warning System in Southern Italy, Table 1Specification of the ISNet data communication links
Type Frequency (GHz) Bandwidth (Mbps)# Number of
CommentsStations LCCs
Spread spectrumRadio
2.45 54 273 – Throughput around 20–24Mbps for links between10–15 km (based on ethernet packets with an averagesize of 512 bytes).
Ethernet – 100 23 Stations connected with ethernet cable to LCCinfrastructure.
Wireline SHDSLover Frame Relay
– 2.048 – 2 At the central site (RISSC) the CIR1 is maximum 1.6Mbpsdepending upon number of PVCs2. At the remote (LCC)site the bandwidth is 640/256 kbps with CIR of 64 kbps inup and download, over ADSL with ATM ABR service class.
Microwave RadioSDH
7 155 – 6 Carrier-class microwave link. Connect six LCC with155Mbps (STM-1) truly full bandwidth available. First linkconstructed for early warning applications.
Microwave RadioHyperLAN/2
5.7 54 – 2 The true usable maximum throughput of HyperLAN/2 is42Mbps.
1 CIR Commited Information Rate.2 PVC permanent virtual circuit.3 Not included stations hosted by LCCs.
GSM controller, the seismic equipment can be com-pletely reset remotely with a power shutdown/restart. TheGSM also controls the device start/stop release procedurewhen the battery goes over/under a predefined voltagelevel.
Unlike the seismic stations, LCCs, which host thedata server and transmission system instruments, are ACpower supplied with back-up gel batteries guaranteeing72-h stand-by power.
Real-Time Data Transmission System
ISNet has a distributed star topology that uses differenttypes of data transmission systems.
The seismic stations are connected via spread-spec-trum radio bridges to the LCCs. Data transmission be-tween LCCs from the local control center to the networkcontrol center in Naples is performed through differenttechnologies and media types as shown in Table 1.
To transmit waveforms in real time from the seismicstations to the LCCs, a pair of outdoor Wireless LANbridges operating in the 2.4GHz ISM band are used. Ourtests have shown that these instruments operate continu-ously without any radio link failure due to adverse weatherconditions (snow, heavy rain).
The two primary backbone data communication sys-tems of the central site use Symmetrical High-speed Dig-ital Subscriber Line (SHDSL) technology over a frame-relay protocol. Frame relay offers a number of significant
Earthquake Early Warning System in Southern Italy E 2403
benefits over analogue and digital point-to-point leasedlines. With the latter, each LCC requires a dedicated cir-cuit between the LCCs and NCC. Instead, the SHDSLframe relay is a packet-switched network, which allowsa site to use a single frame-relay phone circuit to com-municate with multiple remote sites through the use ofpermanent virtual circuits. With virtual circuits, each re-mote site is seen as part of a single private LAN, simplify-ing IP address scheme maintenance and station monitor-ing.
Each seismic site has a real-time data flow of 18.0 kbps(at 125Hz sampling rate for each physical channel), andthe overall data communication bandwidth that is neededis around 540 kbps for 30 stations. ISNet supports thisthroughput under the worst conditions seen and it hasbeen designed to guarantee further developments, such asthe addition of further seismic or environmental sensors,without the need for larger economic and technological in-vestment.
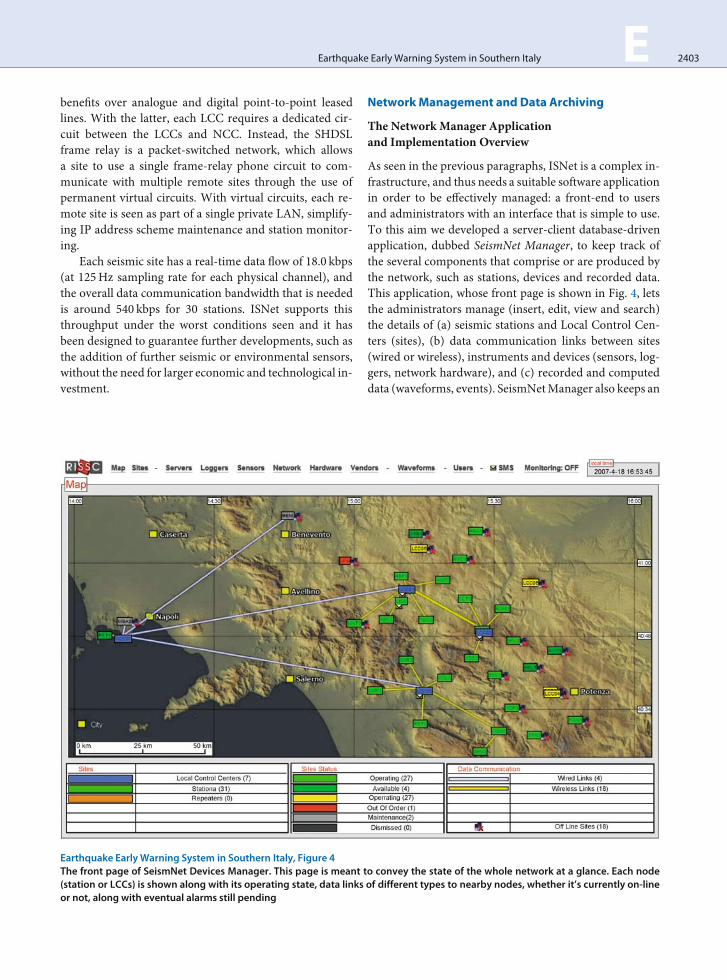
Earthquake EarlyWarning System in Southern Italy, Figure 4The front page of SeismNet Devices Manager. This page is meant to convey the state of the whole network at a glance. Each node(station or LCCs) is shown along with its operating state, data links of different types to nearby nodes, whether it’s currently on-lineor not, along with eventual alarms still pending
NetworkManagement and Data Archiving
The Network Manager Applicationand Implementation Overview
As seen in the previous paragraphs, ISNet is a complex in-frastructure, and thus needs a suitable software applicationin order to be effectively managed: a front-end to usersand administrators with an interface that is simple to use.To this aim we developed a server-client database-drivenapplication, dubbed SeismNet Manager, to keep track ofthe several components that comprise or are produced bythe network, such as stations, devices and recorded data.This application, whose front page is shown in Fig. 4, letsthe administrators manage (insert, edit, view and search)the details of (a) seismic stations and Local Control Cen-ters (sites), (b) data communication links between sites(wired or wireless), instruments and devices (sensors, log-gers, network hardware), and (c) recorded and computeddata (waveforms, events). SeismNetManager also keeps an

2404 E Earthquake Early Warning System in Southern Italy
historical record of the installations and configurations ofthe above elements.
All of the mentioned components are handled byleveraging an instrumental database, a flexible reposi-tory of information that was implemented by using Post-greSQL, a robust and feature-rich Database ManagementSystem available as open source.
The Instrumental Database
The instrumental database is a web-oriented applicationtool where, at the top level, the network is modeled asa set of sites, with installed loggers, sensors, data acqui-sition servers, network hardware and generic hardware,
Earthquake Early Warning System in Southern Italy, Figure 5The page relative to a seismic station. This page is a collection of all the pieces of information linked to a particular site: locationdetails and map; some pictures and notes; recently received warning messages; currently installed devices and their configurationsand mutual connections; data links to other stations; most recent waveforms recorded. Every device at a site also has an associatedinstallation object, that records the configuration parameters and the physical connections to other nearby devices, valid over a pe-riod of time. Some elements, such as the data storage servers and the loggers, also need some further configuration parameters,that are independent of their actual physical installation, for things like firmware release and versions of the software packages run
in a given configuration. Each of the mentioned entitiesis mirrored by a different class of objects in the database,where the relevant details are stored and then presented tothe users as interactive web pages. As an example, see thepage for a typical seismic station in Fig. 5.
The instrumental database was implemented witha layer of abstraction that lets one easily to perform com-plex queries and hides the actual implementation detailsof the underlying structure to a possible client. Thereare both stored procedures, i. e., functions that performcomplex tasks given simple inputs, and views, i. e., virtualdatabase tables that collect the most important pieces ofinformation about an abject, physically scattered in manytables, in a single place andmake it possible to easily query,
Earthquake Early Warning System in Southern Italy E 2405
for example, for all the details of the correctly operatingsensors installed one year ago at stations with a workingwireless link to a given LCC server.
This abstract interface makes the devices databasea central repository for effectively cross-correlating theseismic data recorded at any given place and time with thedetails of the instrument(s) that recorded them, and theconfiguration details of the systems that ultimately madethem available. The interface approach also makes it eas-ier to change the implementation details without the needto update the web application, or any external client proce-dures that need to interact with the instrumental database.
Automatic Monitoring of the Devicesand Automatic Data Retrieval
All of the details about the network described so far areprovided by the administrators of the system and areman-ually updated every time the configuration of somethingin the network changes, e. g., after installing a new sensoror replacing some faulty hardware at a station. This man-
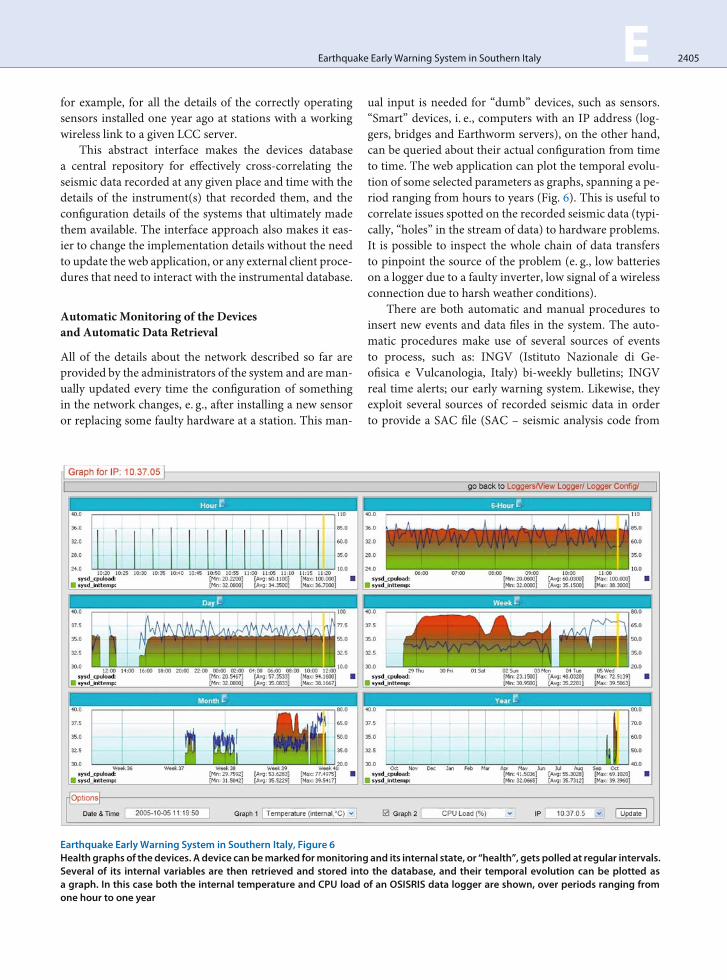
Earthquake EarlyWarning System in Southern Italy, Figure 6Health graphs of thedevices. A device canbemarked formonitoring and its internal state, or “health”, gets polled at regular intervals.Several of its internal variables are then retrieved and stored into the database, and their temporal evolution can be plotted asa graph. In this case both the internal temperature and CPU load of an OSISRIS data logger are shown, over periods ranging fromone hour to one year
ual input is needed for “dumb” devices, such as sensors.“Smart” devices, i. e., computers with an IP address (log-gers, bridges and Earthworm servers), on the other hand,can be queried about their actual configuration from timeto time. The web application can plot the temporal evolu-tion of some selected parameters as graphs, spanning a pe-riod ranging from hours to years (Fig. 6). This is useful tocorrelate issues spotted on the recorded seismic data (typi-cally, “holes” in the stream of data) to hardware problems.It is possible to inspect the whole chain of data transfersto pinpoint the source of the problem (e. g., low batterieson a logger due to a faulty inverter, low signal of a wirelessconnection due to harsh weather conditions).
There are both automatic and manual procedures toinsert new events and data files in the system. The auto-matic procedures make use of several sources of eventsto process, such as: INGV (Istituto Nazionale di Ge-ofisica e Vulcanologia, Italy) bi-weekly bulletins; INGVreal time alerts; our early warning system. Likewise, theyexploit several sources of recorded seismic data in orderto provide a SAC file (SAC – seismic analysis code from
2406 E Earthquake Early Warning System in Southern Italy
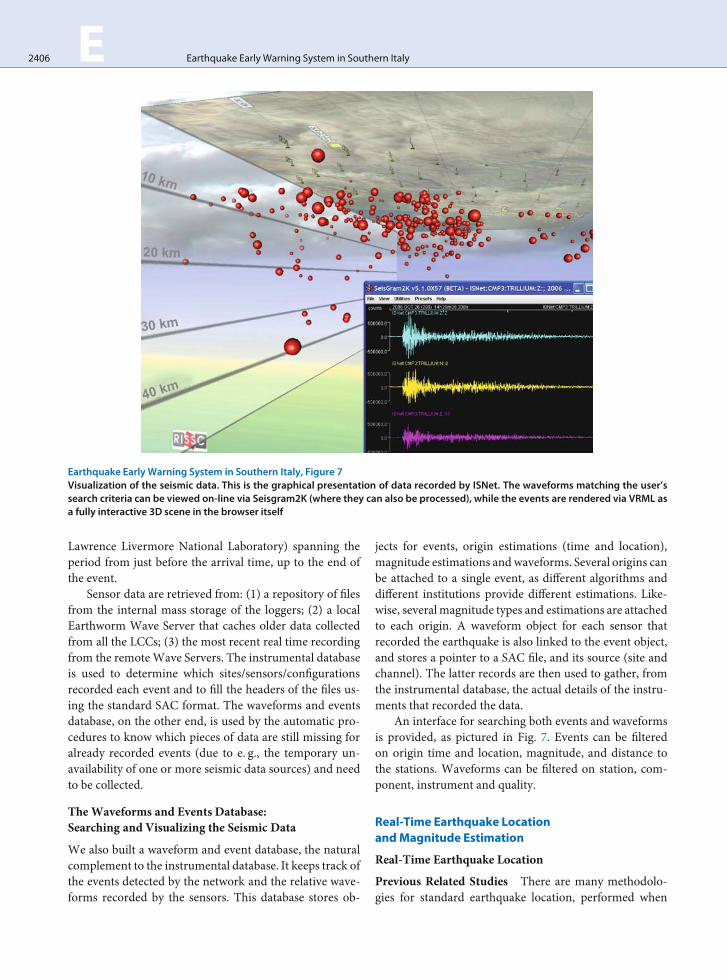
Earthquake Early Warning System in Southern Italy, Figure 7Visualization of the seismic data. This is the graphical presentation of data recorded by ISNet. The waveforms matching the user’ssearch criteria can be viewed on-line via Seisgram2K (where they can also be processed), while the events are rendered via VRML asa fully interactive 3D scene in the browser itself
Lawrence Livermore National Laboratory) spanning theperiod from just before the arrival time, up to the end ofthe event.
Sensor data are retrieved from: (1) a repository of filesfrom the internal mass storage of the loggers; (2) a localEarthworm Wave Server that caches older data collectedfrom all the LCCs; (3) the most recent real time recordingfrom the remoteWave Servers. The instrumental databaseis used to determine which sites/sensors/configurationsrecorded each event and to fill the headers of the files us-ing the standard SAC format. The waveforms and eventsdatabase, on the other end, is used by the automatic pro-cedures to know which pieces of data are still missing foralready recorded events (due to e. g., the temporary un-availability of one or more seismic data sources) and needto be collected.
TheWaveforms and Events Database:Searching and Visualizing the Seismic Data
We also built a waveform and event database, the naturalcomplement to the instrumental database. It keeps track ofthe events detected by the network and the relative wave-forms recorded by the sensors. This database stores ob-
jects for events, origin estimations (time and location),magnitude estimations and waveforms. Several origins canbe attached to a single event, as different algorithms anddifferent institutions provide different estimations. Like-wise, severalmagnitude types and estimations are attachedto each origin. A waveform object for each sensor thatrecorded the earthquake is also linked to the event object,and stores a pointer to a SAC file, and its source (site andchannel). The latter records are then used to gather, fromthe instrumental database, the actual details of the instru-ments that recorded the data.
An interface for searching both events and waveformsis provided, as pictured in Fig. 7. Events can be filteredon origin time and location, magnitude, and distance tothe stations. Waveforms can be filtered on station, com-ponent, instrument and quality.
Real-Time Earthquake LocationandMagnitude Estimation
Real-Time Earthquake Location
Previous Related Studies There are many methodolo-gies for standard earthquake location, performed when
Earthquake Early Warning System in Southern Italy E 2407
most or all the phase arrival times for an event are avail-able. Standard analysis techniques are generally not suitedfor early warning applications, since they typically needthe seismic event to be fully recorded at several stations,leaving little or no lead time for the warning [25]. For thisreason, a different strategy is required, where the compu-tation starts when a few seconds of data and a small num-ber of recording stations are available, and the results areupdated with time.
Previous work on earthquake location for early warn-ing includes several approaches to gain constraints on thelocation at an earlier time and with fewer observationsthan for standard earthquake location.
In the ElarmS methodology [47], when the first sta-tion triggers, the event is temporarily located beneath thatstation; after a second station trigger the location movesto a point between the two stations, based on the timingof the arrivals; with three or more triggered arrivals, theevent location and origin time is estimated using trilatera-tion and a grid search algorithm.
Horiuchi et al. [18] combine standard L2–norm eventlocation, equal differential-time (EDT) location on quasi-hyperbolic surfaces, and the information from not-yet ar-rived data to constrain the event location beginning whenthere are triggered arrivals from two stations. The two ar-rivals times define a hyperbolic surface, which containsthe event location. This solution is further constrained byEDT surfaces constructed using the current time (tnow) asa substitute for future, unknown arrival times at the sta-tions, which have not yet recorded arrivals. The constraintincreases as tnow progresses, even if no further stationsrecord an arrival.
Rydelek and Pujol [36], applying the approach of Ho-riuchi et al. [18], show that useful constraints on an eventlocation can be obtained with only two triggered stations.Cua andHeaton [12], generalized the approach by Rydelekand Pujol in order to start the location with one single trig-gering station.
The real-time location technique described in this pa-per is based on the equal differential-time (EDT) for-mulation [16,27] for standard earthquake location. TheEDT location is given by the point traversed by the max-imum number of quasi-hyperbolic surfaces, on each ofwhich the difference in calculated travel-time to a pairof stations is equal to the difference in observed arrivaltimes for the two stations. The EDT location determina-tion is independent of origin time and reduces to a 3Dsearch over latitude, longitude and depth. Furthermore,EDT is highly robust in the presence of outliers in thedata [27]. This robustness is critical for the problem ofearthquake location for seismic early warning, since we
will often work with small numbers of data and mayhave outlier data such as false triggers, picks from otherevents, and misidentified picks from energetic, secondaryphases.
Assuming that a dense seismic network is deployedaround the fault zone, we define as the “evolutionary ap-proach” a type of analysis where the estimates of earth-quake location and size, and their associated uncertainty,evolve with time as a function of the number of recordingstations and of the length of the portion of signal recordedat each station.
A direct implication of the evolutionary strategy is thateach algorithm must be capable of real-time operation,i. e., its computational time must be smaller than the rateat which data enters the system.
Furthermore, since each algorithm starts processinga limited amount of information, the estimated earthquakeparameter must be provided, at each time step, as a prob-ability density function (PDF) which incorporates in itsdefinition the uncertainties related both to the model em-ployed and to the available data.
The Real-Time Earthquake Location Method Themethodology is related to that of Horiuchi et al. [18],which has been extended and generalized by (a) startingthe location procedure after only one station has triggered,(b) using the equal differential-time approach proposed byFont [16] to incorporate the triggered arrivals and the not-yet-triggered stations, (c) estimating the hypocenter prob-abilistically as a PDF instead of as a point, and (d) applyinga full, non-linearized, global-search for each update of thelocation estimate.
We assume that a seismic network has known sets ofoperational and non-operational stations (Fig. 8a), thatwhen an earthquake occurs, triggers (first P-wave arrivalpicks) will become available from some of the operationalstations, and that there may be outlier triggers whichare not due to P arrivals from the earthquake of inter-est.
Let’s denote the operational stations as (S0; : : :; SN ),and consider a gridded search volume V containing thenetwork and target earthquake source regions, and thetravel times from each station to each grid point (i; j; k)in V computed for a given velocity model.
The standard EDT approach states that, if thehypocenter (i; j; k) is exactly determined, then the differ-ence between the observed arrival times tn and tm at twostations Sn and Sm is equal to the difference between calcu-lated travel times ttn and ttm at the hypocentral position,since the observed arrival times share the common earth-quake origin time. In other words, the hypocenter must
2408 E Earthquake Early Warning System in Southern Italy
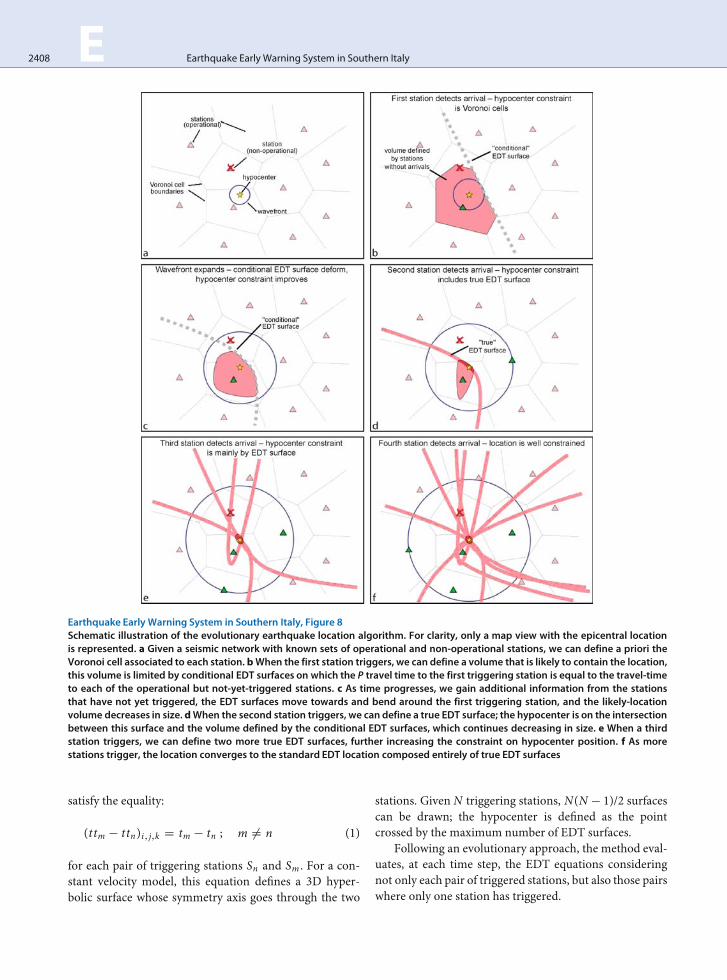
Earthquake Early Warning System in Southern Italy, Figure 8Schematic illustration of the evolutionary earthquake location algorithm. For clarity, only a map view with the epicentral locationis represented. a Given a seismic network with known sets of operational and non-operational stations, we can define a priori theVoronoi cell associated to each station. bWhen the first station triggers, we can define a volume that is likely to contain the location,this volume is limited by conditional EDT surfaces on which the P travel time to the first triggering station is equal to the travel-timeto each of the operational but not-yet-triggered stations. c As time progresses, we gain additional information from the stationsthat have not yet triggered, the EDT surfaces move towards and bend around the first triggering station, and the likely-locationvolume decreases in size. dWhen the second station triggers, we can define a true EDT surface; the hypocenter is on the intersectionbetween this surface and the volume defined by the conditional EDT surfaces, which continues decreasing in size. e When a thirdstation triggers, we can define two more true EDT surfaces, further increasing the constraint on hypocenter position. f As morestations trigger, the location converges to the standard EDT location composed entirely of true EDT surfaces
satisfy the equality:
(ttm � ttn)i; j;k D tm � tn ; m ¤ n (1)
for each pair of triggering stations Sn and Sm . For a con-stant velocity model, this equation defines a 3D hyper-bolic surface whose symmetry axis goes through the two
stations. Given N triggering stations, N(N � 1)/2 surfacescan be drawn; the hypocenter is defined as the pointcrossed by the maximum number of EDT surfaces.
Following an evolutionary approach, the method eval-uates, at each time step, the EDT equations consideringnot only each pair of triggered stations, but also those pairswhere only one station has triggered.
Earthquake Early Warning System in Southern Italy E 2409
Therefore, when the first station, Sn , triggers with anarrival at tn D tnow (tnow is the current clock time), wecan already place some limit on the hypocenter position(Fig. 8b). These limits are given by EDT surfaces de-fined by the condition that each operational but not-yet-triggered station Sl will trigger in the next time instant,tl � tn . That is:
(ttl � ttn)i; j;k D tl � tn � 0 ; l ¤ n : (2)
On these conditional EDT surfaces, the P travel time tothe first triggering station ttn is equal to the travel-timeto each of the not-yet-triggered stations, ttl , l ¤ n. Thesesurfaces bound a volume (defined by the system of in-equalities) which must contain the hypocenter. In the caseof a homogeneous medium with constant P-wave speed,this hypocentral volume is the Voronoi cell around thefirst recording station, defined by the perpendicular bisec-tor surfaces with each of the immediate neighboring sta-tions.
As the current time tnow progresses, we gain the addi-tional information that the not-yet-triggered stations canonly trigger with tl > tnow. Thus the hypocentral volumeis bounded by conditional EDT surfaces that satisfy the in-equality:
(ttl � ttn)i; j;k � ıtn;l ; l ¤ n : (3)
ıt is the time interval between the arrival time at stationSn and the latest time for which we have information fromstation Sl ,
ıtn;l D tnow � tn ; (4)
where tn is the observed arrival time at station Sn .The system (3) defines the volume, bounded by the
conditional EDT surfaces, in which the hypocenter maybe located given that, at current time tnow, only the stationSn has triggered. When ıt D 0 the system (3) reduces tothe system (2); for ıt > 0, the hypocentral volume will besmaller than the previous one, since the updated, condi-tional EDT surfaces tend to fold towards and around thefirst triggered station (Fig. 8c).
We interpret the hypocentral volume in a probabilis-tic way by defining, for each inequality in (3), a valuepn;l (i; j; k) which is 1 if the inequality is satisfied and 0if not. Then we sum the pn;l (i; j; k) over stations l at eachgrid point, obtaining a non-normalized probability densityP(i; j; k), where P(i; j; k) D N � 1 for grid points whereall the inequalities are satisfied and a value less than N � 1elsewhere.
When the second and later stations trigger, we firstre-evaluate the system (3) for all pairs of triggered sta-tions Sn and all not-yet-triggered stations Sl . Secondly, we
construct standard, true EDT surfaces (see Eq. 2) betweeneach pair Sn , Sm of the triggered stations, by evaluating foreach grid point the quantity:
qn;m(i; j; k) D exp
(
�[(ttn � ttm)i; j;k � (tn � tm)]2
2�2
)
;
n ¤ m :
(5)
The expression between square brackets at the exponent isthe standard EDT Eq. 2 whose solutions are quasi-hyper-bolic surfaces; in practice all true EDT surfaces are givena finite width by including the uncertainty � in the arrivaltime picking and the travel-time calculation.
The quantity qn;m(i; j; k) has values between 0 and1. We sum the qn;m(i; j; k) with the pn;l (i; j; k) obtainedfrom the re-evaluation of (4) to obtain a new P(i; j; k).
Starting from P, we define a value:
Q(i; j; k) D�P(i; j; k)Pmax
�N; (6)
which forms a relative probability density function (PDF,with values between 0 and 1) for the hypocenter locationwithin the grid cell (i; j; k). The function Q(i; j; k) may bearbitrarily irregular and may have multiple maxima.
At predetermined time intervals, we evaluate (3) and(5) to obtain Q(i; j; k) in the search volume, using the Oct-tree importance sampling algorithm ([13,27], http://www.alomax.net/nlloc/octtree). This algorithm uses recursivesubdivision and sampling of rectangular cells in 3D spaceto generate a cascade structure of sampled cells, such thatthe spatial density of sampled cells follows the target func-tion values. The Oct-tree search is much faster than a sim-ple or nested grid search (factor 10–100 faster) and moreglobal and complete than stochastic search methods al-gorithms such as simulated annealing and genetic algo-rithms [13]. For each grid point, an origin time estimatecan be obtained from the observed arrival times and thecalculated travel times.
As more stations trigger, the number of not-yet-trig-gered stations becomes small, and the location convergestowards the hypocentral volume that is obtainedwith stan-dard EDT location using the full set of data from all oper-ational stations (Fig. 8d–f).
If there are uncorrelated outlier data (i. e., triggersthat are not compatible with P arrivals from a hypocen-ter within or near the network), then the final hypocen-tral volume will usually give an unbiased estimate ofthe hypocentral location, as with standard EDT location.
2410 E Earthquake Early Warning System in Southern Italy
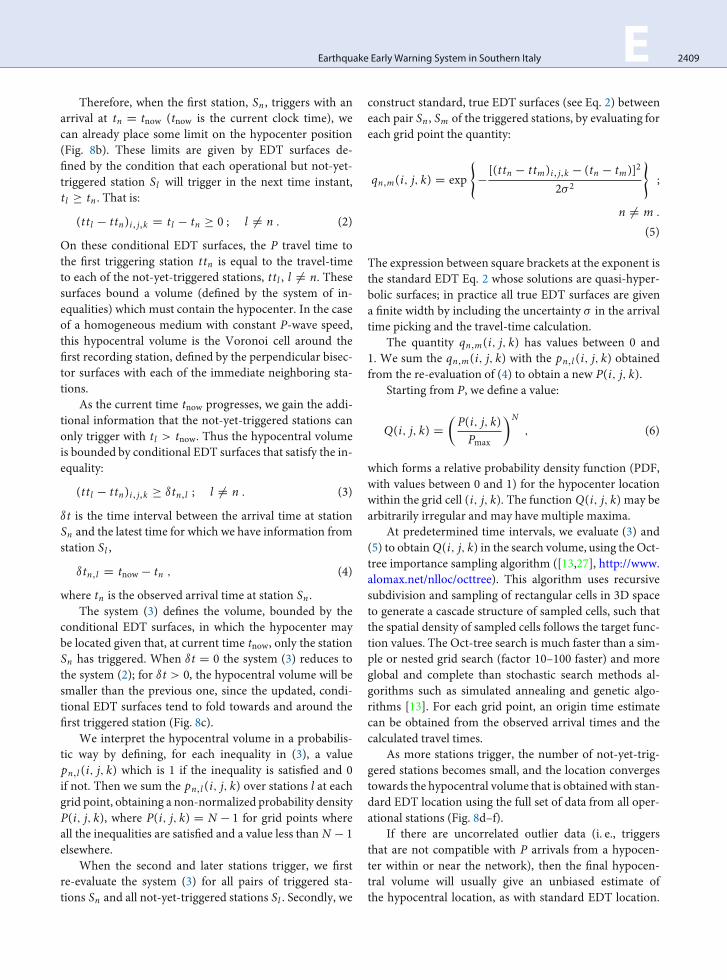
Earthquake Early Warning System in Southern Italy, Figure 9Location test for a synthetic event occurring at the center of the Irpinia Seismic Network (ISNet). The three orthogonal views showmarginal values of the probability function Q(i; j; k). The true hypocenter is identified by a star. ıt is the time from the first trigger,t is the time from event origin. For each snapshot, stations that have triggered aremarked with a circle
However, if one or more of the first arrival times is an out-lier, then the earliest estimates of the hypocentral volumemay be biased. Synthetic tests have shown that, if Nout isthe number of outlier data, the bias reduces significantlyafter about 4C Nout arrivals have been obtained, and then
decreases further with further arrivals, as the solution con-verges towards a standard EDT location [37].
We performed several synthetic tests using the geom-etry of the ISNet network. For each simulated event, wecomputed theoretical arrival picks using travel times ob-
Earthquake Early Warning System in Southern Italy E 2411
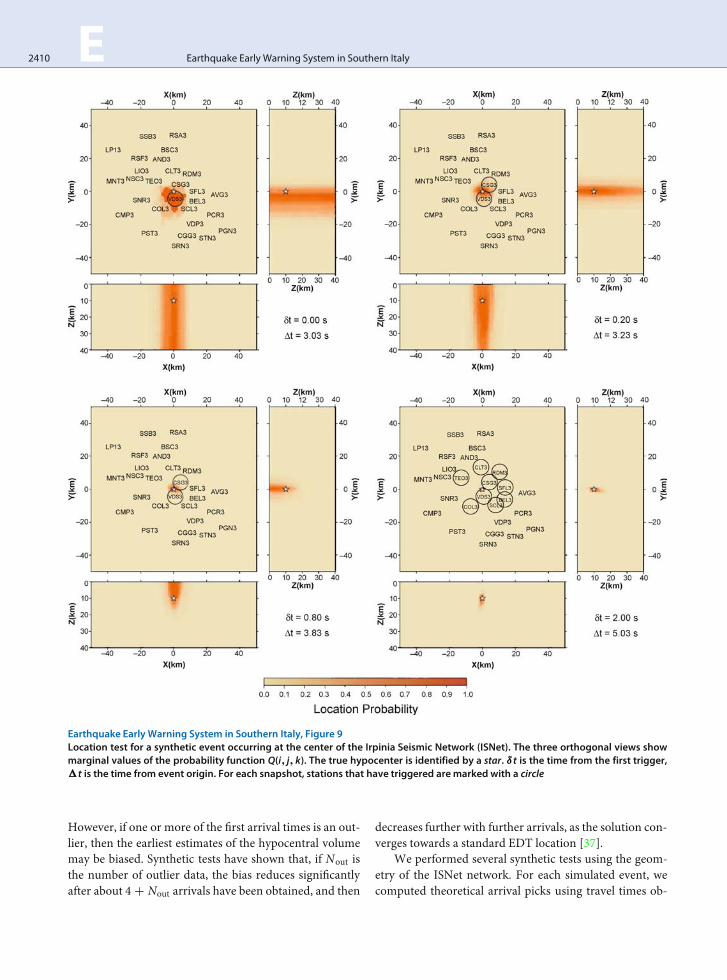
Earthquake EarlyWarning System in Southern Italy, Figure 10Location test for a synthetic event occurring outside the ISNet network (see Fig. 9 for explanation)
tained by the finite difference solution of the eikonal equa-tion [35] for a 1D, P-wave velocity model. To reproduceuncertainties introduced by the picking algorithm, we addto each arrival time a random error following a Gaussiandistribution with a variance of 0.02 s.
Here we use only P picks since currently most net-works have poor capability to perform real-time S pick-
ing. Our tests consider an earthquake occurring at the cen-ter of the network at a depth of 10 km (Fig. 9) and anearthquake occurring outside the network at a depth of10 km (Fig. 10). Each panel in Figs. 9 and 10 is a snapshotat a given time showing the marginal map (i. e., summedover i, j or k) for Q(i; j; k) along the horizontal (x, y) andthe two vertical (x, z and y, z) planes. The star shows the
2412 E Earthquake Early Warning System in Southern Italy
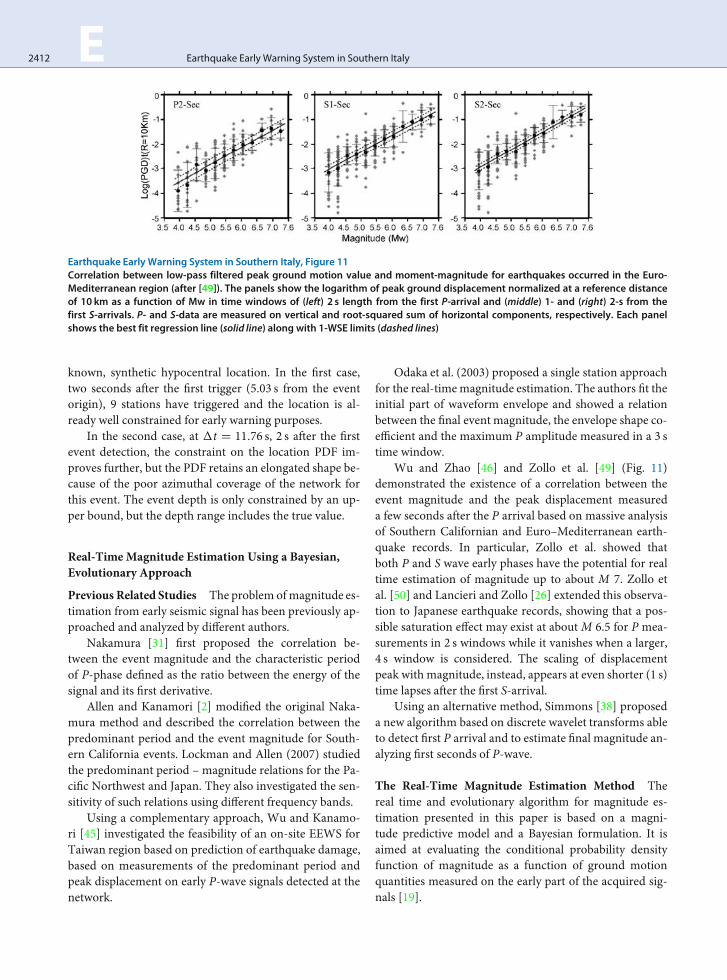
Earthquake Early Warning System in Southern Italy, Figure 11Correlation between low-pass filtered peak ground motion value and moment-magnitude for earthquakes occurred in the Euro-Mediterranean region (after [49]). The panels show the logarithm of peak ground displacement normalized at a reference distanceof 10 km as a function of Mw in time windows of (left) 2 s length from the first P-arrival and (middle) 1- and (right) 2-s from thefirst S-arrivals. P- and S-data are measured on vertical and root-squared sum of horizontal components, respectively. Each panelshows the best fit regression line (solid line) along with 1-WSE limits (dashed lines)
known, synthetic hypocentral location. In the first case,two seconds after the first trigger (5.03 s from the eventorigin), 9 stations have triggered and the location is al-ready well constrained for early warning purposes.
In the second case, at t D 11:76 s, 2 s after the firstevent detection, the constraint on the location PDF im-proves further, but the PDF retains an elongated shape be-cause of the poor azimuthal coverage of the network forthis event. The event depth is only constrained by an up-per bound, but the depth range includes the true value.
Real-Time Magnitude Estimation Using a Bayesian,Evolutionary Approach
Previous Related Studies The problem ofmagnitude es-timation from early seismic signal has been previously ap-proached and analyzed by different authors.
Nakamura [31] first proposed the correlation be-tween the event magnitude and the characteristic periodof P-phase defined as the ratio between the energy of thesignal and its first derivative.
Allen and Kanamori [2] modified the original Naka-mura method and described the correlation between thepredominant period and the event magnitude for South-ern California events. Lockman and Allen (2007) studiedthe predominant period – magnitude relations for the Pa-cific Northwest and Japan. They also investigated the sen-sitivity of such relations using different frequency bands.
Using a complementary approach, Wu and Kanamo-ri [45] investigated the feasibility of an on-site EEWS forTaiwan region based on prediction of earthquake damage,based on measurements of the predominant period andpeak displacement on early P-wave signals detected at thenetwork.
Odaka et al. (2003) proposed a single station approachfor the real-timemagnitude estimation. The authors fit theinitial part of waveform envelope and showed a relationbetween the final event magnitude, the envelope shape co-efficient and the maximum P amplitude measured in a 3 stime window.
Wu and Zhao [46] and Zollo et al. [49] (Fig. 11)demonstrated the existence of a correlation between theevent magnitude and the peak displacement measureda few seconds after the P arrival based on massive analysisof Southern Californian and Euro–Mediterranean earth-quake records. In particular, Zollo et al. showed thatboth P and S wave early phases have the potential for realtime estimation of magnitude up to about M 7. Zollo etal. [50] and Lancieri and Zollo [26] extended this observa-tion to Japanese earthquake records, showing that a pos-sible saturation effect may exist at aboutM 6.5 for P mea-surements in 2 s windows while it vanishes when a larger,4 s window is considered. The scaling of displacementpeak with magnitude, instead, appears at even shorter (1 s)time lapses after the first S-arrival.
Using an alternative method, Simmons [38] proposeda new algorithm based on discrete wavelet transforms ableto detect first P arrival and to estimate final magnitude an-alyzing first seconds of P-wave.
The Real-Time Magnitude Estimation Method Thereal time and evolutionary algorithm for magnitude es-timation presented in this paper is based on a magni-tude predictive model and a Bayesian formulation. It isaimed at evaluating the conditional probability densityfunction of magnitude as a function of ground motionquantities measured on the early part of the acquired sig-nals [19].
Earthquake Early Warning System in Southern Italy E 2413
The predictive models are empirical relationshipswhich correlate the final event magnitude with the loga-rithm of quantities measured on first 2–4 s of record.
The first prediction model, based on the predominantperiod of P-phase (�P), has been introduced by Allen andKanamori [2]. Recently, Wu and Zhao [46] showed theexistence of a correlation between magnitude, distanceand peak displacement measured in a 2–4 s window af-ter P-phase.
Zollo et al. [49,50] refined this correlation and ex-tended the observation on the peaks measured in 2 s af-ter the S-phase arrival through the analysis of the Euro-pean and Japanese strong motion data-bases (Ambraseyset al. [3], K-NET www service of NIED – National Re-search Institute for Earth Science and Disaster Prevention,Japan).
The method therefore assumes that the linear relation-ship between the logarithm of the observed quantity andmagnitude is known, along with standard errors of thepredictive models.
At each time step t from the first station trigger, theconditional PDF of magnitudeM given the observed datavector d D fd1; d2; : : : ; dng is expressed via the Bayes the-orem as:
f (mjd) Df (djm) f (m)
R MMAXMMIN
f (djm) f (m)dM; (7)
where f (m) is the a priori distribution which incorpo-rates the information available before the experimentaldata are collected through a truncated exponential func-tional form, derived by the Gutenberg–Richter recurrencerelationship,
f (m) :
(ˇe�ˇm
e�ˇMmin�e�ˇMmax Mmin � m � Mmax
0 m … [Mmin;Mmax]; (8)
where fˇ;Mmin;Mmaxg depend on the seismic featuresand on the detection threshold of the seismic network ofthe considered region.
The conditional probability f (djm) contains all the in-formation concerning the magnitude as retrievable fromthe data acquired at time t.
Assuming that components of the observed data vec-tor d have a lognormal distribution, and that they arestochastically independent and identically distributed ran-dom variables of parameters �log(d) and �log(d), then thelikelihood is written as:
f (djm) D�Y
iD1
1p2��log(d)di
e� 1
2
�log(di )��log(d)
�log(d)
�2
; (9)
where � is the number of stations acquiring at the instant t;�log(d) and �log(d) are the mean and the standard deviationof the logs of di , respectively..
Substituting Eq. 8 and Eq. 9 into Eq. 7, f (mjd) re-sults as in Eq. 10 where it depends on data only troughP�
iD1 log(di ) and �, which therefore are jointly sufficientstatistics for the estimation of magnitude [21]:
f (mjd) D f
mj�X
iD1
log(di )
!
De
2�log(d)
�P
iD1log(di )
!
���2log(d)
!.22
log(d)e�ˇm
MMAXR
MMIN
e
2�log(d)
�P
iD1log(di )
!
���2log(d)
!.22
log(d)e�ˇmdM
:
(10)
As just outlined, f (mjd) depends onP�
iD1 log(di ) and onthe number of stations triggered, �, at the time of the esti-mation and, consequently, on the amount of informationavailable. Asmore stations are triggered, and providemoremeasures of d, the estimation improves.
The described technique is evolutionary in the sensethat f (mjd) depends on time, i. e., as time passes, ad-ditional stations provide new observations (predominantperiod and/or P-, S-peaks), which are used to refine theprobabilistic estimation of magnitude.
Magnitude Estimationfrom Peak Displacement Measurements
The empirical relationships between low-pass filtered, ini-tial P- and S-peak displacement amplitudes and momentmagnitude (e. g. [49]) can be used as predictive models forthe real-time estimation of magnitude using the Bayesianapproach described above.
While the P-wave onset is identified by an automaticpicking procedure, the S-onset can be estimated from anautomatic S-picking or from a theoretical prediction basedon the hypocentral distance given by the actual earthquakelocation. At a given time step after the first P-wave de-tection at the network, progressively refined estimates ofmagnitude are obtained from P- and S-peak displacementdata. These are preliminarily corrected for distance ampli-tude effects through an empirical attenuation relationshipobtained from available strong motion records [46,49]:
f (M; R) D Aphase C BphaseM C Cphase log(R) ; (11)
where the constants Aphase, Bphase and Cphase are deter-mined through a best-fit regression with a retrieved stan-dard error of SEPMR
phase and R is the hypocentral distance.
2414 E Earthquake Early Warning System in Southern Italy
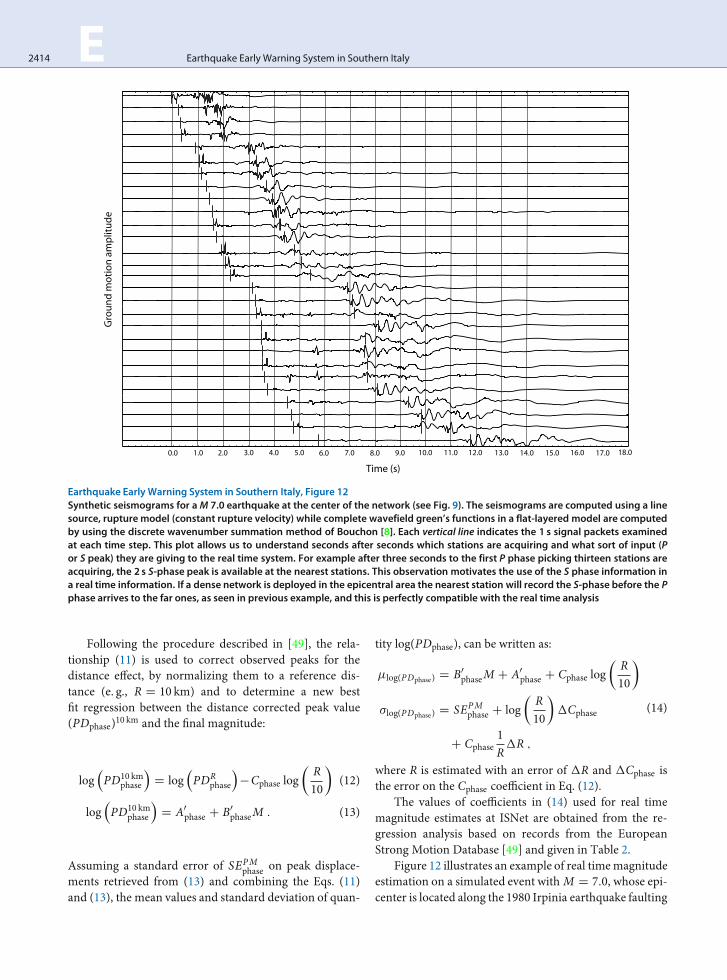
Earthquake Early Warning System in Southern Italy, Figure 12Synthetic seismograms for aM 7.0 earthquake at the center of the network (see Fig. 9). The seismograms are computed using a linesource, rupture model (constant rupture velocity) while complete wavefield green’s functions in a flat-layered model are computedby using the discrete wavenumber summation method of Bouchon [8]. Each vertical line indicates the 1 s signal packets examinedat each time step. This plot allows us to understand seconds after seconds which stations are acquiring and what sort of input (Por S peak) they are giving to the real time system. For example after three seconds to the first P phase picking thirteen stations areacquiring, the 2 s S-phase peak is available at the nearest stations. This observation motivates the use of the S phase information ina real time information. If a dense network is deployed in the epicentral area the nearest station will record the S-phase before the Pphase arrives to the far ones, as seen in previous example, and this is perfectly compatible with the real time analysis
Following the procedure described in [49], the rela-tionship (11) is used to correct observed peaks for thedistance effect, by normalizing them to a reference dis-tance (e. g., R D 10 km) and to determine a new bestfit regression between the distance corrected peak value(PDphase)10 km and the final magnitude:
logPD10 km
phase
�D log
PDR
phase
��Cphase log
�R10
�(12)
logPD10 km
phase
�D A0phase C B0phaseM : (13)
Assuming a standard error of SEPMphase on peak displace-
ments retrieved from (13) and combining the Eqs. (11)and (13), the mean values and standard deviation of quan-
tity log(PDphase), can be written as:
�log(PDphase) D B0phaseM C A0phase C Cphase log�R10
�
�log(PDphase) D SEPMphase C log
�R10
�Cphase
C Cphase1RR ;
(14)
where R is estimated with an error of R and Cphase isthe error on the Cphase coefficient in Eq. (12).
The values of coefficients in (14) used for real timemagnitude estimates at ISNet are obtained from the re-gression analysis based on records from the EuropeanStrong Motion Database [49] and given in Table 2.
Figure 12 illustrates an example of real timemagnitudeestimation on a simulated event with M D 7:0, whose epi-center is located along the 1980 Irpinia earthquake faulting
Earthquake Early Warning System in Southern Italy E 2415
Earthquake EarlyWarning System in Southern Italy, Table 2Coefficients of the empirical regression relationships betweenlow-pass filtered P and S displacement peaks andmagnitude
Phase A0phase B0phase Cphase SEPMphase �Cphase2P –6.31 0.70 –1.05 0.22 0.302S –5.77 0.71 –0.71 0.13 0.16
system. Synthetic seismogramshave been computed by us-ing the discrete wave-number method of Bouchon [8] andCoutant (1989) for a extended source model in a flat-lay-ered velocity model.
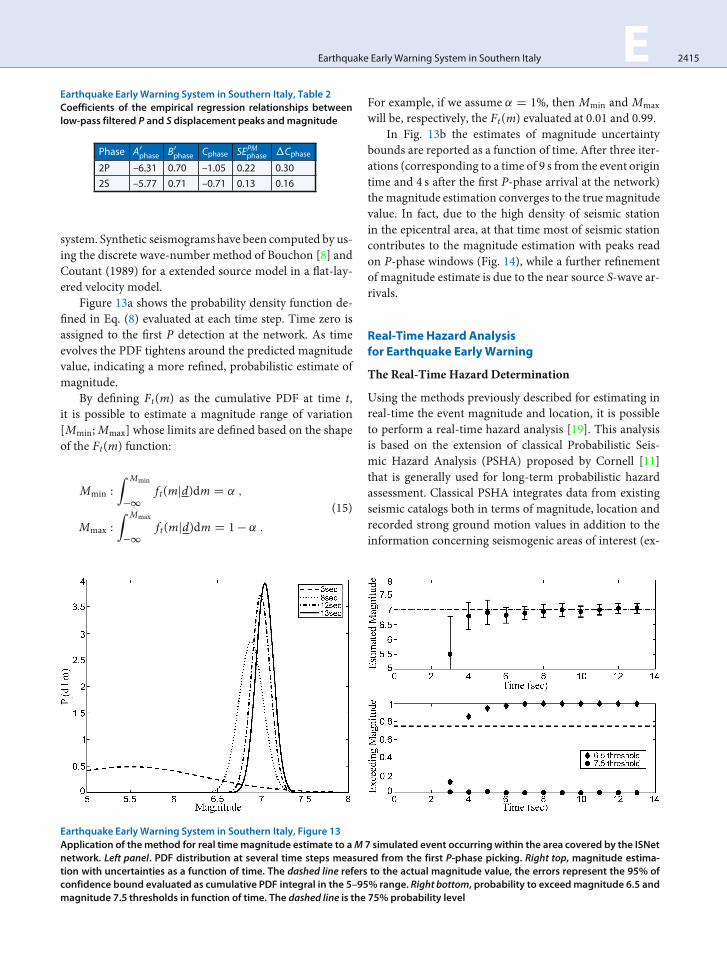
Figure 13a shows the probability density function de-fined in Eq. (8) evaluated at each time step. Time zero isassigned to the first P detection at the network. As timeevolves the PDF tightens around the predicted magnitudevalue, indicating a more refined, probabilistic estimate ofmagnitude.
By defining Ft(m) as the cumulative PDF at time t,it is possible to estimate a magnitude range of variation[Mmin;Mmax] whose limits are defined based on the shapeof the Ft(m) function:
Mmin :Z Mmin
�1
ft(mjd)dm D ˛ ;
Mmax :Z Mmax
�1
ft(mjd)dm D 1 � ˛ :(15)
Earthquake EarlyWarning System in Southern Italy, Figure 13Application of themethod for real timemagnitude estimate to aM 7 simulated event occurringwithin the area covered by the ISNetnetwork. Left panel. PDF distribution at several time steps measured from the first P-phase picking. Right top, magnitude estima-tion with uncertainties as a function of time. The dashed line refers to the actual magnitude value, the errors represent the 95% ofconfidence bound evaluated as cumulative PDF integral in the 5–95% range. Right bottom, probability to exceedmagnitude 6.5 andmagnitude 7.5 thresholds in function of time. The dashed line is the 75% probability level
For example, if we assume ˛ D 1%, then Mmin and Mmaxwill be, respectively, the Ft(m) evaluated at 0.01 and 0.99.
In Fig. 13b the estimates of magnitude uncertaintybounds are reported as a function of time. After three iter-ations (corresponding to a time of 9 s from the event origintime and 4 s after the first P-phase arrival at the network)the magnitude estimation converges to the truemagnitudevalue. In fact, due to the high density of seismic stationin the epicentral area, at that time most of seismic stationcontributes to the magnitude estimation with peaks readon P-phase windows (Fig. 14), while a further refinementof magnitude estimate is due to the near source S-wave ar-rivals.
Real-Time Hazard Analysisfor Earthquake EarlyWarning
The Real-Time Hazard Determination
Using the methods previously described for estimating inreal-time the event magnitude and location, it is possibleto perform a real-time hazard analysis [19]. This analysisis based on the extension of classical Probabilistic Seis-mic Hazard Analysis (PSHA) proposed by Cornell [11]that is generally used for long-term probabilistic hazardassessment. Classical PSHA integrates data from existingseismic catalogs both in terms of magnitude, location andrecorded strong ground motion values in addition to theinformation concerning seismogenic areas of interest (ex-
2416 E Earthquake Early Warning System in Southern Italy
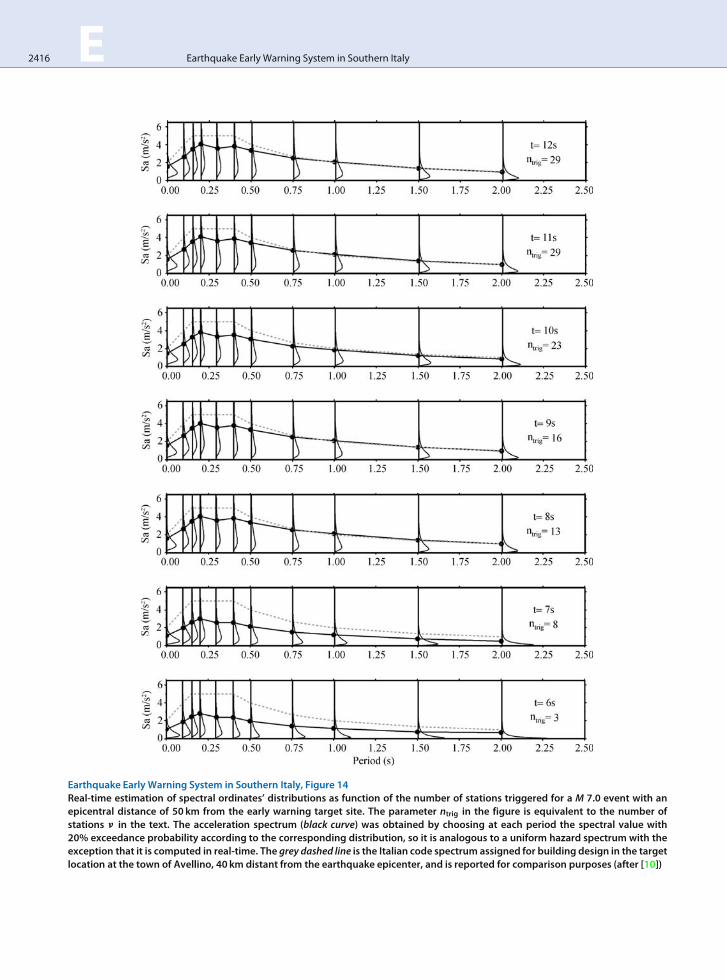
Earthquake Early Warning System in Southern Italy, Figure 14Real-time estimation of spectral ordinates’ distributions as function of the number of stations triggered for a M 7.0 event with anepicentral distance of 50 km from the early warning target site. The parameter ntrig in the figure is equivalent to the number ofstations in the text. The acceleration spectrum (black curve) was obtained by choosing at each period the spectral value with20% exceedance probability according to the corresponding distribution, so it is analogous to a uniform hazard spectrum with theexception that it is computed in real-time. The grey dashed line is the Italian code spectrum assigned for building design in the targetlocation at the town of Avellino, 40 km distant from the earthquake epicenter, and is reported for comparison purposes (after [10])
Earthquake Early Warning System in Southern Italy E 2417
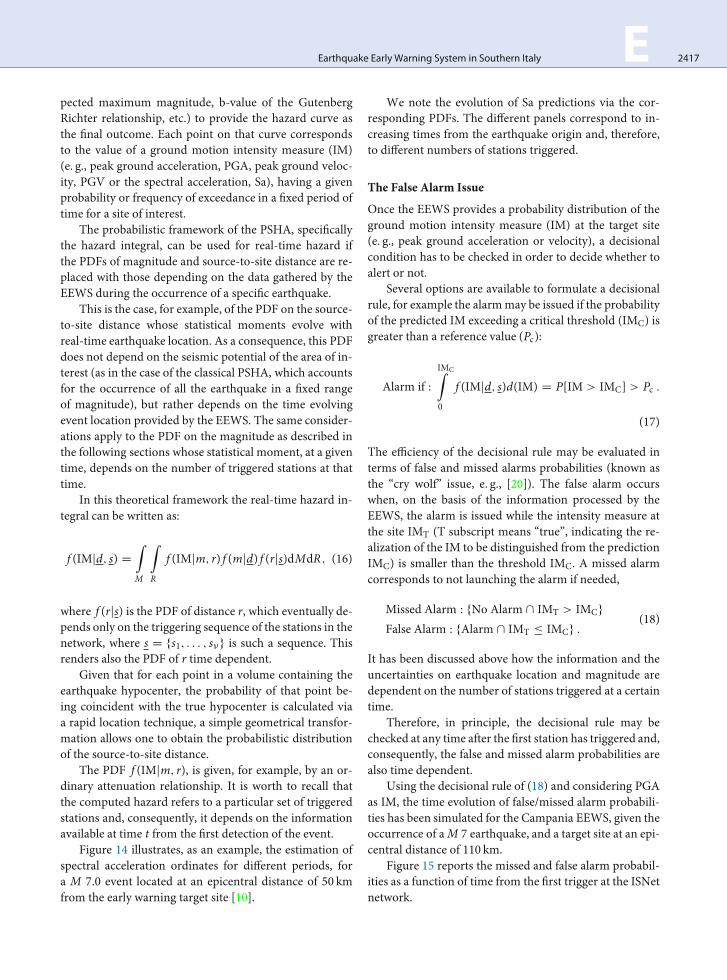
pected maximum magnitude, b-value of the GutenbergRichter relationship, etc.) to provide the hazard curve asthe final outcome. Each point on that curve correspondsto the value of a ground motion intensity measure (IM)(e. g., peak ground acceleration, PGA, peak ground veloc-ity, PGV or the spectral acceleration, Sa), having a givenprobability or frequency of exceedance in a fixed period oftime for a site of interest.
The probabilistic framework of the PSHA, specificallythe hazard integral, can be used for real-time hazard ifthe PDFs of magnitude and source-to-site distance are re-placed with those depending on the data gathered by theEEWS during the occurrence of a specific earthquake.
This is the case, for example, of the PDF on the source-to-site distance whose statistical moments evolve withreal-time earthquake location. As a consequence, this PDFdoes not depend on the seismic potential of the area of in-terest (as in the case of the classical PSHA, which accountsfor the occurrence of all the earthquake in a fixed rangeof magnitude), but rather depends on the time evolvingevent location provided by the EEWS. The same consider-ations apply to the PDF on the magnitude as described inthe following sections whose statistical moment, at a giventime, depends on the number of triggered stations at thattime.
In this theoretical framework the real-time hazard in-tegral can be written as:
f (IMjd; s) DZ
M
Z
R
f (IMjm; r) f (mjd) f (rjs)dMdR ; (16)
where f (rjs) is the PDF of distance r, which eventually de-pends only on the triggering sequence of the stations in thenetwork, where s D fs1; : : : ; s�g is such a sequence. Thisrenders also the PDF of r time dependent.
Given that for each point in a volume containing theearthquake hypocenter, the probability of that point be-ing coincident with the true hypocenter is calculated viaa rapid location technique, a simple geometrical transfor-mation allows one to obtain the probabilistic distributionof the source-to-site distance.
The PDF f (IMjm; r), is given, for example, by an or-dinary attenuation relationship. It is worth to recall thatthe computed hazard refers to a particular set of triggeredstations and, consequently, it depends on the informationavailable at time t from the first detection of the event.
Figure 14 illustrates, as an example, the estimation ofspectral acceleration ordinates for different periods, fora M 7.0 event located at an epicentral distance of 50 kmfrom the early warning target site [10].
We note the evolution of Sa predictions via the cor-responding PDFs. The different panels correspond to in-creasing times from the earthquake origin and, therefore,to different numbers of stations triggered.
The False Alarm Issue
Once the EEWS provides a probability distribution of theground motion intensity measure (IM) at the target site(e. g., peak ground acceleration or velocity), a decisionalcondition has to be checked in order to decide whether toalert or not.
Several options are available to formulate a decisionalrule, for example the alarmmay be issued if the probabilityof the predicted IM exceeding a critical threshold (IMC) isgreater than a reference value (Pc):
Alarm if :IMCZ
0
f (IMjd; s)d(IM) D P[IM > IMC] > Pc :
(17)
The efficiency of the decisional rule may be evaluated interms of false and missed alarms probabilities (known asthe “cry wolf” issue, e. g., [20]). The false alarm occurswhen, on the basis of the information processed by theEEWS, the alarm is issued while the intensity measure atthe site IMT (T subscript means “true”, indicating the re-alization of the IM to be distinguished from the predictionIMC) is smaller than the threshold IMC. A missed alarmcorresponds to not launching the alarm if needed,
Missed Alarm : fNo Alarm \ IMT > IMCg
False Alarm : fAlarm \ IMT � IMCg :(18)
It has been discussed above how the information and theuncertainties on earthquake location and magnitude aredependent on the number of stations triggered at a certaintime.
Therefore, in principle, the decisional rule may bechecked at any time after the first station has triggered and,consequently, the false and missed alarm probabilities arealso time dependent.
Using the decisional rule of (18) and considering PGAas IM, the time evolution of false/missed alarm probabili-ties has been simulated for the Campania EEWS, given theoccurrence of aM 7 earthquake, and a target site at an epi-central distance of 110 km.
Figure 15 reports the missed and false alarm probabil-ities as a function of time from the first trigger at the ISNetnetwork.
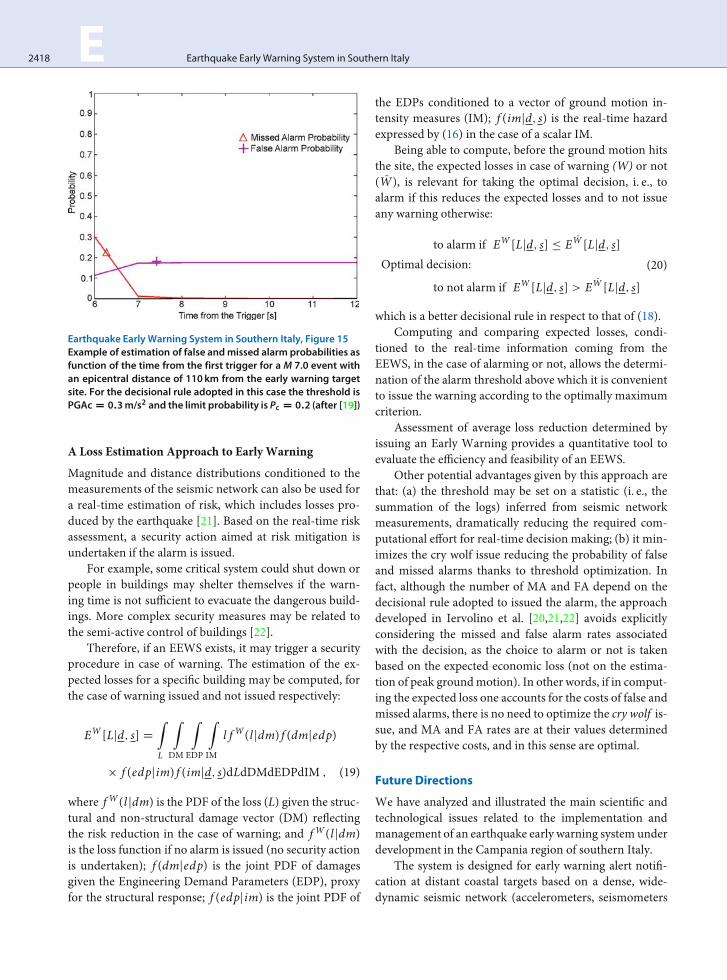
2418 E Earthquake Early Warning System in Southern Italy
Earthquake Early Warning System in Southern Italy, Figure 15Example of estimation of false andmissed alarm probabilities asfunction of the time from the first trigger for a M 7.0 event withan epicentral distance of 110 km from the early warning targetsite. For the decisional rule adopted in this case the threshold isPGAc D 0:3m/s2 and the limit probability is Pc D 0:2 (after [19])
A Loss Estimation Approach to EarlyWarning
Magnitude and distance distributions conditioned to themeasurements of the seismic network can also be used fora real-time estimation of risk, which includes losses pro-duced by the earthquake [21]. Based on the real-time riskassessment, a security action aimed at risk mitigation isundertaken if the alarm is issued.
For example, some critical system could shut down orpeople in buildings may shelter themselves if the warn-ing time is not sufficient to evacuate the dangerous build-ings. More complex security measures may be related tothe semi-active control of buildings [22].
Therefore, if an EEWS exists, it may trigger a securityprocedure in case of warning. The estimation of the ex-pected losses for a specific building may be computed, forthe case of warning issued and not issued respectively:
EW [Ljd; s] DZ
L
Z
DM
Z
EDP
Z
IM
l f W(l jdm) f (dmjedp)
� f (edpjim) f (imjd; s)dLdDMdEDPdIM ; (19)
where f W (l jdm) is the PDF of the loss (L) given the struc-tural and non-structural damage vector (DM) reflectingthe risk reduction in the case of warning; and f W (l jdm)is the loss function if no alarm is issued (no security actionis undertaken); f (dmjedp) is the joint PDF of damagesgiven the Engineering Demand Parameters (EDP), proxyfor the structural response; f (edpjim) is the joint PDF of
the EDPs conditioned to a vector of ground motion in-tensity measures (IM); f (imjd; s) is the real-time hazardexpressed by (16) in the case of a scalar IM.
Being able to compute, before the ground motion hitsthe site, the expected losses in case of warning (W) or not(W), is relevant for taking the optimal decision, i. e., toalarm if this reduces the expected losses and to not issueany warning otherwise:
to alarm if EW [Ljd; s] � EW [Ljd; s]Optimal decision:
to not alarm if EW [Ljd; s] > EW [Ljd; s]
(20)
which is a better decisional rule in respect to that of (18).Computing and comparing expected losses, condi-
tioned to the real-time information coming from theEEWS, in the case of alarming or not, allows the determi-nation of the alarm threshold above which it is convenientto issue the warning according to the optimally maximumcriterion.
Assessment of average loss reduction determined byissuing an Early Warning provides a quantitative tool toevaluate the efficiency and feasibility of an EEWS.
Other potential advantages given by this approach arethat: (a) the threshold may be set on a statistic (i. e., thesummation of the logs) inferred from seismic networkmeasurements, dramatically reducing the required com-putational effort for real-time decision making; (b) it min-imizes the cry wolf issue reducing the probability of falseand missed alarms thanks to threshold optimization. Infact, although the number of MA and FA depend on thedecisional rule adopted to issued the alarm, the approachdeveloped in Iervolino et al. [20,21,22] avoids explicitlyconsidering the missed and false alarm rates associatedwith the decision, as the choice to alarm or not is takenbased on the expected economic loss (not on the estima-tion of peak groundmotion). In other words, if in comput-ing the expected loss one accounts for the costs of false andmissed alarms, there is no need to optimize the cry wolf is-sue, and MA and FA rates are at their values determinedby the respective costs, and in this sense are optimal.
Future Directions
We have analyzed and illustrated the main scientific andtechnological issues related to the implementation andmanagement of an earthquake early warning system underdevelopment in the Campania region of southern Italy.
The system is designed for early warning alert notifi-cation at distant coastal targets based on a dense, wide-dynamic seismic network (accelerometers, seismometers
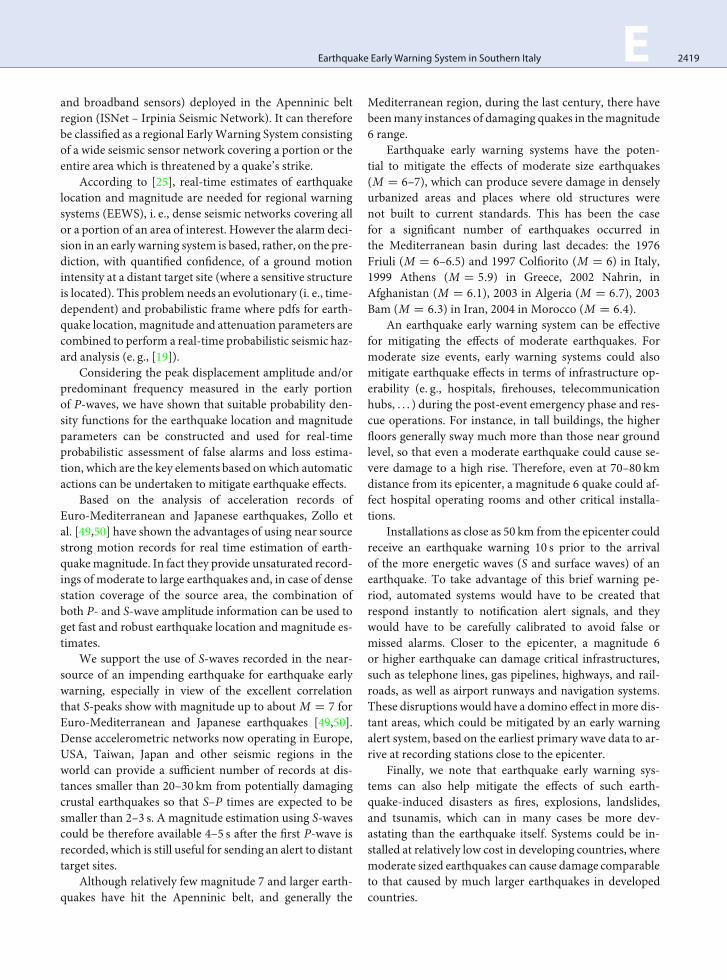
Earthquake Early Warning System in Southern Italy E 2419
and broadband sensors) deployed in the Apenninic beltregion (ISNet – Irpinia Seismic Network). It can thereforebe classified as a regional EarlyWarning System consistingof a wide seismic sensor network covering a portion or theentire area which is threatened by a quake’s strike.
According to [25], real-time estimates of earthquakelocation and magnitude are needed for regional warningsystems (EEWS), i. e., dense seismic networks covering allor a portion of an area of interest. However the alarm deci-sion in an early warning system is based, rather, on the pre-diction, with quantified confidence, of a ground motionintensity at a distant target site (where a sensitive structureis located). This problem needs an evolutionary (i. e., time-dependent) and probabilistic frame where pdfs for earth-quake location, magnitude and attenuation parameters arecombined to perform a real-time probabilistic seismic haz-ard analysis (e. g., [19]).
Considering the peak displacement amplitude and/orpredominant frequency measured in the early portionof P-waves, we have shown that suitable probability den-sity functions for the earthquake location and magnitudeparameters can be constructed and used for real-timeprobabilistic assessment of false alarms and loss estima-tion, which are the key elements based on which automaticactions can be undertaken to mitigate earthquake effects.
Based on the analysis of acceleration records ofEuro-Mediterranean and Japanese earthquakes, Zollo etal. [49,50] have shown the advantages of using near sourcestrong motion records for real time estimation of earth-quakemagnitude. In fact they provide unsaturated record-ings of moderate to large earthquakes and, in case of densestation coverage of the source area, the combination ofboth P- and S-wave amplitude information can be used toget fast and robust earthquake location and magnitude es-timates.
We support the use of S-waves recorded in the near-source of an impending earthquake for earthquake earlywarning, especially in view of the excellent correlationthat S-peaks show with magnitude up to about M D 7 forEuro-Mediterranean and Japanese earthquakes [49,50].Dense accelerometric networks now operating in Europe,USA, Taiwan, Japan and other seismic regions in theworld can provide a sufficient number of records at dis-tances smaller than 20–30 km from potentially damagingcrustal earthquakes so that S–P times are expected to besmaller than 2–3 s. A magnitude estimation using S-wavescould be therefore available 4–5 s after the first P-wave isrecorded, which is still useful for sending an alert to distanttarget sites.
Although relatively few magnitude 7 and larger earth-quakes have hit the Apenninic belt, and generally the
Mediterranean region, during the last century, there havebeenmany instances of damaging quakes in themagnitude6 range.
Earthquake early warning systems have the poten-tial to mitigate the effects of moderate size earthquakes(M D 6–7), which can produce severe damage in denselyurbanized areas and places where old structures werenot built to current standards. This has been the casefor a significant number of earthquakes occurred inthe Mediterranean basin during last decades: the 1976Friuli (M D 6–6.5) and 1997 Colfiorito (M D 6) in Italy,1999 Athens (M D 5:9) in Greece, 2002 Nahrin, inAfghanistan (M D 6:1), 2003 in Algeria (M D 6:7), 2003Bam (M D 6:3) in Iran, 2004 in Morocco (M D 6:4).
An earthquake early warning system can be effectivefor mitigating the effects of moderate earthquakes. Formoderate size events, early warning systems could alsomitigate earthquake effects in terms of infrastructure op-erability (e. g., hospitals, firehouses, telecommunicationhubs, . . . ) during the post-event emergency phase and res-cue operations. For instance, in tall buildings, the higherfloors generally sway much more than those near groundlevel, so that even a moderate earthquake could cause se-vere damage to a high rise. Therefore, even at 70–80 kmdistance from its epicenter, a magnitude 6 quake could af-fect hospital operating rooms and other critical installa-tions.
Installations as close as 50 km from the epicenter couldreceive an earthquake warning 10 s prior to the arrivalof the more energetic waves (S and surface waves) of anearthquake. To take advantage of this brief warning pe-riod, automated systems would have to be created thatrespond instantly to notification alert signals, and theywould have to be carefully calibrated to avoid false ormissed alarms. Closer to the epicenter, a magnitude 6or higher earthquake can damage critical infrastructures,such as telephone lines, gas pipelines, highways, and rail-roads, as well as airport runways and navigation systems.These disruptions would have a domino effect in more dis-tant areas, which could be mitigated by an early warningalert system, based on the earliest primary wave data to ar-rive at recording stations close to the epicenter.
Finally, we note that earthquake early warning sys-tems can also help mitigate the effects of such earth-quake-induced disasters as fires, explosions, landslides,and tsunamis, which can in many cases be more dev-astating than the earthquake itself. Systems could be in-stalled at relatively low cost in developing countries, wheremoderate sized earthquakes can cause damage comparableto that caused by much larger earthquakes in developedcountries.

2420 E Earthquake Early Warning System in Southern Italy
Bibliography
Primary Literature
1. Allen RM (2007) The ElarmS earthquake early warningmethod-ology and its application across California. In: Gasparini P,Manfredi G, Zschau J (eds) Earthquake early warning systems.Springer, Berlin, pp 21–44. ISBN-13 978-3-540-72240-3
2. Allen RM, Kanamori H (2003) The potential for earthquake earlywarning in Southern California. Science 300:786–789. doi:10.1126/science.1080912
3. Ambraseys N, Smit P, Douglas J, Margaris B, Sigbjornsson R,Olafsson S, Suhadolc P, Costa G (2004) Internet site for Eu-ropean strong-motion data. Boll Geofis Teor Appl 45(3):113–129
4. BakunW, Fischer HF, Jensen E, VanSchaack J (1994) Early warn-ing system for aftershocks. Bull Seismol Soc Am 84(2):359–365
5. Bernard P, Zollo A (1989) The Irpinia (Italy) 1980 earthquake:detailed analysis of a complex normal fault. J Geophys Res94:1631–1648
6. Guidoboni E, Ferrari G, Mariotti D, Comastri A, Tarabusi G,ValensiseG (2007) CFTI4Med, Catalogue of Strong Earthquakesin Italy (461 B.C.-1997) andMediterraneanArea (760 B.C.-1500).INGV-SGA. Available from http://storing.ingv.it/cfti4med/
7. Bose M, Ionescu C, Wenzel F (2007) Earthquake early warningfor Bucharest, Romania: Novel and revised scaling relations.Geophys Res Lett 34:L07302. doi:10.1029/2007GL029396
8. Bouchon M (1979) Discrete wave number representation ofelastic wave fields in three-space dimensions, J Geophys Res84:3609–3614
9. Cinti FR, Faenza L, Marzocchi W, Montone P (2004) Probabilitymap of the next M � 5:5 earthquakes in Italy. Geochem Geo-phys Geosyst 5:Q1103. doi:10.1029/2004GC000724.
10. Convertito V, Iervolino I, Giorgio M, Manfredi G, Zollo A (2008)Prediction of response spectra via real-time earthquake mea-surements. Soil Dyn Earthq Eng 28(6):492–505. doi:10.1016/j.soildyn.2007.07.006
11. Cornell CA (1968) Engineering seismic hazard analysis. BullSeismol Soc Am 59(5):1583–1606
12. Cua G, Heaton T (2007) The virtual seismologist (VS) method:A Bayesian approach to earthquake early warning. In: Gas-parini P, Manfredi G, Zschau J (eds) Earthquake early warningsystems. Springer, Berlin. doi:10.1007/978-3-540-72241-0_7
13. Curtis A, Lomax A (2001) Prior information, sampling distribu-tions and the curse of dimensionality. Geophysics 66:372–378.doi:10.1190/1.1444928
14. Erdik M, Fahjan Y, Ozel O, Alcik H, Mert A, Gul M (2003) Istanbulearthquake rapid response and the early warning system. BullEarthquake Eng 1(1):157–163. doi:10.1023/A:1024813612271
15. Espinosa-Aranda JM, Jimenez A, Ibarrola G, Alcantar F, AguilarA, Inostroza M, Maldonado S (1995) Mexico City seismic alertsystem. Seismol Res Lett 66:42–53
16. Font Y, Kao H, Lallemand S, Liu C-S, Chiao L-Y (2004) Hypocen-tral determination offshore Eastern Taiwan using the maxi-mum intersection method. Geophys J Int 158(2):655–675. doi:10.1111/j.1365-246X.2004.02317.x
17. Grasso V, Allen RM (2005) Earthquake warning systems: Char-acterizing prediction uncertainty. Eos Trans AGU 86(52), FallMeet. Suppl., Abstract S44B-03
18. Horiuchi S, Negishi H, Abe K, Kamimura A, Fujinawa Y (2005)An automatic processing system for broadcasting earth-quake alarms. Bull Seism Soc Am 95(2):708–718. doi:10.1785/0120030133
19. Iervolino I, Convertito V, Giorgio M, Manfredi G, Zollo A (2006)Real time risk analysis for hybrid earthquake early warning sys-tems. J Earthq Eng 10(6):867–885
20. Iervolino I, Convertito V, Giorgio M, Manfredi G, Zollo A(2007a) The cry wolf issue in seismic early warning applica-tions for the campania region. In: Gasparini P et al (eds) Earth-quake early warning systems. Springer, Berlin. doi:10.1007/978-3-540-72241-0_11
21. Iervolino I, Giorgio M, Manfredi G (2007b) Expected loss-based alarm threshold set for earthquake early warning sys-tems. Earthq Eng Struc Dyn 36(9):1151–1168. doi:10.1002/eqe.675
22. Iervolino I, Manfredi G, Cosenza E (2007c) Earthquake earlywarning and engineering applications prospects. In: GaspariniP, Manfredi G, Szchau J (eds) Earthquake early warning sys-tems. Springer, Berlin, doi:10.1007/978-3-540-72241-0_12
23. Jenny S, Goes S, Giardini D, Kahle H-G (2006) Seismic poten-tial of Southern Italy. Tectonophysics 415:81–101. doi:10.1016/j.tecto.2005.12.003.
24. Kamigaichi O (2004) JMA earthquake earlywarning. J JapanAs-soc Earthq Eng 3:134—137
25. Kanamori H (2005) Real-time seismology and earthquake dam-age mitigation. Ann Rev Earth Planet Sci 33:195–214. doi:10.1146/annurev.earth.33.092203.122626
26. Lancieri M, Zollo A (2008) A bayesian approach to the real-time estimation ofmagnitude from the early P- and S-wave dis-placement peaks. J Geophys Res. doi:10.1029/2007JB005386,in press
27. Lomax A (2005) A Reanalysis of the hypocentral location andrelated observations for the great 1906 California earthquake.Bull Seism Soc Am 95(3):861–877. doi:10.1785/0120040141
28. Meletti C, Patacca E, Scandone P (2000) Construction of a seis-motectonic model: The case of Italy. Pure Appl Geophys157:11–35
29. Montone P, Mariucci MT, Pondrelli S, Amato A (2004) An im-proved stress map for Italy and surrounding regions (cen-tral Mediterranean). J Geophys Res 109:B10410. doi:10.1029/2003JB002703
30. Munich Re (eds) (2005) Environmental report – perspectives –Today’s ideas for tomorrow’s world, WKD-Offsetdruck GmbH,München
31. Nakamura Y (1988) On the urgent earthquake detection andalarm system (UrEDAS). Proc 9th World Conf Earthquake EngVII, Toyko, 673–678
32. Nakamura Y (1989) Earthquake alarm system for Japan rail-ways. Japan Railway Eng 109:1–7
33. Nakamura Y (2004) Uredas, urgent earthquake detection andalarm system, now and future. 13th World Conference onEarthquake Engineering 908
34. Okada T et al (2003) A new method of quickly estimating epi-central distance and magnitude from a single seismic record.Bull Seismol Soc Am 93(1):526–532. doi:10.1785/0120020008
35. Podvin P, Lecomte I (1991) Finite difference computations oftraveltimes in very contrasted velocitymodels: amassively par-allel approach and its associated tools. Geophys. J Int. 105:271–284
Earthquake Engineering, Non-linear Problems in E 2421
36. Rydelek P, Pujol J (2004) Real-time seismic warning witha 2-station subarray, Bull Seism Soc Am 94(4):1546–1550. doi:10.1785/012003197
37. Satriano C, Lomax A, Zollo A (2008) Real-time evolutionaryearthquake location for seismic early warning. Bull Seism SocAm 98(3):1482–1494. doi:10.1785/0120060159
38. Simons F, Dando JB, Allen R (2006) Automatic detection andrapid determination of earthquakemagnitude bywaveletmul-tiscale analysis of the primary arrival. Earth Planet Sci Lett250:214–223. doi:10.1016/j.epsl.2006.07.039
39. Teng TL, Wu Y-M, Shin TC, Tsai YB, LeeWHK (1997) Oneminuteafter: strong-motion map, effective epicenter, and effectivemagnitude. Bull Seism Soc Am 87(5):1209–1219
40. Tsukada S (2006) Earthquake early warning system in Japan.Proc 6th Joint Meeting UJNR Panel on Earthquake Research,Tokushima, Japan
41. Valensise G, Amato A, Montone P, Pantosti D (2003) Earth-quakes in Italy: Past, present and future. Episodes 26(3):245–249
42. Wenzel FM et al (1999) An early warning system for Bucharest.Seismol Res Lett 70(2):161–169
43. Westaway R, Jackson J (1987) The earthquake of 1980 Novem-ber 23 in Campania-Basilicata (southern Italy), Geophys J R As-tron Soc 90:375–443. doi:10.1111/j.1467-6435.1999.tb00581.x
44. Wu Y-M, Teng T (2002) A virtual subnetwork approach to earth-quake early warning. Bull Seismol Soc Am 92(5):2008–2018.doi:10.1785/0120040097
45. Wu Y-M, Kanamori H (2005) Experiment on onsite early warn-ing method for the Taiwan early warning system. Bull SeismolSoc Am 95(1):347–353. doi:10.1785/0120040097
46. Wu YM, Zhao L (2006) Magnitude estimation using the firstthree seconds of p-wave amplitude in earthquake early warn-ing. Geophys Res Lett 33:L16312. doi:10.1029/2006GL026871
47. Wurman G, Allen RM, Lombard P (2007) Toward earth-quake early warning in Northern California. J Geophys Res112:B08311. doi:10.1029/2006JB004830
48. Zhou H (1994) Rapid 3-D hypocentral determination usinga master station method, J Geophys Res 99(B8):15439–15455
49. Zollo A, Lancieri M, Nielsen S (2006) Earthquakemagnitude es-timation from peak amplitudes of very early seismic signalson strong motion records. Geophys Res Lett 33:L23312. doi:10.1029/2006GL027795
50. Zollo A, Lancieri M, Nielsen S (2007) Reply to commentby P. Rydelek et al on “Earthquake magnitude estimationfrom peak amplitudes of very early seismic signals on strongmotion records”. Geophys Res Lett 34:L20303. doi:10.1029/2007GL030560.
Books and ReviewsBerger JO (1985) Statistical decision theory and Bayesian analysis.
Springer, New YorkCoutant O (1989) Program de simulation numerique AXITRA. Rap-
port LGIT, Grenoble, FranceGruppo di Lavoro MPS (2004) Redazione della mappa di peri-
colosità sismica prevista dall’Ordinanza PCM 3274 del 20marzo (2003) Rapporto Conclusivo per il Dipartimento dellaProtezione Civile, INGV, Milano-Roma, aprile (2004) 65 pp + 5appendici
Milne J (1886) Earthquakes and other earth movements. Appelton,New York, p 361
Earthquake Engineering,Non-linear Problems inMIHAILO D. TRIFUNACDepartment of Civil Engineering,University of Southern California, Los Angeles, USA
Article Outline
GlossaryDefinition of the SubjectIntroductionVibrational Representation of ResponseResponse in Terms of Wave Propagation –
An ExampleObservations of Nonlinear ResponseFuture DirectionsBibliography
Glossary
Meta-stability of man-made structures is the conse-quence of their upright construction above ground.For excessive dynamic (earthquake) loads, when thelateral deflection exceeds some critical value (this isnormally accompanied by softening nonlinear be-havior of the structural members), the overturningmoment of the gravity forces becomes larger than therestoring moment, and the structure becomes unstableand moves exponentially toward collapse.
Complex and evolving structural systems are structureswith a large number of degrees of freedom and manystructural members, which for given loads experi-ence softening nonlinear deformations. During strongexcitation, continuous changes (typically decreases)in effective stiffness and time-dependent changes inboundary conditions result in a system whose prop-erties are changing with time.
Soil–structure interaction is a process in which the soiland the structure contribute to mutual deformationswhile undergoing dynamic response. In time, withcontinuously changing contact area between the foun-dation and the soil (opening and closing of gaps), whenthe deformations are large, soil–structure interactionis characterized by nonlinear geometry and nonlin-ear material properties in both the soil and in thestructure.
Definition of the Subject
Nonlinear problems in structural earthquake engineer-ing deal with the dynamic response of meta-stable, man-
Related Documents