Welcome message from author
This document is posted to help you gain knowledge. Please leave a comment to let me know what you think about it! Share it to your friends and learn new things together.
Transcript

8/7/2019 Earth Observations Program Review
http://slidepdf.com/reader/full/earth-observations-program-review 1/95

8/7/2019 Earth Observations Program Review
http://slidepdf.com/reader/full/earth-observations-program-review 2/95
This review by the Earth Observations Division was pre-
sented to NASA General Management on4 November 1969under the sponsorship o f the Off ic e of Space Science and
Applications ( OSSA). The graphics for this review and
contained in this document were prepared by the Divisionof Program and Specia Reports, Code XP. Questions con-
cerning this review and requests fo
this document should be th Observations
Division, Code SR, NAS20546

8/7/2019 Earth Observations Program Review
http://slidepdf.com/reader/full/earth-observations-program-review 3/95
ARTH
OBSERVA
PROGRAM
R E V I E W
4 A N D 5 N O V E M B E R 1969
PRESENTED BY :
E AR TH O B S E R V A T IO N S P R O G R A M S D I V l S l O NOFFICE O F S P A C E S C IE N C E A N D A P P L IC A T IO N S

8/7/2019 Earth Observations Program Review
http://slidepdf.com/reader/full/earth-observations-program-review 4/95
Forewor
Earth Observations Programs are concerned wi th the
use of aircraft and space to monitor th e Earth's en-
vironment and i t s natural resources. These program
include the use of space technology for Meteorology
and Earth Resources Survey. Meteorological satelI tes
represent an already proven technology which has
reached operational status. Earth Resources Survey,
on the other hand, i s s t i l l in an early stage with thefirst dedicated research satellites under development
but not yet flown. Earth Resources Survey includes
applications to the disciplines of agr icu l ure, forestry,
geology, hydrology, geography, and oceanography e
This report reviews NASA's current programs for thedevelopment of capabil ities for the survey of Earth
resources and the monitoring of Earth's weather, and
i t discusses the Supporting Research and Technology
which contributes to the advancement of these cap-
abil ities and to their fruitful application. Future
programs are also discussed as il lust rations of the
range of missionsandsystemsavailableasoptionsand
to provide insight into NASA's integrated approach
to Earth Observations. Discussion of these potential
programs does not imply of fi cial acceptance or ap-
proval by N A S A General Management. Specif ic
program plans to be executed wi ll be the result of
careful review and consideration of a l Iprogram needs
within the OSSA, as approved by General Manage-
ment, and within the frameworkof program authori-
zations established by the President and the Congress.
1 Dr. J . E. Naugie
ssocia e Adminis ra or,Space Science and Applications

8/7/2019 Earth Observations Program Review
http://slidepdf.com/reader/full/earth-observations-program-review 5/95
CONT E N T S
INTRODUCTION . . . . . . . . . . . .
EARTH RESOURCES SURVEY PROGRAM .1 . lntroduction . . . . . . . . . . . .
. Mr. Leonard Jaffe . . . a . . e e
Deputy Associate Administrator
for Space Science and Applications
(Applications). OSSA
.Mr. Leonard Jaffe . . . . . . . . . .
. . . . . . . . . . . . . . . . . . . . .II. The Aircraft Program . . . . . . . . . . . . . . . . . . . . . . . . . . . .
1 1 1. The Spacecraft Program . . . . . . . . . . . . . . . . . . . . . . . . . . .I V. Supporting Research and Technology . . . . . . . . . . . . . . . . . . . . .V. NASA Sponsored Summer Study on Solid Earth and Ocean Physics . . . . . .
VI.Overa ll Involvement and Management
. . . . . . . . . . . . . . . . . . . .VI1. Summary . . . . . . . . . . . . . . . . . . . . . . . . . . . . . . . . . . .
METEOROLOGICA L
I .
II.11 1 .I V.V.
VI .VI! .
lntroduction
.
PROGRAMS . . . .
. . . . . . . . . . . .The NASA Role . . . . . . . . . . .Global Cloud Cover Program . . . .
Dr.Morris Tepper . . . . . . . . . .Deputy Director. Earth Observations
Programs and Director of Meteorology
. . . . . . . . . . . . . . . . . . . .. . . . . . . . . . . . . . . . . . . .. . . . . . . . . . . . . . . . . . . .Continuous Viewing of th e Atmosphere . . . . . . . . . . . . . . . . . . .Quantitative Measurement of the Atmospheric Structure
Global Atmospheric Research Program . . . . . . . . . . . . . . . . . . . .Program Management . . . . . . . . . . . . . . . . . . . . . . . . . . . .
. . . . . . . . . .
OBSERVATIONS PROGRAMS REV1EWCONCLUDINGREMARKS . . . . . . . . Mr. Leonard Jaffe . . . . . . . . . .
Page__s
1
2
2
2
163142
4447
49
49545663667581
85
Appendix of Abbreviations and Acronyms . . . . . . . . . . . . . . . . . . . . . 88

8/7/2019 Earth Observations Program Review
http://slidepdf.com/reader/full/earth-observations-program-review 6/95
Presented by
t-, Leonard Jaffe
The great strides which have been made i n space technology during the last decade now
provide us with a new view of our planet Earth. As illustrated in igure 1, we no longer are
limi ted to a microcosmic view o f s
can now, from a platform physical
Th is is of particu ar interest since we can now view the Earth as a iargely closed ecolog ical
system, which i t ssentially is , We now have the technological tools to begin to address
some of the broader problems of understanding, odeling and, eventually, managing both
the environment and resources existing on the p
I I pieces of the Earth and atmosphere at a time, but
removed from the Earth, observe the enti re planet.
One might even say, from this distant \I ew of the planet Earth, that there is some reasonable
ogy to the Earth being a manned spacecraft moving i n space wi th its own crew and
tems. Th is view is described in an evocative narration prepared by
for a forthcoming telev ision documentary: "The Promise of Space. I' Whpili s somewhat fanciful, some of the ins
to read i t ,
r eArthur C. Clarke
the description
th your permission, I would Bike
Figure 1

8/7/2019 Earth Observations Program Review
http://slidepdf.com/reader/full/earth-observations-program-review 7/95
This i s the Spaceship Earth. Destination: Unknown.
he crew i s approximately three billion. It has no overall
captain, but a large number of f i r s t mates who do not
always agree.
They rule from many command modules.
I t is a beaut iful ship.
* . but i t is i n grave trouble. There i s always a mutiny
going on somewhere. e .
Some decks are hopelessly overcrowded, and th e food i s
running low.
The plumbing and ai r condit ioning are unreliable.
Some parts are not as well built as they might have been.
The waste disposal system leaves much to be desired.
And there i s fire down below.. .Often its l i f e support systems have been poorly maintained.
Not a l l i t s crew can be kept busy - or productive.
But we can't abandon ship. There are not enough lifeboats
to go around. The nearest land i s distinctly hostile. A
nice place to visit, but who would want to li ve there.
We are here - three b il li on of us - and millions more coming
each year. We are signed on for the duration of the
voyage. We alone, the crew and i t s mates, must decide
i f Spaceship Earth i s to become a tired wornout derelict,
drift ing lifelessly on the seas of space. a e
. whose problems are so profound that the crew resorts,each generation through the ages, to destruction i n
pursuit of peace.
It i s f rom space that, for the first time, we are ab le to
see Earth as a single entity, whose problems are shared
by all mankind.
o meet th e challenges of today% i fe on Ea. the new astronau
8/7/2019 Earth Observations Program Review
http://slidepdf.com/reader/full/earth-observations-program-review 8/95
Because these tools are new. e .and strange. e .on
yet understand their purpose - fewer st ill , their promise.
Some even fear them, as new things are always feared.
But not to use them would be worse than folly - for withtheir aid, we can overcome today's torment on Earth.
Only by using the new technology and sciences have we
been able to put man in his cosmic environment. Now. e
only by apply ing these same talents and tools, w i l l be
understand, fu lly, the true promise of spacee*
-
Here we have heard an imaginative descr iption of some of th e Earth-bound problems - resourceproblems and people problems. Can we be more expl ic it in idenTifying the social and economic
problems to which Earth observations may make a beneficial contribution? Some of these are
referred to i n Figure 2 and include assuring: adequate wor ld food supply, satisfactory water
qual ity and avai labi li ty , an adequate supply of mineral resources, ef fi ci en t use of land, well-
planned urban development, and control of po llu tion and the understanding and control of our
atmospheric environment. Certa inly Earth observations from satelli te platforms w i l l not, of
itself, solve these problems and no intent i s made here to imply that this i s so. However,
based on the work which has been accomplished thus far, i t seems clear that significant contri-butions towards the ir amelioration, and in some cases, eventual solution, may soon be made.
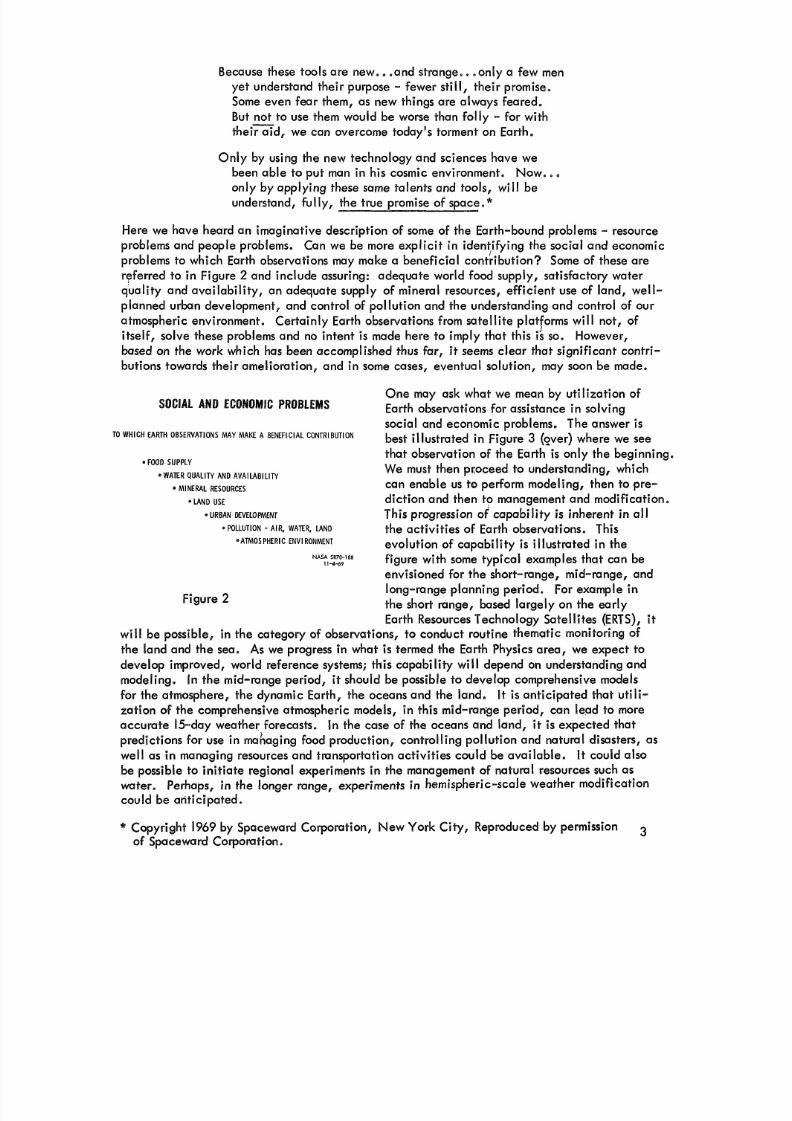
One may ask what we mean by uti li za tion of
Earth observations for assistance i n solv ing
social and economic problems. The answer i s
best illustrated in Figure 3 (Qver) where we seeO W H I C H E A R TH O B S E R V A TI O N S M A Y M A K E A B E N E FI C I A L C O N TR I B U TI O N
that observation of the Earth is only th e beginning.
We must then proceed to understanding, whichcan enable us to perform modeling, then to pre-
e FO O D S U P P LY
0 W A TE R Q U A LI TY A N D A V A I LA B I L I TY
e M I N E R A L R E S OU R C ES
@ L A N D U SE dic tion and then to management and modification.
This progression of capability i s inherent in all
the activities of Earth observations. This
evolution of capability i s illustrated i n the
figure with some typical examples that can be
envisioned for the short-range, mid-range, and
long-range planning period. For example i nthe short range, based largely on the early
Earth Resources Technology Satelli tes (ERTS), i t
e URBAN DEVELOPMENT
* POLLUTION - AIR, WATER, LAND
O A TM O S P H E R I C E N V l R O NM E N T
NASA1-4-69R70-188
Figure 2
be possible, i n the category of observations, to conduct routine thematic monitoring ofand and the sea. As we progress i n what i s termed the E th Physics area, we expect to
depend on understanding and
comprehensive mode s
i s anticipated that uti li-
ed, world reference systems; this capability
he mid-range period, i t should be possible to deve
ere, the dynamic Earth, the oceans and the land.
zation of the comprehensive atmospheric mode s, i n this mid-rangaccurate 15-day weather forecasts. of the oceans and
predictions for use i n mahaging foo
we ll as i n managing resources n activities could be
be possible to initiate regiona he management of na
8/7/2019 Earth Observations Program Review
http://slidepdf.com/reader/full/earth-observations-program-review 9/95
1 UNDERSTANDING
1SHORT-RANGE LONG-RANGE
T H EM A T IC M O N I T O R I N G 5O F
LAND a SEA
IMPROV€REFEREM
NASA SR70-IW114-69
Figure 3
fORLD
i%EM
OMPREHENSIVE MODELS
OR ATMOSPHERE, DYNAMIC
A RT H, W E A N S b L A N D
CCURATE 15-DAY WEATHER FORECA!TS
PREDICTIONS FOR F O O D
PRODUCTION, POLLUTION, iNATURAL DISASTERS,
ESOURCES, 6 TRANSPORTATION^
REGIONAL EXPERIMENTS
IN M A N A G E M E N T O F
NATURAL RESOURCES,
SUCH AS WATER
CPERIMENTS INEM SFHE RIC-SCALE
'EATHER MODIFICATION
It is, however, not olutely necessary that each of these steps of observation, understanding,
predic tion and management/modification proceed in a sequential manner nor that we attai n the
'tast of them to realize b fit. Each of these steps can be consi
itself and certainly some degree of management can be exercise y a knowledge of the
current status der: ved observation withoub the benefit of u
a useful end goal unto
nding and prediction
" INCREASE UTILIZATIO N OF SPACE
CAPABILITIES FOR SERVICES TO MAN,THROUGH AN EXPANDED SPACE APPLI-
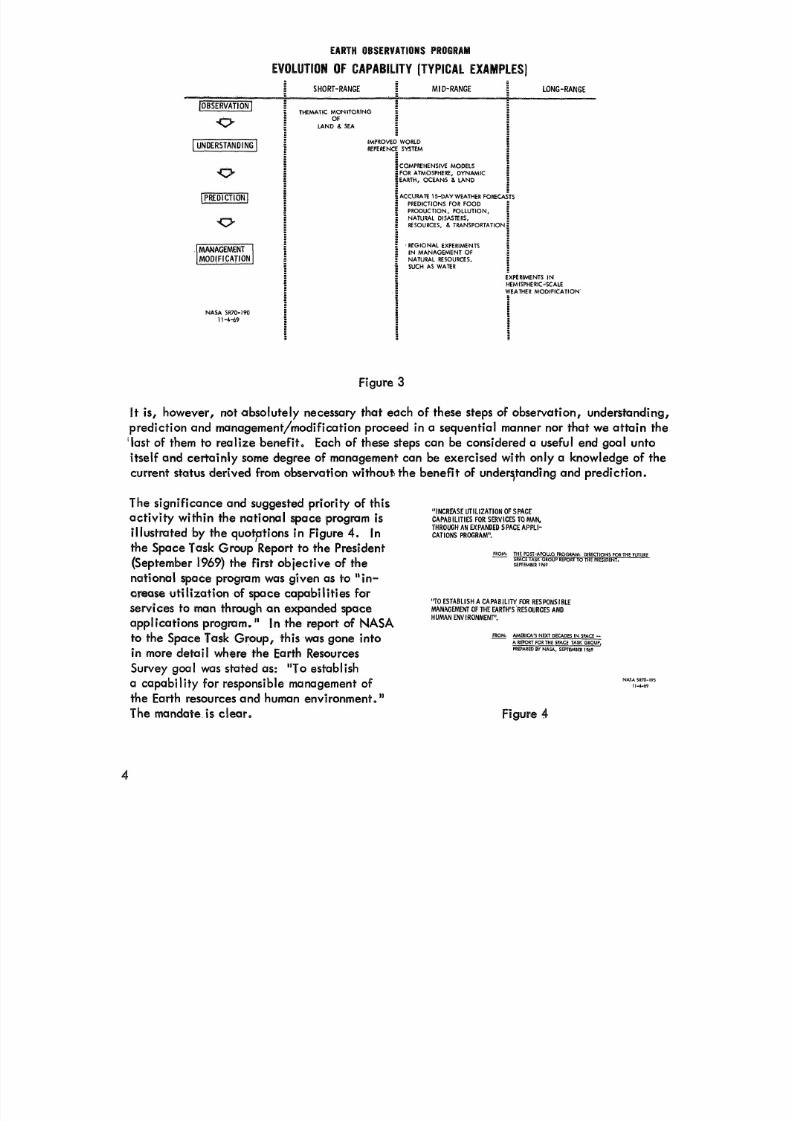
The significance and suggested priority of thisactivity within the national space program i s
illustrated by the quotptions i n Figure 4. In CATIONS PROGRAM".
FROM THE POST-AWLLO PROGWM DIRKTlONSFOR THE WURESPACE TASKGROUP REPORT TO THE PRESIDENT,SEPTEMIIER 1969
-roup Report to the P
9) the first objective o
national space program was given as to "in-. -
"TO ESTABLISH A CAP ABIL IIY FOR RESPONSIBLEMANAGEMEW OFTHE EARTH'S RESOURCES ANDHUMAN ENVIRONMENT:
space capabilities for
" In the report of NASAp, this w a s gone into
in more deta il where the Earth Resources
Survey goal was ed as: "To establish
a cupabil ity for responsible management of
the Earth resources and human environment."
-ROM AMERIC4'S NEXT DECADES IN SPACE --A W O R T FO R THE SPACE TASK MIOUP,
PREPAREDBy NASA, SEPTEMMBER IW9
NASA s~m-195
I -4-69
he mandate i s c igum 4
4

8/7/2019 Earth Observations Program Review
http://slidepdf.com/reader/full/earth-observations-program-review 10/95

8/7/2019 Earth Observations Program Review
http://slidepdf.com/reader/full/earth-observations-program-review 11/95
H RESOURCES SURVEY PROGRAM
1 .
We have alluded to the broad economic and sacial problems which mqy he addressed via remote
sensing (observations), and we w i l l assume fami liar ity wi th the disc iplinary areas of agricu
forestry, hydrology, geography and oceanography with which Earth resources survey i s concerned.
The basic objectives which NASA adopts i n order to provide the maximum assistance of space
technology i n these problem and disciplinary areas are summarized in Figure 1. Certainly, NASAwhich understands best th e capabilities of space
technology, must play a strong role i n defining
those real world problems to which i t seems that
EARTH RESOURCES SURVEY PROGRAM
NASA OBJECTIVES
DEFINE REAL WORLD PROBLEMS TO WHICH SPACE TECHNOLOGY CAN a beneficial contribution can be made by remote
sensing from space. It is also necessary to
conduct research in remote sensing to establish
MAKE A BEN EFICIAL CONTRIBUTION
0 DETERMINE PERFORMANCE OF REMOTE SENSORS, ESTABLISH SIGNATURE
RECOGNITION CRITERIA
e DEVELOP SENSORS,SUBSYSTEMS, AN D EXPERIMENTAL SPACECRAFT, ALONG signature recognition criteria and to develop
sensors, subsystems, experimental spacecraftITH EFFICIENT MEANS FOR GETTING INTO ORBIT.
0 DETERMINE SCOPE & CONFIGURATION OF OPERATIONAL SYSTEMS [INCLUDING and launch vehicles. I t i s also necessary to
determine the scope and confinumtion of tota lSPACECRAFT, AIRCRAFT, AND GROUND SEGMENTS)
e DEVELOP DATA HANOLING TECHNIOUES-
future operational systems inc lud ing spacecmft,0 ASSIST USER AGENCIES IN DEVELOPING A COMMUNITY OF EXPERTS aircraft and ground segments. In addition, i t
i s important to develop data handling techniquesREPARED TO UTILIZE SPACE-DERIVED REMOTE-SENSING DATA.
h l b U Y O $17D-Y5-
which can assure that data will be made avaiiable
to experimenters and users i n a number of dif ferent
disciplines; in particular, i t i s more efficient todevelop, i f feasible, a single set of data handling equipment which can serve the needs of severai
disciplines. Perhaps one of the most significant aspects of NASA activity i s to assist user agencies
i n developing a community of experts prepared to u ti ize space-derived or aircmft -der ived remote
sensing data
11-4-59
Figure 1
An ovemll view of the Earth Resources Survey (ERS) Pros m i s illustrated i
program may be divided into three main groupings, name
program and the supporting research and technology progby addressing these three general areas in sequence,
i s made between the approved and proposed progmms.
A PRBG
ced most of theop remote sensor
6

8/7/2019 Earth Observations Program Review
http://slidepdf.com/reader/full/earth-observations-program-review 12/95
SPACECRAFT PROGRA
NIMBUS
ERTS A&BERTS C&D
ERTS E&F
SATS
MANNED SPACE
GEMINI
APOLLODW S
SPACE STATION
OPERATIONAL SYSTEMDEVELOPMENT
ERTS FOLLOW-ON
FLIGHT EXPERIMENTS
SUPPORTING RESEARCHAND TECHNOLOGY
EARTH RESOURCES SURVEY
I-\
'Ir, APPROVED 19k5 1970 1975 1980
P R0P0SED NASA SR70-871 1-4-69
Figure 2
Figure 3
7
8/7/2019 Earth Observations Program Review
http://slidepdf.com/reader/full/earth-observations-program-review 13/95
executed in cooperation wi th Federal user ugencies, including the Departments of Agriculture,
Interior, Commerce and Navy and other qualif ied investigutors so as to provide the broadest
bese of data possible within the resources available.
The remote sensors that are being evaluated for these disciplines are (a) those that actively
" i l luminate" targets and receive reflected radiation, and (b) those that operate as passive
monitors of natural and cultural emissions or reflections from the earth's surface. With thesetypes of sensors i t i s possible to obtain multispectral datu of terrestrial phenomena for disciplinary
analysis. Rather than going direc tly to instruments in spacecraft, user agencies and hooperating
scientists are obtuining precursary datu from mwltispectral instrumentation i n aircraft . The data
i s used to evaluate the s eaon over specific instrumented test sites and to develop a solid founda-
tfon for sc ient ific observational and interpretive techniques, i n preparation for the advent of
earth resources space missions.
The airborne program has been subdivided into two phases; a low to medium al ti tude phase anda high altitude phase, Currently, in the f i r s t phase, there are three operating spacecraft: a
Convair 240, an Electm P-3A, and a Helccules C-1308. Extensive modification internally and
externally has converted these air cm ft into excellent multispectral airborne platforms for
eva ludon of a variety of sensors.
The National A emy of Sciences (NAS) Space Applications Summer Study a t Woods Hole,
Massachusetts, 1967-68, suggested the use of high-altitude platforms including a iet aircraft.
advantages of high-altitude flights are in simulating conditions nearer to thosewhich can be expected from an orb iting spacecraft and i n permitting assessment of the roles which
may be ef fec tively f il led by airc raft i n future operationul aircruft-spacecraft mixed systems. By
Flying remote sensors at altitudes above about 90perFent of the earth's atmosphere, we extend
the established range of the sensors' performance capabilities, as we ll as veri fy our data-handling
and analysis techniques, The additional duta on the var iat ion of signal-to-noise rat io wi thaltitude permit US to do better remote Sensor planning, and to define in a more realistic manner
h e nput specificat ions For the space sensors.
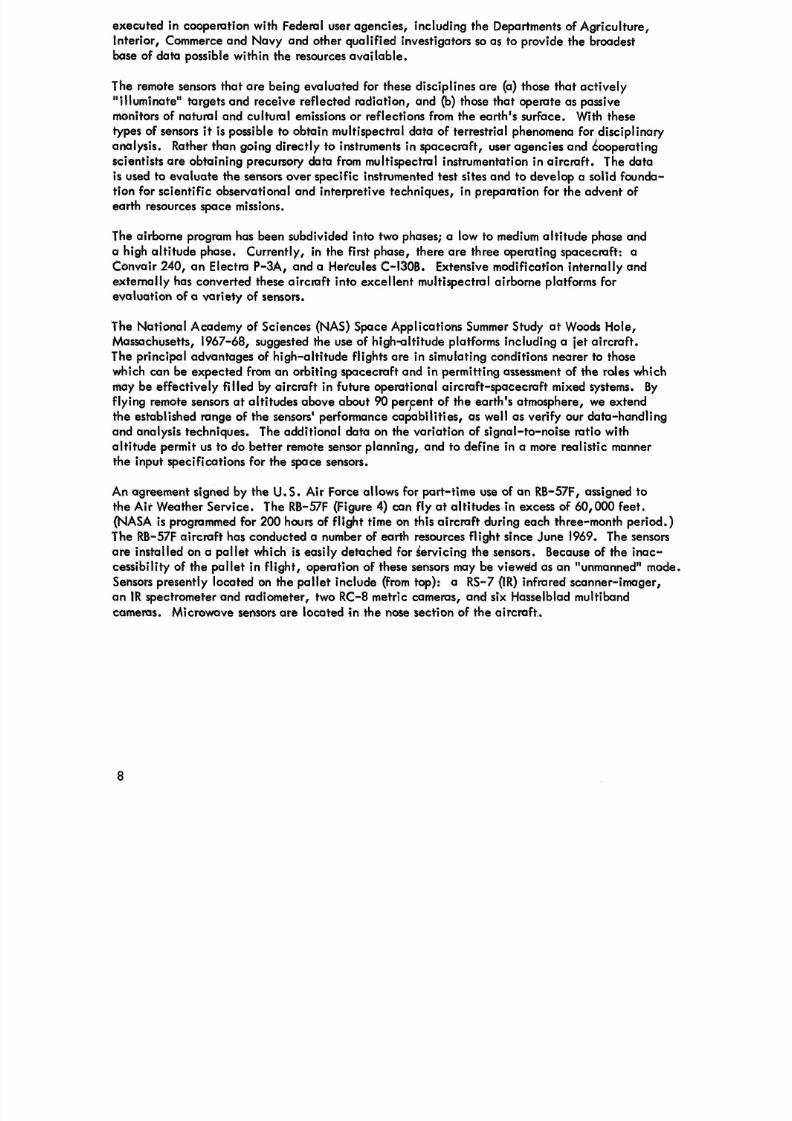
An agreement signed by the U.S. A ir Force allows for part-time use of an RB-SF, assigned to
the A ir Weuther Service. The R B - S F (Figure 4) a n ly a t ali itudes in excess of 60,000 feet.
(NASA i s prograrnmd for 200 h w n of flight t ime on this ai rcra ft during each three-month period.)
The RB-57f aircraft has conducted a number of earth resources flight since June 1969. The sensors
are installed on a pallet which i s easily detached for Servicing the sensors. Because of the inac-
cessibility of the pa lle t i n flight, operation of these sensors may be vieweid as an "unmanned" mode.
Sensors presently located on the pallet include (from top): a RS-7 (1R) infrared scannerimager,
an IR spectrometer and mdiorneter, two RC-8 metric cameras, and six Hasselblad multiband
cameras. Mrcrowave sensors are located i n the nose section of the aircraft,,
8

8/7/2019 Earth Observations Program Review
http://slidepdf.com/reader/full/earth-observations-program-review 14/95
Figure 4
After th e first two years of experimentation i t became obvious that the Convair 240 and the
Electra P-3A aircraft could not fulfill the complete low-medium altitude test requirements of
the part icipating Earth scientists for experimentation with th e sensors over many different test
si te areas. Consequently, a Lockheed C-1308, Figure 5 (over), was obtained to replace the
Convair 240, The C-130B ai rcra ft provides a considerably greater payload, and performs at
greater ranges and at higher altitudes. The sensors that are currently being integrated into this
aircra ft are being transferred from th e Conviar 240. The C-130B also provides a large internal
volume for instrument installa tion and for personnel. Since essentially a l l instrumentation i s
accessible during flight, this aircraft may well be termed a " fl yi ng laboratory" offering a
''manned" mode of operation. As a result of the unique arrangement of the tail section rump,
i t i s possible to load and off load self-propelled vehicles into this aircraft . Consequently,
the use of a specially-equipped mobile ground-truth vehicle i s to be Included as part of the
sensor verification equipment on this aircraft. The ground truth vehicle will be used to provide
ground instrumentation at test sites that do not contain sufficient field equipment for col eoting
the correlative data required for proper sensor evaluation.
The interior view of the C-13OB are shown i n Figure 5. he Systems Manager's console, where
data collection is controlled, contains a tape recorder and other, data handl ing equipmeht.
e-pipe object i s a sky radiance tube for cal ibrat ing the 24-channel multispectral
page 38,Figure 47) being currently buil t for installation i n June 1970. The scanner
ows seen i n the ower l e f t are for the two metric and the six Hasselblad rnulti
y be one of the most significant research instruments contgined in our program.
ca meras
9

8/7/2019 Earth Observations Program Review
http://slidepdf.com/reader/full/earth-observations-program-review 15/95
Figure 5
EARTH RESOURCES SURVEY AIRCRAFT PROGRAM
FLIGHT MISSION TEST SITES FY 1969 AN D 1970TOTAL NUMBER OF MISSIONS
~
FY’69 23
U A
LEGENDOCEANOGRAPHYGEOGRAPHY
e GEOLOGY
o AGRICULTURE/FORESTRY
a HYDROLOGY MEXICO BRAZILmoeoa BI000 a
m
PUERTO RlCOmoe a
BOMEX8 0
NASA HQ SR70-88
11 4-69
Figure 6

8/7/2019 Earth Observations Program Review
http://slidepdf.com/reader/full/earth-observations-program-review 16/95
Figure 6 shows the Earth resources test sites overflown i n FY 1969 and those that will be over-
flown by th e end of N 1970. n FY 1969 NASA Earth resources ai rcra ft conducted 23 missions
970 we expect to conduct 42 missions. A typical mission overflies from three to
n an average. Thus a number of d isciplinary scientists are usually furnished with
esearch data after each mission i s completed. During the coming year, i t i s planned to move
rom individual test sites toward a regional test area concept incorporating, p
of the presently designated test sites. Typical candidate areas for this region
California, the G u l f Coast and one or more estuaries of the northeastern Uni ted States.
In addition to test sites with in the continental U. S., NASA has ini tiated a cooperative test site
research program with two Latin-American countries. The test sites overflown during CY 1969i n Mexico, and Brazil, are shown i n Figure 7 . In Mexic o the NASA ER S P-3A aircraft overflew
six mult idiscip linaty test sites; i n Brazil fiv e test sites were overflown. While i n South America
for the Brazilian program, we were also requested to obtain some data in Argentina i n support
of the International Bio log ical Program. Figure7 shows each test site's approximate locat ion
and the discipl ine involved i n the investigation. Both the user bgencies and NASA have also
provided t rain ing i n remote sensing for foreign nationals. This ini tia l and limited foreign
cooperative program i s i lLstrative of the means by which other countries may eventually beassisted towards participat ion i n ER S activity. This type of experience may be of considerable
use in preparing for the inte rnational impact of ant icipated Earth Resources Technology
Satellite data.
EARTH RESOURCES SURVEY AIRCRAFT PROGRAM
FOREIGN COOPERATIVE TEST SITE RESEARCH
BRAZIL MISSION - 96MSC P-3A ELECTRAJULY 2 - 18, 1969
TEST SITE DIS CIPLIN E
OCEANOGRAPHY
AGRICULTUREElRO HYDROLOGY/GEOGRAPHY
AGRICU LTURE/FO ESTRYEXICO MISSION -
MSC P-3A ELECTRAAPRIL 7 - 20, 1969
TEST SITE DIS CIP LIN E
IXTLAN GEOLOGYELORO GEOLOGYTOLUCA HYDROLOGYCHAPINGO AGRICULTURE/FORESTRYVERACRUZ OCEANOGRAPHYPAPALOAPAN HYDROLOGY
RR I FER0 GEOLOGY
ARGENTINA MISSION - 97MSC P-3A ELECTRAJULY 19 - 20, 1969INTERNATIONAL BIOLOGICAL PROG
TEST SITE DISCIPLINE
PIRANE AGRICULTURE/FORESTRYRlVA DA Vl A AGRICULTURE/FORESTRY
NASA HQ SR70-891 1 4 6 9
SALTA AGRICULTURE/FORESTRY
Figure 7

8/7/2019 Earth Observations Program Review
http://slidepdf.com/reader/full/earth-observations-program-review 17/95
e of data obtained over Mexico i s shown i n Figure 8. This is a color photograph
of the Chapingo Agr icul ture Test Site about 25 miles northeast of Mexico City. (Note that
although this text
i t i s a good examp
alfalfu , peas, barley, oats and wheat, Differences i n stages of growth are d ~ s t i~ g u ~ s h e
photogmph was taken by a metric camera from an altitude of 4,000 feet.). The AgricultureResearch Institu te of Mex ico may be seen i n the lower right corner of the image,
y refer to color, only black and white reproductions are printed.)
of imagery used for crop id ent ~f ic at ~o n*xamples of crops shown are
variat ions i n shades of green, Drainage in cultivated fields can also be distinguished. S
An example of data obtained over Brazil i s shown in Figure9. This is a color IR photo of
the Campinas Agr icul ture Test Site about 250 miles west of Rio de Janeiro. The Central
Research Experiments! Farm of the Campinas Agronomic Lnstitute i s considered to be the most
suituble area Far studies of coffee, soils, and natural vegetation. With this type of f i lm?color IR") red i s indicative of healthy vegetation while yellow is indicative of soil
condition. Some growth can be seen. The green fie lds have been plowed and seeded, withvariations in green indicative of the condition of the soil. Traces of pink in these newly
plowed fields indicate new healthy growth. Traces of blue i n the new fields are indicative
of water. (The photograph was taken with a metric camera from an altitude of about 5,000
Feet.)
Figure 8
12

8/7/2019 Earth Observations Program Review
http://slidepdf.com/reader/full/earth-observations-program-review 18/95
Figure 9
igure 10 summarizes the status of activities
i n the present foreign cooperative prog
with Brazil and Mexico. Data has been
disseminated and reviewed.
can investigators
are due this comin EARTH RESOURCES AIRCRAFT MULTI-DISCIPLINAR Y FLIGHTSMEXICO, AP RIL 1969l S l X TEST FLIGHTS OVERFLOWN1
BRA ZIL, JULY 1969 (FIVE TEST FLIGHTS OVERFLOWN)e
DATA DISSEMINATION AND REVIEWB) NASA AND USER AGENCIES
ME XICA N INVESTIGATORS, JUNE 1969BR AZ ILI AN INVESTIGATORS, SEPTEMBER 1969
PRELIMINARY PROGRESS REPORTS BY FOREIGN INVESTIGATORS
@ MEXICO, SEPTEMBER 1969
e BRAZIL, JANUARY 1970
FINAL REPORTS BY FOREIGN INVESTIGATORS
MEXICO, JUNE 1970@ BRAZIL, SEPTEMBER 1970
$) LATE 1970 OR 1971BR AZ IL IA N AN D MEXIC AN A lR C R AF l O PERAT IO N AL
N i \ S A S W O - l l31-4-69

8/7/2019 Earth Observations Program Review
http://slidepdf.com/reader/full/earth-observations-program-review 19/95
he recent disaster caused by the assage of hurricane Cami l e ove the Gu lf Coast provides
of the potentia for assistance with the existence of aircraft equipped wi th
r damage assessment and
SA Convair a t 5,000 fee
ency planning,
tude the day aft
e-damaged terrain i s shown i n the
coast was overflow
Mississippi harbor.
roximately 80 % of the port%storage and administrative fac li ties were tota
he small craf t harbors on either side of the main harbor were damaged exten
mately 23 feet above mean sea eve1 was observed i n the Louis
can be seen resting on top of the seawall just west of the main harbor. Ahighwater mark of appr
and Nashville Railway
inland from U.S. 90 s mainly fjust east of the main harbor are
ships can be seen to be beached i n the harbor,
inal. Debris in th e western p rtions of the photograph and just
the storage areas at the main harbor. The circular tanksthat remain of the famed Gulfeoast Marine-land. Three
Figure 12 covers a section of the Mississippi Gu lf Coast near Pitcher Point, Long Beach,
Mississippi. This section of coastline is fronted by a man-made beach and a step-type concrete
seawall that i s approximately 10 feet high. Highway U.S. 90 parallels the seawall. Several
features are distinguishable i n th:s photograph: ( I ) a zone of 100% destruction of man-made
cultural structures lies just inland from U.S. 90, (2) a debris line, deposited by the storm tide,
i s apparent and general y conforms to a geologic e levation contour of approximately 18 feet
above mean sea leve l,various residences are tota l y destroyed (rig
shopping center and motel
tree-leveling effects could
nd (3) several motels, a shopping center, a dr ive- in theater and
ter). Figure 13 i s an enlargement of the
th e original master images, tornado-like
inland, near the periphery of the storm. I

8/7/2019 Earth Observations Program Review
http://slidepdf.com/reader/full/earth-observations-program-review 20/95
15
8/7/2019 Earth Observations Program Review
http://slidepdf.com/reader/full/earth-observations-program-review 21/95
This information was supplied to the Corps of Engineers (in Mississippi), to the Off ic e of
Emergency Planning, and the Small Business Administration for whatever use they would make
of i t e We wi l ask them periodically what value they found i n the dataa, As an internal
exercise, the Manned Spacecraft Center i s comparing these data with previously obtained
aircraft data supplied by the Corps of Engineers and Manned Spacecraft Center will turn outa fechnical report on the impact of Camille on these shoreline features.
e THE SPACECRA
Let us now turn to the spacecraft portion of the ER S program, While the ATS and Nimbus
satellites are not formally part of the ERS program, they have provided data of interest
which has assisted the evolution and implementation of ERS. In particular, the Nimbus
High Resolution Infrared (HRIR) sensor data has provided ocean temperature data, and hence,
impl ic it ly , the location of ocean currents such as the Gulf Stream. Some land imagery
from the same sensor has been analyzed by geomorphologists. While this imagery has been
at resolu+ions considered of on ly marginal use i n ERS, i t has provided some encouraging
indicatiens of what may be anticipated from the higher-resolution, dedicated ER S satellites,
The main thrust of the spacecraft program i s the Earth Resources Technology Satellites (ERTS)series, th e f i r s t satellite of which, ERTS-A, i s planned for launch during the fi rst quarter
of 1972. Let us now look at the approved program for ERTS-A & B e The objectives shown
on Figure 14 include the p rincipal mission goals for ERTS-A & B. t i s expected that analysis
of the data acquired by ERTS-A & B wil l provide significant infor tion for each of the
listed objectives. Ou r background studies and the experimentation which we have conducted
i n th e laboratory, i n the field, and by ai rcra ft over the past several years, as we ll as analysis
ofphotography acquired by the Gemini and Apo llo flights, provide a substantial
bas isfor
expecting successful achievement of these objectives by ERTS-A & B. The flow of data from
ERTS-A & B wi l l provide essentially raw (uninterpreted) data to the,user community which
wi ll , in turn, produce the products listed in the chart. The data w i l l also provide a means
to further develop and refine systems to extract and apply the space-acquired information.
As a consequence of the extended time of mission operation, i t should be possible to
accurately assess the performance of the sensors and ancillary data transmission and reproduction
systems. The fl ig ht tests information gained during the ERTS-A & B missions i s expected to
provide extensive systems engineering data for the refinement of fol ow-on missions. Productsto be developed by the user community w i l l include: photo-images at about CI 1:1,000,000
scale, photo-images of large geological features, land-use plots, coastal area plots, and
snow cover plots. These can al l be derived from imagery obtained at the spectral and spatia
resolution performance capabilities specified for the ERTS-A & B sensors. The repeated
coverage each 7 days provided by the ERTS-A & B orbits w il all low addi iona information
to be extracted about time-dependent phenomena such as the variations in snow cover which
may be relatable to water run-off rate and abundance as well as the seasonal variations incolor and tone relating to agriculture and forestry phenomena.
Figure 15 shows the princi
The selection of these sen
performance pa meters of the sensors proposed for ERTS-A.
reflects a careful conside ion of the current state of sensor
EARTH RESOURCES SURVEY P R ~G R A M

8/7/2019 Earth Observations Program Review
http://slidepdf.com/reader/full/earth-observations-program-review 22/95
8 DETERMINE USEFULNESS AND OPERATING
EFFICIENCY OF SYSTEM
8 FLIGHT-TEST SENSORS
8 PROVIDE PRODUCTS TOUSER COMMUNITY
TO DEVELOP APPLICATION S
(OPERATIONAL EXPERIENCE)
- PRODUCE 1:1,OOO, OO SCALE PHOTO
- PLOT GEOLOGICAL FEATURES
- PRODUCE GROSS LAND-USE PLOTS
- PLOT COASTAL AREAS
- PLOT SNOW & ICE COVER
- OBTAIN ANNUAL RECORD OF
TEMPORAL CHANGE
p, 100 N M S W A T H
17DA Y REPEATED
IMAGES
N A S A SR70-901 1-4-69
Figure 14
W
Figure 15
8/7/2019 Earth Observations Program Review
http://slidepdf.com/reader/full/earth-observations-program-review 23/95
The selection of a high-resolution TV system capable of recording images in three regions
of the visible and near I R spectrum i s based primarily upon the need to continuously and
repeatedly acquire images of the best possible spatial resolution over a large surface area.
The provision of a capabil ity for acquiring these images i n the three dif ferent spectral
bands (0.475-0.575, 0.580-0.680, and 0.690-0.830 microns) selected and approved by
the user agencies allows for intercomparison of spectral responses which assist i n identi fying
various Earth resources phenomena. The image format (100 X 100 NM) i s determined largely
by the desire to obtain orthophoto images which are map-like so that correctional modi-
fication is not required.
The four-channel scanner (0.5-0.6, 0.6-0.7, 0.7-0.8, and 0 .8 -1 .1 microns) provides
an extension in spectral coverage to include important longer I R wavelengths. However,
the primary feature which the scanner provides, and which is not readily ava ilable fromthe TV camera system, i s the inherent compatib ility of the scanner data for automated
analysis by di gi ta l computers. The feasib ility o f automatically classifying various Earth
resource phenomena has been demonstrated by experimentation wit h aeria l scanner data.
The ERTS-A scanner wi l l provide a means to extend the technique of automated information
extraction to include data acquired from orbi tal altitudes on a repet itive and large-scale
basis.
ERTS-A & B
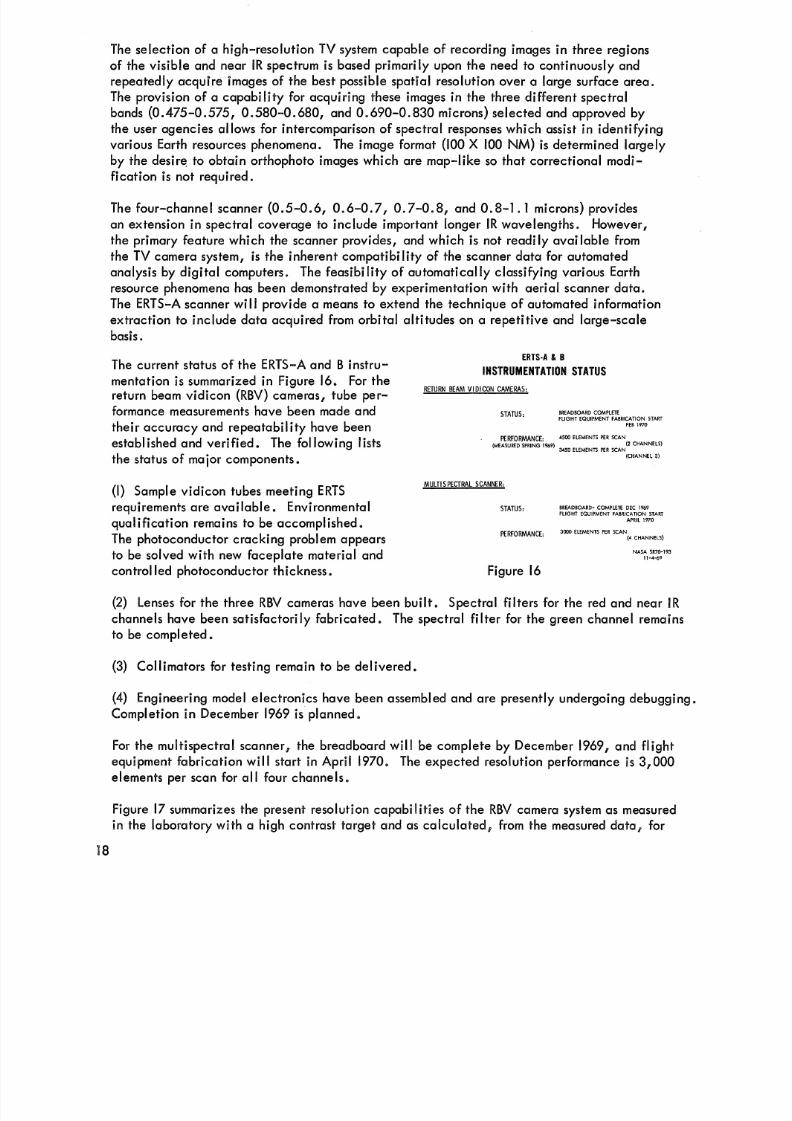
INSTRUMENTATION STATUShe current status of the ERTS-A and B instru-
mentation i s summarized i n Figure 16. For the
return beam vidicon (RBV) cameras, tube per-RETURN BEAMV , O , C O N CAMERAS:
BREADBOARD COMPLETEFLIGHT EQUIPMENT FABRICATION START
formance measurements have been made and
their accuracy and repeatability have been
established and verified. The following l i s t s (MEASUIIED SPRING 1969)
STATUS:
FEB 1970
PERFORMANCE: 45W ELEMENTS PER SCAN
3450 ELEMENTS PER SCAN(2 CHANNELS)
(CHANNEL 3)the status of major components.
(I) Sample vid icon tubes meeting ERTS
requirements are availab le. Environmental
qualification remains to be accomplished.
The photoconductor cracking problem appears
to be solved with new faceplate material and
control ed photoconduc tor thickness e
BREADBOARD- COMPLETE DEC 19 69FLIGHT EQUIPMENT FABRICATION START
STATUS:
APRIL 1970
PERFORMANCE: 3wO ELEMENTS PER SCAN(4 CHANNELS)
NASA SR70-19311 4-69
Figure 16
enses for the three RBV cameras have been bu il t. Spectral fil ters for the red and near I R
channels have been satisfactorily fabricated. The spectral f i l te r for the green channel remains
to be completed.
( 3 ) Collimators for testing remain to be delivered.
(4) Engineering model electronics have been assembled and are presently undergoing debugging.
Completion i n December 1969 i s planned.
For the multispectral scanner, the breadboard w i l l be complete by December 1969, and flight
equipment fabrication will start in April 1970.e lements per scan for a l l four channels,,
he expected resolution performance
ERTS-A & Btypical targets with a standard atmosphere.

8/7/2019 Earth Observations Program Review
http://slidepdf.com/reader/full/earth-observations-program-review 24/95
RBV CAMERA - YPICAL TARGET RESOLVING POWERThe factor of two differences between reso
V lin e and per optical lin e pair AVERAGE GROUND RESOLUTION
should be noted. Thus, the equivalent optica l
resolution indicated in the chart corresponds
to the range 300-550 feet.*
The data collection system referred to in
Figure 15 was selected as a candidate for
ERTS-A in order to test the feasibility of
repetitively collecting and relaying a com-
DESERT SAND VS SHADOW
AVERAGE PLANT VS WET LOAM
prehensive sequence of time-variant data from 'OPTICAL RESOLUTION CORRESPONDS TO WOW LINESNAS& Sum-194
Earth-based sensors. Typical sensors wou ld I 1 - 4 4
measure and transmit to ERTS-A parameters
such as stream flow rates, water content of
snow, moisture and temperature. ERTS-Awould accumulate data on magnetic tape and read it out to ground receiving stations. Th is
i n situ "ground-truth" type data would be ut ili zed in conjunction with the RBV and scanner
images i n conducting user-oriented data u ti li za ti on experiments.
Figure 17
I-
As a result of competitive procurement, GE and TRW have recently been selected to perform a
PhaseB/C
study to definethe ERTS-A
andB
spacecraft and data management systems.It isexpected that each of these aerospace companies w i l l employ, to the most economical and prac-
ticable extent, their existing spacecraft designs in meeting the requirements for the ERTS-A and
B missions. Figure 18 shows the most probable general appearances of the two spacecraft designs.
Upon completion of the Phase B/C study, one spacecraft and data management system w i l l be
selected for development.
The principal design and performance characteristics of ERTS-A and B are shown i n Figure 19,
The one-year li fe time i s required i n order to repetitively observe time var iant phenomena suchas are particularly important in the cases of agriculture and hydrology. The near-polar sun-
synchronous orbi t i s required in order to achieve the necessary repetit ive continuous coverage
EARTH RESOURCES SURVEY PROGRAM
ERTS A&B SPACECRAFT
[PROPOSED]
GE
Figure 18
NASA HQ S ( w - 9 1
1 , 4 4 9
EARTH RESOURCES SURVEY PROGRAM
KEY DESIGN & PERFORMANCE CHARACTERISTICS
OF ERTS A&B
0 LIFETIME OBIECTIVE-ONE YEAR
0 ORBIT-NEAR-POLAR. SUN-SYNCHRONOUS, CIRCULAR, 496 N.M.
o ATTITUDE CONTROL 4 . 7 '
o REPETITIVE COVERAGE EVERY 17 DAYS
0 PAYLOAO CAPACITY-350 LBS
0 SPACECRAFT WEIGHT - 2 0 0 LB S
0 MIN IMU M POWER-20 MINUT E SENSOR OPERATIOW PER ORBIT
0 WIDEBAN D DATA TRANSM ISSION-20MHZ , S-BAND
0 ON-BOAR0 DATA RECORDING
ORBIT ADJUST CAPABILITY
M U Q SIVC-9211-469
Figure 19
* The notation of "in fin ity" in Figure 17 i n the column headed Channel I merely indicates
that th e two target categories cannot be distinguished by the designated RBV camera.
19
at a constant sun-angle and the orbit he ight is determined both by the requirement for synchro-
8/7/2019 Earth Observations Program Review
http://slidepdf.com/reader/full/earth-observations-program-review 25/95
nism and by the need to avoid rapid decay of the orbit, he 0.7 degree attitude control accu-
racy i s adequate for the mission and does not exceed the capabil ity o f available subsystem
technology. The. payload capacity i s required to carry the candidate sensors and data collec-
tion systems and the spacecraft weight is estimated to be commensurate with structures capable
of providing the required payload capacity, power, telemetry, and attitude control systems.
The bandwidth requirement for data transmission is established by the characteristics of thesignal outputs from the sensors. The provision of a tape recorder on-board the spacecraft will
assure ful l coverage and greater fl ex ib il it y i n choices of areas to be covered. Because o f the
wide bandwidth and high data rates involved, data transmission and on-board storage wi l l
represent the greatest challenges to current technology. An orb it adjustment capabil ity i s
necessary to achieve and maintain the required orbit for synchronism and continuous coverage
during the l i fe t ime of the satellite.
The rate and volume of data expected from ERTS-A & B are large and these data will requiregreat care in handling in order to best preserve the qual ity of the origina! sensor responses.
Spectral purity, geometric fide lity , and spatial resolution are a l l extremely important
aspects of these data and later successful extraction of information depends greatly upon
how wel l the systems of recording, transmission, reception, re-recording and reproducing
are accomplished,
Figure 20 shows the essential components of the data handling and contro l system and i t
also indicates th e volume o f data expected each day. The system consists of the commandand data telemetry links, the receiving stations (3), the operations control center (GSFC),the NASA data processing fac il it y (GSFC), and the data services to provide principal
users wi th h igh qua lit y data master copies. The actual locations for receiving stations have
not yet been finalized. The RBV 3-camera television system produces triplets of images and
a total of 180 individual frames showing ground scenes 100 X 100 NM in size are to be taken
daily . The multispectral scanner takes quadruplets of th e scene in the form of a continuous
strip-map 100 NM wide. This strip-map i s to be reproduced i n sections covering ground
lengths of 100 NM so that 240 separate images i n a 100 X 100 NM format will result each
day. The scanner data i s also to be reproduced in magnetic tape format and i n this case
th e data would be continuous rather than separated into frames. These taped data from the
scanner are to be used i n automated information extract ion processes.
The Data Processing Faci i t y w i l l provide the necessary inclusion of annotation for geographica
location and will precision-process perhaps 5% of the data to remove geometric distortions.
Such processing is necessary to faci li ta te those in formation extract ion processes which require
accurate superposition of the several multispectral images of one scene, The data are to bedelivered to th e users i n several formats and degrees of processing depending upon the require-
ments of the part icular invest igation. Raw and processed tape, hard copy color, and hard
copy black-and-white formats are expected to be useful i n the support of the investigations
which have been identifie ERTS-A & B missions. Monitoring th e condition of the
spacecraft and sensors i s c ated to the data handling functions and required real-time
data qual ity assessment in to proper ly command the spacecraft.
20

8/7/2019 Earth Observations Program Review
http://slidepdf.com/reader/full/earth-observations-program-review 26/95
REQUESTS FROM
E A C H D A Y A T NDPF: E A C H D A Y A T D A TA S E R V I C E S :
COMPLETE PHOTO OUTPUT
PLUS PRECISION PROCESSING
OF 5% OF IMAGES AND
REV IMAGES - IELl/DAYM/S SCANNER IMAGES - 240/DAY
DATA COLLECTION SYSTEM - 3 TAPES/DAYER
60 TAPES/DAY
NASA 51370-192I 1 4-69
Figure 20
Processing is required i n order to provide the
experimenters with data of uniformly high
acceptable t ime after acquisition. It is also
necessary to provide a means to rapidly
recognize the need to apply correct ive com-
mands to the satellite and to bring together
the orbital element information with the
images acquired i n order to annotate the data
as to geographical location. Figure 21 shows
th e several inputs and outputs of the data
processing system proposed at the NASAGoddard Space Flight Center (GSFC) to handle
ERTS-A & B data. The blocks show theprincipal functions or operations which are
now iden ti fied as being necessary. The Figure 21ERTS-A & B Phase B/C study will examine
in deta il the structure and funct ion of the data processing system and w i l l define a best-fit
configuration based upon factors such as input flow rates, user format requirements, cost,
qua lity , and speed of delivery.
EARTH RESOURCES SURVEY PROGRAM
ERTS DATA PROCESSINGPLANNEO AT 6SFC
quality , i n a useful format, and within an
ORBITLL itmiins
NLU lao-117l .4dP
TOR FUlURtC O R R iU l lO N
21
he presently large and pidly increasing amount of data bout earth resources relat ing to a

8/7/2019 Earth Observations Program Review
http://slidepdf.com/reader/full/earth-observations-program-review 27/95
large number of scient ific disciplines areas which have a i ady been collected by the ERS
rogram constitute an extremely valuable and unique source of information. The variety
complexity of this aircraft and spacec ft data, many of which are in the form of color fi
and in reports which conta in color or high-resolution photographs, preclude low-cost mass
reproduction without drastic loss of information content. I n order to provide access to these
data for study by investigators and other interested parties, an ER S research data facility(Figure 22) was recently established at the NASA Manned Spacecraft Center (MSC) at Houston,
Texas. A comprehensive cataloging and retrieval system enables th e user to locate data, and
provision i s made for viewing imagery so that specific portions can be selected for further study
as required to support the experimented research.
he graph showing the rate of accumulation of OQCUMEWTS OR PlLE
15801 m 0 1 ' 5 * 2 'ocuments before and since the official
establishment of the facility in
M
12951
12/66 12/67 12/68 12/69
Figure 22
15/25/693/l8/69)~1~ AINDUSTRY EDIEATIONAL 6oyT FfflflGN
CD&tMERCIAL lS ~ U T lO N S GLNCIES AfiEWCILS
Figure 23 summarizes the growth i n th e amount
of datu and indicates the use being made of
the Earth Resources Research Data Facility.
EARTH RESOURCES SURVEY PROGRAM
MSC EARTH RESOURCES DATA FACILITY
OPERATIONAL STATISTICS
affil iations of visitors to th e faci l i ty i s indicative of th e high degree of interest which these
kinds of data create. The re lat ive ly high proportion of visitors from th e industrial and

8/7/2019 Earth Observations Program Review
http://slidepdf.com/reader/full/earth-observations-program-review 28/95
commercial communities indicates strongly that these kinds of data have potentia! for
prac tica l applications. The fact that over one mi ll ion photographic frames are currently on
f i le, indicates the scope of th e evolving ERS data handling problem particularly in view of
the forthcoming ERTS-A & B data.
As part of our ERTS series, i t i s proposed to
uti l ize a f i l m recovery satellite to provide an
early high-resolution record of the earth's
surface i n a number of spectrul bands with
metric accuracy. These fi lm recovery satel-
l i t e s would be functioning during the service
l i fe of ERTS-A & B. The data to be obtained
from these missions w i l l contribute to and makepossible the following objectives (Figure 24):(I) provide a high-resolution record of th e
contiguous United States, Alaska, Hawaii,
and adjacent water areas as a correlation base
for the lower-resolution electronic return data
of ERTS-A & B; (2) provide a comprehensive
inventory of natural resources as a base for
future h ighe r-reso I t ion te l eme ry- type earthresources satellites; and (3) provide an economic
means of preparing and updating mapping infor-
mation for orthophoto maps, thematic maps, and
cartography in general
The payload module for ERTS-C & D would,
conceptually, consist of a camera section and
a f i l m recovery veh icle as shown in Figure 25.included i n the camera section are metric
cameras of approximately the same resolving
power as the Apollo cameras but wi th metric
fidelity. The f i l m recovery veh icle contains
th e exposed f i l m from al l cameras, and provides
reentry and recovery capability when separated
from the rest of the spacecraft at the end of th e
orbital phase of th e mission. The il lust ra tion
shown i n Figure 25 i s based on one contractor's
EARTH RESOWCES SURVEY WIOGRAWI
ERTS C&D FILM RETURN
- ROPOSED OBJECTIVES -PROVIDE EARLY HIGH-QUALITY RECORD OF EARTH'S FEATURES
@ FOR REFERENCE I N ANALYSIS OF ERTS ELECTRONIC
RETURN DATA
0 AS BASE FOR EARTH CHANGES OBSERVED ON LATER FLIGHTS
B MAPPING -EARLY CAPABILITY
NASA HQ SR7W3Il-4-H
Figure 24
EARTH RESOURCES SURVEY PROGRAM
ERTS C&D FILM RECOVERY CONCEPT
INBOARD PROFIE
T l E R L WATER SEAL
CAMERA MVLTISPfCTRAL 1H-W EA RCMRA LINKAGE
FOR 1.M.C. I
(HINGE MOUNTED I1.M.C. CO Nl mL l
NASA SVC-94
I l -CbV
Figure 25
concept presented about two years ago. This and similar work has just been reviewed by MSCin a Phase A study. The proposed concept is now ready for Phase B/C so that launches concur-
rent with ERTS-A & B could be achieved. The proposed recovery sequence I s illustrated i n
igure 26 (over). ni ti at ion of the recovery sequence wi l l be commanded from one of the
round stations prior to the last (recover
e executed i n cooperation with the Air
phase of the recovery cou
23
While i t i s anticipate that ERTS-A &gather data on coasta processes and p

8/7/2019 Earth Observations Program Review
http://slidepdf.com/reader/full/earth-observations-program-review 29/95
Figure 26
some other oceanographic activities, these
f i r s t two ERS dedicated electronic return sate(-
give priority to land-oriented
objectives. In order to more fully satisfy the
important needs of the oceanographic communityat an early date as well as to carry out th e mandate
i n spacecraft oceanography given to NASA by
the Marine Council, i t i s proposed to undertake
ERTS-E & F which w i l l have ocean surveys as
their highest priority objective. In order to
achieve early implementation, ERTS-E & F
would probably employ spacecraft and subsystems
similar to ERTS-A & B but with sensors and orbitsoptimized for ocean surveys. This concept i s
illustrated i n Figure 27.
EARTH RESOURCES SURVEY PROGRAM
ERTS E&F OCEANOGRAPHIC CONCEPT
OBJECTIVES
@SEA STATE
0 OCEAN TEMPERATURE
0 OCEAN CURRENTS
OCEAN COLOR
0 SEA ICE
NASA 51170-97
AND UPWELLING
1 1 4-69
Figure 27
t i s proposed that ERTS-E & F have as the i r mission objectives the acquisition of information
on sea state (ocean waves), ocean surface tempe
ice, and coastal processes. This information wi lother groups for subsequent ana ys is and applications.
ure, Ocean color, ocean currents, sea
e made available to user agencies and
24
n the ERTS-E & F concept, the remote sensor payload would consist of, for example,I infswred scanner and radiometer, a passive microwave scanner, and an imaging

8/7/2019 Earth Observations Program Review
http://slidepdf.com/reader/full/earth-observations-program-review 30/95
spectrometer. Measurements of ocean surface temperatures would be made by the infrared
remote sensors. From measurements of the horizontal temperature gradients, it would be
ssible to delineate major ocean current t
cation, as well as regions of upwelling
ks and their variations both i n time and
r (which are known to bring nutrients up to
the surface layer for the plankton which are the main source of food for schooling fish).
Information on sea state conditions would be obtained by the microwave scanner. The
operating fc:equency of the scanner would be selected to allow the acquisition of signals
through cloud cover as well as during clear conditions. Information on ocean color and
coastal processes would be obtained by the imaging spectrometer.
Because the ocean is a dynamic medium of great extent, special attention wil l be neces-
sary to obtain "ground-tmth" information for. use in correlating the remote sensor data
with the physical parameters being observed. Advantage wil l be taken of oceanographic
research ships of opportunity to gain this information. It is also expected that an Inter-
national Decade of Ocean Exploration will be underway during the conduct of the ERTS-E
& F missions. If this should be the case, plans will be made i n advance for appropriate
coordination. Because of the global coverage of the oceans and the increasing interest
of many nations i n the oceans, it is anticipated that many foreign scientists will be collab-
orating in the analysis and applications of the data. An advanced study of concepts
and mission requirements for ERTS-E & F will be undertaken during the current fiscal year
(FY-70).
There is a need to supplement the larger,
relatively compI ca ted mu ti-sensor sateI i tes
SMALL APPLICATIONS TECHNOLOGY SATELLITE [ SATS )
WEIGHT - ABOUT 250 POUNDS
of the ERTS series with a capability for earlyLAUNCH VEHICLE- SCOUT SIZE
and swpid space flight testing of sensors an d
subsystems. T h e proposed mechanism for
accomplishing this is the Small Applications
Technology Satellite (SATS) illustrated inFigure 28. In the SATS program it i s proposed
to utilize relatively small Scout class space-
craft to conduct a coordinated program ofOBJECTIVES
experimental research and technology develop- 0 TEST CRITICAL SUBSYSTEM IMPROVEMENTS
ment over the entire Space Applications area ,
Having small spacecraft with basically single
purpose experiments will considerably simplify
the mission. The orbits of the SPITS will be
0 ESTABLISH THE UTILITY AND RELIABILITY OF ADVANCED SENSORS
e ACHIEVE EARLY SPACE FLIGHT TESTNASA SR7O-IW
ll-449
Figure 28
optimized for the particular experiments that are carried, and operational requirements
w i l l only be considered on a noninterference b a s i s with the experimental requirements.
Because of the simplicity of the spacecraft and the use of the all-solids Scout launch
vehicle, the turn-around time at the launch pad should be on the order of a few days.
ated that some missions may require durations up to about one year. The SPITS
I sewe i n the accomplishment of ( I ) testing critical subsystem improvements; (2)~ e ~ t ~ n gf advanced sensors; and (3) providing early flight tests for experiments. There are
umber of experiments and experiment prsposa s presently available for implementation on
25
EARTH RESOURCES SURVEY PROGRAM
SMALL APPLICATIONS TECHNOLOGY SATELLITE [S A T S )SATS. A listing for some typical candidate
experiments is shown i n Figure 29. It may- CANDIDATE EXPERIMENTS -

8/7/2019 Earth Observations Program Review
http://slidepdf.com/reader/full/earth-observations-program-review 31/95
DRAG-FREE SATELLITE TECHNOLOGY
e MICROWAVE RADIOMETRY
0 WIDE RANGE IMAGE SPECTROMLTER
0 RADIOMETR IC VERTICAL SENSOR
be noted that, i n addit ion to remote sensing
payloads, data co llec tion and Earth physics-
type payloads (drag-free satelli te and
satellite-altimeter) are included. A Phase A* COMPOSITE RADIWR.R-SCAIIERWR.R
0 VISIBLEEASURMMTADIATIW WLARlZATlON
MlLLlMVERWAVE PROPAGATICN
study is planned on SATS during the current
fiscal year (FY 1970).
The Earth observations program has employed
both manned and unmanned spacecraft for
acquiring data. As mentioned previously,
both the Nimbus and ATS spacecraft have pro-
vided imagery and data which has been useful
in Earth observations; certa inly the early photog-
* NANO-G ACCELERMnEFER
e DATA COLLECTION SATELLITE TECHNOLOGY
0 SATELLITE ALTIMETER TECHNOLOGY
NASA Ha IWC-IO~I l . ld9
Figure 29
raphy from manned missions (Gemini and Apollo) has been a tremendous catalyst i n focusing
attention on the potential o f remote sensing from space platforms. The principa l objectives of
manned mission experiments i n the current program are to determine the role of man, to develop
instrumentation for Earth observation, and to provide an earlier source o f research data for
analysis (Figure 30).
The'various platforms and missions i n the manned
program as they relate to Earth resources are
illustrated in Figure 31. The early hand-held
color photography from Mercury, Gemini and
Apollo provided imagery which a number of
scientists in universities, industry and govern-
ment found of great professional interest. Geol-
ogists, in particular, found that these targe-area,
small scale images revealed features which had
never before been ident ified by conventionalaircraft or ground means. This enthusiasm and
evident promise le d to the design of the first
control ed multispectral photography experiment
(SQ65) carried out during March 1969 from
Apollo 9, Th is experiment employed four
Hasselblad cameras r ig id ly mounted to a hatch
EARTH RESOURCES SURVEY PROGRAM
MANNED MISSION EXPERIMENTS
OBJECTIVES
c1 TO DETERMINE ROtE OF MAN
0 TO DEVELOP INSTRUMENTATION
e TO PRovioE EARLIER SOURCE OF R&D DATA
Figure 30
window of the ApolIoCo&mand Module. Three of the four cameras used black-and-white fi lm
with fil te rs to match the proposed bands (green, red, near-lR} for the ERTS TV cameras. Thefourth camera contained color infrared fi lm. Coverage of a number of user test sites during the
mission confirmed the choice of bands for the ERTS TV cameras QS we ll as prov iding a considsr-
oble quantity of data for user analysis, I t i s also possible ka simulate ERTS data to facilitate
earlier development and checkout of ERTS grou data hand1 ng systems.
An example af Apollo 9 SO65 multispectral imagery i s shown in Figure 32, the now-familiar
Salton Sea - imperial Va lley area. The images shown are in colo r IR, and green, red and
near-IR bands, approximating the proposed ERTS bands. This and similar data has been usedto ve rlfy the capabili ty o f the green band for water penetration, the red and near-tR band for
crop and features identif ica tion and the near- R band for plant stress detection and identifica-
t2on of surface water,
26
EARTH RESOURCES SURVEY PROGRAM
AN ISSl

8/7/2019 Earth Observations Program Review
http://slidepdf.com/reader/full/earth-observations-program-review 32/95
Figure 31
Figure 32
27

8/7/2019 Earth Observations Program Review
http://slidepdf.com/reader/full/earth-observations-program-review 33/95
1~~~~~ 8-11, 19691
COMBINED USE OF SPACE, S MULTANEOUS-AIRCRAFT
L-AIRCRA FT MU LTI-S PECTRAL IMAGERY FOR INVENTORYING
RESOURCES.
w0 EVALUATION OF MULTISPECTRAL PHOTOGRAPHY0 S MULA TION OF ERTS-RBV IMAGERY
0 ADDITIVE COM BINING OF MULTISPECTRAL IMAGERY FOR
APOLLOE OPT IMUM PHENOMENA ENHANCEMENT
RB-57FOTHER DOD
0 5 MULATE 5 PACE PHOTOGRAPHY
.STUDY TIME -VAR IANT PHENOMENA OVER GROW iNG SEASON
n
A
M F D IU M ALT IT U D LN ASA - CV-240
NASA SR70-1 Q(
I 1 - 4 5 '
Figure 33
EARTH RESOURCES SURVEY PROGRAM
SIMULTANEOUS COVERAGE BY
SATELLITE, HIGH-ALTITUDE I LOW-ALTITUDE AIRCRAFT
In addition to the primary objective of verifying
the choice of spectral bands for the ERTS TVcameras, an in it ia l attempt was made in SO65
to evaluate the ut il it y of simultaneous
spacecmft-aircraft imagery and sequential
aircraft imagery for inventorying resources.This is outlined in Figure 33 where the con-
current use of high and medium alt itude aircra ft
i s indicated. The areas of the U.S. over which
simu taneous ai cra and spacecraft imagery
was obtained is indicated i n Figure 34. The
two left-hand areas include the Imperial
ley and Mesa, Arizona, agr icu ltural test
sites while the right-hand areas were coveredby the Forest Service in a timber inventorying
example which will be
Figure 34
Comparative samples of spacecraft, lower-resoiution ai rcra ft and higher-resolution aircra ft,
color-lR imagery are shown i n Figures35, 36 and 37 over). The areashown i s the ~mpe ria ~
t site just above the
600,000, he lower
exican border, The spacecraft image (Figure
image (Figure 36) s at a
igure 37) is a t a scale ofof 1:940,000 and the higher-resolution
28

8/7/2019 Earth Observations Program Review
http://slidepdf.com/reader/full/earth-observations-program-review 34/95
29

8/7/2019 Earth Observations Program Review
http://slidepdf.com/reader/full/earth-observations-program-review 35/95
Figure 37
1:68,000. It may be of interest to note the clear demarcation of the Mexico-U, S. border
due to differences i n land-use practices. The twin cities of Mexicali, Mexico, and
Calexico, California, are clearly seen in the Figure 36.
The test fields, as seen i n Figure 37, are sugar beets (fields I and 2) and alfalfa (fields 3,
4 nd 5). It i s of interest to note that, while the cutlivation patterns first become evidenti n the 1:68,000 image (Figure 37), the tonal signatures are well-preserved i n the smal l -
scale spacecraft imagery. These types of tonal signatures, when combined with sequential
coverage, have established the feasibility of constructing crop calendars which, i n turn
can be used for identification, vigor, and yield estimation.
The time variability of crop signatures is illustmted i n Figure 38 which shows three color
I R images of the same agricultural test site in Mesa, Arizona, taken a t one-month interva
using a high-altitude aircraft. T he first image (on the left) was taken concurrently withSO65 (Apollo 9). A typical wheat field and a typical sugar beet field are indicated on the
images and the tonal progression can be followed from left to right during the growing
season. T h e wheat field shows a very distinctive change i n tone in the May image due to
harvesting having taken place. The sugar beet field shows some tonal change as the growing
season progresses.
tonal var~at~onsn three images p bably due to f i exposure, and processing
techniques.
addition, i f can readily be note
trates some of the difficulties of dependence on photographic f i
hat there are significant overall

8/7/2019 Earth Observations Program Review
http://slidepdf.com/reader/full/earth-observations-program-review 36/95
Figure 38
IV . SUPPORTING RESEARCH AN D TECHNOLOGY (SR&T)
The third major portion of th e ERS program i s referred to as supporting research and technology.
This may be divided roughly in to three general categories: (1) sensor-signature research,
(2) instrumentation research and development, and (3) advanced studies.
1. Sensor-Signature Research - In the earth resources SR&T progmm, we have been pressing
for establishment of quantitative relationships in the analysis of remote sensing. Some
notable work has recently been demonstmted by th e Forest Service i n the application of
Apollo 9 (S065) pacecraft imagery, together with concurrent ai rcraft and ground data,
to the pract ica l operationa! problem of timber inventorying. The principal area inventoried
consisted of 5,000,000 acres of the Mississippi Valley, i n the states of Louisiana, Mississippi
and Arkansas, as shown in the Apo llo 9 color photograph i n Figure 39 (over). The mathe-matical formulation is based on a multi-stage sumpling analysis technique indicated i nFigure 40 (over). The calcu lated timber volume (V) is determined by five stages of sampling
and calculation with the f i r s t stage being dependent direct ly on space imagery, the three
intermediate stages being dependent on ai rcra ft coverage, and the last stage being dependent
on the detailed but limited tree volume measurements on the ground.
31

8/7/2019 Earth Observations Program Review
http://slidepdf.com/reader/full/earth-observations-program-review 37/95
Figure 39
Very briefly, the procedure i s as fo
frame of the space imagery (Figure
divided into 4 x 4 mile squares, and estimates
of the percentage of timber i n each square are
made. More detailed estimates from aeria l
photography at scales o f 1:60,000, 1:12,000and 1:2,000 are made on a probability Ibasis.
The sample areas f 9 :2,000scale are divided
in to four quadran and the actual timber
content of each of these samples is esti
and measured on the ground by a further
sampling technique. Without delv ing int o
the mathematical deta ils any further, the
procedure can be viewed as bridging, by
statistical techniques, t
le measurements that can be done
EARTH RESOURCES SURVEY PROGRAM
OF
VOLUMEON ROTst STAGE
VOLUME INSTUP
-PACE - AIRCRAFT- - ROUND-
igure 40
32
he calculations carried out i n this pilo t i n ntory of 5,000,000 acres have demonstrated a
reduction i n expected error i n th e timber v me estimate from 31% to 13% due direct ly to
the uti l ization of the space imagery. This represents an 58% reduction in error which can bereflected direct ly i n aircraft-hours and man-hours required to complete the inventory with

8/7/2019 Earth Observations Program Review
http://slidepdf.com/reader/full/earth-observations-program-review 38/95
a fixed expected error. Thus, with the benefit of the information obtained from the Apol lo 9photography, i t would have been possible to reduce the required man-hours by a factor of
approximately 6:l while maintaining the same accuracy i n the estimate of timber volume.
These 6:l savings apply d irect ly to the aircraft flight hours, the maintenance crews, thephotointerpreters who evaluate the large-scale aer ial photos, and the field crews who locate
the plots on the ground and measure the sample trees.
This app lication example demonstrates the potent ial for pract ical savings i n operational
inventorying problems through exp loit ing the complementary nature of space and aer ial
imagery i n a statistical sampling approach. The technique should be applicable to other
Earth resources inventory ing problems.
Significant progress i s also being made i n the area of automatic classification of Earth
features using dig it ized data as i s obtained from a multispectral scanner. The original work
done at Purdue Univers ity was focused on crop ident if icat ion and considerable success has
been achieved and previously reported on. More recently, attempts have been underway
to extend these identi fica tion techniques to other types of Earth features. Some promising
results i n automatic soil classification as illust rated i n Figure 41. The area shown is an
agricultural test site in Tippicanoe County, Indiana. Both digi tized images were processed
33
from line scan information obtained with the Mich igan multispectral scanner.
image represents the classificat ion of soils by standard color indices. Thshows the same test area classified according to organic matter content.

8/7/2019 Earth Observations Program Review
http://slidepdf.com/reader/full/earth-observations-program-review 39/95
automatic classifications correlated over 90% correct when compared to
measurements
The Purdue automatic d ig ital class ification techniques are being extended in to the geologica
area. A promising example o f automatic terrain class ification i s shown in Figure 42. Ten
terrain classes have been identi fied i n a test area within Yellowstone Nationa l Park. Three
classi fication results are.shown. In the top one, an optimum set of four spectra
used; i n the midd le band, the three proposed ERTS bands were used; and, i n the bottom one,
a thermal I R band was substituted for the ERTS green band. I t i s significant to note that:
( I ) a l l three c rite ria produced relat ively high levels of correlation with ground truth (81-86%)and (2) that the ERTS bands produced very nearly the same accuracy (82%) as the four
optimum bands (86%). This indicates considerable promise for automatic terrain class ification
from ERTS data.
Figure 42
Le t us now take a look at the oceanographic area and particular ly some implications for what
we may expect i n this app & B data. A significant Apollo 9 handheld
color photograph of Cape ina, i s shown i n Figure 43. This image has
been color separated into two black-and-white images as shown in igure 44 and Figure 45(over). Figure 44 now represents what would be seen by the ERTS- d band and Figure 45,represents what would be seen by the E S-green band, The red band shows on ly surface and
34

8/7/2019 Earth Observations Program Review
http://slidepdf.com/reader/full/earth-observations-program-review 40/95
igure 43
C OAS TAL I ~ A ~ E ~ ~ - C ~ ~ EOOKOUT, NORTH CWHOLINA
REP SEPARATION [ A P O t L O 9)
35
es such as sediment, shoals, etc., while the green band penetrates to
one may conclude that coastal processes, such as large-scale
sedimentation flow patterns, together with the smaller-scale behavior in the i nlet areas,

8/7/2019 Earth Observations Program Review
http://slidepdf.com/reader/full/earth-observations-program-review 41/95
al ly be observable in the green and, perhaps, sed band of ERTS-A 81 B e Actua!
I water column are
vbmersible measurements
est panels of known
hese test panels carried
roach will be expanded
surements of subsurface
bsurface targets.
EARTH RESOURCES SURV€Y P ROGRAM
COASTAL I MAG ER Y - C A P E LOOKOUT, NORTH ~ ~ ~ ~ L lGREEN ~ E ~ ~ ~ ~ TAPOLkO 91
igure45
instrumentation is the
lation i n the C-1308urrent procurermen
nner indicates
BENDIX 24-CHANN EL RESEARCH SCANNER
E A R T H R E S OU R C E S S U R V E Y A I R C R A F T P R QB R A M

8/7/2019 Earth Observations Program Review
http://slidepdf.com/reader/full/earth-observations-program-review 42/95
GENERAL ARRANGEMENT
(Not Including Aircraft Control Consolar)
NASA SR70-1751 1-4-59
GROUND DATA STATION
4 UP1
Figure 46
appropriate to th e various bands. In addit ion to the scanner itself, airborne control consoles
wi l l be provided as wi l l the ground data station illustrated i n the figure. The total weight of
airborne equipment w i l be about 2,600 pounds.
Our experimentation and studies over the past several years indicate that the variances in
spectral' response of many Earth resource phenomena provide a means of remote mapping and
iden tification. In order fo r the analysis to be effective, however, one must be able to
simultaneously observe the response of the object i n the several desired spectral regions.I f taken with several separate instruments, the intercomparisons of response become inaccurate
because of extreme di ff icul ti es i n achieving registration and because of instrument response
differences. If the observations are made through a single aperture by one instrument such
as the scanner depicted in Figure 46, there i s inherent registration and the relati ve instru-
mental error i s much easier to control. Equally important is that the outputs from a multi-
channel scanner can conveniently be stored on magnetic tape, hence assuring that the
spatial relationships as well as the radiometic response of each element of the scene are
preserved and can be read-out as required. Of considerable importance is that the recordeddata is compatible with automated processing methods by digital computers so that the complex
operations involved i n analysis and interpretation can be m pidly and accurately completed.
Th e 24-channel scanner i s designed to be a research instrument which shou d provide a wide
range of information about the nature of the "signaturest8 which provide the means to iEarth resources phenomena, I t is not expected that as many as 24 channels of data wi
required toachieve a isfactory probability of correct classification of any individual Earth

8/7/2019 Earth Observations Program Review
http://slidepdf.com/reader/full/earth-observations-program-review 43/95
resources phenomena. any single case, perhaps three to seven channels w i l l prove
adequate. However, di fferen t classes of objects may require a dif ferent set of channels for
optimum classification accuracy and there i s great pract ical value i n knowing which spectral
bands are most suitable for the identif ica tion of a variety of economically significant
phenomena. The selection of optimum numbers of channels and wavelengths needed for data
acquisition from space by multi-channel scanners i s highly sign ificant i n terms of costs and
complexity of fl ight equipment, on-board storage, down-l ink transmission, and on-the-ground
data management.
Figure 47 provides an overa ll view of the
FY 1969and FY 1970 levels of effort for
research and for procurement of instruments
for Earth resource remote sensing and data
management. The differences i n dollar
scales for the research and th e procurement
areas should be noted when examining the
figure. The funding for instrument research
(top of Figure 47) i s categorized according to
the spectral region i n which th e deviceoperates. The generic types of instruments
include cameras, radiometers, spectrometers,
and radars. Both imaging and non-imaging
INFRAREO
MICROWAVE
OAT4 PROCESSIU6
FUNOlNs IYILLIMIS PT DOLURSlINSTRUMENT PROCUREMENT
TElEVlSlOU ClMERAS
Nasi\ *o illO.110i l . l d P
- -
systems are being investigated as well as are
the related instrumentation for data reduction
and information extraction. The instrument
research category generally carries the work through th e feasibility study phase and usually
includes the demonstration of performance by means of laboratory or f ie ld test models whichin turn serve to define versions of th e device which would be suitable for aerial or space
fl ight development and experimentation. The instrument procurement category (bottom of
Figure 47) includes the funding levels aimed at the build ing of hardware to meet the specifi-
cations required for use in the aircraft program and i n the ERTS-A & B spacecraft program.
The very s igni ficant increases in spacecraft instrument procurement in N 1970 is , of course,
a reflection of th e ERTS-A & B program implementat ion,
Figure 47
3. Advanced Studies - In order to effectively guide research efforts and allocate fundingin the Earth Resources Survey Program, i t i s necessary to develop some understanding of
what the total Earth resources survey system may be, both in th e operational prototype
phase and subsequent operational phase. T h i s type of understanding is being acquired bymeans of our advanced study program. The evolu tion of this study program is illustrated i n
Figure 48. Initiully, the ef fort was responsive largely to program just ification needs and
was focused on cost-benefit analyses i n a future operational context. n order to proceed,
i t was Zcessary to conceptua future operational systems, before any
economic analysis could be done. Aside from the questions of cost and benefits per se, the
38
EARTH RESOURCES SURVEY PROGRAbl
ADVANCED STUDIES
COST BENEFITrnNALYSIS - EVDLUT'DN -
conceptualization and study of these future
operational systems have been useful i n
providing some insight into future data system
requirements, in to def ining data ut i iza tian

8/7/2019 Earth Observations Program Review
http://slidepdf.com/reader/full/earth-observations-program-review 44/95
UTILIZATION EXPERIMENTS
MEET FUTURENASA "a wo- im
11-4-69
experiments for the forthcoming series o f
Earth Resources echnology Satelli tes (ERTS-A
& B), and into planning a research program
to meet future operationai needs. Basically,these studies have provided a framework of
the synthesis and analysis of future total
operational systems and,for this purpose, may
have more general application.
The i n it ia l studies analyzed fiv e examples of
hypothetica I sate l I te-assisted operationa
appl icat ion systems, (rice production manage-
Figure 48
ment, wheat rust control, regional water management, Paci fic tuna fishing, and malaria
control) each ut il iz ing a dif ferent sensor-platform system. Each system was "optimized" for
i t s particular purpose; no attempt was made to derive a common hardware system which could
accomplish more than one application. A later study, being done by Planning Research
Corporation (NASA Contract NASW-1816), has analyzed i n considerably more detail, three
promisi ng appI a ions: regionaI water management, wheat production management, and
wheat rust control. In this later study,a single hardware system has been conceptualized for
performing a l l three applications. This study
has been conducted with the general guidance
of the interagemy Earth Resources Survey
fu l l coordination has not yet been completed
with the ERSPRC, cost-benefit relationships
for such a future operational concept appear
promising as indicated i n Figure 49. The
benefits and costs shown are the totals for
an assumed 20-year operational period
w i t h both costs and benefits discounted at
a 10% rate back to the year of investment
decision
COST-BENEFIT ESTIMATES *SATELLITE-ASSISTED SYSTEM FOR WATER MANAGEMENT & AGRICULTUREIBASED ON PLANNING RESEARCH CORPORATION STUDY, CONTRACT NASW-1816)
lBlLllONS OF OOLURSl
Program Review Committee (ERSPRC). While
BENEFITS NASA Ha 5~70-im' T OT AL S FOR 20 E A R S . O l S C O U N Tl O I T 10% I,-4-69There are some important limit ing assumptionsops: OpemtionINW lnvontory
i n these studies which should be recognized..Some of these are as follows: (I)The Figure 49
conceptual systems employed spacecraft
platforms only--no mixes of ai rcra ft and spacecraft data gathering were considered since thiswould have excessiveJy complicated the studies at this point, (2) The economic models
employed were of necessity fa ir ly rudimentary. Completely satisfying and applicable
economic models are genera ly not available, and (3) A considerable amount of research and
development has been assum d to have been accomplishable--and ccomplished--in order to
accept technical feas ib ili ty for the operationa system concepts, view of these considera-tions, the numerical cost-benefit estimates should be used with caution and are not
necessarily the primary outputs of these studies.
39
Any rea listic to tal operat nal system i s not l ik ely to be solely a spacecraft system nor sole
an aircra ft system, but w be, i n a l l likelihood, a combination of a number of spacecraft,
a number of ai rcra ft and a considerable array of ground-based data-gathering capabil ities

8/7/2019 Earth Observations Program Review
http://slidepdf.com/reader/full/earth-observations-program-review 45/95
as represented by river gauges, meteorological stations, ocean buoys and, possibly, balloons.
I hese information sources would have to beconsidered for incorporation into the total
system
A complete model o f an operational ERS system
shown i n Figure 50. The observation systems
vide remote sensing data. These data, after
processing, must serve as input to Earth-science-
based models which can provide status interpreta-
tions and predictions of physical phenomena which,in turn, can be used by managers, by means of
management decision models to determine manage-
ment actions. The management decisions are also
affected by non-physical inputs, e.g., i n th e
of these latter factors can be taken into account
principally i n a qualitative way. The manage- Figure 50
ment actions are shown impacting on the
resource problem. Na tu ra l phenomena also af fect the resource problem but, as yet, we have
no control over this input. The resource problem, as manifested by Earth conditions, i s
observable by means of the observation systems. It i s clear, of course, that the impact of
management actions on Earth conditions will often be modest in re lation to th e impact of:
natural phenomena. The elements shown i n th e Figure 50 represent the essential functional
elements of any total Earth resources survey system. In most cases, i t i s important that the
total closed loop system be considered i f the requirements of the operat ional system are to
be ful y understood.
must contain at least the essential elements MOOELtNG OF AN OPERATIONAL ERS SYSTEM
METEOROLOGICAL EARTH PHYSICS WOK PHYS ICAL(spacecraft, ai rcraft and ground-based) pro- MODELS MOOELS INP UTS
NASA HO SloO-lO?
poli tica l, economic, and social areas. Some I 1-449
RELEVANCE MATRICES
FOR AN OPERATIONAL ERS SYSTEM'
MANAGEMENT AREAS
I l lPHYSICAL STATUSI
PREDICTIONS
I l lMEASURMENTS
NASA MQ SR7O-IO11-449
igure 51
How can we provide an analytic framework for
synthesis and analysis o f these future systems?
t is generally not feasible at this time to
imply write down sets of diff eren tial equations
which describe the dynamic behavior i n each
of the boxes shown i n Figure50.
I t has,
however, been possible to develop what have
been termed multi-stage "relevance matrices. 'I
These are illust rated symbolically i n Figure 51and have a one-to-one correspondence with
the more conventiona ock diagram pieces
shown i n Figure 50,
tion systems matrix which relates sensorcapabil ities to the measurements which can be
made with these sensors of Earth conditions.
igure 51 i s shown, symb
The Earth science model matrix relates these measurements to predictions and the management
decision model matrix relates predictions to management and benefi t areas. In each cel l afthese matrices i t i t possible to insert a number ind ica tive of the state of knowledge and
relevance for that ce e, the numbers i n a column o f the Earth science model

8/7/2019 Earth Observations Program Review
http://slidepdf.com/reader/full/earth-observations-program-review 46/95
matrix would indica t
o f the measurements to the predic tion associate wi th the particular column,
A particular example from the regional water management case study
This information, based on the case study of satellite-assisted r
ut il ized the Bonneville Power Administration operation in the Cmodel for detailed analysis and subsequent extrapolation to the
applicable regions, to the entire U.S.situat ion where a single input i s "sufficient," by itself, to provide a l l data necessary for a
single output, I t is clear i n this example, and i n general, that there are no simple one-to-
one causal relationships between a single input and a single output
with the management decision matrix (upper left), we see that the
optimum drawdown-refill strategy (for cy cl ical dams) is dependent
abi ity of five predictions (shown by the 112'sf1).One of these five
seasonal snowmelt runoff, i s dependent on the l i s t of measurement
indicated i n each cel l, ;.e., suf ficient by itse lf el),major contri
contribution p3). If we look at one of these measurements, snow
sensors are u ti li ze d to infer this measurement. Snow temperature,
dependent on the thermal ( IR ) channel of the scanner. The assessments i n the chart aredependent on technological capabil ities assumed feasible for the operational time f
timate of the potentia l rela tive contributions of each-
In this matrix, the number " 1 " would denote a
EARTH RESOURCES SURVEY PROGRAM
RELEVANCE MATRICES FOR REGJONAL WATER MANAGEMENT STUDY(SIMPLIFIED FOR EARLY OWRATIONAL CONCEPT)
DWIWOOWN-REFILL STWIT€GY 2 2 2 3 3 2 2INTER-RESERVOIR COORDINATION 3 3 2 3 3 3 2HEAD EFFICIENCIES AND HEDGE 3 3 2 3 2 2 2FLOOD CONTROLIRRIGATION 1. SUFFICIENT
2. MAJOR CONTRIBUTION3. CONTRIBUTION
2 2 3 3 2 3
E!2 3 2 3 3
MANAGEMENT AREAS
g g a2 5 g g
2 2 2 2 3 RAINFALL
SNOW AREA
SNOW WATER EQUIVALENT
SNOW TEMPERAWE
SNOW ALBEDO
GROUND EMPER AWE
SOIL MOISTURE
EVAPOTWINSPIRATION
CLOUD COVER
NASA SUO-I 0911-4-69
Figure 52
4
selected and are, of course, subject to some debate, However, one can in fer from the
observation system matrix (F gure 52, lower right) that the multispectml Scanner is a key
sensor in this application an should receive appro
been reflected i n the summary of instrumentation Rfunding, Fortunately this has
previously presented

8/7/2019 Earth Observations Program Review
http://slidepdf.com/reader/full/earth-observations-program-review 47/95
Through the use of mode ing techniques supported by multi-stage relevance matrices, i t has
been possible to develop a practical format and ana ytical fmmework for synthesizing and
examining future operational Earth resources surveyanalyt ical framework gives promise of: (0 eing us
must preceed future space-assisted operational man
(2) providing a basis for design of data ut ili za tio n experiments for R&D spacecraft systems
such as the planned Earth Resources Technology Satellites (ERTS).
In add ition there are three other conclusions which appear significant : ( I ) there is a
cr iti ca l need for development of Earth-science-based models which can make effect ive
use of the synoptic, repeti tive of spacecraft systems, (2) the presentlyprogrammed ERTS flight system provide an outstanding opportunity to
develop and vaIidate8pammetelPs f interpret ive and predictive models, and
(3) i n many cases of dynamic Earth g. ,water management and agriculture,
there is a first order intemction bet gical models and Earth-science-based
models. This relationship requires in examining any future operational
Earth resources survey systems.
i n planning the extensive R&D which
ent of dynamic Easth phenomena and
,
SO AND QCEAN PHYSICS. NASA-SPQNSQR
An important development during the past year has been the recognition of the significant
relationships between Earth and ocean physics and the space-based precision tracking
capab ili ties emerging from the NASA-managed National Geodetic Satell ite Program.
This recognition led to the spons , uring Avgvst 1969 of a two-week Summer
Study on Solid Earth and Ocean ams College, Wi Iliamstown, Massachusetts.The purpose of the Summer Study was threefold:: (I) to identi fy important problems relating
to the dynamics of the solid Ea
the applicat ion of space techn
(2) to assess the value of the a
of furthering fundamental understandi
of the Earth, and in terms of attackin
to indicate a lternate approaches for
evaluation (Figure 53) e
and the oceans whose solutions would be fac il itated by
gy and precision, space-oriented, measurement techniques
on measurement techniques i n terms
cesses i n the solid and
f environmental prob le
, xperiment definition, and problem
Participation in the Summe
foreign scientists from geod
disc ipline areas; sci
representatives from
uded U S. and
sical oceanography
nt techniques, and
2
he Summer Study emerged as an effective
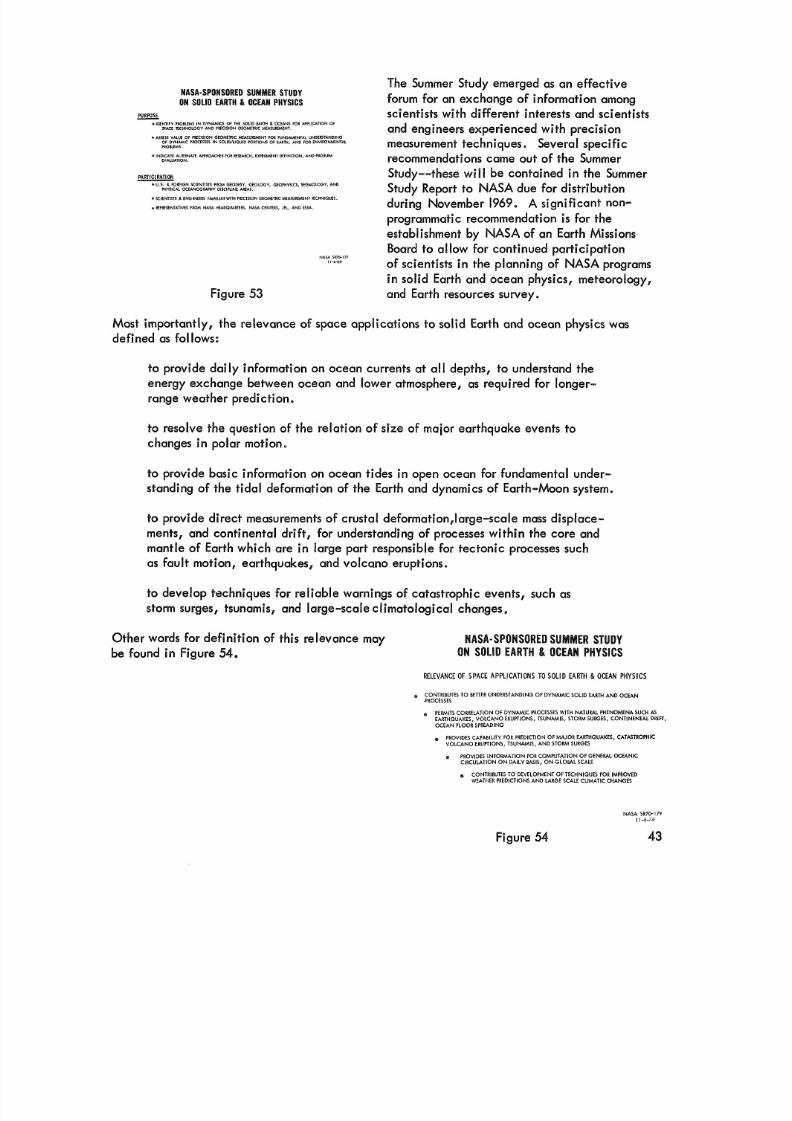
8/7/2019 Earth Observations Program Review
http://slidepdf.com/reader/full/earth-observations-program-review 48/95
ON SOLID EARTH & OCEAN PHYSICS
PURWSE-* WNTIIY P R O K lE M S IN Dyu4MICS OF THE SOLID EAUH L OCEANS FOR APPLICATION OF
SPACE TECHNOLOGY AND PECISION GEOMEWC MEAIUWENT
e ASYSS VALUE OF PEClSlON GEOMEtUC MEASUWENT FOR FUNDWENTAL UNDEIISTANDINGOf O W I C PROCESSES IN SOLID/LIOUID PORTIONSOs E M M , A N D FOR ENVIRONMENTALPIIOKLEMS
0 INDICATE ALIRNATE APPROACWSFOR PLXARCH. EXPERIMENT DEFINITION, AND SROBLulEVALUATION.
PARTICIPATION
e U . 1 . 6 FOEIGN ICIENTISTS FROM GIODESY, GEOLOGY. GEOPHYSIC I, WWOLO GV. ANDPHYflCAl OCEA NOGW HY DISCIPLINE AEAS.
e XIENI~STS L ENGINEELSw.munwim SKIIION GEOMETRIC EASUREMENT TECHNIQUES.
EIEY NTATIV IS FROM NASA HEADQUAREG, NASA CENTEP5, JPL. AN D ESSA.
Figure 53
forum for an exchange of information among
scientists with different interests and scientists
and engineers experienced with precisionmeasurement techniques Several specific
recommendations came out o f the Summer
Study--these wi I be contained i n the Summer
Study Report to NASA due for distribution
during November 1969. A significant non-
programmatic recommendation is for the
establishment by NASA of an Earth Missions
Board to allow for continued participationof scientists in the planning of NASA programs
in solid Earth and ocean physics, meteorology,
and Earth resources survey.
Most importantly, the relevance of space applications to solid Earth and ocean physics was
defined as follows:
to provide da ily information on ocean currents at a l depths, to understand theenergy exchange between ocean and lower atmosphere, as required for longer-
range weather prediction.
to resolve the question of the relation of size of major earthquake events to
changes i n polar motion,
to provide basic information on ocean tides in open ocean for fundamental under-
standing of the ti da l deformation of the Earth and dynamics of Earth-Moon system.
to provide direct measurements of crusta deformat on I arge-sca le mass dispI ce-, nd continental drift, for understanding of processes within the core and
e of Earth which are i n large part responsible for tectonic processes such
as faul t motion, earthquakes, and volcano eruptions.
to develop techniques for re liab le warnings of catastrophic events, such as
storm surges, tsunamis, and large-sca e cl imatolog ical c
r definition of this relevance may Y
s
RELEVANCE OF SPACE APPLICATIONS TO SOL ID EARTH & OCEAN PHYSICS
6 CONTRIBUTES TO BETTER UNDERS TAND ING OF DYNAMIC SOLID EARTH AND OCEANPROCESSES
P E R M I T S CORRELATION OF DYNAMIC PROCESSES WITH NATURAL PHENOMENA SUCH AS
EARTHQUAKES, VOLC ANO ERUPTIONS, TSUNAM IS, STORM SURGES, C ONTI NENTA L DRIFT,OCEAN FLOOR SPREADING
PROVIDES CAPABILITY FOR PREDICTION OF MAJOR EARTHQUAKES, CATASTROPHICVOLCANO ERUPTIONS, TSUNAMIS, AND STORM SURGES
0 PROVIDES INFORMATION FOR COMPUTATION OF GENERAL OCEANICCIRCULATION O N DAILY BASIS, O N GLOBAL SCALE
CONTRIBUTES TO DEVELOPMENT OF TECHNIQUES FOR IMPROVEDWEATHER PREDICTIONS AND LARGE SCALE CLIMATIC CHANGES
VI. OVERALL I N V O L V ~ ~ N TN D MANAGEMENT
EARTH RESWRCES SURVEY PllBSRAH
The overall involvement of NASA centers in

8/7/2019 Earth Observations Program Review
http://slidepdf.com/reader/full/earth-observations-program-review 49/95
NASA ORGAWITATIMIAL INVOLVEMENTthe Earth Resources Survey Program isillustrated i n Figure 55. The dominant role
of MSC and GSFC i s evident. I t i s antici-
pated that, when the SATS program i s
in it ia ted and when experiments for the DW5-space station experiment modules and shuttle
are initiated , the involvement w i l l broaden
significantI .
The distribu tion of funding by program
entiated from proposed programs. The
proposed funding i s based on an assumed
FY 71 start for ERTS-C & D ( f i lm return)
and an FY 72 start for ERTS-E & F (oceanographic). It i s anticipa ted that projected
follow-on ERTS and possible operational prototype systems w i l l require a continued
growth i n total funding.
Figure 55
EARTH RESOURCES SURVEY PROGRAM
FUNDING BY PROJECT
(MILLIONS OF DOLLARSI
1985 1666 1967 1968 1969 1970 1971 1972 1973 1934 f975
NASA SR70-120ISCAL YEAR
*APPROVED PROGRAM 1 1-4-69
Figure 56

8/7/2019 Earth Observations Program Review
http://slidepdf.com/reader/full/earth-observations-program-review 50/95
A significant accomp ishment during the past
year has been the eo tinued development of the
interagency Earth Resources Survey Program
Review Committee (ERSPRC) as the primary
vehicle for accomplishing interagency
ation for the ER S program (Figure 57).The function of the group is to review the
total ERS program from a nationa l and poli cy
viewpoint and to deal with any substantive
issues i n the programmatic and pol icy areasa
Representation is at or near the AssistantSecretary level from NASA, USDI, USDA,
USDC and Navy Department. Arrangements
EARTH RESOURCES SURVEY P R O G R A ~ EVIEW COMMITTEE*irumnow: REVEW TOTAL as PRWRAUS WOSUBSTMIVIVCSSUES
IWlllRLlAN
DR . JDHn E. NAUGLE. NASA
OR. RL SeuntRs~ yil. A W RUTRIN,
N*% HQ 1170-111I 1 4 9
'REF NASA . MI #1154.8, JULY 15,1S811)
have been made for-attendance of observers
from Bureau of the Budget, Marine Council,
Space Council, Of fi ce of Science and Technology, and Department of Transportation. The
committee has established two working subcommittees, one to gu ide and review systems and
benefits studies and the second to deal with international matters. Among the ac tion of the
ERSPRC have been: (I) eview and approval of specifications for ERTS-A & B, (2) developmentof a position paper on plans for international involvement in ERS for use by U.S. foreign
service personnel and (3) supervision and coordination o f a study of a satellite-assisted system
for water management and agriculture.
Figure 59
igure 58 summarizes the history of transfer
of NASA funds to the user agencies of the
ERSPRC for the development of the ER S program.
In addition, user agencies have been providing
their own funds i n support o f earth resources
survey. For example, the Department of
interior has allocated over $1 1,500,000 since
1964, and the Department of Agricu lture
has allocated nearly $2,95O,OOOduring t h i s
same period. I t has been agreed upon, a t
the level, that NASA transfer fundsW i l l o taper Q f f during the next few
years wi th the user agencies assuming the
growing funding burden in their particular
disciplinary areas. This curtailment of the
need for transfer funds w i l l permit NASAter f ~ e x i b ~ ~ ~ t yn funding of ERTS
EARTH RESOURCES SURMY PRQRAM
USER AGENCY FUNDINGINASA FUNOSl
-.-I AVERAEE/VEAR E 13.6% ~
NASA HQ 1170'113114-69
FISCAL VEAR
igur
There has been, from the inception of the ERS program, a significant involvement of univer-
sities, their faculties, staffs and graduate students. The extent of this involvement i s
illustrated i n Figure 59. Some 27 universities are involved spread over 23 states. The four
principal centers are the university of Michigan, Purdue University, University of Kansas,
and the University of California a t Berkeley. While somewhat modest compared to the

8/7/2019 Earth Observations Program Review
http://slidepdf.com/reader/full/earth-observations-program-review 51/95
university effort i n the sciences, these ERS-university involvements have played a vital role
i n supporting key research areas. For example, Purdue has been the lead research center
i n automatic digitized classification of Earth features, first for agriculture and now extendinginto geology an d other disciplines. The group led by Dr. R. N. Colwell at Berkeley has
pioneered i n sensor-signature research i n agriculture and forestry.
1 RESOURCES SURVEY PROGRAM
~ N I V E R S I T ~NVOLVEMENT0
UNIVERSITY OF ALASKA
UNIVERS
I@ ! KANSAS 05
1 f l 6 0 K
--.,,I-.
NASA HQ SR70-1141 1 -4-59
Figure 59
The distribution of ERS SR&T funds in FY 1970 EARTH RESOURCES SURVEY PROGRAM
DISTRIBUTION OF SR&T FUNDING, FY-1970is shown i n Figure 60. It can be seen that
approximately 45% of all SR&T funds eventua
go to universities, 13% going directly fromNASA and the balance via user agencies. The
balance of 55% of SR&T funds is spent i n
industry or directly within the user agencies.SR&T
NASA HQ SWO-Ill11.469
igure 60
et us review some of the recent sign ificant accompIishments i n the E

8/7/2019 Earth Observations Program Review
http://slidepdf.com/reader/full/earth-observations-program-review 52/95
ese are lis ted i n Figure 61. We have conducted th first contro lled multispect
bands for ERTS-A & B e This experimentm space which has verified the selection of spect
with i t s concurrent aircraft coverage has demonstrated the utility of combined spacecraftai rc ra ft and ground coverage for multi-stage inventorying of resources. The associated
sequential high-alti tude multispectra! photography through the growing season has demon-
strated the feas ibi lity of crop calendars to faci li ta te identifica tion, as well as vigor, and
yie ld estimation for crops. Continued success with automated digi tized crop classi fication
has been extended to geological features. The first dedicated ER S multi-sensor research
spacecraft program (ERTS-A & B) has been ini tia ted. The ERSPRC has been established as the
vehicle for interagency coordination of programmatic and po lic y issues at a national level.
Through our studies of total ERS systems, conducted under the cognizance of the ERSPRC, wehave improved our understanding of total ER S system requirements inc lud ing data handling
and management. Through the recent NASA Summer Study we have improved our under-
standing of potent ial satellite applications to Earth and ocean physics.
EARTH RESOURCES SURVEY PROGRAM
ACCOMPLISHMENTS
F I R S T C O N TR O LL E D M U L T I - S P E C T R A L P H O TO G R A P H Y F R O M S P A C E
C OM B IN ED S PACECRAFT-A IR C R AF T C OVER AGE F OR M U LT I - ST A GE AN A LYS I S
S E Q U E N T I A L H IG H - A L T I T U D E A I R C R A F T C O V E R AG E D U R I N G G R O W I N G S E A S O N
E X T E N S I O N OF A G R I C U L T U R A L A U T O M A T I C D A T A P R O C E S S I N G T O
GEOLO GIC AL F EAT U R ES
I N I T I A T I O N OF ERTS A & B
I M P L E M E N T A T I O N OF E R S P R C A S V E H I C L E F O R I N T E R A G E N C YC O O R D I N A T I O N
I M P R O V E D U N D E R S T A N D IN G OF T O T A L E R S S Y S T E M R E Q U I R E M E N T S
I M P R O V E D U N D E R S T A N D IN G OF S A E L L I T E A P P L I C A T I O N S T O E AR T H A N D
O C E A N P H Y S I C S .
NASA SR70-1971 1-4-69
Figure QI
that we have made substantial accomp ishments towards the goa
i ty for responsib e management of the Ea
But much remains to be done.

8/7/2019 Earth Observations Program Review
http://slidepdf.com/reader/full/earth-observations-program-review 53/95
METEOROLOGICALPROGRAMS
Presented by
Dr. Morris Tepper
8/7/2019 Earth Observations Program Review
http://slidepdf.com/reader/full/earth-observations-program-review 54/95
1. INTRODUCTION
The influence of Earth's weather on man and his activities i s clearly obvious. Each year our
Nat ion suffers catastrophic losses of l i f e and property as a result of such weather calamities as
hurricanes, tornadoes, floods and blizzards. For example, i t i s stated in the Environmental
Science Services Administration (ESSA) World Weather Program Plan document of this year that
in 1966 alone the U.S. lost approximately one thousand lives and over one billion dollars to
severe weather. I t i s quite probable that this to ll could have been substantially reduced by
longer range and more timely warnings combined with proper precautions. President Nixon, inforwarding this World Weather Program Plan to Congress stated, "Because so much of our social
and economic l i f e i s sign ificant ly in fluenced by weather conditions, i t i s important that we
encourage those advances i n weather predic tion and control which our scientists now foresee. 'I
NASA has recognized the importance and urgency of this problem, and has stated, in a report
for the Space Task Group, the fo llow ing as the goals of the meteorological profession: "To
understand the physics of the atmosphere, to bring about improved pred iction of weather, and to
establish a basis for eventual weather modificat ion and climate control . I' (Figure I)
I' T O U N D E R S T A N D T H E P H Y S I C S OF T H E A T M O S P H E R E ,
T O B R I N G A B O U T I M P R O V E D P R E D I C T I O N OF W E A T H E R , A N D
T O E S T A B L I S H A B A S I S F O R E V E N T U A L W E A T H E R M O D I F I C A -
T I O N AND C LIMATE C O N T R O L I '
AMERICA'S NEXT DECADES IN SPACEA REPORT FOR THE SPACE TASK GROUP
NASA, SEPT. 1969
NASA SR70 -1 211 1-4-69
Figure I
49
Our present knowledge of meteorology i s based on loca I weather observations--the observation
of weather conditions at specific loca l points on the Earth's surface. From these local observa-
tions we can construct area charts showing weather conditions over large regions of the Earth.
For example, Figure 2 depicts the weather con-
ditions over North America on 17 August 1969,

8/7/2019 Earth Observations Program Review
http://slidepdf.com/reader/full/earth-observations-program-review 55/95
the date on which Hurricane Camille reached
the Gulf Coast,
Figure 3 provides a pic tor ial legend for the
wide var iety o f weather conditions i n Figure 2.O n that day there was a snow storm i n Alaska,
rain along the coast of the Pacific Northwest,
and coastal fog in Southern California . I n the
Midwest, thunderstorms were reported in the
Northern Plains, associated with a frontal sys-tem, while further south i n Texas only fai r
weather cumulus clouds were observed, Themost severe weather was found along the
Eastern sector of the U.S., where electri cal
storms occurred i n the Northeast; tornadoes
were reported i n the Southeast and Hurricane
Camille was about to str ike the Mississippi
coast at Gulfport.
SURFACE WEATHER MAPNORTH AMERICA 12002, 17 AUGUST 1969
Figure 2
Figure 3
50
These variat ions i n local weather--from snow-
storm to sunny skies to tornadoes and hurricanes,
a l l occurring within the United States on one
particular day, a produced by variations in
ented by the 500
igure 2, the curved
er a i r flow, as re
height contours
500 ME CONSTANT PRESSURE CHART

8/7/2019 Earth Observations Program Review
http://slidepdf.com/reader/full/earth-observations-program-review 56/95
lines over lying the surface weather map. There-
fore, an understanding of the upper a ir flow i sessential to an understanding--and prediction--
of loca l weather conditions. However, as we
can see from the Northern Hemisphere 500milli bar contour chart of this same date
(Figure 4), the upper ai r flow over the United
States i s but one segment of the circulation
pattern for the enti re Northern Hemisphere.
Therefore, to understand and pred ict airflow,and thereby, loca l weather conditions over the
Figure 4
U.S., requires knowledge of the airflow over the entire hemisphere. This requirement becomes
even more demanding as we attempt to predict weather conditions farther and farther into the
future.
As we stated initially, our goal i s not only to predict, but also to establish a scientif ic basis for
future weather control. We have already achieved some degree of success in mod ifying weather
as shown i n Figure 5. Certain types of fogs have been successfully dissipated by the use of sodiumch lw ide. Large holes in clouds have been created by using the down-wash from helicopters.
-
Figure 551
O n a larger scale, the recent Hurricane Debbie was seeded in an attempt to modify i t s tremendous
power; as can be seen in Figure5, a significant reduction in i t s total size occurred, giv ing rise to
hopes that we may indeed be able to influence these tremendous storms. And, of course, we must
take note of th e fact that man i s inadvertently modifying the world's weather by th e type and
quantity of pollutants which he i s introducing into the atmosphere. However, i t should be appar-
ent that our current capabilities of modifying the weather are l im i t ed essentially to local effects.

8/7/2019 Earth Observations Program Review
http://slidepdf.com/reader/full/earth-observations-program-review 57/95
Any success with large-scale weather control must first depend on a much better understanding
and predict ion of atmospheric processes than we now possess. We must know in advance and
know accurately what the natural course of weather i s to be, otherwise we shall be unable to
recognize the results of weather modif icat ion attempts nor to measure i t s effect. Therefore, our
goals of long-range predic tion and eventual control of our weather are clearly dependent upon
a bet ter understanding of weather processes and an increased knowledge of global weather condi-
tions. Space technology--the abil i ty to observe Earth's weather from space-enables us to
increase dramat ical ly our knowledge of global weather conditions. This knowledge undoubtedly
w i l l lead to improved understanding of weather processes.
52

8/7/2019 Earth Observations Program Review
http://slidepdf.com/reader/full/earth-observations-program-review 58/95
I I . THE NASA ROLE
NASA plays an active and important role in the totul meteorological program to achieve these
goals, through the conduct of the national Meteoro logica l Satellite research and development
(R&D) program

8/7/2019 Earth Observations Program Review
http://slidepdf.com/reader/full/earth-observations-program-review 59/95
Our programs to fu lf i ll the requirements for global meteorological data can be classified into
three separate, but interrelated, object ives (Figure 6). The first obiective, global cloud coverimaging, provides for the capabilit y to per iodical ly observe the global cloud cover; information
which enables us to iden ti fy and track storms and to observe the ir formation and dissipation.
information of this nature i s valuable i n the analysis of current weather and the prediction of
24-36 hour changes. Th e second objective, continuous viewing of th e atmosphere, provides
the capability to keep significant portions of the Earth's cloud cover under constant surveillance,
providing essential information on rap idly developing weather phenomena, such as thunderstorm
and tornado formation, growth, and decay; information which i s valuable for short-period (0 - 12
hours) forecasts. The third objective, global quantita tive measurement of the atmospheric struc-ture, w i l l provide quantitative information of atmospheric parameters, such as the temperature,
NASA SUO-126
I 1 -469
Figure 6
wind, water vapor; global information of the three dimensional structure of the atmosphere and
i t s temporal variations. These data w i l l vastly increase our knowledge of global weather condi-
tions, increase our understanding of atm i c processes, and, when used i n conjunction wi
global mathematical models of atmosphe havior, may make possib e extended period (2 - 3
weeks) forecasts.
54
The NASA Meteorological Satelli te Program has been designed against these stated objectives,
and i s being accomplished i n this approximate order. The various satell ite systems, past, present,
and proposed, as they relate to each of the three major objectives are shown in Figure 7 in their
relative time positions. No te that in general terms the TIROS satellites are associated with the
first objective, the

8/7/2019 Earth Observations Program Review
http://slidepdf.com/reader/full/earth-observations-program-review 60/95
the Nimbus satellites, with the third. We shall proceed to look at each of the three objectives
and their fl ight programs in much greater detai l. Also note that on the right of Figure 7 under
1975, we have the letters "G-A-R-P", which is the acronym for the Global Atmospheric Research
Program. This program w i l l be discussed in detail later but for now let i t be noted that the ul ti -
mate objec tive o f this international research program i s the attainment of economically-useful, long-
range predictions. t represents the next step i n man's effort t o predict the weather, and even-
tually to modify i t for his own uses. It i s the conduct of a comprehensive program of research
to acquire a bet ter sc ien tif ic understanding of the physical and dynamic processes of the atmos-
phere for incorporation into prediction models. This requires quantitative global observationsof the state and structure of the Earth's atmosphere. I t i s economically possible only through th e
development and u til izat ion of the capabilities o f meteorological satellites.
Figure 7
We have discussed the meteorological goals and the meteorological satelli te program objectives.
Now we wish to present in somewhat greater detai our program plans to achieve these objectives,
111. GLOBAL C OUD COVER PROGRAM
The program elements of the global cloud cover program (Figure 8) are: ( I ) 0
program based on the IROS and early Nimbus meteorological satel ites; (2) The operational

8/7/2019 Earth Observations Program Review
http://slidepdf.com/reader/full/earth-observations-program-review 61/95
prototype spacecraft, TIROS-M and later TIROS-N; (3) The operational satel l i te systems
funded and managed by the Department of Commerce (DOC), ESSA-I through X and ITOS-Athrough G; and (4) Our TOS improvements program which currently includes the major
improvement items listed on Figure 8.
The R&D flight program has consisted of the TIROS and early Nimbus satellites R&D program.
The successive development of TIROS-I through X produced a fami ly o f meteorological satel-
lites capable of viewing global cloud cover once da ily (during daylight) in either a stored-data
mode for global analysis or in direct readout mode for local usage. The Nimbus I satellite
provided some essential sensors for this purpose: The Advanced Vidicon Camera System (AVCS)for global coverage and the Automatic Picture Transmission (APT) Camera System for local
coverage. The early TlROS and Nimbus R&D fl ight program led to the first operational meteor-
ologica l satelli te system--the TIROS Operational System, or TOS. The TOS program requires
the continued operation from each of two satellite types. The first type is equipped with AVCScameras to provide da ily global picture coverage for central weather analysis and forecasting
use. Pictures are taken on the sunli t portion of each orbit and stored on magnetic tape for
later transmission to the ESSA's National Environmental Satellite Center (NESC) through theCommand and Data Acquisition stations at Gi more Creek, Alaska, and WaI lops Station,
Virgin ia. The second satel lite type i s equipped with the APT camera systems which provide
immediate readout of cloud pictures as they are taken. From this system, properly equipped
GLOBAL CLOUD IMAGING PROGRAM DETAIL
PICOGRAM ELEMENT 1360 61 62 63 64 65 86 67 68 69 70 7l 72 73 74I I I I I I I I I I l l I I I I 1
A
R
P
...@""l..".. ..I""_L .................I. FUTURE
I 8 GLOBAL IMA6u16TO5 IMPROVEMENTS I
VERT HIGH RESOLUTION RADIOMETER IVERTICAL TEM POIAN RE PROFILE RADIOMETER ISC AN NIN G CELESTIAL ATTITUDE DETERMINATION SYSTEM IDATA COLLECTION SYST EM I
ADVANCED VERTICAL TEMPERATURE PROFILE RADIOMETER IADVANCED SENSOR GROUND SYSTEMS ION-BOARD GRIDDING SYSTEMORBITAL TRIM SYSTEM NASA SR7C-128
114-69
f
stutions (more than 500 stations over the world) can receive cloud pictures covering a region
with in about 2,000 miles of the stations. Both types of satellites are flown i n circular, sun-
synchronous orbits at an altitude of 790 nautical miles, and carry redundant systems designed
to extend the useful l i f e of the satellite.
Figure 9 depicts the performance history of the meteorological satel i t e program, revealing

8/7/2019 Earth Observations Program Review
http://slidepdf.com/reader/full/earth-observations-program-review 62/95
that since inception of each of the two types of satellites--stored data (AVCS) and direct
readout (APT), almost continuous performance has been provided. The on ly exceptions arethe brie f intervals between TIROS-I and II and between TIROS-Ill and IV i n the earliest days
of the stored data program. The cloud cover data from these satellites have provided valuoble
information for analysis and predic tion of weather conditions, and have become an essential
element of our national weather service.
OPERATIOXAL UTlLlZATlON OF METEOROLOllCAL SATELLITES
.. PERFORMANCE HISTORY -
0
E A
D T
A
' R
' E
R A
R O
E D
C O
T uT
1961J21314-s I
T I R
1962
m
IITIROS I= I
-T I RO!
T
1964 1965
1121314 11213(1
VROF V I
1 2 3 4 1 2 3 4
""IESSA V I 8
1968 1969
,121314 1121 314
INASA S R M - 1 2 9
11-4-49
Figure 9
57
Figure I O cites several examples in which AVCS aad APT data have proven particular ly valu-
able i n operational situations. The cloud cover photograph shown is the product of the Amstation which the U.S. provided to the Mexican Government. Photos such as these are sent
daily to 17 Mexican departments. The value o f satellite data was graphically proven to Mexico
on th e occasion when continued heavy rains threatened to destroy a dam. To rel ieve the

8/7/2019 Earth Observations Program Review
http://slidepdf.com/reader/full/earth-observations-program-review 63/95
pressure on this dam, i t was proposed to open the flood gates which would, i t was realized,
destroy a small vi llage downstream from the dam. Satel lite photos indicated that rain would
stop pr ior to the danger point, and therefore, neither the dam nor the village were endangered.
Based on similar data, the hospital ship "HOPE" was rerouted, to avoid a developing storm at
sea; ai rcraft crews are routinely provided with a specially prepared montage of. eography,
cloud photographs and cloud analyses detail ing weather conditions for transatlantic flights;
both cloud cover photographs and a specially prepared snow and ice f i e l d chart are used by
U.S. Coast Guard ice breakers and the S.S. Manhattan in i t s recent voyage through the
Northwest Passage to Prudhoe Bay. In the recent Barbados Oceanographic Meteoro log icalExperiment (BOMEX) conducted by the Department of Commerce, Department of Defense, NASA,and other agencies, satelli te cloud cover data were gathered in conjunction wi th conventional
surface, upper air, radar, and aircra ft reconnaissance data i n a concerted ef fort to improve our
knowledge of trop ical meteorology. The value of satel lite photos, i n detecting and tracking of
hurricanes is obvious; cloud cover imagery le d to the initial detection of Hurricane Debbie when
the Weather Bureau's fu l l attention, and a l l of i t s reconnaissance aircraft, were being directed
to the impending violence and destruction of Hurricane Camille as i t moved in on the Gulf
coast.
Figure I O
The United States and the USSR have established the Washington-Moscow b ila teral cir cu it
depicted i n Figure I I for the exchange of both conventional meteorological charts u d meteor-
olog ical satellite datu. Bilateral discussions led to the f i r s t exchange of meteorological data
over this ci rcui t on 28 October 1964.
The U. S. transmits ESSA AVCS pictures and nephanalyses (cloud analyses) of the north and
equatorial At lant ic areas, equatorial Africa, and Eurasia, plus conventional meteorological

8/7/2019 Earth Observations Program Review
http://slidepdf.com/reader/full/earth-observations-program-review 64/95
charts. In return, the Soviet Union sends selected cloud coyer pictures, nephanalyses andactinometric (radiation) charts, plus conventional meteorological charts. The cloud cover
pictures are not over the same areas every day. Examples of the data transmitted to USSRare shown on Figure 12. Figure 13 shows examples of the Russian data. A one-for-one quali-
ta tive comparison should not be made, for the U. S. data represents copies of original photo-
graphic products, whi le the Russian data are copies of products received by facsimile machine
after radio and cable transmission.
WASHINGTON - MOSCOW METEOROLOGICAL DATA LINK
/I' /(
WASHINGTON ------+0 ESSA-9 AVCS PICTURES
NORTH ATLANTIC AREA
EQUATORIAL ATLANTIC
EQUATORIAL A FRICAEURASIA AREA
* NEPHANALYSES OF ABOVE AREAS
0 CONVENTIONAL NMC PRODUCTS
-OSCOW
CLOUD-COVER PICTURES(LARGELY IR)
NEPHANALYSES
(BASED LARGELY ON IR )
0 ACTINOMETRIC CHARTS
0 CONVENTIONAL METEOR-
OLOGICAL PRODUCTS SR 70-132
11-4-69
Figure I
9

8/7/2019 Earth Observations Program Review
http://slidepdf.com/reader/full/earth-observations-program-review 65/95
Figure 12
igure 13
6
The chronology of this meteorological datalink i s shown i n Figure 14. As noted, trans-
missions of U. S. data to the USSR of T
ESSA data commenced in 1966, and conven-
tional data i n 1964, continuing without
interruption since those dates. The USSR
has transmitted conventional data continuously
since 1964; however, transmission of satel it e 1965 1966
WASHIWGTON- RIOSCOW METEOROLOGICAL DATA LIWK
TIROSIESSI

8/7/2019 Earth Observations Program Review
http://slidepdf.com/reader/full/earth-observations-program-review 66/95
data has been interrupted on several occasions.
1964
We have now reviewed br ie fly the history of
establishment of the operational system for
global cloud imagery, and have discussed the
use and importance of this data. Now le t us
look to the future.
1967 1988 1969
COSMOS/METEOR
NASA 51170-13511-4-59
Figure 14
As shown on Figure 15 a new system, TIROS-M,wi l l combine in one sate llite the capabilities of the existing TOS system and the nighttime
infrared ( IR) cloud cover imagery capabil ity developed i n the Nimbus program. TIROS-M i s
in effect an operational prototype for an lmproved-TOS Operational System (ITOS). TIROS-M
wi l l be launched soon, and the improved TOS system i s scheduled to follow next year.
TIROS-M EVOLUTION
STORED I UCAt
DATA- DAY 2 WIGHT
Figure 15
61
Planning for the TIROS-N, the second of the two operational prototype systems shown onFigure 8, w i l I be primarily concentrated on appropriate spacecraft modifications to the
TIROS-M design in order to accommodate new instrument payloads suggested i n the Nimbus
R&D flight program.
In addi tion to the development programs of the spacecraft themselves, we are conducting a
specialized program to develop certain sensor, ground station, and other subsystems tailored
part icular ly for the operational system. These developments, ca lled the TOS Improvements

8/7/2019 Earth Observations Program Review
http://slidepdf.com/reader/full/earth-observations-program-review 67/95
Program, are designed to solve special problems and, as appropriate, wil l be incorporatedi n the TOS program.
IV. CONTINUOUS VIEWING OF THE ATMOSPHERE

8/7/2019 Earth Observations Program Review
http://slidepdf.com/reader/full/earth-observations-program-review 68/95
The second objective, continuous viewing of the atmosphere (Figure 16) i s also addressed i n the
three program elements of ( I ) R&D fl ig ht programs, based on the Applications Technology Satel-
l i t e (ATS) multi-purpose satellites; (2) The operational prototype spacecraft Synchronous
Meteorological Satellite (SMS); and (3) The operational satellite system Geostationary Opera-
tional Environmental Satellite (GOES).
This R&D fl ight program benefited from NASA's ATS program. The communications satellite,
Syncom, established th e fact and feas ibili ty o f geostationary orbits, in which satellites appear
to remain stationary with regard to the subsatellite point. Using this technology, the ATSsatellites exploited the advantages of this constant Earth-satellite relationship as demonstrated
in Figure 17. ATS-I, launched on 7 December 1966, was placed in orbit over the Pacific Ocean
Basin at the Equator and 151' West Longitude, and i s in operation to this day. ATS-Ill was
launched on 5 November 1967, and i s also in operation today over the Atlantic Ocean at th eEquator and 47' West Longitude, just off the East Coast of South America. In early 1968, i t
was temporarily moved to 950 West so that severe storms over North America could be monitored.
The major experiment on both of these satellites i s the spin scan camera capable of providing animage of the Earth's disc every 20 minutes. Secondary experiments inc lude the WEFAX data
co llec tion and Omega Position Location Experiment, which are concerned with the collect ion
and transmission of meteorological data, and have successfully demonstrated the feasibi li ty of
these concepts for use i n future weather systems.
The capability to produce cloud cover images every 20 minutes provides material to study the
formation and movement of sign ificant weather systems, to derive w ind information from cloud
motion, and to view the dynamics of atmospheric motions.
As a demonstration of the value of ATS photographs for analysis of dynamic atmospheric processes,
i t i s posiible to combine sequential ATS photos in to a time-lapse movie, revealing dramatica lly
"Weather i n Motion.'' A short film clip, prepared under NASA contract by Dr. Fujita of the
University of Chicago, reveals examples of intense local cloud ac ti vi ty i n South America, an
East Coast snowstorm, tornado ac ti vi ty , "hook-cloud" formations (noted to be associated wi th
tornado incidence), jet stream motions, and Hurricanes Candy and Cami lle--a ll made a l l the
more graphic by the "Weather i n Motion" feature o f the movie.
S-D was launched on IO August 1968, carrying camera systems with a potentia l for both day
and nigh t cloud viewing. A malfunction of the launch vehicle's second stage le ft the satellite
attached to the vehicle and i n a highly el lip ti ca l orb it and no useful meteorological results
cou ld be obtained.
S-F, whose launch is scheduled for Ca endar Year 1972, w i l l provide additional developmen-
ta l support for a future geostationary meteorological satelli te system. We are also planning fora dedicated ATS meteorological sateflite in synchronous orbit,"MET-ATS, I' which wil l serve as
a platform for continuing our R&D i n th e continuous viewing of the atmosphere from space.
CALENDAR YEARS
PR
R I
I
A T S - ISPIW-SCAN CAMERAWEFAX EXPERIMENT

8/7/2019 Earth Observations Program Review
http://slidepdf.com/reader/full/earth-observations-program-review 69/95
ATS-I l lS P I N -S C A N C A M E R AIMAGE DISSECTOR CAMERAWEFAX EXPERIMENTOMEGA POSIT ION LOCATIONEXPERIMENT
ATS-D
IMAGE DISSECTOR CAMERADAY-NIGHT CAMERA
ATS-FMET ATS
OPERATIONAL PROTOTYPESSMS-ASMS-8
OPERATIONAL SYSTEMS
GOES-AGOES-8
IIIIIIIIIII
IIIIIIIIIII
E3Q3
Q3
48
NASA SR70-137Rev. ( I ) 1-15-70
Figure 17
Cloud cover pictures, obtained with the ATS-Iand 111 satellites during the past two years,
have convincingly demonstrated the tremendous
potentia l of continuous observation. Consider-
ing the ut il it y of these data and the fact that

8/7/2019 Earth Observations Program Review
http://slidepdf.com/reader/full/earth-observations-program-review 70/95
no new technology i s required, i t i s our planto initiate the development of a prototype
opera iona Synchronous Meteorologi ca
Satellite (SMS-A, Figure IS) i n FY 1970.T h i s effort could lead to the launch of such
a prototype i n early C Y 1972. An operational
capability thus implemented will permit con-
tinuous observation of major weather systems,
NASA sVW.38112-59
Figure I8
routinely enhancing our ab il it y to predictand locate short-lived storms. The analysis of cloud motions, through such observations, w i l l
permit the der ivat ion of important wind fields over a considerably larger area and in much less
time than presently possible.
-
The satellites of the operational system, GOES-A and B, would follow the successful launch
of the prototype satellites SMS A and B and w i l l take their p lace as part of this nation's
National Operational Meteorological Satellite Systems
6
V. QUANTlTATIVE MEASUREMENT OF THE ATMOSPHERIC STRUCTURE
Figure 19 presents the fl ight program of the th ird obiective, quantitat ive measurement of th eatmespheric structure. Here also the program can be divided into (I) The R&D flight program;
(2) Operational prototypes; and (3) Operational systems. The magnitude and complexity of
quantitatively determining the many meteorological parameters using remote sensors are orders
of magnitude greater than the relatively simpler task of viewing cloud cover. Dramatic develop-

8/7/2019 Earth Observations Program Review
http://slidepdf.com/reader/full/earth-observations-program-review 71/95
ments have been made toward this objective, but we are s t i l l i n the R&D phase and considerations
of an operational system are l im i ted to a select few parameters.
QUANTITATIVE MEASUREMENT PROGRAM DETAIL
PROGRAM ELEMENT I1964 1965 I1966 1967 I1968I1969I 9701 1971I 972I 973 1974 1975
I GI
I
RLD FLIGHT PROGRAM
I A
R
NIMBUS I11 P
NIMBUS I
NIMBUS II 1
%$
NIMBUS D
NIMBUS E II
NIMBUS F II
NIMBUS 6 I
IMET ATS II
III
&B
h.sNIMBUS H I '&
OPERATIONAL PROTOTYPES
IIROS N
OPERATIONAL SYSTEM
ITOS
IIIII
NASA SR75139
Rev. (1) 1-15-70
Figure 19
For these reasons, our discussion of this objective wi I concentrate essentially on the Nimbus
R&D program, wi th onty a b rief mention of future operational systems which can incorporatequantitative sounding sensors developed i n the Nimbus program. Although shown for 1975,we are considering incorporating a first version of an atmospheric sounder on an earlier ITOS.
The growth of the Nimbus program i s depicted i n Figure 20. Nimbus I and 1 1 , launched in
1964and 1966, were essentially devoted to development and test of cloud cover mapping in
th e visible and 1R spectral bands. Note i n Figure 21 th e sensors which have already been
mentioned in the TOS/ITOS programs.
NIMBUS GROWTH

8/7/2019 Earth Observations Program Review
http://slidepdf.com/reader/full/earth-observations-program-review 72/95
A D V A N C E D A T M O S P H E R I C
S O U N D I N G
( MIC R O WAVE) a ADVANCED VIDICON CAMERA
SYSTEM (AVCS]
N I M B U S I & D
IN 1TI A L A T M O S P H E R l C
S O U N D I N G ( I R )e AUTOMATIC PICTURE
TRANSMISSION [APT]
CAMERA SYSTEM
HIGH-RESOLUTION INFRA-REDI M B U S I & II
C L O UD I M A G I N G
( V I SI B E & I R) RADIOMETER [HRIRI
NIMBUS GROWTH
0 AVCS
0 APT
0 HRlR
0 MEOIUM-RESOLUTION INFRA-
RED RADIOMETER [MRIRJ
NASA SR7C-I4011-4-59
CLOUD IMAGING-VjS IBLE & IR
NASA SWO-180
1 1-4-69
Figure 20 Figure 21
Nimbus 111, launched on 14 April 1969, and
Nimbus D (Figure 22) scheduled for launch i n
1970, represent our first concentrated efforts toNIMBUS GROWTH
ATMOSPHERIC SOUNDING-IR
quantitatively measure the atmospheric state N IMBU S 111 N I M B U S D
parameters. Primary emphasis i s placed on I R
sensors, such as the sate ll ite I R spectrometer
(SIRS) and the Infrared Interferometer Spectrom-
eter (IRIS), fo r the determination of temperature,water vapor and ozoqe content. Another impor-
tant method for obtaining global quantitative
data of the atmosphere i s the Interrogation,
Recording and Location System (IRLS) tested
This system i s essentially a data system which
interroga es se Iec ted sensor p atforms, acquir ing
the meteorological data and at the same timeelectronically determining the exact location
and included on Nimbus D.
INTERROGATION. RECORDING & LOCATION
* RADIOISOTOPE THERMOELECTRIC GENERATOR
SYSTEM (IRLS)
I TG)
I ID C S)
I I R I S I
I S RS )
IMUSE)
IMAGE DISSECTOR CAMERA SYSTEM
e INFRA-RED INTERFEROMElER SPECTROMEIER
(. SATELLITE INFRA-RED SPECTROMEIER
0 MONITOR OF ULTRAVIOL ET SOLAR ENERGY
* M R l R- H R l R
Figure 22
* TEMPERATURE & HUMIDITY INFRA-REDR AD lOMElER ( T H IN
IBU V)
IWS)
(SCR)
BACKSCATlER ULTRAVIOLET SPECTROMElER
* FILTER WEDGE SPECTROMETER
SELECTIVE CHOPPER RADIOMEIER
IRLS
IDCS
* IR IS B
SIR S B
0 MUSE
NASA SWP-I41
114-59
and identification of the platform. Other sensors on Nimbus 11 1 include a Monitor of Ultra-
violet Solar Energy (MUSE) and an image Dissector Camera System (IDCS) for viewing cloud
cover. Nimbus D wi l l conta in improved versions of the sensors indicated on Nimbus I
wil l also provide experimental tes t of additional I R sounding sensors.
The next major milestone i n our program to
quantitatively measure the structure of the
atmosphere w i l l occur with the launch of
Nimbus E and F i n 1972 and 1973. These
satellites w il l make the f i r s t exploratory use
of the microwave region of the spectrum for
atmospheric sounding. The microwave spec-
WlMBUS GROWTH
OSPHERIC SOUNOING*~IGROWAV€NIMBUS E
e INFRARED TOMPERATURE PROFILERADIOMETER (ITPRI
eMICRWAVE SPECTROMETER(MWSI
I)UECTRICALLY SCAMI NG MICR WAV ERADIOMETER IESMR)
QSURFACE CO MPOSITION MAPPINGRADIOMEIER ISCMR)
*REAL-TIME DATA RELAY(RDRI
NIMBUS F ICANDIDATE XPERIMENTSI
e MULTI-DEFECTOR GRATING SPE CTR WTE R(MGSI
* C 9 RADIOMETER FOR TEMPERATURE SOUNDING
eHIGH-RESOLUTION INFRA-RED RADIATION
SOUNDER
OTROPICAL WIND MEASUREMENT
eL lM B RADIANCE INVERSION EXPERIMENT
OHEAT BUDGET EXPERIMW
e POSITIVE ION COMPOSITION

8/7/2019 Earth Observations Program Review
http://slidepdf.com/reader/full/earth-observations-program-review 73/95
tral band offers real promise to meteorologyfor the reason that microwave radiation i s
not obscured by ice clouds or by water drop-
lets (i f their size and number are not large),
the temperature structure despite cloud cover.
NASA SWC-142I 1- Id9thereby giving the possibility of measuring
*THIR
eSCR
eCIRCULAR ELECTROSTATIC PROBE SN OI ES
O S O L A R COSMIC RAY & TRAPPED PARTICLE
* T H I R
aE3MR
MW5
EXPERIMENT
bus E w il l carry two microwave experi- Figure 23ments. The f i r s t i s the Microwave Spectrometer(MWS), to mea r e atmospheric temperature a t
three levels between the surface and 18,000 meters alti tude and the total liquid and water
vapor content of the troposphere using the 5 mm band for temperature and the I 35mm band
for water vapor. The second microwave experiment i s the Electrically Scanning Microwave
Radiometer (ESMR), which w i l l map (globally and continuously) the thermal radiation from
the Earth's surface and the atmosphere at a wavelength of approximately 1.55 cm,
I n addit ion to the microwave experiments, Nimbus E w il l also contain I R sounders for compari-
son with the microwave sounders and also to advance I R technology. These w i l l in cl
Temperature and Humidity I R Radiometer (THIR) carried on Nimbus D; an I R Temperature Pro-
file Radiometer (ITPR), which will measure I R radiation i n the II and 15 micron bands, providing
high spectral resolution of 20 wave numbers and spatial resolution of 26 nautical miles; a
Surface Composition Mapping Radiometer (SCMR) for providing information on the composition
Earth's surface; and a Realtime Data Relay (RDR) to test the feasibility of using a polar-
orbiting satellite to collect and relay data from synchronous satellites (ATS-F) and the feasibility
of track ing low-orbit satellites by synchronous orbi t satellites.
The tentative payload candidates for Nimbus F are i n the selection process. From these candi-
dates, a final selection wi l l be made at a later date. The present l i s t of possible experiments
is as follows (Figure 23):
- A Mul ti-detector Gra ting Spectrometer (MGS) to provide higher temperature resolutions
at low altitudes and temperature data from higher altitudes than possible with earlier ER
sounders
- A Carbon Dioxide Radiometer to obtain temperature soundings from higher altitudes
- A High Resolution R Sounder to provide spatial resolution capable of sounding the atmos-
phere through breaks in the cloud cover
- A Tropical Wind Measurement Experiment
- The Microwave Spectrometer of Nimbus E- The Electrically Scanning Microwave Spectrometer of Nimbus E- The Temperature and Humidity I R Radiometer of Nimbus D
- A Heat Budget .Experiment to measure the heat flux into and out of th

8/7/2019 Earth Observations Program Review
http://slidepdf.com/reader/full/earth-observations-program-review 74/95
- Several space physics e
space, weight and PO
Figure 24 gives our concepts for the Nimbus
Follow-on Satellites, Nimbus G and H, which
are currently under study. We are studying
the app lication of advanced observing tech-
niques for the analysis and survey of thoseboundary phenomena which i
atmosphere, i .
surface. We exp tudy the upper
atmosphere as i t influences the weather below
as well as the details of the cloud itself.
The Nimbus program, designed to further tech-
nology in the meteorological satel l it e program,
i s restr icted to lower al ti tude orbits. Therefore,
we have under consideration a meteorologically-
dedicated ATS satellite, called MET-ATS
NIMBUS GROWTH
IJtMBUS 6&HCONCEPTS
A P P L I C A T I O N OF ADVANCED OBSERVING TECHNIQUES FOR ANALYSIS
& SURVEY OF ATMOSPHERIC PHENOMENA
* SEA SURFACE ROUGHNESS, COMP OSfTION & TEMPERATURE
STRUCTURE & W E N O M E N A OF THE UPPER ATMOSPHERE
e CLOUD STRUCTURE & C O M P O S I T I O N
@ INTERACTION BElWEEN SEA SURFACE & ATMOSPHERE
e S P E CTR A L, S P A TI A L & TE M P O R A L C H A R A C TE R I S T I C S OF
SIGNIFICANT FEATURES OF THE EARTH'S SURFACE
NASA SR7C-I43
11-4-69
Figure 24
planned for launch in 1974. This satellite is being proposed to adapt quantitative measurements
of th e atmospheric structure to geostationary survei
enable us to obtain variable-time--scale or near ly continuom soundings of selected p&Jons of
the atmosphere.
hchnology. This combinationd
The value of the Nimbus program to the fi el d of meteorology, and to the quanti tative measure-
ment objective, cannat be overemphasized. Nimbus 111, the cur
now in orbit, has been ha iled as one of the most important developments in the history o f
meteorology. Figures 25 through 31 w i l l br ie fl y illust rate the data products obtained from
Nimbus 111, clear ly demonstrating the reasons for the high regard for this satellite.
satellite of this progmm,
contains two in fmred sounders for the an ti ative measurement of the atmospheric
structure--the SIRS and the I R I S . Figure 25 shows the SIRS- and
structure o f the atmosphere, as obtained from Nimbus I l l , compared with a standard measure-
ment by radiosonde. The comparison i s excellent. The er circle has the 300 MB contour,
constructed from Nimbus 11 1 SIRS data and the lower circle i s that constructed from conventionaI
data. The similari ty of th e patterns attests to the usefulness of satellite sounding data. Alsoshown on Figure 25 is a montage of daytime cloud cover provided by an OR imagery system.
Figure 26 depicts the principle and the products of the IR IS . This instrument utilizes the
entire spectrum, and as such represents a more versatile instrument. From radiat ion values in
ived temperature
9

8/7/2019 Earth Observations Program Review
http://slidepdf.com/reader/full/earth-observations-program-review 75/95
I
10
E
100
Figure 25
NIMBUS 111 DATA PRODUCTS
- IRIS -
','. '.
* RADIOSONDE 1800 G M T
- IR IS 1652 G M 1
MIXING R A TIO (glkg)
NASA 5170-147
I 1-4-69
Figure 26
7
this spectrum we can deduce the temperature, as shown in the left graph, the to tal atmospheric
ozone content, shown at the bottom center and th e water vapor mixing ratio, shown in the
The additional
Radiometer (HR edium Resolutio Infrared Radiometer (MRIR) and the Mon
UI raviolet Solar Energy (MUSE).
data products ( igure 27) come from the High Resolution

8/7/2019 Earth Observations Program Review
http://slidepdf.com/reader/full/earth-observations-program-review 76/95
The HRIR provides us wi th nighttime viewing o f the cloud cover and also, during daylight, with
mapping of the reflected solar 1R radiation, useful in showing contrasts between deserts, vege-
tation, and water surfaces.
The MRIR i s a 5-channel radiometric device covering the water vapor band at 6.5 to 7 microns,
the radia tion transparency band, or "window" from I O to I I microns, the carbon dioxide channel
from 14.5 to 15.5 microns; the water vapor rotat ional bands from 20 to 23 microns, and vis ible
and near-IR radiation from0.2
microns to4
microns. These data are used separately and
together in atmospheric research.
The MUSE i s designed to measure the variations in solar radiat ion by looking at the Sun and
determining whether there are variations in this part of the solar spectrum which can be seen
only from above the atmosphere. If these variations exist, we wi l l attempt to correlate them
with changes in the upper atmosphere. Early results sugge t that significant variation can bemeasured in the shortest o f the wavelength bands -- 1200 f .
Figure 27
71
Figure 28 shows the sequence of photo hs of Hurricane Camille, as tracked by Nimbus 111 ,
tion of this storm WQS made using the photo mcxde an I f August 1969.
iated with this very intense and dangerous storm with

8/7/2019 Earth Observations Program Review
http://slidepdf.com/reader/full/earth-observations-program-review 77/95
il le was 25Q miles swth of Mobile,
n for haavy storms. Some residents
he storm. The eye of Camille moved inland just west of Bay St. Louis, MiI:30 p.m. that night. Camille continued to move north and north
cipit ation pattern on 18 and 19 August, weake steadily wi th ra
i n Southern Kentucky. Arriving at th e Appalachian Mountains in th e late hours o f 19 August,
the storm in tensif ied rapid ly and turned to th e east, In an eight-hour period, ra in fa ll of 12 to14 inches was fai rl y widespread in the mountains and amounts exceeding 27 inches occurred i n
one area; more than three times the state's previous record of 8.4 i es in 12 hours,
Figure 28
other fechnique for locating the intense storminess reglon On a hurriiccrne i s shown on
by Dr, Fuj ita. Here he has enhanced the intense convection cells crnd suppressed the
ud regions. Depicted now quite bold ly are the regions of intense rain . Figure 30 has

8/7/2019 Earth Observations Program Review
http://slidepdf.com/reader/full/earth-observations-program-review 78/95
N A S A SR7B-20811-4-69
F igure 29
NASA SR70-2081 1 - 1 10
F igure 30
73
Figure 31 depicts the Interrogation, Recording
and Location System ( IR LS ) flown on Nimbus ! I
This i s a communications and position location
system for meteorological purposes, which
enables us to interrogate wor ld-w ide platforms,
receive data from those platforms, and to deter-
mine the location of the platform. This informa-
tion i s stored in the satellite memory for delivery
NIMBUS 111 DATA PRODUCTS
INTERROGATION, RECORDING &
LOCATION SYSTEM (IRLS)

8/7/2019 Earth Observations Program Review
http://slidepdf.com/reader/full/earth-observations-program-review 79/95
to the data acquisition station. Examples of
sensor platforms which have been used wit h thissystem are included on Figure 31. One platform
which may require explanation i s the elk--this
represents an attempt to track the migration of
ment shown here that has not as yet been
performed. Figure 31
NASA 51170146an animal by satellite. This i s the only experi- 11-4-67
In summary, the data products from Nimbus 11 1 show the spacecraft and i t s experiments to besignificant in the history of meteorology. For the first time, we have conducted remote sounding
from a spacecraft, and even wi th this first spacecraft have found the results applicable to opera-
tional problems.
74
e GLOBAL ATMOSPHER C RESEARCH PRQGRAM
Figure 7 was used earlier to show the evolution of the meteorological program from TlROS, the
first meteorological satellite, to a period i n the mid-1970's. Let us now come back and discuss
GARP. As mentioned earlier, GARP i s an acronym for Globa l Atmospheric Research Program.
The GARP story (Figure 32) commenced i n the early 1960's shortly after the historic launch of
th e first of the TIROS satellites. Recognition of the tremendous potential of observations fromspace led to ear ly efforts to employ space to man's benefit. The la te President Kennedy, i n

8/7/2019 Earth Observations Program Review
http://slidepdf.com/reader/full/earth-observations-program-review 80/95
an address to the United Nations i n 1961, stated, "W e shall propose further cooperative efforts
between a l l nations i n weather predict ion and eventua ly i n weather control "
The United Nations, "Not ing with grat ifica tion the marked progress for meteorological science
and technology opened up by the advances i n outer space.. .,I' recommended i n 1961 the early
and comprehensive study of measures to employ space observations to advance the state of
atmospheric sciences, The U. N. further proposed, in 1962 that a detailed plan to strengthenmeteorological services and research be developed plac ing part icu lar emphasis upon meteoro-
logicaI satellites.
Figure 32
n response to these proposals, the scien ti fi c community has investigated the manner and extent
to which meteorological satellites cou ld contribute to the advancement o f our knowledge and
understanding of the weather. Studies revealed clearly that weather, as we noted earlier i n
75
Figure 4, i s global, and that conditions prevail ing over one sector of the globe w i l l have
defin ite influence on other sectors. Moreover, other studies (Figure 33) indicate that exten-
sive requirements for weather data are needed
for accurate weather forecasts. The most
modest of I to 2-day forecasts require longitu- PATA REQUlREMElYTS FOR DIFFEREHT FORECAST PERlOOSLATITUDE
dinal and latitudinal coverage of several 80 a 40 20 0 20 40 a 8 0
thousand miles and vertical coverage from the
Earth's surface to th e tropopause. To be able
to extend our forecasts i n time beyond I to 2

8/7/2019 Earth Observations Program Review
http://slidepdf.com/reader/full/earth-observations-program-review 81/95
weeks w i l l require knowledge o f weather and
weather-influencing phenomena covering
nearly the enti re globe from pole to po le and
to the depths of several meters in the oceans. ! ai
s 1wI-1 WEEK-2 MONTHS :The GARP concept evolved and i s based on 8 1m-..-..-..-
SCHEMATIC OFME DATA REWIRED FOR FORECASTS IN
W E MID LATITUDES FOR DIFFERENT FORECAST PERIODS
the accomplishments o f three separate tech-REF WORLD WtAIHER PROGW NASA SRIPI52
P U L I f 0 8 FY 1970 11.4-69ological programs, as indicated on Figure 34,MAKH I, 1969
Present theory and technology enable us to
forecast the weather with reasonable accuracy
for 24 to 48 hours in advance. We have been
engaged i n theoretica l and applied meteorolog-
ical research which has produced mathematical
models o f atmospheric behavior. It has been
shown that integrationof these
mathematical
equations with time w i l l provide a forecast of
Figure 33
GARP CONCEPT
CAPA E I1N:
2-DAY
FORECAST
NASA SWC-15111-4-69
Figure 34
76
future weather conditions. However, the complexity of the mathematical model is too greatfor manual manipulation, and also the models require global data for the in it ia l conditions.
Fortunately, electronic computer development has produced high-speed computers capable of
handling the numerical models o f the atmosphere, and space technology research puts us on
the threshold o f obta ining global quanti tative observations o f the atmosphere Therefore, we
can see the opportunity to combine these three major breakthroughs--numerical models, high-
speed computers, and global observations--into one concerted global atmospheric research
program. From this program we hope to achieve a sc ien tif ic understanding of atmospheric
processes plus the operational techniques for app lying this understanding, producing a forecast

8/7/2019 Earth Observations Program Review
http://slidepdf.com/reader/full/earth-observations-program-review 82/95
SEP 1961
DEC 1961
DEC 1962
1963-1967OCT 1961
NOV 1967
MAY 1968
JULY 1968
MAR 1969
MAY 1969
MAY 1969
JUNE 1969
MAR 1910
GARP MILESTONES
PRES IDENT KENNEDY IN 5 PEECH TO UN, PROPOSED COOPERATIVE EFFORT IN WEATHER PREDICTION tiCONTROL
UN GENERAL ASSEMBLY ADOPTED RESOLUTION 1721O(VI1
UN GENERAL ASSEMBLY ADOPTED RESOLUTION 1802 fX VI II
NATIONAL AND INTERNATIONAL W N NI N G ACTIVITIESICS UNM O ESTABLISHED THE JOINT ORGANIZIN G COMMITTEE (JOCI
NATIONAL ACADEMY OF SCIENCES APPROVED A U.S. COM Mll TEf FOR GARP
U.S. CONGRESS PASSED CONCURRENT RESOLUTION ENDORSING THE WORLD WEATHER PROGRAM
PRESIDENT JOHNSON MEMO CALLED UPON AGENCIES TO COOPERATE FULLY IN ME WORLD WEATHER PROGRAM
PRESIDENT NIX ON SUBMllTED FIR ST PLAN TO CONGRESS FOR U.S. PARTICIPAT ION IN WORLD WEATHER
PROGRAM
WMO EXECUTIVE COMMllTEE APPROVED DRA Fl JOC PLAN FOR GARP
ICSU PANEL FOR GARP APPROVED DRAFT JOC PLAN FOR GARP
U.S. COMMlTtEE FOR GARP WSCG I PUBLISHED PLAN FOR U.S. PARTIC IPATION
IMERNATION AL PLANNING MEETINGOF NATIONS TO EXPRESS INTEREST AND DEGREEOF PARTICIPATION
NASA SWO-165Rev. (I ) 1-14-70
Figure 35
which other studies show would be valid far
up to two weeks, and possible leading to a
capabili ty t o modify weather conditions to
man's benefit.
Figure 35 ists chronologically some of the
major milestones in the GARP program, We
have covered the f i rst four items on the con-
ception and early studies far the program.
The next item, the establishment of national
and international organita ons representing
both the scientif ic community and the govern-
ments of the part icipating nations, i s outlined
i n Figure 36. Congress, former President
Johnson and President Nixon supported the
INT
NAT
0
L
E
II
NAT
0
A
BARP ORDANlZAllON
SCIENTIFIC COMMUNITV WERNMEWT
# WfCUlNf U3MMlNEfb EXEcUllVE COMMlllE f
WMO INNINGORLD m mAFF WATCH
NATIONAL A C ~ D D M Yof SCIENCE DEPARTMENTW COMMERCU -INA SI ENVIRONMENTAL SCIENCE SERVICES ADMI N
IDOCIESSAI
0 INlUIDfPARlMMlALCOMMlNfEa NATIONAL COMMlTTEfFOR GARP FOR WORLDWUTHB M G U M WC.
NASA, W D. Dol, 001. WS,AEC, NSR
NASA SUO-IS0I 1 4 4 9
Figure 36
79
planned program. President Ni xon in March of 1969 submitted to Congress the first plan for U. .
participation in the World Weather Watch, as mentioned at the beginning of this presentation.
Planning for this research program has been focused on spec ific data requirements. Figure 37lists the observational requirements, summarizing the weather parameters and their specifications.
In terms of these requirements, i t can be seen from the map in Figure 37 that while data from
portions of the temperate zones of North America, Europe and Asia are adequate, data from the
rest of the world is generally inadequate for our purposes. The current concept to provide global
data by satell ites during the 1974-1975 time frame i s shown on Figure 38. This concept calls for

8/7/2019 Earth Observations Program Review
http://slidepdf.com/reader/full/earth-observations-program-review 83/95
a combination o f four geostationary satellites for detailed surveillance o f the lower and mid-latitudes, two polar orbiting satellites for surveillance of the polar regions, and low-alt itude
equatorial orbiting satellites for tropical wind data.
These actions take us through May 1969. In June 1969, the U.S. Committee for GARP published
the plan for U. . participation i n GARP. Figure 39 summarizes the proposed U. S. subprograms
to study the physical processes of vital concern to GARP. These include plans for developingthe global observing capabil ity , programs for studying meteorological processes, and experiments
to improve numerical prediction equations. The f ie ld observations programs proposed as part of
this program are listed on Figure 40. The first two programs have been conducted, and the
reinainder will be carried out i n conjunction wi th the development of the observing capability.
The tropical cloud cluster experiment and th e global observing system Pacific test are experi -
ments of major magnitude, i . e., comparable in size and importance to the recent BOMEX
experiment.
GLOBAL OBSERVATIONAL REQUIREMENTS FOR GARP
0 W IN D VELOC IT Y -+3 M P H
0 TEMPERATURE =hoc0 WATER VAPOR AlW
* PRESSURE k0.2960 HORIZONTAL RESOLUTION 400 KM0 VERTICAL RESOLUTION 200 M B
e H OR IZ ON T AL D OM AIN GLOBAL
* V E R T I C A L D O M A I N
0 FREQUENCY ONCE PER DAY
SURFACE TO 10 M B
CURRENT
AVAILABILITY
OF
UPPER-AIR
DATA:
INADEQUATE
NASA SR70-1531 1-4-69
Figure 3778

8/7/2019 Earth Observations Program Review
http://slidepdf.com/reader/full/earth-observations-program-review 84/95
GEOSTATIONARY SATELLITES 14) POLAR ORBITING SATELLITES (2) LOW INC LINAT ION ORBITING SATELLITES
e V I S I B L E & IR SCANNERS (WIND S)e IR SPECTRO-RADIOMETERS (TEMP) SYSTEM WI ND S) (WINDS )
e TWO-CHANNEL RADIOME TERS ICLOUDS)
e TRANS PONDERS (DATA COLLECTION)
e SATELLITE-BALLOON LOCATION
e I R A N D M I C R O W A V E S P EC TRO -
o SATELLITE-BALLOON LOCATION SYSTEM
R A D l O M E l E R S ( TE M P & W A TE R
V A P O R )
.TRANS PONDERS (DATA COLLECTION)
NASA SR70-15411 4 6 9
Figure 38
P R O P O S E 0 U.S. S U B P R O G R A M S TO S TU D Y TH E
P H Y S I C A L P R O C E S S E S OF V I TA L C O N C E R N TO GARP
PROGRAMS FOR DEVELOPING THE GLOBAL OBSERVING CAPABILITY
OBSERVING SYSTEMS SIMULATION MPERIMENTS
0 GLOBAL OBSERVING SYSTEMS PA CIF IC TEST
FIELD OBSERVATIONAL PROGRAMS FOR STUDYING PHYSICAL PROCESSES
a TROPICAL CLOUD CLUSTER MPERIMENT
e BOUNDARY LAYER AND CONVECTION EXPERIMENTS
e CLEAR AI R TURBULENCE EXPERIMENTS
NUMERICAL MODELLING MPERIMENTS FOR IMPROVING THE PHYSICAL FORMULATION
OF THE PREDICTION EQUATIONS
0 NUMERICAL MODELLING MPERIifiENTS
N A Y , SR7c-1%
1 1-4-69
1967
1969
1970
1970-73
1970-71
1972
1973
1973
1974
1974-75
GARP FIELO OBSERVATIONS PROGRAMS
[RECOMMENDED BY NA S GAAP COMMITTEE]
LINE ISLAND EXPERIMENT
BaMM
TRADE WIND INVERSI ON
CLEAR AIR TURBULENCE
STRONG AIR MASS MODIFICATION
LAND CONVECTION BOUNDARY LAYER
TROPICAL CLOUD CLUSTER
GLOBAL OBSERVING SYSTEM - PACIFIC TEST
"POPCORN" CUMULUS
GLOBAL GARP
Figure 39 Figure 40
CENTRAL PACIFIC
BARBADOS
EASTERN TROPICAL PACIFIC
CENTRAL & WESTERN U.S.
OFF U S . EAST COAST
CENTRAL U S .
MARSHALL ISLANDS
PACIFIC OCEAN
AMAZON BAS IN (TROPICAL CONTINENTAL)
GLOBAL
N*SA sn7c-15711-4-69
The immediate future also contains milestones of sign ificance to GARP. During the next few
months, we w i l l be developing the U. S. position for the n ernat ona P Iann; g Meeting
nations who w i l l meet to express interest and to discuss p sible participation i n GARP.of importance is the World Meteorological Organization (WMO) Quadrennial Congress in 1971,
which will establish the WMO budget for the following four years.
This concludes our discussion o f GARP. I t represents a program of great sign ificance to the
meteorological community, and i s a program to which NASA can, and should, make a maior,
vita l contribution. In recognition of this importance, we have established a GARP Project
Office at the Goddard Space Flight Center (GSFC) to insure timely and adequate input from
NASA to the planning and development of the GARP program.

8/7/2019 Earth Observations Program Review
http://slidepdf.com/reader/full/earth-observations-program-review 85/95
VII. PROGUAM MANAGEMENT
in the development of the Meteorological Satellite Program, NASA plays an important and
dynamic but not independent role. The design, development and scheduling of the entire
Meteorological Sateiiite Program (Figure 41) i s ccordinafed direc tly on a bilatera l basis with
ESSA through the coordinating bodies of the Meteorological Satellite Program Review Board
(MSPRB) and the Advisory Group for Supporting Technology for Operational Meteorological
S), Direct Formal cwrdinati onwi th
the Department of Defense i s accom-
plished vi a the Swbcommitfee on Me+eorology

8/7/2019 Earth Observations Program Review
http://slidepdf.com/reader/full/earth-observations-program-review 86/95
of the Unmanned Spacecraft Panel. Direct
coordinai.ion also occurs bemeen ESSA and
DOD. However, no formal body has been
tion, mu1t i agency coordination of meteoroolog-
I1i e research, deve wpm e n b and
s s conducted through the functioning
shed for this express
of the Interdepartmen
Sciences ( K ACommittee far Applied
(ICAMR), and the lnte
for Meteorological Services (ICMS).
As one would expect,owr unive
important role in the cievebpm
NASA S R I G I I U
I 1-4.69
Figure 41
cai k t e l i i t e Program. NASA has m d e exten
und in engineering and scien tific colleges. As we can see from Figure 42,use of the technical
PARTfC IPATlNG WEVERS ITlES
m.J5M(
-t5m
lh91*K ISWOK- 13wK
TOTAl MET.SR&T
FY 1970
UNIV. 11,180K
330
3M
210
21 , '*'58 59 60 61 62 63 64 65 66 67 1968
83
there are about 20 educational institutions now partic ipat ing in this program, distributed as indi -
cated, During FY 1970 we have funded $4,912,000 in Supporting Research and Technology
(SR&P); of this tota , l,180,000 has gone to universities. Also of note i s the interest in
satellite meteorology throughout the meteorological community as suggested by the number of
publications dealing wi th this subject. These have grown to more than 300 per year in th e ten
short years of space experience. The number of PhD theses dealing wi th satellite meteorology
also reflects an increasing interest.
1
An excellent example of the explosive growth in both interest and participation i s the University

8/7/2019 Earth Observations Program Review
http://slidepdf.com/reader/full/earth-observations-program-review 87/95
of Wisconsin story (Figure 43). In the early years there was essentially only a single investigator,
Professor Suomi, concerned with acquiring and interpret ing radiat ion data from space. This ledto increased interest a t the University of Wisconsin i n th e Earth's rad iat ion balance, the varia-
tions in the Earth's radiation budget, development of I R sensors and research into atmospheric
effects on ref lection, transmission and emission of radiat ion. In short, a center of excellence
in th is f ie ld developed there. Recognition of thiv ins titution as a center of excellence has le d
di rect ly to increased emphasis upon the f ie ld of meteorology and also has resulted i n expansionof interests into the mul ti-d isciplinary impacts of satellite meteorology on agriculture, commerce,
communications, economics and even social and po li t ic al studies, In this manner, the University
of Wisconsin, has assisted the total Meteoro log ica l Sate1 ite Program and has reaped considerable
benefit and world-wide recognition as a center of exce llence i n this f ie ld.
THE UNIVERSITY OF WISCONSIN STORY
MULTIDISCIPLINARY ACTIVITY
*I",,,D,XlPUN*t I >r"DlEi or ,*IOCIAI.
IE*NO*II A N 0 WLIIICAL IM*I\CI UZIULIING
1wv * < E N , IDVIINLL, JN 119LL16 MTTlOROLGG"
r-------ME"m,OGr- 9CENTER OF EXCELLENCE
ATMOSPHERICS RESARCH-
INVESTIGATION OF CLOUDS ABOVE SNOWSURFACES UTILIZING RADIATION MEASUREMENTS
UTILIZATION OF SYNCHRONOUS-...R-RADIATION BALANCE- SATELLITE DATA
B 8 W AND COLORISPIN SCAN CAMERAiADIATION ANALYSIS FOR
SUBTROPICAL HIGHRADIOOCCULTATION mR-ATMOSPHERIC STRUCTURE-NFLIGHT CALIBRATION-
OF TIROS/lR SENSORS
THE REFLECTION OF SUNLIGHT 6
ABSORPTION BY THE EARTH a ATMOSPHEREINTERPRETATION OF-
IR RADIATION DATAEXPLORER VI1
I I I I I I I I I I I I I I60 61 62 63 6 4 65 66 67 68 69 70 71 72 73 74
NASA SR70-160
11-4-69
Figure 43
Finally , a br ie f word on personnel and funding requirements. Figure 44 presents the currentand projected funding level and personnel requirements by fi e ld center. The bulk of the
requirements, both for funds and for personnel,are found at Goddard Space Fl ight Center,
where the TIROS, TOS, TOS, Nimbus and synchronous sate ll ite programs are executed. Other
centers also contr ibut ing to these programs, but a t a considerably lower level, include the
Je t Propulsion Laboratory (JPL), the Electronics Research Center (ERC), the Langley Research
Center (LaRC), and Wallops Station (WS). The total NASA in-house personnel figures range
between 200 to 250. A l l of the data includes requested Fiscal Year 1971 new starts and run-out
of existing programs and the new starts.

8/7/2019 Earth Observations Program Review
http://slidepdf.com/reader/full/earth-observations-program-review 88/95
PROJECT FIELD CENTER RESOURCES REQUIREMENTS
PERSONNEL
NUMBER
250
200
150
100
50
(250)
1970
(229)
1971
FC
W I SLARC
ERC
J PL
1972
(MILLIONS OF FUNDS
75rDOLLARS)
70
65
60
55
50
45
40
35
30
25
20
15
10
5
1969 1970
($70.0) NEW
NASA SR70-16211 -4-69
Figure 44
83
As we stated at the beginning of this presentation (Figure I ) our goal is to understand the physicsof the atmosphere, to bring about improved prediction of weather, and to establish a basis for
eventual weather modification and c l i rh te control. The Meteorological Satelli te Program pro-
vides valuable contributions toward this goal * Figure 45 is ts some major recent accomplishments
of our national Meteorolog ical Satelli te Program. We have ach ieved continuous operation of a
system provid ing da ily cloud cover photographs, loca ll y and globally. We have engaged in the
planning, research and development of the GARP, with such activities as the BOMEX experiment,
the,World Weather Program plan, and the U.S. plan for participation in GARP; and we have
accomplished the first, quantitative measurements of the structure of the atmosphere from space,
with the highly-successful Nimbus 111 satellite.

8/7/2019 Earth Observations Program Review
http://slidepdf.com/reader/full/earth-observations-program-review 89/95
METEOROLOGICAL PROGRAMS
SIGNIFICANT ACCOMPLISHMENTS
0 CONTINUOUS OPERATION OF THE NATIO NAL OPERATIONAL METEOROLOG ICALSATELLITE SYSTEM
DAILY GLOBAL CLOUD COVER PHOTOGRAPHS
0 DAILY LOCAL CLOUD COVER PHOTOGRAPHS
PLANNING, RESEARCH 81DEVELOPMENT OF THE GLO BAL ATMOSPHERIC RESEARCH PROGRAM
0 BOMEX EXPERIMENT
0 WORL D WEATHER PROGRAM PL AN
0 US PLAN F O R PARTICIPATION IN GARP
0 QUANTITATIVE MEASUREMENTS
OF THE STRUCTURE OF THE
ATMOSPHERE FROM SPACE (NIMBUS I )
VERTICAL PROFILE OF TEMPERATURE
0 VERTICAL PROFILE OF WATER VAPOR
0 VERTICAL PROFILE OF O ZO NE CON TENT
0 SOLAR FLUX MEASUREMENTS
INTERROGATION, RECORDING, a LOCATION OF ~ I X E D
a FREE-FLOATING SENSOR LATFORMS
NASA SWO-20011-4-69
Figure 45
84

8/7/2019 Earth Observations Program Review
http://slidepdf.com/reader/full/earth-observations-program-review 90/95
being proposed i s the best system that can be established a t any particular time taking into
account a l l aspects of= Nat ion’s interests.-
The study of preferred approaches involves more than technical considerations. Social,economic, organizational, and pol it ic al considerations are a part of the whole. We must
involve appropriate talent with in NASA on such considerations as well as expand our univer-
sity involvement i n these questions. I believe an example of a good way to go about this i s
contained in our approach to the Univers ity of Wisconsin where we are build ing on the tech-nic al competence of an individua l to involve other disciplines of the University in th inking
about al l aspects of a part icular problem. We shall want to expand this type of experiment

8/7/2019 Earth Observations Program Review
http://slidepdf.com/reader/full/earth-observations-program-review 91/95
to other universities and other applications. We are working with the University of California
to try to develop such a concept and program in Earth Resources Surveys.
We have just begun to scratch the surface of the problems of data management--for processing,
formating and distribution. We must begin to consider organizational roles and jurisdict ions
and responsibilities as wel l as the development of techniques and hardware. NASA wi l l becalled upon for advice i n these matters. An important consideration i n these problems w i l l
be industrial and commercial relationships.
We must consider our role i n providing for o rientat ion and training of other user agencies and
of foreign nationals. President Nixon’s statement to the United Nations on Earth resources
carries with i t a potential commitment to involve our in ternat iona l neighbors on a much more
expanded scale. The cooperative efforts wi th Mex ico and Brazil are experiments; we should
learn from them and plans for the future should be developed, tak ing this experience in toaccount. However, we should not necessarily consider these efforts as necessarily adequate
patterns for the future.
The interna tional involvement w i l l grow i n other applications as well, for example, NAV/”IC,Oceanography, etc. As the budgets tighten i n ai l countries, the interest has turned to appli-
cations of space, which, i n th e eyes of many, can be justified on the more immediate return
on investment.
The interest in the applications program a t national, state and local levels continues to grow
and wil require respective indiv idua l thought and attent ion.
The pressure for improved radio frequency spectrum management directions wi I derive largely
from the frequency al loca tion requirements for the new applications of space, i.e., ERS,
N A V D C , data collection, etc. NASA inputs are required. Consideration must be given
to interference I imitations, space technology developments, systems concepts, and the need
to study ways to conserve the spectrum. As a nation, we must investigate, understand and
prepare our position on a much earlier time scale for national and then international endeavors
such as the World Administrative Radio Conference (WARC) sponsored by the international
Telecommunications Union (ITU) e
Finally , we have the attention of many people and many act ivit ies. This may be viewed as
fortunate or unfortunate, depending on one’s poin t of view. The fol low ing groups are already
i volved:
86
President's Scientific Advisory Committee (PSAC)Off ic e of Science and Technology (OST)
Bureau of the Budget (BOB)
National Aeronautics and Space Council
National Council for Marine Research and Engineering Development
Nationa l Academy of Science
Department of Interior (USGS)
Department of Agriculture
Department of Commerce(ESSA)Department of the Navy (NAVOCEANO)
Congress, Congressional Committees and Staffs

8/7/2019 Earth Observations Program Review
http://slidepdf.com/reader/full/earth-observations-program-review 92/95
The Oceanographic Community
The Press
Engineering Societies
There are many more that I $could name, but the point that I should li ke to make i s that the
interested and concerned community i s large, and every element of this community desiresand deserves the attentiol; of NASA on the subject of thei r interest. Applications of space
are topics o f intense interest and concern to these people, and the amount of time that must
be devoted to these interests i s inordinately high relative to the proportion of the space R&Dbudget consumed
A l l of these factors must be recognized in the allocat ion of personnel resources to space
applications efforts, both a t NASA Headquarters and the fi e ld centers. The f ie ld centers
must be made to understand the need for an expenditure o f va luable talent on studies whichmay never result i n a NASA space flight, and Headquarters must recognize the need to involve
itself i n the concerns of space applications at the very highest levels to insure adequate and
timely policy attention.
87
ABBEFWIATIONS AND ACRONYMS
aACFTAEC
AGSTOMS
APTATSAVCS
Angstrom centimeters)
Ai rcraf tAtomic Energy CommissionAdvisory Group on Supporting Technology
Automatic Picture Transmission C e r a systemApplications Technology SatelliteAdvanced Vidicon (television) Camera System
For Operational Meteorological Satellites

8/7/2019 Earth Observations Program Review
http://slidepdf.com/reader/full/earth-observations-program-review 93/95
BOBBOMEX
BWCM
COMSAT
DCS
DOADOC
DQD
DO1DOSDOT
DWSERC
ERS
ERSPRCER’I’SESMRESSAFCCFwsG e R p
GEOSGMT
GOESGSFCHRIRI C A S
ICAMR
ICMSICSUIDCS
IMCINTELSAT
I RIRISIRIS
Bureau of BudgetBarbados Oceanographic Me teorological ExperimentBackscatter U ltraviol et (W ) Spectrometer sensorCentimeterCommunications S a t e l l i t e CorporationData Collection System
Department of AgricultureDepartment of CommerceDepartment of DefenseDepartment of InteriorDepartment of StateDepartment of TransportationDry Workshop (Apollo Applications )Electronic Research CenterEarth Resources Survey
Earth Resources Survey Program Review CommitteeEarth Resources Technology SatelliteElectronically Scanning Microwave Radiometer sensorEnvironmental Science Serv ices AdministrationFederal Communications CommissionF i l t e r Wedge Spectrometer sensorGlobal Atmospheric Research ProgramGeodetic Satell i teGreenwich Mean Time
Geostationary Operational Environmental SatelliteGoddard Space Flight Center (NASA, Greenbelt, -land)
High Resolution Infrared ( I R ) Radiometer sensorIn te rdepar tmen ta l Committee on Atmospheric ScienceIn terdepar tmen ta l Committee on Applied
Int erdepa rtment al Committee on M eteorological Se rvicesInterna tional Council of Sc ien tif ic UnionsImage Dissector C a m e r a System
Image Motion CompensationInternational Telecommunications SatelliteInfraredInf rare d Interferometer Spectrometer sensorInterrogation, Recording and Location System
Meteorological Research
88
ITOSITU
ITPR
JOC
JPL
M C
LVMBMET-ATS
Improved TIFW Operational (s a te ll it e ) SystemIn te rn at io na l Telecommunications UnionInfrared Temperature Profile Radiometer sensor
Joint Organizing Committee ( C S U / W )Je t Prapulsion LaboratoryLangley Research Center (IUSA, H q t o n , V ir gi ni a)
Launch VehicleMillibar (uni t of atmospheric pressure)Meteorological ( "dedicated") Applications
EegahertzMulti-detector Grating Spectrometer sensor
Technology Sa te ll it e

8/7/2019 Earth Observations Program Review
http://slidepdf.com/reader/full/earth-observations-program-review 94/95
NMC
NMI
NSFOPLEOST
PCM
PSACRBV
RDRR&;D
RTGSATSSCMR
SCRSE BSECOR
SIRS
&dAm Resolution Infrared Radiometer sensor
Wti- pe t alManned Spacecraft Center ( U S A , Houston, Texas)Meteorological Satellite Program Review BoardMulti-Spectral Point ScazmerMonitor of Ultraviolet (w) solar Energy sensor
9Microwave Spec-brometer sensorAceexeration of gravity constant X 10-
National Academy of SciencesNational Aeronau%ics and Space AdministrationNavigation/Traffic Control (s at e ll it e )NASA Data Processing FacilityEat io na l Environmenta1 Sate l i t e Center
(ESSA, Sui t and, Maryland)National Meteorological Center
(ESSA, Suitland, Maryland)NASA Management IssuanceNational Science Foundation
Omega Position Location ExperimentO f f c e of Science and Technology
Pulse Code ModuLation (telemetry system)Pr es ide nt' s S ci en ti fi c Advisory Committee
Return Beam Vidicon
Realtime Data RelayResearch a d DevelopmentRadioisotope Thermoelectric GeneratorSmall AppLications Technology S a t e ll i t e sSurface Composition Bpping Radiometer sensor
Selective Chopper Radiometer sensor(RCA electronic tube designation)Sequential Collation of R e n g e(U.S. Army geodet ic sa te l l i te s y s t e m )
S a t e l l i t e Infrared Spectrometer Sensor
(Executive Office of the Pre side nt)
89
SMSSNAP
so65
SPOCSRSR&TSSASCS WSYNCOM
THIRT I R ETOS
Synchronous Meteorological S a t e l l i t eSpace Nuclear Au xi ll ia ry Power supply( W t i - S p e c t r a l Camera Experiment)
Spacecraft Oceanography Pr oj ec tScanning RadiometerSupporting Research and TechnologySpace Science and Applications Steering CommitteeStandard Temperature and PressureSynchronous - Altitude Communications s a t e l l i t e
Temperature/Humidity Infra red Radiometer sensorTelevision and Infrared Observational SatelliteTIROS Operational ( sa te ll i t e ) System

8/7/2019 Earth Observations Program Review
http://slidepdf.com/reader/full/earth-observations-program-review 95/95
momxUSA2USCGUSCGUSDAUSDC
USDIUSGSUSNWARC
WEFAX
WMO
ws
Z
Tro pical Meteorological Experiment (no longe r planned)U.S. Air ForceU.S. Coast GuardU.S. Committee on GAIip
U . . Department of AgricultureU a S. Department of Commerce
U.S. Department of InteriorU.S. Geologica l Servic eU.S. N a v y
World Administrative Radio ConferenceWeather F a c s b i l e Experlment (d at a transmission)World Meteorological OrganizationWallops St at ion resea rch ce nter (NASA, Wallops
Zulu Time (GMT)
Station, Virginia)
G P O 888-957
90
Related Documents