Earth Observation Science and Applications for Risk Reduction and Enhanced Resilience in Hindu Kush Himalaya Region Birendra Bajracharya Rajesh Bahadur Thapa Mir A. Matin Editors A Decade of Experience from SERVIR

Welcome message from author
This document is posted to help you gain knowledge. Please leave a comment to let me know what you think about it! Share it to your friends and learn new things together.
Transcript
Earth Observation Science and Applications for Risk Reduction and Enhanced Resiliencein Hindu Kush Himalaya Region
Birendra BajracharyaRajesh Bahadur ThapaMir A. Matin Editors
A Decade of Experience from SERVIR

Earth Observation Science and Applicationsfor Risk Reduction and Enhanced Resiliencein Hindu Kush Himalaya Region
Birendra Bajracharya • Rajesh Bahadur Thapa •
Mir A. MatinEditors
Earth Observation Scienceand Applications for RiskReduction and EnhancedResilience in Hindu KushHimalaya RegionA Decade of Experience from SERVIR
123

EditorsBirendra BajracharyaInternational Centre for IntegratedMountain Development (ICIMOD)Kathmandu, Nepal
Mir A. MatinInternational Centre for IntegratedMountain Development (ICIMOD)Kathmandu, Nepal
Rajesh Bahadur ThapaInternational Centre for IntegratedMountain Development (ICIMOD)Kathmandu, Nepal
ISBN 978-3-030-73568-5 ISBN 978-3-030-73569-2 (eBook)https://doi.org/10.1007/978-3-030-73569-2
© The Editor(s) (if applicable) and The Author(s) 2021. This book is an open access publication.Open Access This book is licensed under the terms of the Creative Commons Attribution 4.0International License (http://creativecommons.org/licenses/by/4.0/), which permits use, sharing, adap-tation, distribution and reproduction in any medium or format, as long as you give appropriate credit tothe original author(s) and the source, provide a link to the Creative Commons license and indicate ifchanges were made.The images or other third party material in this book are included in the book’s Creative Commonslicense, unless indicated otherwise in a credit line to the material. If material is not included in the book’sCreative Commons license and your intended use is not permitted by statutory regulation or exceeds thepermitted use, you will need to obtain permission directly from the copyright holder.The use of general descriptive names, registered names, trademarks, service marks, etc. in this publi-cation does not imply, even in the absence of a specific statement, that such names are exempt from therelevant protective laws and regulations and therefore free for general use.The publisher, the authors and the editors are safe to assume that the advice and information in thisbook are believed to be true and accurate at the date of publication. Neither the publisher nor theauthors or the editors give a warranty, expressed or implied, with respect to the material containedherein or for any errors or omissions that may have been made. The publisher remains neutral with regardto jurisdictional claims in published maps and institutional affiliations.
Cover illustration: Cover image courtesy of the Earth Science and Remote Sensing Unit, NASA JohnsonSpace Center. NASA Photo ID: ISS041-E-81045Copyeditors: Samuel Thomas, Shanuj VC, Utsav Maden, Rachana Chettri, Kundan ShresthaGraphic design: Sudip K. Maharjan, ICIMOD
This Springer imprint is published by the registered company Springer Nature Switzerland AGThe registered company address is: Gewerbestrasse 11, 6330 Cham, Switzerland

Foreword
We are in a new age of technology—as our planet’s health deteriorates, we are alsoable to monitor and act on changes with swiftness, greater accuracy, and widerimpact. The unprecedented and rapid advances in Earth observation (EO),geospatial, and digital technologies have dramatically improved our ability tounderstand and respond to the impacts of climate change and other human-inducedthreats. These technologies have become instrumental in measuring and monitoringour natural and social environments and the effectiveness of our developmentpolicies and programmes. More than ever, these technologies have great importancein the Hindu Kush Himalayan (HKH) region, which faces a range of challengessuch as melting glaciers, degrading ecosystems, changing environments, global-ization, and a multitude of socioeconomic pressures.
As an intergovernmental knowledge and learning centre, ICIMOD aims to servethe HKH region through information and knowledge generation and sharing to findinnovative solutions to critical mountain problems, bridging science with policiesand on-the-ground practices. The Mountain Environment Regional InformationSystem (MENRIS), one of our longstanding regional programmes, has continuallyworked to improve access to and use of EO and geospatial information technologiesand developed meaningful applications for integrated mountain development.Under MENRIS, ICIMOD has partnered with USAID and NASA to implementSERVIR Hindu Kush Himalaya (SERVIR-HKH) as a regional hub of the SERVIRGlobal Initiative. Over the last decade, SERVIR-HKH has worked extensively withnational and international partners to develop various EO and geospatial informa-tion services in the fields of agriculture and food security, land cover and ecosys-tems, water resources and hydro-climatic disasters, and weather and climate. Byadopting a service planning approach, SERVIR-HKH has been able to focus on theusers and their capacity-building needs. Given the diversity of users in the regionand the unique issues they face, addressing their needs is not without challenges.This book illustrates the range of areas, the depth of work, and the broad impactachieved by the SERVIR-HKH team and our partners. Their collective learning inthe process will be beneficial to all those interested in applying these tools in theHKH region and beyond.
v

I would like to take this opportunity to thank the SERVIR-HKH team atICIMOD, NASA SERVIR Science Coordination Office at the NASA MarshallSpace Flight Center, principal investigators and team members of the NASAApplied Science Projects, USAID Washington and USAID Country Missions in theregion, and national and international agencies who have partnered withSERVIR-HKH for their important contributions. That NASA and USAID haveextended support to SERVIR-HKH for another five years is testimony to theimportance of its work for the environment and communities in the region. I amconfident that the current and future work of SERVIR-HKH will make significantcontributions to the HKH Call to Action, which is a key priority for ICIMOD andbacked by all our member countries.
Pema GyamtshoDirector General, InternationalCentre for Integrated Mountain
Development (ICIMOD)Kathmandu, Nepal
vi Foreword
Message from USAID
The global health pandemic is a stark reminder of the importance for timely,accurate, and credible information to help governments and individuals understandand manage risk. While the challenges addressed by the SERVIR partnership aredifferent than those of a pandemic health crisis, there is a parallel need for strongsystems that integrate timely, accurate, and credible weather, climate, and land useinformation into decision-making processes for improved food security, waterresource management, hydroclimatic disaster preparedness and response, and nat-ural resource management.
The United States Agency for International Development (USAID) is proud tocontinue our partnership with the National Aeronautics and Space Administration(NASA) and with the International Centre for Integrated Mountain Development(ICIMOD) in support of the SERVIR Hindu Kush Himalaya hub. While NASA andUSAID have different mandates, our complementary partnership layers NASA’sinvestments in technology and science with USAID’s investments in promotingresilience in partner countries. It is through our partnerships with strong institutionssuch as ICIMOD that we are able to strengthen national and local capacity toaccess, process, and use remote Earth observation data and information, tailoring itto the needs of users so that they can better understand and manage risk. Whenapplied to development challenges, technology has the power to spur inclusiveeconomic growth, build resilience to climate change, and support pathways out ofpoverty.
In this book, SERVIR Hindu Kush Himalaya shares their experience in imple-menting a collaborative, user-centric approach to designing and delivering servicesthat help government and civil society stakeholders identify and manage risk.SERVIR’s consultative approach to assessing needs and building capacity to accessand use timely, actionable information is an investment that empowers our partnersto address and help solve the complex challenges of the twenty-first century.
vii

We look forward to seeing SERVIR Hindu Kush Himalaya strengthen existingpartnerships and forge new ones as they continue to improve the reach, impact, andsustainability of their services.
Greg CollinsDeputy Assistant Administrator,USAID Resilience Coordinator,Bureau for Resilience and Food
Security, United States Agency forInternational Development,
Washington, D.C., USA
viii Message from USAID
Preface
The guiding principle of SERVIR, a joint initiative of NASA and USAID, has been“Connecting Space to Village”—a pretty ambitious statement that calls for Earthobservation (EO) applications to be employed to address real problems on theground. At the International Centre for Integrated Mountain Development(ICIMOD), SERVIR Hindu Kush Himalaya (SERVIR-HKH)—as the regional hubfor the HKH region—has strived to achieve these objectives over the past decade byworking on EO applications to deal with issues of regional priority. Over the years,technologies have advanced at a rapid pace, and the journey has been educative—especially in terms of understanding users’ contexts and customizing solutions totheir specific needs for greater meaning and effectiveness.
This book aims to capture our efforts in EO science and its applications toaddress environmental challenges in the HKH region, not only from a technologicalperspective, but also coming at it from the equally important cross-cutting aspectsof user engagement, capacity building, communications, gender, and programmemanagement. Our approaches, methodologies, technical details, and decade-longexperience have been presented across the book’s 19 chapters. These providebackground and analysis of SERVIR-HKH’s approaches to designing and deliv-ering information services on agriculture and food security; water resources andhydro-climatic disasters; land cover and land use change, and ecosystems; andweather and climate services. Similarly, multidisciplinary topics including serviceplanning; gender integration; user engagement; capacity building; communication;and monitoring, evaluation, and learning have been accommodated. We also doc-ument challenges and future perspectives for EO products and services in the HKHregion through a unique focus on EO science and applications for improvingenvironmental decision making in the complex landscape of the HKH.
Put together by 68 contributing authors and sharpened further by 44 reviewers,the book presents a complete package of knowledge on service life cycles with acollection of multi-disciplinary topics and practically tested applications for theHKH region. We expect that the EO and geospatial communities in the region andbeyond will gain useful insights and benefit from our experience with focused andtargeted interventions and user-centred approaches to develop impactful solutions.
ix

We hope that this book will be a good reference document for professionals andpractitioners working in remote sensing, geographic information systems (GIS),regional and spatial sciences, climate change, ecosystems, and environmentalanalysis. Furthermore, we are hopeful that policymakers, academics, and otherinformed audiences working in sustainable development and evaluation—bothwithin the SERVIR network and beyond—will greatly benefit from what we haveshared here on our applications, case studies, and documentation acrosscross-cutting topics.
Kathmandu, Nepal Birendra BajracharyaRajesh Bahadur Thapa
Mir A. MatinEditors
x Preface
Acknowledgements
We acknowledge NASA’s Daniel Irwin and USAID’s Carrie Stokes, who con-ceived the idea of SERVIR—named so after the Spanish and French “to serve”—tocomplement the strengths of two United States agencies to utilize space tech-nologies in development decision-making. Over the years, the programme—begunin 2005 in Mesoamerica—has grown into the global SERVIR network that worksacross five regions and over 50 countries to benefit communities around the world.
We are grateful to Basanta Shrestha, Director of Strategic Cooperation—andformer Regional Programme Manager, MENRIS—at ICIMOD. His role in estab-lishing the Hindu Kush Himalaya (HKH)-focused SERVIR-HKH hub in 2010 waspivotal. Since its establishment, SERVIR-HKH has demonstrated that the adoptionof Earth observation information can support initiatives working to improve thelives and livelihoods of people in the HKH.
We also acknowledge the contributions of colleagues who have supported ourwork: Nancy Searby, Ashutosh Limaye, Gwen Artis, Lee Stewart, Eric Anderson,Walter Lee Ellenburg, Francisco Delgado, Tim Mayer, Helen Blue Baldwin, andothers from the NASA SERVIR Science Coordination Office in Huntsville,Alabama; Jenny Franklin Reed, Albert Anoubon Momo, Pete Epanchin, TomZearly, and Karl Wurster from USAID; the NASA Applied Sciences Team(AST) Principal Investigators—Benjamin Zaitchik, Jim Nelson, Patrick Gatlin,Cedric David; and Carlos Quintela, Anthony Panella, and the entire SERVIRSupport Team. Learning exchanges and collaborations with other regional SERVIRhubs also helped strengthen our services and applications.
We are grateful to ICIMOD’s SERVIR-HKH team, which has contributed to itssuccessful implementation. This book has been a joint effort at recording andexplicating the various interventions made and lessons learnt by our team in the pastdecade. We hope these prove useful and interesting to those working on EOapplications.
We would like to thank David Molden, former Director General, ICIMOD;Eklabya Sharma, former Deputy Director General, ICIMOD; and Ghulam Rasul,Regional Programme Manager, MENRIS, ICIMOD for their support and guidancein the preparation of this book as well as the implementation of SERVIR-HKH.
xi

Thanks go to Laurie Vasily, Samuel Thomas, Utsav Maden, Rachana Chettri,Kundan Shrestha, Sudip K. Maharjan, and Jitendra Raj Bajracharya from theKnowledge Management and Communication Unit at ICIMOD and Shanuj VC,consulting editor, for their support in the preparation of the book.
Special thanks are due to Ganesh Bhattarai, Angeli Shrestha, and RajeshShrestha for their support to the smooth functioning of SERVIR-HKH. We wouldalso like to thank colleagues from our partner institutions in Afghanistan,Bangladesh, Bhutan, Myanmar, Nepal, and Pakistan, who made significant con-tributions to the design, implementation, and use of the services critical to thesuccess of SERVIR. We acknowledge all the authors for their contributions to thisbook, and all our reviewers for their thorough, constructive comments.
xii Acknowledgements
About SERVIR
SERVIR connects space to village by helping developing countries use satellitedata to address challenges in food security, water resources, weather and climate,land use, and natural disasters. A partnership of the National Aeronautics and SpaceAdministration (NASA), the United States Agency for International Development(USAID), and leading technical organizations, SERVIR develops innovativesolutions to improve livelihoods and foster self-reliance in Asia, Africa, and theAmericas.
SERVIR Hindu Kush Himalaya
The International Centre for Integrated Mountain Development (ICIMOD) imple-ments SERVIR Hindu Kush Himalaya (SERVIR-HKH)—one of five regional hubsof the SERVIR network—in its regional member countries, prioritizing activities inAfghanistan, Bangladesh, Myanmar, Nepal and Pakistan. For more information,visit servir.icimod.org.
xiii
List of Reviewers
Abdul Aziz Mohibbi, Kabul University—Faculty of Agriculture, AfghanistanAdvancing Gender in the Environment (AGENT) Team, AGENT is a ten-yearcollaboration between the United States Agency for International Development(USAID) and the International Union for Conservation of Nature (IUCN)Angelica L. Gutierrez, National Oceanic and Atmospheric Administration (NOAA),USABarbara Ryan, Independent consultant, USABhogendra Mishra, Science Hub, Kathmandu, NepalBhoj Raj Ghimire, Nepal Open University, NepalBjörn Alfthan, GRID-Arendal, NorwayBoru Douthwaite, Selkie Consulting Ltd., IrelandBrian Wardlow, Center for Advanced Land Management InformationTechnologies, School of Natural Resources at the University of Nebraska–Lincoln,USABuddi S. Poudel, REDD Implementation Centre, NepalBulbul Baksi, Partnership Brokers AssociationCarmen Tedesco, Fraym, USAChandra Giri, United States Environmental Protection Agency, USAChandrashekhar Biradar, International Center for Agricultural Research in the DryAreas (ICARDA), EgyptChristina T. Kwauk, Center for Universal Education, The Brookings Institution,USAChristopher Butler, International Potato Center, PeruDaan Boom, Independent development consultant, PhilippinesDavid Saah, Geospatial Analysis Lab, University of San Francisco, USADulani Sirisena, Partnership Brokers AssociationFrancisco Delgado Olivares, Universities Space Research Association,NASA SERVIR Science Coordination Office, Huntsville, USAGajendra Singh, Uttarakhand Space Application Centre, IndiaHamid Mehmood, United Nations University Institute for Water, Environment andHealth, Canada
xv

Hyongki Lee, Department of Civil and Environmental Engineering, University ofHouston, USAJoanna Pyres, Partnership Brokers AssociationJordan Bell, Earth Science Branch, NASA Marshall Space Flight Center, USAJordan G. Powers, National Center for Atmospheric Research, Boulder, Colorado,USAJustine Lacey, Commonwealth Scientific and Industrial Research Organisation(CSIRO), AustraliaJyoti Singh, Indian Institute of Technology, Delhi (IIT-Delhi), IndiaLiu Shiyin, Institute of International Rivers and Eco-security, Yunnan University,Kunming, ChinaManohara Khadka, International Water Management Institute (IWMI), NepalMollah Md Awlad Hossain, ICT-GIS Division, Institute of Water Modelling(IWM), BangladeshNabin Raj Joshi, Asia Network for Sustainable Agriculture and Bioresources(ANSAB), NepalNilesh Narayan Wagh, India Meteorological Department, Pune, IndiaPaul Bartel, SERVIR West Africa, NigerPeeranan Towashiraporn, Geospatial Information Department, Asian DisasterPreparedness Center, ThailandRishiraj Dutta, Asian Disaster Preparedness Center, ThailandRobinson Mugo, Regional Centre for Mapping of Resources for Development(RCMRD), KenyaRonald C. Estoque, National Institute for Environmental Studies, JapanSayed Sharif Shobair, United Nations Food and Agriculture Organization(UNFAO), AfghanistanShafique Matin, Agriculture and Food Development Authority (TEGASAC),IrelandShahriar Rahman, Department of Earth and Environmental Sciences, MacquarieUniversity, AustraliaSomeshwar Das, Department of Atmospheric Science, Central University ofRajasthan, IndiaSushma Bhattarai, Institute of Forestry, Tribhuvan University, NepalZhou Xiang, Aerospace Information Research Institute, Chinese Academy ofSciences, China
xvi List of Reviewers
Contents
1 Earth Observation Applications in the Hindu Kush HimalayaRegion—Evolution and Adoptions . . . . . . . . . . . . . . . . . . . . . . . . . 1Birendra Bajracharya, Daniel E. Irwin, Rajesh Bahadur Thapa,and Mir A. Matin
2 Service Planning Approach and Its Application . . . . . . . . . . . . . . . 23Rajesh Bahadur Thapa, Birendra Bajracharya, Mir A. Matin,Eric Anderson, and Pete Epanchin
3 Geospatial Applications in the HKH Region: Country Needsand Priorities . . . . . . . . . . . . . . . . . . . . . . . . . . . . . . . . . . . . . . . . . 41Mir A. Matin and Sheikh Tawhidul Islam
4 A Regional Drought Monitoring and Outlook Systemfor South Asia . . . . . . . . . . . . . . . . . . . . . . . . . . . . . . . . . . . . . . . . . 59Faisal Mueen Qamer, Mir A. Matin, Ben Zaitchik, Kiran Shakya,Yi Fan, Nishanta Khanal, Walter Lee Ellenburg, Timothy J. Krupnik,Hasan Md. Hamidur Rahman, Bashir Ahmad, Shib Nandan Shah,and Man Kshetri
5 In-Season Crop-Area Mapping for Wheat and Ricein Afghanistan and Bangladesh . . . . . . . . . . . . . . . . . . . . . . . . . . . . 79Varun Tiwari, Faisal Mueen Qamer, Mir A. Matin,Walter Lee Ellenburg, Waheedullah Yousafi, and Mustafa Kamal
6 Regional Land Cover Monitoring System for Hindu KushHimalaya . . . . . . . . . . . . . . . . . . . . . . . . . . . . . . . . . . . . . . . . . . . . . 103Kabir Uddin, Mir A. Matin, Nishanta Khanal, Sajana Maharjan,Birendra Bajracharya, Karis Tenneson, Ate Poortinga,Nguyen Hanh Quyen, Raja Ram Aryal, David Saah,Walter Lee Ellenburg, Peter Potapov, Africa Flores-Anderson,Farrukh Chishtie, Khun San Aung, Timothy Mayer, Sudip Pradhan,and Amanda Markert
xvii
7 Climate-Resilient Forest Management in Nepal . . . . . . . . . . . . . . . 127Vishwas Sudhir Chitale, Sunil Thapa, Mir A. Matin, Kamala Gurung,Shankar Adhikari, and Rabindra Maharjan
8 Forest Fire Detection and Monitoring . . . . . . . . . . . . . . . . . . . . . . . 147Sunil Thapa, Vishwas Sudhir Chitale, Sudip Pradhan,Bikram Shakya, Sundar Sharma, Smriety Regmi,Sameer Bajracharya, Shankar Adhikari, and Gauri Shankar Dangol
9 Enhancing Flood Early Warning System in the HKH Region . . . . 169Karma Tsering, Kiran Shakya, Mir A. Matin, Jim Nelson,and Birendra Bajracharya
10 Rapid Flood Mapping Using Multi-temporal SAR Images:An Example from Bangladesh . . . . . . . . . . . . . . . . . . . . . . . . . . . . 201Kabir Uddin, Mir A. Matin, and Rajesh Bahadur Thapa
11 Monitoring of Glaciers and Glacial Lakes in Afghanistan . . . . . . . 211Sudan Bikash Maharjan, Finu Shrestha, Fayezurahman Azizi,Esmatullah Joya, Birendra Bajracharya, Mohammad Tayib Bromand,and Mohammad Murtaza Rahimi
12 The High-Impact Weather Assessment Toolkit . . . . . . . . . . . . . . . . 231Patrick N. Gatlin, Jonathan L. Case, Jayanthi Srikishen,and Bhupesh Adhikary
13 Geospatial Information Technology for InformationManagement and Dissemination . . . . . . . . . . . . . . . . . . . . . . . . . . . 251Sudip Pradhan, Birendra Bajracharya, Kiran Shakya,and Bikram Shakya
14 Strengthening the Capacity on Geospatial InformationTechnology and Earth Observation Applications . . . . . . . . . . . . . . 269Rajesh Bahadur Thapa, Poonam Tripathi, Mir A. Matin,Birendra Bajracharya, and Betzy E. Hernandez Sandoval
15 Gender Integration in Earth Observation and Geo-informationTechnology Applications: Correlation and Connections . . . . . . . . . 291Chanda Gurung Goodrich, Kamala Gurung, and Menaka Hamal
16 Communicating Science for Informed Decision-Making . . . . . . . . . 307Birendra Bajracharya, Utsav Maden, Devrin Weiss, and Leah Kucera
17 User Engagement for Sustaining Services . . . . . . . . . . . . . . . . . . . . 327Naina Shakya, Santosh Pathak, Birendra Bajracharya,and Mir A. Matin
xviii Contents

18 Approach and Process for Effective Planning, Monitoring,and Evaluation . . . . . . . . . . . . . . . . . . . . . . . . . . . . . . . . . . . . . . . . 343Lalu Maya Kadel, Farid Ahmad, and Ganesh Bhattarai
19 Lessons and Future Perspectives of Earth Observationand GIT in the HKH . . . . . . . . . . . . . . . . . . . . . . . . . . . . . . . . . . . 363Mir A. Matin, Birendra Bajracharya, and Rajesh Bahadur Thapa
Contents xix
About the Editors
Birendra Bajracharya is Senior Remote Sensing and Geoinformation Specialistat ICIMOD and leads the SERVIR-HKH initiative. He specialises on decisionsupport systems, spatial data infrastructure, capacity building, and applications onnatural resources management.
Rajesh Bahadur Thapa is Remote Sensing and Geoinformation Specialist atICIMOD. His work focuses on radar applications to monitor and assess terrestrialenvironments, and capacity building on Earth observation and geoinformationtechnologies in the region.
Mir A. Matin is Theme Leader for the Geospatial Solutions at ICIMOD. Heprovides scientific leadership in building and promoting innovative anduser-oriented geospatial applications to support improved resilience and livelihoodsin the region.
xxi
Acronyms
ACT Australia Capital TerritoryADIM Assessment, Design, Implementation, and MonitoringADPC Asian Disaster Preparedness CenterAEZ Agro-Ecological ZonesAFS Agriculture and Food SecurityAGU Annual American Geophysical UnionAHP Analytical Hierarchy ProcessAI Artificial IntelligenceAIMS Afghanistan Information Management ServicesALOS Advanced Land Observing SatelliteAMA Afghan Meteorological AuthorityAMD Afghanistan Meteorological DepartmentANDMA Afghanistan National Disaster Management AuthorityANN Artificial Neural NetworkAOGEO Asia-Oceania Group on Earth ObservationsAOGEOSS Asia Oceania Global Earth Observation System of SystemsAPFM Associated Programme on Flood ManagementAPHRODITE Asian Precipitation—Highly-Resolved Observational Data
Integration Towards EvaluationAPI Application Programming InterfaceARD Application Ready DataARIES Artificial Intelligence for Ecosystem ServicesARVI Atmospherically Resistant Vegetation IndexASHA Adaptation for Smallholders in Hilly AreasAST Applied Sciences TeamAUROC Area Under the Receiver Operating CharacteristicsAVHRR Advanced Very High Resolution RadiometerAWiFS Advanced Wide Field SensorAWS Amazon Web ServicesBARC Bangladesh Agricultural Research Council
xxiii
BARI Bangladesh Agriculture Research InstituteBBC British Broadcasting CorporationBFD Bangladesh Forest DepartmentBiDS Big Data from SpaceBMD Bangladesh Meteorological DepartmentBRRI Bangladesh Rice Research InstituteBSDMA Bihar State Disaster Management AuthorityBSI Bare Soil IndexBUET Bangladesh University of Engineering and TechnologyBWDB Bangladesh Water Development BoardBYU Brigham Young UniversityC3S Copernicus Climate Change ServiceCARE Cooperative for Assistance and Relief EverywhereCB Capacity BuildingCBD Convention on Biological DiversityCBS Central Bureau of StatisticsCC Cross CuttingCC-BY Creative Commons AttributionCDF Common Data FormCEGIS Centre for Environmental and Geographic Information
ServicesCEMS Copernicus Emergency Management ServiceCEO Collect Earth OnlineCEOS Committee on Earth Observation SatellitesCF Community ForestryCFM Community Forestry ManagementCFUGs Community Forest User GroupsCHIME Copernicus Hyperspectral Imaging Mission for the
EnvironmentCHIRP Climate Hazards Group InfraRed PrecipitationCHIRP/S Climate Hazard Group InfraRed Precipitation SatelliteCI Clean IceCIFOR Center for International Forestry ResearchCIMMYT International Maize and Wheat Improvement CenterCIMR Copernicus Imaging Microwave RadiometerCNN Cable News NetworkCO2M Carbon dioxide monitoringCORDEX Coordinated Regional Climate Downscaling ExperimentCRED Center for Research on the Epidemiology of DisastersCRFMS Climate Resilient Forest Management SystemCRISTAL Copernicus Polar Ice and Snow Topography AltimeterDAE Department of Agriculture ExtensionDC Debris-CoveredDDG Deputy Director GeneralDDM Department of Disaster Management
xxiv Acronyms

DEM Digital Elevation ModelDEOC District Emergency Operation CenterDFOMP Divisional Forest Operation and Management PlanDFOs Divisional Forest OfficersDFRS Department of Forest Research and SurveyDG Director GeneralDHM Department of Hydrology and MeteorologyDLRS Department of Land Records and SurveyDMDD Data Management Definition DocumentDNPWC Department of National Parks and Wildlife ConservationDoA Department of AgricultureDoF Department of ForestsDoFSC Department of Forests and Soil ConversationDOIs Digital Object IdentifiersDORIS Delft Institute of Earth Observation and Space SystemsDPHE Department of Public Health and EngineeringDQA Data Quality AssessmentDRAS Drought Assessment ModelDRR Disaster Risk ReductionECMWF European Center for Medium Range Weather ForecastsECs Executive CommitteesEFFIS European Forest Fire Information SystemEFWS Enhancing Flood Forecasting and Warning SystemEL Exposure and LearningEMC Environmental Modeling CenterEM-DAT Emergency Events DatabaseEML Ecological Metadata LanguageENSO El Nino–Southern OscillationENVISAT Environmental SatelliteEO Earth ObservationEO4SDG EO for Sustainable Development GoalsER Elevation RatingERDAS Earth Resources Data Analysis SystemESRI Environment Systems Research InstituteET EvapotranspirationETDI Evapotranspiration Deficit IndexETM Enhanced Thematic MapperEVI Enhanced Vegetation IndexEWS Early Warning SystemsFAO Food and Agriculture OrganizationFD Forest DepartmentFECOFUN Federation of Community Forestry Users NepalFEWS NET Famine Early Warning Systems NetworkFEWS Flood Early Warning System
Acronyms xxv

FF Forest FireFFR Forest Fire RiskFFWC Flood Forecasting and Warning CenterFOSS Free and Open Source SoftwareFR Frequency RatioFRA Forest Resource AssessmentFRTC Forest Research and Training CenterGARD Generalized Analog and Regression DownscalingGBIF Global Biodiversity Information FacilityGCI Green Chlorophyll IndexGDACS Global Disaster Alert and Coordination SystemGDAS Global Data Assimilation SystemGDEST Global Dialogue on Emerging Science and TechnologyGDP Gross Domestic ProductGDWR General Directorate of Water ResourcesGEE Google Earth EngineGEF Global Environment FacilityGEFS Global Ensemble Forecast SystemGEO Group on Earth ObservationsGEOBON Group on Earth Observations Biodiversity Observation
NetworkGEOGLAM Group on Earth Observations Global Agricultural Monitoring
InitiativeGeoGLOWS GEO Global Water SustainabilityGEOS Global Earth Observation SystemGEOSS Global Earth Observation System of SystemsGESI Gender and Social InclusionGFMC Global Fire Monitoring CenterGFOI Global Forest Observations InitiativeGFS Global Forecast SystemGIAnt Generic InSAR Analysis ToolboxGIS Geographic Information SystemsGIT Geospatial Information TechnologiesGLAD Global Land Analysis and DiscoveryGLDAS Global Land Data Assimilation SystemGLIMS Global Land Ice Measurements from SpaceGLOF Glacial Lake Outburst FloodGLoFAS Global Flood Awareness SystemGLOVIS Global Visualization ViewerGMI GPM Microwave ImagerGMTSAR Generic Mapping Tools Synthetic Aperture RadarGNOME Global Network for Observations and Information on
Mountain EnvironmentsGoN Government of Nepal
xxvi Acronyms
GPM Global Precipitation MeasurementGPS Global Positioning SystemGRAIN Grain Research and InnovationGRD Ground Range DetectedGWP Global Water PartnershipHIWAT High Impact Weather Assessment ToolkitHKH Hindu Kush HimalayaHPC High Performance ComputingHTESSEL Hydrology Tiled ECMWF Scheme for Surface Exchange over
LandHTTP Hypertext Transfer ProtocolICIMOD International Centre for Integrated Mountain DevelopmentICST International Conference on Sensing TechnologyIDMP Integrated Drought Management ProgrammeIFAD International Fund for Agricultural DevelopmentIFS Integrated Forecast SystemIGES Institute for Global Environmental StrategiesIGIF Integrated Geospatial Information FrameworkINGO International Non-Governmental OrganizationIoT Internet of ThingsIPCC Intergovernmental Panel on Climate ChangeIRS Institute of Remote SensingISCE InSAR Scientific Computing EnvironmentISO International Organization for StandardizationISODATA Iterative Self-Organizing Data Analysis TechniqueISPAN Irrigation Support Project for Asia and the Near EastIT Information TechnologyIUCN International Union for Conservation of NatureIUFRO International Union of Forest Research OrganizationsIWFM Institute of Water and Flood ManagementIWM Institute of Water ModellingJAWRA Journal of the American Water Resources AssociationJICA Japan International Cooperation AgencyJPEG Joint Photographic Experts GroupJPL Jet Propulsion LaboratoryJRC Joint River CommissionsJU Jahangirnagar UniversityKFS Korean Forestry ServicesKFZ Kandahar Food ZoneKGE Kling-Gupta EfficiencyKMC Knowledge Management and CommunicationKU Kabul UniversityLAI Leaf Area IndexLAPA Local Adaptation Plan of ActionLCCS Land Cover Classification System
Acronyms xxvii

LCR Land Cover RatingLDAS Land Data Assimilation SystemLEOCs Local Emergency Operation CentersLFA Lightning Forecast AlgorithmLGED Local Government Engineering DepartmentLIDAR Light Detection and RangingLIS Land Information SystemLISS Linear Imaging Self Scanning SensorLoA Letter of AgreementLoI Letter of IntentLPG Liquified Petroleum GasLRMP Land Resource Mapping ProjectLSM Land Surface ModelLSTM Land Surface Temperature MonitoringLULC Land Use and Land CoverLULC&E Land Use, Land Cover and EcosystemsLWM Land and Water MaskM&E Monitoring and EvaluationMAE Mean Absoulte ErrorMAIL Ministry of Agriculture, Irrigation and LivestockMC Mercy CorpsMCDA Multi-Criteria Decision AnalysesME Mean ErrorMEA Millennium Ecosystem AssessmentMEL Monitoring, Evaluation and LearningMENRIS Mountain Environment Regional Information SystemMEW Ministry of Energy and WaterMIID Myanmar Institute for Integrated DevelopmentML Machine LearningMoALD Ministry of Agriculture and Livestock DevelopmentMODIS Moderate Resolution Imaging SpectroradiometerMoFE Ministry of Forests and EnvironmentMoFSC Ministry of Forests and Soil ConservationMoHA Ministry of Home AffairsMoNREC Ministry of Natural Resources and
Environmental ConservationMoPE Ministry of Population and EnvironmentMoU Memorandum of UnderstandingMoWR Ministry of Water ResourcesMRV Measurement, Reporting and VerificationMSFC Marshall Space Flight CenterMSS Multispectral Scanner SystemMTAP Medium Term Action PlanMTR Melghat Tiger ReserveMyCOE My Community Our Earth
xxviii Acronyms

NAMIS National Agriculture Management Information SystemNAP National Adaptation PlanNAPA National Adaptation Plan of ActionNARC Nepal Agricultural Research CouncilNASA National Aeronautics and Space AdministrationNASEM National Academies of Sciences, Engineering, and MedicineNCAR National Center for Atmospheric ResearchNCEP National Centers for Environmental PredictionNCHM National Center for Hydrology and MeteorologyNDDBI Normalized Difference and Distance Built-up IndexNDFI Normalized Difference Fraction IndexNDMC National Drought Monitoring CenterNDMI Normalized Difference Moisture IndexNDSI Normalized Difference Snow IndexNDVI Normalized Difference Vegetation IndexNDWI Normalized Difference Water IndexNEPA National Environmental Protection AgencyNFFMC Nepal Forest Fire Management ChapterNFI National Forest InventoryNGIC National Geoinformation CenterNGO Non-Governmental OrganizationNHMS National Hydrological and Meteorological ServicesNIRAPAD Network for Information, Response And Preparedness
Activities on DisasterNISAR NASA-ISRO Synthetic Aperture RadarNLCMS National Land Cover Monitoring SystemsNOAA National Oceanic and Atmospheric AdministrationNPP Net Primary ProductivityNRT Near Real-TimeNSDI National Spatial Data InfrastructureNSE Nash-Sutcliffe EfficiencyNSIA National Statistic and Information AuthorityNTFP Non-Timber Forest ProductNTNC National Trust for Nature ConservationNU Nangarhar UniversityNWARA National Water Affairs Regulation AuthorityNWP Numerical weather predictionOBIC Object-Based Image ClassificationODC Open Data CubeODK Open Data KitOFDA Office of Foreign Disaster AssistanceOGC Open Geospatial ConsortiumOJT On the Job TrainingOLI Operational Land Imager
Acronyms xxix
OPeNDAP Open-source Project for a Network Data Access ProtocolOSM Open Street MapPA Practical ActionPALSAR Phased Array type L-band Synthetic Aperture RadarPARC Pakistan Agricultural Research CouncilPAs Protected AreasPBA Partnership Brokers AssociationPBIAS Percent biasPBL Planetary Boundary LayerPCRWR Pakistan Council of Research in Water ResourcesPDD Definition DocumentPIPA Participatory Impact Pathway AnalysisPM&E Planning, Monitoring and EvaluationPMD Pakistan Meteorological DepartmentPMEL Planning, Monitoring, Evaluation and LearningPMM Probability Matched MeanPNG Portable Network GraphicsPOD Probability of DetectionPPCR Pilot Program for Climate ResiliencePPGIS Public Participation Geographic Information SystemQGIS Quantum Geographic Information SystemRADAR Radio Detection and RangingRAM Random Access MemoryRAN Robotics Association of NepalRAPID Routing Application for Parallel Computation of DischargeRBM Result Based ManagementRCP Representative Concentration PathwayRDAFRI Relative Differenced Aerosol-Free Vegetation IndexRDMOS Regional Drought Monitoring and Outlook SystemRDR Road Distance RatingRDS Regional Database SystemRECOFTC Regional Community Forestry Training Center for Asia and
the PacificREDD Reducing Emissions from Deforestation and Forest
DegradationREST API Representational State Transfer-Application Program InterfaceRF Random ForestRLCMS Regional Land Cover Monitoring SystemRMSE Root Mean Square ErrorROI_PAC Repeat Orbit Interferometry PackageROSE-L Radar Observing System for Europe—L-bandRS Remote SensingRSR RMSE-observations standard deviation ratioS2S Season to Sub-seasonS2S-LDAS Sub-Seasonal to Seasonal Land Data Assimilation System
xxx Acronyms

SA Spectral AngleSAARC South Asian Association for Regional CooperationSAC SAARC Agriculture CentreSAGE Scientific Advisory Group for EmergenciesSALDAS South Asia Land Data Assimilation SystemSAR Synthetic Aperture RadarSASCOF South Asian Climate Outlook ForumSAVI Soil Adjusted Vegetation IndexSCO-SOCRATES SERVIR Coordination Office-SERVIR Operational Cluster
Resource for Applications—Terabytes for Earth ScienceSDG Sustainable Development GoalSDK Software Development KitSDR Settlement Distance RatingSEPAL System for Earth observations, data access, processing and
analysis for land monitoringSFD State Forest DepartmentSFDRR Sendai Framework for Disaster Risk ReductionSFTP Streamflow Prediction ToolSIG Spatial Informatics GroupSLR Slope RatingSMA Soil Moisture AnomalySMEs Subject Matter ExpertsSMRC SAARC Meteorological Research CentreSMS Short Message ServiceSNAP Sentinel Application PlatformSoB Survey of BangladeshSOCRATES SERVIR Operational Cluster Resource for Applications—
Terabytes for Earth ScienceSOP Standard Operating ProceduresSoP Survey of PakistanSPA Service Planning ApproachSPARRSO Bangladesh Space Research and Remote Sensing
OrganizationSPI Standardized Precipitation IndexSPME Strategic Planning, Monitoring and EvaluationSPoRT Short-term Prediction Research and Transition CenterSPOT Satellite Pour l’Observation de la TerreSPT Streamflow PredictionSQL Structured Query LanguageSRDI Soil Resources Development InstituteSRTM Shuttle Radar Topography MissionSST Sea Surface TemperatureST Standard TrainingSTEM Science, Technology, Engineering, and MathematicsSUPARCO Pakistan Space and Upper Atmosphere Research Commission
Acronyms xxxi

SVM Support Vector MachineSWOT Strengths, Weaknesses, Opportunities and ThreatsTDD Training Definition DocumentTDOM Temporal Dark Outlier MaskTHREDDS Thematic Realtime Environmental Distributed Data ServicesTM Thematic MapperTOA Top of AtmosphereToC Theory of ChangeToT Training of TrainersTR Temperature RatingTRU Thompson Rivers UniversityUAV Unmanned Aerial VehicleUEMS Unified Environmental Modeling SystemUMD University of MarylandUN United NationsUNDP United Nations Development ProgrammeUNDRR United Nations Office for Disaster Risk ReductionUNEP United Nations Environment ProgrammeUNESCAP United Nations Economic and Social Commission for Asia
and the PacificUNESCO United Nations Educational, Scientific and Cultural
OrganizationUNFCCC United Nations Framework Convention on Climate ChangeUNGGIM United Nations International Group on Geospatial Information
ManagementUNISDR United Nations International Strategy for Disaster ReductionUNOOSA United Nations Office for Outer Space AffairsUN-SPIDER United Nations Platform for Space-based Information for
Disaster Management and Emergency ResponseURL Uniform Resource LocatorUSA United States of AmericaUSAID United States Agency for International DevelopmentUSDA United States Department of AgricultureUSF University of San FranciscoUSFS United States Forest ServiceUSGS United States Geological SurveyUTC Universal Time CoordinatedVCI Vegetation Condition IndexVDC Village Development CommitteeVGI Volunteered Geographical InformationVH Vertical transmissions and the horizontals receivedVIC Variable Infiltration CapacityVIIRS Visible Infrared Imaging Radiometer SuiteVRA Vulnerability Reduction AssessmentVV Vertical transmissions and the verticals received
xxxii Acronyms

WAPRO Water Resources Planning OrganizationWCS Web Coverage ServiceWFP World Food ProgrammeWFS Web Feature ServiceWMO World Meteorological OrganizationWMS Web Map ServiceWRD Water Resource DepartmentWRF Weather Research and ForecastingWRHD Water Resources and Hydro-Climatic DisastersWRI World Resources InstituteWWF World Wide Fund for Nature
Acronyms xxxiii
Chapter 1Earth Observation Applicationsin the Hindu Kush HimalayaRegion—Evolution and Adoptions
Birendra Bajracharya , Daniel E. Irwin, Rajesh Bahadur Thapa,and Mir A. Matin
1.1 Introduction and Rationale
The year 1957 marked the start of a new era in human history with the launch ofSputnik, thus began the journey of Earth observation (EO). Then, in the early1960s, with rapid developments in space technology and the race to reach themoon, scientific discussions veered toward the potential applications of EO in thefields of geography, agriculture, water resources, geology, and oceanography(NASA 2017; Haklay et al. 2018). The famous photograph of the rising Earth(Earthrise) taken from the lunar orbit in December 1968 by astronaut WilliamAnders is considered the most influential environmental picture ever (Moran 2018).Astronauts have often expressed their experiences on looking at the Earth fromspace—a planet full of water and without borders—and how the sight made themfeel small and vulnerable (Shrestha and Bajracharya 2011). Earth’s images fromspace have urged us to think of and understand our planet as a system. The launchof Landsat 1 in 1972 symbolized the beginning of the modern EO era and provideda consistent set of synoptic, high-resolution images (80 m) to the scientific com-munity (Zhou and Kafatos 2002). Since then, EO has proven to be a powerful toolto generate information across the globe—information that is consistent, transpar-ent, reliable, verifiable, and not restricted by national borders.
Our daily lifestyles have dramatically changed in today’s increasingly global,connected, and digital world, dictating how we spend our work and social life(O’Sullivan et al. 2018). EO data and services have become an integral part ofmodern society, ranging from monitoring global climate to navigating cars orexploring online detailed images of our neighborhood with our mobile phones. The
B. Bajracharya (&) � R. B. Thapa � M. A. MatinInternational Centre for Integrated Mountain Development, Kathmandu, Nepale-mail: [email protected]
D. E. IrwinNASA SERVIR Science Coordination Office, Huntsville, AL, USA
© The Author(s) 2021B. Bajracharya et al. (eds.), Earth Observation Science and Applications for RiskReduction and Enhanced Resilience in Hindu Kush Himalaya Region,https://doi.org/10.1007/978-3-030-73569-2_1
1
evolution of citizen science and volunteered geographic information (VGI) hasresulted in concrete projects like OpenStreetMap (Brovelli et al. 2020). We are nowaccustomed to accurate hourly weather forecasts and to following satellite imagesof swirling storms hitting coasts and cities. A combination of satellite data andweather models has made it possible to forecast discharge in each stream segmentand also the extent of flood two weeks ahead, thereby helping in better preparednessto tackle any potential disaster (Souffront et al. 2019; Nelson et al. 2019).
The wide range of information collected by EO directly or indirectly supports allfunctions of government, economic sectors and in tracking biodiversity and wildlifetrends; it also helps in measuring land-use change and deforestation; monitoringnatural disasters such as fires, floods, and earthquakes; managing natural resources,such as energy, freshwater, and agriculture; addressing emerging diseases andhealth risks; and predicting and mitigating climate change (Anderson et al. 2017;Petiteville et al. 2015; Paganini et al. 2018).
Today, all countries are facing complex challenges of climate and environ-mental, sociocultural, and economic changes which are having an impact on naturalenvironments and livelihoods. This calls for immediate actions, both globally andlocally. So, realizing the need for unified interventions, all member states of theUnited Nations have adopted the 2030 Agenda for Sustainable Development, whichprovides a shared blueprint for peace and prosperity for the people and the planet(UN 2015). The agenda includes 17 Sustainable Development Goals (SDGs),which the countries need to address in a global partnership. These goals, targets,and indicators have been designed to measure, manage, and monitor progress in auniform and systematic manner across the globe. EO has a significant role to play inthis regard by bringing in spatial dimension to natural resources and socioeconomicstatistics, while also allowing for disaggregation and granularity of the indicators(Paganini et al. 2018). EO data can support in analysis, modeling, and mappingSDGs which can then provide the integrative and quantitative framework necessaryfor global collaboration, consensus, and evidence-based decision-making (Liu et al.2020). The global interest in EO is also demonstrated by the membership of morethan 100 national governments and over 130 participating organizations in theGroup on Earth Observations (GEO) which envisions “a future where decisions andactions for the benefit of humankind are informed by coordinated, comprehensive,and sustained Earth observations” (http://earthobservations.org). Moreover, initia-tives such as the United Nations Office for Outer Space Affairs (UNOOSA) forpromoting international cooperation in the peaceful uses of outer space, and itsUnited Nations Platform for Space-based Information for Disaster Management andEmergency Response (UN-SPIDER) are examples of international efforts in the useof EO for societal benefits (http://unoosa.org). UN-SPIDER supports the devel-oping countries to have access to specialized EO technologies which are essential inthe management of disasters and reducing disaster risks. EO-based applications andservices are increasingly being used for emergency response (Petiteville et al. 2015)and environmental monitoring, which are mainly seen as humanitarian needs. EO isalso contributing to the emerging markets and providing opportunities for small and
2 B. Bajracharya et al.

medium enterprises, thereby being of value for citizens, government agencies, andthe commercial industry (O’Sullivan et al. 2018).
It was the opening of the United States Geological Survey’s Landsat archive in2008 that greatly encouraged the development of applications using EO data. Forthe first time, a systematic, decades-long archive of our planet became freelyavailable. The benefits to the US and international users from the Landsat imagerywere estimated at $3.4 billion in 2017 (Straub et al. 2019). This open-data policyresulted in a 60-fold increase in daily data downloads and crossed 100 milliondownloads as of March 2020 (Zhu et al. 2019; Straub et al. 2019; USGS 2020).Meanwhile, the Copernicus Program of the European Union implemented similarpolicies by providing free and open access to the vast majority of data and infor-mation delivered by the Copernicus Space infrastructure and the CopernicusServices (Zhu et al. 2019; Reillon 2017; Filchev et al. 2018). In the case of Asia,China, India, Japan, and South Korea are the major contributors in this area withtheir large suite of satellites; they have also initiated open-access policies on someselected data sets. Another development in the field of EO is the considerableincrease in CubeSats which have changed the way satellites are built, launched, andused to address different needs (Thyrso et al. 2019). Besides, the adoption of thesedisruptive satellite technologies by private players like Planet has made any part ofEarth accessible on a daily basis (http://planet.com).
The large volumes of free Landsat, Sentinel, and many other resources in theapplication ready data (ARD) format provided through cloud computing serviceswith programming interfaces and powerful processing capabilities is seen as thedemocratization of satellite mapping (Dwyer et al. 2018). Efforts are also beingmade by space agencies on joint development and continuous innovation in thespace sector; these are driven by national security and science objectives, userneeds, and the pursuit of human space exploration (Zhu et al. 2019; ESREWhitepaper 2017). Today, we observe a rapid transformation in the internationalspace sector alongside the emergence of Space 4.0, which has been characterized byincreased interaction among governments, the private sector, society, and thepolitical community (Mazzucato and Robinson 2017). This is often seen in con-junction with the Fourth Industrial Revolution that has transformed the productioncycle which is now being driven by digital technologies such as artificial intelli-gence (AI), machine learning (ML), cloud computing, Internet of things (IoT), andbig data analytics (Filchev et al. 2018; Vaidya et al. 2018). Meanwhile, manydevelopments from other areas, such as data cube technologies and block chain, arebeing adopted or explored for implementation in EO applications (ESA 2019;Sudmanns et al.2019; O’Sullivan et al. 2018; Baumann et al. 2018). Then there isthe factor of next-generation EO satellites which are expected to be highly intel-ligent and possessing the capability to integrate sensors, data-processing devices,and communication systems, thereby making it possible to carry out global surveysand real-time environmental analysis (Liu et al. 2020). With the maturity andconvergence of these evolving technologies, we can expect unprecedented oppor-tunities from EO to serve the needs of our communities, nations, and the world as awhole.
1 Earth Observation Applications in the Hindu … 3
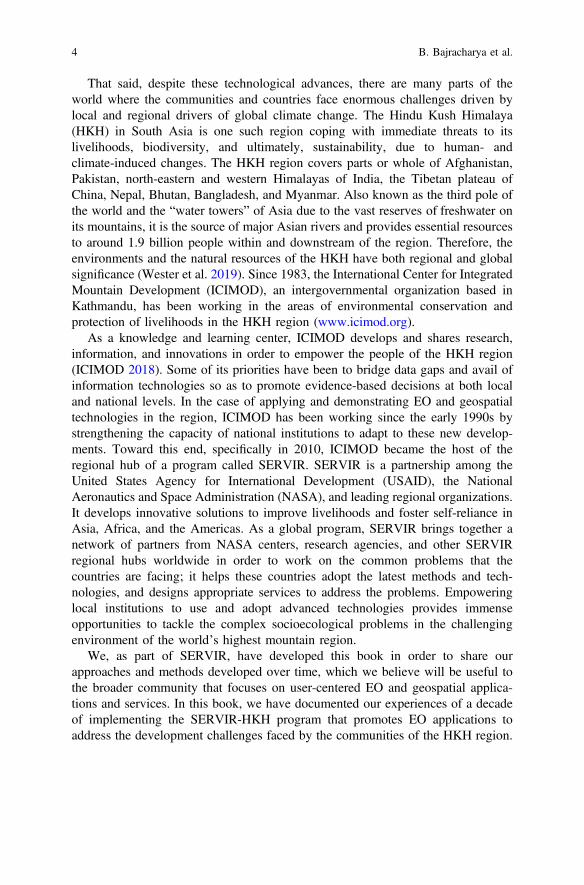
That said, despite these technological advances, there are many parts of theworld where the communities and countries face enormous challenges driven bylocal and regional drivers of global climate change. The Hindu Kush Himalaya(HKH) in South Asia is one such region coping with immediate threats to itslivelihoods, biodiversity, and ultimately, sustainability, due to human- andclimate-induced changes. The HKH region covers parts or whole of Afghanistan,Pakistan, north-eastern and western Himalayas of India, the Tibetan plateau ofChina, Nepal, Bhutan, Bangladesh, and Myanmar. Also known as the third pole ofthe world and the “water towers” of Asia due to the vast reserves of freshwater onits mountains, it is the source of major Asian rivers and provides essential resourcesto around 1.9 billion people within and downstream of the region. Therefore, theenvironments and the natural resources of the HKH have both regional and globalsignificance (Wester et al. 2019). Since 1983, the International Center for IntegratedMountain Development (ICIMOD), an intergovernmental organization based inKathmandu, has been working in the areas of environmental conservation andprotection of livelihoods in the HKH region (www.icimod.org).
As a knowledge and learning center, ICIMOD develops and shares research,information, and innovations in order to empower the people of the HKH region(ICIMOD 2018). Some of its priorities have been to bridge data gaps and avail ofinformation technologies so as to promote evidence-based decisions at both localand national levels. In the case of applying and demonstrating EO and geospatialtechnologies in the region, ICIMOD has been working since the early 1990s bystrengthening the capacity of national institutions to adapt to these new develop-ments. Toward this end, specifically in 2010, ICIMOD became the host of theregional hub of a program called SERVIR. SERVIR is a partnership among theUnited States Agency for International Development (USAID), the NationalAeronautics and Space Administration (NASA), and leading regional organizations.It develops innovative solutions to improve livelihoods and foster self-reliance inAsia, Africa, and the Americas. As a global program, SERVIR brings together anetwork of partners from NASA centers, research agencies, and other SERVIRregional hubs worldwide in order to work on the common problems that thecountries are facing; it helps these countries adopt the latest methods and tech-nologies, and designs appropriate services to address the problems. Empoweringlocal institutions to use and adopt advanced technologies provides immenseopportunities to tackle the complex socioecological problems in the challengingenvironment of the world’s highest mountain region.
We, as part of SERVIR, have developed this book in order to share ourapproaches and methods developed over time, which we believe will be useful tothe broader community that focuses on user-centered EO and geospatial applica-tions and services. In this book, we have documented our experiences of a decadeof implementing the SERVIR-HKH program that promotes EO applications toaddress the development challenges faced by the communities of the HKH region.
4 B. Bajracharya et al.
1.2 The Geographic Context
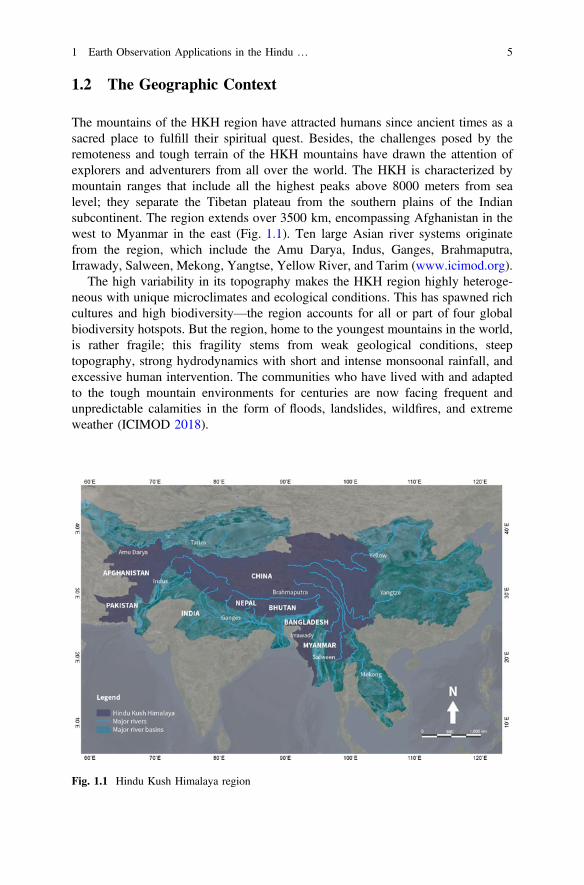
The mountains of the HKH region have attracted humans since ancient times as asacred place to fulfill their spiritual quest. Besides, the challenges posed by theremoteness and tough terrain of the HKH mountains have drawn the attention ofexplorers and adventurers from all over the world. The HKH is characterized bymountain ranges that include all the highest peaks above 8000 meters from sealevel; they separate the Tibetan plateau from the southern plains of the Indiansubcontinent. The region extends over 3500 km, encompassing Afghanistan in thewest to Myanmar in the east (Fig. 1.1). Ten large Asian river systems originatefrom the region, which include the Amu Darya, Indus, Ganges, Brahmaputra,Irrawady, Salween, Mekong, Yangtse, Yellow River, and Tarim (www.icimod.org).
The high variability in its topography makes the HKH region highly heteroge-neous with unique microclimates and ecological conditions. This has spawned richcultures and high biodiversity—the region accounts for all or part of four globalbiodiversity hotspots. But the region, home to the youngest mountains in the world,is rather fragile; this fragility stems from weak geological conditions, steeptopography, strong hydrodynamics with short and intense monsoonal rainfall, andexcessive human intervention. The communities who have lived with and adaptedto the tough mountain environments for centuries are now facing frequent andunpredictable calamities in the form of floods, landslides, wildfires, and extremeweather (ICIMOD 2018).
Fig. 1.1 Hindu Kush Himalaya region
1 Earth Observation Applications in the Hindu … 5

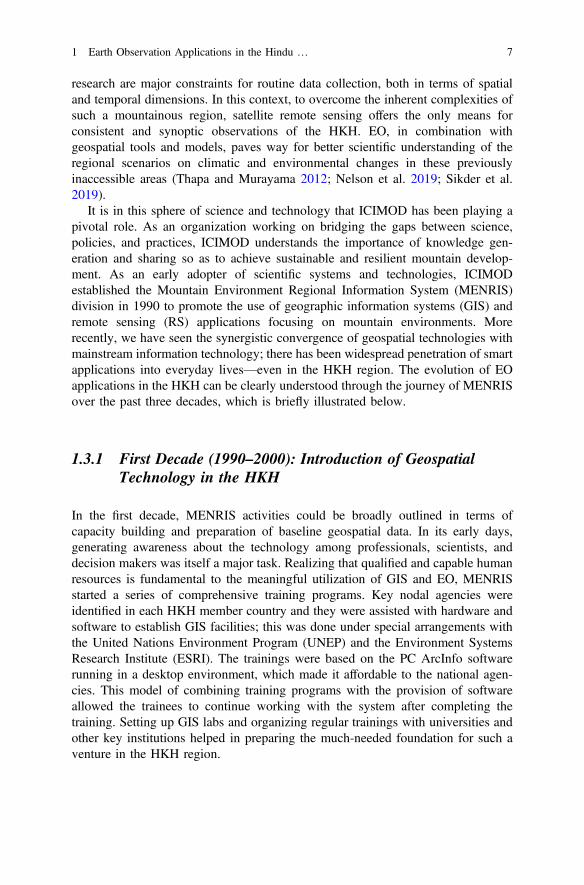
More recently, the HKH region has received growing attention as one of the mostvulnerable ecosystems in the world; concerns have risen about rapid glacier melt andthe consequent threats to water resources for both upstream and downstream com-munities (Wester et al. 2019). The visible impact of climate change on snow andglaciers, the water cycle, and biodiversity, as well as the increasing frequency andmagnitude of climate-induced disasters is threatening the dynamics of life-supportsystems and the traditional adaptation and coping mechanisms of the local people(Bajracharya et al. 2007; Wester et al. 2019). The mountain communities still maketheir living from limited farmlands and natural resources (Fig. 1.2). However,recurring droughts are affecting agricultural production where access to water forfarming was already under strain. The region is also facing multiple pressures fromglobalization by way of migration, unsustainable tourism, overexploitation of nat-ural resources, and changes in land-cover and land-use practices (Wester et al. 2019).
1.3 Earth Observation Applications in the HKH
Understanding the complex natural and socioecological processes in the HKH hasbeen challenging due to limited scientific data and information. Highly inaccessibleterrains, harsh climatic conditions, and lack of investment in long-term scientific
Fig. 1.2 Farmlands in the highmountain district ofMustang, Nepal. Photo by Birendra Bajracharya
6 B. Bajracharya et al.
research are major constraints for routine data collection, both in terms of spatialand temporal dimensions. In this context, to overcome the inherent complexities ofsuch a mountainous region, satellite remote sensing offers the only means forconsistent and synoptic observations of the HKH. EO, in combination withgeospatial tools and models, paves way for better scientific understanding of theregional scenarios on climatic and environmental changes in these previouslyinaccessible areas (Thapa and Murayama 2012; Nelson et al. 2019; Sikder et al.2019).
It is in this sphere of science and technology that ICIMOD has been playing apivotal role. As an organization working on bridging the gaps between science,policies, and practices, ICIMOD understands the importance of knowledge gen-eration and sharing so as to achieve sustainable and resilient mountain develop-ment. As an early adopter of scientific systems and technologies, ICIMODestablished the Mountain Environment Regional Information System (MENRIS)division in 1990 to promote the use of geographic information systems (GIS) andremote sensing (RS) applications focusing on mountain environments. Morerecently, we have seen the synergistic convergence of geospatial technologies withmainstream information technology; there has been widespread penetration of smartapplications into everyday lives—even in the HKH region. The evolution of EOapplications in the HKH can be clearly understood through the journey of MENRISover the past three decades, which is briefly illustrated below.
1.3.1 First Decade (1990–2000): Introduction of GeospatialTechnology in the HKH
In the first decade, MENRIS activities could be broadly outlined in terms ofcapacity building and preparation of baseline geospatial data. In its early days,generating awareness about the technology among professionals, scientists, anddecision makers was itself a major task. Realizing that qualified and capable humanresources is fundamental to the meaningful utilization of GIS and EO, MENRISstarted a series of comprehensive training programs. Key nodal agencies wereidentified in each HKH member country and they were assisted with hardware andsoftware to establish GIS facilities; this was done under special arrangements withthe United Nations Environment Program (UNEP) and the Environment SystemsResearch Institute (ESRI). The trainings were based on the PC ArcInfo softwarerunning in a desktop environment, which made it affordable to the national agen-cies. This model of combining training programs with the provision of softwareallowed the trainees to continue working with the system after completing thetraining. Setting up GIS labs and organizing regular trainings with universities andother key institutions helped in preparing the much-needed foundation for such aventure in the HKH region.
1 Earth Observation Applications in the Hindu … 7
A major challenge was that base maps in the digital form were nonexistent forany work to begin on any real application. So, efforts were made on developingdatabases using the available paper maps. Digitizing all the 1 inch: 1 mile scaletopographic maps of Nepal and making them freely available to the users was amassive undertaking. Also, a number of demonstration projects were implementedwith partners. Some of the early examples of application of GIS and EO in theregion are: MENRIS case study series on Dhading (ICIMOD 1992), Gorkha (Trapp1995), and Lamjung (Trapp and Mool 1996); Kathmandu Valley GIS database(Shrestha and Pradhan 2000); GIS for municipal planning in Kirtipur (Shresthaet al. 2003); and land-cover mapping of Nepal and Pakistan using the NationalOceanic and Atmospheric Administration’s (NOAA’s) Advanced VeryHigh-Resolution Radiometer (AVHRR) data (UNEP 1998).
In 1996, the project “Strengthening of Training Capabilities for GISApplications in Integrated Development in the Hindu Kush Himalayan Region,”funded by the Netherlands government, provided a further boost to developstructured capacity building activities with new courses on Infrastructure andFacility Planning; Mountain Agriculture and Land-use Planning; Monitoring,Assessment and Planning of Mountain Natural Resources; and Slope StabilityAnalysis and Hazard Mapping (Shrestha and Bajracharya 2002). These month-longtrainings were organized in all member countries of ICIMOD. The technicaltrainings and policy workshops helped to generate the required skill sets amongprofessionals from governments and relevant agencies, thereby raising awarenessamong the decision makers. During this time, the development of moreuser-friendly software interfaces on Windows, such as Esri’s ArcView and ErdasImagine, helped to improve the learning curve of the beginners and made it possibleto include more advanced analytical tools in the trainings.
1.3.2 The Second Decade (2000–2010): Transitionto Internet-Based Applications and Decision-SupportSystems
MENRIS started its second decade by focusing on the emerging approaches incapacity building. A computer-based CD-ROM on “Applications of GIS andRemote Sensing to Sustainable Mountain Development” was developed—withconcepts of geospatial technology, interactive and hands-on exercises, and sup-plementary materials—for the trainers to serve as a self-learning kit and as an aid inprofessional-level training programs. Internet map services were also introducedthrough ICIMOD’s Mountain GeoPortal with interactive online training materials.
And from the years 2006–2009, advanced applications of EO on socioecosystemmodeling were initiated through a Hindu Kush–Karakoram–Himalaya (HKKH)partnership project supported by the Italian Development Cooperation of theMinistry of Foreign Affairs. This partnership initiative took place under the umbrellaof the global mountain partnership with the purpose of consolidating institutional
8 B. Bajracharya et al.

capacity for systemic planning and management of mountain resources at regional,national, and local levels. It focused on developing decision-support tools for con-servation management in the three of the most elevated protected areas of the world:Everest National Park in Nepal; Chomolungma Nature Preserve in China; andKarakoram National Park in Pakistan (Bajracharya et al. 2010a). During this time,MENRIS adopted emerging and innovative approaches such as object-based clas-sification for studying land-cover dynamics using high-resolution IKONOS imagery(Bajracharya et al. 2010b); integration of GIS visualization with system dynamicsmodels on various socioeconomic drivers of change; and the implementation ofweb-based platforms for sharing data and applications. The second decade ofMENRIS enabled the transition from desktop-based systems to server technologieson GIS/RS applications. In addition, MENRIS was also engaged in habitat suit-ability analyses in the eastern Himalayas, above-ground biomass estimation in thecommunity forests of Nepal for Reducing Emissions from Deforestation and ForestDegradation (REDD), and in the preparation of glacier and glacial lake inventory ofthe entire HKH region (Chettri et al. 2010; Bajracharya and Shrestha 2011;Bajracharya et al. 2007). Over these two decades (1990–2010), ICIMOD, throughMENRIS, had established itself as a regional resource center for providing inno-vative solutions which integrated GIS and remote sensing. ICIMOD also became aparticipating member of the GEO and worked with regional and internationalpartners on fostering regional cooperation for improved access to and use ofgeo-based knowledge for the benefit and development of the mountain communities.Currently, ICIMOD is leading the Himalayan GEO, one of the task groups of theAsia Oceania GEO (AOGEO), with objectives to foster regional collaboration onEO applications and to link the priorities of the HKH region with global initiatives.
1.3.3 The Third Decade (2010–2020): Transformationfrom Applications to Services with SERVIR-HKH
While developing decision-support tools and researching similar work in other partsof the world, the MENRIS team came across the SERVIR-Mesoamerica websiteand noted that it had objectives which were very similar to MENRIS’s.Subsequently, SERVIR and ICIMOD officials met at a GEO meeting in Athens in2009 where the initial concept of SERVIR-Himalaya was discussed. (By this time,SERVIR had already established a new hub in East Africa in addition to its first hub—SERVIR-Mesoamerica, which was established in 2005.) Thus, by working oncommon objectives, ICIMOD became a SERVIR hub for the HKH region. Theimplementation of SERVIR in the HKH can be split into two phases.
SERVIR Phase 1 (2010–2015)
SERVIR-Himalaya formally started operations in July 2010 and was officiallylaunched during the international symposium on “Benefiting from EarthObservation: Bridging the Data Gap for Adaptation to Climate Change in the Hindu
1 Earth Observation Applications in the Hindu … 9
Kush Himalayan Region,” which was organized from October 4–6, 2010 inKathmandu. Among those who attended the launch event were NASAAdministrator Charlie Bolden, USAID Senior Deputy Assistant AdministratorMichael Yates, GEO Secretariat Director Jose Achache, as well as senior govern-ment officials from the HKH countries and scientists from the region and beyond.The international symposium and the regional inception workshop set up a soundstage for SERVIR-Himalaya among the regional partners in ICIMOD membercountries and clearly demonstrated SERVIR’s relevance in the region (Shrestha andBajracharya 2011).
The scope of SERVIR-Himalaya was defined within four major areas of itsresults framework: capacity building of ICIMOD as the regional center for EOapplications; building the capacities of national institutions in the region; promotingplatforms for data sharing; and developing customized tools and products to supportdecision-making. While SERVIR-Himalaya was the third hub to join the SERVIRnetwork, the ground realities differed greatly from those prevailing in the other twohubs in Mesoamerica and Africa. The countries of the HKH region had their ownindividual institutional setups, and the national capacities of these countries variedlargely in terms of EO technologies. It was then realized that the essence ofdeveloping successful EO applications lay in focusing on the needs of the nationalinstitutions and the end users of the system.
A preliminary needs assessment was carried out to identify the key regionalissues and the national priorities and capacities of the institutions of the HKHcountries before initiating the design and development of information products andservices (ICIMOD 2010). The assessment focused on a wide range of issues whichwere often interrelated, involving a large cross-section of institutions and peoplefrom different countries with different levels of capacity. Therefore, a qualitativeapproach was adopted with standard tools for the needs assessment—these are moreintuitive than quantitative methods. As part of this effort, in order to analyze rel-evant recent and ongoing initiatives and to identify potential users and partners,several activities were carried out: literature reviews; consultation workshops; focusgroup meetings with the management and professionals; and questionnaire surveysin Bangladesh, Bhutan, China, India, Nepal, and Pakistan. The user landscapeincluded government ministries and departments which were the mandated insti-tutions and primary stakeholders, UN organizations and donors, universities, localgovernments, and non-governmental organizations. The needs assessment rein-forced the fact that the information system and the databases in the region wereweak and needed to be developed; and that remote sensing and modeling tech-nologies were at a very early stage of development or even nonexistent. So, therewas a need for the professionals to have hands-on experience in climate modelswith the capacity to capture complex terrain features and also a need to improveunderstanding about the regional and local dimensions of vulnerability.
A demand–supply model (Fig. 1.3) was then framed, looking into the demandfor better information and supplying high-quality, user-tailored tools, and infor-mation services. A number of science applications were designed, using satellitedata and predictive models, to develop the visualization tools that had been
10 B. Bajracharya et al.

prioritized based on the needs assessment; another aspect that was considered wasthe feasibility of availing data and technologies. The assessment had focused on thethemes of cryosphere, ecosystems and biodiversity, disaster risk reduction, andtransboundary air pollution (Table 1.1). Detailed assessments and implementationplans for each science application were then prepared by identifying user require-ments, products, and methodologies. Each application was planned to be madeaccessible through web-enabled systems and also included user-friendly tools andfunctionalities.
In addition to the science applications being developed by the hub, there werethree applied sciences projects which were implemented through NASA grants by aSERVIR applied sciences team; these projects also enabled US-based researchorganizations to complement the hub’s activities. The projects were: a study led byArizona State University on glacier and alpine hazards in relation to developmentand habitation; a study led by the University of Washington on early warning,mapping, and post-disaster visualization of the water resources of low-lying deltas;and a study led by the R&D organization Battelle on the use of satellite products forair quality monitoring, analysis, and visualization.
In order to promote the involvement of national/local-level organizations in theapplications of EO and geospatial technologies, two streams of a small grant pro-gram were also implemented. One set of eight grants was provided through an opencall, while another six grants were provided through a selective call for proposals.These included applications that varied from flood forecasting, hazard mapping,and UAV for REDD, to the assessment of grazing intensity for rangeland man-agement, engaging local citizens in agricultural mapping, and the dissemination ofcommunity-based forest-fire information. These applications were carried out byagencies in Bangladesh, Nepal, Pakistan, and India. All the small grant programs
Fig. 1.3 Demand and supply model
1 Earth Observation Applications in the Hindu … 11

had components of fieldwork and engagement with communities, which wasenormously useful in catalyzing innovative ideas and bringing them to the locallevel.
Since the beginning of SERVIR-Himalaya, there has been a building up on pastefforts and approaches of MENRIS in designing and organizing training programs.For example, the aspect of focusing on youth was strengthened through youthforums and through programs like NASA DEVELOP and My Community, OurEarth (MyCOE). All of these added new dimensions to the capacity building efforts.
SERVIR Phase 2 (2015–2020)
The start of the second phase of SERVIR in 2015 saw new arrangements in thehub’s operations. First and foremost, at the beginning of the new phase, the hub wasofficially renamed as SERVIR-Hindu Kush Himalaya (SERVIR-HKH) andexpanded to include a specific component on Afghanistan. In the first phase, thecontract management of the USAID development funds for SERVIR at ICIMODwas conducted through an agreement with NASA; in the second phase, it wasthrough USAID. In this new configuration, NASA optimized its role to focus on:science coordination and technical backstopping; connecting the hub in a better waywith the scientific communities; facilitating connection with subject-matter experts;providing access to EO data and methods; and giving support on GeospatialInformation Technology (GIT). In this phase, NASA continued to support and
Table 1.1 List of science applications in SERVIR-Himalaya (Phase 1)
Theme Science application Geographiccoverage
Cryosphere andwater
MODIS-based regional snow-cover area mapping andmonitoring system
HKH region
Run-off modeling using the CREST model in Bhutanunder different climate change scenario
Bhutan
Ecosystem andbiodiversity
Multiscale biomass assessment models and theREDD+ MRV process
Nepal
Land-cover change and GHG inventories Bhutan, Nepal
Phobjika wetland habitat conservation studies Bhutan
Development of rangeland decision-support system inthe HKH region of Pakistan
Pakistan
Forest-change proneness modeling Bhutan, Nepal,Bangladesh
Disastermanagement
Forest-fire detection and reporting system Bhutan, Nepal
Wireless sensor network for community-based floodearly warning system
Bangladesh
Agriculturefood security
Satellite-based crop monitoring and productionassessment
Nepal
Air qualitymonitoring
Regional aerosol mapping using MODIS andAERONET station data
HKH region
12 B. Bajracharya et al.
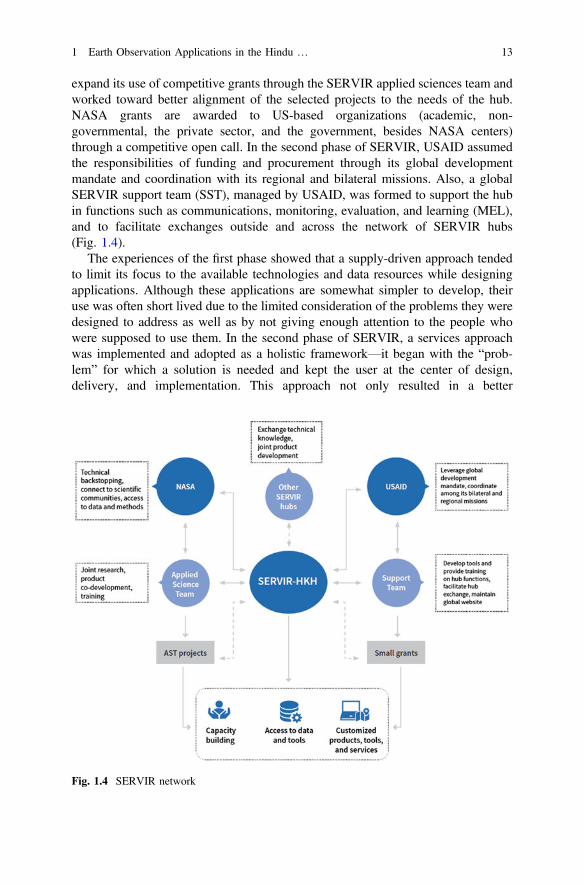
expand its use of competitive grants through the SERVIR applied sciences team andworked toward better alignment of the selected projects to the needs of the hub.NASA grants are awarded to US-based organizations (academic, non-governmental, the private sector, and the government, besides NASA centers)through a competitive open call. In the second phase of SERVIR, USAID assumedthe responsibilities of funding and procurement through its global developmentmandate and coordination with its regional and bilateral missions. Also, a globalSERVIR support team (SST), managed by USAID, was formed to support the hubin functions such as communications, monitoring, evaluation, and learning (MEL),and to facilitate exchanges outside and across the network of SERVIR hubs(Fig. 1.4).
The experiences of the first phase showed that a supply-driven approach tendedto limit its focus to the available technologies and data resources while designingapplications. Although these applications are somewhat simpler to develop, theiruse was often short lived due to the limited consideration of the problems they weredesigned to address as well as by not giving enough attention to the people whowere supposed to use them. In the second phase of SERVIR, a services approachwas implemented and adopted as a holistic framework—it began with the “prob-lem” for which a solution is needed and kept the user at the center of design,delivery, and implementation. This approach not only resulted in a better
Fig. 1.4 SERVIR network
1 Earth Observation Applications in the Hindu … 13
understanding of user needs but also enabled true co-development with the endusers, ultimately leading toward long-term impact. As part of this effort,SERVIR-HKH contributed to the SERVIR Service Planning Toolkit which hasbecome an invaluable resource to adopt the services approach in order to pave wayfor better design, delivery, and implementation of EO services for long-termimpact.
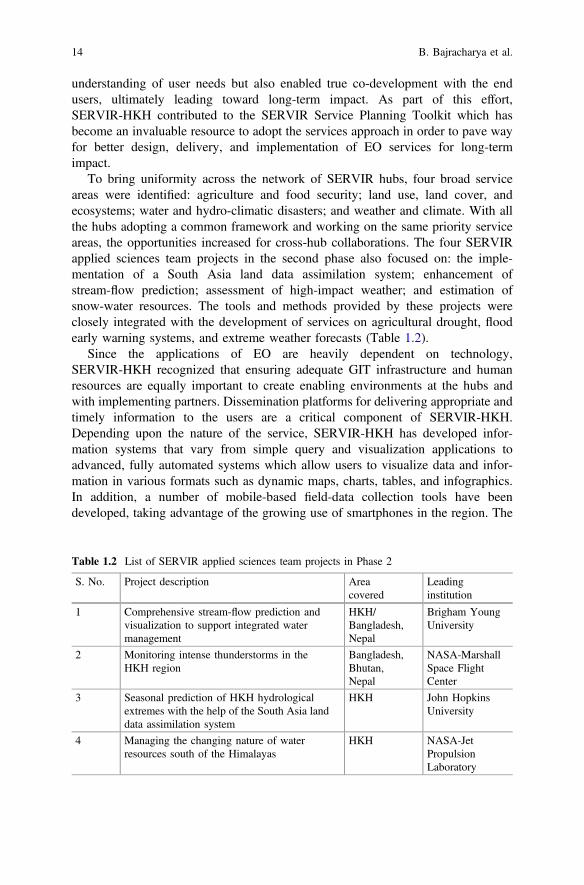
To bring uniformity across the network of SERVIR hubs, four broad serviceareas were identified: agriculture and food security; land use, land cover, andecosystems; water and hydro-climatic disasters; and weather and climate. With allthe hubs adopting a common framework and working on the same priority serviceareas, the opportunities increased for cross-hub collaborations. The four SERVIRapplied sciences team projects in the second phase also focused on: the imple-mentation of a South Asia land data assimilation system; enhancement ofstream-flow prediction; assessment of high-impact weather; and estimation ofsnow-water resources. The tools and methods provided by these projects wereclosely integrated with the development of services on agricultural drought, floodearly warning systems, and extreme weather forecasts (Table 1.2).
Since the applications of EO are heavily dependent on technology,SERVIR-HKH recognized that ensuring adequate GIT infrastructure and humanresources are equally important to create enabling environments at the hubs andwith implementing partners. Dissemination platforms for delivering appropriate andtimely information to the users are a critical component of SERVIR-HKH.Depending upon the nature of the service, SERVIR-HKH has developed infor-mation systems that vary from simple query and visualization applications toadvanced, fully automated systems which allow users to visualize data and infor-mation in various formats such as dynamic maps, charts, tables, and infographics.In addition, a number of mobile-based field-data collection tools have beendeveloped, taking advantage of the growing use of smartphones in the region. The
Table 1.2 List of SERVIR applied sciences team projects in Phase 2
S. No. Project description Areacovered
Leadinginstitution
1 Comprehensive stream-flow prediction andvisualization to support integrated watermanagement
HKH/Bangladesh,Nepal
Brigham YoungUniversity
2 Monitoring intense thunderstorms in theHKH region
Bangladesh,Bhutan,Nepal
NASA-MarshallSpace FlightCenter
3 Seasonal prediction of HKH hydrologicalextremes with the help of the South Asia landdata assimilation system
HKH John HopkinsUniversity
4 Managing the changing nature of waterresources south of the Himalayas
HKH NASA-JetPropulsionLaboratory
14 B. Bajracharya et al.
core principle of free and open access to data is central to SERVIR’s approach ingeneration of information and providing access to all of its information services.
Another major effort of SERVIR-HKH has been to fill the capacity gaps amongindividuals and institutions in the use of EO information products and systems forevidence-based decision-making. As part of this effort, SERVIR-HKH developed acapacity building strategy to address the needs at various levels and to ensuresustained institutional capacities at national and local levels. Trainings related to thescience and technologies adopted in the different services developed bySERVIR-HKH are given priority while keeping abreast with emerging technologiessuch as cloud computing, Synthetic Aperture Radar (SAR), and machine learning.Special trainings are designed to target young women and high-schoolteachers inorder to increase awareness and interest among women professional to adoptcareers in GIT, as well as to reach out to the local communities throughschoolchildren.
SERVIR’s adoption of the service approach has also put extra emphasis ongender, user engagement, and communications. SERVIR-HKH recognizes the needto consider gender impacts beyond just the use of a wide range of technologies.Thus, efforts are made to explore connections between gender and GIT, byincluding gender-related information to improve decisions involving the issues ofthe most vulnerable and marginalized groups in society. SERVIR-HKH has alsodeveloped a gender strategy and action plan to improve upon the methods ofcollecting gender-disaggregated data; the plan also seeks to customize informationservices to address gender needs; besides, it aims to promote GIT careers andwomen’s participation in capacity building. The area of service planning alsoentails a knowledge management and communication strategy for targeted com-munication, sharing, and dissemination of the knowledge generated bySERVIR-HKH; this is to foster use by the target audiences and ultimately triggerbehavioral change. Such knowledge shared and delivered to the users in appropriateformats, through relevant channels at appropriate timings, is central towardenabling any stakeholder to take informed decisions.
User engagement in the context of SERVIR-HKH is a multifaceted,multi-stakeholder, and multi-country complex phenomenon with both challengesand opportunities. SERVIR-HKH’s user-engagement strategy ensures the system-atic involvement of users at different stages either as co-creators, co-designers,co-implementers or as potential beneficiaries. Starting with the assessment of theuser landscape and stakeholder mapping, the users are then engaged in variousconsultations and training events. Formal mechanisms such as a memorandum ofunderstanding (MOU), a letter of agreement (LOA), and a letter of intent (LOI) arebrought to bear for long-term collaborations with key institutions. These instru-ments are enormously valuable for institutional continuity should key personnelleave, be transferred, or if there is a change in government in the countries whereSERVIR-HKH works.
Ultimately, all the efforts being made by SERVIR at the global level and in theregions are driven by the goal to create lasting impacts on the lives and livelihoodsof the communities through the best use of the available EO and GIT resources. We
1 Earth Observation Applications in the Hindu … 15

strive to achieve our goals by defining theories of change and by identifying impactpathways. We believe that an MEL framework will guide us through the pathwayand expedite learning and the adoption of new knowledge as we move along in ourjourney to connect “Space to Village”—the mantra of SERVIR.
The diversity of socioeconomic and political contexts, the complex user land-scape, and the various types of services that have been developed have providedenormous learning opportunities to us during the design and implementation of theservices. This book is an outcome of our learnings during the evolution ofapproaches and processes from phase one to phase two where we managed thepriorities of users and professionals and aligned with the technological advances inthe global market.
1.4 Overview of the Book
This book consists of nineteen chapters including this chapter. In this book, we referto the HKH hub at ICIMOD as SERVIR-HKH, while SERVIR represents the globalnetwork including all the hubs. Chapter 2 explains the services approach and theSERVIR Service Planning Toolkit. It describes the major components of the toolkitand provides an example of its implementation in one of our services. Chapter 3explains our efforts in understanding the gaps, needs, and priorities of nationalagencies in using EO and GIT for decision-making. Here, we present a study and itsfindings to understand the mandates of the key agencies and the status of theircapacity and resources to develop and use geospatial tools. The study methodologyincludes literature review, institutional surveys, and key informant interviews, whichresulted in findings related to different aspects of EO applications, ranging fromcurrent research and knowledge generation to human resources and the IT environ-ment, as well as data-sharing policies at national and agency levels.
Adopting agriculture and food security as a priority service area is justified by thefact that the HKH region is predominantly an agrarian society with the majority of thepopulation depending on agriculture for their livelihoods. The agricultural practices inthe region largely depend on monsoonal rain which has been experiencing increasedanomalies due to changes in climate. A wealth of climate and EO information isavailable from the past few decades which has been helpful in monitoring, modeling,and understanding the climatic variables—this can help in decision-making andagricultural planning. Chapter 4 presents our services on drought monitoring and inthe establishment of an early warning system for the same that not only supportsnational- and local-level planning, but also provides agro-advisory services for pre-paredness to mitigate the impacts of drought on agriculture. In this regard, regionaland national drought monitoring and outlook systems have been developed, whichcovers Afghanistan, Bangladesh, Nepal, and Pakistan. Chapter 5 focuses on anotherimportant area of EO applications in agriculture—the assessment of in-season croparea; this is critically important for national food security strategies. For example,SERVIR-HKH initiated a wheat-mapping activity in Afghanistan in response to a
16 B. Bajracharya et al.
high-level request from its Ministry of Agriculture, Irrigation, and Livestock (MAIL).Then, an operational system for in-season monitoring of wheat crop was developed,utilizing optical (Sentinel-2) and Synthetic Aperture Radar (SAR, Sentinel-1) data,and by integrating decision trees and a machine learning algorithm in the GoogleEarth Engine cloud platform. In this chapter, we present the methodologies, thefindings, and the institutional challenges that had to be tackled during the imple-mentation of this system.
Chapter 6 presents the Regional Land-Cover Monitoring System (RLCMS) andthe national systems which are implemented in Afghanistan, Bangladesh, Nepal,and Myanmar. The availability of free online satellite data and advances in cloudcomputing platforms such as Google Earth Engine made it possible to developRLCMS and adopt it for generating more frequent land-cover maps at regional andnational scales. The methodology was initially developed by SERVIR-Mekong andthen was adopted for the HKH region through a multi-hub, co-development pro-cess. Chapter 7 presents another service that provides scientific data and informa-tion on the vulnerability of forest ecosystems to climate change and anthropogenicdrivers; this service involves the use of ecological modeling techniques to supportthe identification and implementation of adaptation and forest-management strate-gies. One of the important drivers of forest degradation is forest fire, which hasadverse ecological and economic effects. A reliable and timely fire detection andmonitoring system is an important component of forest-fire management. Chapter 8presents the forest-fire monitoring system developed by SERVIR-HKH. Theinnovative system identifies forest fires through the hotspot data generated by theModerate Resolution Imaging Spectroradiometer (MODIS), and uses forest masksand overlays of administrative units. It sends SMS and email alerts to the corre-sponding authorities in the event of fire incidents in their area, as well as to therelevant national department. The forest-fire monitoring system has been useful inenhancing understanding about the spatial and temporal patterns of fire incidentsand in identifying the vulnerable areas. The system also includes a function toreport fire incidents from the field, thus making it a two-way process whereby datacan be captured from both space and at the community level.
The HKH region is a hotspot of predominantly natural hazards, with frequentfloods and extreme weather events playing havoc with people’s lives and liveli-hoods. The services on water and hydro-climatic disasters include enhancing theflood early warning system, rapid flood mapping using multi-temporal SAR images,and mapping and change assessment of glaciers and glacial lakes. Chapter 9 pre-sents our work on enhanced flood early warning, which is based on the novelstream-flow prediction tool that increases flood-forecast lead times in Bangladesh,Bhutan, and Nepal. This includes an operational 15-day flood forecast that inte-grates local data into a global model using methods co-developed by applied sci-ence team and local experts. Longer lead times and access to accurate andappropriate information ensure better preparedness for disaster responders, who canthen help save lives and property. While early warnings can reduce the impacts offlood on lives and properties, timely and rapid flood inundation mapping plays animportant role in rescue and relief operations, as well as in post-flood damage
1 Earth Observation Applications in the Hindu … 17
assessment. Chapter 10 presents our work on an operational methodology for rapidflood inundation mapping which helps in assessing flood situations. Since themonsoon period is always cloudy, we use Sentinel-1 SAR images during this periodto prepare maps of the inundated areas. These areas are overlaid with pre-floodland-cover maps in order to identify settlements and agricultural areas, and themaps are distributed to the different agencies working on flood response and relief.In Chap. 11, we present our work on mapping glaciers and glacial lakes inAfghanistan. In response to a request from the Ministry of Energy and Water inAfghanistan, SERVIR-HKH carried out a study of glacier and glacial lakedynamics from 1990–2015 for the entire country. Glaciers are key freshwaterresources and play a significant role in local and regional hydrology; they also carrywith them the threat of glacial hazard. The glacier and glacial lake database wereprepared by applying the semiautomatic object-based image classification methodusing Landsat imagery from the years 1990, 2000, 2010, and 2015; in this exercise,each glacier was mapped. In the 25-year period, the study not only showed asignificant decrease in the number of glaciers but also recorded how the formationand expansion of glacial lakes have been adversely affected. Under the service areaof weather and climate, a High-Impact Weather Assessment Toolkit (HIWAT) wasdeveloped to facilitate probabilistic forecasting and to assess the hazards associatedwith high-impact weather. Presented in Chap. 12, HIWAT consists of a real-time,convection-permitting ensemble numerical weather prediction system based on theWeather Research and Forecasting (WRF) model and a situational awareness toolthat gauges thunderstorm intensity through satellite measurements. The forecast isdisseminated to the stakeholders via an innovative data visualization platform. Theprecipitation registered in the forecast is also used in a routing model to predictflash floods in smaller watersheds.
Enabling environments that support the various services are very important wherethese enablers ensure that the services are efficiently deployed and also used by thetarget audience in an effective manner. Chapter 13 introduces the various informationsystems and mobile data collection tools developed by SERVIR-HKH. It providesdetails on the overall application development process and on the various types oftechnologies that are in use. Chapter 14 presents the capacity building strategyadopted by SERVIR-HKH and its implementation for strengthening the capacities ofgovernment organizations, development stakeholders, and individuals on the use ofEO and GIT applications. Overall, it covers capacity gaps and identifies needs; it alsodwells on facets such as structured planning, implementation, monitoring, evalua-tion, and successive learnings. It illustrates the four categories of training processes—standard training, training of trainers, on-the-job training, and exposure learning—that were strategically carried out by SERVIR-HKH with a focus on priority serviceareas. Chapter 15 describes our efforts in integrating the aspect of gender into serviceplanning and design, and how the participation of women was promoted throughvarious initiatives. As the prevalent inequality between women and men is bound toinfluence the development of technologies, this chapter tracks the connectionbetween gender and technology over the decades and discusses how SERVIR-HKHintegrates gender concerns into its program and activities.
18 B. Bajracharya et al.

Next, in Chap. 16, we deliberate over the importance of communications inproviding the right type of data at the right time and in translating data visualiza-tions into decisions. As we all know, communication plays a crucial role in makingscience available and accessible to the people. Since its inception, SERVIR-HKHhas adopted an integrated approach toward communication processes; it has facil-itated internal knowledge sharing and network-wide communications, as well asfostered brand recognition and trust among partners; dissemination and outreachtoo have played key roles. In place was also a communication strategy that guidedthe knowledge management and knowledge-sharing processes; various online andoffline tools too were in use to help SERVIR-HKH achieve its strategic goals.Chapter 17 presents the key learnings while strengthening engagement with theusers. This chapter highlights the impact of embedding the user-engagementapproach, more particularly emphasizing that if the users are given ownership, thereis a greater chance that products and services will be used effectively. In Chap. 18,we share our experiences on how the MEL practice enhanced result orientation,adaptive management, mutual understanding, and ownership by the stakeholders.This ultimately leads to better user-tailored EO products and services, and ensuresthe adoption and use of EO and GIT in evidence-based decision-making for thebenefit of the vulnerable communities. We explain our learnings systematicallywith evidences and examples from the region.
Finally, the Chap. 19 has its spotlight on the lessons, challenges, and opportu-nities in the use of EO and GIT applications and services via SERVIR-HKH. Overthe years, there have been significant developments in the field of EO and GITwhile the capacity of the key agencies to leverage these advancements to produce,disseminate, and use the information has been rather limited. However, there aremany opportunities in the region to fill the existing gaps in data, capacity, andservices while simultaneously there is an increasing acceptability of EO and GIT asa means to improve the decision-making process in national institutions. It isobserved that the partners’ confidence has been growing on the use ofSERVIR-HKH applications and services, and that enormous progress has beenmade on all fronts. The SERVIR network and its partnership with many institutionsthroughout the world provide excellent opportunities to usher in the latestadvancements in science and technology and create broader perspectives inaddressing the problems plaguing the HKH region.
References
Anderson K, Ryan B, Sonntag A, Kavvada A, Friedl L (2017) Earth observation in service of the2030 agenda for sustainable development. Geo-Spat Inf Sci. https://doi.org/10.1080/10095020.2017.1333230
Bajracharya SR, Shrestha B (2011) The status of glaciers in the Hindu Kush-Himalayan region.ICIMOD, Kathmandu
1 Earth Observation Applications in the Hindu … 19
Bajracharya SR, Mool PK, Shrestha BR (2007) Impact of climate change on Himalayan glaciersand glacial lakes: case studies on GLOF and associated hazards in Nepal and Bhutan.ICIMOD, Kathmandu
Bajracharya B, Pradhan S, Shrestha B, Salerno F (2010) An integrated decision support toolboxfor the management of mountain protected areas. Mt Res Dev 30(2)
Bajracharya B, Uddin K, Shrestha B, Chettri N (2010) Understanding land cover change using aharmonized classification system in the Himalayas: a case study from Sagarmatha NationalPark, Nepal. Mt Res Dev 30(2)
Baumann P, Rossi AP, Bell B, Clements O, Evans B, Hoenig H, Hogan P, Kakaletris G,Koltsida P, Mantovani S, Figuera RM, Merticariu V, Dimitar Misev D, Pham HB, StephanSiemen S, Wagemann J (2018) Fostering cross-disciplinary earth science through datacubeanalytics. In: Mathieu PP, Aubrecht C (eds) Earth observation open science and innovation,ISSI scientific report series 15. Springer Open. https://doi.org/10.1007/978-3-319-65633-5_1,https://link.springer.com/chapter/10.1007%2F978-3-319-65633-5_5
Brovelli MA, Ponti M, Schade S, Solís P (2020) Citizen science in support of digital earth. In:Guo H, Goodchild MF, Annoni A (eds) Manual of digital earth. SpringerOpen
Chettri N, Sharma E, Shakya B, Thapa R, Bajracharya B, Uddin K, Oli, KP, Choudhury D (2010)Biodiversity in the Eastern Himalayas: Status, trends and vulnerability to climate change;Climate change impact and vulnerability in the Eastern Himalayas. Technical report 2,ICIMOD. ISBN: 978-92-9115-147-9
Dwyer JL, Roy DP, Sauer B, Jenkerson CB, Zhang HK, Lymburner L (2018) Analysis ready data:enabling analysis of the landsat archive. Remote Sens 10:1363
ESA (2019) Blockchain and earth observation. White PaperESRE Whitepaper (2017) Selected trends and space technologies expected to shape the next
decade. The association of european space research establishmentsFilchev L, Pashova L, Kolev V, Frye S (2018) Challenges and solutions for utilizing earth
observations in the “Big Data” era. In: BigSkyEarth conference: AstroGeoInformatics,Tenerife, Spain, 17–19 Dec, 2018
Haklay M, Mazumdar S, Wardlaw J (2018) Citizen science for observing and understanding theearth. In: Mathieu PP, Aubrecht C (eds) Earth observation open science and innovation, ISSIscientific report series 15. https://doi.org/10.1007/978-3-319-65633-5_5
ICIMOD (1992) Applications of GIS for natural resource management in Dhading district, Nepal.ICIMOD
ICIMOD (2010) SERVIR Himalaya preliminary needs assessment. ICIMODICIMOD (2018) Strategy and results framework 2017. ICIMODLiu Z, Foresman T, van Genderen J, Wang L (2020) Understanding digital earth. In: Guo H,
Goodchild MF, Annoni A (eds) Manual of digital earth. SpringerOpenMazzucato M, Robinson D (2017) Market creation and the European space agency (European
Space Agency (ESA) Report)Moran J (2018) Earthrise: the story behind our planet’s most famous photo. The Guardian. https://
www.theguardian.com/artanddesign/2018/dec/22/behold-blue-plant-photograph-earthriseNASA (2017) Sputnik and the dawn of the space age. https://history.nasa.gov/sputnik/Nelson EJ, Pulla ST, Matin MA, Shakya K, Jones NL, Ames DP, Ellenburg WL, Markert KN,
David CH, Zaitchik BF, Gatlin P, Hales R (2019) Enabling stakeholder decision-making withearth observation and modeling data across the SERVIR hubs using Tethys platform. FrontEnviron Sci: Freshwater Sci. https://doi.org/10.3389/fenvs.2019.00148, https://doi.org/10.1016/j.envsoft.2019.05.001
O’Sullivan C, Wise N, Mathieu PP (2018) The changing landscape of geospatial informationmarkets. In: Mathieu PP, Aubrecht C (eds) Earth observation open science and innovation,ISSI scientific report series 15. Springer Open. https://doi.org/10.1007/978-3-319-65633-5_1
Paganini M, Petiteville I, Ward S, Dyke G, Steventon M, Harry J, Kerblat F (2018) Satellite earthobservations in support of the sustainable development goals, Special 2018 edition, ESA
20 B. Bajracharya et al.
Petiteville I, Ward S, Dyke G, Steventon M, Harry J (eds) (2015) Satellite earth observations insupport of disaster risk reduction, Special 2015 WCDRR edition. In: CEOS earth observationhandbook for WCDRR, ESA
Reillon V (2017) Securing the copernicus programme—why EU earth observation matters, EPRS,PE 599.407. https://www.copernicus.eu/en/documentation/copernicus-policy/copernicus-policy
Shrestha B, Bajracharya B (eds) (2011) Proceedings of the international symposium—benefitingfrom earth observation bridging the data gap for adaptation to climate change in the HinduKush-Himalayas, 4–6 Oct 2010, Kathmandu, Nepal. ICIMOD
Shrestha B, Pradhan S (2000) Kathmandu valley GIS database: bridging the data gap. ICIMODShrestha B, Bajracharya B (2002) GIS education—experiences from the Hindu Kush-Himalayan
(HKH) region. Proceedings of ACRS 2002. https://a-a-r-s.org/proceeding/ACRS2002/Papers/ED02-7.pdf
Shrestha B, Bajracharya B, Pradhan S, Rajbhandari L (2003) GIS for municipal planning: a casestudy from Kirtipur municipality. ICIMOD
Sikder MS, David CH, Allen GH, Qiao X, Nelson EJ, Matin MA (2019) Evaluation of availableglobal runoff datasets through a river model in support of transboundary water management inSouth and Southeast Asia. Front Environ Sci. https://doi.org/10.3389/fenvs.2019.00171
Souffront MA, Nelson EJ, Shakya K, Edwards C, Roberts W, Krewson C, Ames DP, Jones NL(2019) Hydrologic modeling as a service (HMaaS): A new approach to address hydroinfor-matic challenges in developing countries. Front Environ Sci: Freshwater Sci (Oct 2019).https://doi.org/10.3389/fenvs.2019.00158
Straub CL, Koontz SR, Loomis JB (2019) Economic valuation of landsat imagery, open-file report2019–1112. US Department of the Interior, USGS
Sudmanns M, Dirk Tiede D, Stefan Lang S, Helena Bergstedt H, Georg Trost G, HannahAugustin H, Andrea Baraldi A, Thomas Blaschke T (2019) Big earth data: disruptive changesin earth observation data management and analysis? Int J Dig Earth. https://doi.org/10.1080/17538947.2019.1585976
Thapa RB, Murayama Y (2012) Scenario based urban growth allocation in Kathmandu valley,Nepal. Landscape Urban Plann 105:140–148
Thyrso V, Costa CA, Brandão AM, Bueno FT, Leonardi R (2019) Towards the ThousandthCubeSat: a statistical overview. Int J Aerosp Eng 2019(5063145). Hindawi. https://doi.org/10.1155/2019/5063145
Trapp H (1995) Application of GIS for planning agricultural development in Gorkha district.ICIMOD
Trapp H, Mool PK (1996) Lamjung district information system for local planning and assessmentof natural resources using GIS and RS technology. MENRIS case study no. 4. ICIMOD
UN (2015) Transforming our world: the 2030 agenda for Sustainable development, A/RES/70/1.https://sustainabledevelopment.un.org/
UNEP (1998) Land cover assessment and monitoring pakistan, environment assessment. Technicalreports, Vol 10-A. ICIMOD and UNEP
USGS (2020) Landsat project statistics. https://www.usgs.gov/land-resources/nli/landsat/landsat-project-statistics
Vaidya S, Ambad P, Bhosle S (2018) Industry 4.0—a glimpse. In: 2nd International conference onmaterials manufacturing and design engineering. Science Direct, Elsevier
Wester P, Mishra A, Mukherji A, Shrestha AB (eds) (2019) The Hindu Kush Himalayaassessment—mountains, climate change, sustainability and people. Springer NatureSwitzerland AG, Cham
Zhou G, Kafatos M (2002) Future intelligent earth observing satellites. In: Pecora 15/land satelliteinformation IV/ISPRS commission I/FIEOS 2002 conference proceedings
Zhu Z, Wulder MA, Roy DP, Woodcock CE, Hansen MC, Radeloff VC, Healey SP, Schaah C,Hostert P, Strobl P, Pekel JF, Lymburner L, Pahlevan N, Scambos TA (2019) Benefits of thefree and open landsat data policy. Remote Sens Environ 224(April 2019):382–385
1 Earth Observation Applications in the Hindu … 21

Open Access This chapter is licensed under the terms of the Creative Commons Attribution 4.0International License (http://creativecommons.org/licenses/by/4.0/), which permits use, sharing,adaptation, distribution, and reproduction in any medium or format, as long as you give appro-priate credit to the original author(s) and the source, provide a link to the Creative Commonslicense, and indicate if changes were made.The images or other third party material in this chapter are included in the chapter’s Creative
Commons license, unless indicated otherwise in a credit line to the material. If material is notincluded in the chapter’s Creative Commons license and your intended use is not permitted bystatutory regulation or exceeds the permitted use, you will need to obtain permission directly fromthe copyright holder.
22 B. Bajracharya et al.

Chapter 2Service Planning Approachand Its Application
Rajesh Bahadur Thapa , Birendra Bajracharya, Mir A. Matin,Eric Anderson, and Pete Epanchin
2.1 Introduction
In the first phase, SERVIR-HKH placed high importance on developing applicationproducts and tools to demonstrate the usefulness of Earth observation (EO) andgeospatial information in supporting decision-making on various thematic areasincluding land cover mapping, forest fire monitoring, agriculture and food security,disasters, and air quality monitoring (Chap. 1). Although the application productsand tools were prioritized based on the country needs assessments, they werelargely driven by the available data, technology, and research interest of scientists(Bajracharya 2015). The products and tools were often developed with limited userinteractions. The products were delivered to the users mostly in the form of onlineapplications with interactive map visualization and often with data downloadcapabilities. This method of product development assumed a full understanding ofuser needs, and that the developed products would be used by the targeted users. Inreality, many of the application products ended up unused or less used by thetargeted users. In some cases, there was a lack of clarity on the integration of theproducts and tools for decision-making within and beyond the user’s organizations.Although the development of applications and tools addressed the perceived issuesin the region, the limited engagement of partners in the development and validationprocess failed to produce user-friendly information per user expectations.Consequently, this limited the use of the applications and tools.
R. B. Thapa (&) � B. Bajracharya � M. A. MatinInternational Centre for Integrated Mountain Development (ICIMOD), Kathmandu, Nepale-mail: [email protected]
E. AndersonNASA SERVIR Science Coordination Office, Huntsville, AL, USA
P. EpanchinUSAID, Washington, D.C., USA
© The Author(s) 2021B. Bajracharya et al. (eds.), Earth Observation Science and Applications for RiskReduction and Enhanced Resilience in Hindu Kush Himalaya Region,https://doi.org/10.1007/978-3-030-73569-2_2
23
The institutional and operational aspects beyond science and technology werenot sufficiently considered for the long-term sustainability of the applicationproducts. For products and tools to be used and operationalized, user engagementefforts need to be increased such that partner organizations, including governmentagencies, co-develop these products and tools, and have increased ownership ofthem (Bajracharya 2015, Chap. 17). Based on these lessons through the years, werealized that the mere connection between user consultations and the applicationproducts that have been developed are not adequate for achieving the intendedsustainable impacts. Co-development among a SERVIR hub and stakeholderorganizations requires a clear understanding of the information-drivendecision-making challenges, the usefulness of the products, and formal partner-ships. Therefore, there is a need for a pathway to encourage stakeholder commu-nities and potential users to be active collaborators during the iterative stages ofproblem definition, product development, and delivery stages.
In this context, SERVIR developed a service planning approach in 2017 as astructured pathway to deal with these challenges and to shift the focus fromdeveloping application products to building services in collaboration with itspartners to support their mandated responsibilities. SERVIR defines a “service”holistically as either data, information, tools, products, platforms, and training, or asuite of all these items offered to a stakeholder. Service planning, therefore, is asystematic process of designing and integrating user needs and preferences into theservice delivery approach, to ensure that the process is responsive and effective. Theservice planning approach integrates stakeholders, partners, and the broader usercommunities into service planning discussions, starting with the identification oflocal challenges, then going through the design, tailoring, and delivery of servicesthat use EO and geospatial information to address these challenges. In addition,identifying existing mechanisms where services can be integrated for sustainabilityis another important aspect of service planning. The service planning approach wasadopted by all SERVIR hubs which continue to learn from practical applications. Inthis chapter, we highlight the modalities of the service planning approach and itsimplementation at SERVIR-HKH hub.
2.2 Service Planning Approach
The service planning approach provides a well-defined process for end-to-endimplementation of service by actively engaging stakeholders, partners, and endusers, starting from service conceptualization to adoption. The systematicengagement of users in service planning ensures the usability of the service,improves the service quality, and creates a pathway to the sustainability of theservice. It aims to articulate the intended impact upfront through the development ofa theory of change (ToC). Great attention is paid to maximizing the impact of theservice through effective co-development and sustained delivery with the partners.The approach aims to include diverse voices and perspectives and engages
24 R. B. Thapa et al.
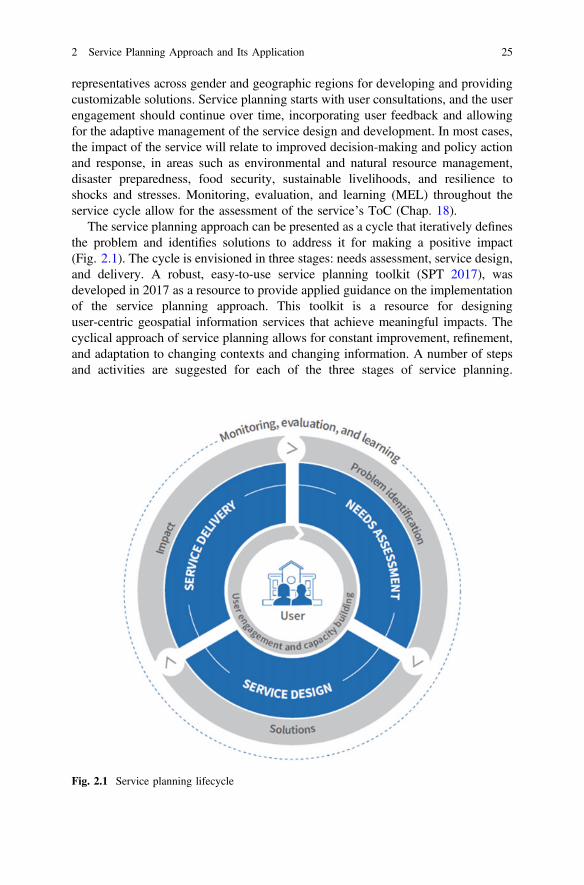
representatives across gender and geographic regions for developing and providingcustomizable solutions. Service planning starts with user consultations, and the userengagement should continue over time, incorporating user feedback and allowingfor the adaptive management of the service design and development. In most cases,the impact of the service will relate to improved decision-making and policy actionand response, in areas such as environmental and natural resource management,disaster preparedness, food security, sustainable livelihoods, and resilience toshocks and stresses. Monitoring, evaluation, and learning (MEL) throughout theservice cycle allow for the assessment of the service’s ToC (Chap. 18).
The service planning approach can be presented as a cycle that iteratively definesthe problem and identifies solutions to address it for making a positive impact(Fig. 2.1). The cycle is envisioned in three stages: needs assessment, service design,and delivery. A robust, easy-to-use service planning toolkit (SPT 2017), wasdeveloped in 2017 as a resource to provide applied guidance on the implementationof the service planning approach. This toolkit is a resource for designinguser-centric geospatial information services that achieve meaningful impacts. Thecyclical approach of service planning allows for constant improvement, refinement,and adaptation to changing contexts and changing information. A number of stepsand activities are suggested for each of the three stages of service planning.
Fig. 2.1 Service planning lifecycle
2 Service Planning Approach and Its Application 25

The toolkit includes guidance for consultation and needs assessment for effectiveproblem identification, with recommendations for workshop agendas and activities;stakeholder mapping; service design; and monitoring, evaluation, and learning, withtemplates for developing a ToC.
Here, we present the implementation of the service planning approach withexamples from one of our services on the regional land cover monitoring system(RLCMS). The land cover monitoring system is being developed at the HKHregional and national levels (NLCMS) in Afghanistan, Bangladesh, Myanmar, andNepal to address the need for consistent and efficient mapping which can bereplicated on an annual basis. Details of the overall service on RLCMS are pre-sented in Chap. 6.
2.3 Steps in Service Planning
Service planning is broadly designed in three stages (Fig. 2.2): problem identifi-cation which focuses on a clear understanding of needs; providing solutionsthrough service design; and achieving impact through service delivery which isensured by proper implementation and adoption by the intended users. Userengagement and capacity building are considered as key activities throughout theservice planning cycle. Moreover, the learnings from monitoring and evaluation areapplied iteratively to improve service planning across all of its stages.
Fig. 2.2 Steps followed in service planning
26 R. B. Thapa et al.

2.3.1 Stage 1: Needs Assessment
Scoping and Consultation
The needs assessment begins with a scoping and consultation process by engagingstakeholders to identify the user needs in a selected thematic area. Taking stock ofrelated activities is important; the review of previous tools and applications ofSERVIR as well as those being developed by other organizations in a given the-matic area helps to understand the problems in broad terms. It is important toaccurately capture the existing problems and challenges, to prioritize among mul-tiple problems, and to understand the context of the problems and the underlyingassumptions. An effective approach is to organize consultation workshops to bringpeople together to engage in dialog to identify the needs, priorities, and challenges.A structured format is followed for the workshops which is designed to be relevantfor regional, national, and local consultations, even with a few stakeholders. Somecontext-specific customization is also done in the design of the workshop as needed.
The capacities among different organizations and users relevant to the service arealso discussed during the workshop. This is followed by the organizational capacityassessments of selected organizations which would be partners in theco-development of the service. Capacity assessment includes meetings with keyinfluencers, focus group discussions, semi-structured interviews, and technicalassessment questionnaire surveys. The outputs from this step include a situationalanalysis of the problems in the particular thematic area and of the key priorities andcapacities of the stakeholders. Consultation and needs assessment are perceived ascontinuous processes, required to be conducted or revised even during servicedesign and delivery, in order to refine, adapt, and accommodate the findings duringthe implementation process.
During the implementation of RLCMS, a regional consultation workshop wasorganized in Bangkok where the national representatives from Afghanistan, Nepal,Bangladesh, and Myanmar participated, along with co-development partners fromSERVIR-Mekong, FAO, SilvaCarbon, and the US Forest Service (USFS). The goalof the workshop was to learn from the national contexts as well as to understandcommon issues from the service development perspective. The deliberations ontechnical approaches and methodologies were useful in bringing all the participantsto a common understanding of the needs and proposed solutions. Each country haddifferent land cover mapping initiatives undertaken in the past with varyingapproaches and definitions of classes. Looking at the broader needs andcountry-specific priorities, it was evident that a common methodology wouldaddress the needs. However, specific considerations were required to define andderive certain land cover classes in each country. Similarly, national workshopswere organized for each country, including for the wider user groups from thesecountries, so as to identify national needs and priorities, and the requirements fordesigning tailored solutions for countries within a regional system. An example ofthe different steps in the service planning of RLCMS is presented in Fig. 2.3.
2 Service Planning Approach and Its Application 27
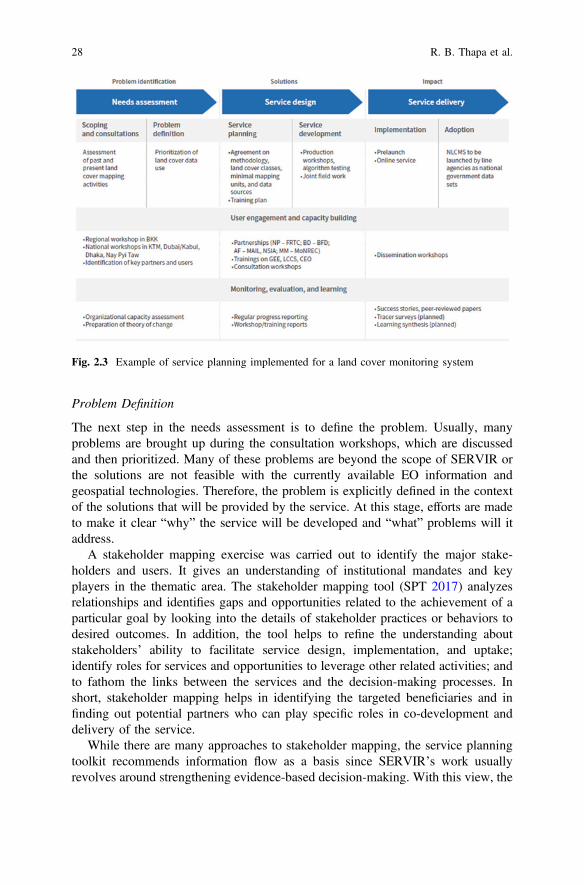
Problem Definition
The next step in the needs assessment is to define the problem. Usually, manyproblems are brought up during the consultation workshops, which are discussedand then prioritized. Many of these problems are beyond the scope of SERVIR orthe solutions are not feasible with the currently available EO information andgeospatial technologies. Therefore, the problem is explicitly defined in the contextof the solutions that will be provided by the service. At this stage, efforts are madeto make it clear “why” the service will be developed and “what” problems will itaddress.
A stakeholder mapping exercise was carried out to identify the major stake-holders and users. It gives an understanding of institutional mandates and keyplayers in the thematic area. The stakeholder mapping tool (SPT 2017) analyzesrelationships and identifies gaps and opportunities related to the achievement of aparticular goal by looking into the details of stakeholder practices or behaviors todesired outcomes. In addition, the tool helps to refine the understanding aboutstakeholders’ ability to facilitate service design, implementation, and uptake;identify roles for services and opportunities to leverage other related activities; andto fathom the links between the services and the decision-making processes. Inshort, stakeholder mapping helps in identifying the targeted beneficiaries and infinding out potential partners who can play specific roles in co-development anddelivery of the service.
While there are many approaches to stakeholder mapping, the service planningtoolkit recommends information flow as a basis since SERVIR’s work usuallyrevolves around strengthening evidence-based decision-making. With this view, the
Fig. 2.3 Example of service planning implemented for a land cover monitoring system
28 R. B. Thapa et al.

main stakeholder types are considered as: (i) data collector—persons or institutionsresponsible for collecting primary or secondary data; (ii) data analyzers—entitiesinvolved in the analysis of data for the preparation of products and tools; (iii) in-termediaries—responsible for the communication or dissemination of informationbetween the data analyzers, decision makers, and beneficiaries; (iv) enablers—thosenot directly involved in the information system, but who influence the policyenvironment; (v) decision makers/end users—those with the authority to makedecisions based on the data, products, and tools produced by the informationsystem; and (vi), beneficiaries—those who benefit from the decisions informed bythe system. A single stakeholder can fall into multiple categories. An example of astakeholder map in the context of the National Land Cover Monitoring System forNepal is illustrated in Fig. 2.4.
In this case, FRTC is the organization mandated to conduct land cover mappingin Nepal. It was the logical partner for SERVIR to engage to co-develop the service.Other sectoral departments or subnational offices such as the Department of Forestsand Soil Conservation (DoFSC) were involved as data analyzer/producer since it isdirectly responsible for the forest sector data. Other agencies like the Department ofNational Parks and Wildlife Conservation (DNPWC), the Ministry of Agricultureand Livestock Development (MoALD), and the Central Bureau of Statistics(CBS) play the role of intermediaries which lend support in the communication,dissemination, and use of the information services. The end users include
Fig. 2.4 Example of stakeholder map and information flow for the National Land CoverMonitoring, Nepal. Forest Research and Training Center (FRTC), Department of Forests and SoilConservation (DoFSC), Department of National Parks and Wildlife Conservation (DNPWC),Ministry of Agriculture and Livestock Development (MoALD), and Central Bureau of Statistics(CBS)
2 Service Planning Approach and Its Application 29

conservation managers, development planners, and agricultural and environmentalagencies which use the information in their decision-making process. Donoragencies and professional/research organizations are considered as enablers as theyinfluence the policies for use or the reach of the service. The beneficiaries are thosewho benefit from the more accurate and timely information and managementdecisions made by the implementing partners, which include farmers, local com-munities, and the private sector.
Another component of problem identification is developing a ToC which definesthe pathways to achieve the intended impacts from the service. The ToC is acomprehensive description and illustration of how and why the desired change isexpected to happen in a particular context (https://www.theoryofchange.org/). Itstarts with the desired impacts and works backwards to identify the conditions oroutcomes that must be in place to achieve those impacts. Clear outcome and impactstatements are formulated to guide the planning, monitoring, and evaluation pro-cess, and to track the changes brought about by the use of the service to measure itsimpact. The ToC is considered as an ongoing process of reflection to explorechange and how it happens while implementing the service (Vogel 2012). A brieftemplate of ToC for RLCMS is provided in Table 2.1.
Table 2.1 Theory of change for the regional land cover monitoring system
Impacts Sustainable land management, reduced loss of biodiversity, andenhancement of forest cover
Outcomes Enhanced capacity of partners/stakeholders in monitoring changes in landcover for effective management
Outputs • Annual land cover maps for the HKH region using a unified methodology,classification schema, and data sets
• Annual national land cover maps based on nationally acceptedclassification schema
• Web-based data visualization and analysis system for dissemination ofland cover data and change information
• Trained professionals in land cover mapping and monitoring
Inputs • Consultations and stakeholder engagement for co-development of theclassification schema and methodology
• Land cover mapping and change analysis methodology (using GoogleEarth Engine and Landsat data)
• Training of partners• Dissemination (workshops) on the complete system
Assumptions • Stakeholders will use the annual land cover information indecision-making
• The land cover classification system will overcome the technicalchallenges in mountainous and shadow-dominated areas
• Sufficient cloud-free Landsat images will be available for the region• Google Earth Engine will be available as an open system for imageanalysis
Sustainabilitystrategy
The capacity of the partner will be enhanced, and the whole methodologyand system will be customized and automated for easy adoption by partners
30 R. B. Thapa et al.
At the end of the needs assessment stage, it is expected that we have a clearsense of the problems to address; an understanding of the information environmentaround the service and of the roles of the implementing partners, users, and ben-eficiaries; required inputs, including data and human resources; knowing about thecapacity gaps of the different stakeholders; comprehending the relationshipsbetween the stakeholders and understanding their roles, and how they can con-tribute to the development and use of the service; and a well-defined ToC for theservice.
2.3.2 Stage 2: Service Design
The design step sets up an environment of collaboration with the implementingpartners on service design; development of data sets, products, and tools; on nec-essary capacity building activities; and on the dissemination strategy to supportuptake.
Service design is the critical phase in which the hub and implementing partnerscome together to formulate a functional service. During this phase, they come to aconsensus on the service requirements and the anticipated impact on a definedproblem. The key driver of service design is a commitment by all parties to plan,implement, and sustain an effective response to the problem at hand. Partnershipsare established with key organizations that have committed to the co-design anddevelopment of the service through formal instruments such as a memorandum ofunderstanding (MoU) or a letter of intent (LoI), or via data-sharing agreements,depending upon the nature of the organizational setup. Sometimes, this process islengthy due to the procedural requirements of government bureaucracies. However,work usually can advance under mutual, informal understandings between theagencies while formal relationships are being pursued. A partnership landscape inthe context of RLCMS is given in Fig. 2.5.
Service Planning
Following the consultations and needs assessment and stakeholder mapping, ser-vice planning begins with consensus on a service concept and evolves into detailedplanning to make the concept a reality. The service concept enhances concurrencein technical approaches and capacity building approaches; cultivates relationships,consolidating long-term user buy-in and ownership; and documents key aspects ofdeveloping and implementing the service. It helps to articulate the service vision,leading to impacts, and reflects an understanding of baseline technical capacity,data availability, gaps, and trainings and capacity needs. Besides, it is helpful tospecify the technical details and other activities related to the various components ofservice design and delivery, including about products, data management, andcapacity building. The service concept is supported by three additional documents:product definition document (PDD); data management definition document(DMDD); and training definition document (TDD). The PDD provides a
2 Service Planning Approach and Its Application 31
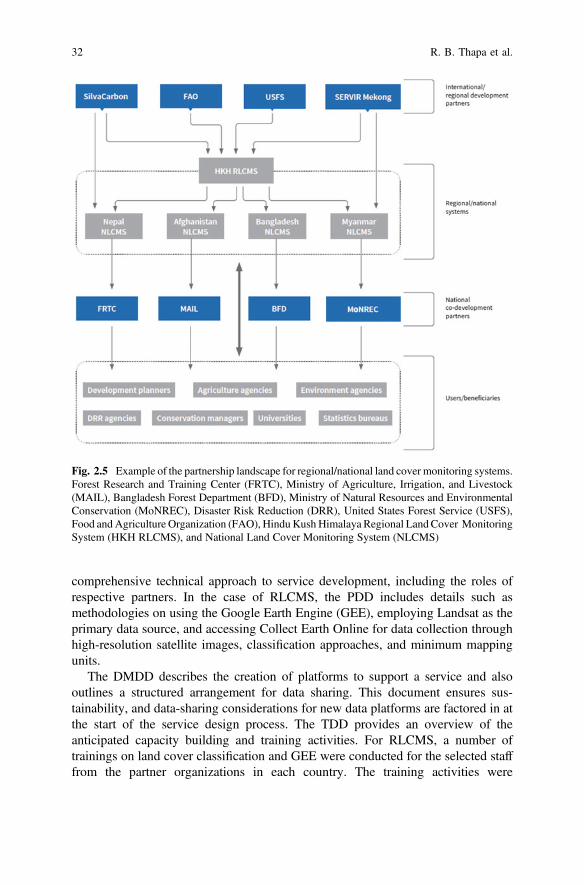
comprehensive technical approach to service development, including the roles ofrespective partners. In the case of RLCMS, the PDD includes details such asmethodologies on using the Google Earth Engine (GEE), employing Landsat as theprimary data source, and accessing Collect Earth Online for data collection throughhigh-resolution satellite images, classification approaches, and minimum mappingunits.
The DMDD describes the creation of platforms to support a service and alsooutlines a structured arrangement for data sharing. This document ensures sus-tainability, and data-sharing considerations for new data platforms are factored in atthe start of the service design process. The TDD provides an overview of theanticipated capacity building and training activities. For RLCMS, a number oftrainings on land cover classification and GEE were conducted for the selected stafffrom the partner organizations in each country. The training activities were
Fig. 2.5 Example of the partnership landscape for regional/national land cover monitoring systems.Forest Research and Training Center (FRTC), Ministry of Agriculture, Irrigation, and Livestock(MAIL), Bangladesh Forest Department (BFD), Ministry of Natural Resources and EnvironmentalConservation (MoNREC), Disaster Risk Reduction (DRR), United States Forest Service (USFS),Food andAgriculture Organization (FAO), HinduKushHimalaya Regional LandCover MonitoringSystem (HKH RLCMS), and National Land Cover Monitoring System (NLCMS)
32 R. B. Thapa et al.

designed as structured courses, production workshops, and on-the-job training.Collaboration with SilvaCarbon, USFS, FAO, and the SERVIR-Mekong hub wereclearly defined for specific inputs during the training exercises.
Service Development
The next step after service design is the development of system components asdefined in the PDD. Technical teams, consisting of relevant professionals from thehub, the NASA Science Coordination Office, the Applied Science Team and partnerorganizations, work together in the development of the different products con-tributing to the service.
User engagement during this phase includes regular meetings and consultationworkshops organized jointly with the co-development partners. These consultationscan be seen as follow-up activities to the needs assessment step; here, the primaryfocus is to provide updates on the development process and to receive feedbackfrom the stakeholders. These consultations are useful in confirming the alignment ofservice development with the identified needs and priorities, which may havedeviated to some extent from the previous findings. Any modifications that arerequired due to technical or institutional challenges are also identified through theseuser consultations. The frequent and regular engagement among service developers,users, and beneficiaries sets up the service implementers to achieve the intendedoutcomes.
Following the plans specified in the TDD, the major activity during this phase isorganizing trainings to the targeted staff on the various software tools that are usedin product development. Structured class room style training, on-the-job training,and production workshops are the modalities usually adopted for capacity building.During this phase, the RLCMS saw a series of trainings at the hub, and forco-development partners on GEE, there were also joint workshops for finalizing theland cover primitives and classes, as well as joint fieldwork. The strong sense ofownership demonstrated by the co-development partners, which are also nationallymandated organizations, ensured the utility and sustainability of the service in thelong run.
2.3.3 Stage 3: Service Delivery
Service Implementation
At this stage, all the products planned under the service are finalized. The feedbackand endorsement from the relevant line agencies are received through disseminationworkshops. The accuracy of the data and information products are ensured usingstandard accuracy assessment methods. The online platform is developed to servethe data to the users with features for interactive visualization.
The beta version of land cover data for Nepal was released at a prelaunchworkshop jointly organized by FRTC and SERVIR-HKH to which the relevant
2 Service Planning Approach and Its Application 33

stakeholders were invited. An online application, as well as a mobile app, wasdeveloped to receive users’ feedback on areas where the land cover was wronglyclassified. After incorporating the users’ feedback as well as after additional fieldverification from FRTC, the data were finalized. Further workshops are planned forendorsement from the sectorial agencies. The data will be finally released as thenational land cover data set produced by the Government of Nepal.
Adoption
Dissemination workshops and orientation/training on the use of services areorganized for broader awareness and adoption of the data and information gener-ated through the service. With proper completion of all the stages of servicedevelopment and implementation, it is expected that the data and informationproducts will be used by the intended stakeholders and users in theirdecision-making process, thereby bringing positive impacts on policies and oncommunities. The evidence of the adoption and use will be captured through newsarticles, published papers, and the narration of success stories.
Performance Monitoring, Evaluation, and Learning
The MEL practice (Chap. 18) is considered as an essential component of the serviceplanning approach, and it spans through the full cycle. MEL also evolves to expandthe use of impact-driven planning and monitoring tools.
During the needs assessment of stage 1, MEL focuses on organizational capacityassessments and developing a ToC for the service. The ToC captures the “how” and“why” of the desired change in a particular context and brings clarity to the logicunderpinning MEL. The MEL tools ensure the identification of changing per-spectives, inputs, activities, outputs, outcomes, and impacts; promote effectiveimplementation and sustainability of the services; identify measurements for pro-gress; and highlight the logic of a service concept.
The MEL tools capture periodic progress through a number of predefinedindicators. The metrics used for the indicators help in identifying whether theactivities are going in the right direction in achieving the results as planned duringthe design and development of the service. During the service delivery stage, MELhelps in systematically capturing success stories. Capturing success stories areencouraged at this stage to demonstrate the utility of the services and attract moreusers who can benefit from them. MEL tools, like tracer survey and the repetition oforganizational capacity assessment, help us in identifying the changes, and we havebeen able to bring as well as show us the areas of improvement for effectiveadoption of the service.
34 R. B. Thapa et al.
2.4 Experiences from Adopting the Service PlanningApproach
As discussed in Chap. 1, the first phase of SERVIR-HKH started with the tech-nological possibilities from EO applications and matching them with the users’demands in designing and developing products. The service approach has brought aparadigm shift in developing products or solutions by putting the “problems” firstand working backwards from the desired impacts and outcomes toward the inter-mediate outputs and inputs that are required. SERVIR’s capacity building goals arebetter achieved through a service approach that is composed of needs assessments,tools, products, and training; these are required to solve the identified problems.The service planning toolkit provides a guide to consider the full cycle of serviceplanning. However, the tools need to be applied by taking into consideration theexperience and context that are unique to each service. SERVIR works on the fourservice areas of agriculture and food security; land use, land cover, and ecosystems;water and hydro–climatic disasters; and weather and climate land cover andecosystems, water and related disasters, and weather and climate (Chap. 1). Thedevelopment outcomes, stakeholders, and challenges that span these four serviceareas are rather diverse, and therefore, the technical complexities also vary in thedesign of services. On the other hand, some problems in these service areas areinterrelated. For example, an extreme weather event causes floods and landslides,which can destroy farms and bring changes in land cover types. Therefore, itbecomes important to keep in mind the cross-connections among the services,products, and stakeholders. To address this, we came up with a matrix of productsand services (Table 2.2) to identify the overlaps.
As with the services, the users also overlap and interact for different services. Forexample, the hydro-met agencies, with whom we co-develop services related tostreamflow, weather, and climate, are often mandated to provide information tostakeholders in other service areas related to agriculture, water resources manage-ment, and disaster risk reduction. The capacities of the users and their access to theinformation systems also vary within a country and in the region. Therefore, userengagement and capacity building plans need customization according to thecontext. Another experience that we gathered from the service design and userengagement process is that there are substantial differences in the attitude of theinstitutions in the region. For instance, some are more open to experimenting withand adopting new technologies and information sharing, while others are veryreticent to change (probably because they may face significant institutional risks indeviating from the current information and technology workflows; or the resourcesmay be limited to participate in co-development). This demands a differentiatedapproach in engaging with partners and users.
From our experience, we have learnt that the service planning process usuallytakes more than three years, from the stage of needs assessment to the phase ofservice delivery. During this period, there are sometimes significant changes in theexternal landscapes, such as the start of larger projects at the national level dealing
2 Service Planning Approach and Its Application 35
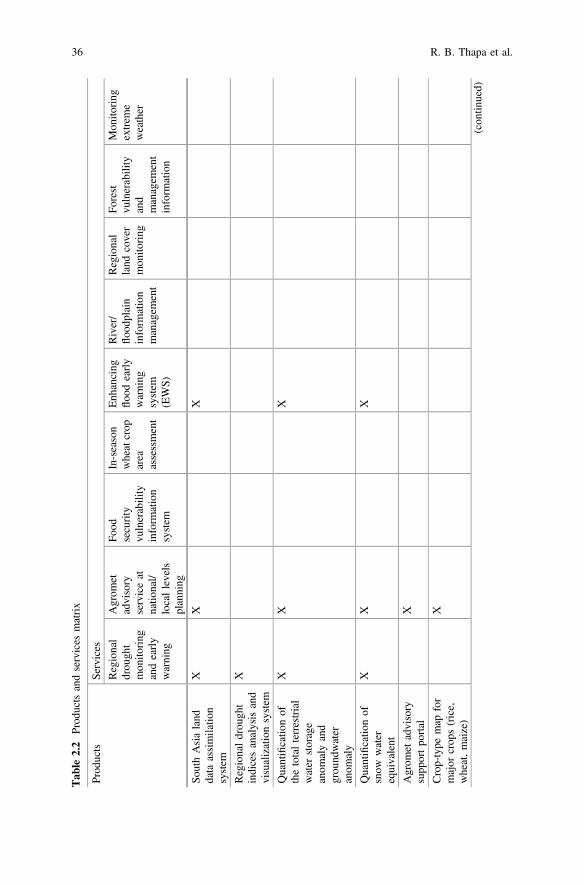
Tab
le2.2
Prod
uctsandservices
matrix
Prod
ucts
Services
Regional
drou
ght
mon
itoring
andearly
warning
Agrom
etadvisory
serviceat
natio
nal/
locallevels
planning
Food
security
vulnerability
inform
ation
system
In-season
wheatcrop
area
assessment
Enh
ancing
floo
dearly
warning
system
(EWS)
River/
floo
dplain
inform
ation
managem
ent
Regional
land
cover
mon
itoring
Forest
vulnerability
and
managem
ent
inform
ation
Mon
itoring
extrem
eweather
SouthAsialand
data
assimilatio
nsystem
XX
X
Regionaldrou
ght
indicesanalysisand
visualizationsystem
X
Quantificatio
nof
thetotalterrestrial
water
storage
anom
alyand
grou
ndwater
anom
aly
XX
X
Quantificatio
nof
snow
water
equivalent
XX
X
Agrom
etadvisory
supp
ortpo
rtal
X
Crop-type
map
for
major
crop
s(rice,
wheat,maize)
X
(con
tinued)
36 R. B. Thapa et al.

Tab
le2.2
(con
tinued)
Prod
ucts
Services
Regional
drou
ght
mon
itoring
andearly
warning
Agrom
etadvisory
serviceat
natio
nal/
locallevels
planning
Food
security
vulnerability
inform
ation
system
In-season
wheatcrop
area
assessment
Enh
ancing
floo
dearly
warning
system
(EWS)
River/
floo
dplain
inform
ation
managem
ent
Regional
land
cover
mon
itoring
Forest
vulnerability
and
managem
ent
inform
ation
Mon
itoring
extrem
eweather
Food
security
inform
ationsystem
X
Wheat
area
assessmentand
mapping
system
X
Mob
ileapplication
forfielddata
collection
XX
Regional
hydrolog
ical
mod
elfordischarge
mon
itoring
and
forecast
X
National/
region
al-level
view
erfor
visualizationof
ECMWF/GLOFA
S
X
Floo
dplain
inform
ationpo
rtal
X
(con
tinued)
2 Service Planning Approach and Its Application 37
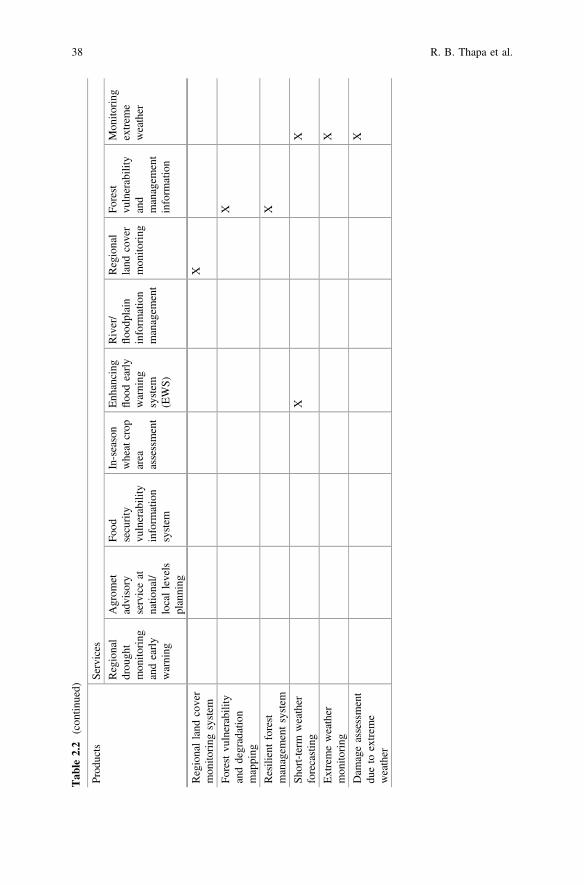
Tab
le2.2
(con
tinued)
Prod
ucts
Services
Regional
drou
ght
mon
itoring
andearly
warning
Agrom
etadvisory
serviceat
natio
nal/
locallevels
planning
Food
security
vulnerability
inform
ation
system
In-season
wheatcrop
area
assessment
Enh
ancing
floo
dearly
warning
system
(EWS)
River/
floo
dplain
inform
ation
managem
ent
Regional
land
cover
mon
itoring
Forest
vulnerability
and
managem
ent
inform
ation
Mon
itoring
extrem
eweather
Regionalland
cover
mon
itoring
system
X
Forestvu
lnerability
anddegradation
mapping
X
Resilientforest
managem
entsystem
X
Short-term
weather
forecasting
XX
Extremeweather
mon
itoring
X
Dam
ageassessment
dueto
extrem
eweather
X
38 R. B. Thapa et al.
with the same issues on which SERVIR has been working, or changes in theorganizational structure of the government which directly affect the individuals andorganizations partnering in co-development. The service design process must adaptto these external dynamics as we move into service delivery. Similarly, newtechnological platforms may emerge during the implementation phase, which canhave a significant impact on product design. These changing landscapes, whethertriggered by internal changes in government, by external influences from devel-opment and donor agencies, or by scientific and technological progress, furtherunderscore the importance of iterating with users in reassessing and refining theneeds, ToC, and intended outcomes of the services which are to be co-developed.
Although dissemination workshops were planned for RLCMS, it was not pos-sible to organize the workshops physically during the final stages of servicedevelopment due to safety issues and travel restrictions that were enacted to protectthe citizenry from the COVID-19 pandemic. As an adaptation measure,SERVIR-HKH took to the virtual meeting platform to engage with the partners andstakeholders in order to disseminate the service; this has helped us achieve theexpected outputs/outcomes as in the case of conventional meetings.
2.5 Conclusion
The keys to the service planning approach are to engage with the stakeholders injointly focusing on problem identification, solutions, and impacts. While focusingon these keys, the approach encapsulates stakeholder consultation and needsassessment, stakeholder mapping, service design, monitoring and evaluation, andservice delivery. User engagement, gender considerations, capacity building, andeffective communication approaches are also fundamental aspects to improvingservice delivery and the sustainability of the services. To guide the successfulimplementation of the service planning approach, SERVIR was able to develop aservice planning toolkit with four sets of tools. Each tool provides an opportunity tothe hubs and the implementing partners to consider: (1) disproportionate effects of adevelopment problem on audiences, (2) whether their needs are adequatelyaddressed, and (3) whether the design and delivery of services can be strengthenedto help reduce their vulnerability. The service concept and theory of change doc-uments have advanced our ability to account for and integrate the needs of ourstakeholders through the co-development of services. In this chapter, we havebriefly described how implementing the service planning approach relies on theexpertise and careful interpretation of the challenges faced by the implementingpartners. Before the implementation of the service planning approach, the devel-opment of products lacked a shared vision to create sustainable information servicesin partnership with national or regional stakeholders. In addition to making the hubservices more effective, the service planning approach adopted by the global net-work of SERVIR hubs, USAID, and NASA has enabled knowledge sharing amongscience and development practitioners in the Americas, Africa, and Asia. Enhanced
2 Service Planning Approach and Its Application 39

by knowledge exchanges, the systematic documentation, consistency, and sharedexpectations of the service planning approach have enabled SERVIR hubs to findsolutions in terms of data products, tools, platforms, methods, user engagement,capacity building, and outreach strategies from one region to another.
References
Bajracharya (2015) A hub’s perspective on five years of collaboration. SERVIR Himalaya report.ICIMOD, Kathmandu, 34p
Bajracharya B, Irwin D, Thapa RB, Matin MA (2021) Earth observation applications in the HinduKush Himalaya region—evolution and adoptions. In: Earth observation science andapplications for risk reduction and enhanced resilience in Hindu Kush Himalaya region(Chap. 1). Springer International Publishing, Cham. https://doi.org/10.1007/978-3-030-73569-2_1 (this volume)
Lalu MK, Ahmad F, Bhattarai G (2021) Approach and process for effective planning, monitoring,and evaluation. In: Earth observation science and applications for risk reduction and enhancedresilience in Hindu Kush Himalaya region (Chap 18). Springer International Publishing, Cham.https://doi.org/10.1007/978-3-030-73569-2_18 (this volume)
Service Planning Toolkit (SPT) (2017) https://www.servirglobal.net/Portals/0/Documents/ServicePlanningToolkit_2017-09-19.pdf
Shakya N, Pathak SR et al (2021) User engagement for sustaining services. In: Earth observationscience and applications for risk reduction and enhanced resilience in Hindu Kush Himalayaregion (Chap 17). Springer International Publishing, Cham. https://doi.org/10.1007/978-3-030-73569-2_17 (this volume)
Uddin K, Matin MA et al (2021) Regional land cover monitoring system for Hindu KushHimalaya. In: Earth observation science and applications for risk reduction and enhancedresilience in Hindu Kush Himalaya region (Chap 6). Springer International Publishing, Cham.https://doi.org/10.1007/978-3-030-73569-2_17 (this volume)
Vogel I (2012) Review of the use of ‘Theory of Change’ in international development, DFID.www.theoryofchange.org
Open Access This chapter is licensed under the terms of the Creative Commons Attribution 4.0International License (http://creativecommons.org/licenses/by/4.0/), which permits use, sharing,adaptation, distribution and reproduction in any medium or format, as long as you give appropriatecredit to the original author(s) and the source, provide a link to the Creative Commons license andindicate if changes were made.The images or other third party material in this chapter are included in the chapter’s Creative
Commons license, unless indicated otherwise in a credit line to the material. If material is notincluded in the chapter’s Creative Commons license and your intended use is not permitted bystatutory regulation or exceeds the permitted use, you will need to obtain permission directly fromthe copyright holder.
40 R. B. Thapa et al.

Chapter 3Geospatial Applications in the HKHRegion: Country Needs and Priorities
Mir A. Matin and Sheikh Tawhidul Islam
3.1 Introduction
Geospatial information, defined as information that refers to a location on Earth, isbecoming a critical tool in governance (Chantillon et al. 2017). Over the lastdecade, such information has become part of mainstream information management,thereby creating a massive demand for geospatial content and solutions amongindividuals, private companies, and government agencies. The industry has beengrowing at an annual rate of 14% and impacting the global economy at a rate of18% (GEOBUIZ 2018). Though the use of geoinformation in the HKH regionstarted in the 1990s and while the application areas have been on the rise, theintegration of geoinformation into the working of many key governmental agencieshas not yet been achieved. The agencies in the region have had limited exposure tothe latest developments in geospatial technologies. As the success of any infor-mation system depends on its usefulness for the intended target, in the context ofthe limited resources within the HKH region, it was crucial to understand the needsand priorities of the user agencies before planning to develop such a system.
This present study was commissioned by the SERVIR-HKH program to assessthe situation in four countries—Afghanistan, Bangladesh, Nepal, and Pakistan—regarding the decision-making processes at the institutional level (a total of 98institutions were surveyed) and the capability of the institutions to use geospatialinformation in an effective manner. The study tried to identify the type of servicesthese agencies provide and the kind of challenges they face regarding data andresources—hardware, software, human; it also attempted to understand the needsthat have to be accounted for while producing decision-support products. The study
M. A. Matin (&)International Centre for Integrated Mountain Development, Kathmandu, Nepale-mail: [email protected]
S. T. IslamInstitute of Remote Sensing, Jahangirnagar University, Dhaka, Bangladesh
© The Author(s) 2021B. Bajracharya et al. (eds.), Earth Observation Science and Applications for RiskReduction and Enhanced Resilience in Hindu Kush Himalaya Region,https://doi.org/10.1007/978-3-030-73569-2_3
41

aimed to attain threefold objectives. First, to know the institutional structure andpolicies that provide geospatial- and climate-information services related to agri-culture and food security, water resources and hydro-climatic disasters, land coverand land-use changes, as well as on weather and climate. Second, to determine thepattern of use of geospatial tools by the national agencies in decision-supportsystems and data-sharing mechanisms. Third, to identify potential areas of part-nerships with agencies where geospatial applications could be used for providingservices to communities/users/beneficiaries so that they are able to address thechallenges they face, thereby reducing vulnerabilities and enhancing resilienceagainst disaster.
3.2 The Decision-Making Landscape
A decision-making landscape includes different elements that create an enablingenvironment for the relevant agencies to deliver services that cater to the welfare ofthe intended recipient. The decision-making landscape in the government involvesknowledge and action, societies, organizations, and individuals (Raadschelders andWhetsell 2017). In this landscape, geospatial technology has the capability ofproviding valuable tools that can seamlessly organize and analyze knowledge tosupport evidence-based and spatially-contextualized decisions. In the case of theHKH region, the decision-making processes are generally top-down where nationalpolicies define the activity mandates of the specific agencies and then resources arearranged to perform the duties. In order to respond to emergencies, the governmentusually has standard operating procedures (SOP) which define decision-makingprocesses and the role of individual agencies. As for non-emergency issues such asthe monitoring of natural resources, the mandated agencies develop their ownpriorities and procedures. Thus, in a bid to understand the overall decision-makinglandscape in the context of geospatial applications, we considered the followingelements (Table 3.1).
Different public agencies, sometimes with support from national and interna-tional partner organizations, use geospatial tools and techniques to generate data fordecision-making purposes. The primary application areas are for: monitoring asituation (e.g., occurrence of a disaster); natural resource appraisal/management andbetter land-use planning (by way of soil-suitability assessment, urban planning, andland-zoning exercises); forest and biodiversity assessment; and for providing cli-mate services. In this regard, the agencies in the HKH region have been classifiedinto four categories (Fig. 3.1).
42 M. A. Matin and S. T. Islam

Table 3.1 Elements to understand decision-making landscape
Objectives Elements
To know about institutional structuresand policies
• Assess the organogram of the organizationconcerned to understand the decision-makinghierarchy and process
• Understand the contexts and contents ofdecision-making (why decisions are made forshort and long terms; and what decision aremade)
• Understand the decision-making processesduring crises and challenging situations
To examine the current pattern of use ofgeospatial data, tools, and methods
• Analyze the inputs (e.g., data) that organizationsuse to execute decisions
• Examine the level (e.g., local, regional, national)of service delivery for different thematic areasand use data appropriate for that scale
• Assess the provisions for data updates
To identify potential areas ofpartnerships among the relevantagencies
• Study the current partnership process amongorganizations
• Assess the service delivery processes (mappingapplication, and data dissemination throughtables, documents, catalogues, and web portals)
• Examine mandates such as the National SpatialData Infrastructure (NSDI) that aims to facilitatedata-sharing provisions among partner agencies
Fig. 3.1 Types of agencies that provide services using geospatial data
3 Geospatial Applications in the HKH Region: Country … 43
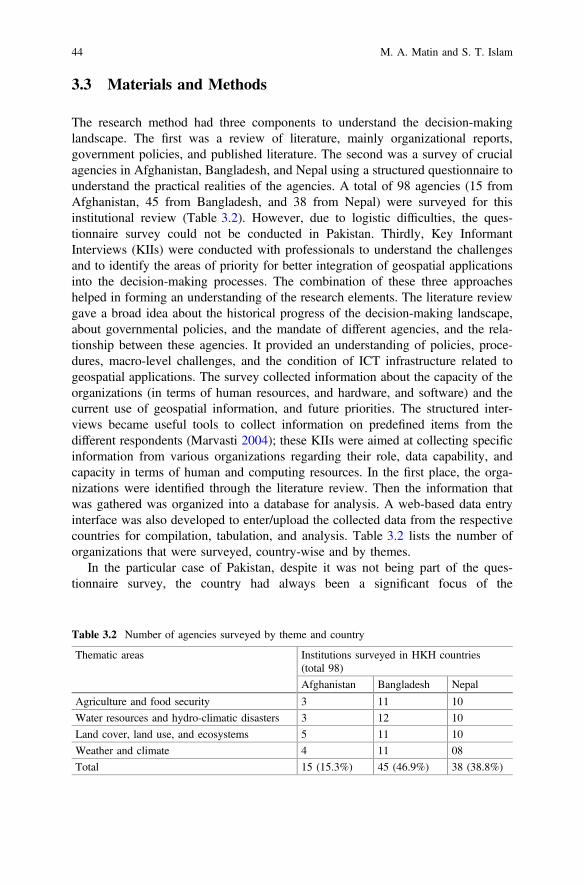
3.3 Materials and Methods
The research method had three components to understand the decision-makinglandscape. The first was a review of literature, mainly organizational reports,government policies, and published literature. The second was a survey of crucialagencies in Afghanistan, Bangladesh, and Nepal using a structured questionnaire tounderstand the practical realities of the agencies. A total of 98 agencies (15 fromAfghanistan, 45 from Bangladesh, and 38 from Nepal) were surveyed for thisinstitutional review (Table 3.2). However, due to logistic difficulties, the ques-tionnaire survey could not be conducted in Pakistan. Thirdly, Key InformantInterviews (KIIs) were conducted with professionals to understand the challengesand to identify the areas of priority for better integration of geospatial applicationsinto the decision-making processes. The combination of these three approacheshelped in forming an understanding of the research elements. The literature reviewgave a broad idea about the historical progress of the decision-making landscape,about governmental policies, and the mandate of different agencies, and the rela-tionship between these agencies. It provided an understanding of policies, proce-dures, macro-level challenges, and the condition of ICT infrastructure related togeospatial applications. The survey collected information about the capacity of theorganizations (in terms of human resources, and hardware, and software) and thecurrent use of geospatial information, and future priorities. The structured inter-views became useful tools to collect information on predefined items from thedifferent respondents (Marvasti 2004); these KIIs were aimed at collecting specificinformation from various organizations regarding their role, data capability, andcapacity in terms of human and computing resources. In the first place, the orga-nizations were identified through the literature review. Then the information thatwas gathered was organized into a database for analysis. A web-based data entryinterface was also developed to enter/upload the collected data from the respectivecountries for compilation, tabulation, and analysis. Table 3.2 lists the number oforganizations that were surveyed, country-wise and by themes.
In the particular case of Pakistan, despite it was not being part of the ques-tionnaire survey, the country had always been a significant focus of the
Table 3.2 Number of agencies surveyed by theme and country
Thematic areas Institutions surveyed in HKH countries(total 98)
Afghanistan Bangladesh Nepal
Agriculture and food security 3 11 10
Water resources and hydro-climatic disasters 3 12 10
Land cover, land use, and ecosystems 5 11 10
Weather and climate 4 11 08
Total 15 (15.3%) 45 (46.9%) 38 (38.8%)
44 M. A. Matin and S. T. Islam

SERVIR-HKH project. So, in Islamabad, on 23 February 2016, the necessary datawere collected through a stakeholder consultation process, jointly organized byICIMOD and the Pakistan Council of Research in Water Resources (PCRWR).A total of 37 participants attended from 23 agencies and institutions from gov-ernmental and non-governmental sectors. The participants were divided into threegroups and provided valuable inputs on: the availability of spatial data; the currentservice delivery processes where geospatial data, methods, techniques are used; andon the skills gaps in the geospatial applications. The participants identified theactivities and ranked them on a priority basis. Process documentation was dulydone, and a report was generated on the consultation processes. This report wasused as a source of data for this research in Pakistan since direct data collectionfrom the institutions was not possible due to logistical reasons.
3.4 Results and Discussions
3.4.1 The Organizational Framework for GeospatialApplications in the HKH Countries
Afghanistan
During the last few decades, several projects have been implemented in Afghanistanto develop geospatial data and spatial data infrastructure. The AfghanistanInformation Management Services (AIMS) was established in 1997 to process anddisseminate geoinformation and build the capacity of the national agencies in thisregard. Till 2009, several geospatial data sets and applications were developedthrough AIMS. More attempts were undertaken by the United States GeologicalSurvey (USGS), UNDP, and other international organizations to establish a nationalspatial data infrastructure in the country. However, despite a massive number ofprojects and initiatives to implement geospatial information, the agencies inAfghanistan showed a limited capacity to develop and maintain geospatial appli-cations. Among the institutions surveyed in Afghanistan was the NationalEnvironmental Protection Agency (NEPA), which is primarily responsible formonitoring and managing environmental resources and mainstreaming climatechange activities. Then there is the Afghan Meteorological Department (AMD), theprincipal agency that monitors hydrometeorological variables with an advancedmeteorological monitoring network. The Ministry of Agriculture, Irrigation andLivestock (MAIL), is responsible for natural resources exploitation, management,and conservation in the country; it also has a Statistics directorate with GIS facilitieswith dedicated human resources. Besides, MAIL has a network of stations to collectagrometeorological data for agriculture management. As for the Ministry of Energyand Water (MEW), it is responsible for all hydrological monitoring andwater-related disaster monitoring. The Afghanistan National Disaster Management
3 Geospatial Applications in the HKH Region: Country … 45

Authority (ANDMA) has the mandate to deal with the impact of climate change inthe country. It is the principal agency that coordinates the development ofdisaster-warning and disaster-risk reduction systems. On November 6, 2017, thePresident of Afghanistan endorsed the establishment of the National GeoinformationCenter (NGIC) under the National Statistical and Information Authority (NSIA).NGIC (https://nsia.gov.af/) has been given the responsibility to coordinate allgeospatial mapping and data management initiatives being carried out by all therelevant agencies aiming to provide coordinated access to all geospatial data. But allsaid, the Afghanistan experience tells us that the existence of a modest institutionaland policy framework to deal with hydrometeorological and environmental chal-lenges is not enough to deliver effective geospatial services. The problems are:
• Decision-making processes are generally top-down; identifying and under-standing user needs are usually less prioritized in this region
• National-level decision-making processes generally guide agency-leveldecision-making activities
• Data-generation and data-sharing provisions are inadequate• Agencies need skilled human resources and technical support for product/
service generation• There is a need for continued international support to strengthen the capabilities
of institutions such as universities in conducting research and providing trainingas well as in policy analysis in the various disciplines of environmentalmanagement
• Agro-meteorological data are available with MAIL, MEW, and AMD; they alsocollect hydro-meteorological data within their station networks; but the regularmaintenance of stations and data management were challenging.
Bangladesh
In Bangladesh, the Space Research and Remote Sensing Organization (SPARRSO)and the Survey of Bangladesh (SoB) are the two mandated government agenciesthat promote remote-sensing and topographic information systems. A moreextensive application of GIS and remote sensing started in the country in 1990when the Bangladesh Flood Action Plan (FAP 19) set up a GIS facility under theIrrigation Support Project for Asia and the Near East (ISPAN) with funds fromUSAID. The project later transformed into the Centre for Environmental andGeographic Information Services (CEGIS) as a public trust in 2002. A similarproject under the flood action plan responsible for hydrological modeling of floodand cyclone early warning systems transformed into the Institute of WaterModeling (IWM) in 1996. After that, the Local Government EngineeringDepartment (LGED) established a GIS lab for mapping different levels of admin-istrative units (such as thana maps). During the last three decades, many othergovernmental organizations have been adopting geospatial technology for analysisand spatial data management. In the agriculture and food security area, many of theagencies under the National Agricultural Research System (NARS) went on toestablish a geospatial lab. Among them, the Bangladesh Agricultural Research
46 M. A. Matin and S. T. Islam
Centre (BARC), the Soil Resources Development Institute (SRDI), BangladeshAgriculture Research Institute (BARI), Bangladesh Rice Research Institute (BRRI),and the Department of Agriculture Extension (DAE) have excellent geospatialfacilities. In this context, the development of Agro-Ecological Zones (AEZs) byBARC and soil maps by SRDI are the two significant data sets that have beendeveloped, although updating of these data has not happened since its development.In the area of water resources and disaster, in 1998, CEGIS was able to develop anational water resources database for the Water Resources Planning Organization(WARPO); this is a comprehensive database containing most of the spatial datalayers of Bangladesh. And since 1997, CEGIS has been using satellite data tomonitor flood and erosion. Another critical spatial data are the detailed digitaladministrative boundary and infrastructure maps developed by LGED, which isused for many spatial applications. In the case of monitoring land-cover changes, itis the Bangladesh Forest Department (BFD) that is in charge. BFD has been pro-ducing land-cover maps since the 1990s and recently produced a series ofland-cover maps (from 2000 to 2015) through funding from USAID and technicalassistance from the Food and Agricultural Organization (FAO).
But while a number of projects have been implemented, funds expended, anddata have been generated, the mainstreaming of geospatial technology for variousservices are still limited in the country. While CEGIS and IWM are maintaininggood geospatial capability, the relevant government agencies are suffering from thelack of resources. Lack of coordination among the agencies, use of old data due tothe absence of updating facilities, shortage of skilled human resources, ineffectivedata-sharing provisions, all are significant barriers in better use of geospatialtechnology in Bangladesh. The major challenges identified by the institutionalreview carried out in the country are:
• The current geospatial services are useful for short-term decision-making, butnot for long-term forecasts by the decision makers
• Data consistency, quality, and outdated data are still concerns for differentsectors
• The inadequate number of skilled human resources is a major problem• Data-sharing provisions are weak among the Bangladeshi agencies and need to
be improved because the services developed and provided by many agencies,such as BARC and DAE, depend on the geospatial data produced by otheragencies. Any challenges in data sharing jeopardize the whole process
• Early warning facilities are in place for flood, riverbank erosion and cyclonehazards. But the early warning systems for drought, landslides, and thunder-storms are still non-existent.
• Applications of geospatial methods, tools, and data in monitoring and yieldforecasting for different crops are very much required.
Nepal
Several agencies in Nepal use geospatial applications for different purposes. TheDepartment of Land Information and Archive of the Government of Nepal is one of
3 Geospatial Applications in the HKH Region: Country … 47
the principal agencies that manage land-ownership data for Nepal. The first detailedassessment and mapping of Nepal’s land resources were carried out by the LandResources Mapping Project (LRMP) under the auspices of this agency. Theassessment and mapping were based on aerial photography conducted in 1978–79and were supplemented by extensive field checks and sampling. And, between 1987and 1998, the Department of Forest Research and Survey, later renamed as ForestResearch and Training Centre (FRTC), conducted a nation-wide survey to prepare aNational Forest Inventory (NFI). The Survey Department of Nepal has beengathering, managing, and archiving spatial data related to geodesy and preparationof topographic maps. Soil maps of Nepal have been developed for agriculturalplanning by the Soil Science Division of the Nepal Agricultural Research Council.The Department of Hydrology and Meteorology (DHM), under the Ministry ofEnergy, Water Resources and Irrigation, has been playing a significant role ingenerating in situ hydro-met data from a large number of stations; these data areprimarily managed using the spatial data structure. Besides, the Central Bureau ofStatistics, the Department of Irrigation, and the National Planning Commission ofNepal has been extensively using various kinds of social, economic, and demo-graphic data for national-level planning activities and reporting purposes. OnSeptember 20, 2015, Nepal changed its constitution to transform the country into afederal system consisting of seven provinces and 753 local governments (includingsix metropolitan cities, 11 sub-metropolitan cities, 276 municipalities, and 460 ruralmunicipalities). Many of the tasks, including disaster management, are now beingcarried out by the provincial governments. However, the spatial data have not yetbeen updated to reflect the new administrative structure. The responsibility ofcollecting hydro-meteorological data still lies with the DHM, which is centrallymanaged. Many international agencies, such as the World Food Programme of theUnited Nations and the WWF (World Wide Fund for Nature), undertake actions inthe country wherein they widely use geospatial data, tools, and applications. Theprimary data gaps and challenges faced by Nepal are the following:
• There is a necessity to develop accurate baseline data/map on crop types andfarming practices at the sub-district (Village Development Committee) level
• The existing spatial data need to be updated to reflect the new administrativechanges and the relevant statistical data need to be synchronized with thesechanges
• There’s a need to develop a comprehensive agricultural information system byputting together data in the form of crop statistics, market prices, irrigationsystems, soil profiles, disease cycles, etc.
• District-level statistics on disasters (Devkota et al. 2012) are largely not avail-able; this needs to be addressed
• The provision of suitable indices for meteorological drought, agriculturaldrought, and hydrological drought needs to be developed
• The existing flood risk management practices and the early warning system haveto be improved and the lead time increased by using Earth observationapplications.
48 M. A. Matin and S. T. Islam
Pakistan
In Pakistan, the geospatial data are mainly produced and disseminated by gov-ernment agencies as part of their mandated responsibilities (Ali and Ahmad 2013).The primary organizations producing geospatial data and conducting research forthe government are the Survey of Pakistan (SoP), the Pakistan Space and UpperAtmosphere Research Commission (SUPARCO), the Pakistan AgriculturalResearch Council (PARC), and the Census Department. Here, it is also important tomention that individual researchers have produced a wealth of information ondifferent themes. The significant area of research by these researchers has been ondisaster management—primarily on droughts, floods (Gaurav et al. 2011; Haq et al.2012), cyclones, earthquakes, and landslides. The researchers have also focused oncrop-yield forecasting (Bastiaanssen and Ali 2003) and groundwater use andmonitoring in large irrigated areas, especially in Rachna Doab. At the consultationworkshop, the experts picked out eight significant areas where geospatial data andtechniques are widely used (ICIMOD 2016). These are (i) crop monitoring andyield estimation, (ii) agriculture drought monitoring and forecasting with earlywarning facility, (iii) catchment monitoring is required for water resources,(iv) rangeland productivity monitoring, (v) monitoring water use for agriculture,(vi) tree plantation monitoring, (vii) development and management of NationalGIS/RS data bank, (viii) flood forecasting, early warning, and water resourcesmonitoring system. The major challenges with regard to the availability ofgeospatial data in Pakistan are:
• Geospatial data are collected primarily by government agencies, and data col-lections are carried out as per the mandates of the respective organizations
• Geospatial data are available for sectors such as agriculture, water resources,land cover, river basins, weather, climate, and environment, but data-sharingprovisions among the agencies are generally limited or non-existent
• Regular updating of the data does not happen; lack of skilled human resources isanother barrier in advancing geospatial applications.
3.4.2 Institutional Assessment
Since SERVIR’s approach depends on partner agencies to deliver the geospatialinformation services, an assessment of current tasks, priorities, needs, and capaci-ties were essential to understand the overall landscape. This section gives anaccount of how geospatial technologies are being used by the agencies working inthe HKH region; this is based on a specific survey conducted for this study.
3 Geospatial Applications in the HKH Region: Country … 49

3.4.2.1 Major Tasks of the Organizations
The agencies in the HKH region perform different types of activities to deliverinformation services in related sectors. Among the three countries that were sur-veyed, it was mostly Nepal’s agencies which mentioned that they carried outprojects based on the need of the client. Six agencies indicated that they performedassessments using geospatial data, tools, and methods to assess developmentimpacts on the environment and society. The agencies in Bangladesh and Nepalreported that they mainly stuck to the activities that were required to support thecore/primary activities of any sector. About 34% of the agencies stated that theyused geospatial technologies to address the needs of the users in a more efficientway; 28% indicated that using geospatial technologies helped them to ensurecomplete coverage of the problem whereby they could use multiple layers ofinformation. Some agencies reported that they used geospatial technologies forbetter planning and for maintaining commitments in delivering services. The surveyresults revealed that the agencies prioritized activities in terms of what were mostimportant to them (i.e., primary-focus activities) and then paid attention tosecondary/other priority areas. The agencies informed that such prioritization was atricky and complicated job since it depended on several elements like the durationand size of the project and organizational policy and donor priorities.
3.4.2.2 Requirement and Use of Data
The agencies that were interviewed mentioned about 15 thematic categories(Fig. 3.2), where they use various types of geospatial data and methods. Onaverage, land use and land cover, land topography and elevation, and informationabout administrative boundaries were mentioned as the most important thematiccategories that use geospatial data. The countries, however, provided differentaccounts in this regard. Most of the agencies in Bangladesh indicated that theyneeded hydro-climatic data on a daily and weekly basis because they needed todevelop early warning forecast products to deal with floods of various kinds (e.g.,riverine floods, flash floods, abnormal water surge in the coastal areas) and also topredict related vulnerabilities like riverbank erosion, crop loss, and landslides. Theagencies in Nepal mentioned that they needed all kinds of data since the variation inelevation and topography results in significant variation in climatic variables. Theagencies in Afghanistan stated that they mostly depended on annual data to producegeospatial products aimed at irrigation planning and also to assess impacts ofhazards like drought, floods, and landslides.
Land use and land cover, topography, land elevation, administrative units, andinfrastructure are the top five categories of data used by agencies relying ongeospatial technologies in Bangladesh, Afghanistan, and Nepal. The agenciesindicated during the institutional survey that these data sets helped by way of inputsto undertake different types of analysis and to produce map products, trend
50 M. A. Matin and S. T. Islam

analyses, impact assessments, and modeling results for the monitoring and planningof resources. The survey also showed that mining and service-utility data were theleast used by the agencies in these three countries.
3.4.2.3 Data-Sharing Provisions
The status of exchange and sharing of geospatial data among the agencies arelimited in all the countries in the HKH region. These limited sharing provisionsexist because of the absence of necessary policy, infrastructure, and resources. Forexample, in Pakistan, geospatial data are produced and archived by agencies likethe Survey of Pakistan, SUPARCO, the Revenue Department, and the GeologicalSurvey of Pakistan; but institutional, legal, and technical arrangements are not in
Fig. 3.2 Application areas of geospatial technologies
3 Geospatial Applications in the HKH Region: Country … 51
place for coordination among these agencies (Ali 2009). In Bangladesh, the primaryagencies that produce, use, and deliver geospatial data are SoB and SPARRSO,which is under the Ministry of Defense. So, for accessing their data, the users haveto go through complicated and time-consuming administrative processes andsecurity checks; indeed, items like topographical maps created by SoB still comeunder the category of classified products and are restricted for public use. Otheragencies in Bangladesh, like the Department of Land Records and Survey (DLRS)under the Ministry of Land, the Department of Public Health and Engineering(DPHE), and LGED do use geospatial technologies in different capacities andpurposes, but they also need to follow cumbersome administrative processes toshare their data with other agencies. Then there’s the issue of copyright such aswhen it comes to reproducing spatial data by digitizing hard-copy maps producedby third parties.
But a few agencies did state that their offices had designated personnel formanaging geospatial data sharing with other agencies and that they shared dataregularly. Interestingly, Nepal, Pakistan, Afghanistan, and Bangladesh are currentlytrying to put in place a National Spatial Data Infrastructure (NSDI) so that theircentral archives are linked to each other, and the dissemination/sharing of spatialdata is enabled in an effective manner. Most of the agencies indicated that poor dataquality, shortage of human resources, and hardware resources are the major chal-lenges for data sharing.
3.4.3 Institutional Needs and Priorities
The study reveals that though the introduction of geospatial technologies in dif-ferent application domains started in the HKH region in the 1990s, the properintegration and institutionalization of the system have not yet taken place in thepublic agencies. While professional activities are taking place, they are by way oftime-bound projects where external partner agencies play vital roles in supplyingresources and technical solutions. And the funds generally cease with the termi-nation of a project; so, there’s no continued support to enable regular operationalactivities and to update the data/products. In most of the cases, the allocation ofresources from the revenue sources is negligible because of the non-existence ofpolicies and strategies in this regard. This uncertainty causes diminishing use/reuseand hampers the sharing of the geoinformation with other agencies. Over time, withthe help of partnerships with external agencies when the hardware and software,and EO data become less costly and more available, and the agencies become morefamiliar with the geospatial tools, methods, and applications, a better ground couldbe laid for more sustainable and robust use/integration of geospatial technologies indifferent areas. In this regard, the interviewees had several suggestions (Table 3.3),such as in terms of developing human resources who can better handle geospatialdata, tools, and models and where appropriate strategies are in place so that the
52 M. A. Matin and S. T. Islam

agencies can retain skilled human resources. However, as Table 3.3 shows, when itcomes to priorities of all the countries combined, they are slightly different from theoptions and priorities of the individual countries (Table 3.4; Fig. 3.3).
Table 3.3 Suggestions for improved geospatial applications
Priority areas Number and percentage of agenciesthat responded (multiple responses)
1. Skill development training 32 (21%)
2. Hardware support and upgradation 26 (17%)
3. Necessary fund flow 26 (17%)
4. Retain the trained workforce in the organization 25 (16%)
5. Need appropriate policy (e.g., NSDI) 23 (15%)
6. Access to scale-specific and requireddata when necessary
20 (13%)
Table 3.4 Country-specific priorities for improving geospatial applications
Priority areas
Priorities of Nepal Priorities of Bangladesh Priorities of Afghanistan
1. Need appropriate policy2. Skill development training3. Hardware support4. Necessary funding5. Retain human resources
1. Skill development training2. Hardware support3. Necessary funding4. Retain human resources5. Access to data
1. Appropriate policy2. Skill development training3. Retain human resources4. Access to data5. Necessary funding
Fig. 3.3 Country-wise priorities for more effective geospatial applications (number of agencies;multiple responses counted)
3 Geospatial Applications in the HKH Region: Country … 53
3.5 Conclusions and Major Findings
The study on the decision-making landscape of the different countries in the HKHregion has provided an in-depth understanding of the degree of applications ofgeospatial data and tools for various application domains. The study reveals that theintroduction of geospatial technologies in different application domains in the HKHregion took place in the 1990s. However, proper integration and institutionalizationof the system has not yet happened in the case of the public agencies of the region.Activities are taking place only on an ad hoc basis in all the relevant sectors:agriculture and food security; water resources and hydro-climatic disaster man-agement; land cover and land use; ecosystems; and weather and climate. And theseactivities are mostly time-bound projects where external partner agencies play vitalroles in supplying resources and technical solutions. All these resources generallycease with the termination of the contract with the external partners and thus cannotcontinue providing support to perform regular operational activities and to updatethe products. The required allocation of resources from the revenue sources issparse because of the non-existence of policies and budgetary provisions. Thislacuna also leaves its impacts on proper use/reuse and the sharing of geoinformationwith other agencies.
Agencies in the HKH region are using geospatial technologies within thebackground contexts mentioned above for improving the services they deliver foruser benefits. However, it is important to note that in recent times, the cost ofhardware and software has dropped, and EO agencies like NASA have made theirdata available for free. Against such a backdrop and when the agencies becomemore familiar with the geospatial tools, methods, and applications, a firmer groundcould be laid for more sustainable and robust integration of geospatial technologieswith the agencies that are interested in using this technology. In this regard, severalrecommendations (below) have come from the national agencies that were inter-viewed for this study; the implementation of these suggestions would go a long wayin ensuring a strong foothold for geospatial data infrastructure in the HKH region. Itis imperative to mention here that in the given contexts and as an interim solution(unless and until national agencies develop necessary policies), the promotion ofonline geospatial systems such as Google Earth Engine (GEE) and free softwarelike QGIS could play vital roles because these will help the agencies to avoid theburden of data production and archiving, and also relieve them of the need toprocure and maintain expensive hardware facilities. The major findings of thisresearch and the recommendations are grouped into two categories; the first cate-gory presents the findings and recommendations relating to geospatial data andapplications; while the second category reveals the institutional policy gaps.
Findings on Geospatial Resources (Data, Applications)
• Geospatial applications are needed primarily to assess disaster impacts andearly warning systems in the HKH region: The study suggests that the agenciesneed various types of geospatial data during different time frames –such as
54 M. A. Matin and S. T. Islam
daily, seasonal, annual, and decadal—for conducting impact assessments ofhydro-climatic disasters (e.g., flood-affected–area mapping in Bangladesh;landslide susceptibility in Nepal—Islam and Sado 2000; Haq et al. 2012; Regmiet al. 2014) and change detection in irrigated agriculture (e.g., in the case ofAfghanistan—Haack et al. 1998), as well as for providing early warning andforecasts on droughts and landslides.
• National communication reports mention about the need for data andknowledge products: The governments in their international communicationreports (e.g., reports written for UNFCCC, CBD, and UNCTAD) refer to theneed for geospatial data for producing high-quality reports with valuableinformation.
Findings on Institutional Policy Gaps
• The apex management of the agencies play important roles in making deci-sions: The results suggest that the apex management of an organization plays avital role in making decisions regarding the integration of geospatial applica-tions in the service-delivery processes. Sensitizing them is, therefore, crucial toincorporate geospatial applications into organizational mandates.
• Activity prioritization depends on the core mandates of an agency: The surveyresults reveal that agencies prioritize activities as per their organizationalmandates wherein there are primary-focus activities and then secondary priorityareas.
• Time-bound, project-based geospatial applications: The study findings suggestthat in most of the instances, government agencies are approached by interna-tional agencies to incorporate geospatial technologies to improve theirdecision-making and service-delivery processes. These international agenciesgenerally come with geospatial data (where necessary), technical solutions, andthe human resources to provide support within a specific period for which theysign the agreement. The geospatial laboratories that are developed during theproject time generally lose the necessary attention from the host agency and theapex body of a sector (like ministry) when the project ends. This is mainlybecause giving importance to such activities are neither indicated in the sector’spolicy papers nor mentioned in its organizational strategy documents. Therefore,it becomes challenging for the host agencies to sustain skilled human resourcesand regular updating of geospatial data. There’s lack of a recurrent budget fromrevenue sources for upgradation of hardware and software facilities andarchiving and dissemination.
• The sharing provisions of geospatial data are poor among the agencies:Data-sharing provisions are low among the agencies in the HKH region forseveral reasons. These are: (i) absence of policies, legal frameworks, andmandates; (ii) absence of a central coordinating authority to produce, archive,and share data, not to mention the non-existence of a geospatial data-sharingclearinghouse; (iii) absence of the metadata of the geospatial data in most cases—thus, it becomes difficult to know about the accuracy, consistency, sources,
3 Geospatial Applications in the HKH Region: Country … 55
and scale of the data, resulting in the agencies shying away from receiving thedata of other agencies—instead, they prefer to produce the same data again;(iv) limited understanding about the usefulness of sharing geospatial data; and(v), inadequate human and financial resources with the agencies to performdata-sharing activities.
References
Ali A (2009) Spatial data infrastructure for land administration in Pakistan. Paper presented in theconference titled ‘Spatial data serving people: land governance and the environment—buildingthe capacity’, Hanoi, Vietnam, 19–22 Oct 2009
Ali A, Ahmad M (2013) Geospatial data sharing in Pakistan: possibilities and problems. In:Conference: global geospatial conference 2013, Addis Ababa, Ethiopia
Bastiaanssen WGM, Ali S (2003) A new crop yield forecasting model based on satellitemeasurements applied across the Indus Basin, Pakistan. Agric Ecosyst Environ 94(3):321–340
Chantillon M, Crompvoets J, Peristeras V (2017) The governance landscape of geospatiale-services—the Belgian case. ISPRS Int J Geo-Inf 6
Devkota KC, Regmi AD, Pourghasemi HR, Yoshida K, Pradhan B, Ryu I Chang, Dhital MR,Althuwaynee OF (2012) Landslide susceptibility mapping using certainty factor, index ofentropy and logistic regression models in GIS and their comparison at Mugling-Narayanghatroad section in Nepal Himalaya. Nat Hazards 65:135–165
Gaurav K, Sinha R, Panda PK (2011) The Indus flood of 2010 in Pakistan: a perspective analysisusing remote sensing data. Nat Hazards 59:1815–1826
GEOBUIZ (2018) Geospatial industry outlook & readiness index. Geospatial Media andCommunications
Haack B, Wolf J, English R (1998) Remote sensing change detection of irrigated agriculture inAfghanistan. Geocarto Int 13(2):65–75
Haq M, Akhtar M, Muhammad S, Paras S, Rahmatullah J (2012) Techniques of remote sensingand GIS for flood monitoring and damage assessment: a case study of Sindh province,Pakistan. Egypt J Remote Sens Space Sci 15:135–141
ICIMOD (2016) Report of national consultation workshop on needs assessment for SERVIR-HKHin Pakistan. Workshop held on February 23 at Pakistan council of research in water resources(PCRWR), Islamabad
Islam MM, Sado K (2000) Development of flood hazard maps of Bangladesh usingNOAA-AVHRR images with GIS. Hydrol Sci J 45(3):337–355
Marvasti AB (2004) Qualitative research in sociology: an introduction. SAGE Publications Ltd,London
Raadschelders JCN, Whetsell TA (2017) Conceptualising the landscape of decision making forcomplex problem solving. Int J Public Adm 41:1132–1144
Regmi AD, Devkota KC, Yoshida K, Pradhan B, Pourghasemi HR, Kumamoto T, Aykut A (2014)Application of frequency ratio, statistical index, and weights-of-evidence models and theircomparison in landslide susceptibility mapping in Central Nepal Himalaya. Arab J Geosci 7(2):725–742
56 M. A. Matin and S. T. Islam

Open Access This chapter is licensed under the terms of the Creative Commons Attribution 4.0International License (http://creativecommons.org/licenses/by/4.0/), which permits use, sharing,adaptation, distribution and reproduction in any medium or format, as long as you give appropriatecredit to the original author(s) and the source, provide a link to the Creative Commons license andindicate if changes were made.The images or other third party material in this chapter are included in the chapter’s Creative
Commons license, unless indicated otherwise in a credit line to the material. If material is notincluded in the chapter’s Creative Commons license and your intended use is not permitted bystatutory regulation or exceeds the permitted use, you will need to obtain permission directly fromthe copyright holder.
3 Geospatial Applications in the HKH Region: Country … 57

Chapter 4A Regional Drought Monitoringand Outlook System for South Asia
Faisal Mueen Qamer, Mir A. Matin, Ben Zaitchik, Kiran Shakya,Yi Fan, Nishanta Khanal, Walter Lee Ellenburg, Timothy J. Krupnik,Hasan Md. Hamidur Rahman, Bashir Ahmad, Shib Nandan Shah,and Man Kshetri
4.1 Introduction
Current observations of the mean rainfall measurements in South Asia have placedin evidence a trend of decreasing monsoonal precipitation in the region (Hijiokaet al. 2014). The changing rainfall patterns and their intensity are likely to increasethe risk of drought—even during the monsoon period, especially when coupledwith other climate-related events (like extreme temperature and winds) that can leadto water shortage and heat stress in the dry season. About 45% of the population(around 800 million people) of the region are now living in areas expected tobecome climate-stress hotspots under the projected changes in weather conditions.Heat waves are also likely to affect more than 200 million people by the year 2040
F. M. Qamer (&) � M. A. Matin � K. Shakya � N. KhanalInternational Centre for Integrated Mountain Development, Kathmandu, Nepale-mail: [email protected]
B. Zaitchik � Y. FanJohns Hopkins University, Baltimore, MD, USA
W. L. EllenburgNASA SERVIR Science Coordination Office, Huntsville, AL, USA
T. J. KrupnikInternational Maize and Wheat Improvement Center, Dhaka, Bangladesh
H. Md. Hamidur RahmanBangladesh Agricultural Research Council, Dhaka, Bangladesh
B. AhmadPakistan Agricultural Research Council, Islamabad, Pakistan
S. N. ShahMinistry of Agriculture and Livestock Development, Kathmandu, Nepal
M. KshetriWorld Food Programme, Kathmandu, Nepal
© The Author(s) 2021B. Bajracharya et al. (eds.), Earth Observation Science and Applications for RiskReduction and Enhanced Resilience in Hindu Kush Himalaya Region,https://doi.org/10.1007/978-3-030-73569-2_4
59
(Mani et al. 2018). Moreover, drought and heat stress are likely to have adverseimpact on many of the crops grown in the dry season, which could have negativeimplications for food and nutrition security for households that are primarily sub-sistence based. Decreased water availability could also limit agricultural growthunless adaptation measures are implemented (Fig. 4.1). Further, declining snow-melt during spring and summer will likely affect surface water flow and ground-water recharge (due to less snow stored during the wintertime and the current fasterrate of snowmelt) and as such, could reduce farm output from irrigable land in thenear future. The projected increase in drier conditions will also likely have con-sequences for farmers relying exclusively on rain-fed agriculture. As variabilityexists in the South Asian monsoon patterns, droughts are ever likely to take place,thereby adversely affecting food production and agricultural sustainability ofcountries like Afghanistan, Nepal, Bangladesh, and Pakistan. Drought is a majordriver of production risk in rain-fed agriculture in terms of lost yield and income.A major drought can hamper crop yields, force farmers to reduce planted acreage,decrease livestock productivity and can under extreme circumstances affect theprice of irrigation water and animal feed (Enenkel et al. 2015; Dorigo et al. 2012;Chen et al. 2014). As water-related food security issues also spawn regional ten-sions (Bora et al. 2011), an accurate understanding of the availability and variabilityof water resources, particularly across geopolitical boundaries, is essential forimproving food security, economic development, and regional stability. Droughtepisodes are characterized by an unusual and prolonged period of dry weatherleading to situations of water shortage and crop damage. Various causes are at theorigin of drought episodes; these can be classified, as done by Wilhite and Glantz(1985), into—meteorological, hydrological, and agricultural (these three are linkedto physical situations); and socio-economical (linked to overuse of water by humansfor several activities).
Food insecurity in rural areas is caused by biophysical and socioeconomicfactors. The former includes climate change and climatic extremes. Food insecurityis also higher in the HKH mountain region than in the downstream plains of SouthAsia that tend to support more productive agricultural systems (Hussain et al.2016). In Afghanistan, drought contributed to large losses of the production ofmaize (85%), potato (50%), wheat (75%), and 60% of overall agricultural pro-duction during the extended dry spell between 1998 and 2005 (NEPA 2013). As forPakistan, situated in the sunny belt of 24°N–37°N latitude and 61°E–75°E longi-tude, it presents a variability in rainfall across its regions and drought is also a majorthreat that the country has to contend with (Mazhar et al. 2015; Dahal et al. 2016).Similarly, periodic and brief droughts in Nepal have caused losses in rice and potatoyields (Luitel et al. 2015; Alamgir et al. 2015). Moreover, when farmers do nothave access to irrigation, like in Bangladesh, they suffer crop losses due to droughtsin the monsoon season (Ahmad et al. 2004; PMD 2008). A summary of majordrought events that have occurred in Afghanistan, Bangladesh, Nepal, and Pakistansince 1980 is presented in Fig. 4.2.
60 F. M. Qamer et al.
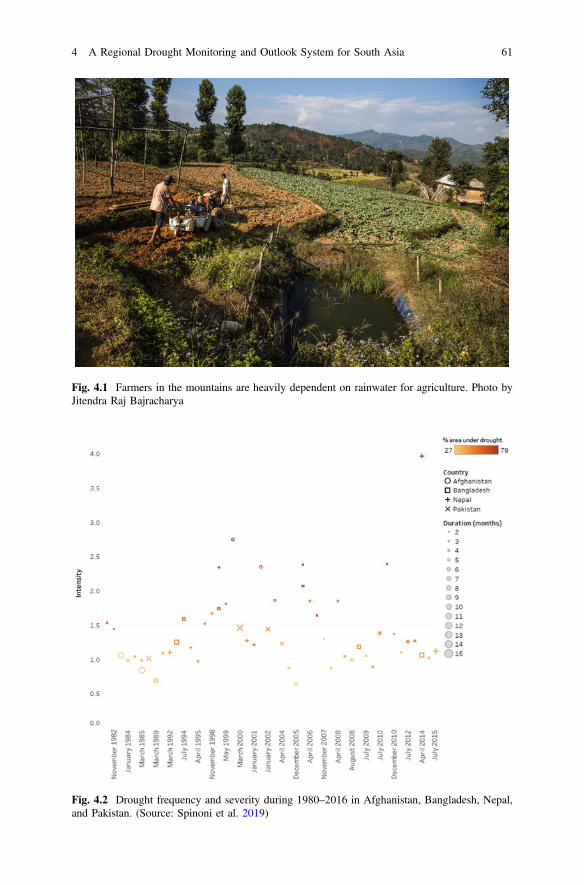
Fig. 4.2 Drought frequency and severity during 1980–2016 in Afghanistan, Bangladesh, Nepal,and Pakistan. (Source: Spinoni et al. 2019)
Fig. 4.1 Farmers in the mountains are heavily dependent on rainwater for agriculture. Photo byJitendra Raj Bajracharya
4 A Regional Drought Monitoring and Outlook System for South Asia 61
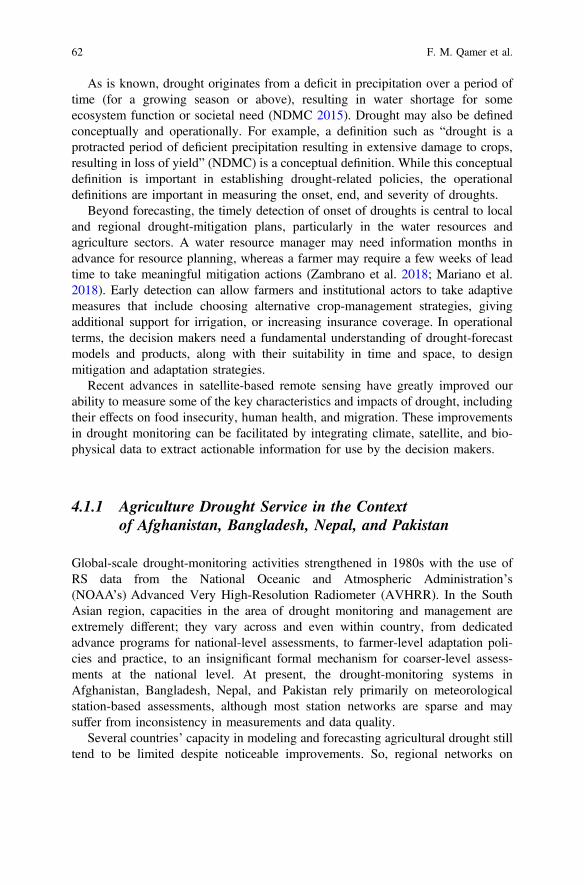
As is known, drought originates from a deficit in precipitation over a period oftime (for a growing season or above), resulting in water shortage for someecosystem function or societal need (NDMC 2015). Drought may also be definedconceptually and operationally. For example, a definition such as “drought is aprotracted period of deficient precipitation resulting in extensive damage to crops,resulting in loss of yield” (NDMC) is a conceptual definition. While this conceptualdefinition is important in establishing drought-related policies, the operationaldefinitions are important in measuring the onset, end, and severity of droughts.
Beyond forecasting, the timely detection of onset of droughts is central to localand regional drought-mitigation plans, particularly in the water resources andagriculture sectors. A water resource manager may need information months inadvance for resource planning, whereas a farmer may require a few weeks of leadtime to take meaningful mitigation actions (Zambrano et al. 2018; Mariano et al.2018). Early detection can allow farmers and institutional actors to take adaptivemeasures that include choosing alternative crop-management strategies, givingadditional support for irrigation, or increasing insurance coverage. In operationalterms, the decision makers need a fundamental understanding of drought-forecastmodels and products, along with their suitability in time and space, to designmitigation and adaptation strategies.
Recent advances in satellite-based remote sensing have greatly improved ourability to measure some of the key characteristics and impacts of drought, includingtheir effects on food insecurity, human health, and migration. These improvementsin drought monitoring can be facilitated by integrating climate, satellite, and bio-physical data to extract actionable information for use by the decision makers.
4.1.1 Agriculture Drought Service in the Contextof Afghanistan, Bangladesh, Nepal, and Pakistan
Global-scale drought-monitoring activities strengthened in 1980s with the use ofRS data from the National Oceanic and Atmospheric Administration’s(NOAA’s) Advanced Very High-Resolution Radiometer (AVHRR). In the SouthAsian region, capacities in the area of drought monitoring and management areextremely different; they vary across and even within country, from dedicatedadvance programs for national-level assessments, to farmer-level adaptation poli-cies and practice, to an insignificant formal mechanism for coarser-level assess-ments at the national level. At present, the drought-monitoring systems inAfghanistan, Bangladesh, Nepal, and Pakistan rely primarily on meteorologicalstation-based assessments, although most station networks are sparse and maysuffer from inconsistency in measurements and data quality.
Several countries’ capacity in modeling and forecasting agricultural drought stilltend to be limited despite noticeable improvements. So, regional networks on
62 F. M. Qamer et al.

droughts could help strengthen these countries’ ability to develop adequatedrought-monitoring services and warnings.
In this regard, in the case of South Asia, the South Asian Climate OutlookForum (SASCOF), established in 2010, is the most prominent platform whichfunctions under the World Meteorological Organization (WMO). Every year duringthe month of April, SASCOF regional experts review the global and regionalclimate conditions to produce the monsoon outlook for the upcoming rainy season.The other networks that are partly related to drought monitoring in the regioninclude Global Earth Observation System of Systems (GEOSS) Asian Water CycleInitiative, South Asian Association for Regional Cooperation (SAARC)Meteorological Research Center, Dhaka, and Global Crop Watch, Beijing. In thecase of Pakistan, it is its Meteorological Department’s National DroughtMonitoring Center (NDMC) that provides drought information and warnings whichare primarily based on ground-station data (PMD 2008). However, in the recentyears, Pakistan has been able to develop a better and more active meteorologicaldrought-warning system by improving its capability to integrate weather radar andGIS data for drought identification (Islam et al. 2013; Sarkar et al. 2010). Still, thecountry’s prediction level in terms of onset of drought is rather limited (Islam et al.2013).
In Bangladesh, while the Center for Environmental and GeographicalInformation System (CEGIS) has developed a Drought Assessment Model (DRAS)that has the capability to monitor agricultural drought and net irrigation (Prasad2015), it is, however, not yet in operation as it is primarily a research product(Parvin et al. 2015). As for Nepal, there simply is no drought-monitoring system inoperation (Abbas et al. 2016). This is despite the fact that an agricultural droughtmonitoring and warning system has been identified by several studies as crucial forNepal. These studies include such diverse research projects as: a winterdrought-monitoring case study by the Nepal Department of Hydrology andMeteorology (DHM); a governmental project on a crop insurance scheme forfarmers; and a study on the use of space technology for drought monitoring andearly warning, conducted by the Economic and Social Commission for Asia and thePacific (ESCAP) (Abbas et al. 2016).
At the global level, there are a number of international agriculturaldrought-monitoring systems, including Integrated Drought Management supportedby the WMO and the Global Water Partnership (GWP), which play a fundamentalrole in the decision-making processes that govern food aid and agricultural productsin the global market. These systems are in operation to assist in: food security andfamine early warning; monitoring production to ensure stable global and nationalmarkets for agricultural crops; and monitoring and modeling of agriculturalland-use change (Hao et al. 2017). But these systems only provide general infor-mation at a rather coarse resolution for agriculture in the South Asian countries.There still remain large disparities between the monitoring capabilities of developedand developing nations.
One of the obstacles to the development of an effective and operational droughtmonitoring and early warning system for the region lies in the lack or absence of a
4 A Regional Drought Monitoring and Outlook System for South Asia 63

sufficiently reliable regional hydro-meteorological monitoring system as well as dueto data gaps from country to country. To counter these issues, ICIMOD hasintroduced a Regional Drought Monitoring and Outlook System (RDMOS). Theaim of the service is to produce a reliable drought indicator for countries in theHKH region. In this system, the drought and vegetation indices are based onclimatic models, EO data as well as land-surface models to produce a mechanismwhereby drought is monitored in a near-real-time span. It also provides a seasonaloutlook, every four months, in order to help the countries of the HKH region bebetter prepared to take drought management actions.
In this regard, a twofold framework has been developed based on the goal ofestablishing an integrated modeling platform to produce scientifically robustregional-level drought data products and the development of appropriate informa-tion systems to contextualize data and support related decision-making by keyinstitutions working on climate adaptation (Fig. 4.3). The system has two distinctcomponents, one of monitoring the current drought conditions and the other offraming a seasonal drought outlook, ranging from four to nine months. Thus, thesystem gives prominence to both the quality of meteorological forecast and theaccuracy of the modeled initial hydrological state, particularly during the earlyperiod of prediction.
4.1.2 Indicators for Operational Drought Monitoring
In order to provide a quantitative measure of the main episodic characteristics of adrought, data are assimilated from several variables, like precipitation and evapo-transpiration, to build drought indices. A drought index can be used to quantifymoisture conditions in a particular location, and thereby identify the onset and
Fig. 4.3 Framework for establishing an integrated platform for drought data products anddissemination service
64 F. M. Qamer et al.

intensity of a particular drought event. However, as a drought may involve variouscharacteristics, an efficient drought-monitoring system must take into account thetype and characteristics of the event. Therefore, several drought indices have beenderived for the effective monitoring of the intensity, duration, severity, and spatialextent during the various stages of a drought (WMO and GWP 2016; Mishra andSingh 2010). In this regard, as part of our co-development philosophy, severalconsultation workshops were held with the key collaborators with the aim togenerate agreement on the relevant drought indices that can be suitable for nationaland regional operational needs. Currently, four key variables related to droughtindices are being used by the RDMOS: the Standardized Precipitation Index (SPI);the Evapotranspiration Deficit Index (ETDI); Soil Moisture Anomaly (SMA); andthe Vegetation Conditions Anomaly (VCA). These methodologies and the inputdata are discussed below. While the methodology to compute the drought indicestends to be the same globally, the input data may vary across regions. A moreharmonized and standardized set of indices can help in getting better information onthe main causes of drought (Steinemann and Cavalcanti 2006).
Standardized Precipitation Index (SPI): SPI is the most notably used indicatorfor drought detection and monitoring. It is based on a statistical comparison of thetotal amount of precipitation received by a region for a specific period of time andprovides long-term trends for a specified period of the year. It is generally calcu-lated on the basis of monthly intervals for a moving window of n months, typically1, 3, 6, and 12 months.
Evapotranspiration Deficit Index (ETDI): A useful tool to monitor short-termagriculture drought, the ETDI, alongside the Soil Moisture Anomaly, providesinformation on the actual evapotranspiration as compared to crop evapotranspira-tion. This water stress ratio can be compared with the median water stress ratioobtained from longer-time framework observations.
Soil Moisture Anomaly (SMA): Agricultural drought is characterized by soilmoisture deficiency that can adversely impact crop yield and production. SMA isthe main instrument used to measure soil moisture content and to identify potentialagricultural drought episodes. Soil moisture is an important component of thehydrological cycle, and its evaluation is critical in forecasting the changes in thewater balance of a region. In an agricultural system, the spatial variability of soilmoisture and its deficits may result in a decline in crop yields or in the variability inyields.
Vegetation Conditions Anomaly: This indicator measures the anomalies ofsatellite-measured normalized difference vegetation index (NDVI) and is used tohighlight areas of relative vegetational stress during agricultural drought. Forlarge-area monitoring, season-integrated NDVI offers an effective approach tomeasure crop production as it closely relates to the overall plant vigor, canopyexpansion, and water stress during the season of growing.
4 A Regional Drought Monitoring and Outlook System for South Asia 65
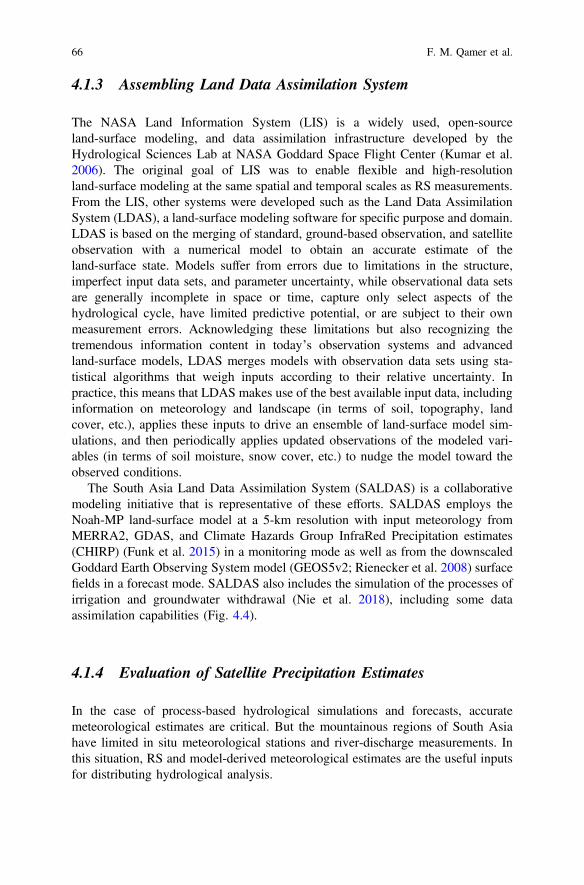
4.1.3 Assembling Land Data Assimilation System
The NASA Land Information System (LIS) is a widely used, open-sourceland-surface modeling, and data assimilation infrastructure developed by theHydrological Sciences Lab at NASA Goddard Space Flight Center (Kumar et al.2006). The original goal of LIS was to enable flexible and high-resolutionland-surface modeling at the same spatial and temporal scales as RS measurements.From the LIS, other systems were developed such as the Land Data AssimilationSystem (LDAS), a land-surface modeling software for specific purpose and domain.LDAS is based on the merging of standard, ground-based observation, and satelliteobservation with a numerical model to obtain an accurate estimate of theland-surface state. Models suffer from errors due to limitations in the structure,imperfect input data sets, and parameter uncertainty, while observational data setsare generally incomplete in space or time, capture only select aspects of thehydrological cycle, have limited predictive potential, or are subject to their ownmeasurement errors. Acknowledging these limitations but also recognizing thetremendous information content in today’s observation systems and advancedland-surface models, LDAS merges models with observation data sets using sta-tistical algorithms that weigh inputs according to their relative uncertainty. Inpractice, this means that LDAS makes use of the best available input data, includinginformation on meteorology and landscape (in terms of soil, topography, landcover, etc.), applies these inputs to drive an ensemble of land-surface model sim-ulations, and then periodically applies updated observations of the modeled vari-ables (in terms of soil moisture, snow cover, etc.) to nudge the model toward theobserved conditions.
The South Asia Land Data Assimilation System (SALDAS) is a collaborativemodeling initiative that is representative of these efforts. SALDAS employs theNoah-MP land-surface model at a 5-km resolution with input meteorology fromMERRA2, GDAS, and Climate Hazards Group InfraRed Precipitation estimates(CHIRP) (Funk et al. 2015) in a monitoring mode as well as from the downscaledGoddard Earth Observing System model (GEOS5v2; Rienecker et al. 2008) surfacefields in a forecast mode. SALDAS also includes the simulation of the processes ofirrigation and groundwater withdrawal (Nie et al. 2018), including some dataassimilation capabilities (Fig. 4.4).
4.1.4 Evaluation of Satellite Precipitation Estimates
In the case of process-based hydrological simulations and forecasts, accuratemeteorological estimates are critical. But the mountainous regions of South Asiahave limited in situ meteorological stations and river-discharge measurements. Inthis situation, RS and model-derived meteorological estimates are the useful inputsfor distributing hydrological analysis.
66 F. M. Qamer et al.

Among the available satellite precipitation data products, the long-term CHIRPis available at a high spatial and temporal resolution and can provide an opportunityto develop drought monitoring and early warning applications in data-sparseregions using rainfall estimates. However, CHIRP data also have some level ofuncertainty, which could affect the accuracy of predictions when they are used in adrought outlook scenario.
In the case of precipitation data products, they are being tested in different timeframes in different regions of the world that represent different climate conditions.To proceed with this evaluation, various statistical metrics like theroot-mean-square error (RMSE) and the bias and regression correlation coefficientof determination (R2) are used (Habib et al. 2009; Jiang et al. 2012; Nelson 2016).But in South Asia, such information is difficult to validate on account of limitedaccess to meteorological station data. In this evaluation, we compared the monthlyprecipitation estimates, during 1980–2018, from CHIRP with APHRODITE and thedata from 130 rain gauges collected from Bangladesh, Nepal, and Pakistan thatrepresent seven key climate divisions of South Asia (Fig. 4.5). The performance ofthe precipitation products was evaluated by using continuous (ME, MAE, and R2)and categorical (PBIAS, RSR) statistical approaches (Fig. 4.6). These metrics arebased on a pair-wise comparison to evaluate the performance of the monthlyCHIRPS-2.0 product, which estimates the amount of rainfall on each rain gauge andthen is summarized for each climate division. Overall, CHIRP performs better inwet regions than in arid and semiarid areas, and achieves greater accuracy duringsummer than in winter.
4.1.5 Season to Sub-season (S2S) Forecasting
Monsoon prediction is a key element in water-related agricultural management anddisaster preparedness. However, being able to forecast the monsoon dynamic has
Fig. 4.4 Elements and process of the SALDAS system for producing drought data products
4 A Regional Drought Monitoring and Outlook System for South Asia 67

proven to be a difficult exercise. The current development in the S2S meteorologicalforecast as well as improvements in EO applications could be exploited to provide amore accurate monitoring of the hydrological states and thus better forecasting. Theinformation from these sources is currently being merged in the S2S Land DataAssimilation System (S2S-LDAS) (Yifan et al. 2020).
Fig. 4.5 Climatic regions of the northern portion of South Asia
68 F. M. Qamer et al.
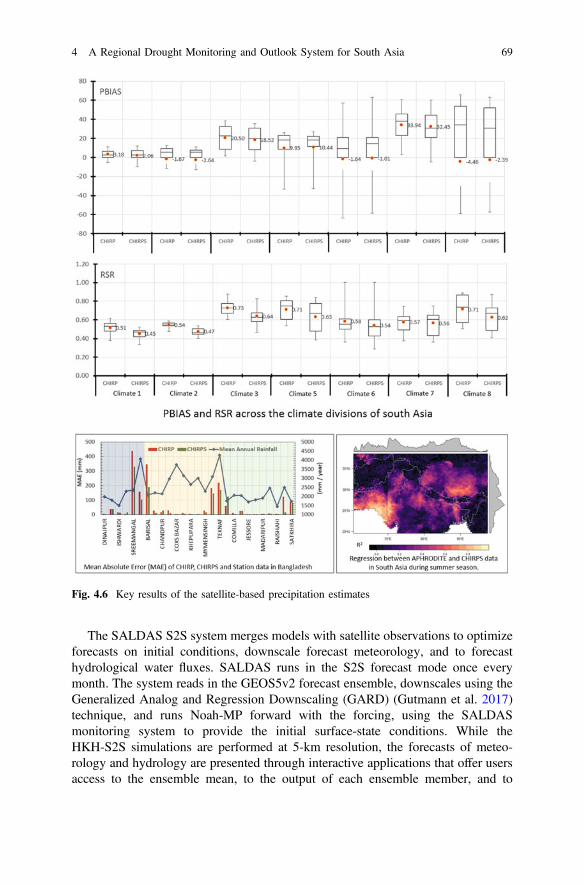
The SALDAS S2S system merges models with satellite observations to optimizeforecasts on initial conditions, downscale forecast meteorology, and to forecasthydrological water fluxes. SALDAS runs in the S2S forecast mode once everymonth. The system reads in the GEOS5v2 forecast ensemble, downscales using theGeneralized Analog and Regression Downscaling (GARD) (Gutmann et al. 2017)technique, and runs Noah-MP forward with the forcing, using the SALDASmonitoring system to provide the initial surface-state conditions. While theHKH-S2S simulations are performed at 5-km resolution, the forecasts of meteo-rology and hydrology are presented through interactive applications that offer usersaccess to the ensemble mean, to the output of each ensemble member, and to
Fig. 4.6 Key results of the satellite-based precipitation estimates
4 A Regional Drought Monitoring and Outlook System for South Asia 69

ensemble statistics presented as ranked anomalies. In keeping with the S2Starget-time horizon of the system, the outputs are presented as temporal averages atdecadal and monthly resolutions. The evaluation of the system is being conductedby comparing on-ground data with satellite observation data for the water fluxes. Itis expected, that in principle, better sub-seasonal hydrological forecast would be ofgreat use for governmental and other organizations in better assessing the risk ofdrought and taking mitigating actions. In the month of May 2019, the first seasonalforecast was produced for the 2019 monsoon season and the results were sharedwith relevant professionals from meteorological and agricultural institutions,including the Nepal PPCR program agriculture advisory team. Similarly in 2020,the seasonal outlook was produced in May 2020 and Fig. 4.7 shows the results ofthe months of June, July, August and its comparison with the observed conditionsmeasured by CHIRPS data sets the end of the season. The analysis of the match andmismatch between the predicted and observed conditions has helped in gaining theinitial confidence of users.
4.1.6 Information System Development
Efficient and effective water-related information systems should be able to housedifferent aspects like climate parameters and water, soil, and socioeconomic indi-cators which clearly identify the key characteristics of the severity of a drought, itsgeographical extent, and its impacts (WMO 2006). Additionally, the deliveredinformation via the warning system should be formulated in a manner that is clearand easy to understand in order to not exclude its use by non-specialist decisionmakers.
The purpose of a viable information system should not be limited to making dataaccessible, but it should also pay attention to the target audience and the intendedsupport for decision-making. The United Nations International Strategy for Disaster
Fig. 4.7 Regional seasonal outlook for precipitation based on the initial condition in April–May2020 and comparison with the conditions observed by the CHIRPS data set
70 F. M. Qamer et al.
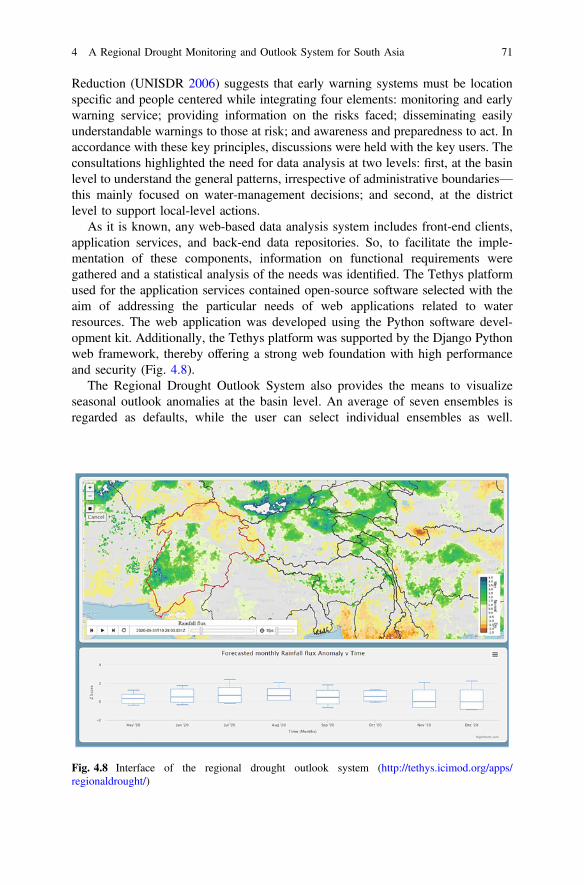
Reduction (UNISDR 2006) suggests that early warning systems must be locationspecific and people centered while integrating four elements: monitoring and earlywarning service; providing information on the risks faced; disseminating easilyunderstandable warnings to those at risk; and awareness and preparedness to act. Inaccordance with these key principles, discussions were held with the key users. Theconsultations highlighted the need for data analysis at two levels: first, at the basinlevel to understand the general patterns, irrespective of administrative boundaries—this mainly focused on water-management decisions; and second, at the districtlevel to support local-level actions.
As it is known, any web-based data analysis system includes front-end clients,application services, and back-end data repositories. So, to facilitate the imple-mentation of these components, information on functional requirements weregathered and a statistical analysis of the needs was identified. The Tethys platformused for the application services contained open-source software selected with theaim of addressing the particular needs of web applications related to waterresources. The web application was developed using the Python software devel-opment kit. Additionally, the Tethys platform was supported by the Django Pythonweb framework, thereby offering a strong web foundation with high performanceand security (Fig. 4.8).
The Regional Drought Outlook System also provides the means to visualizeseasonal outlook anomalies at the basin level. An average of seven ensembles isregarded as defaults, while the user can select individual ensembles as well.
Fig. 4.8 Interface of the regional drought outlook system (http://tethys.icimod.org/apps/regionaldrought/)
4 A Regional Drought Monitoring and Outlook System for South Asia 71
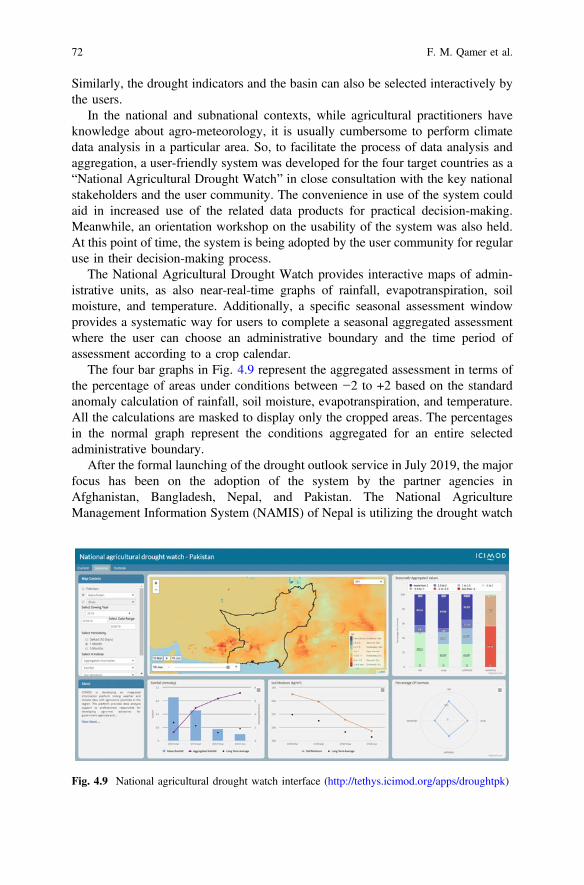
Similarly, the drought indicators and the basin can also be selected interactively bythe users.
In the national and subnational contexts, while agricultural practitioners haveknowledge about agro-meteorology, it is usually cumbersome to perform climatedata analysis in a particular area. So, to facilitate the process of data analysis andaggregation, a user-friendly system was developed for the four target countries as a“National Agricultural Drought Watch” in close consultation with the key nationalstakeholders and the user community. The convenience in use of the system couldaid in increased use of the related data products for practical decision-making.Meanwhile, an orientation workshop on the usability of the system was also held.At this point of time, the system is being adopted by the user community for regularuse in their decision-making process.
The National Agricultural Drought Watch provides interactive maps of admin-istrative units, as also near-real-time graphs of rainfall, evapotranspiration, soilmoisture, and temperature. Additionally, a specific seasonal assessment windowprovides a systematic way for users to complete a seasonal aggregated assessmentwhere the user can choose an administrative boundary and the time period ofassessment according to a crop calendar.
The four bar graphs in Fig. 4.9 represent the aggregated assessment in terms ofthe percentage of areas under conditions between −2 to +2 based on the standardanomaly calculation of rainfall, soil moisture, evapotranspiration, and temperature.All the calculations are masked to display only the cropped areas. The percentagesin the normal graph represent the conditions aggregated for an entire selectedadministrative boundary.
After the formal launching of the drought outlook service in July 2019, the majorfocus has been on the adoption of the system by the partner agencies inAfghanistan, Bangladesh, Nepal, and Pakistan. The National AgricultureManagement Information System (NAMIS) of Nepal is utilizing the drought watch
Fig. 4.9 National agricultural drought watch interface (http://tethys.icimod.org/apps/droughtpk)
72 F. M. Qamer et al.
service to disseminate information on the drought conditions and outlook amongthe stakeholders in the country, while the World Food Programme of Nepal isutilizing the drought data products in their quarterly food security assessments.Besides, building on SERVIR agriculture drought products and learning, theClimate Service Initiative of ICIMOD is establishing a localized agriculture advi-sory in Nepal’s Chitwan District.
In the case of Bangladesh, the Bangladesh Agriculture Research Council(BARC) is working toward hosting the drought outlook system. Similarly, thePakistan Agriculture Research Council (PARC) is in the process of establishing anAgriculture Decision Dashboard under the Ministry of Food Security and Researchfor planning decisions on food security which will also incorporate SERVIR’sseasonally aggregated drought data products.
4.1.7 Trainings and Capacity Building
A well-structured and rigorous effort has been made in the institutional capacitybuilding of the national agriculture agencies in Afghanistan, Bangladesh, Nepal,and Pakistan. A comprehensive resource book has been prepared which has boththeoretical and practical information on the drought monitoring and forecastapproach adopted under the RDMOS by the four countries (Qamer et al. 2019a, b).Several training exercises have also been conducted, including regional, national,and on-the-job trainings where a good number of professionals were exposed todrought-monitoring issues.
In this regard, the Regional Knowledge Forum on Drought held at ICIMODfrom 8 to 10 October 2018 brought together 100 participants—academicians, policypractitioners, researchers, and media persons—affiliated to 50 institutions based in13 countries in Asia and beyond. The forum discussed the ways to establish aregional partnership through the participation of national and regional institutions,the private sector, and local and international organizations to improve climateservices using EO applications and thereby facilitating agricultural decision-makingthat can strengthen the food security situation in the region (Qamer et al. 2019a, b).Discussing examples from South and Southeast Asia, the panelists showcased thevalue that EO technologies and climate services can bring to establish national andregional drought monitoring and early warning systems, as well as agro-advisoryservices.
4.1.8 Leanings and Future Directions
In South Asia, only a few scientific resources are available on operational droughtservices and associated mitigation tools. The establishment of the RDMOS providessupport for drought assessment and mitigation in South Asia. The system produces
4 A Regional Drought Monitoring and Outlook System for South Asia 73

key drought indicators including at decadal, monthly, and trimonthly intervals andis equipped with the ability to analyze these indicators on a seasonal scale accordingto crop calendars or the period of interest of the users. Besides, meteorological andhydrological forecasts are presented through interactive applications that offer usersaccess to the ensemble mean, to the output of each ensemble member, and toensemble statistics presented as ranked anomalies. In keeping with the S2Starget-time horizon of the system, the outputs are presented as temporal averages atdecadal and monthly resolutions. In addition, the system produces seasonal fore-casts on precipitation, soil moisture, evapotranspiration, and temperature to evaluatepotential drought hazards. The program has also developed operationalagriculture-monitoring data products and dissemination platforms through its net-work of partners in NASA, USAID, CIMMYT (International Maize and WheatImprovement Center), and globally renowned universities, as well as in closecollaboration with national experts from Afghanistan, Bangladesh, Nepal, andPakistan.
To enhance the usability of these platforms, extensive capacity building effortshave taken place to promote the use of EO data among the national-level managers,relevant development partners as well as field-level agriculture extension profes-sionals. As an operational service, it is expected to reduce regional crop loss causedby drought-associated damage. The advisory support system, over time, is expectedto achieve impacts by catalyzing and supporting the processes of innovationthrough two pathways: acquisition of new knowledge; and capacity building ofindividuals and institutions. The knowledge pathway is anticipated to facilitate andsupport stakeholders in gaining better access to the necessary products for thesmooth running of the service. The second pathway of capacity building has beendesigned to enable individuals and institutions to generate and use EO and GISinformation to develop advisories relevant at the farm level. The gradual uptake ofthe service is under way via trainings of partner agencies in Afghanistan,Bangladesh, Nepal, and Pakistan.
The current system provides analysis at the district level and is a guide to anyemerging agricultural drought situation. However, systems with higher resolutionswill be needed in the future, as most agricultural decision makers require morelocalized information. The linkages between community-based adaptation approa-ches and the national early warning systems are still very weak (Pulwarty andVerdin 2013), and this can only be improved by roping in the expertise of agri-cultural extension professionals.
Drought-warning systems provide excellent means of alleviating the issue ofshort-term food insecurity and thereby save lives. But the current crisis manage-ment approach has several limitations. A paradigm shift to proactive approachesbased on the edifice of drought-risk reduction and building greater societal resi-lience to drought impacts is the need of the moment. This calls for improvinglong-term agricultural land use and efficient water resource planning based on
74 F. M. Qamer et al.

quantitative resource assessments. In this region, China is already moving from adrought-emergency response (reactive) approach to a drought-risk management(proactive) approach, which involves integrated systems of monitoring, prediction,and modeling of hydrological and meteorological influences on water resources,coupled with demand management for water conservation. Agricultural droughtmonitoring and other early warning systems can be useful only to the extent thatthey offer actionable information that can be used to avoid or minimize the eco-nomic and social impacts of the predicted risk (Tadesse et al. 2018). This strategyshould also take into consideration the drought impacts on health which involve thevulnerability of the people living in drought-prone areas. Such a scheme of thingscould help build a more drought-resilient society (Li et al. 2017; Wall and Hayes2016). And it goes without saying that to mitigate the impacts of drought on humanlife and the environment, and to ensure production of adequate food to avoid foodcrises, developing strong early warning and mitigation strategies are critical(Zambrano et al. 2018; Mariano et al. 2018).
As part of climate adaptation strategies, crop insurance programs could aid inbuffering the financial impacts of drought-induced crop failure. However, theimplementation of index-based crop insurance in South Asia is rather constraineddue to the sparse hydro-meteorological network in the region and due to highvariability in the agro-meteorological conditions stemming from the complexity ofthe terrain (World Bank 2009; USAID 2014). In such a context, locally calibratedRDMOS can play a supporting role in implementing crop insurance as well asforecast-based financing in the agriculture sector.
Currently in South Asia, crop yield assessment is largely done through crop-cutsurveys, which are time-consuming and expensive. The integration ofprocess-based crop models with the current SALDAS system could also potentiallyimprove efficiency in crop monitoring, but more research is required in this area(Xia et al. 2019).
References
Abbas A, Amjath-Babu TS, Kächele H, Usman M, Müller K (2016) An overview of floodmitigation strategy and research support in South Asia: implications for sustainable flood riskmanagement. Int J Sustain Dev World Ecol 23(1):98–111
Ahmad S, Hussain Z, Qureshi AS, Majeed R, Saleem M (2004) Drought mitigation in Pakistan:current status and options for future strategies. IWMI
Alamgir M, Shahid S, Mohsenipour M, Ahmed K (2015) Return periods of extrememeteorological droughts during monsoon in Bangladesh. In: Applied mechanics and materials,Trans Tech Publ, pp 186–189
Bora S, Ceccacci I, Delgado C, Townsend R (2011) Food security and conflict. World Bank,Washington, DC. © World Bank. https://openknowledge.worldbank.org/handle/10986/9107
Chen T, De Jeu RAM, Liu YY, Van der Werf GR, Dolman AJ (2014) Using satellite based soilmoisture to quantify the water driven variability in NDVI: a case study over mainlandAustralia. Remote Sens Environ 140:330–338
4 A Regional Drought Monitoring and Outlook System for South Asia 75
Dahal P, Shrestha NS, Shrestha ML, Krakauer NY, Panthi J, Pradhanang SM et al (2016) Droughtrisk assessment in central Nepal: temporal and spatial analysis. Nat Hazards 80(3):1913–1919
Dorigo W, de Jeu R, Chung D, Parinussa R, Liu Y, Wagner W, Fernández-Prieto D (2012)Evaluating global trends (1988–2010) in harmonized multi-satellite surface soil moisture.Geophys Res Lett 39(18):L18405
Enenkel M, See L, Bonifacio R, Boken V, Chaney N, Vinck P, You L, Dutra E, Anderson M(2015) Drought and food security–improving decision-support via new technologies andinnovative collaboration. Global Food Security 4:51–55
Funk C, Peterson P, Landsfeld M, Pedreros D, Verdin J, Shukla S et al (2015) The climate hazardsinfrared precipitation with stations—a new environmental record for monitoring extremes. SciData 2(1):1–21
Gutmann ED, Hamman J, Eidhammer T, Nowak K, Arnold J, Clark MP (2017) Leveraging pastclimate variability to inform methodological choices and improve hydrologic projections.In AGU Fall Meeting Abstracts (vol 2017, pp H42C-01)
Habib E, Larson BF, Graschel J (2009) Validation of NEXRAD multisensor precipitationestimates using an experimental dense rain gauge network in south Louisiana. J Hydrol 373(3–4):463–478
Hao Z, Yuan X, Xia Y, Hao F, Singh VP (2017) An overview of drought monitoring andprediction systems at regional and global scales. Bull Am Meteor Soc 98(9):1879–1896
Hijioka Y, Lin E, Pereira JJ, Corlett RT, Cui X, Insarov GE, Lasco RD, Lindgren E, Surjan A(2014) Asia. In: Climate change 2014: impacts, adaptation, and vulnerability. Part B: regionalaspects. Contribution of working group II to the fifth assessment report of the intergovern-mental panel on climate change. Cambridge University Press, Cambridge, United Kingdomand New York, NY, USA, pp 1327–1370
Hussain A, Rasul G, Mahapatra B, Tuladhar S (2016) Household food security in the face ofclimate change in the Hindu-Kush Himalayan region. Food Security 8(5):921–937
Islam AKMS, Attwood S, Braun M, Kamp K, Aggarwal P (2013) Assessment of capabilities,needs of communities, Bangladesh. WorldFish, Penang, Malaysia
Jiang S, Ren L, Hong Y, Yong B, Yang X, Yuan F, Ma M (2012) Comprehensive evaluation ofmulti-satellite precipitation products with a dense rain gauge network and optimally mergingtheir simulated hydrological flows using the Bayesian model averaging method. J Hydrol452:213–225
Kumar SV, Peters-Lidard CD, Tian Y, Houser PR, Geiger J, Olden S, Lighty L, Eastman JL,Doty B, Dirmeyer P, Adams J, Mitchell K, Wood EF, Sheffield J (2006) Land informationsystem—an interoperable framework for high resolution land surface modeling. EnvironModel Softw 21:1402–1415. https://doi.org/10.1016/j.envsoft.2005.07.004
Li Z, Chen Y, Fang G, Li Y (2017) Multivariate assessment and attribution of droughts in CentralAsia. Sci Rep 7(1):1316
Luitel BP, Khatri BB, Choudhary D, Paudel BP, Jung-Sook S, Hur O-S et al (2015) Growth andyield characters of potato genotypes grown in drought and irrigated conditions of Nepal. Int JAppl Sci Biotechnol 3(3):513–519
Mani M, Sushenjit B, Shun C, Anil M, Thomas M (2018) South Asia’s hotspots: the impact oftemperature and precipitation changes on living standards. In: South Asia development matters.World Bank, Washington, DC. https://doi.org/10.1596/978-1-4648-1155-5. License: CreativeCommons Attribution CC BY 3.0 IGO
Mariano DA, Santos CC, Wardlow B, Anderson MC, Schiltmeyer AV, Tadesse T, Svoboda M(2018) Use of remote sensing indicators to assess effects of drought and human-induced landdegradation on ecosystem health in Northeastern Brazil. Remote Sens Environ 213:129–143
Mazhar N, Nawaz M, Mirza AI, Khan K (2015) Socio-political impacts of meteorologicaldroughts and their spatial patterns in Pakistan. South Asian Stud 30(1):149
Mishra AK, Singh VP (2010) A review of drought concepts. J Hydrol 391(1):202–216. https://doi.org/10.1016/j.jhydrol.2010.07.012
National Drought Mitigation Center (2015) The standardized precipitation index, 16
76 F. M. Qamer et al.

Nelson BR, Prat OP, Seo DJ, Habib E (2016) Assessment and implications of NCEP Stage IVquantitative precipitation estimates for product intercomparisons. Weather Forecast 31(2):371–394
NEPA (2013) Afghanistan initial National communication to the United Nations frameworkconvention on climate change. Available at: https://unfccc.int/resource/docs/natc/afgnc1.pdf
Nie W, Zaitchik BF, Rodell M, Kumar SV, Anderson MC, Hain C (2018) Groundwaterwithdrawals under drought: reconciling GRACE and land surface models in the United Stateshigh plains aquifer. Water Resour Res 54(8):5282–5299
Parvin GA, Fujita K, Matsuyama A, Shaw R, Sakamoto M (2015) Climate change, flood, foodsecurity and human health: cross-cutting issues in Bangladesh. In: Food security and riskreduction in Bangladesh. Springer, pp 235–254
PMD (2008) National drought monitoring center, 14th session of Regional Association II (Asia),Tashkent, Uzbekistan, 5–11 Dec 2008
Prasad S (2015) Droughts in Nepal. In: Interactive workshop—South Asia drought monitoringsystem (SADMS), Global wather partnership—South Asia, Dhaka, Bangladesh
Pulwarty RS, Verdin, J (2013) Crafting early warning information systems: the case of drought.Measuring vulnerability to natural hazards: towards disaster resilient societies, 124–147
Qamer FM, Krupnik TJ, Pandey PR, Ahmad B (eds) (2019a) Resource book: earth observationand climate data analysis for agricultural drought monitoring in South Asia. South AsianAssociation for Regional Cooperation (SAARC) Agriculture Centre (SAC), Dhaka,Bangladesh
Qamer FM, Tadesse T, Matin M, Ellenburg WL, Zaitchik B (2019b) Earth observation and climateservices for food security and agricultural decision making in South and Southeast Asia. BullAm Meteorol Soc 100(6):ES171–ES174
Rienecker MM, Suarez MJ, Todling R, Bacmeister J, Takacs L, Liu HC, …, Stajner I (2008) TheGEOS-5 data assimilation system: documentation of versions 5.0. 1, 5.1. 0, and 5.2. 0
Sarkar P, Islam M, Biswas S, Hossain M, Hassan S (2010) Validation of DRAS model forirrigation of wheat. Bangladesh J Agric Res 35(3)
Spinoni J, Barbosa P, De Jager A, McCormick N, Naumann G, Vogt JV, Mazzeschi M (2019) Anew global database of meteorological drought events from 1951 to 2016. J Hydrol Reg Stud22:100593. https://edo.jrc.ec.europa.eu/gdo/php/index.php?id=2001
Steinemann AC, Cavalcanti LF (2006) Developing multiple indicators and triggers for droughtplans. J Water Resour Plan Manage 132(3):164–174
Tadesse et al (2018) Improving national and regional drought early warning systems in the greaterhorn of Africa. Bull Am Meteorol Soc ES135–ES138
UNISDR (2006) Developing early warning systems—a checklistUSAID (2014) Feasibility study on agricultural index insurance in Nepal: preliminary final report.
https://basis.ucdavis.edu/sites/g/files/dgvnsk466/files/2017-02/2015-10-28-Draft-Final-Report_Nepal_-small-1.pdf
Wall and Hayes (2016) Drought and health in the context of public engagement. In: Extremeweather, health, and communities, pp 219–244
Wilhite DA, Glantz MH (1985) Understanding the drought phenomenon: the role of definitions.Water Int 10:111–120
WMO, World Meteorological Organization (2006) Drought monitoring and early warning:Concepts, progress and future challenges. WMO-No. 1006
WMO and GWP (2016) Handbook of drought indicators and indices (M. Svoboda and B.A.Fuchs). Integrated drought management programme (IDMP), Integrated Drought ManagementTools and Guidelines Series 2, Geneva
World Bank (2009) Agricultural insurance feasibility study for Nepal. Global Facility for DisasterReduction and Recovery (GFDRR), South Asia
Xia Y, Hao Z, Shi C, Li Y, Meng J, Xu T, Zhang B (2019) Regional and global land dataassimilation systems: Innovations, challenges, and prospects. J Meteorol Res 33(2):159–189
4 A Regional Drought Monitoring and Outlook System for South Asia 77

Yifan Z, Zaitchik BF, Kumar SV, Arsenault KR, Matin MA, Qamer F, Zamora RA, Shakya K(2020) Developing a hydrological monitoring and sub-seasonal to seasonal forecasting systemfor South and Southeast Asian river basins. Hydrol Earth Syst Sci Open J
Zambrano F, Vrieling A, Nelson A, Meroni M, Tadesse T (2018) Prediction of drought-inducedreduction of agricultural productivity in Chile from MODIS, rainfall estimates, and climateoscillation indices. Remote Sens Environ 219:15–30. https://doi.org/10.1016/j.rse.2018.10.006
Open Access This chapter is licensed under the terms of the Creative Commons Attribution 4.0International License (http://creativecommons.org/licenses/by/4.0/), which permits use, sharing,adaptation, distribution and reproduction in any medium or format, as long as you give appropriatecredit to the original author(s) and the source, provide a link to the Creative Commons license andindicate if changes were made.The images or other third party material in this chapter are included in the chapter’s Creative
Commons license, unless indicated otherwise in a credit line to the material. If material is notincluded in the chapter’s Creative Commons license and your intended use is not permitted bystatutory regulation or exceeds the permitted use, you will need to obtain permission directly fromthe copyright holder.
78 F. M. Qamer et al.
Chapter 5In-Season Crop-Area Mappingfor Wheat and Rice in Afghanistanand Bangladesh
Varun Tiwari, Faisal Mueen Qamer, Mir A. Matin,Walter Lee Ellenburg, Waheedullah Yousafi, and Mustafa Kamal
5.1 Introduction
Cereal grains are the most commonly grown crops in the world. Wheat and rice areimportant commodities which contribute to 50% of the world’s food-calorie intake(McKevith 2004). These two cereals are critical to food security in the developingregions. In this context, crop-mapping services can be used for detailed monitoringof the cultivated areas; it can also provide the area statistics of specific crops andthe data on their intensity across the landscape. This mapping process is alsovaluable for government agencies since it provides them with critical informationthat can be used to manage their stocks (for imports and exports). This chapterdwells on a crop-mapping service developed under the SERVIR-HKH program. Inthis regard, the needs assessment was carried out with the assistance of the gov-ernments of Bangladesh and Afghanistan through a consultation workshop. Wheatmapping in Afghanistan and rice mapping in Bangladesh were the top priorities forthe respective governments. Here, we discuss two particular mapping exercises thatwere undertaken in these two countries: wheat mapping in Afghanistan at a nationallevel and the mapping of Boro rice in selected districts of Bangladesh.
V. Tiwari (&) � F. M. Qamer � M. A. Matin � W. YousafiInternational Centre for Integrated Mountain Development, Kathmandu, Nepale-mail: [email protected]
W. L. EllenburgSERVIR Science Coordination Office, Huntsville, AL, USA
M. KamalInternational Maize and Wheat Improvement Center, Dhaka, Bangladesh
© The Author(s) 2021B. Bajracharya et al. (eds.), Earth Observation Science and Applications for RiskReduction and Enhanced Resilience in Hindu Kush Himalaya Region,https://doi.org/10.1007/978-3-030-73569-2_5
79
5.1.1 Cereal Crop Production and Food Insecurity
In-season mapping of major crops is important for early assessment of productionand to know about any potential threats to food security. As all of us know, SouthAsia is the most populated part of the world, wherein recent years, both industri-alization and urbanization have grown by leaps and bounds. This has created animbalance in food supply and demand in the region. While it is true that more landcame under agricultural activity from the 1960s to 2000s, resulting in an increase infood production (Ramankutty et al. 2018). In recent times, it has been observedthat the production levels have gone down because, increasingly, agricultural landis housing urban infrastructure. Another reason for the dip in food production is thatconventional methods are still being used for agricultural land management. Thenthere is the factor of monsoonal variability due to changing climatic conditionswhich has also affected crop production. The other factors are poor quality of seeds,small farms that have limited or no access to technology, and natural disasters in theform of floods and even earthquakes.
The decrease in domestic crop production and the yearly fluctuations in the samepose serious threats to the food security situation in the HKH region. Thus, swiftand accurate estimation of crop production becomes vital in providing a baseline forformulation and implementation of policy related to agriculture management at thenational level. This also plays a significant role in the planning and decision-makingprocesses related to food and social security (Demeke et al. 2016).
5.1.2 Crop Dynamics in Afghanistan and Bangladesh
Figure 5.1a,b shows the bioclimatic zones—a proxy for agro-ecological zones(AEZs)—of Afghanistan and Bangladesh (Balasubramanian 2011). AEZs are areaswith similar climates, vegetation, and soils. Some examples are deserts, savannas,tropical forests, steppes, temperate forests, and cold regions. These zones aredeveloped utilizing different parameters such as elevation, climatic conditions, andsoil and vegetation types. Agricultural activity is closely related to the conditions ofthese zones. The sowing, growing, and harvest time of crops are dependent on theconditions and varies from one AEZ to another. Broadly, there are five AEZs inAfghanistan and two in Bangladesh. This is mainly because of the diverse topog-raphy and climatology in Afghanistan as compared to those in Bangladesh.However, at the micro-level, there may be many AEZs because of diverse geog-raphy, with thousands of microclimates and micro-watersheds, as conditions fre-quently change from one valley to the next, within a fairly short distance.
The phenology of a crop is referred to as the periodic life cycle events of plantgrowth and how these are influenced by seasonal and inter-annual variations inclimate (Martínez and Gilabert 2009). Crop phenology plays an important role inunderstanding the dynamic vegetation-growth patterns in a crop (Fisher and
80 V. Tiwari et al.
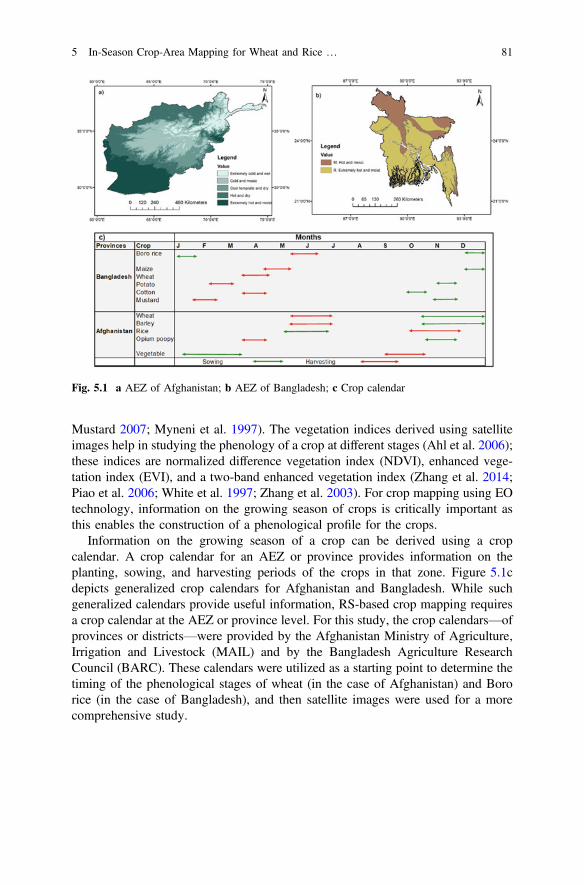
Mustard 2007; Myneni et al. 1997). The vegetation indices derived using satelliteimages help in studying the phenology of a crop at different stages (Ahl et al. 2006);these indices are normalized difference vegetation index (NDVI), enhanced vege-tation index (EVI), and a two-band enhanced vegetation index (Zhang et al. 2014;Piao et al. 2006; White et al. 1997; Zhang et al. 2003). For crop mapping using EOtechnology, information on the growing season of crops is critically important asthis enables the construction of a phenological profile for the crops.
Information on the growing season of a crop can be derived using a cropcalendar. A crop calendar for an AEZ or province provides information on theplanting, sowing, and harvesting periods of the crops in that zone. Figure 5.1cdepicts generalized crop calendars for Afghanistan and Bangladesh. While suchgeneralized calendars provide useful information, RS-based crop mapping requiresa crop calendar at the AEZ or province level. For this study, the crop calendars—ofprovinces or districts—were provided by the Afghanistan Ministry of Agriculture,Irrigation and Livestock (MAIL) and by the Bangladesh Agriculture ResearchCouncil (BARC). These calendars were utilized as a starting point to determine thetiming of the phenological stages of wheat (in the case of Afghanistan) and Bororice (in the case of Bangladesh), and then satellite images were used for a morecomprehensive study.
Fig. 5.1 a AEZ of Afghanistan; b AEZ of Bangladesh; c Crop calendar
5 In-Season Crop-Area Mapping for Wheat and Rice … 81

5.1.3 Wheat Crop in Afghanistan and Recent Effortsin Mapping
The agricultural sector plays a significant role in Afghanistan, providing revenue fornearly three-quarter of the country’s population. It contributes nearly 28% to thecountry’s GDP (United Nations 2013). Wheat is the primary crop and food ofAfghanistan and is grown in every province of the country; and mostly, it is grownfor self-consumption. That said, its production has not yet been able to meet theinternal demand. Figure 5.2 depicts the import of wheat to Afghanistan during1960–2019. It can be observed that wheat imports have consistently increased in thepast few years. In recent times, about 1 million ton (equivalent to 25% of theinternal demand) of wheat have been imported annually to meet the internalrequirement (Martínez and Gilabert 2009), making Afghanistan one of the leadingimporters of wheat in the world (Persaud 2013).
The government utilizes the statistics on wheat—about the areas where it isgrown and how much is produced—to assess the current demand and also forprocurement in case of shortages. However, limited work has been done till now inthe case of wheat-area estimation in Afghanistan. While MAIL carries out yearlyqualitative assessments of wheat-sown areas using ground sample data and with thehelp of some conventional RS techniques based on interpretation of satellite images
Fig. 5.2 Wheat import data of Afghanistan. Source USDA
82 V. Tiwari et al.
(FAO 2016), United States Department of Agriculture (USDA) has made somequalitative assessments using NDVI anomalies (Baker 2015; Pervez et al. 2014).
Recently, donor agencies such as United States Agency for InternationalDevelopment (USAID) have shown interest in food security management inAfghanistan. They have started projects like grain research and innovation(GRAIN) which primarily supports wheat-related research in order to boost pro-duction; the project also works on resilience building and diversification. Then,there is the Kandahar food zone (KFZ) project which focuses on strengthening rurallivelihoods (USAID 2017). However, currently, there is no operational frameworkin Afghanistan that can provide a rapid assessment of wheat-sown areas essential interms of food security management.
5.1.4 Rice Crop in Bangladesh and Recent Effortsin Mapping
The economic growth of Bangladesh depends highly on agriculture. Two-third ofthe labor forces in the country are either directly or indirectly employed in theagricultural sector (Raihan 2011). Moreover, nearly 80% of the population belongto rural areas which directly rely on the agricultural sector for their livelihood. And,agricultural production accounts for one-third of the country’s GDP and 32% of itsvalue of exports (Rahman and Hossain 2014).
Rice is the most valuable commodity in the economy of Bangladesh. It is themost dominating cereal crop, making Bangladesh the world’s sixth-largest producerof rice. This also makes Bangladesh one of the top exporters of rice in the world.However, it is becoming increasingly evident that the production of rice can beextremely vulnerable to the impacts of climate change (Aryal et al. 2019). Riceproduction has been adversely influenced by unpredictable rainfall, temperatureextremes, increased salinity, droughts, floods, river erosion, and tropical storms.Moreover, the prediction is that these events would be highly repetitive andintensify in the future (Sivakumar and Stefanski 2010), which could lead to adecrease in crop yields by up to 30%, thereby posing a very high risk to foodsecurity. Figure 5.3 shows the uneven trends in rice exports which stronglyexplains the variability in the production of rice. Therefore, there is a strong needfor an in-season assessment of the rice-crop area and yields for the formulation andimplementation of policy-related rice exports and food security management.
Numerous works have been carried out for rice-area estimation, using both RS aswell as the conventional field-based sampling approaches. The Bangladesh bureauof statistics (BBS) is the agency that is in charge of rice-area mapping. It utilizesconventional methods such as crop-cut surveys and statistical approaches(“Yearbook of Agricultural Statistics-2017” 2018). This approach is cumbersomeand inefficient as it requires manual field data collection, rich sampling, and sig-nificant post processing before releasing any reliable statistics on crop area. But that
5 In-Season Crop-Area Mapping for Wheat and Rice … 83
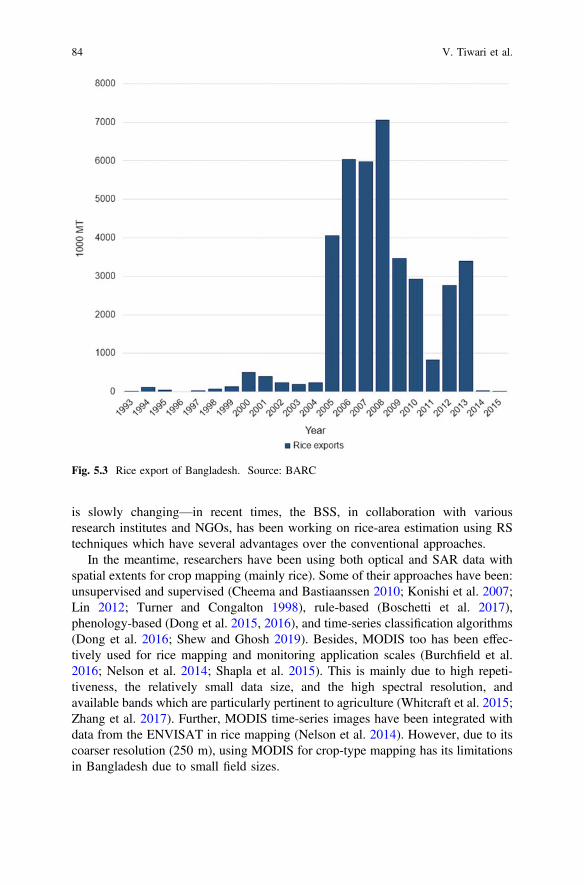
is slowly changing—in recent times, the BSS, in collaboration with variousresearch institutes and NGOs, has been working on rice-area estimation using RStechniques which have several advantages over the conventional approaches.
In the meantime, researchers have been using both optical and SAR data withspatial extents for crop mapping (mainly rice). Some of their approaches have been:unsupervised and supervised (Cheema and Bastiaanssen 2010; Konishi et al. 2007;Lin 2012; Turner and Congalton 1998), rule-based (Boschetti et al. 2017),phenology-based (Dong et al. 2015, 2016), and time-series classification algorithms(Dong et al. 2016; Shew and Ghosh 2019). Besides, MODIS too has been effec-tively used for rice mapping and monitoring application scales (Burchfield et al.2016; Nelson et al. 2014; Shapla et al. 2015). This is mainly due to high repeti-tiveness, the relatively small data size, and the high spectral resolution, andavailable bands which are particularly pertinent to agriculture (Whitcraft et al. 2015;Zhang et al. 2017). Further, MODIS time-series images have been integrated withdata from the ENVISAT in rice mapping (Nelson et al. 2014). However, due to itscoarser resolution (250 m), using MODIS for crop-type mapping has its limitationsin Bangladesh due to small field sizes.
Fig. 5.3 Rice export of Bangladesh. Source: BARC
84 V. Tiwari et al.
Bangladesh’s SPARRSO has also attempted to use RS for rice monitoring usingMODIS data and the AI-based semi-automatic approach (Shew and Ghosh 2019;Rahman and Hossain 2014; Begum and Nessa 2013). Besides, the time-seriesseasonal maximum value NDVI composites from MODIS data were used forclassifying the rice fields in Bangladesh (Gumma 2011). In 2014, Nelson et al.attempted to integrate SAR and optical data for rice-crop mapping. They usedMODIS and ENVISAT, as also phenology, to map the rice fields in Bangladesh.However, they have not yet reported on the achieved accuracy. Earlier, in 2013,multi-date SPOT images and ISODATA image-classification techniques had beenused for rice mapping (More and Manjunath (2013)). Change detection techniquestoo have been used in Bangladesh—to assess the surplus or deficiency in ricecultivation—based on a phenological analysis of MODIS data (More andManjunath 2013; Shapla et al. 2015).
Some of the studies have also taken advantage of the high-resolution SAR andoptical data, along with cloud-computing techniques like GEE, for mapping dif-ferent crops. Recently, Singha et al. (2019) used the high-resolution SAR Sentinel-1and MODIS data on the GEE platform for mapping rice in Bangladesh, and theyreported more than 90% accuracy. Similarly, Shew and Ghosh (2019) utilized EVIand the normalized difference fraction index (NDFI) derived from the landsatarchive on the GEE platform for mapping rice in the country. These approachesfocus more on commission error—i.e., if a pixel in an image is classified as rice, butit is not—and less on omission error, i.e., if a pixel in an image is non-rice, but isclassified as rice.
5.1.5 Global RS-Based Crop-Mapping Techniques
Globally, several researchers have developed methods for crop-type mapping usingdifferent RS techniques. These techniques can be classified as those based on:sensors—optical or SAR (Inglada et al. 2015), the resolution of satellite data(Wardlow and Egbert 2010), and threshold and classification.
The remote sensing data sets, both optical and SAR, utilized time-series NDVIprofiles for identification of seasonal thresholds, which is utilized for classifyingdifferent crop types. The acquisition time of the image plays a major role inidentification and classification of different crop types. The information on lifecycle, i.e., sowing, growing, and harvesting time of any crop is obtained by con-sulting the crop calendar. Although time-series NDVI thresholding approachesrequire fewer number of samples from the ground, they enable high accuracy eventhough they are unable to classify crops with similar phenological characteristics(with the same sowing, peak, and harvest time).
Alternatively, machine-learning classification algorithms, such as random forest(RF), support vector machine (SVM), and artificial neural network (ANN) require asystematic sampling approach and an ample amount of accurate ground samples fortraining the classification model (Tatsumi et al. 2015; Camps-Valls et al. 2003;
5 In-Season Crop-Area Mapping for Wheat and Rice … 85
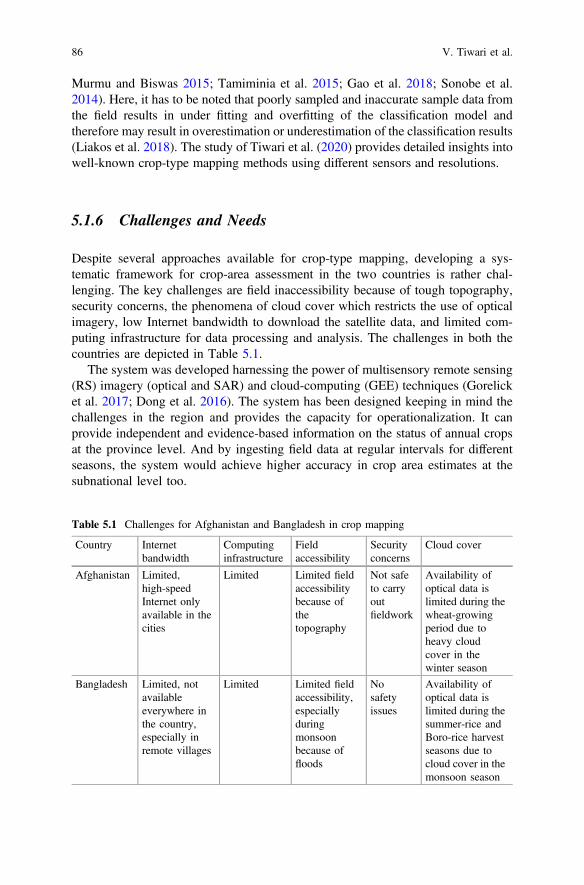
Murmu and Biswas 2015; Tamiminia et al. 2015; Gao et al. 2018; Sonobe et al.2014). Here, it has to be noted that poorly sampled and inaccurate sample data fromthe field results in under fitting and overfitting of the classification model andtherefore may result in overestimation or underestimation of the classification results(Liakos et al. 2018). The study of Tiwari et al. (2020) provides detailed insights intowell-known crop-type mapping methods using different sensors and resolutions.
5.1.6 Challenges and Needs
Despite several approaches available for crop-type mapping, developing a sys-tematic framework for crop-area assessment in the two countries is rather chal-lenging. The key challenges are field inaccessibility because of tough topography,security concerns, the phenomena of cloud cover which restricts the use of opticalimagery, low Internet bandwidth to download the satellite data, and limited com-puting infrastructure for data processing and analysis. The challenges in both thecountries are depicted in Table 5.1.
The system was developed harnessing the power of multisensory remote sensing(RS) imagery (optical and SAR) and cloud-computing (GEE) techniques (Gorelicket al. 2017; Dong et al. 2016). The system has been designed keeping in mind thechallenges in the region and provides the capacity for operationalization. It canprovide independent and evidence-based information on the status of annual cropsat the province level. And by ingesting field data at regular intervals for differentseasons, the system would achieve higher accuracy in crop area estimates at thesubnational level too.
Table 5.1 Challenges for Afghanistan and Bangladesh in crop mapping
Country Internetbandwidth
Computinginfrastructure
Fieldaccessibility
Securityconcerns
Cloud cover
Afghanistan Limited,high-speedInternet onlyavailable in thecities
Limited Limited fieldaccessibilitybecause ofthetopography
Not safeto carryoutfieldwork
Availability ofoptical data islimited during thewheat-growingperiod due toheavy cloudcover in thewinter season
Bangladesh Limited, notavailableeverywhere inthe country,especially inremote villages
Limited Limited fieldaccessibility,especiallyduringmonsoonbecause offloods
Nosafetyissues
Availability ofoptical data islimited during thesummer-rice andBoro-rice harvestseasons due tocloud cover in themonsoon season
86 V. Tiwari et al.

5.2 Setting up Crop Interpretation Applicationsand Operation
The workflow for in-season crop mapping that is being implemented by SERVIR isshown in Fig. 5.4. Broadly, the methodology has six major components. The firststep is reference data preparation. This involves the collection of ground samplepoints and quality check, after which the reference data is prepared for training andvalidation. In the second step, the agriculture mask (representation of agriculturearea) is delineated which is used in the further stages. After obtaining the
Fig. 5.4 Methodology of crop mapping
5 In-Season Crop-Area Mapping for Wheat and Rice … 87
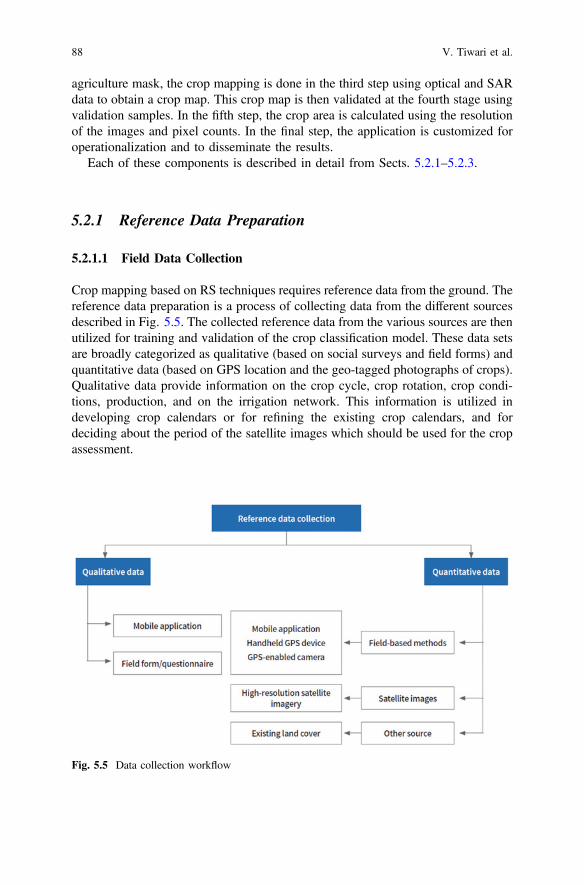
agriculture mask, the crop mapping is done in the third step using optical and SARdata to obtain a crop map. This crop map is then validated at the fourth stage usingvalidation samples. In the fifth step, the crop area is calculated using the resolutionof the images and pixel counts. In the final step, the application is customized foroperationalization and to disseminate the results.
Each of these components is described in detail from Sects. 5.2.1–5.2.3.
5.2.1 Reference Data Preparation
5.2.1.1 Field Data Collection
Crop mapping based on RS techniques requires reference data from the ground. Thereference data preparation is a process of collecting data from the different sourcesdescribed in Fig. 5.5. The collected reference data from the various sources are thenutilized for training and validation of the crop classification model. These data setsare broadly categorized as qualitative (based on social surveys and field forms) andquantitative data (based on GPS location and the geo-tagged photographs of crops).Qualitative data provide information on the crop cycle, crop rotation, crop condi-tions, production, and on the irrigation network. This information is utilized indeveloping crop calendars or for refining the existing crop calendars, and fordeciding about the period of the satellite images which should be used for the cropassessment.
Fig. 5.5 Data collection workflow
88 V. Tiwari et al.

In quantitative data collection, the GPS locations and multidirectional pho-tographs of the crops are captured which are then utilized in understanding the cropdynamics and in training and validating the classification model for crop mapping.Depending on the type of the data, these data sets are collected using the differentdata collection platforms described in Fig. 5.5, such as mobile applications,handheld GPS, GPS-enabled camera, high-resolution satellite images, and existingland-cover maps.
Figure 5.6a,b shows the reference data collected from different sources inAfghanistan and Bangladesh using a random sampling approach. In Afghanistan,the quantitative reference data were collected using a field-based method(GPS-enabled camera), high-resolution satellite images (Pleiades and Google Earthimages), and the existing food and agriculture organization (FAO) land-cover data(FAO 2010). The qualitative data were collected using field forms/questionnairesprepared by professionals from MAIL. In Bangladesh, both quantitative andquantitative reference data were collected using a mobile application (Geo-ODK)by professionals from the International Maize and Wheat Improvement Center(CIMMYT), BARC, and ICIMOD.
5.2.1.2 Data Cleaning and Preparation
The collected field data were then subjected to a quality check. This was becausesome of the samples were not taken from the middle of the crop field due toinaccessibility. So, the reference points collected from the corner of the crop fieldwere then adjusted and moved inside the fields to make them useful for the trainingand validation of the models. The judgment was made on three criteria: thedirection and orientation of the field photographs, the phenological characteristicsof the crop, and the visual interpretations through high-resolution Google Earth
Fig. 5.6 Field data collection—a Afghanistan. b Bangladesh
5 In-Season Crop-Area Mapping for Wheat and Rice … 89
images. The cleaned reference points were then merged and divided randomly intotwo categories—for training and validation; while 70% of the samples were usedfor training, the remaining 30% were utilized in the validation process.
5.2.2 Delineation of Agriculture Mask
For crop-area mapping, the delineation of agriculture areas is important, so as toconfine the identification of specific crops within an agriculture mask. There are twoways of delineating an agriculture mask: by the existing land cover and by derivingit using optical time-series images. In the case of Afghanistan, the agriculture areawas delineated using the existing FAO land-cover data (FAO 2010) and byextracting the area of agricultural land from it. Whereas, in the case of Bangladesh,the agricultural land extent was delineated by performing the random forest(RF) classification using ground reference points on time-series NDVI imagesderived from optical (Sentinel-2) images (from January 2017 to December 2018).The agriculture mask was delineated for two years (2017 and 2018) and combinedto obtain the maximum agriculture mask.
5.2.3 Crop-Area Mapping
In RS-based crop mapping, two things are important and must be considered beforeproceeding to mapping: knowledge of the crop-growing season and selection of thedata set (optical or SAR). The knowledge of the growing season of the target crophelps in deciding the time period for acquisition of satellite data which eventuallyhelps in reconstructing the crop phenology through time-series NDVI (refer toSect. 1.2). Phenology is measured commonly by the onset of greening, peakdevelopment during the growing period, the onset of senescence, and the length ofthe growing season (Hudson and Keatley 2010). The selection of the data setcompletely relies on cloud cover. Sometimes, despite using high-temporal opticalsatellite data sets (e.g., Sentinel-2), the crops cannot be separated using the opticaldata sets. This is because the intermixing/overlapping of NDVI (crop phenology)values with the limited cloud-free images makes it difficult to select the appropriateseasonal thresholds (sowing, peak, harvest).
Alternatively, SAR sensors have the unique capability to penetrate clouds andcollect during all weather and are also sensitive to plant structure. However,SAR-based classification alone would require much more sample data on all thecrops. Also, SAR is incapable of capturing the chlorophyll content present in thecrops which is directly proportional to the growing stage of the crops. Therefore,SAR cannot alone be used for crop identification in case of limited availability ofsample points. However, a crop map (developed from optical data) can be refinedusing SAR data under the following conditions:
90 V. Tiwari et al.

• SAR data should have consistent time series in terms of incidence angle andshould have a wide swath in mapping different crops (Inglada et al. 2016)
• The data should be preprocessed which entail: orbital file correction; thermalnoise removal; terrain correction; and removal of speckle noise
5.2.3.1 Wheat-Area Mapping in Afghanistan
Wheat mapping (both for irrigated and rainfed crops) in Afghanistan was carriedout at the district/provincial level in order to capture the phenological response ofthe crop. For this, time-series Sentinel-1&2 images were used. The mapping wasdone in two steps. At first, NDVI thresholds were determined by analyzing the fielddata for each province to separate the wheat area from other crops using Sentinel-2(optical) imagery. Once the wheat areas were separated, Sentinel-1 (SAR) imagerywas used to refine the estimated wheat area through an RF classifier. Then, afterconsulting a crop calendar, the time-series Sentinel-2A Level 1-C (top-of-atmosphere) satellite images with less than 30% cloud cover (from November2016 to July 2017) were fetched. These images were preprocessed and masked withthe agriculture mask (Sect. 5.2.2). Due to the cloud cover during the wheat-growingcycle, the seasonal NDVI median composites were generated for the sowing, peak,and harvest seasons of the wheat crop. Figure 5.7a,b shows the growth pattern ofwheat and other crops for the Laghman and Helmand provinces of Afghanistan.After examining the growth pattern of different crops, it was found that thespatio-temporal (time-series NDVI) signal and growth pattern of vineyards arecompletely different from the wheat crop cycle. The NDVI values of orchards werefound to be higher when compared to wheat in peak and harvest times. The NDVIresponse from vegetables varied a lot, but the values were generally lower thanthose of wheat during the peak and harvest seasons. A high degree of overlapbetween the NDVI values of opium poppy and wheat was also observed during thesowing period. As opium poppy has a shorter cropping season, a separation of the
Fig. 5.7 Phonological characteristics of crops in the provinces of a Laghman. b Helmand inAfghanistan
5 In-Season Crop-Area Mapping for Wheat and Rice … 91

former with barley would have been possible if cloud-free monthly images couldhave been obtained. Figure 5.7b shows the NDVI characteristics of opium poppy inHelmand which shows higher separability from wheat during the sowing and peakseasons.
The rule for defining the threshold for separating wheat from other crops is givenin Eqs. 5.1–5.3.
Minimumof NDVIwheat samples\Wheatsowing �Maximumof NDVIwheat samples
ð5:1Þ
Wheatpeak �ðMinimumof NDVIwheat samplesÞ ð5:2Þ
Minimumof NDVIwheat samples\Wheatharvest �Maximumof NDVIwheat samples
ð5:3Þ
In general, the NDVI seasonal composites were useful to distinguish wheat fromorchards, vineyards, and some vegetables. It was also observed that much moreseparation between these crops could be achieved when combining data sets fromthe sowing, peak, and harvest times rather than using the sowing or peak timesalone. However, a significant overlap in NDVI was still observed between wheat,opium poppy, and barley while using the optical image composites.
Therefore, in the second step, these crops (opium poppy and barley) wereseparated from wheat using Sentinel-1 (SAR) time-series data. These time-seriesSentinel-1 data sets had been preprocessed by orbital file correction, thermal, andspeckle noise removal, as well as terrain correction. Monthly median compositeswere also developed for the entire wheat-crop cycle (i.e., from sowing till har-vesting). After performing analysis on Sentinel-1 SAR data, it was observed thatdifferent crops had different and unique response patterns across the differentgrowth phases of wheat. However, the variability of responses showed overlaps andmade it difficult for threshold-based separation (Fig. 5.8a,b). Therefore, an RFclassification technique was performed on time-series Sentinel-1 data using training
Fig. 5.8 Phenological characteristics observed using Sentinel-1 SAR data in a Laghman.b Helmand provinces in Afghanistan
92 V. Tiwari et al.

sample points to separate the wheat from the other crops. The RF classification wasapplied within the classified mask generated from the optical image analysis. Thisstep was applied only after the harvest season.
5.2.3.2 Boro-Rice Mapping in Bangladesh
Bangladesh has a different crop calendar for Boro rice (Islam and Hossain 2012)since it demonstrates wide variability in its growing seasons across the entirelandscape. Therefore, the mapping of Boro rice was done at the district level tocapture the unique phenological responses, region-wise. Time-series Sentinel-1 and-2 (optical and SAR) images were used for mapping Boro rice in three districts—Rangpur, Dinajpur, and Barisal. Because of the availability of an adequate numberof randomly collected samples from the field, time-series Sentinel-1 images wereutilized in the first step followed by time-series Sentinel-2 data in the second step forrefinement of the Boro-rice map. Firstly, the time-series Sentinel-1 images fromNovember 2018 to May 2019 were collected. After that, the images were maskedusing a delineated agriculture mask (Sect. 5.2.2). Sentinel-1 has two bands (VV andVH); therefore, to test the most suitable band for Boro-rice mapping, Sentinel-1images were classified using training samples from different crops. Three combi-nations were tested (VV, VH, and VV + VH) for the classification using RF clas-sifiers for mapping Boro rice and other crops. The highest accuracy was observedwhile using cross-polarization data sets (VH)—an accuracy of 92.10%; this wasfollowed by VV + VH (86.48%) and VV (71.05%). The backscattered responsefrom VH band was also examined (Fig. 5.9a). Different backscattered patterns wereobserved for different crops because of the sensitivity of the backscatter toward thecrop structure. Since the highest accuracy was achieved using VH, the classificationwas performed using Sentinel-1 (VH) band to classify Boro rice and other crops.
Fig. 5.9 Phenological characteristic of crops determined by using a Sentinel-2 (Optical) data.b Sentinel-1 (SAR) data
5 In-Season Crop-Area Mapping for Wheat and Rice … 93

In step two, the Sentinel-2 (optical) data were used to refine the results obtainedin step one. Figure 5.9b shows phenological characteristics of different crops, i.e.,Boro rice, maize, wheat, and potato using Sentinel-2 data. By examining thephenological characteristics of these major crops, it can be interpreted that potato’ssowing, peak, and harvest seasons differ completely from other crops, while Bororice, wheat, and maize have different length of the season and slightly differentsowing and harvest times. Also, the cropping cycle of these crops (maize, Boro rice,and wheat) can vary because of late sowing or early harvest and sowing. Theclassification results obtained using Sentinel-1 data may have high accuracy, but itmay have overestimation in terms of area. This is mainly because of the dependenceof the RF classifier on an ideal number of ground sample points (of different crops)for training. This might result in overfitting or underfitting of the classifier andambiguity in the estimated area. Therefore, to further refine the results, Sentinel-2time-series images were utilized using the phenological and threshold-basedapproach discussed in Sect. 5.2.3.1. Sentinel-2 images with less than 20% cloudcover (from November 2018 to June 2019) were utilized. The NDVI thresholdswere derived using Eqs. 5.1–5.3 and were applied on the Boro-rice map derivedfrom the Sentinel-1 images for further refinement of the result.
5.3 Validation and Area Assessment
The validation and area assessment of the maps were done using the standardRS-based accuracy assessment technique. The accuracy assessment was conductedin three ways: the results were checked by comparing with various ancillary data toidentify gross errors, by visual interpretation, and by quantitative accuracyassessment. A confusion matrix/error matrix was also generated, and statisticalaccuracy assessment primitives such as the producer’s and user’s accuracy,including the Kappa coefficient, were utilized in understanding the distribution oferrors. The confusion matrix for Afghanistan and Bangladesh for wheat and Bororice, respectively, is depicted in Tables 5.2 and 5.3.
In RS-based classification, the area for the class can be calculated by countingthe number of pixels in a particular class and resolution of the classifiedmap. Equation 5.4 (below) is generally used for estimating the crop area.
Crop area hað Þ ¼ Pixel countð Þ � resolution of the imageð Þ � resolution of the imageð Þ10; 000
ð5:4Þ
Figure 5.10a,b shows the distribution of wheat (in Afghanistan) and Boro rice(in Bangladesh), whereas Fig. 5.10c,d depicts the areas of wheat and rice,respectively.
94 V. Tiwari et al.

5.4 Service Delivery
5.4.1 Operationalization/Application Development
The dissemination of the final results for Afghanistan was done through thedevelopment of a web-based visualization system as depicted in Fig. 5.12. Such aweb-based visualization system is also planned for Bangladesh. The Afghanistanportal can be accessed via the following URL: http://geoapps.icimod.org/afwheat/.The wheat and Boro-rice mapping workflow was implemented in GEE using acustomized interface. The modules (https://code.earthengine.google.com/?accept_
Table 5.2 Accuracy assessment of Afghanistan
Class Non-wheat Irrigated wheat Total User’saccuracy (%)
Irrigated wheat
Non-wheat 1839 282 2121 86
Irrigated wheat 341 1388 1729 80
Total 2180 1670 3850
Producer’s accuracy (%) 84 83
Overall 83.8 (%)
AC 0.50
Kappa 0.67
Rainfed wheat
Non-wheat 710 59 769 92
Rainfed wheat 58 238 296 80
Total 768 297 1065
Producer’s accuracy (%) 92 80
Overall accuracy 89 (%)
AC 0.59
Kappa 0.77
Table 5.3 Accuracy assessment for Bangladesh
Class Boro rice Other crops Total User’s accuracy (%)
Boro Rice 609 18 627 97
Other crops 3 95 98 97
Total 612 113 725
Producer’s accuracy (%) 99 84
Overall 97 (%)
AC 0.75
K 0.88
5 In-Season Crop-Area Mapping for Wheat and Rice … 95
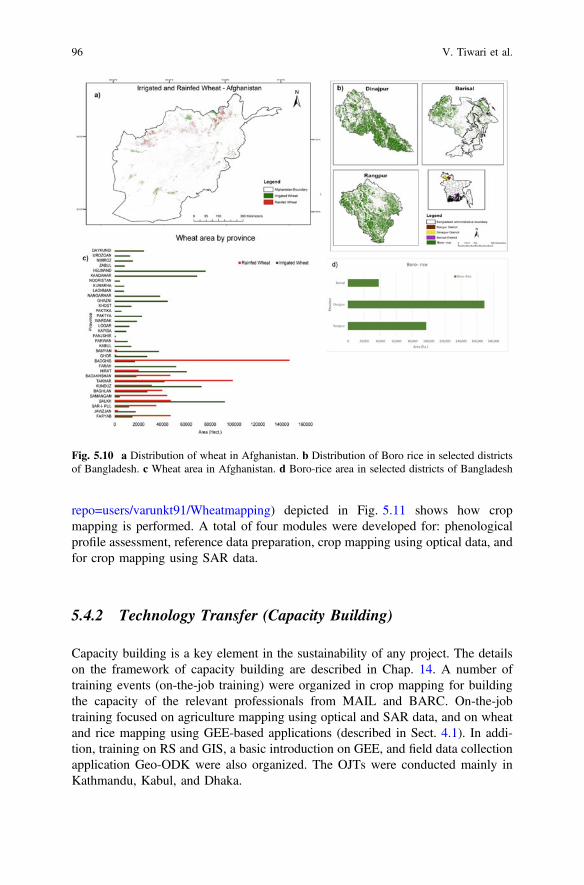
repo=users/varunkt91/Wheatmapping) depicted in Fig. 5.11 shows how cropmapping is performed. A total of four modules were developed for: phenologicalprofile assessment, reference data preparation, crop mapping using optical data, andfor crop mapping using SAR data.
5.4.2 Technology Transfer (Capacity Building)
Capacity building is a key element in the sustainability of any project. The detailson the framework of capacity building are described in Chap. 14. A number oftraining events (on-the-job training) were organized in crop mapping for buildingthe capacity of the relevant professionals from MAIL and BARC. On-the-jobtraining focused on agriculture mapping using optical and SAR data, and on wheatand rice mapping using GEE-based applications (described in Sect. 4.1). In addi-tion, training on RS and GIS, a basic introduction on GEE, and field data collectionapplication Geo-ODK were also organized. The OJTs were conducted mainly inKathmandu, Kabul, and Dhaka.
Fig. 5.10 a Distribution of wheat in Afghanistan. b Distribution of Boro rice in selected districtsof Bangladesh. c Wheat area in Afghanistan. d Boro-rice area in selected districts of Bangladesh
96 V. Tiwari et al.

5.5 Conclusions and Way Forward
In this chapter, a systematic and robust framework for mapping wheat (inAfghanistan) and Boro rice (in Bangladesh) has been explained. This frameworkhas good potential for operationalization to strengthen the food security manage-ment of both the countries. The overall framework was designed keeping in mindchallenges such as limited Internet bandwidth, scarcity of ground samples, andcloud-free optical images.
The system uses a multistep approach to provide area estimation as the wheatand Boro-rice season progresses in Afghanistan and Bangladesh, respectively.However, the methodology can also be utilized to map other varieties of rice such
Fig. 5.11 Customized GEE-based application for crop-area mapping
Fig. 5.12 A web-based visualization system for wheat in Afghanistan
5 In-Season Crop-Area Mapping for Wheat and Rice … 97
as Aman (spring rice) in Bangladesh if sample points are available for the springseason. In the first stage, time-series Sentinel-2 was used to map different cropsusing a phenology-based approach in different seasons. While in the second stage,time-series Sentinel-1 (SAR) data sets, along with the RF machine-learning clas-sification technique, were utilized to refine the result. The first estimation wasprovided during the peak season to give an early indication about the cultivatedareas of wheat and Boro rice. A more accurate estimation was provided immedi-ately after the harvest season. The entire workflow was automated in GEE con-sidering the low capacity and the need for timely estimation of the crop area.Meanwhile, capacity building activities—mainly in the area of crop mapping andmonitoring using GEE—in order to enhance the skills of the local staff in gov-ernment agencies are under way through the SERVIR initiative.
These two case studies from Afghanistan and Bangladesh are primarily aboutRS-based crop-area assessment. A standard RS-based method was utilized foraccuracy assessment which provided statistical exactitude based on the Kappacoefficient and primitives such as user and producer accuracy (Sect. 5.3). However,in remote sensing-based crop-area estimates can be adjusted by performing biasadjustment using ground-based area measurement. This can only be achieved byincorporating more robustly sampled ground truth data for different crop samples.Such a bias-adjusted area provides for a more robust insight into the mapped area ofany class of crop. The logistics and feasibility of acquisition of adequate sample datarequired for this method have to be ensured before deciding the use of such method.
References
Ahl DE, Gower ST, Burrows SN, Shabanov NV, Myneni RB, Knyazikhin Y (2006) Monitoringspring canopyphenology of a deciduous broadleaf forest using MODIS. Remote Sens Environ104(1):88–95. https://doi.org/10.1016/j.rse.2006.05.003
Aryal JP, Sapkota TB, Khurana R, Chhetri AK, Rahut DB, Jat ML (2019) Climate change andagriculture in South Asia: adaptation options in smallholder production systems. Environ DevSustain. https://doi.org/10.1007/s10668-019-00414-4
Baker W (2015) Wheat production above average but down from last year. United StatesDepartment of Agriculture, United States. https://ipad.fas.usda.gov/highlights/2015/07/Afghanistan/Index.htm
Balasubramanian A (2011) Classifying the bioclimatic zones. https://doi.org/10.13140/RG.2.2.32430.10562
Begum S, Nessa M (2013) Space technology for crop monitoring of Bangladesh 02(04):7Boschetti M, Busetto L, Manfron G, Laborte A, Asilo S, Pazhanivelan S, Nelson A (2017)
PhenoRice: a method for automatic extraction of spatio-temporal information on rice cropsusing satellite data time series. Remote Sens Environ 194(June):347–365. https://doi.org/10.1016/j.rse.2017.03.029
Burchfield E, Nay JJ, Gilligan J (2016) Application of machine learning to the prediction ofvegetation health. ISPRS—Int Arch Photogram Remote Sens Spat Inf Sci XLI-B2 (June):465–469. https://doi.org/10.5194/isprsarchives-XLI-B2-465-2016
98 V. Tiwari et al.
Camps-Valls G, Gómez-Chova L, Calpe-Maravilla J, Soria-Olivas E, Martín-Guerrero JD,Moreno J (2003) Support vector machines for crop classification using hyperspectral data. In:Perales FJ, Aurélio J, Campilho C, de la Blanca NP, Sanfeliu A (eds) Pattern recognition andimage analysis, vol 2652, pp 134–141. Springer, Berlin. http://link.springer.com/10.1007/978-3-540-44871-6_16
Cheema MJM, Bastiaanssen WGM (2010) Land use and land cover classification in the irrigatedindus basin using growth phenology information from satellite data to support watermanagement analysis. Agric Water Manag 97(10):1541–1552. https://doi.org/10.1016/j.agwat.2010.05.009
Demeke M, Kiermeier M, Sow M, Antonaci L (2016) Agriculture and food insecurity riskmanagement in Africa 92
Dong J, Xiao X, Kou W, Qin Y, Zhang G, Li L, Jin C, et al (2015) Tracking the dynamics ofpaddy rice planting area in 1986–2010 through time series landsat images and phenology-based algorithms. Remote Sens Environ 160(April):99–113. https://doi.org/10.1016/j.rse.2015.01.004
Dong J, Xiangming X, Menarguez AK, Zhang G, Qin Y, Thau D, Biradar C, Moore B (2016)Mapping paddy rice planting area in Northeastern Asia with landsat 8 images, phenology-based algorithm and google earth engine. Remote Sens Environ 185:142–154. https://doi.org/10.1016/j.rse.2016.02.016
FAO (2016) Afghanistan special report: pre-harvest assessment. https://reliefweb.int/sites/reliefweb.int/files/resources/2016%20Pre-Harvest_Assessment%20Report.pdf
FAO (2010) The islamic Republic of Afghanistan land cover Atlas 8Fisher JI, Mustard JF (2007) Cross-scalar satellite phenology from ground, landsat, and MODIS
data. Remote Sens Environ 109(3):261–273. https://doi.org/10.1016/j.rse.2007.01.004Gao Q, Zribi M, Escorihuela M, Baghdadi N, Segui P (2018) Irrigation mapping using sentinel-1
time series at field scale. Remote Sens 10(9):1495. https://doi.org/10.3390/rs10091495Gorelick N, Hancher M, Dixon M, Ilyushchenko S, Thau D, Moore R (2017) Google earth engine:
planetary-scale geospatial analysis for everyone. Remote Sens Environ 202:18–27. https://doi.org/10.1016/j.rse.2017.06.031
Gumma MK (2011) Mapping rice areas of South Asia using MODIS multitemporal data. J ApplRemote Sens 5(1): https://doi.org/10.1117/1.3619838
Hudson IL, Keatley MR (2010) Phenological research: methods for environmental and climatechange analysis. Dordrecht [The Netherlands]; Springer, New York
Inglada J, Vincent A, Arias M, Marais-Sicre C (2016) Improved early crop type identifica-tion by joint use of high temporal resolution SAR and optical image time series. Remote Sens8(5):362. https://doi.org/10.3390/rs8050362
Inglada J, Arias M, Tardy B, Hagolle O, Valero S, Morin D, Dedieu G (2015) Assessment of anoperational system for crop type map production using high temporal and spatial resolutionsatellite optical imagery. Remote Sens 7(9):12356–12379. https://doi.org/10.3390/rs70912356
Islam MM, Hossain E (2012) Crop diversification in Bangladesh: constraints and potentials 15Konishi T, Omatu S, Suga Y (2007) Extraction of rice-planted area using a self-organizing feature
map. Artif Life Robot 11(2):215–218. https://doi.org/10.1007/s10015-007-0431-2Liakos K, Busato P, Moshou D, Pearson S, Bochtis D (2018) Machine learning in agriculture: a
review. Sensors 18(8):2674. https://doi.org/10.3390/s18082674Lin ML (2012) Mapping paddy rice agriculture in a highly fragmented area using a geographic
information system object-based post classification process. J Appl Remote Sens 6(1): https://doi.org/10.1117/1.JRS.6.063526
Martínez B, Gilabert MA (2009) Vegetation dynamics from NDVI time series analysis using thewavelet transform. Remote Sens Environ 113(9):1823–1842. https://doi.org/10.1016/j.rse.2009.04.016
McKevith B (2004) Nutritional aspects of cereals. Nutr Bull 29(2):111–142. https://doi.org/10.1111/j.1467-3010.2004.00418.x
5 In-Season Crop-Area Mapping for Wheat and Rice … 99
https://reliefweb.int/sites/reliefweb.int/files/resources/2016%20Pre-Harvest_Assessment%20Report.pdf

More R, Manjunath KR (2013) Deducing rice crop dynamics and cultural types of Bangladeshusing geospatial techniques. J Indian Soc Remote Sens 41(3):597–607. https://doi.org/10.1007/s12524-012-0228-1
Murmu S, Biswas S (2015) Application of fuzzy logic and neural network in crop classification: areview. Aquat Procedia 4:1203–1210. https://doi.org/10.1016/j.aqpro.2015.02.153
Myneni RB, Keeling CD, Tucker CJ, Asrar G, Nemani RR (1997) Increased plant growth in thenorthern high latitudes from 1981 to 1991. Nature 386(6626):698–702. https://doi.org/10.1038/386698a0
Nelson A, Boschetti M, Manfron G, Holecz F, Collivignarelli F, Gatti L, Barbieri M, Villano L,Chandna P, Setiyono T (2014) Combining moderate-resolution time-series RS data from SARand optical sources for rice crop characterisation: examples from Bangladesh. In: Closson D,Holecz F, Pasquali P, Milisavljević N (eds) Land applications of radar remote sensing. InTech.https://doi.org/10.5772/57443
Persaud S (2013) Afghanistan’s wheat flour market: policies and prospects 36Pervez SMd, Budde M, Rowland J (2014) Mapping irrigated areas in Afghanistan over the past
decade using MODIS NDVI. Remote Sens Environ 149(June):155–165. https://doi.org/10.1016/j.rse.2014.04.008
Piao S, Fang J, Zhou L, Ciais P, Zhu B (2006) Variations in satellite-derived phenology in China’stemperate vegetation. Glob Change Biol 12(4):672–685. https://doi.org/10.1111/j.1365-2486.2006.01123.x
Rahman Z, Hossain E (2014) Role of agriculture in economic growth of Bangladesh: a VARapproach 7:24
Raihan S (2011) Economic reforms and agriculture in Bangladesh: assessment of impacts usingeconomy‐wide simulation models 56
Ramankutty N, Mehrabi Z, Waha K, Jarvis L, Kremen C, Herrero M, Rieseberg LH (2018) Trendsin global agricultural land use: implications for environmental health and food security. AnnuRev Plant Biol 69(1):789–815. https://doi.org/10.1146/annurev-arplant-042817-040256
Shapla T, Park J, Hongo C, Kuze H (2015) Change detection of rice cultivation in Bangladeshbased on the phenological analysis of MODIS data. Adv Remote Sens 04(04):319–329.https://doi.org/10.4236/ars.2015.44026
Shew AM, Ghosh A (2019) Identifying dry-season rice-planting patterns in Bangladesh using thelandsat archive. Remote Sens 11(10):1235. https://doi.org/10.3390/rs11101235
Singha M, Dong J, Zhang G, Xiao X (2019) High resolution paddy rice maps in cloud-proneBangladesh and Northeast India using sentinel-1 data. Sci Data 6(1):26. https://doi.org/10.1038/s41597-019-0036-3
Sivakumar MVK, Stefanski R (2010) Climate change in South Asia. In: Lal R, Mannava VK,Sivakumar SMA, Faiz AHM Rahman M, Islam KR (eds) Climate change and food security inSouth Asia, pp 13–30. Springer, Dordrecht, Netherlands. https://doi.org/10.1007/978-90-481-9516-9_2
Sonobe R, Tani H, Wang X, Kobayashi N, Shimamura H (2014) Random forest classification ofcrop type using multi-temporal TerraSAR-X dual-polarimetric data. Remote Sens Lett 5(2):157–164. https://doi.org/10.1080/2150704X.2014.889863
TamiminiaH, Homayouni S, Safari A (2015) Clustering of multi-temporal fully polarimetricL-band SAR data for agricultural land cover mapping. ISPRS—Int Arch Photogram RemoteSens Spat Inf Sci XL-1-W5 (December): 701–705. https://doi.org/10.5194/isprsarchives-XL-1-W5-701-2015
Tatsumi K, Yamashiki Y, Torres MAC, Taipe CLR (2015) Crop classification of upland fieldsusing random forest of time-series landsat 7 ETM + Data. Comput Electron Agric 115(July):171–179. https://doi.org/10.1016/j.compag.2015.05.001
Tiwari V, Matin MA, Qamer FM, Ellenburg WL, Vadrevu K, Rushi BR, Yusafi W (2020)Wheat area mapping in Afghanistan based on optical and SAR time-series images in googleearth engine cloud environment. Front Environ Sci Land Use Dyn 48 (in Press)
100 V. Tiwari et al.

Turner MD, Congalton RG (1998) Classification of multi-temporal SPOT-XS satellite data formapping rice fields on a West African floodplain. Int J Remote Sens 19(1):21–41. https://doi.org/10.1080/014311698216404
United Nations (2013) Ensuring food and nutrition security. In: World economic and social survey2013, United Nations, pp 85–119. https://www.un-ilibrary.org/economic-and-social-development/world-economic-and-social-survey-2013_0e3c4bbb-en
USAID (2017) Agriculture consolidated project appraisal documentWardlow BD, Egbert SL (2010) A comparison of MODIS 250-m EVI and NDVI data for crop
mapping: a case study for Southwest Kansas. Int J Remote Sens 31(3):805–830. https://doi.org/10.1080/01431160902897858
Whitcraft A, Reshef IB, Justice C (2015) A framework for defining spatially explicit earthobservation requirements for a global agricultural monitoring initiative (GEOGLAM). RemoteSens 7(2):1461–1481. https://doi.org/10.3390/rs70201461
White MA, Thornton PE, Running SW (1997) A continental phenology model for monitoringvegetation responses to interannual climatic variability. Global Biogeochem Cycles 11(2):217–234. https://doi.org/10.1029/97GB00330
Zhang X, Friedl MA, Schaaf CB, Strahler AH, Hodges JCF, Gao F, Reed BC, Huete A (2003)Monitoring vegetation phenology using MODIS. Remote Sens Environ 84(3):471–475. https://doi.org/10.1016/S0034-4257(02)00135-9
Zhang G, Xiao X, Biradar CM, Dong J, Qin Y, Menarguez MA, Zhou Y et al (2017)Spatiotemporal patterns of paddy rice croplands in China and India from 2000 to 2015. SciTotal Environ 579(February):82–92. https://doi.org/10.1016/j.scitotenv.2016.10.223
Zhang X, Tan B, Yu Y (2014) Interannual variations and trends in global land surface phenologyderived from enhanced vegetation index during 1982–2010. Int J Biometeorol 58(4):547–564.https://doi.org/10.1007/s00484-014-0802-z
Open Access This chapter is licensed under the terms of the Creative Commons Attribution 4.0International License (http://creativecommons.org/licenses/by/4.0/), which permits use, sharing,adaptation, distribution, and reproduction in any medium or format, as long as you give appro-priate credit to the original author(s) and the source, provide a link to the Creative Commonslicense, and indicate if changes were made.The images or other third party material in this chapter are included in the chapter’s Creative
Commons license, unless indicated otherwise in a credit line to the material. If material is notincluded in the chapter’s Creative Commons license and your intended use is not permitted bystatutory regulation or exceeds the permitted use, you will need to obtain permission directly fromthe copyright holder.
5 In-Season Crop-Area Mapping for Wheat and Rice … 101

Chapter 6Regional Land Cover MonitoringSystem for Hindu Kush Himalaya
Kabir Uddin, Mir A. Matin, Nishanta Khanal, Sajana Maharjan,Birendra Bajracharya, Karis Tenneson, Ate Poortinga,Nguyen Hanh Quyen, Raja Ram Aryal, David Saah,Walter Lee Ellenburg, Peter Potapov, Africa Flores-Anderson,Farrukh Chishtie, Khun San Aung, Timothy Mayer, Sudip Pradhan,and Amanda Markert
6.1 Introduction
The land cover across the HKH region is changing at an accelerated rate due to therapid economic growth and population pressures that are impacting the long-termsustainability of ecosystems (Fig. 6.1) and their services, including food, water, andenergy (Neupane et al. 2013; Wester et al. 2019; Rasul 2016; Song et al. 2018). Thevast changes happening in the forested and vegetative areas are leading to changesin environmental and climatic conditions (Hansen et al. 2001). These land coverclasses are critical for maintaining the Earth’s surface energy balance between theatmosphere, pedosphere, and soil (Duveiller et al. 2018; Schäfer and Dirk 2011).
K. Uddin (&) � M. A. Matin � N. Khanal � S. Maharjan � B. Bajracharya � S. PradhanInternational Centre for Integrated Mountain Development, Kathmandu, Nepale-mail: [email protected]
N. Khanal � K. Tenneson � A. Poortinga � N. H. Quyen � D. Saah � F. ChishtieSpatial Informatics Group, Pleasanton, CA, USA
W. Lee Ellenburg � A. Flores-Anderson � T. Mayer � A. MarkertNASA SERVIR Science Coordination Office, Huntsville, AL, USA
P. PotapovGlobal Land Analysis and Discovery, University of Maryland, College Park, MD, USA
K. S. AungAsian Disaster Preparedness Center, Bangkok, Thailand
R. R. AryalForest Research and Training Centre, Kathmandu, Nepal
D. SaahUniversity of San Francisco, San Francisco, CA, USA
© The Author(s) 2021B. Bajracharya et al. (eds.), Earth Observation Science and Applications for RiskReduction and Enhanced Resilience in Hindu Kush Himalaya Region,https://doi.org/10.1007/978-3-030-73569-2_6
103
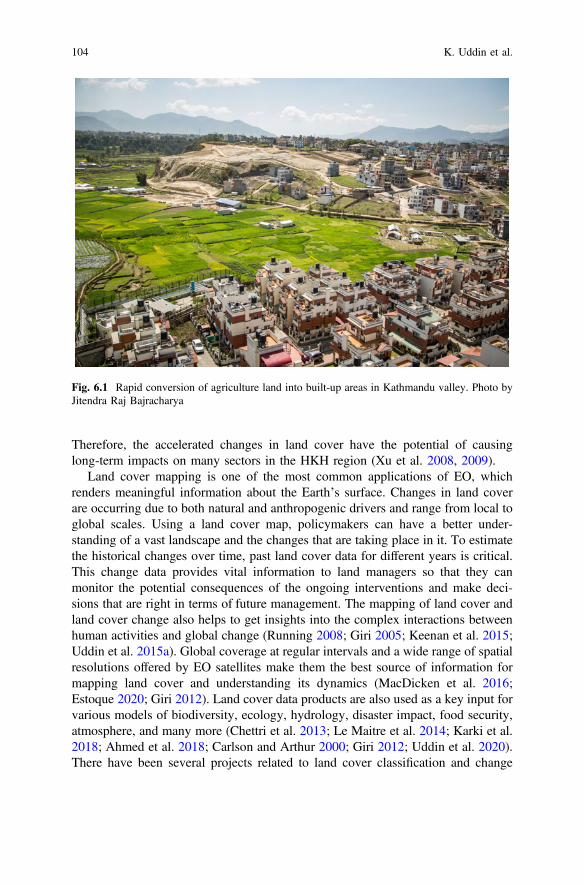
Therefore, the accelerated changes in land cover have the potential of causinglong-term impacts on many sectors in the HKH region (Xu et al. 2008, 2009).
Land cover mapping is one of the most common applications of EO, whichrenders meaningful information about the Earth’s surface. Changes in land coverare occurring due to both natural and anthropogenic drivers and range from local toglobal scales. Using a land cover map, policymakers can have a better under-standing of a vast landscape and the changes that are taking place in it. To estimatethe historical changes over time, past land cover data for different years is critical.This change data provides vital information to land managers so that they canmonitor the potential consequences of the ongoing interventions and make deci-sions that are right in terms of future management. The mapping of land cover andland cover change also helps to get insights into the complex interactions betweenhuman activities and global change (Running 2008; Giri 2005; Keenan et al. 2015;Uddin et al. 2015a). Global coverage at regular intervals and a wide range of spatialresolutions offered by EO satellites make them the best source of information formapping land cover and understanding its dynamics (MacDicken et al. 2016;Estoque 2020; Giri 2012). Land cover data products are also used as a key input forvarious models of biodiversity, ecology, hydrology, disaster impact, food security,atmosphere, and many more (Chettri et al. 2013; Le Maitre et al. 2014; Karki et al.2018; Ahmed et al. 2018; Carlson and Arthur 2000; Giri 2012; Uddin et al. 2020).There have been several projects related to land cover classification and change
Fig. 6.1 Rapid conversion of agriculture land into built-up areas in Kathmandu valley. Photo byJitendra Raj Bajracharya
104 K. Uddin et al.
detection in the HKH region conducted by various organizations (Table 6.1) usingmedium resolution satellite images. However, a project-based land cover mappingdoes not always meet the requirements beyond the specific users involved in themapping. Various agencies and institutions often do not share the necessary ref-erence data which is crucial for systematic land cover mapping efforts. Fordecision-making purposes, the national agencies (usually the national forestdepartments) are mostly using single-year, often backdated, national land covermaps with limited capability to monitor in a timely or integrated fashion(Vidal-Macua et al. 2017; Kaim et al. 2016). The land cover data produced throughthese projects does not always fully meet the requirements of activity data fornational and international reporting on the estimation of forest carbon fluxes. As aresult, global land cover products are frequently used as the best available alter-native when appropriate and timely maps are not available at the regional, national,or subnational levels (Gong et al. 2013). These land cover products also havelimitations given they have been created using different sensors and differenttechniques at varying spatial resolution and classification typologies resulting ininconsistencies on global scales (Verburg et al. 2011; Bajracharya et al. 2009).These inconsistencies often hinder the practical and multiple uses of land coverlayers to contribute to planning and policy formulation, as well as overall man-agement (Ziegler et al. 2012; Skole et al. 1997; Coulston et al. 2014).
Recognizing the land cover data gaps inconsistent land cover maps in the HKHcountries, ICIMOD initiated the development of regional land cover maps using aharmonized classification schema by adopting the land cover classification system(LCCS) of the FAO. During the first phase of SERVIR-HKH initiative, it developedland cover maps of 1990, 2000, and 2010 based on Landsat images using theobject-based image analysis method, for the entire countries of Nepal and Bhutanand the mountain areas of Pakistan, Bangladesh, and Myanmar (Gilani et al. 2015;Qamer et al. 2016; Uddin et al. 2018, 2015). These maps made it possible toanalyze changes at a decadal scale since the data for all the three years was preparedusing consistent sources, classification schemes, and methodologies. At thebeginning of the second phase of SERVIR-HKH, the stakeholders prioritized theneed for an annual land cover monitoring mechanism called the regional land covermonitoring system (RLCMS). This was in the wake of the fact that the preparationof land cover maps using object-based segmentation requires substantial time togenerate land cover data for each year. The traditional supervised classificationsystem using desktop software also requires large computing and data storageresources. The availability of human and financial resources within these nationalagencies was also a major obstacle in implementing such operations. The mainobjective of RLCMS was to develop a system to produce annual land cover mapsfor the entire HKH region using a robust method and a harmonized classificationscheme that could be updated with less human and computing resources. Thespecific objective was to develop the methodology and workflow, produce annualland cover maps for the years 2000–2018, and develop the capacity of the regionalstakeholders to apply the relevant techniques. Co-development, co-learning, and
6 Regional Land Cover Monitoring System for Hindu Kush Himalaya 105
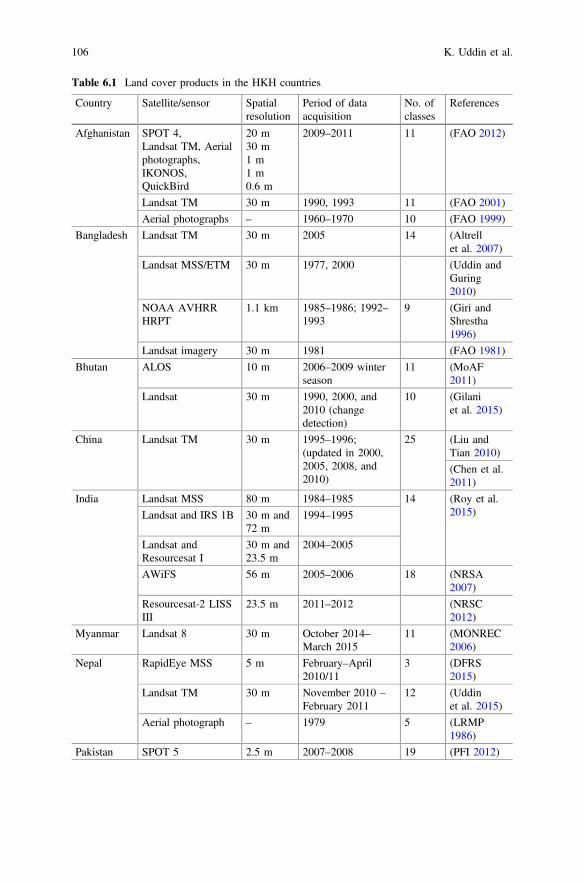
Table 6.1 Land cover products in the HKH countries
Country Satellite/sensor Spatialresolution
Period of dataacquisition
No. ofclasses
References
Afghanistan SPOT 4,Landsat TM, Aerialphotographs,IKONOS,QuickBird
20 m30 m1 m1 m0.6 m
2009–2011 11 (FAO 2012)
Landsat TM 30 m 1990, 1993 11 (FAO 2001)
Aerial photographs – 1960–1970 10 (FAO 1999)
Bangladesh Landsat TM 30 m 2005 14 (Altrellet al. 2007)
Landsat MSS/ETM 30 m 1977, 2000 (Uddin andGuring2010)
NOAA AVHRRHRPT
1.1 km 1985–1986; 1992–1993
9 (Giri andShrestha1996)
Landsat imagery 30 m 1981 (FAO 1981)
Bhutan ALOS 10 m 2006–2009 winterseason
11 (MoAF2011)
Landsat 30 m 1990, 2000, and2010 (changedetection)
10 (Gilaniet al. 2015)
China Landsat TM 30 m 1995–1996;(updated in 2000,2005, 2008, and2010)
25 (Liu andTian 2010)
(Chen et al.2011)
India Landsat MSS 80 m 1984–1985 14 (Roy et al.2015)Landsat and IRS 1B 30 m and
72 m1994–1995
Landsat andResourcesat I
30 m and23.5 m
2004–2005
AWiFS 56 m 2005–2006 18 (NRSA2007)
Resourcesat-2 LISSIII
23.5 m 2011–2012 (NRSC2012)
Myanmar Landsat 8 30 m October 2014–March 2015
11 (MONREC2006)
Nepal RapidEye MSS 5 m February–April2010/11
3 (DFRS2015)
Landsat TM 30 m November 2010 –
February 201112 (Uddin
et al. 2015)
Aerial photograph – 1979 5 (LRMP1986)
Pakistan SPOT 5 2.5 m 2007–2008 19 (PFI 2012)
106 K. Uddin et al.
joint validation pathways were also planned to ensure the sustainability of thesystem. The generated land cover data was then disseminated through a customizedapplication.
6.2 The Approach of RLCMS
As SERVIR HKH initiative transitioned to the second phase, land cover mappingwas still one of the priorities. Specifically, the stakeholders, and they were inter-ested in having updated maps at more frequent intervals than those of decades. Itwas the time when cloud computing was evolving as a strong platform forlarge-volume image analysis, and the University of Maryland (UMD) and theWorld Resources Institute (WRI) had set an example by implementing GlobalForest Watch using GEE. Around the same time, the newly establishedSERVIR-Mekong, led by the Asian Disaster Preparedness Center, was conceptu-alizing and building the RLCMS for Lower Mekong region. The approach andmethodology have been published in Saah et al. (2020), and Khanal et al. (2020).The RLCMS adopted a modular architecture built on the GEE computationalplatform which applied cloud computing and storage frameworks and thus enabledparallel calculations on a large series of data. This made it possible to generate landcover maps at national and regional scales more efficiently and at any desiredtemporal frequency. Realizing the changing paradigm in land cover mappingtechnologies and the benefits offered by GEE, SERVIR-HKH andSERVIR-Mekong joined hands to collaborate on expanding the RLCMS to theHKH region. To enable these systems the GEE outreach team provided cloudstorage facilities and technical expertise. The basic structure of RLCMS wasco-developed through a series of user engagements from 2016 to 2017 in theMekong region which was later extended to the HKH region in 2018. The details ofthe RLCMS approach are outlined in Khanal et al. (2020); Saah et al. (2019), whilethe land cover methods are provided in Saah et al. (2020).
The key highlight of the RLCMS approach is co-development through part-nerships and stakeholder engagements which ensure a sense of ownership and trustin developing land cover maps. The joint working environment has enabled apathway for capacity development in terms of the sustainability of RLCMS (Saahet al. 2019). In the partnership configuration, SERVIR-Mekong and SERVIR-HKHare the regional hubs responsible for implementing the system with regional andcountry partners in the Lower Mekong and HKH regions, respectively. NASA, theUnited States Forest Service (USFS), the University of San Francisco (USF), andthe GEE outreach team provided the technical assistance for developing the algo-rithms and implementing them in GEE. NASA also continues to collaborate withthe FAO for development of an online reference data collection system calledCollect Earth Online (CEO). Collaboration with FAO continues to implement theRLCMS framework in FAO SEPAL (System for Earth Observation Data Access,Processing and Analysis for Land Monitoring) in order to build a user-friendly
6 Regional Land Cover Monitoring System for Hindu Kush Himalaya 107
interface for the RLCMS. This collaborative process has provided opportunities byleveraging the best practices and the most advanced state-of-the-art technologies onland cover mapping (Saah et al. 2019b). Besides, there were additional collabora-tions for specific needs, for example, the University of Maryland supported tocustomize a tree cover algorithm for producing data on tree cover and height.
To address the different needs of the various stakeholders, the RLCMS approachadopted five key principles: exercising flexibility to accommodate the requirementsof land cover typologies; maintaining consistency across time and space; regardingremote sensing data as the source; understanding measurable uncertainty; anddeveloping capacities (Saah et al. 2019).
A recent trend on image analysis shows that GEE is growing widely as ananalysis platform because it provides publicly available multi-petabyte satelliteimagery at planetary scales without any cost. It is also highly efficient in com-parison to desktop, server-based image processing, and is capable of processingvast areas immediately (Saah et al. 2020; Duan et al. 2020; Mahdianpari et al. 2019;Uddin et al. 2020). Building upon GEE as its core, RLCMS incorporates the needsof each country and maintains consistency and transparency using contemporary,robust methods, and provides user-friendly analysis tools and products, besideshelping build the capacity of the partners (Saah et al. 2019).
6.3 Methods of Land Cover Mapping
The overall methodology of the RLCMS and its eight stages, as outlined in Fig. 6.2,are: defining the land cover classification system and land cover typology; col-lecting land cover training samples; selection of Landsat imagery, image correction,and preparation of annual composites; selection of additional thematic data, andcreation of image indices and covariates to make input layers for machine learning;utilization of supervised machine learning algorithms and creation of land coverprimitives, and primitives evaluation and smoothing; evaluation of annual treecanopy and height; preparation of customized land cover maps by modifying theassemblage logic using a decision tree; and validation of the land cover maps andassessment of their accuracy. The steps are described in the following sections.
6.3.1 Defining the RLCMS Classification Schemesand Primitives
Defining an appropriate classification system is the first step in developing RLCMS,as a land cover map with a well-defined legend can provide useful information onthe geographical status of a specific area. Classification systems can describe land
108 K. Uddin et al.

cover features all over the world at any scale or level of detail. To identify landcover typology and to define the legend for RLCMS, the land cover classificationsystem version 3 (LCCS 3), developed by the FAO (Di Gregorio 2016; Bajracharyaet al. 2010; Gregorio 2005), was used. The LCCS provides a framework and assistsusers in systematically defining land cover categories through specific, observableland cover characteristics or attributes, along with the identification of their spatialand temporal relationships. The LCCS-based classification scheme utilizes the landcover element known as a primitive and employs biophysical entities that can bemapped and assembled into a final land cover map. Primitives are defined as thebuilding blocks or the basis of a land cover class in the RLCMS approach (Saahet al. 2020). There can be one or more primitives for a particular land cover class.The definitions of land cover classes used for RLCMS with the correspondingprimitives are given in Table 6.2, which are comparable for international reportingrequirements for the countries and recommended by the IPCC (Penman et al.2003).
For the development of this harmonized land cover classification system for theHKH region, different national and regional consultation workshops (Chap. 3) wereconducted across the region involving professionals from key agencies. During theworkshops, the stakeholders identified their needs as per land cover typology. At
Fig. 6.2 Methodological framework for regional land cover mapping
6 Regional Land Cover Monitoring System for Hindu Kush Himalaya 109

the regional scale, ten classes were defined (Table 6.2) to develop land cover mapsfor the whole of the HKH region. When the system was implemented at the nationallevel to develop a National Land Cover Monitoring System (NLCMS), customizedschemes were defined in consultation with the national stakeholders.
Table 6.2 Definitions of land cover classes
S/N Landcover(LCSS)
Description Comparabilityto IPCC class
RLCMSPrimitives
1 Forest Land spanning more than 0.5 ha withtrees higher than 5 m and a canopy ofmore than 10%, or trees able to reachthese thresholds in situ. It does notinclude land that is predominantly undercrop land or large settlement areas
Forest Treeheight,tree coverTree
2 Grassland
This class describes the areas covered byherbaceous vegetation with a coverranging from “closed to open” (15–100%). This category includesrangelands and pasturelands that are notconsidered as crop land
Grassland Grassland
3 Cropland
This category includes arable and tillageland and agroforestry systems wherevegetation falls below the thresholds forthe forest land category, consistent withnational definitions
Crop land Crop land
4 Built-up Built-up describes artificial structuressuch as towns, villages, industrial areas,airports, etc.
Settlements Built-up,NDDBI
5 Waterbody
A river is a naturally flowing waterbody;typically, it is elongated and has ageomorphologic context. Lakes andponds of perennial standing are alsowaterbodies
Wetlands Openwater
6 Riverbed
Riverbed is a tract of land withoutvegetation surrounded by the waters ofan ocean, lake, or stream; it usuallymeans any accretion in a river course
Riverbeds
7 Baresoil
A soil surface devoid of any plantmaterial
Other Bare soil
8 Barerock
Non-vegetated areas with a rock surface Bare rock
9 Snow This class describes perennial snow(persistence >9 months per year)
Snow
10 Glacier Perennial ice in movement Glacier
110 K. Uddin et al.
6.3.2 Collection of Land Cover Training and ValidationData
The primary reference data was collected for each year from 2000–2020 usingvarious sources. Field campaigns were conducted in collaboration with the nationalpartners using a mobile app. Some data was collected from previous field cam-paigns by the partner agencies. Additional data was collected for national landcover mapping for each country. High-resolution satellite images were used tocollect samples from earlier years using the Collect Earth Desktop or the CEOplatform of the FAO. The CEO supports a systematic collection of referencesamples using various high- and very high-resolution satellite images as back-ground to meet the requirements of any land cover mapping project for differentyears (Saah et al. 2019a). The collected 51,002 systematic sampling reference datawas divided into two subsets. Randomly, 85% were used for primitives develop-ment, while 15% were used for the accuracy assessment of the primitives and thefinal maps in order to produce a confusion/error matrix.
6.3.3 Satellite Image Processing and Land Cover Mapping
GEE has archived Landsat scenes that have undergone multiple procedures such ascomputation of the sensor radiance, top-of-atmosphere (TOA) reflectance, surfacereflectance (SR), cloud score, and cloud-free composites (Sidhu et al. 2018). Theyearly mapping of the HKH land cover from 2000 to 2018 was done using imagesfrom Landsat 5 with the Thematic Mapper (TM) sensor, Landsat 7 with theEnhanced Thematic Mapper (ETM+) sensor, and Landsat 8 with the OperationalLand Imager (OLI) sensor.
However, a few more important image preprocessing steps still needed to beapplied (Saah et al. 2020; Khanal et al. 2020) to these Landsat images to minimizesolar illumination, atmospheric noise, and topographic effects. In brief, removingclouds from the images was an obligatory step in Landsat image processing. In thiscloud-removal step, the pixel-QA band and a cloud-core algorithm that used thespectral and thermal properties of clouds were used to identify and remove thosepixels with cloud cover from the imagery. Besides the cloud area, the cloudshadows were removed in order to avoid misclassification of the areas. For that, theTemporal Dark Outlier Mask (TDOM) algorithm was used (Housman et al. 2018).The pixel quality attributes generated from the CFMASK algorithm (pixel-qa band)were also used for shadow masking (Foga et al. 2017; Scaramuzza et al. 2011;Housman et al. 2018). During the image processing, the correction of the bidi-rectional reflectance distribution function (BRDF) was also applied following analgorithm developed by Roy et al. (2016). As most of the HKH region has acomplex terrain, topographic correction was done to alleviate the illuminationeffects from the topographic position, aspect, and slope that divert reflectance
6 Regional Land Cover Monitoring System for Hindu Kush Himalaya 111
values in the case of similar features within different territories (Carrasco et al.2019; Riaño et al. 2003; Tokola et al. 2001). Once the process of image correctionwas completed, 80 covariates were generated based on the Landsat annual com-posites, and SRTM DEM was then used as input to supervise the classification.Thus, the image indices collectively provided a critical parameter for classifyingland cover, and this has a noticeable correlation with the particular land coverassociation (Zhao et al. 2017; da Silva et al. 2019).
6.3.4 Creating Image Indices and Covariates
Image indices and covariates are synthetic image layers usually created by multi-spectral satellite imagery. These indices and covariates often provide a uniquedistinguished value on a particular land cover that is not found in any of the otherindividual band. Typically, a wide range of ecological information and plantcharacteristics is recognized through various indices as it increases the separabilityof the classes of interest by improving the spectral information. Usually, mapping inthe HKH landscape is a challenging task because of topographic variations andheterogenic land cover patterns. The satellite image bands and indices usuallyemphasize a specific phenomenon that is present in particular land cover classes.Because of that, a set of image bands and covariance matrices is required foraccurate classification. In order to effectively classify the land cover map for theHKH, typical Landsat bands—Band 1, Band 2, Band 3, Band 4, Band 5, Band 6,and Band 7—and the multiple indices were used. The indices and covariates wereselected from a large number of image matrices through analysis of their impor-tance. The indices used were: normalized difference vegetation index (NDVI);normalized difference moisture index (NDMI); soil adjusted vegetation index(SAVI); atmospherically resistant vegetation index (ARVI); enhanced vegetationindex (EVI); green chlorophyll index (GCI); normalized difference water index(NDWI); and bare soil index (BSI) and the SRTM DEM-based slope, aspect wereused as input in the regression tree for land cover primitives formation by machinelearning. All of these indices and covariates, together with land cover training sets,generated a higher probability of classifying the primitives. The definition of theabove indices and corresponding references is available at the index databasewebsite (Henrich et al. 2009; Henrich and Brüser 2012).
6.3.5 Primitives Generation by Machine Learning
A supervised machine learning random forest algorithm was applied to produceland cover primitives. For each primitive, the corresponding confidence (0–100)layer was generated. To reduce computational resources, the process of featureimportance was performed to identify the covariates and indices with a stronger
112 K. Uddin et al.

influence for each primitive. This gave a list of 15–30 bands for each classificationthat had the most impact on the results, which was then used as input for theclassifier. Finally, generating land cover primitives, a random forest classifier wasapplied using the imported training sets, the Landsat image, and associated relatedraster layers.
6.3.6 Annual Tree Canopy Cover and Height
Tree and woody vegetation structure primitives include the annual tree canopycover and canopy height maps. To improve regional consistency, the vegetationstructure product was derived using the same approach as for the Lower Mekongregion (Potapov et al. 2019). In order to map the woody vegetation structure, a setof LIDAR-based vegetation structure prediction models was applied regionallyusing the time series Landsat Analysis Ready Data (Potapov et al. 2019). Tree coverdisturbances were detected separately and integrated into the structure’s time series(Hansen et al. 2013).
6.3.7 Primitives Assemblage for Land Cover Mapping
Once the primitives were generated, a decision tree classifier was used to runthrough these primitives and hierarchically classify all the pixels into the final landcover classes (Fig. 6.3). After applying the decision tree, a minimum of 0.5 hamapping units and continuous pixel counts were calculated for results throughoutthe study region which helped to remove any stray pixels or patches smaller thanthe minimum mapping unit. This whole process is referred to as primitiveassemblage.
6.3.8 Validation and Accuracy Assessment
In order to ensure the reliability and credibility of the RS-based land cover map forthe HKH, an accuracy assessment was considered as a mandatory step. In thisregard, the most appropriate method is to validate the land cover map using theground truth data which is considered to be a more authentic reference. Besides, thespatiotemporal consistency of the land cover data and similar types of productsshould be evaluated over national and regional representative locations and periods.However, as the HKH region consists of a vast area with rough topography and asthere is a problem of inaccessibility, a field-based land cover validation approachwas not possible. So, for validation of the land cover, we had to depend on CEO asit has a collection of very high-resolution images. As for the accuracy estimate, it is
6 Regional Land Cover Monitoring System for Hindu Kush Himalaya 113
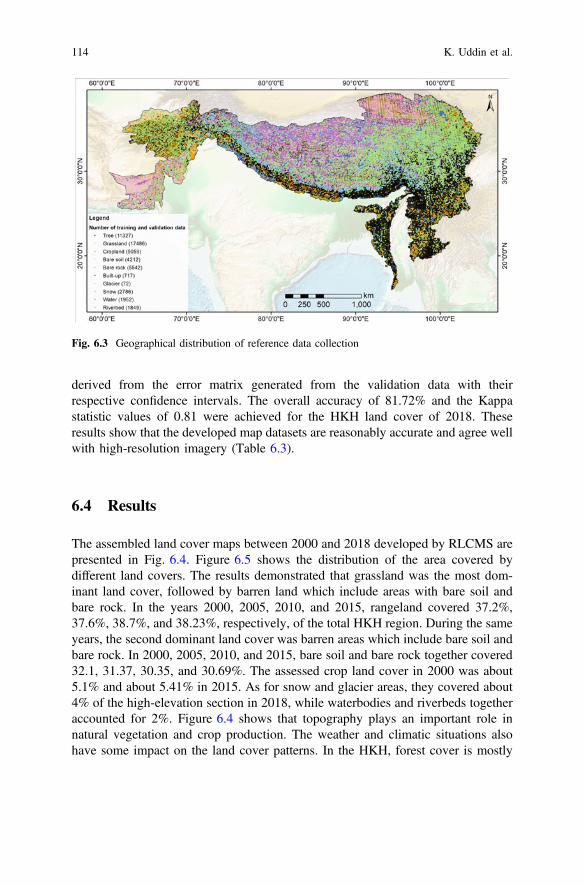
derived from the error matrix generated from the validation data with theirrespective confidence intervals. The overall accuracy of 81.72% and the Kappastatistic values of 0.81 were achieved for the HKH land cover of 2018. Theseresults show that the developed map datasets are reasonably accurate and agree wellwith high-resolution imagery (Table 6.3).
6.4 Results
The assembled land cover maps between 2000 and 2018 developed by RLCMS arepresented in Fig. 6.4. Figure 6.5 shows the distribution of the area covered bydifferent land covers. The results demonstrated that grassland was the most dom-inant land cover, followed by barren land which include areas with bare soil andbare rock. In the years 2000, 2005, 2010, and 2015, rangeland covered 37.2%,37.6%, 38.7%, and 38.23%, respectively, of the total HKH region. During the sameyears, the second dominant land cover was barren areas which include bare soil andbare rock. In 2000, 2005, 2010, and 2015, bare soil and bare rock together covered32.1, 31.37, 30.35, and 30.69%. The assessed crop land cover in 2000 was about5.1% and about 5.41% in 2015. As for snow and glacier areas, they covered about4% of the high-elevation section in 2018, while waterbodies and riverbeds togetheraccounted for 2%. Figure 6.4 shows that topography plays an important role innatural vegetation and crop production. The weather and climatic situations alsohave some impact on the land cover patterns. In the HKH, forest cover is mostly
Fig. 6.3 Geographical distribution of reference data collection
114 K. Uddin et al.
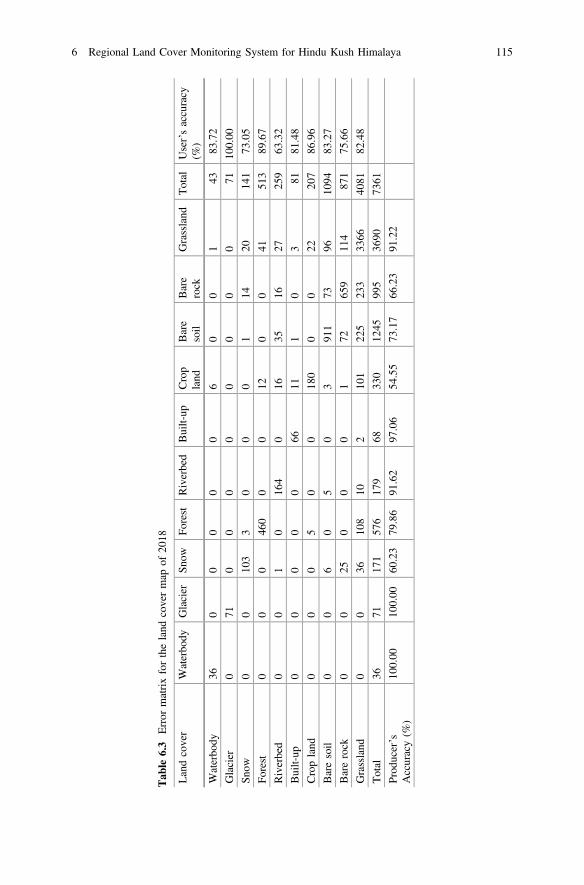
Tab
le6.3
Error
matrixfortheland
covermap
of20
18
Landcover
Waterbo
dyGlacier
Snow
Forest
Riverbed
Built-up
Crop
land
Bare
soil
Bare
rock
Grassland
Total
User’saccuracy
(%)
Waterbo
dy36
00
00
06
00
143
83.72
Glacier
071
00
00
00
00
7110
0.00
Snow
00
103
30
00
114
2014
173
.05
Forest
00
046
00
012
00
4151
389
.67
Riverbed
00
10
164
016
3516
2725
963
.32
Built-up
00
00
066
111
03
8181
.48
Cropland
00
05
00
180
00
2220
786
.96
Baresoil
00
60
50
391
173
9610
9483
.27
Barerock
00
250
00
172
659
114
871
75.66
Grassland
00
3610
810
210
122
523
333
6640
8182
.48
Total
3671
171
576
179
6833
012
4599
536
9073
61
Prod
ucer’s
Accuracy(%
)10
0.00
100.00
60.23
79.86
91.62
97.06
54.55
73.17
66.23
91.22
6 Regional Land Cover Monitoring System for Hindu Kush Himalaya 115
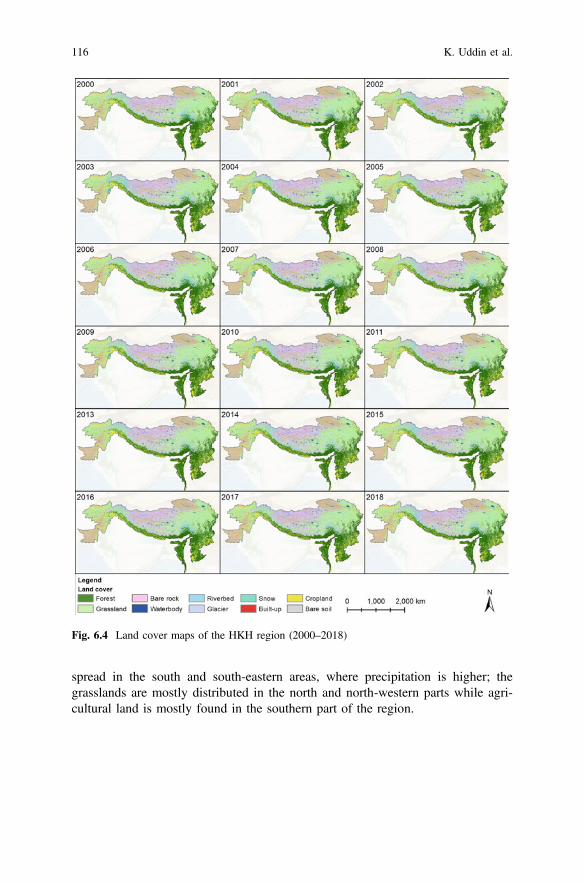
spread in the south and south-eastern areas, where precipitation is higher; thegrasslands are mostly distributed in the north and north-western parts while agri-cultural land is mostly found in the southern part of the region.
Fig. 6.4 Land cover maps of the HKH region (2000–2018)
116 K. Uddin et al.

6.5 Implementation at the Regional and National Levels
The land cover mapping system was implemented at two levels. At the regionallevel, a spatially seamless and temporally consistent annual land cover maps of thewhole HKH region were generated using the broad land use categories recom-mended by the IPCC; this is also suitable for regional-level change monitoring ofcarbon stock and GHG emissions (Penman et al. 2003; Li et al. 2017). However, inaddition to the IPCC-specified classes, a few additional categories such as snow,bare soil, and bare rock which are important for the region have also been included.
At the national level, the system has been implemented to develop NLCMS incollaboration with the national agencies mandated for land cover mapping andmonitoring. In Nepal, the system has been implemented in collaboration with theForest Research and Training Center (FRTC). To implement RLCMS in Nepal,ICIMOD and FRTC partnered in developing the system. A technical team wasformed, comprising of staff from FRTC and ICIMOD, and an advisory team toowas set up consisting of senior management of FRTC and the senior leadership ofSERVIR, to provide guidance. National workshops, supported by SERVIR andSilvaCarbon, were also organized with participants from most of the agencies usingland cover data to get feedback on the classification scheme, data quality, andaccuracy. FRTC and ICIMOD worked together for sample collection from imagesand fields, evaluating classification results and field validation.
In Afghanistan, a land cover map was produced by the FAO for 2010. TheMinistry of Agriculture Irrigation and Livestock (MAIL) needed to update thismap. Through a workshop attended by high-level officials from MAIL and otherkey government agencies, the RLCMS methodology and land cover legends forAfghanistan were finalized. A technical team consisting of staff from ICIMOD,MAIL, and the National Statistical Information Authority (NSIA) was formed toco-develop this map.
0.00
5.00
10.00
15.00
20.00
25.00
30.00
35.00
40.00
45.00
Forest Grassland Cropland Bare soil Bare rock Built-up Riverbed Water body Glacier Snow
Land
cove
r are
a (%
)
2000 2001 2002 2003 2004 2005 2006 2007 2008 2009 2010 2011 2012 2013 2014 2015 2016 2017
Fig. 6.5 Percentage of different land cover classes (2000–2018)
6 Regional Land Cover Monitoring System for Hindu Kush Himalaya 117

In Myanmar, NLCMS has been implemented jointly by SERVIR-Mekong,SERVIR-HKH, and the Forest Department. The land cover legends were defined inconsultation with the latter.
In the case of Bangladesh, the Bangladesh Forest Department (BFD) carried outa mapping project to develop land cover maps for the years 2000, 2005, 2010, and2015. The project was implemented by the FAO with funding from USAID. Theland cover legend was defined using the FAO LCCS system through countryconsultations. The mapping was done by interpreting SPOT and Landsat images.Then, in order to update these maps, the BFD requested ICIMOD to implementRLCMS for mapping the 2019 land cover of Bangladesh. Toward this end, field-work and image-based sample collections were conducted jointly by a team con-sisting of members from the BFD and ICIMOD.
6.6 Challenges and Lessons Learnt
6.6.1 Class Definition
The accuracy of a land cover map depends highly on the clarity and unambiguity ofthe class definition. Before implementing the RLCMS method for generating landcover maps, priority was accorded to document the class definition so that all theusers and developers could agree on it. However, there were some classes where thepartners were unsure about how to define them. The following two exampleselaborate it:
• A forest is defined as an entity with “more than 20% tree crown cover andaverage tree height more than 5 m within the minimum mapping unit” (Heroldet al. 2009). However, when an area within a forest has very young trees withtheir height less than 5 meters, there arises a problem in defining that area. Whilesome people argue that since these trees have the potential to grow beyond 5meters, they should be grouped as a forest, but there are others who do notagree. One issue with RS technology is that it is not capable of determiningfuture growth; it only classifies what is currently on the ground.
• Another confusion is about the classes of “other wooded land” and “openforest.” In both cases, the canopy cover is between 20 and 50%.
6.6.2 Reference Data Collection
The accuracy of classification is also dependent on the number and quality of thereference data that are used. While in some cases, high-resolution images provide agood source of reference data, these images are not available for all the previous
118 K. Uddin et al.

years. Besides, the accuracy of the reference data also varies with the operatorcollecting those data.
6.6.3 Comparison with Legacy Data and Statistics
The accuracy assessment of RS-based classification is usually done with statisti-cally designed validation samples and by calculating various accuracy parameters.But in the HKH region, another issue interrupts the independent assessment ofaccuracy. Usually, the government agencies have the legacy data on land cover andthe corresponding statistics, but they can be reluctant to accept any deviation fromthose earlier statistics.
6.6.4 Limitation of the GEE Cloud Platform
When processing the whole geographical region of the HKH, the image volumeswere too large for a desktop computer to handle. Though GEE provides theopportunity to process these large areas, sometimes processing in GEE could not bedone when the number of the reference sample were too many. In such cases,processing needs to be done in batches, focusing on a smaller area at a time.Typically, GEE allows a maximum of 100 million object features and 100,000vertices for each row’s geometry.
The implementation of a few obligatory image-processing algorithms, e.g.,atmospheric and topographic corrections, was easy to implement for Landsatimages. In a couple of days, GEE could perform all corrections for a countrywithout implementing image tiles options. But that said, in the case of the HKHregion, it takes approximately 20 days to create composites. Among theuser-defined land cover classes, distinguishing the built-up land cover class waschallenging through the random forest algorithm. In this aspect, the newly con-ceived Normalized Difference and Distance Built-up Index (NDDBI) developed afusion of OSM and NDVI layers to map built-up accurately (Khanal et al. 2019).Also, NDDBI index takes advantage while negating the limitations on built-upmapping.
6.6.5 Partners’ Confidence
It was a challenging task to gain the confidence of the partner agencies to adopt theRLCMS for land cover mapping. It took some time, multiple consultations andtraining programs to gain their confidence as they had been involved in traditionalmapping systems. To ensure that the resultant land cover data would be used by the
6 Regional Land Cover Monitoring System for Hindu Kush Himalaya 119
partners, SERVIR focused on co-development and partnership. But this took a longtime since agreements had to be arrived at through the organizational channels ofthe partner agencies.
6.6.6 Sustainability and Human Resource
Though the RLCMS relies on an automatic classification method and needs com-paratively fewer human resources than the traditional image-interpretation-basedland cover map production, the future update of land cover data needs a team withan understanding of the RLCMS algorithm which is based on GEE and JavaScriptor Python script. At present, the partner agencies lack sufficient GIS and RS pro-fessionals with the appropriate background to update the land cover maps.Sometimes, frequent staff turnover in corresponding agencies makes it difficult forsustainable knowledge transfer on land cover mapping. Sometimes, the trained RSstaff get transferred to other departments or field offices. Besides, the technical staffat the respective government agencies is engaged in other administrative workwhich diverts their time from working on the RLCMS.
6.7 Conclusion and Way Forward
The chapter has presented the SERVIR-HKH efforts in land cover mapping of theHKH region. The currently available land cover datasets in the region are notsuitable for analyzing land cover changes over time due to the different classifi-cation schemes and methodologies used to generate those maps. SERVIR aimed toaddress this gap and develop a methodology and system to produce land covermaps on an annual basis using the same classification scheme and processingmethodology. While addressing the regional needs, SERVIR also focused onaddressing national needs that vary and sought to customize the method for pro-ducing land cover maps at the national level. The National Land Cover MonitoringSystem, or NLCMS, was customized for Afghanistan, Myanmar, and Nepal byaddressing the specific needs of the national agencies which were co-developing thesystem with ICIMOD. The system was built and implemented upon the GEEcloud-based platform using Landsat imagery in combination with other thematiclayers. The overall process laid great emphasis on collaboration andco-development with the partners to define the land cover typologies, collect ref-erence samples, and validate the data. This chapter has mainly addressed the pro-cess, its methodology, and the primary results of the exercise in land covermapping. In order to enable the partner agencies to produce and validate land covermaps, extensive training and co-development were conducted for sustainability of
120 K. Uddin et al.

the system. In the future, more validation programs will be conducted in collabo-ration with the national partners. Further modifications will also be made to increasethe number of classes so that additional requirements are met.
References
Ahmed B, Rahman M, Islam R, Sammonds P, Zhou C, Uddin K, Al-Hussaini TM (2018)Developing a dynamic Web-GIS based landslide early warning system for the ChittagongMetropolitan Area, Bangladesh. ISPRS Int J Geo-Info 7(12):485
Altrell D, Saket M, Lyckeback L, Piazza M, Ahmad I, Banik H, Hossain A, Chowdhury R (2007)National forest and tree resources assessment 2005–2007
Bajracharya B, Uddin K, Shrestha B (2009) Land cover mapping in the HKKH region—casesfrom three mountain protected areas. International centre for integrated mountain developmentKathmandu
Bajracharya B, Uddin K, Chettri N, Shrestha B, Siddiqui SA (2010) Understanding land coverchange using a harmonized classification system in the Himalaya. Mt Res Dev 30(2):143–156.https://doi.org/10.1659/MRD-JOURNAL-D-09-00044.1
Carlson TN, Arthur ST (2000) The impact of land use—land cover changes due to urbanization onsurface microclimate and hydrology: a satellite perspective. Global Planet Change 25(1–2):49–65
Carrasco L, O’Neil AW, Morton RD, Rowland CS (2019) Evaluating combinations of temporallyaggregated Sentinel-1, Sentinel-2 and Landsat 8 for land cover mapping with Google EarthEngine. Remote Sensing 11(3):288
Chen J, Chen J, Gong P, Liao A, He C (2011) Higher resolution global land cover mapping.Geomatics World 2:12–14
Chettri N, Uddin K, Chaudhary S, Sharma E (2013) Linking spatio-temporal land cover change tobiodiversity conservation in the Koshi Tappu Wildlife Reserve, Nepal. Diversity 5(2):335–351
Coulston JW, Reams GA, Wear DN, Brewer CK (2014) An analysis of forest land use, forest landcover and change at policy-relevant scales. Forestry 87(2):267–276
da Silva VS, Salami G, da Silva MIO, Silva EA, Monteiro Junior JJ, Alba E (2019)Methodological evaluation of vegetation indexes in land use and land cover (LULC)classification. Geol Ecol Landscapes 1–11
DFRS (2015) State of Nepal’s forests. Forest resource assessment (FRA) Nepal. Department ofForest Research and Survey (DFRS). Kathmandu, Nepal
Di Gregorio A (2016) Land cover classification system: classification concepts. Software version 3Duan Y, Li X, Zhang L, Chen D, Ji H (2020) Mapping national-scale aquaculture ponds based on
the Google Earth Engine in the Chinese coastal zone. Aquaculture 520:Duveiller G, Hooker J, Cescatti A (2018) The mark of vegetation change on Earth’s surface energy
balance. Nature Commun 9(1):679Estoque RC (2020) A review of the sustainability concept and the state of SDG monitoring using
remote sensing. Remote Sensing 12(11):1770FAO (1981) Land cover indications derived from Landsat imagery. FAO. http://www.fao.org/
geonetwork/srv/en/main.home?uuid=5879a4f0-8fdf-4c93-b39a-02d6ce69ae6d, 2019FAO (1999) Land Cover of Afghanistan (1972). FAO. http://www.fao.org/geonetwork/srv/en/
main.home?uuid=5879a4f0-8fdf-4c93-b39a-02d6ce69ae6d, 2019FAO (2001) Land Cover of Afghanistan (1993). FAO. http://www.fao.org/geonetwork/srv/en/
main.home?uuid=5879a4f0-8fdf-4c93-b39a-02d6ce69ae6d, 2019FAO (2012) Aggregated land cover database of the Islamic Republic of Afghanistan (2010). FAO.
http://www.fao.org/geonetwork/srv/en/main.home?uuid=5879a4f0-8fdf-4c93-b39a-02d6ce69ae6d, 2019
6 Regional Land Cover Monitoring System for Hindu Kush Himalaya 121
Foga S, Scaramuzza PL, Guo S, Zhu Z, Dilley RD Jr, Beckmann T, Schmidt GL, Dwyer JL,Hughes MJ, Laue B (2017) Cloud detection algorithm comparison and validation foroperational Landsat data products. Remote Sens Environ 194:379–390
Gilani H, Shrestha HL, Murthy M, Phuntso P, Pradhan S, Bajracharya B, Shrestha B (2015)Decadal land cover change dynamics in Bhutan. J Environ Manage
Giri C (2005) Global land cover mapping and characterization: present situation and futureresearch priorities. Geocarto Int 20(1):35–42. https://doi.org/10.1080/10106040508542334
Giri CP (2012) Remote sensing of land use and land cover: principles and applications. CRC pressGiri C, Shrestha S (1996) Land cover mapping and monitoring from NOAA AVHRR data in
Bangladesh. Int J Remote Sens 17(14):2749–2759Gong P, Wang J, Yu L, Zhao Y, Zhao Y, Liang L, Niu Z, Huang X, Fu H, Liu S, Li C, Li X,
Fu W, Liu C, Xu Y, Wang X, Cheng Q, Hu L, Yao W, Zhang H, Zhu P, Zhao Z, Zhang H,Zheng Y, Ji L, Zhang Y, Chen H, Yan A, Guo J, Yu L, Wang L, Liu X, Shi T, Zhu M, Chen Y,Yang G, Tang P, Xu B, Giri C, Clinton N, Zhu Z, Chen J, Chen J (2013) Finer resolutionobservation and monitoring of global land cover: first mapping results with Landsat TM andETM + data. Int J Remote Sens 34(7):2607–2654. https://doi.org/10.1080/01431161.2012.748992
Gregorio AD (2005) Land cover classification system classification concepts and user manualSoftware version (2). Food and Agriculture Organization of the United Nations, Rome
Hansen AJ, Neilson RP, Dale VH, Flather CH, Iverson LR, Currie DJ, Shafer S, Cook R,Bartlein PJ (2001) Global change in forests: responses of species, communities, and biomes:interactions between climate change and land use are projected to cause large shifts inbiodiversity. Bioscience 51(9):765–779
Hansen MC, Potapov PV, Moore R, Hancher M, Turubanova S, Tyukavina A, Thau D,Stehman S, Goetz S, Loveland TR (2013) High-resolution global maps of 21st-century forestcover change. Science 342(6160):850–853
Henrich V, Brüser K (2012) Index database a database for remote sensing indices. Institute of CropScience and Resource Conservation, University of Bonn, 2019
Henrich V, Götze E, Jung A, Sandow C, Thürkow D, Gläßer C (2009) Development of an onlineindices database: motivation, concept and implementation. In: Proceedings of the 6th EARSeLimaging spectroscopy sig workshop innovative tool for scientific and commercial environmentapplications, Tel Aviv, Israel. pp 16–18
Herold M, Hubald R, Di Gregorio A (2009) Translating and evaluating land cover legends usingthe UN Land Cover Classification System (LCCS). GOGC-GOLD Report 43
Housman IW, Chastain RA, Finco MV (2018) An evaluation of forest health insect and diseasesurvey data and satellite-based remote sensing forest change detection methods: case studies inthe United States. Remote Sensing 10(8):1184
Kaim D, Kozak J, Kolecka N, Ziółkowska E, Ostafin K, Ostapowicz K, Gimmi U, Munteanu C,Radeloff VC (2016) Broad scale forest cover reconstruction from historical topographic maps.Appl Geogr 67:39–48
Karki S, Thandar AM, Uddin K, Tun S, Aye WM, Aryal K, Kandel P, Chettri N (2018) Impact ofland use land cover change on ecosystem services: a comparative analysis on observed dataand people’s perception in Inle Lake, Myanmar. Environ Syst Res 7(1):25
Keenan RJ, Reams GA, Achard F, de Freitas JV, Grainger A, Lindquist E (2015) Dynamics ofglobal forest area: results from the FAO Global Forest Resources Assessment 2015. For EcolManage 352:9–20
Khanal N, Uddin K, Matin MA, Tenneson K (2019) Automatic detection of spatiotemporal urbanexpansion patterns by fusing OSM and landsat data in Kathmandu. Remote Sensing 11(19):2296
Khanal N, Matin MA, Uddin K, Poortinga A, Chishtie F, Tenneson K, Saah D (2020) Acomparison of three temporal smoothing algorithms to improve land cover classification: a casestudy from NEPAL. Remote Sensing 12(18):2888
122 K. Uddin et al.
Le Maitre DC, Kotzee IM, O’Farrell PJ (2014) Impacts of land-cover change on the water flowregulation ecosystem service: invasive alien plants, fire and their policy implications. Land UsePolicy 36:171–181
Li X, Chen G, Liu X, Liang X, Wang S, Chen Y, Pei F, Xu X (2017) A new global land-use andland-cover change product at a 1-km resolution for 2010 to 2100 based on human–environmentinteractions. Ann Am Assoc Geogr 107(5):1040–1059
Liu M, Tian H (2010) China’s land cover and land use change from 1700 to 2005: estimationsfrom high‐resolution satellite data and historical archives. Glob Biogeochem Cycles 24(3)
LRMP (1986) Land system report. Land Resource Mapping Project (LRMP), Kenting EarthSciences Limited, Canada
MacDicken K, Jonsson Ö, Piña L, Maulo S, Contessa V, Adikari Y, Garzuglia M, Lindquist E,Reams G, D’Annunzio R (2016) Global forest resources assessment 2015: how are the world’sforests changing?
Mahdianpari M, Salehi B, Mohammadimanesh F, Homayouni S, Gill E (2019) The first wetlandinventory map of newfoundland at a spatial resolution of 10 m using sentinel-1 and sentinel-2data on the google earth engine cloud computing platform. Remote Sensing 11(1):43
MoAF (2011) Bhutan land cover assessment 2010MONREC F (2006) Data book with the results of the project “strengthening Myanmar’s national
forest monitoring system- land use assessment and capacity building” (TCP/MYA/3501)Neupane N, Murthy MSR, Rasul G, Wahid S, Shrestha AB, Uddin K (2013) Integrated
biophysical and socioeconomic model for adaptation to climate change for agriculture andwater in the Koshi Basin. Handbook of climate change adaptation. Springer, Berlin, Germany,pp 1–23
NRSA (2007) National land use and land cover mapping using multi temporal AWiFS data. http://www.fao.org/geonetwork/srv/en/main.home?uuid=5879a4f0-8fdf-4c93-b39a-02d6ce69ae6d.Accessed NRSA 2019
NRSC (2012) National land use/land cover: national level annual land use/land cover (LU/LC)maps. http://www.fao.org/geonetwork/srv/en/main.home?uuid=5879a4f0-8fdf-4c93-b39a-02d6ce69ae6d. Accessed NRSA 2019
Penman J, Gytarsky M, Hiraishi T, Krug T, Kruger D, Pipatti R, Buendia L, Miwa K, Ngara Todd,Tanabe K, Wagner F (2003) Good practice guidance for land use, land-use change and forestry.The Intergovernmental Panel on Climate Change (IPCC), Kanagawa, Japan
PFI (2012) Landcover atlas of Pakistan. Pakistan Forest Institute (PFI), Peshawar, PakistanPotapov P, Tyukavina A, Turubanova S, Talero Y, Hernandez-Serna A, Hansen M, Saah D,
Tenneson K, Poortinga A, Aekakkararungroj A (2019) Annual continuous fields of woodyvegetation structure in the Lower Mekong region from 2000–2017 landsat time-series. RemoteSens Environ 232:
Qamer FM, Shehzad K, Abbas S, Murthy M, Xi C, Gilani H, Bajracharya B (2016) Mappingdeforestation and forest degradation patterns in Western Himalaya, Pakistan. Remote Sens 8(5):385
Rasul G (2016) Managing the food, water, and energy nexus for achieving the sustainabledevelopment goals in South Asia. Environ Dev 18:14–25
Riaño D, Chuvieco E, Salas J, Aguado I (2003) Assessment of different topographic corrections inLandsat-TM data for mapping vegetation types (2003). IEEE Trans Geosci Remote Sens 41(5):1056–1061
Roy PS, Roy A, Joshi PK, Kale MP, Srivastava VK, Srivastava SK, Dwevidi RS, Joshi C,Behera MD, Meiyappan P (2015) Development of decadal (1985–1995–2005) land use andland cover database for India. Remote Sensing 7(3):2401–2430
Roy DP, Zhang H, Ju J, Gomez-Dans JL, Lewis PE, Schaaf C, Sun Q, Li J, Huang H,Kovalskyy V (2016) A general method to normalize landsat reflectance data to nadir BRDFadjusted reflectance. Remote Sens Environ 176:255–271
Running SW (2008) Ecosystem disturbance, carbon, and climate. Science 321(5889):652–653
6 Regional Land Cover Monitoring System for Hindu Kush Himalaya 123

Saah D, Tenneson K, Matin M, Uddin K, Cutter P, Poortinga A, Ngyuen QH, Patterson M,Johnson G, Markert K (2019) Land cover mapping in data scarce environments: challenges andopportunities. Front Environ Sci 7:150
Saah D, Tenneson K, Poortinga A, Nguyen Q, Chishtie F, San Aung K, Markert KN, Clinton N,Anderson ER, Cutter P (2020) Primitives as building blocks for constructing land cover maps.Int J Appl Earth Obs Geoinf 85:101979
Scaramuzza PL, Bouchard MA, Dwyer JL (2011) Development of the Landsat data continuitymission cloud-cover assessment algorithms. IEEE Trans Geosci Remote Sens 50(4):1140–1154
Schäfer K, Dirk V (2011) The physical environment within forests. Nat Educ Knowl 2(12):5Sidhu N, Pebesma E, Câmara G (2018) Using Google Earth Engine to detect land cover change:
Singapore as a use case. Eur J Remote Sens 51(1):486–500Skole D, Justice C, Townshend J, Janetos A (1997) A land cover change monitoring program:
strategy for an international effort. Mitig Adapt Strat Glob Change 2(2–3):157–175Song X-P, Hansen MC, Stehman SV, Potapov PV, Tyukavina A, Vermote EF, Townshend JR
(2018) Global land change from 1982 to 2016. Nature 560(7720):639–643Tokola T, Sarkeala J, Van der Linden M (2001) Use of topographic correction in Landsat
TM-based forest interpretation in Nepal. Int J Remote Sens 22(4):551–563Uddin K, Guring DR (2010) Land cover change in Bangladesh: a knowledge based classification
approach. In: Paper presented at the 10th international symposium on hill mountain remotesensing cartography, Graz: Karl-Franzens University of Graz, Institute of Geography andRegional Science, Kathmandu, Nepal, pp 08–18, 2008
Uddin K, Chaudhary S, Chettri N, Kotru R, Murthy M, Chaudhary RP, Ning W, Shrestha SM,Gautam SK (2015a) The changing land cover and fragmenting forest on the Roof of the World:a case study in Nepal’s Kailash Sacred Landscape. Landscape Urban Plan 141:1–10. https://doi.org/10.1016/j.landurbplan.2015.04.003
Uddin K, Shrestha HL, Murthy M, Bajracharya B, Shrestha B, Gilani H, Pradhan S, Dangol B(2015) Development of 2010 national land cover database for the Nepal. J Environ Manage148:82–90. https://doi.org/10.1016/j.jenvman.2014.07.047
Uddin K, Abdul Matin M, Maharjan S (2018) Assessment of land cover change and its impact onchanges in soil erosion risk in Nepal. Sustainability 10(12):4715. https://doi.org/10.3390/su10124715
Uddin K, Khanal N, Chaudhary S, Maharjan S, Thapa RB (2020) Coastal morphological changes:assessing long-term ecological transformations across the northern Bay of Bengal.Environmental Challenges 1:100001
Verburg PH, Neumann K, Nol L (2011) Challenges in using land use and land cover data forglobal change studies. Glob Change Biol 17(2):974–989
Vidal-Macua JJ, Zabala A, Ninyerola M, Pons X (2017) Developing spatially and thematicallydetailed backdated maps for land cover studies. Int J Digit Earth 10(2):175–206
Wester P, Mishra A, Mukherji A, Shrestha AB (2019) The Hindu Kush Himalaya Assessment.Cham: Springer International Publishing, Basel, Switzerland
Xu J, Sharma R, Fang J, Xu Y (2008) Critical linkages between land-use transition and humanhealth in the Himalayan region. Environ Int 34(2):239–247
Xu J, Grumbine RE, Shrestha A, Eriksson M, Yang X, Wang Y, Wilkes A (2009) The meltingHimalayas: cascading effects of climate change on water, biodiversity, and livelihoods.Conserv Biol 23(3):520–530
Zhao L, Zhang P, Ma X, Pan Z (2017) Land cover information extraction based on daily NDVItime series and multiclassifier combination. Mathematical problems in engineering 2017
Ziegler AD, Phelps J, Yuen JQ, Webb EL, Lawrence D, Fox JM, Bruun TB, Leisz SJ, Ryan CM,Dressler W (2012) Carbon outcomes of major land-cover transitions in SE Asia: greatuncertainties and REDD + policy implications. Glob Change Biol 18(10):3087–3099
124 K. Uddin et al.

Open Access This chapter is licensed under the terms of the Creative Commons Attribution 4.0International License (http://creativecommons.org/licenses/by/4.0/), which permits use, sharing,adaptation, distribution, and reproduction in any medium or format, as long as you give appro-priate credit to the original author(s) and the source, provide a link to the Creative Commonslicense, and indicate if changes were made.The images or other third party material in this chapter are included in the chapter’s Creative
Commons license, unless indicated otherwise in a credit line to the material. If material is notincluded in the chapter’s Creative Commons license and your intended use is not permitted bystatutory regulation or exceeds the permitted use, you will need to obtain permission directly fromthe copyright holder.
6 Regional Land Cover Monitoring System for Hindu Kush Himalaya 125

Chapter 7Climate-Resilient Forest Managementin Nepal
Vishwas Sudhir Chitale, Sunil Thapa, Mir A. Matin, Kamala Gurung,Shankar Adhikari, and Rabindra Maharjan
7.1 Introduction
7.1.1 Ecosystem Degradation in the Hindu Kush HimalayaRegion
Forests are important components of livelihood system for a large percentage of thepopulation in the Himalayan region, and they also offer an important basis forcreating as well as safeguarding more climate-resilient communities. The HKHregion hosts diverse vegetation systems, which could be attributed to the climatevariability within the region. However, the region is fragile in terms of land-coverdiversity and its association with variable terrain, climate, and socio-demographicinteractions. The region is also rich in biodiversity; nonetheless, it is one of the mostunderstudied regions of the world in this regard (Kumar et al. 2019). In addition, inthe last few decades, the HKH region has experienced rapid economic, social, andenvironmental changes owing to unsustainable and haphazard development(Sharma et al. 2019). The Millennium Ecosystem Assessment of the United Nations(MEA 2005) shows that more than 60% of the world’s ecosystem services are eitherdegraded or used unsustainably. Stern et al. (2006) have highlighted the detrimentaleffect of deforestation on climatic conditions, which demands the urgent need forimproved management and governance of forest resources to avoid further chronicdisturbances leading to degradation. As a matter of fact, higher forest degradation is
V. S. Chitale (&) � S. Thapa � M. A. Matin � K. GurungInternational Centre for Integrated Mountain Development, Kathmandu, Nepale-mail: [email protected]
S. AdhikariREDD Implementation Centre, Ministry of Forests and Environment, Kathmandu, Nepal
R. MaharjanForest Directorate, Ministry of Industries, Tourism, Forest and Environment, Province No. 1,Biratnagar, Nepal
© The Author(s) 2021B. Bajracharya et al. (eds.), Earth Observation Science and Applications for RiskReduction and Enhanced Resilience in Hindu Kush Himalaya Region,https://doi.org/10.1007/978-3-030-73569-2_7
127
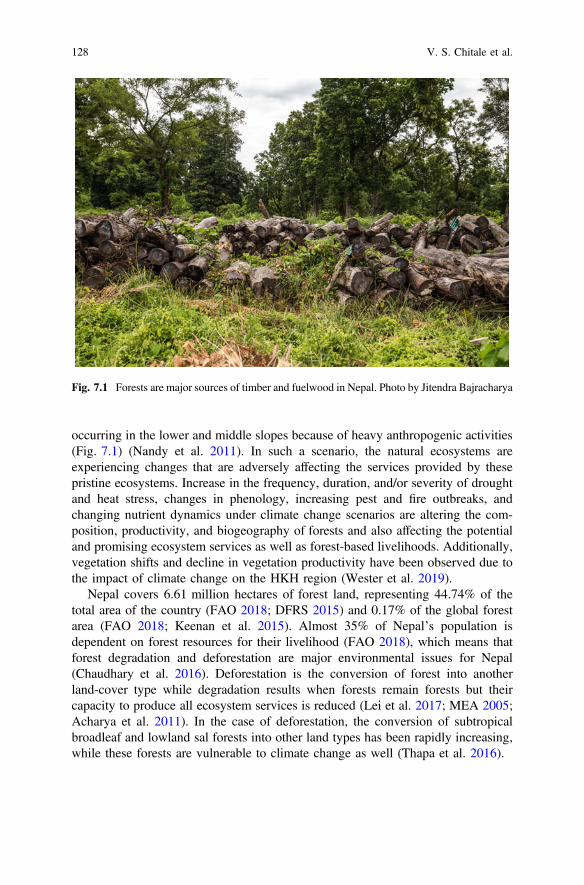
occurring in the lower and middle slopes because of heavy anthropogenic activities(Fig. 7.1) (Nandy et al. 2011). In such a scenario, the natural ecosystems areexperiencing changes that are adversely affecting the services provided by thesepristine ecosystems. Increase in the frequency, duration, and/or severity of droughtand heat stress, changes in phenology, increasing pest and fire outbreaks, andchanging nutrient dynamics under climate change scenarios are altering the com-position, productivity, and biogeography of forests and also affecting the potentialand promising ecosystem services as well as forest-based livelihoods. Additionally,vegetation shifts and decline in vegetation productivity have been observed due tothe impact of climate change on the HKH region (Wester et al. 2019).
Nepal covers 6.61 million hectares of forest land, representing 44.74% of thetotal area of the country (FAO 2018; DFRS 2015) and 0.17% of the global forestarea (FAO 2018; Keenan et al. 2015). Almost 35% of Nepal’s population isdependent on forest resources for their livelihood (FAO 2018), which means thatforest degradation and deforestation are major environmental issues for Nepal(Chaudhary et al. 2016). Deforestation is the conversion of forest into anotherland-cover type while degradation results when forests remain forests but theircapacity to produce all ecosystem services is reduced (Lei et al. 2017; MEA 2005;Acharya et al. 2011). In the case of deforestation, the conversion of subtropicalbroadleaf and lowland sal forests into other land types has been rapidly increasing,while these forests are vulnerable to climate change as well (Thapa et al. 2016).
Fig. 7.1 Forests are major sources of timber and fuelwood in Nepal. Photo by Jitendra Bajracharya
128 V. S. Chitale et al.

Degradation can be measured by various approaches, viz. decrease in the canopydensity or decrease in biodiversity or increase in the occurrence of invasive plantsor a decline in the ecosystem services provided by the forests. Nepal’s foreststatistics reflects that forest degradation is more critical than deforestation (Acharyaet al. 2011) and a major catalyst in promoting forest fragmentation (Panta et al.2008). Between 1947 and 1980, the annual rate of deforestation in Nepal was 2.7%(Chaudhary et al. 2016), whereas the degradation trend was at 5.57% for the period1978/79–1994 (Acharya et al. 2011). Studies also show that Nepal’s forests areconsidered to be one of the most vulnerable to the effects of climate change in theHKH region (Lamsal et al. 2017), thereby placing in peril the communities that aredependent on the forests in so many ways (Ma et al. 2012).
7.1.2 Forest Policies and Management in Nepal
In response to the need for a forest management regime, some key policies andlegal instruments have been introduced in Nepal: Private Forest NationalizationAct, 1957; National Forest Plan, 1976; Master Plan for the Forestry Sector, 1989;Forest Act, 1993; Forest Rules, 1995; Revised Forestry Sector Policy, 2000;Leasehold Forestry Policy, 2002; Herbs and Non-Timber Forest Product (NTFP)Development Policy, 2004; Forest Policy, 2015; and the Forestry Sector Strategy(2016–25). These policies have been supported by several strategies and actionplans such as the Terai Arc Landscape Strategy, 2004–2014; Gender and SocialInclusion Strategy in the Forestry Sector, 2004–19; Sacred Himalayan LandscapeStrategy, 2006–16; and the National Biodiversity Strategy (NBS 2002) and ActionPlan, 2014. As of 2020, Nepal has 22 protected areas (PAs) distributed acrossdifferent altitudinal gradients, which have been designed mainly with a focus onwildlife habitat and corridors. Although the earlier policies did not explicitlyaddress the issue of vulnerability of forest and its dependent communities to therepercussions of climate change, the latest policies and strategies have specificprovisions related to reducing this vulnerability and promoting/ensuringclimate-resilient forest management practices. For example, climate change miti-gation and resilience is one of the eight pillars and responding to climate change asa core strategy of the Forestry Sector Strategy (2016–25). Nepal’s NationalAdaptation Plan also has a sector on “forests and biodiversity” to specifically lookat the climate change vulnerability under predicted scenarios and identify suitableadaptation options (MoPE 2017). Then there’s the model of community forestrywhich has been in existence in Nepal for four decades and more after the enactmentof the National Forestry Plan in 1976. Currently, the number of community forestsin Nepal exceeds 22,000, which managing a total area of about 22.37 millionhectares involving almost 2.9 million households (Dahal et al. 2017; DoF 2018).These community forests follow the Community Forest Development Guidelines(2014) which empowers the forest user groups to develop their own constitutionand management plans, and directs them in implementing activities as per the plans
7 Climate-Resilient Forest Management in Nepal 129
(GoN 2014). This guideline also includes a mandatory provision on how the rev-enue that is generated ought to be used—at least 35% of a community forestrygroup’s income should be invested in pro-poor activities and 40% toward thewelfare of the forest community (GoN 2014). So far, community forests have beensuccessful in achieving their “dual goal” of ecosystem restoration and livelihoodimprovement; however, better efforts have to be made to ensure at least 50%participation of women and members of the marginalized communities indecision-making roles; this would tick the boxes of gender and social equality thatis part of the UN’s Sustainable Development Goals (SDGs).
7.1.3 Importance of Gender and Social Inclusionin Community Forest Management
Community-based forest management (CFM) is considered one of the successfulmodels of community-based forest governance; however, its success depends onseveral factors—socioeconomic heterogeneity, institutional setting, leadership,property rights regimes, degree of decentralization, community characteristics,technology, and market influence (Cox et al. 2010; Pagdee et al. 2006). Moreover,as things stand currently, while Nepal has taken some important steps in securinggender and social equality, its National Adaptation Plan of Action (NAPA), theLocal Adaptation Plan of Action (LAPA), and REDD + (Reducing emissions fromdeforestation and forest degradation) initiative are not gender and socially inclusive(Gurung et al. 2011).
The United Nations Framework Convention on Climate Change (UNFCCC) firstintroduced gender to global climate change discussions in 2001, specifying genderequality as a guiding principle in the preparation of adaptation plans for the “urgentand immediate needs” of the least developed countries. It also highlights theimportance of women participating in climate change negotiations in a meaningfulway. Of all the South Asian countries in the Women’s Resilience Index—a tool thatassesses the extent to which a country has been able to integrate women intoresilience-building efforts—Nepal is the only country where gender has been“mainstreamed” into its climate change decision-making setup, which acknowl-edges women as a vulnerable group (Agarwal 2010). However, there is an absenceof targets for women’s involvement within the NAPA, and of the nine specifiedprojects, none is gender-specific (Economic Intelligence Unit 2014; GoN 2010). Inour study, we provide more insights into how gender and social inclusion play arole in community-based forest management in Nepal; for this, we have relied ondata from three priority districts. We also point out how it is important that thecommunity forest user’s groups (CFUGs) have an equal representation of house-holds from all ethnicities and different income categories. The premise of CFUGsasserts that communities or groups of forest users should collectively be engaged inthe management of forests (Negi et al. 2018).
130 V. S. Chitale et al.

7.1.4 Climate Change Adaptation and Forest Ecosystems
Understanding the vulnerability of forests and the degradation of ecosystems is thefirst step toward effectively identifying adaptation and management strategies. Thetwo fundamental response options to the predicted climate change scenarios aremitigation and adaptation. Traditionally, mitigation has been the main focus ofthose studying climate change, from both scientific and policy perspectives.However, researchers have been underlining the importance of considering adap-tation options as a response measure to climate change, along with mitigationmechanisms; the reasons being: Climate change is inevitable; adaptation measuresproduce more instant benefits; and adaptive actions can be carried out at both localand regional levels (Millar et al. 2007). Hence, the assessment of the vulnerabilityof forest ecosystems to climate change and the development of a database toidentify and support relevant adaptation strategies have been identified as urgentneeds.
At present, there is a gap in terms of availability of accurate information onforest degradation and about the impacts of climate change on forest ecosystems;the bridging of this gap could prove crucial in assisting the decision-makers to makemore effective plans for managing forest ecosystems. Effective adaptation to climatechange depends on the availability of two important prerequisites: information onwhat to adapt, where to, and how to; and resources to implement the adaptationmeasures. Ground-based information about the vulnerable systems and the stressorsthat they are exposed to and the transfer of resources to vulnerable societies to helpthem prepare to cope with the inevitable impacts of climate change are thus nec-essary elements of a comprehensive climate policy (Saxon et al. 2005; Parmesanet al. 2013). In this context, in the present study, we introduce the concept of amulti-tier approach that can support effective identification and implementation ofadaptation measures.
7.2 Context of Services
A Climate-Resilient Forest Management System (CRFMS) to supportdecision-making processes at different geographic scales
The district/divisional forest offices of Nepal follow a five-year Divisional ForestOperation and Management Plan (DFOMP), which is used to prioritize the activ-ities of the various divisions. This plan currently lacks a scientific approach toeffectively address deforestation and forest degradation as well as the vulnerabilityof the forests to climate change impacts. To introduce a scientific approach toDFOMP, the Department of Forests and Soil Conservation (DoFSC) is attemptingto prepare a vulnerability profile at the district/division level. It would use thisprofile as a guiding document to identify the hotspots of degradation and
7 Climate-Resilient Forest Management in Nepal 131

vulnerability, and then decide the priorities for that particular district or division.There is also the Hariyo Ban program undertaken by a consortium of four agencies:Cooperative for Assistance and Relief Everywhere (CARE); World Wide Fund ForNature (WWF); the Federation of Community Forestry Users Nepal (FECOFUN);and the National Trust for Nature Conservation (NTNC). The information devel-oped under the CRFMS at the district level could provide important data andinformation on climate change vulnerability and the degradation of forest ecosys-tems at the community forest level. This information can add scientific evidence tocommunity-level forest management plans and enhance the decision-making pro-cess at the community forest level.
Scope of the service
Theory of change: It is important to define the scope of a service by jointlyagreeing with the co-developer and user agencies. It is also important to understandand monitor the impact of the service, which is often done by developing a theoryof change (ToC) and identifying impact pathways—and all along adopting themonitoring, evaluation, and learning approach. In the case of the CRFMS service,we and our partners both developed and revised the ToC (Fig. 7.2). Our definitionof the ToC revolved around the following elements: zone of project control; zone ofproject influence; zone of partners’ influence; the context; outputs and outcomes;and risks and impacts.
Zone of project control: While developing a service, it is crucial to identify andunderstand the gap areas through a needs assessment process and to design anddevelop the service so that the products of the service help in supporting the
Zone of project control Zone of project influence Zone of partners’ influence
Training on importance and use of EO/GIT in forest management, gender mainstreaming, interaction/awareness
Enhanced capacity of stakeholders for application of geospatial data and tools in forest management and evidence-based decision makingCo-development of
information platform
Co-creation of Information system using EO/GIT
•organizational leaders informed on value of EO/GIT in forest management
• Vulnerability map, dependence map, and their individual layers
• Analytical/decision support tool to
management options• Information options; information platform
developed, publications
• Proactive engagement of the
Resilient Forest Management System in Nepal
• Stakeholders willing to share data•
process and acknowledge support• Stakeholders interested/
aware about info available and understand the value
• Other federal DoFs will consider outputs in their programs and plans
• Direct partners actively engage boundary partners and use the information
• MoFE allocate budget to use EO/GIT in forest management and to influence green sectors policy
• Researchers use data/products for further analysis
Managed forest ecosystem by reducing degradation and by monitoring resource extraction, thereby bringing benefits to the forest-dependent communities in Nepal
• Nepal’s forests are experiencing changes in their distribution and functioning as a result of climate change
• Limited knowledge of potential future impact of climate change and anthropogenic pressure on sustainable forest ecosystem services
•
•institutional interest and accountability
•• Poor internet connectivity can hamper the work and usability of the service
1. Technical capacity
Outcome
3. Access
2. ActionableInformation
Outputs
Assumptions I Assumptions II
Impacts
The context of Nepal
Risks
Fig. 7.2 Theory of change for a climate-resilient forest management system
132 V. S. Chitale et al.

decisions at various scales. Alongside, there’s a need to enhance the technicalcapacity of the implementing partners/co-developing agencies. Co-development ofservices can be helpful for all the organizations that are involved in the collabo-rative process, where some stakeholders benefit by getting access to data andinformation that can help in decision making; while some organizations benefit bygetting the thrust to engage with decision-makers for policy-level changes andsuchlike. In order to enhance the use of the products that have been developed,packaging them as “actionable information” plays an important role that can helpdecision-makers to improve their planning and management with precise infor-mation, in this case, on the vulnerability of forest ecosystems to climate change.
Zone of project influence: This zone mainly focuses on working together withthe partners and involves data collection, data sharing, co-design, andco-development as well as co-implementation of the service. This can be of mutualbenefit to both the agencies and adds value to the different products being devel-oped under the service. A proper validation of the products and the information thatis generated under the service by the partners is important to assess the accuracy ofthe products through the decision-makers’ lens, which helps in increasing theacceptability of the service to a wider audience. It is also useful to understand thedifferent dimensions, such as gender and social inclusion, in order to explore thesocioeconomic linkages and in this case the impacts of forest-related work under theservice; this provides an idea about the users of the forest resources and how tobring in sustainable forest management. This also improves the sense of ownershipof the service among the partner agencies, which can then enhance the usability ofthe products by adding to the decision-making capacity of the users.
Zone of partners’ influence: This zone focuses on up-scaling and out-scaling ofthe service to take it to other relevant user agencies—in this case, institutions likethe Ministry of Forests and Soil Conservation (MoFSC) and the Department ofNational Parks and Wildlife Conservation (DNPWC), as well as projects workingon the relevant thematic area. Through this scaling approach, we aim to bring aregional dimension to the service so as to get the decision-makers of the HKHregion to work on reducing forest degradation and climate change vulnerability inthe region.
7.3 Service Implementation
7.3.1 Service Design and Development
To ensure accurate incorporation of user needs, the service was co-designedthrough a series of user consultations and engagements at different levels. Theservice-planning process broadly involved three steps: needs assessment, servicedesign, and service delivery. These steps also involved defining the objective and
7 Climate-Resilient Forest Management in Nepal 133
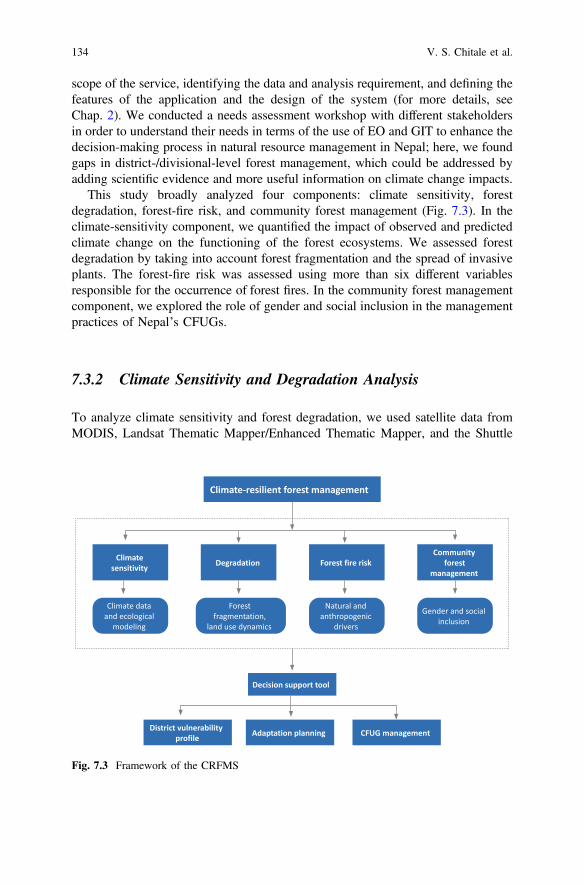
scope of the service, identifying the data and analysis requirement, and defining thefeatures of the application and the design of the system (for more details, seeChap. 2). We conducted a needs assessment workshop with different stakeholdersin order to understand their needs in terms of the use of EO and GIT to enhance thedecision-making process in natural resource management in Nepal; here, we foundgaps in district-/divisional-level forest management, which could be addressed byadding scientific evidence and more useful information on climate change impacts.
This study broadly analyzed four components: climate sensitivity, forestdegradation, forest-fire risk, and community forest management (Fig. 7.3). In theclimate-sensitivity component, we quantified the impact of observed and predictedclimate change on the functioning of the forest ecosystems. We assessed forestdegradation by taking into account forest fragmentation and the spread of invasiveplants. The forest-fire risk was assessed using more than six different variablesresponsible for the occurrence of forest fires. In the community forest managementcomponent, we explored the role of gender and social inclusion in the managementpractices of Nepal’s CFUGs.
7.3.2 Climate Sensitivity and Degradation Analysis
To analyze climate sensitivity and forest degradation, we used satellite data fromMODIS, Landsat Thematic Mapper/Enhanced Thematic Mapper, and the Shuttle
Climate-resilient forest management
Climate sensitivity
Climate data and ecological
modeling
Forest fragmentation,
land use dynamics
Degradation
Decision support tool
Forest fire risk
Natural and anthropogenic
drivers
Community forest
management
Gender and social inclusion
District vulnerability profile Adaptation planning CFUG management
Fig. 7.3 Framework of the CRFMS
134 V. S. Chitale et al.

Radar Topography Mission (SRTM). In this context, biophysical, climatic, eco-logical, and socioeconomic data were reviewed and analyzed. For biophysicalanalysis, we used MODIS-based products like Net Primary Productivity (NPP),Leaf Area Index (LAI), Evapotranspiration (ET), and Forest Fire (FF). As forclimatic data, the annual mean temperature and the annual precipitation figures ofboth current and future periods (RCP 4.5 and RCP 8.5 for the year 2030) weregathered from bioclim datasets. Tree density and species richness were consideredas ecological data. And to analyze forest degradation, the following elements werestudied: forest fragmentation; distribution of invasive plants; and the demand–supply dynamics of fodder, fuelwood, NTFPs, and timber. The study was carriedout in three districts of Nepal located at different altitudinal gradients: Rasuwa inthe high-altitude; Lamjung in the mid-hills; and Kapilvastu in the plains.
7.3.2.1 Trend Analysis and Calculation of Climate Sensitivity
The biophysical and climatic data were initially masked by the classified forestcover of the year 2010, and the annual and seasonal linear trend analysis of eachbiophysical index (ET, LAI, and NPP) was carried out in the R software. Fourseasons, namely pre-monsoon (March–May), monsoon (June–September),post-monsoon (October–November), and winter (December–February), were cate-gorized, and the indices’ trend was analyzed. Each index (NPP, ET, and LAI) wascategorized into five classes using Jenks Natural Breaks in the ArcMap softwareand reclassified (one to five) at the pixel level. The Jenks Natural BreaksClassification (or Optimization) system is a data classification method designed tooptimize the arrangement of a set of values into “natural” classes. A “natural class”is the most optimal class range found “naturally” in a dataset (Chen et al. 2013).The spatial layers of the reclassified indices were then overlaid, and compositevalues were calculated, through which climate-sensitivity layers were generated.For predicting future climate sensitivity, a model was developed using the Rplatform for each of the indices, and the spatial raster layers of LAI, ET, and NPPwere generated for two climate change scenarios (RCP 4.5 and RCP 8.5) for theyear 2030. Future climate sensitivity was calculated from the predicted biophysicalindices produced from the developed model. The model was validated by predictingthe LAI, ET, and NPP data for the years 2010, 2014, 2015, and 2018, andcross-checked with the MODIS product data for the years 2010, 2014, 2015, and2018. Furthermore, based on the composite value, the climate-sensitivity classeswere categorized into five levels—very low, low, moderate, high, and very high—using the Jenks Natural Breaks Classification system.
7 Climate-Resilient Forest Management in Nepal 135

7.3.2.2 Assessment of Forest Degradation
The spatial layer of forest degradation was generated based on the demand–supplydynamics of deforestation, fodder, NTFPs, fuelwood, forest fragmentation, andinvasive plants distribution.
Ground- and satellite-based data were then used to generate geospatial layers onthese parameters, and these were integrated to develop a forest-dependence layerdepicting low-, medium-, and high-dependence classes.
The spatial layer for fuelwood supply was generated based on the above-groundbiomass map of the landscape, whereas the fuelwood demand map was generatedbased on the actual fuelwood demand noted in the district forest management plansof the three districts. The data on the demand–supply of NTFPs were generatedusing the data obtained from the forest management plans of all the districts fallingin the study area. The fodder demand map was generated based on the district-wiselivestock information and the annual fodder demand for each livestock type; whilethe grazing supply map was generated based on a grassland map that was createdusing RS datasets. The spatial layer of deforestation was generated based on theforest dynamics from the years 2000–2010. The forest fragmentation layer wasgenerated based on the land-use and land-cover map of 2010. The invasive plantdistribution pattern was developed using the ground locations of 21 dominantinvasive plants; this was done via Maxent modeling for the current scenario and forthe future scenario of year 2030. All the layers from this climate sensitivity anddegradation analysis were aggregated to generate the final layer of climate sensi-tivity and degradation, which was then divided into five classes to generate theoverall layer of forest vulnerability using a classification matrix based on the JenksNatural Breaks Classification system.
7.3.2.3 Assessing Forest-Fire Risk
We assessed the forest-fire risk using various datasets involving natural andanthropogenic drivers, which was based on a study by Matin et al. (2017). Thedatasets included: forest type; the average land-surface temperature during thesummer season; distance to roads and distance to settlements; altitude; and slope(More details on this can be found in Chap. 8).
7.3.2.4 Integrating Gender Analysis for Enhancing ForestManagement at the Community Level
As almost 35% of Nepal’s population depend on forest resources for their liveli-hoods, our study attempted to understand and address the important issues related togender and social inclusion. The study on gender and social inclusion was mainlyfocused on CFUGs in western Nepal; it was jointly conducted with a team fromHariyo Ban, a consortium of four agencies working in Nepal, viz. WWF, CARE,
136 V. S. Chitale et al.
FECOFUN, and NTNC. The study aimed to analyze how gender and socialinclusion in community forest management vary across the geographical zones inNepal. We thus hoped to gain important insights into the policy environment andthe state of policy–practice interface regarding gender equality and social inclusionin the community forestry sector. Specifically, the study aimed to address thefollowing two major domains by analyzing the analyzing the secondary data/information at the national level; it also conducted a survey in three districts rep-resenting three different geographical terrains (mountain, mid-hill, and plains).
(i) Understanding women’s voice and agency in CFUGs(ii) Allocation of community forest funds for rural development
We utilized the data from the Hariyo Ban I program, which was implemented inthe Chitwan Annapurna Landscape and the Terai Arc Landscape during 2010–2015. Due to limited availability of data, only three districts were chosen for thegender analysis: Rasuwa (high altitude); Makwanpur (mid-hills), and Bara (plains).The data were collected in 2017–18 through a questionnaire survey—with 85parameters—of all CFUGs in these three districts. However, as the data weremissing in terms of a lot of parameters, our study focused on only those attributesthat had relevance with the gender and social inclusion aspect.
7.3.3 Service Delivery
7.3.3.1 Enhancing the Decision-Making Capacity of Forest Managersin Nepal
We jointly conducted the work in collaboration with the DoFSC with the aim ofusing science to improve the decision-making process. Regular user engagementwas maintained with the DoFSC through frequent meetings and feedback sessionsin order to keep the decision-makers updated on the progress of the work as well ason the results obtained during the analysis. The methodology was designed con-sidering the applicability, usability, and scalability of the framework for othercountries in the HKH region. The three priority districts were selected consideringthe differences in their climate, ecology, and socioeconomic conditions; this, webelieved, would give us a fair idea about the varying impacts of climate change andabout the anthropogenic drivers that trigger this change. The selection of thesedistricts was made after discussions at a consultation workshop in Kathmandu withofficers from the various forest divisions of Nepal. Keeping the aspect of usabilityin mind, we used publicly available datasets for most of the analyses, whichcomprised of MODIS and other satellite datasets.
The methodology framework of the study was presented to the decision-makersat multi-stakeholder platforms in order to take their feedback and revise theframework wherever needed. This multi-stakeholder forum involved officials from
7 Climate-Resilient Forest Management in Nepal 137

the DoFSC, members of the NAPA team, those involved in the Adaptation forSmallholders in Hilly Areas (ASHA) project, and representatives from WWF,CARE, and FECOFUN. The initial rounds of presentation at this forum focused onfinalizing the methodology and data, while later on, the results of the study werepresented for validation by the stakeholders. The results highlight the overall vul-nerability of the forest ecosystems to observed and predicted climate change anddegradation due to the anthropogenic drivers in these three districts.
Climate sensitivity, forest degradation, and forest-fire risk analysis
The feature of climate sensitivity was found to be the highest in Lamjung district,with more than 42% of the forest area falling under the high and very highclimate-sensitivity indices. This sensitivity trend is predicted to intensify in thefuture, where 48% of the current forest area may fall under high and very highsensitivity indices (Fig. 7.4). Moreover, high-altitude ecosystems are predicted toexperience more warming than the hills and the plains (Wester et al. 2019). In a2015 study, Bhatta et al. had observed similar impacts on the forests in Dolakhadistrict, situated in northern Nepal. Our results are in line with results from earlierstudies where the forest ecosystems in the high-altitude areas of Nepal have beenobserved to depict a higher degree of climate change impacts than other physio-graphic regions in the country (Ebi et al. 2007; Chaudhary and Bawa 2011; Zomeret al. 2014; Chitale et al. 2014; Baral et al. 2018). In the study, out of the threedistricts, we found Rasuwa facing the highest forest degradation rate, with morethan 32% of its forest area depicting high and very high degradation; this could beattributed to the remoteness of its landscape which hinders accessibility to tradi-tional energy sources such as LPG. This might be putting pressure on the forestecosystems, leading to the extraction of fuelwood. A similar trend was observed inDolakha in a 2016 study by Kandel et al., while Reddy et al. in (2018) alsoobserved similar trends in forest degradation. In our study, the district of Lamjungdepicted 26% high and very high forest degradation areas. In the case of forest-firerisk, it was found to be the highest in Kapilvastu district, with above 52% of it in thecategories of high and very high risk. This could be attributed to the plain terrain,dominant broadleaved vegetation, the proximity of agriculture lands, and the easieraccess to forest areas compared to the mid-hills and the high-altitude areas. So, thepossibility is higher of anthropogenic drivers triggering forest fire.
0 10 20 k5 ms
1:350,000
Overall Vulnerability Map of Rasuwa District
LegendDistrict boundary
Overall Vulnerability classVery lowLowModerateHighVery highOther areas than forest 0 10 20 k5 ms
1:350,000
LegendDistrict boundary
Overall Vulnerability classVery LowLowModerateHighVery highOther areas than forest
Overall Vulnerability Map of Lamjung District
0 10 205 kms
1:350,000
Overall Vulnerability Map of Kapilvastu District
LegendDistrict boundary
Overall Vulnerability ClassVery LowLowModerateHighVery highOther areas than forest
Fig. 7.4 Climate sensitivity of the forest ecosystems in the pilot districts (left to right) of Rasuwa,Lamjung, and Kapilvastu
138 V. S. Chitale et al.
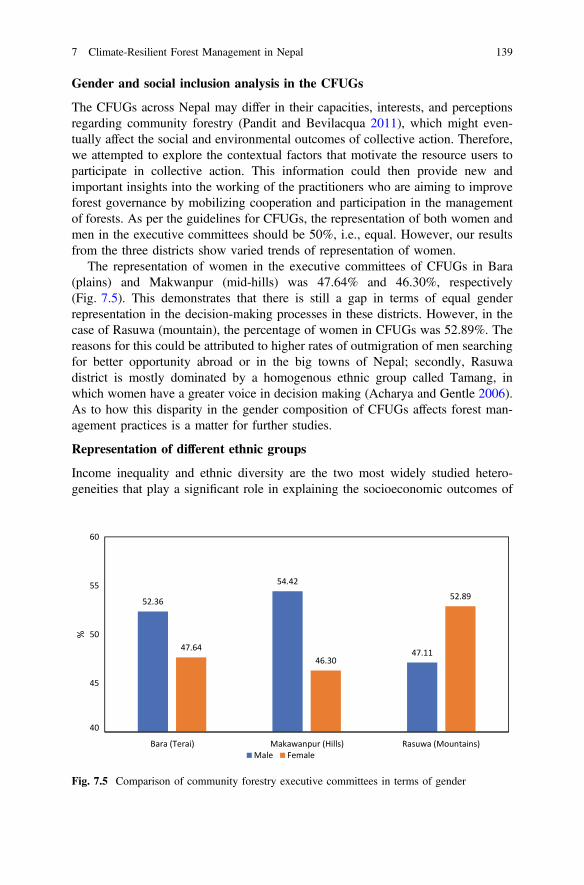
Gender and social inclusion analysis in the CFUGs
The CFUGs across Nepal may differ in their capacities, interests, and perceptionsregarding community forestry (Pandit and Bevilacqua 2011), which might even-tually affect the social and environmental outcomes of collective action. Therefore,we attempted to explore the contextual factors that motivate the resource users toparticipate in collective action. This information could then provide new andimportant insights into the working of the practitioners who are aiming to improveforest governance by mobilizing cooperation and participation in the managementof forests. As per the guidelines for CFUGs, the representation of both women andmen in the executive committees should be 50%, i.e., equal. However, our resultsfrom the three districts show varied trends of representation of women.
The representation of women in the executive committees of CFUGs in Bara(plains) and Makwanpur (mid-hills) was 47.64% and 46.30%, respectively(Fig. 7.5). This demonstrates that there is still a gap in terms of equal genderrepresentation in the decision-making processes in these districts. However, in thecase of Rasuwa (mountain), the percentage of women in CFUGs was 52.89%. Thereasons for this could be attributed to higher rates of outmigration of men searchingfor better opportunity abroad or in the big towns of Nepal; secondly, Rasuwadistrict is mostly dominated by a homogenous ethnic group called Tamang, inwhich women have a greater voice in decision making (Acharya and Gentle 2006).As to how this disparity in the gender composition of CFUGs affects forest man-agement practices is a matter for further studies.
Representation of different ethnic groups
Income inequality and ethnic diversity are the two most widely studied hetero-geneities that play a significant role in explaining the socioeconomic outcomes of
52.36
54.42
47.1147.6446.30
52.89
40
45
50
55
60
Bara (Terai) Makawanpur (Hills) Rasuwa (Mountains)
%
Male Female
Fig. 7.5 Comparison of community forestry executive committees in terms of gender
7 Climate-Resilient Forest Management in Nepal 139
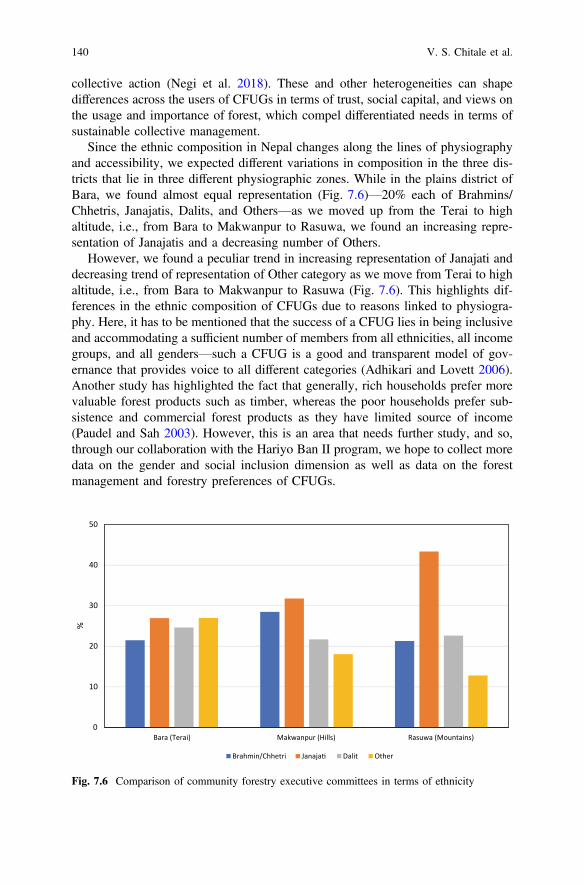
collective action (Negi et al. 2018). These and other heterogeneities can shapedifferences across the users of CFUGs in terms of trust, social capital, and views onthe usage and importance of forest, which compel differentiated needs in terms ofsustainable collective management.
Since the ethnic composition in Nepal changes along the lines of physiographyand accessibility, we expected different variations in composition in the three dis-tricts that lie in three different physiographic zones. While in the plains district ofBara, we found almost equal representation (Fig. 7.6)—20% each of Brahmins/Chhetris, Janajatis, Dalits, and Others—as we moved up from the Terai to highaltitude, i.e., from Bara to Makwanpur to Rasuwa, we found an increasing repre-sentation of Janajatis and a decreasing number of Others.
However, we found a peculiar trend in increasing representation of Janajati anddecreasing trend of representation of Other category as we move from Terai to highaltitude, i.e., from Bara to Makwanpur to Rasuwa (Fig. 7.6). This highlights dif-ferences in the ethnic composition of CFUGs due to reasons linked to physiogra-phy. Here, it has to be mentioned that the success of a CFUG lies in being inclusiveand accommodating a sufficient number of members from all ethnicities, all incomegroups, and all genders—such a CFUG is a good and transparent model of gov-ernance that provides voice to all different categories (Adhikari and Lovett 2006).Another study has highlighted the fact that generally, rich households prefer morevaluable forest products such as timber, whereas the poor households prefer sub-sistence and commercial forest products as they have limited source of income(Paudel and Sah 2003). However, this is an area that needs further study, and so,through our collaboration with the Hariyo Ban II program, we hope to collect moredata on the gender and social inclusion dimension as well as data on the forestmanagement and forestry preferences of CFUGs.
0
10
20
30
40
50
Rasuwa (Mountains)Makwanpur (Hills)Bara (Terai)
%
Brahmin/Chhetri Janaja Dalit Other
Fig. 7.6 Comparison of community forestry executive committees in terms of ethnicity
140 V. S. Chitale et al.
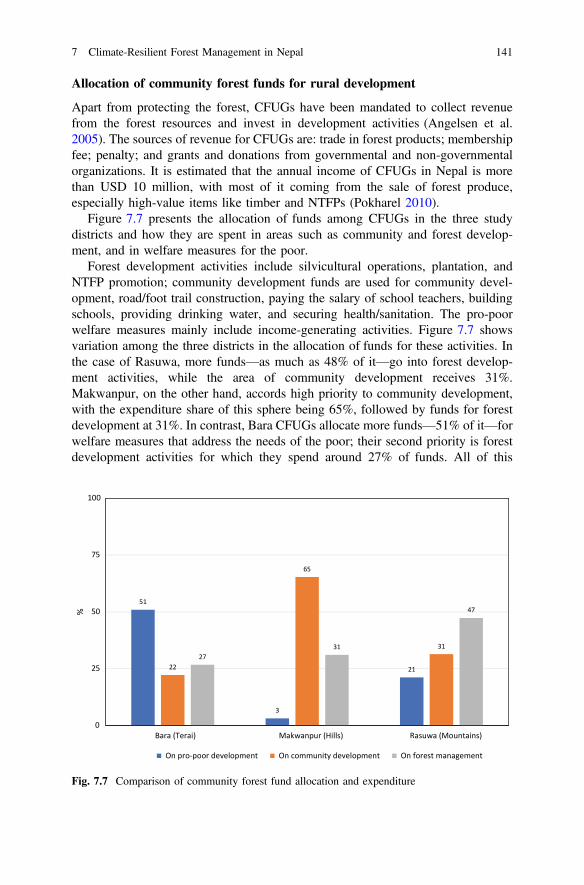
Allocation of community forest funds for rural development
Apart from protecting the forest, CFUGs have been mandated to collect revenuefrom the forest resources and invest in development activities (Angelsen et al.2005). The sources of revenue for CFUGs are: trade in forest products; membershipfee; penalty; and grants and donations from governmental and non-governmentalorganizations. It is estimated that the annual income of CFUGs in Nepal is morethan USD 10 million, with most of it coming from the sale of forest produce,especially high-value items like timber and NTFPs (Pokharel 2010).
Figure 7.7 presents the allocation of funds among CFUGs in the three studydistricts and how they are spent in areas such as community and forest develop-ment, and in welfare measures for the poor.
Forest development activities include silvicultural operations, plantation, andNTFP promotion; community development funds are used for community devel-opment, road/foot trail construction, paying the salary of school teachers, buildingschools, providing drinking water, and securing health/sanitation. The pro-poorwelfare measures mainly include income-generating activities. Figure 7.7 showsvariation among the three districts in the allocation of funds for these activities. Inthe case of Rasuwa, more funds—as much as 48% of it—go into forest develop-ment activities, while the area of community development receives 31%.Makwanpur, on the other hand, accords high priority to community development,with the expenditure share of this sphere being 65%, followed by funds for forestdevelopment at 31%. In contrast, Bara CFUGs allocate more funds—51% of it—forwelfare measures that address the needs of the poor; their second priority is forestdevelopment activities for which they spend around 27% of funds. All of this
51
3
2122
65
3127
31
47
0
25
50
75
100
Bara (Terai) Makwanpur (Hills) Rasuwa (Mountains)
%
On pro-poor development On community development On forest management
Fig. 7.7 Comparison of community forest fund allocation and expenditure
7 Climate-Resilient Forest Management in Nepal 141
indicates that the revenue generated at CFUGs is mostly used for collective benefitsrather than individual ones. The results presented in this chapter will be furtherexplored in detail in our future work in the area of gender and social inclusion.
Integrated approach for enhancing the resilience of ecosystems
Our results provide important information about the current trends in climatesensitivity and degradation as well as about the predicted impacts on the func-tioning of forest ecosystems; the results also shed light on the aspect of gender andsocial inclusion in CFUGs, which needs to be integrated into the planning andmanagement contours of the forest ecosystems in Nepal.
Every five years, Nepal’s divisional forest offices prepare and revise forestmanagement and operational plans, which also have a section on climate changeadaptation. The findings from our study will be included in this section wherein wewill describe the current and predicted climate-sensitivity indices and the observedtrends in forest degradation, along with the some six suitable adaptation measuresthat can be adopted. The framework of the International Union of Forest ResearchOrganizations (IUFRO) on climate change adaptation suggests a list of 144 adap-tation options for forest ecosystems across the world. Out of that, we have short-listed six adaptation options through consultations held in the three study districts;these could be suitable for building the resilience of forest ecosystems not only inthese districts, but also for Nepal as a whole. The six options are: forest-fire reg-ulation; grazing regulation; improving stock levels; introducing/enhancing agro-forestry; utilizing solar energy; and maintaining forest cover.
The results from our study have been compiled in a web-based decision-supporttool (http://geoapps.icimod.org/CRFMS/) that provides user-friendly access to allinformation on climate sensitivity, degradation, and forest-fire risk from all 77districts in Nepal. It is also compatible with Nepal’s new federal structure, wherethe districts fall under seven provinces. The tool is open access and includes optionsto compare any two parameters for the same study area side by side, which shouldbe useful for the decision-makers. The adaptation planning toolbox provides a listof suitable adaptation options that can be implemented to enhance the resilience offorest ecosystems. The decision-support tool also comprises of a module on forestmanagement at the community forest level, which can support decision-makers atCFUGs to understand the trends and predicted scenarios of climate sensitivity,degradation, and forest-fire risk. It can also show them the current patterns ofgender and social inclusion in the decision-making processes in the CFUGs. Allsuch tools should further strengthen the capability of CFUGs in the planning andmanagement of forest ecosystems.
142 V. S. Chitale et al.
7.4 Way Forward
Considering the observed trends and predicted climate change impacts and forestdegradation in the countries of the HKH region, it is crucial to incorporate scientificanalysis into the planning and management aspects of forest ecosystems.The CRFMS framework follows a “Science into Use” approach that can play animportant role in enhancing forest management in these countries. The CRFMSframework is less data intensive, which makes it also suitable for extending itsoperations to countries outside the HKH region. Building the institutional capacityof user agencies, such as governmental ministries and departments and CFUGs, hasbeen one of our priorities; we believe that partnerships and the active involvementof co-development and user agencies since the conceptual phase of the service isimportant to ensure a sense of ownership on the products by these agencies. We aimto scale out this framework to the whole of the HKH region, but do not want it to berestricted to this region alone—this framework can be easily implemented in anypart of the world. With the advent of freely available satellite data and platformslike GEE, we can apply CRFMS to reduce both time and resources. Ultimately andlooking into the future, it is the geospatial tools that are going to be the primeplayers in decision making, not only in the HKH but also globally.
References
Acharya KP, Dangi RB, Acharya M (2011) Understanding forest degradation in Nepal. Unasylva62(2):238
Acharya K, Gentle P (2006) Improving the effectiveness of collective action: sharing experiencesfrom community forestry in Nepal. CAPRi Working Paper No. 54
Adhikari B, Lovett JC (2006) Transaction costs and community-based natural resourcemanagement in Nepal. J Environ Manage 78(1):5–15
Agarwal B (2010) The impact of women in Nepal’s community forestry management. Sustain MtDev 57:26–29
Angelsen A, Berguers P, Belcher B, Nasi R (2005) Livelihoods, forests, and conservation indeveloping countries: an overview. World Dev 33(9):1383–1402
Baral P, Wen Y, Urriola N (2018) Forest cover changes and trajectories in a typical middlemountain watershed of western Nepal. Land 7(2):72
Chaudhary P, Bawa KS (2011) Local perceptions of climate change validated by scientificevidence in the Himalayas. Biol Let 7(5):767–770
Chaudhary RP, Uprety Y, Rimal SK (2016) Deforestation in Nepal: causes, consequences, andresponses. In: Shroder JF, Sivanpillai R (eds) Biological and environmental hazards, risks, anddisasters, pp 335–372. Elsevier
Chen J, Yang S, Li H, Zhang B, Lv J (2013) Research on geographical environment unit divisionbased on the method of natural breaks (Jenks). Int Arch Photogramm Remote Sens Spat Inf Sci3:47–50
Chitale VS, Shrestha HL, Agrawal NK, Choudhury D, Gilani H, Dhonju HK, Murthy MSR (2014)Forest climate change vulnerability and adaptation assessment in Himalayas. Int ArchPhotogrammetry, Remote Sens Spatial Inf Sci 8
7 Climate-Resilient Forest Management in Nepal 143

Cox M, Arnold G, Tomás SV (2010) A review of design principles for community-based naturalresource management. Ecol Soc 15(4)
DFRS (2015) State of Nepal’s forests. Forest Resource Assessment (FRA) Nepal, Department ofForest Research and Survey (DFRS). Kathmandu, Nepal
Dahal GR, Pokharel BK, Pokhrel PR (2017) Why does tenure security Matter in communityforestry? A critical reflection from Nepal. J For Livelihood 15(1):15–26
DoF (2018) Database on community forests in Nepal. Department of Forests, Ministry of Forestsand Soil Conservation, Kathmandu, Nepal
Ebi KL, Woodruff R, von Hildebrand A, Corvalan C (2007) Climate change-related health impactsin the Hindu Kush-Himalayas. Eco Health 4(3):264–270
FAO (2018) The state of the world’s forests 2018—forest pathways to sustainable development.Rome, Licence: CC BY-NC-SA 3.0 IGO
GoN (2014) Community forestry program development guideline (Third Revision) 2014. Availableonline: http://d2ouvy59p0dg6k.cloudfront.net/downloads/community_forest_development_directive_2.pdf
Government of Nepal (GoN) (2010) National adaptation programme of action (NAPA) to climatechange. Overnment of Nepal, Ministry of Environment, Singa Durbar, Kathmandu, Nepal
Gurung J, Giri K, Setyowati AB, Lebow E (2011) Getting REDD right for women: an analysis ofthe barriers and opportunities for women’s participation in the REDD + sector in Asia. USAID(United States Agency for International Development). http://www.gender-climate.org/Content/Docs/Publications/Gender_REDD_Asia_Regional_Analysis.pdf. Accessed on 7April 2020
Keenan RJ, Reams GA, Achard F, de Freitas JV, Grainger A, Lindquist E (2015) Dynamics ofglobal forest area: results from the FAO global forest resources assessment 2015. For EcolManage 352:9–20
Khadka M, Karki S, Karky SK, Kotru R, Dargee BK (2014) Gender equality challenges to theREDD initiative in Nepal. Mt Res Dev 34(3):197–207. International Mountain Society: https://doi.org/10.1659/MRD-JOURNAL-D-13-00081.1. Accessed on 1 April 2020
Kumar M, Singh H, Pandey R, Singh MP, Ravindranath NH, Kalra N (2019) Assessingvulnerability of forest ecosystem in the Indian Western Himalayan region using trends of netprimary productivity. Biodivers Conserv 28(8–9):2163–2182
Lamsal P, Kumar L, Atreya K, Pant KP (2017) Vulnerability and impacts of climate change onforest and freshwater wetland ecosystems in Nepal: a review. Ambio 46(8):915–930
Lei G, Li A, Cao X, Zhao W, Bian J, Deng W, Koirala HL (2017) Land cover mapping and itsspatial pattern analysis in Nepal. In: Land cover change and its eco-environmental responses inNepal, pp 17–39. Springer, Singapore
MEA (2005) Millennium ecosystem assessment. Ecosystems and human well-being: synthesis.Island Press, Washington, DC
Ma M, Singh RB, Hietala R (2012) Human driving forces for ecosystem services in the Himalayanregion. Environ Econ 3:53–57
Matin MA, Chitale VS, Murthy MS, Uddin K, Bajracharya B, Pradhan S (2017) Understandingforest fire patterns and risk in Nepal using remote sensing, geographic information system andhistorical fire data. Int J Wildland Fire 26(4):276–286
Millar CI, Stephenson NL, Stephens SL (2007) Climate change and forests of the future: managingin the face of uncertainty. Ecol Appl 17(8):2145–2151
MoPE (2017) Vulnerability and risk assessment framework and indicators for national adaptationplan (NAP) formulation process in Nepal. Ministry of Population and Environment (MoPE),Kathmandu
NBS (2002) Nepal biodiversity strategy. Ministry of Forests and Soil Conservation, Governmentof Nepal, Kathmandu, p 132
Nandy S, Kushwaha SPS, Dadhwal VK (2011) Forest degradation assessment in the uppercatchment of the river Tons using remote sensing and GIS. Ecol Ind 11(2):509–513
Negi S, Pham TT, Karky B, Garcia C (2018) Role of community and user attributes in collectiveaction: case study of community-based forest management in Nepal. Forests 9(3):136
144 V. S. Chitale et al.
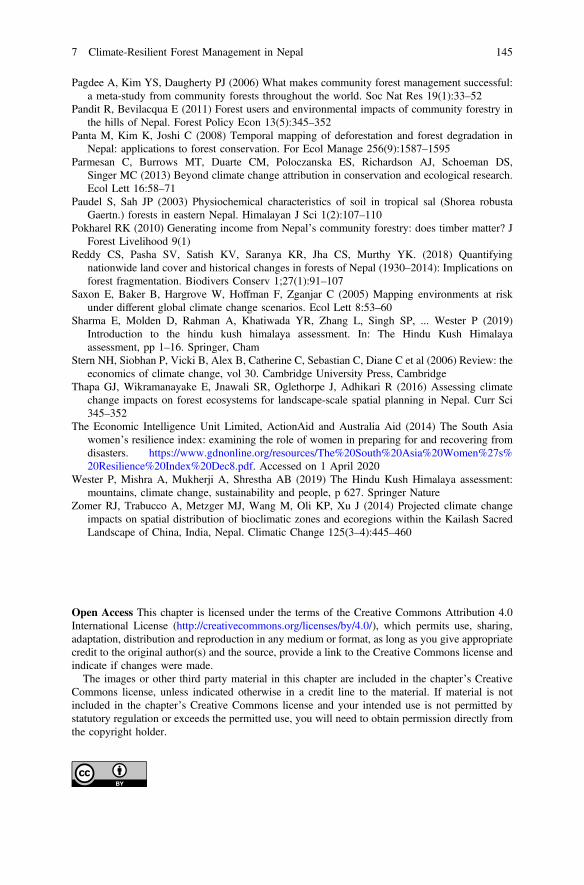
Pagdee A, Kim YS, Daugherty PJ (2006) What makes community forest management successful:a meta-study from community forests throughout the world. Soc Nat Res 19(1):33–52
Pandit R, Bevilacqua E (2011) Forest users and environmental impacts of community forestry inthe hills of Nepal. Forest Policy Econ 13(5):345–352
Panta M, Kim K, Joshi C (2008) Temporal mapping of deforestation and forest degradation inNepal: applications to forest conservation. For Ecol Manage 256(9):1587–1595
Parmesan C, Burrows MT, Duarte CM, Poloczanska ES, Richardson AJ, Schoeman DS,Singer MC (2013) Beyond climate change attribution in conservation and ecological research.Ecol Lett 16:58–71
Paudel S, Sah JP (2003) Physiochemical characteristics of soil in tropical sal (Shorea robustaGaertn.) forests in eastern Nepal. Himalayan J Sci 1(2):107–110
Pokharel RK (2010) Generating income from Nepal’s community forestry: does timber matter? JForest Livelihood 9(1)
Reddy CS, Pasha SV, Satish KV, Saranya KR, Jha CS, Murthy YK. (2018) Quantifyingnationwide land cover and historical changes in forests of Nepal (1930–2014): Implications onforest fragmentation. Biodivers Conserv 1;27(1):91–107
Saxon E, Baker B, Hargrove W, Hoffman F, Zganjar C (2005) Mapping environments at riskunder different global climate change scenarios. Ecol Lett 8:53–60
Sharma E, Molden D, Rahman A, Khatiwada YR, Zhang L, Singh SP, ... Wester P (2019)Introduction to the hindu kush himalaya assessment. In: The Hindu Kush Himalayaassessment, pp 1–16. Springer, Cham
Stern NH, Siobhan P, Vicki B, Alex B, Catherine C, Sebastian C, Diane C et al (2006) Review: theeconomics of climate change, vol 30. Cambridge University Press, Cambridge
Thapa GJ, Wikramanayake E, Jnawali SR, Oglethorpe J, Adhikari R (2016) Assessing climatechange impacts on forest ecosystems for landscape-scale spatial planning in Nepal. Curr Sci345–352
The Economic Intelligence Unit Limited, ActionAid and Australia Aid (2014) The South Asiawomen’s resilience index: examining the role of women in preparing for and recovering fromdisasters. https://www.gdnonline.org/resources/The%20South%20Asia%20Women%27s%20Resilience%20Index%20Dec8.pdf. Accessed on 1 April 2020
Wester P, Mishra A, Mukherji A, Shrestha AB (2019) The Hindu Kush Himalaya assessment:mountains, climate change, sustainability and people, p 627. Springer Nature
Zomer RJ, Trabucco A, Metzger MJ, Wang M, Oli KP, Xu J (2014) Projected climate changeimpacts on spatial distribution of bioclimatic zones and ecoregions within the Kailash SacredLandscape of China, India, Nepal. Climatic Change 125(3–4):445–460
Open Access This chapter is licensed under the terms of the Creative Commons Attribution 4.0International License (http://creativecommons.org/licenses/by/4.0/), which permits use, sharing,adaptation, distribution and reproduction in any medium or format, as long as you give appropriatecredit to the original author(s) and the source, provide a link to the Creative Commons license andindicate if changes were made.The images or other third party material in this chapter are included in the chapter’s Creative
Commons license, unless indicated otherwise in a credit line to the material. If material is notincluded in the chapter’s Creative Commons license and your intended use is not permitted bystatutory regulation or exceeds the permitted use, you will need to obtain permission directly fromthe copyright holder.
7 Climate-Resilient Forest Management in Nepal 145
https://www.gdnonline.org/resources/The%20South%20Asia%20Women%2527s%20Resilience%20Index%20Dec8.pdf

Chapter 8Forest Fire Detection and Monitoring
Sunil Thapa, Vishwas Sudhir Chitale, Sudip Pradhan,Bikram Shakya, Sundar Sharma, Smriety Regmi,Sameer Bajracharya, Shankar Adhikari, and Gauri Shankar Dangol
8.1 Introduction
8.1.1 Forest Fire Across the World
Forest fire is one of the major global environmental issues, causing havoc in placesas disparate as cold Siberia, tropical Amazon, and the temperate HKH region(Fig. 8.1). Recent mega fires in Australia (Nolan et al. 2020), Brazil (BBC 2019),the United States, Greece (CNN 2020; Smith et al. 2019), and Indonesia have notonly destroyed ecosystems but have also triggered climate change through carbonemission (Mannan et al. 2017). A rise in global temperature by 2 °C has contributedto increased frequency of forest fire, though only 3% of all forest fires have beencaused naturally (Hirschberger 2016)—the majority of them have been sparked offby anthropogenic activities (FAO 2007).
HKH, known as the Third Pole, or the Water Tower, is likely to face an increasein the frequency of forest fires as it is a region sensitive and vulnerable to climatechange. The region is currently experiencing an annual increase in temperature by0.03–0.07 °C (IGES and ICIMOD 2013; Wester et al. 2019; Zomer et al. 2014).Climate change has had an impact on the increasing number of hot and dry days,thereby aggravating the risk of fire (Hirschberger 2016). Also, climate change andforest fire are interrelated and can have an impact on both—while forest fires cancause climate change through carbon emission (Joseph et al. 2009), an increase in
S. Thapa (&) � V. S. Chitale � S. Pradhan � B. Shakya � S. Bajracharya � G. S. DangolInternational Centre for Integrated Mountain Development, Kathmandu, Nepale-mail: [email protected]
S. Sharma � S. RegmiDepartment of Forests and Soil Conservation, Ministry of Forests and Environment,Kathmandu, Nepal
S. AdhikariREDD Implementation Centre, Ministry of Forests and Environment, Kathmandu, Nepal
© The Author(s) 2021B. Bajracharya et al. (eds.), Earth Observation Science and Applications for RiskReduction and Enhanced Resilience in Hindu Kush Himalaya Region,https://doi.org/10.1007/978-3-030-73569-2_8
147
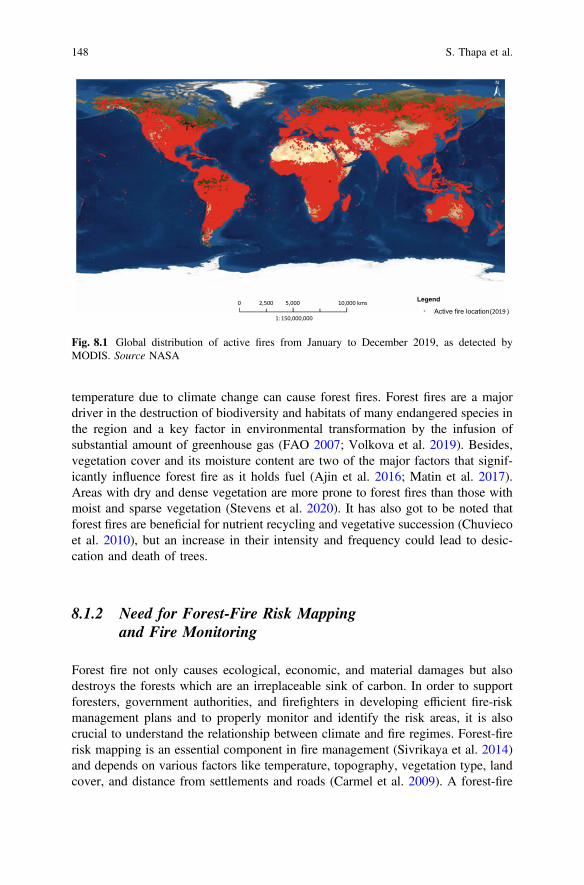
temperature due to climate change can cause forest fires. Forest fires are a majordriver in the destruction of biodiversity and habitats of many endangered species inthe region and a key factor in environmental transformation by the infusion ofsubstantial amount of greenhouse gas (FAO 2007; Volkova et al. 2019). Besides,vegetation cover and its moisture content are two of the major factors that signif-icantly influence forest fire as it holds fuel (Ajin et al. 2016; Matin et al. 2017).Areas with dry and dense vegetation are more prone to forest fires than those withmoist and sparse vegetation (Stevens et al. 2020). It has also got to be noted thatforest fires are beneficial for nutrient recycling and vegetative succession (Chuviecoet al. 2010), but an increase in their intensity and frequency could lead to desic-cation and death of trees.
8.1.2 Need for Forest-Fire Risk Mappingand Fire Monitoring
Forest fire not only causes ecological, economic, and material damages but alsodestroys the forests which are an irreplaceable sink of carbon. In order to supportforesters, government authorities, and firefighters in developing efficient fire-riskmanagement plans and to properly monitor and identify the risk areas, it is alsocrucial to understand the relationship between climate and fire regimes. Forest-firerisk mapping is an essential component in fire management (Sivrikaya et al. 2014)and depends on various factors like temperature, topography, vegetation type, landcover, and distance from settlements and roads (Carmel et al. 2009). A forest-fire
0 2,500 5,000
1: 150,000,000
10,000 kms Legend
Active fire location (2019 )
Fig. 8.1 Global distribution of active fires from January to December 2019, as detected byMODIS. Source NASA
148 S. Thapa et al.
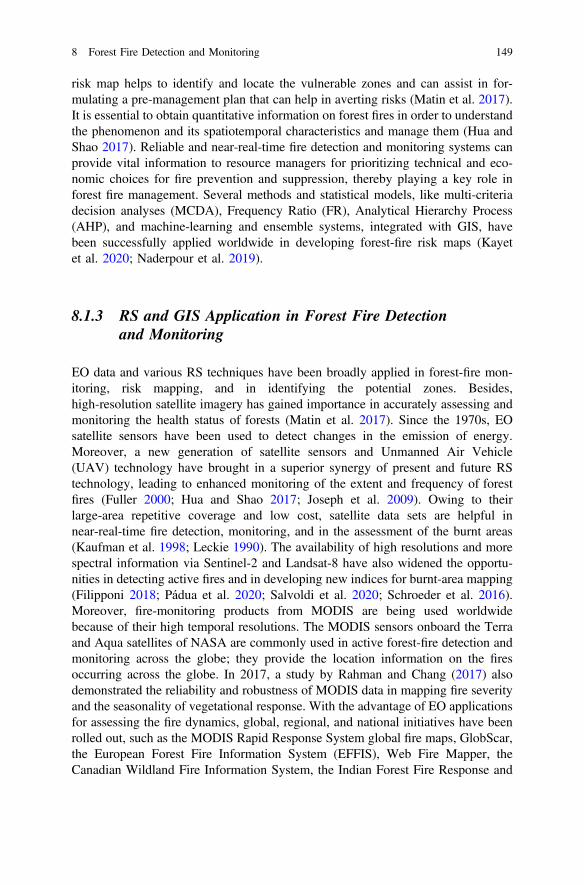
risk map helps to identify and locate the vulnerable zones and can assist in for-mulating a pre-management plan that can help in averting risks (Matin et al. 2017).It is essential to obtain quantitative information on forest fires in order to understandthe phenomenon and its spatiotemporal characteristics and manage them (Hua andShao 2017). Reliable and near-real-time fire detection and monitoring systems canprovide vital information to resource managers for prioritizing technical and eco-nomic choices for fire prevention and suppression, thereby playing a key role inforest fire management. Several methods and statistical models, like multi-criteriadecision analyses (MCDA), Frequency Ratio (FR), Analytical Hierarchy Process(AHP), and machine-learning and ensemble systems, integrated with GIS, havebeen successfully applied worldwide in developing forest-fire risk maps (Kayetet al. 2020; Naderpour et al. 2019).
8.1.3 RS and GIS Application in Forest Fire Detectionand Monitoring
EO data and various RS techniques have been broadly applied in forest-fire mon-itoring, risk mapping, and in identifying the potential zones. Besides,high-resolution satellite imagery has gained importance in accurately assessing andmonitoring the health status of forests (Matin et al. 2017). Since the 1970s, EOsatellite sensors have been used to detect changes in the emission of energy.Moreover, a new generation of satellite sensors and Unmanned Air Vehicle(UAV) technology have brought in a superior synergy of present and future RStechnology, leading to enhanced monitoring of the extent and frequency of forestfires (Fuller 2000; Hua and Shao 2017; Joseph et al. 2009). Owing to theirlarge-area repetitive coverage and low cost, satellite data sets are helpful innear-real-time fire detection, monitoring, and in the assessment of the burnt areas(Kaufman et al. 1998; Leckie 1990). The availability of high resolutions and morespectral information via Sentinel-2 and Landsat-8 have also widened the opportu-nities in detecting active fires and in developing new indices for burnt-area mapping(Filipponi 2018; Pádua et al. 2020; Salvoldi et al. 2020; Schroeder et al. 2016).Moreover, fire-monitoring products from MODIS are being used worldwidebecause of their high temporal resolutions. The MODIS sensors onboard the Terraand Aqua satellites of NASA are commonly used in active forest-fire detection andmonitoring across the globe; they provide the location information on the firesoccurring across the globe. In 2017, a study by Rahman and Chang (2017) alsodemonstrated the reliability and robustness of MODIS data in mapping fire severityand the seasonality of vegetational response. With the advantage of EO applicationsfor assessing the fire dynamics, global, regional, and national initiatives have beenrolled out, such as the MODIS Rapid Response System global fire maps, GlobScar,the European Forest Fire Information System (EFFIS), Web Fire Mapper, theCanadian Wildland Fire Information System, the Indian Forest Fire Response and
8 Forest Fire Detection and Monitoring 149

Assessment System (INFFRAS), and Nepal’s Forest Fire Detection and MonitoringSystem (Joseph et al. 2009; Matin et al. 2017). In the case of EFFIS, well-knownfor its comprehensive monitoring of forest fires, it is based on RS and GIS, andintegrated with components like fire-danger forecast, fire detection, forest-fireevents, burnt-area maps, land-cover damage assessment, emission assessment,potential soil erosion estimation, and vegetation regeneration (San-Miguel-Ayanzet al. 2012).
8.1.4 Forest-Fire Impacts During the Last Decade in Nepal
In Nepal, active fire incidents and burning days have been increasing annually andmore than half of the forest areas experience frequent fires (Fig. 8.2) during the dryseason (Parajuli et al. 2015). In Nepal too, anthropogenic activities are consideredto be main drivers of forest fire (Khanal 2015). From 2001 to 2019, more than38,000 fire incidents were reported from Nepal (MODIS archive data: https://earthdata.nasa.gov/firms). The years 2009 and 2016 were the worst, with severaldisastrous forest fires being reported; in 2016, more than 12,000 community forestsin 50 districts were damaged by forest fires, killing 15 people (CIFOR 2017;SERVIR Global 2018). In March 2009, high-intensity and disastrous fires engulfed48 places in Nepal, including several listed PAs, namely, Langtang, Makalu Barun,Chitwan, Shivapuri-Nagarjun, Bardia and Parsa national parks, Kanchenjunga andManaslu Conservation Areas, and the Dhorpatan Hunting Reserve (BBC 2012).Earlier, in 1995, about 90% of the forests in Terai had been affected by fires(Sharma 1996), while in April 2009, NASA listed Nepal as a country “most vul-nerable to wildfires” having registered the highest number in a day of 358 blazes(The Kathmandu Post 2016). In 2012, more than 70% of Bardiya National Park wasengulfed by fire, leading to the loss of 40% of small mammals, 60% of insects, anda substantial number of birds (BBC 2012). In this regard, our study focuses on theefforts in mapping forest-fire risk, and on monitoring and identifying the fire zonesin Nepal which could help decision makers in enhancing preparedness andresponses during such fires.
8.1.5 Collaborations and Partnerships for Forest-FireManagement in Nepal
Based on the demand from the country partners, in 2012, SERVIR jointly devel-oped a forest-fire detection and monitoring system for Nepal with its Department ofForests and Soil Conservation (DoFSC). In 2019, the system was upgraded incollaboration with the DoFSC in Nepal to include a feedback module for gettinginformation on incidents and damages from the field. Also, a fire-risk analysis and
150 S. Thapa et al.

reporting mechanism was incorporated into the system. The DoFSC played acrucial role in the uptake of these products in the planning process in a few districts,starting with Province 1. Besides ICIMOD, other partnerships and programs likethe Australia Capital Territory (ACT), Global Fire Monitoring Center (GFMC),Japan International Cooperation Agency (JICA), Korean Forestry Services (KFS),Nepal Forest Fire Management Chapter (NFFMC), Thompson Rivers University(TRU), USAID, and WWF also collaborated with the relevant Nepali agencies inforest-fire governance and management (Sombai et al. 2018). This chapter describesthe methodologies and the implementation processes of the fire monitoring systemand its components, including about fire-risk analysis and fire-alert monitoringmechanisms.
8.1.6 Objectives of the Forest-Fire Detectionand Monitoring System
The forest-fire detection and monitoring system in Nepal, with the help of theDoFSC, aims to support forest officials, local decision makers, stakeholders, andcommunity forest user groups in fire monitoring, analysis, and in the action requiredto minimize fire impacts. In addition, there’s a forest-fire monitoring web tool that
Fig. 8.2 Forest fires are common during the pre-monsoon season in Nepal. Photo by BirendraBajracharya
8 Forest Fire Detection and Monitoring 151

supplies visual information on historical forest fires as well as on near-real-time fireincidents and fire-risk areas.
8.2 Methodology
8.2.1 Fire-Risk Mapping
Several indices have been used and suggested to assess fire risks using natural andanthropogenic parameters (Matin et al. 2017; Sivrikaya et al. 2014; Zhang et al.2014). In this study, we used vegetation type (land cover), elevation, slope, andsurface temperature, as the natural parameters, and proximity to settlements androads as the anthropogenic factors to compute the fire risk index (FRI). The FRI isexpressed as shown in Eq. 8.1 (Matin et al. 2017):
FRI ¼X
Wi� Ci ð8:1Þ
where Wi is the relative weight of a variable and Ci is the rating for different classeswithin each variable.
The relative weights for variables were selected on the basis of literature (Adabet al. 2013; Matin et al. 2017) and the ratings of the different classes for eachvariable were selected on the basis of historical data analysis (Matin et al. 2017).Higher ratings were assigned to classes with relatively higher occurrence of his-torical fire incidence within that class compared to other classes.
FRI ¼ 10 LCRþ 6 TRþ 4 SDRþRDRð Þþ 2 ERþ SLRð Þ ð8:2Þ
where,
LCR = land cover ratingTR = temperature ratingSDR = settlement distance ratingRDR = road distance ratingER = elevation ratingSLR = slope rating
The exploratory data analysis method was used while assigning the ratings forthe variables.
Vegetation cover and its moisture content is one of the key factors that signif-icantly influence forest fire as it holds the availability of fuel (Ajin et al. 2016; Matinet al. 2017; Roy 2003). Areas having dry and dense vegetative cover are more proneto forest fires than those with moist and sparse cover. The ratings for these variableswere assigned as below (Table 8.1), a method adopted by Matin et al. (2017).
152 S. Thapa et al.

Table 8.1 Weights and ratings for different variables and classes
S. no. Variables Weight Classes Ratings Fire risk
1 Land cover 10 Broadleavedclosed forest
10 Very high
Broadleavedopen forest
6 High
Shrub land 4 Moderate
Grassland 4 Moderate
Needle-leavedclosed forest
2 Low
Needle-leavedopen forest
2 Low
Other landcover
0 Notconsidered
2 Average summer landsurface temperature
6 >30 °C 6 Very high
25–30 °C 4 High
20–25 °C 2 Moderate
<20 °C 1 Low
3 Distance from settlement 4 <1,000 m 6 Very high
1,000–2,000 m 4 High
2,000–3,000 m 2 Moderate
>3,000 m 1 Low
4 Distance from road 4 <1000 m 6 Very high
1,000–2,000 m 4 High
2,000–3,000 m 2 Moderate
>3,000 m 1 Low
5 Elevation 2 <1,000 m amsl 6 Very high
1,000–2,000 m amsl
4 High
2,000–3,000 m amsl
2 Moderate
>3,000 m amsl 1 Low
6 Slope 2 <15% 6 Very high
15–30% 4 High
30–35% 2 Moderate
>35% 1 Low
8 Forest Fire Detection and Monitoring 153
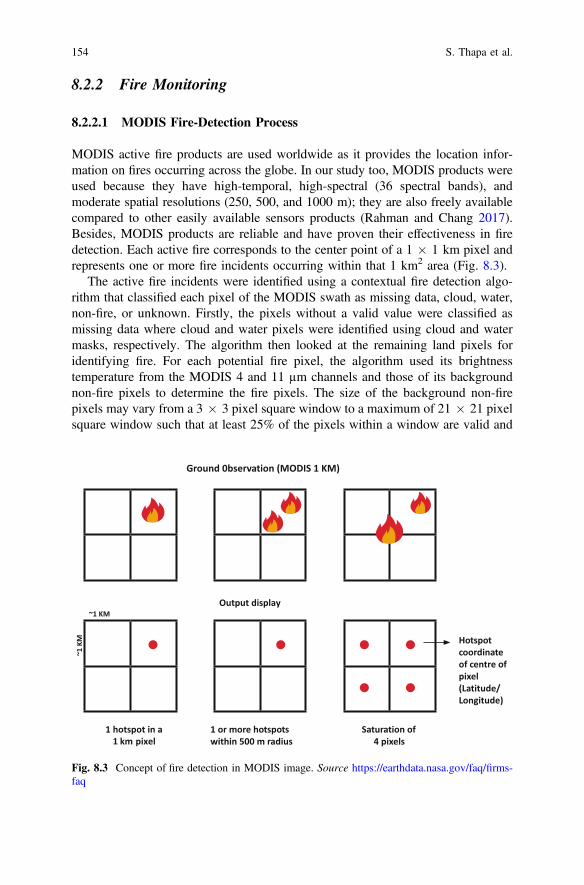
8.2.2 Fire Monitoring
8.2.2.1 MODIS Fire-Detection Process
MODIS active fire products are used worldwide as it provides the location infor-mation on fires occurring across the globe. In our study too, MODIS products wereused because they have high-temporal, high-spectral (36 spectral bands), andmoderate spatial resolutions (250, 500, and 1000 m); they are also freely availablecompared to other easily available sensors products (Rahman and Chang 2017).Besides, MODIS products are reliable and have proven their effectiveness in firedetection. Each active fire corresponds to the center point of a 1 � 1 km pixel andrepresents one or more fire incidents occurring within that 1 km2 area (Fig. 8.3).
The active fire incidents were identified using a contextual fire detection algo-rithm that classified each pixel of the MODIS swath as missing data, cloud, water,non-fire, or unknown. Firstly, the pixels without a valid value were classified asmissing data where cloud and water pixels were identified using cloud and watermasks, respectively. The algorithm then looked at the remaining land pixels foridentifying fire. For each potential fire pixel, the algorithm used its brightnesstemperature from the MODIS 4 and 11 µm channels and those of its backgroundnon-fire pixels to determine the fire pixels. The size of the background non-firepixels may vary from a 3 � 3 pixel square window to a maximum of 21 � 21 pixelsquare window such that at least 25% of the pixels within a window are valid and
Ground 0bservation (MODIS 1 KM)
1 or more hotspots within 500 m radius
1 hotspot in a 1 km pixel
Saturation of 4 pixels
Output display
Hotspot coordinateof centre of pixel (Latitude/ Longitude)
~1 K
M
~1 KM
Fig. 8.3 Concept of fire detection in MODIS image. Source https://earthdata.nasa.gov/faq/firms-faq
154 S. Thapa et al.
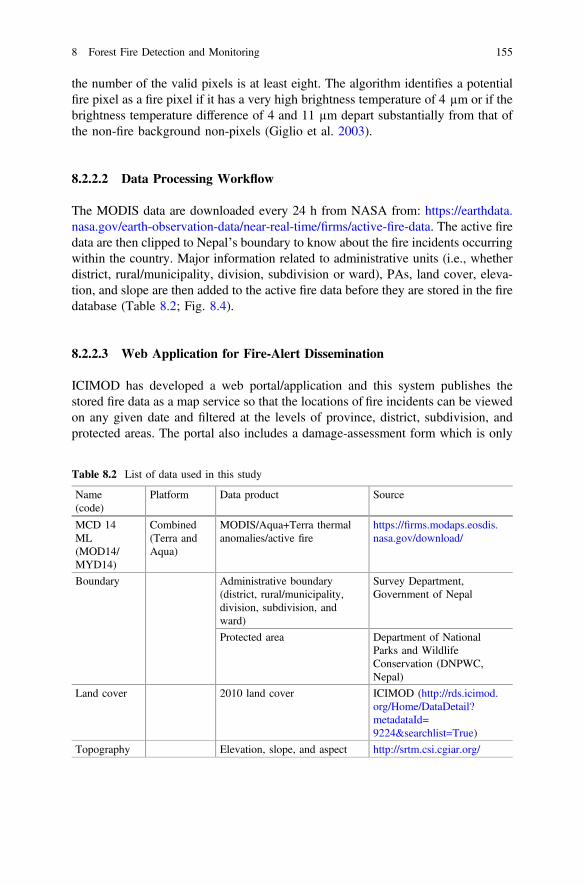
the number of the valid pixels is at least eight. The algorithm identifies a potentialfire pixel as a fire pixel if it has a very high brightness temperature of 4 µm or if thebrightness temperature difference of 4 and 11 µm depart substantially from that ofthe non-fire background non-pixels (Giglio et al. 2003).
8.2.2.2 Data Processing Workflow
The MODIS data are downloaded every 24 h from NASA from: https://earthdata.nasa.gov/earth-observation-data/near-real-time/firms/active-fire-data. The active firedata are then clipped to Nepal’s boundary to know about the fire incidents occurringwithin the country. Major information related to administrative units (i.e., whetherdistrict, rural/municipality, division, subdivision or ward), PAs, land cover, eleva-tion, and slope are then added to the active fire data before they are stored in the firedatabase (Table 8.2; Fig. 8.4).
8.2.2.3 Web Application for Fire-Alert Dissemination
ICIMOD has developed a web portal/application and this system publishes thestored fire data as a map service so that the locations of fire incidents can be viewedon any given date and filtered at the levels of province, district, subdivision, andprotected areas. The portal also includes a damage-assessment form which is only
Table 8.2 List of data used in this study
Name(code)
Platform Data product Source
MCD 14ML(MOD14/MYD14)
Combined(Terra andAqua)
MODIS/Aqua+Terra thermalanomalies/active fire
https://firms.modaps.eosdis.nasa.gov/download/
Boundary Administrative boundary(district, rural/municipality,division, subdivision, andward)
Survey Department,Government of Nepal
Protected area Department of NationalParks and WildlifeConservation (DNPWC,Nepal)
Land cover 2010 land cover ICIMOD (http://rds.icimod.org/Home/DataDetail?metadataId=9224&searchlist=True)
Topography Elevation, slope, and aspect http://srtm.csi.cgiar.org/
8 Forest Fire Detection and Monitoring 155

accessible to the authorized users. The form is in the Nepali language and it allowsentry of data about any damage to a forest or other property by fire, which is thenstored in a central database system.
8.2.2.4 Alert Generation and Distribution
When one or more fire incidents are detected in a district, the system sends out SMSalerts containing the location details of those fires to individuals who are subscribedto the SMS fire alert for that district. These alerts, delivered within 20 min ofdetection, have the ability to reach hundreds of divisional forest Officers and localcommunity representatives from all districts in Nepal. The SMS fire alert containsthe following information:
a. District nameb. Location details of individual fires in terms of latitude and longitudec. Rural/municipality name, and ward numberd. Forest division/subdivision namee. Protected area identification in case fire is detected within a protected area
The information about all the fire incidents occurring in a district is combined tocreate one SMS which is then sent to individuals who have subscribed from thatdistrict. Due to the restriction on the number of characters that can be sent in one
A ach important informa on (regarding district, rural/
municipality, subdivision, ward, protected area, etc.) to fire data
Damage assessment form
Clip to Nepal
boundary
MODIS ac ve fire data
Load to forest fire database
SMS no fica on
Email no fica on Web portal
Acquisi on
Analysis and storage
Dissemina on
h p://geoapps.icimod.org/NepalForestFire
Fig. 8.4 Workflow diagram
156 S. Thapa et al.
single SMS (160 characters), the fire alert may be received by the subscribers asmultiple SMSs in cases when there is a large number of fire incidents within a singledistrict. And to avoid false alarm, the notification on individual fire incidents isincluded in the SMS only if the “confidence” level of the active fire is greater than70% and only if it has occurred in forest, shrub, or grassland.
8.2.2.5 Email Alerts
The system also sends email notification on active fires throughout Nepal to all thesubscribers, which comprise divisional forest officers and other decision makers inthe country. These notifications contain the following detailed information onindividual fires:
a. Location details of individual fires in terms of latitude and longitudeb. District, rural/municipality name and ward numberc. Protected area identification in case fire is detected within a protected aread. Elevation (in meters)e. Slope (in percentage)f. Confidence (in percentage)
8.2.2.6 Fire-Incidence Maps and Feedback from Field
The system allows registered users to download maps with forest fire incidents onany given day. The fire-incidence maps were generated on the basis of fireoccurrence data of over 50% confidence level recorded by MODIS. To avoid wrongidentification, incidence levels of less than 50% were filtered out. The system alsoallows the user to view and select any information provided on this web platform.
A mobile application, “Nepal Forest Fire Detection and Alert”, has also beendeployed to support citizens in reporting forest fires in Nepal. Through the use ofthis application, members of CFUGs and forest department officials can nowrespond more quickly to fire dangers. Moreover, a damage assessment form hasbeen integrated into the web-based system that allows DoFSC officials to captureinformation on reported fire incidences, estimated damages, and on fatalities.
8.2.3 Temporal Distribution of Forest Fires in Nepal
A total of 38,248 active fires with a confidence level of 50% or more were recordedin Nepal by MODIS sensors from January 2001 to December 2019. The maximumnumber of fire incidents occurred in the year 2016 (Fig. 8.5), which were almost15% of all the total fire events that took place from 2001 to 2019; the secondhighest (9%) took place in 2009, followed by instances in 2019 (8%). A study by
8 Forest Fire Detection and Monitoring 157
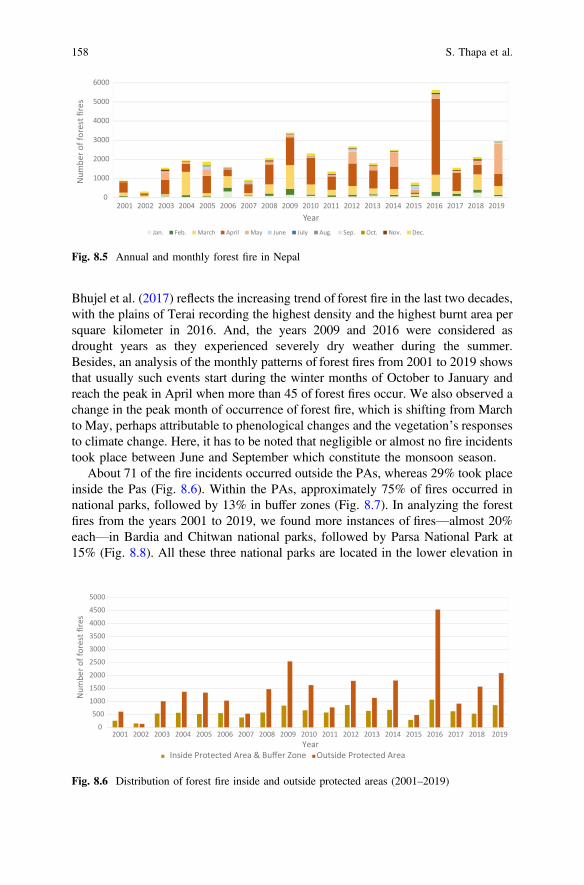
Bhujel et al. (2017) reflects the increasing trend of forest fire in the last two decades,with the plains of Terai recording the highest density and the highest burnt area persquare kilometer in 2016. And, the years 2009 and 2016 were considered asdrought years as they experienced severely dry weather during the summer.Besides, an analysis of the monthly patterns of forest fires from 2001 to 2019 showsthat usually such events start during the winter months of October to January andreach the peak in April when more than 45 of forest fires occur. We also observed achange in the peak month of occurrence of forest fire, which is shifting from Marchto May, perhaps attributable to phenological changes and the vegetation’s responsesto climate change. Here, it has to be noted that negligible or almost no fire incidentstook place between June and September which constitute the monsoon season.
About 71 of the fire incidents occurred outside the PAs, whereas 29% took placeinside the Pas (Fig. 8.6). Within the PAs, approximately 75% of fires occurred innational parks, followed by 13% in buffer zones (Fig. 8.7). In analyzing the forestfires from the years 2001 to 2019, we found more instances of fires—almost 20%each—in Bardia and Chitwan national parks, followed by Parsa National Park at15% (Fig. 8.8). All these three national parks are located in the lower elevation in
0
1000
2000
3000
4000
5000
6000
2001 2002 2003 2004 2005 2006 2007 2008 2009 2010 2011 2012 2013 2014 2015 2016 2017 2018 2019
Num
ber o
f for
est fi
res
YearJan. Feb. March April May June July Aug. Sep. Oct. Nov. Dec.
Fig. 8.5 Annual and monthly forest fire in Nepal
0
500
1000
1500
2000
2500
3000
3500
4000
4500
5000
2001 2002 2003 2004 2005 2006 2007 2008 2009 2010 2011 2012 2013 2014 2015 2016 2017 2018 2019
Num
ber o
f for
est fi
res
YearInside Protected Area & Buffer Zone Outside Protected Area
Fig. 8.6 Distribution of forest fire inside and outside protected areas (2001–2019)
158 S. Thapa et al.
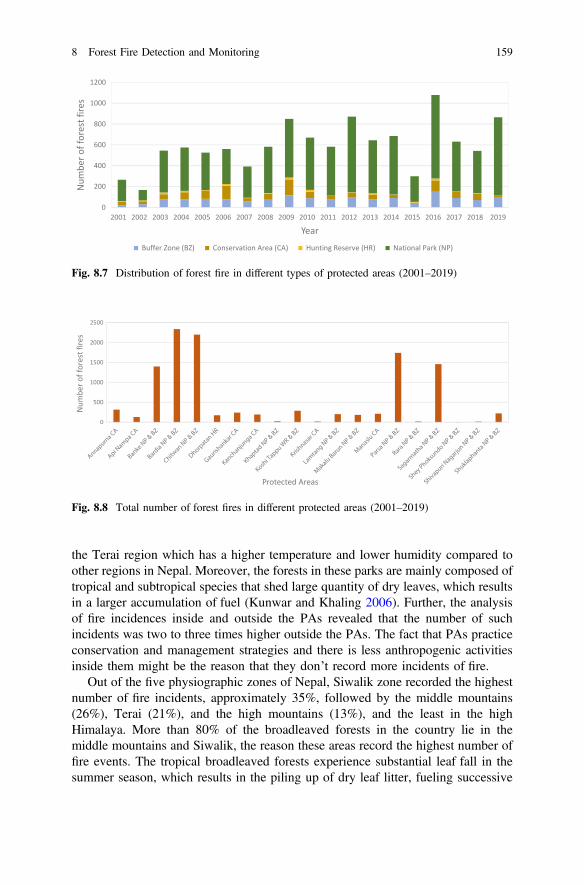
the Terai region which has a higher temperature and lower humidity compared toother regions in Nepal. Moreover, the forests in these parks are mainly composed oftropical and subtropical species that shed large quantity of dry leaves, which resultsin a larger accumulation of fuel (Kunwar and Khaling 2006). Further, the analysisof fire incidences inside and outside the PAs revealed that the number of suchincidents was two to three times higher outside the PAs. The fact that PAs practiceconservation and management strategies and there is less anthropogenic activitiesinside them might be the reason that they don’t record more incidents of fire.
Out of the five physiographic zones of Nepal, Siwalik zone recorded the highestnumber of fire incidents, approximately 35%, followed by the middle mountains(26%), Terai (21%), and the high mountains (13%), and the least in the highHimalaya. More than 80% of the broadleaved forests in the country lie in themiddle mountains and Siwalik, the reason these areas record the highest number offire events. The tropical broadleaved forests experience substantial leaf fall in thesummer season, which results in the piling up of dry leaf litter, fueling successive
0
200
400
600
800
1000
1200N
umbe
r of f
ores
t fire
s
Year
Buffer Zone (BZ) Conservation Area (CA) Hunting Reserve (HR) National Park (NP)
2001 2002 2003 2004 2005 2006 2007 2008 2009 2010 2011 2012 2013 2014 2015 2016 2017 2018 2019
Fig. 8.7 Distribution of forest fire in different types of protected areas (2001–2019)
0
500
1000
1500
2000
2500
Num
ber o
f for
est f
ires
Protected Areas
Fig. 8.8 Total number of forest fires in different protected areas (2001–2019)
8 Forest Fire Detection and Monitoring 159

and extended incidents of fire during summers (Matin et al. 2017). In the forest-firetrend analysis, out of the seven provinces, Province 5 showed the highest number offire incidents of about 23%, followed by Sudur Paschim (Province 7) of 19%,Karnali (Province 6) of 15%, Province 3 of 14%, Province 2 of 11%, and Gandakiand Province 1 of 9% (Fig. 8.9).
8.2.4 Characteristics of the Location of Fire Occurrence
The majority of the forest fires were reported from low-elevation areas (up to1,000 masl). More than 85% of the fires were recorded below the elevation of2,000 masl, of which 65 occurred below 1,000 masl. Only a negligible per cent(about 1%) of fire incidents were recorded above 4,000 masl. Besides elevation,slopes also have an effect on the distribution of forest fire. A significant number offires were recorded in plain lands with less than 5% sloping and in moderate landswith 15–35% sloping. A negligible number of fire events were noted in thesteep-land areas (>50% slope).
8.2.5 Forest-Fire Risk Zone and Vulnerability
Six major driving factors, namely, land cover, average summer land-surface tem-perature, distance from settlement, distance from road, elevation, and slope weretaken into account while analyzing the forest-fire risk zone. The study demonstratesthat out of 77 districts, 12 districts fall into very high forest-fire risk zones and 11districts in the high-risk class (Fig. 8.7). Most of the districts located in Terai andSiwalik zones are in the very high and high-risk classes.
0100020003000400050006000700080009000
10000
Province 1 Province 2 BagmatiProvince
GandakiProvince
Province 5 Karnali Province SudurpaschimProvince
Num
ber o
f for
est f
ires
Province
Fig. 8.9 Province-wise forest fire from 2001 to 2019
160 S. Thapa et al.

The province-wise forest-fire risk analysis reflects that the forest area (about4,000 km2) in Province 5 is more vulnerable and falls under the very high-riskcategory (Fig. 8.10), followed by Bagmati Province (�3,400 km2) andSudurpashchim Province (>2,600 km2); whereas Province 1 is in very low fire-riskclass (Fig. 8.11).
Fig. 8.10 Forest-fire risk map of Province 5
0.00
2000.00
4000.00
6000.00
8000.00
10000.00
12000.00
14000.00
Province 1 Province 2 Bagmti Province Gandaki Province Province 5 Karnali Province SudurpashchimProvince
Area
sq. k
m
Province
Very low Low Moderate High Very high
Fig. 8.11 Province-level forest-fire risk classification
8 Forest Fire Detection and Monitoring 161

8.2.6 Forest-Fire Monitoring System in Nepal
Nepal’s forests exhibit a high level of threat from fires, which occur predominantlyduring February to May, with its peak being mid-April. In this regard, it isimperative to understand the temporal pattern of the fires in order to be betterprepared and disseminate timely fire-alert messages. In a bid to record the forest-firerisk areas in Nepal, a SERVIR-HKH team and the DoFSC co-developed a mapshowing the fire-risk areas zones in Nepal. This map depicts the risk levels in all the77 districts of Nepal—from very low to very high risk—which can help decisionmakers in prioritizing forest management activities, especially with regard toreducing the risk of forest fires. The map is placed in the forest-fire control room inDoFSC, which is the main monitoring station in Nepal that reports the occurrenceof forest fires to the relevant agencies. Following hands-on training by theSERVIR-HKH team, the DoFSC has prepared province- and division-level maps tohelp the relevant stakeholders in reducing forest-fire risks at various spatial scales.Besides, based on a request from DoFSC, a forest-fire alert and monitoring web tool(http://geoapps.icimod.org/NepalForestFire) has been customized which contains aform that mentions, apart from other details, the extent of damage caused by suchfires. The web tool is available both in Nepali and English languages (Figs. 8.11and 8.12). This tool not only provides real-time information on the occurrence offorest fires but also sends SMSs and emails to officials from all forest divisions,subdivisions, and to the members of community forest user’s groups across thecountry. In the year 2019, more than 300 fire-alert SMSs were sent to districtofficials in the months of April, May, and June; more than 200 SMSs were sent inthe month of May alone, with Salyan district receiving the highest number (68) offire-alert SMSs in that month (Fig. 8.13).
Fig. 8.12 Forest-fire detection and monitoring web tool
162 S. Thapa et al.
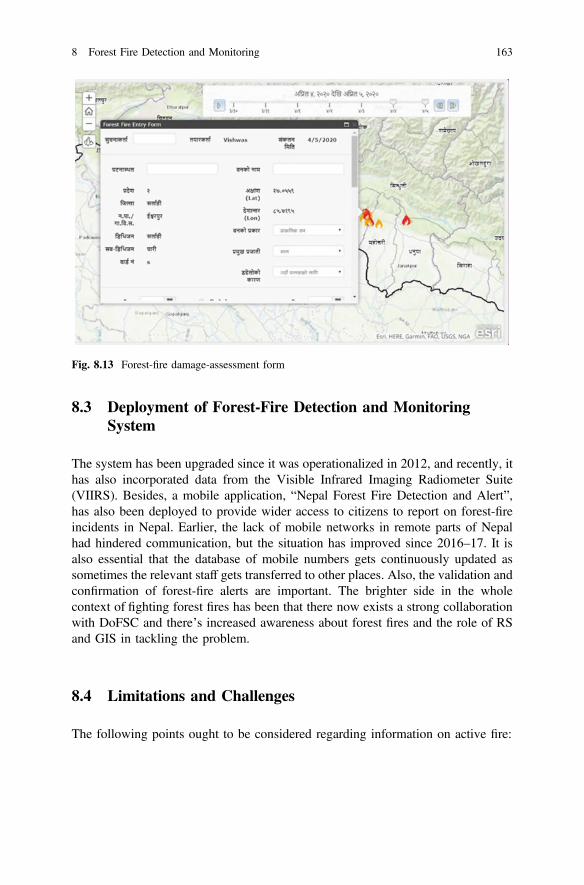
8.3 Deployment of Forest-Fire Detection and MonitoringSystem
The system has been upgraded since it was operationalized in 2012, and recently, ithas also incorporated data from the Visible Infrared Imaging Radiometer Suite(VIIRS). Besides, a mobile application, “Nepal Forest Fire Detection and Alert”,has also been deployed to provide wider access to citizens to report on forest-fireincidents in Nepal. Earlier, the lack of mobile networks in remote parts of Nepalhad hindered communication, but the situation has improved since 2016–17. It isalso essential that the database of mobile numbers gets continuously updated assometimes the relevant staff gets transferred to other places. Also, the validation andconfirmation of forest-fire alerts are important. The brighter side in the wholecontext of fighting forest fires has been that there now exists a strong collaborationwith DoFSC and there’s increased awareness about forest fires and the role of RSand GIS in tackling the problem.
8.4 Limitations and Challenges
The following points ought to be considered regarding information on active fire:
Fig. 8.13 Forest-fire damage-assessment form
8 Forest Fire Detection and Monitoring 163

a. The active-fire data provide only the location information, i.e., center of the firepixel of 1 � 1 km area and it shall be used as alert over 1 km2 area, not theexact point.
b. There are some problems with fire alerts:
• Sometimes, due to the coarse resolution of the fire pixel, a fire occurring inone district may be falsely reported as one occurring in a neighboringdistrict.
• Certain small-duration fires may have been extinguished by the time thesubscribers get the fire alert since currently, the alerts are sent after about twoto four hours of the satellite’s passing.
c. Certain fires may be missed out because they are of a smaller size or smoldering,and they were not occurring during the satellite’s passing.
d. SMS alerts may not reach the subscribers on time because of some technicalissues faced by Nepal Telecom.
8.5 Capacity Enhancement of Partners
Several training programs on forest-fire detection and monitoring systems havebeen provided to the DoFSC staff with the aim to enhance and strengthen theDoFSC’s institutional capacity in generating information on important attributessuch as forest-fire risk, fire occurrence, and damage to the forests. Training mate-rials, hands-on exercises, and flyers have been developed on how to use theforest-fire monitoring system and web application. The DoFSC staff are now wellacquainted with fire-monitoring system and web application. They have alsobecome skilled in identifying the vulnerable zones, which has helped them inminimizing the impacts of forest fire.
8.6 Way Forward
With the help of fire-risk zonal maps and other forest-fire monitoring tools, theforest managers can now easily track the fire-risk areas and develop strategies in firemanagement. This has also enabled efficient and effective decision-making inminimizing the impacts of fires as well as in allocating resources to the province,district, or area that face high fire risk.
More users should be brought into the firefighting system—from the forestdirectorates in the seven provinces and the 84 divisional forest offices in thecountry. The MoFE, DoFSC, and the province-level forest directorates should workin unison and reach out to all levels of administration and community to tackle themenace of forest fires. This can be facilitated through appropriate policy and
164 S. Thapa et al.

program support, dissemination of information, and the monitoring of activities onthe field. There’s also a strong case for regional cooperation in the firefighting arenawhereby all the relevant agencies are not only made aware of the seriousness of theproblem but also of the fact that fires know no boundaries.
References
Adab H, Kanniah KD, Solaimani K (2013) Modeling forest fire risk in the northeast of Iran usingremote sensing and GIS techniques. Nat Hazards 65:1723–1743. https://doi.org/10.1007/S11069-012-0450-8
Ajin RS, Loghin AM, Jacob MK, Vinod PG, Krishnamurthy RR (2016) The risk assessment studyof potential forest fire in Idukki Wildlife Sanctuary using RS and GIS techniques. Int J AdvEarth Sci Eng 5(1):308–318
BBC (2012) Nepal forest fires ‘cause big wildlife loss’. https://www.bbc.com/news/science-environment-17937620. Accessed Aug 2019
BBC (2019) The Amazon in Brazil is on fire-how bad is it? https://www.bbc.com/news/world-latin-america-49433767. Accessed Feb 2020
Bhujel KB, Maskey-Byanju R, Gautam AP (2017) Wildfire dynamics in Nepal from 2000–2016.Nepal J Environ Sci 5:1–8
Carmel Y, Paz S, Jahashan F, Shoshany M (2009) Assessing fire risk using Monte Carlosimulations of fire spread. For Ecol Manage 257(1):370–377
Chuvieco E, Aguado I, Yebra M, Nieto H, Salas J, Martín MP, De La Riva J (2010) Developmentof a framework for fire risk assessment using remote sensing and geographic informationsystem technologies. Ecol Model 221(1):46–58
CIFOR (2017) Nepal’s forest fires. https://forestsnews.cifor.org/48187/nepals-forest-fires?fnl.Accessed Aug 2019
CNN (2020) California wildfires have burned an area almost the size of Connecticut. https://edition.cnn.com/2020/09/14/us/california-wildfires-monday/index.html Accessed Sept 2020
FAO (2007) Fire management-global assessment 2006. A thematic study prepared in theframework of the global forest resources assessment 2005. FAO, Rome
Filipponi F (2018) BAIS2: burned area index for Sentinel-2. In: Multidisciplinary digitalpublishing institute proceedings, vol 2, no 7, p 364
Fuller DO (2000) Satellite remote sensing of biomass burning with optical and thermal sensors.Prog Phys Geogr 24(4):543–561
Giglio L, Descloitres J, Justice CO, Kaufman YJ (2003) An enhanced contextual fire detectionalgorithm for MODIS. Remote Sens Environ 87(2–3):273–282
Hirschberger P (2016) Forests ablaze: causes and effects of global forest fires [Winter S, vonLaer Y, Köberich T (eds)]
Hua L, Shao G (2017) The progress of operational forest fire monitoring with infrared remotesensing. J Forest Res 28(2):215–229
IGES, ICIMOD (2013) Technical report: climate change adaptation needs of people of the HinduKush Himalayas. IGES, Hayama, Japan
Joseph S, Anitha K, Murthy MSR (2009) Forest fire in India: a review of the knowledge base.J For Res 14(3):127–134
Kathmandu Post (2016) Blazes raging across country. https://kathmandupost.com/national/2016/04/12/blazes-raging-across-country. Accessed Feb 2020
Kaufman YJ, Justice CO, Flynn LP, Kendall JD, Prins EM, Giglio L, Setzer AW (1998) Potentialglobal fire monitoring from EOS-MODIS. J Geophys Res Atmos 103(D24):32215–32238
8 Forest Fire Detection and Monitoring 165

Kayet N, Chakrabarty A, Pathak K, Sahoo S, Dutta T, Hatai BK (2020) Comparative analysis ofmulti-criteria probabilistic FR and AHP models for forest fire risk (FFR) mapping in MelghatTiger Reserve (MTR) forest. J For Res 31(2):565–579
Khanal S (2015) Wildfire trends in Nepal based on MODIS burnt-area data. Banko Janakari 25(1):76–79
Kunwar RM, Khaling S (2006) Forest fire in the Terai, Nepal: causes and community managementinterventions. Int For Fire News 34:46–54
Leckie DG (1990) Advances in remote sensing technologies for forest surveys and management.Can J For Res 20(4):464–483
Mannan A, Feng Z, Ahmad A, Beckline M, Saeed S, Liu J, Shah S, Amir M, Ammara U, Ullah T(2017) CO2 emission trends and risk zone mapping of forest fires in subtropical and moisttemperate forests of Pakistan. Appl Ecol Environ Res 17(2):2983–3002
Matin MA, Chitale VS, Murthy MS, Uddin K, Bajracharya B, Pradhan S (2017) Understandingforest fire patterns and risk in Nepal using remote sensing, geographic information system andhistorical fire data. Int J Wildland Fire 26(4):276–286
Naderpour M, Rizeei HM, Khakzad N, Pradhan B (2019) Forest fire induced Natech riskassessment: a survey of geospatial technologies. Reliab Eng Syst Saf 191:106558
Nolan RH, Boer MM, Collins L, Resco de Dios V, Clarke H, Jenkins M, Bradstock RA (2020)Causes and consequences of eastern Australia’s 2019–20 season of mega-fires. Glob ChangeBiol 26(3):1039–1041
Pádua L, Guimarães N, Adão T, Sousa A, Peres E, Sousa JJ (2020) Effectiveness of Sentinel-2 inmulti-temporal post-fire monitoring when compared with UAV imagery. ISPRS Int JGeo-Inform 9(4):225
Parajuli A, Chand DB, Rayamajhi B, Khanal R, Baral S, Malla Y, Poudel S (2015) Spatial andtemporal distribution of forest fires in Nepal, pp 7–11. XIV World Forestry Congress, Durban,South Africa
Rahman S, Chang HC (2017) Assessment of fire severity and vegetation response usingmoderate-resolution imaging spectroradiometer: moderate resolution (MODIS) satellite imagesto assess vegetation response after a big fire event at the selected national parks around Sydney,Australia. In: 2017 eleventh international conference on sensing technology (ICST), pp 1–6.IEEE
Roy PS (2003) Forest fire and degradation assessment using satellite remote sensing andgeographic information system. Satellite remote sensing and GIS applications in agriculturalmeteorology, p 361
Salvoldi M, Siaki G, Sprintsin M, Karnieli A (2020) Burned area mapping using multi-temporalsentinel-2 data by applying the relative differenced aerosol-free vegetation index (RdAFRI).Remote Sens 12(17):2753
San-Miguel-Ayanz J, Schulte E, Schmuck G, Camia A, Strobl P, Liberta G, McInerney D (2012)Comprehensive monitoring of wildfires in Europe: the European forest fire information system(EFFIS). In: Approaches to managing disaster-Assessing hazards, emergencies and disasterimpacts. IntechOpen
Schroeder W, Oliva P, Giglio L, Quayle B, Lorenz E, Morelli F (2016) Active fire detection usingLandsat-8/OLI data. Remote Sens Environ 185:210–220
SERVIR Global (2018) Satellite data aids forest fire detect in and monitoring in Nepal. https://servirglobal.net/Global/Articles/Article/2642/satellite-data-aids-forest-fire-detection-and-monitoring-in-nepal. Accessed Feb 2020
Sharma SP (1996) Forest fire in Nepal. Int For Fire News 15:36–39Sivrikaya F, Sağlam B, Akay AE, Bozali N (2014) Evaluation of forest fire risk with GIS. Pol J
Environ Stud 23(1)Smith A, Schismenos S, Stevens G, Hutton L, Chalaris M, Emmanouloudis D (2019)
Understanding large-scale fire events: megafires in Attica, Greece and California, USA. In:Youth science policy interface publication-2nd special edition: disaster risk reduction: movingforward, thinking ahead, pp 29–34
166 S. Thapa et al.

Sombai IG, Karakatsoulis J, Gardner W, Gautam AP, Sharma SP, Adhikari B (2018) Forestgovernance in Nepal: rationale for centralised forest and wildfire management. J Manage DevStud 28:16–35
Stevens JT, Boisramé GF, Rakhmatulina E, Thompson SE, Collins BM, Stephens SL (2020)Forest vegetation change and its impacts on soil water following 47 years of managed wildfire.Ecosystems 1–19
Volkova L, Roxburgh SH, Surawski NC, Meyer CM, Weston CJ (2019) Improving reporting ofnational greenhouse gas emissions from forest fires for emission reduction benefits: an examplefrom Australia. Environ Sci Policy 94:49–62
Wester A, Mishra A, Mukherji AB, Shrestha (eds) (2019) The Hindu Kush Himalaya assessment—mountains, climate change, sustainability and people. Springer Nature Switzerland AG, Cham
Zhang H, Qi P, Guo G (2014) Improvement of fire danger modelling with geographically weightedlogistic model. Int J Wildland Fire 23(8):1130–1146
Zomer RJ, Trabucco A, Metzger MJ, Wang M, Oli KP, Xu J (2014) Projected climate changeimpacts on spatial distribution of bioclimatic zones and ecoregions within the Kailash SacredLandscape of China, India, Nepal. Clim Change 125(3–4):445
Open Access This chapter is licensed under the terms of the Creative Commons Attribution 4.0International License (http://creativecommons.org/licenses/by/4.0/), which permits use, sharing,adaptation, distribution and reproduction in any medium or format, as long as you give appropriatecredit to the original author(s) and the source, provide a link to the Creative Commons license andindicate if changes were made.The images or other third party material in this chapter are included in the chapter’s Creative
Commons license, unless indicated otherwise in a credit line to the material. If material is notincluded in the chapter’s Creative Commons license and your intended use is not permitted bystatutory regulation or exceeds the permitted use, you will need to obtain permission directly fromthe copyright holder.
8 Forest Fire Detection and Monitoring 167

Chapter 9Enhancing Flood Early Warning Systemin the HKH Region
Karma Tsering, Kiran Shakya, Mir A. Matin, Jim Nelson,and Birendra Bajracharya
9.1 Introduction
Flooding is a chronic natural hazard with disastrous impacts that have magnifiedover the last decade due to the rising trend in extreme weather events and growingsocietal vulnerability from global socioeconomic and environmental changes(WMO/GWP 2011). Such unprecedented change is manifest in the increasedseverity and frequency of climate-induced hazards that are intensifying disastrousconsequences, in particular, flood disasters. While vulnerable nations grapple withthe flip side, it has globally-inspired collective interest and resolves to anticipateextremes, invest in building resilient societies and economies, and make proactiveinterventions. Catastrophic floods impact tens of millions of people each year andcause significant infrastructure damage around the world. The situation is gettingworse due to increasing population, urbanization, and economic development inhazard-prone areas (Etienne et al. 2019). Floods are among the most frequentlyoccurring and deadly natural phenomena, affecting on an average 520 millionpeople a year (UNESCO 2007). Almost half the people killed in the last decade (asa result of natural disasters were victims of floods, which also account for aboutone-third of economic losses (CRED/EM-DAT 2020). Globally, flash floods areamong the world’s deadliest natural disasters accounting for almost 85% of theflood incidences with the highest mortality rate among different classes of floodingand resulting in significant social, economic, and environmental impacts (Fig. 9.1).Flash floods are also difficult to forecast compared to riverine (floodplain) floodsdue to their rapid onset and as they occur in smaller basins due to intense andincessant rainfall. Also less frequent but more catastrophic are the flash floods
K. Tsering (&) � K. Shakya � M. A. Matin � B. BajracharyaInternational Centre for Integrated Mountain Development, Kathmandu, Nepale-mail: [email protected]
J. NelsonBrigham Young University, Provo, UT, USA
© The Author(s) 2021B. Bajracharya et al. (eds.), Earth Observation Science and Applications for RiskReduction and Enhanced Resilience in Hindu Kush Himalaya Region,https://doi.org/10.1007/978-3-030-73569-2_9
169
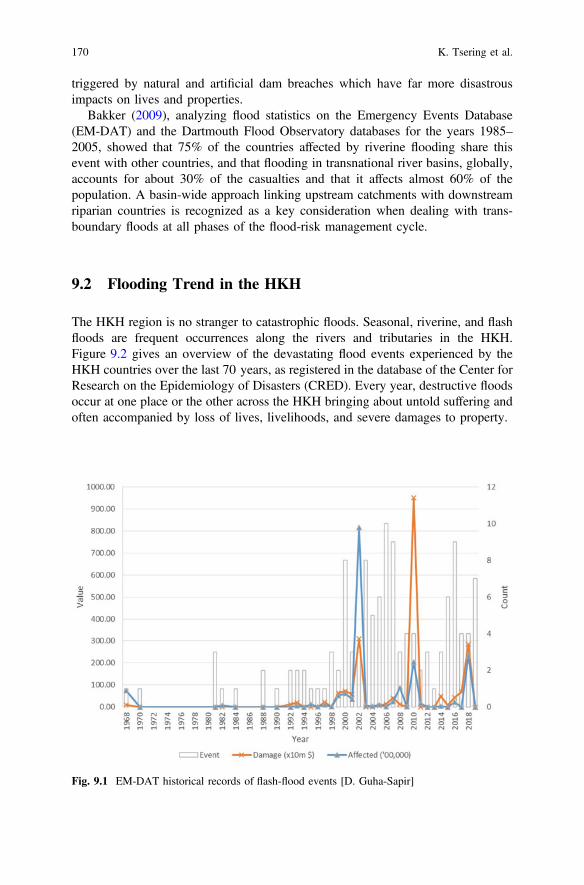
triggered by natural and artificial dam breaches which have far more disastrousimpacts on lives and properties.
Bakker (2009), analyzing flood statistics on the Emergency Events Database(EM-DAT) and the Dartmouth Flood Observatory databases for the years 1985–2005, showed that 75% of the countries affected by riverine flooding share thisevent with other countries, and that flooding in transnational river basins, globally,accounts for about 30% of the casualties and that it affects almost 60% of thepopulation. A basin-wide approach linking upstream catchments with downstreamriparian countries is recognized as a key consideration when dealing with trans-boundary floods at all phases of the flood-risk management cycle.
9.2 Flooding Trend in the HKH
The HKH region is no stranger to catastrophic floods. Seasonal, riverine, and flashfloods are frequent occurrences along the rivers and tributaries in the HKH.Figure 9.2 gives an overview of the devastating flood events experienced by theHKH countries over the last 70 years, as registered in the database of the Center forResearch on the Epidemiology of Disasters (CRED). Every year, destructive floodsoccur at one place or the other across the HKH bringing about untold suffering andoften accompanied by loss of lives, livelihoods, and severe damages to property.
Fig. 9.1 EM-DAT historical records of flash-flood events [D. Guha-Sapir]
170 K. Tsering et al.
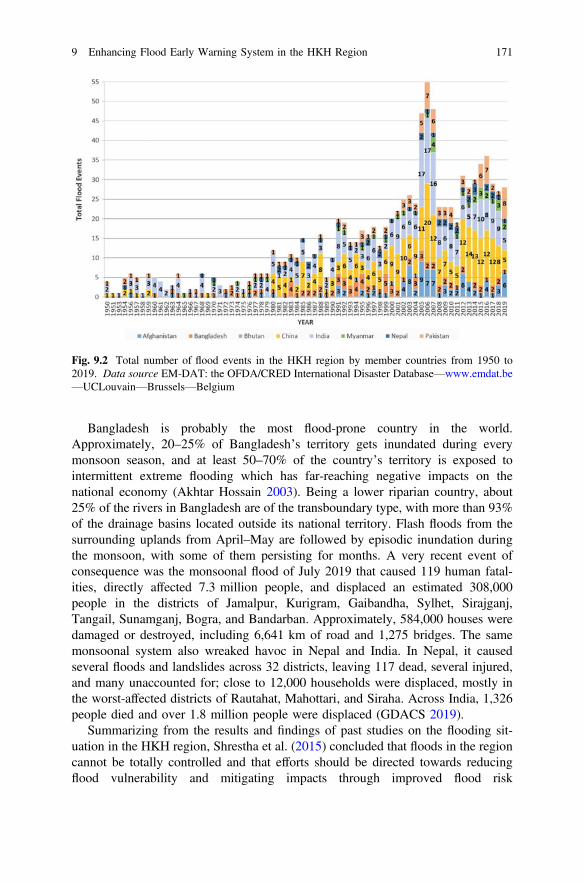
Bangladesh is probably the most flood-prone country in the world.Approximately, 20–25% of Bangladesh’s territory gets inundated during everymonsoon season, and at least 50–70% of the country’s territory is exposed tointermittent extreme flooding which has far-reaching negative impacts on thenational economy (Akhtar Hossain 2003). Being a lower riparian country, about25% of the rivers in Bangladesh are of the transboundary type, with more than 93%of the drainage basins located outside its national territory. Flash floods from thesurrounding uplands from April–May are followed by episodic inundation duringthe monsoon, with some of them persisting for months. A very recent event ofconsequence was the monsoonal flood of July 2019 that caused 119 human fatal-ities, directly affected 7.3 million people, and displaced an estimated 308,000people in the districts of Jamalpur, Kurigram, Gaibandha, Sylhet, Sirajganj,Tangail, Sunamganj, Bogra, and Bandarban. Approximately, 584,000 houses weredamaged or destroyed, including 6,641 km of road and 1,275 bridges. The samemonsoonal system also wreaked havoc in Nepal and India. In Nepal, it causedseveral floods and landslides across 32 districts, leaving 117 dead, several injured,and many unaccounted for; close to 12,000 households were displaced, mostly inthe worst-affected districts of Rautahat, Mahottari, and Siraha. Across India, 1,326people died and over 1.8 million people were displaced (GDACS 2019).
Summarizing from the results and findings of past studies on the flooding sit-uation in the HKH region, Shrestha et al. (2015) concluded that floods in the regioncannot be totally controlled and that efforts should be directed towards reducingflood vulnerability and mitigating impacts through improved flood risk
Fig. 9.2 Total number of flood events in the HKH region by member countries from 1950 to2019. Data source EM-DAT: the OFDA/CRED International Disaster Database—www.emdat.be—UCLouvain—Brussels—Belgium
9 Enhancing Flood Early Warning System in the HKH Region 171

management by providing end-to-end flood forecasting and warning services. Floodevents cause far more suffering and bring economic burden on the poor and themarginalized communities in the mountains since the socioeconomic situation andlack of political voice invariably condemn them to the most vulnerable sites forsustenance. The study concluded that on an average, 76 flood disasters occurannually in the region, accounting for thousands of deaths and millions of affectedpeople. The breach of the Koshi barrage in the 2008 flood event was a textbookcase during which millions were displaced across Nepal and Bihar, and hundreds oflives were lost, along with millions worth of Indian rupees’ in damage anddestruction.
Generally, the HKH region is vulnerable to flooding during the summer mon-soon season; however, its western part does experience significant and sometimesdevastating pre- and post-monsoon floods associated with mid-latitude westerlystorms. Pakistan has suffered massive flood disasters in recent decades causing hugeeconomic impact and human suffering. When normalized to the respective coun-try’s economic strength and population size, Nepal, Afghanistan, and Bangladeshshow higher socioeconomic impacts of flooding (Elalem and Pal 2014).
Improvements in flood forecasting and the ability to communicate actionableinformation to those at-risk have substantial lifesaving and monetary benefits. Butthe benefits will accrue only if early warnings lead to early action, which can verymuch depend on the credibility and available lead-time of the warning information.Communication and dissemination are consistently being identified as the weakestlinks in the flood management chain despite tremendous growth in informationproducts and increasing demand from the stakeholders and affected communities.There is a real need for targeted and tailored communication of flood information toreach the local level.
The targets set under the Sendai Framework for Disaster Risk Reduction(SFDRR) and the Sustainable Development Goals (SDGs) advocate flood earlywarning systems (EWSs) as a flood-risk management measure (UNISDR 2006).However, despite widespread recognition (UNDRR 2004; WMO 2013;Pappenberger et al. 2015; Thielen del Pozo et al. 2015), the operational status,benefits, and costs, and the challenges and trends associated with these systemshave still not been fully understood so as to garner concrete support and commit-ment for wider adoption and upscaling to multi-hazard capability (Perera et al.2019).
9.2.1 Perspective on the Current State of FloodManagement—Issues and Challenges
The way people deal with floods determines whether water remains a life-providingelement or becomes a destructive force against human life and economic devel-opment. Traditionally, flood management has focused on reactive practices largely
172 K. Tsering et al.
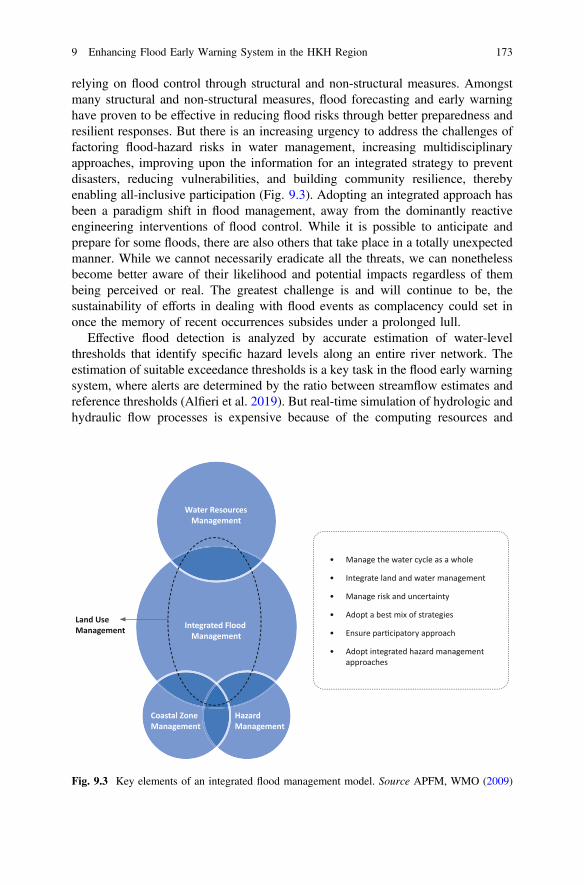
relying on flood control through structural and non-structural measures. Amongstmany structural and non-structural measures, flood forecasting and early warninghave proven to be effective in reducing flood risks through better preparedness andresilient responses. But there is an increasing urgency to address the challenges offactoring flood-hazard risks in water management, increasing multidisciplinaryapproaches, improving upon the information for an integrated strategy to preventdisasters, reducing vulnerabilities, and building community resilience, therebyenabling all-inclusive participation (Fig. 9.3). Adopting an integrated approach hasbeen a paradigm shift in flood management, away from the dominantly reactiveengineering interventions of flood control. While it is possible to anticipate andprepare for some floods, there are also others that take place in a totally unexpectedmanner. While we cannot necessarily eradicate all the threats, we can nonethelessbecome better aware of their likelihood and potential impacts regardless of thembeing perceived or real. The greatest challenge is and will continue to be, thesustainability of efforts in dealing with flood events as complacency could set inonce the memory of recent occurrences subsides under a prolonged lull.
Effective flood detection is analyzed by accurate estimation of water-levelthresholds that identify specific hazard levels along an entire river network. Theestimation of suitable exceedance thresholds is a key task in the flood early warningsystem, where alerts are determined by the ratio between streamflow estimates andreference thresholds (Alfieri et al. 2019). But real-time simulation of hydrologic andhydraulic flow processes is expensive because of the computing resources and
Integrated Flood Management
HazardManagement
Coastal ZoneManagement
Land Use Management
• Manage the water cycle as a whole
• Integrate land and water management
• Manage risk and uncertainty
• Adopt a best mix of strategies
• Ensure par cipatory approach
• Adopt integrated hazard management approaches
Water ResourcesManagement
Fig. 9.3 Key elements of an integrated flood management model. Source APFM, WMO (2009)
9 Enhancing Flood Early Warning System in the HKH Region 173

entails a steep learning curve to build the necessary human capacity to set up andrun the models. As an alternative, pre-simulated scenarios and matching processesare often employed to anticipate flood events and determine the consequences.
According to Perera et al. (2019), challenges in flood management arise fromseveral factors related to the inadequacy in the observing and monitoring networkson the ground, poor integration of remotely sensed and satellite Earth observations,and the inability to assimilate outputs of numerical models into developing acommon operating picture in flood management. The expenses involved in theacquisition of technological know-how and scientific knowledge, and other relatedfinancial issues are the primary reasons for not investing sufficiently in the criticalfacilities and generating actionable information in strategizing flood managementsystems. The appreciation for prevention and preparedness is still very low amongthe decision makers faced with competition for development priorities in a situationwhere the resources are scarce.
9.2.2 State of the Science in Flood Forecasting
The flood-forecasting process includes executing hydrological models withobserved and predicted hydro-meteorological data to obtain information on riverdischarges and translating the predicted streamflow into simulated river-waterstages. The water levels in the river channels are then assessed in the context offlood-recurrence intervals to decide on the warning levels for dissemination to areaslikely to be exposed to imminent flooding hazards. Unless early warnings inspireearly actions to mitigate risks, they are unlikely to deliver the anticipated socioe-conomic benefits that can accrue from even the best and robust of flood predictionand early warning systems.
To start this dissection from a broader and longer perspective, it all began withrelentless efforts in predicting the ENSO (El Nino-Southern Oscillation) phe-nomenon, which added a whole new dimension to the issue of weather and climatepredictability. Since it has a dominant influence on the seasonal and annual vari-ability of floods and droughts in South Asia, the focus was initially on precipitationforecasts as a proxy for hydrological extremes. But the relationship betweenextreme precipitation and extreme flooding is nonlinear and not the best of indi-cators. So, the improved predictability of ENSO impacts, along with recentadvances in prediction science and forecasting tools, has opened up vast opportu-nities to provide reliable forecasts and early warnings on disastrous floods. Onesuch approach is the dynamic seasonal river-flow outlook of the Global FloodAwareness System (GloFAS-30 Days and Seasonal: http://www.globalfloods.eu2020). GloFAS products are now widely used by almost all the national hydrometservices in the HKH region as the benchmark guidance for daily forecast routinesand seasonal outlooks on flood situations.
Modeling the catchment hydrologic response to the predicted meteorologicalforcing in space and time defines the flow characteristics that will be evaluated as
174 K. Tsering et al.
flood or not based on a set of exceedance thresholds. Flood forecasting is done todetect flood with sufficient actionable lead time to protect lives and propertiesthrough better preparedness and response measures. Modeling science has evolvedto fit the circumstances in which outputs are applied and matched with the availableand accessible data required to configure and run the models. A more recentapproach is toward tailored, purpose-built prediction models nested within broaderflood-forecasting frameworks (Fakhruddin 2010; UNDP 2018; WMO 2011). Suchconfigurations provide flexibility in the choice of an appropriate model, chaindifferent models with scalable and interoperable computing infrastructure, andsingle-window user-interface platform for dissemination.
From the operational perspective, flood forecasting is precisely about providinglegitimate, credible, and reliable information to the right people at the right place,and time in a manner comprehensible and actionable (Perera et al. 2019).Observations and research findings have evidenced that natural hydroclimaticvariability and imperfect understanding of the physical processes cause the issue ofuncertainty in flood forecasting. This uncertainty increases as forecasts are trans-lated into potential impacts in terms of inundation extent and early warnings.However, recent technological developments in hydrologic modeling, exponentialgrowth in computing power, satellite earth observation, and communicationadvances continue to improve forecast accuracy and warning lead time. As sciencenarrows the knowledge gap between mesoscale and convective processes, there is areal hope of developing and operationalizing a class of scale-independent fore-casting and warning schemes.
9.2.3 State of Flood EWSs
Any holistic EWS should necessarily include the formulation of warning, theissuance of warning, the reception of and response to warning, and finally thefeedback to those who developed and issued the warning in the first place. Formalor informal early warning systems have existed for centuries. Traditional approa-ches to flood early warnings have been based on the comparison of measured waterstages with predetermined “threshold levels”. Current EWSs utilize water-levelsensors placed at strategic locations along flood-prone drainage segments tomonitor river stage and relate to predefined thresholds in order to trigger appropriatelevels of warnings. Generally, different agencies are involved in the production,issuance, and response to warnings, with no single organization responsible for anend-to-end flood early warning service. More recent warnings employ scientificadvances in the knowledge and understanding of hazards and the natural andhuman-induced processes that result in hazardous situations. Warnings are nowessentially based on forecasts, projections, scenarios, and trends as a result oftracking a selected, explicitly identified set of hazard and threat indicators. Theseindicators must not only be reliable but also possess the ability to discriminatebetween levels and degrees of urgency, severity, and the certainty of the threats
9 Enhancing Flood Early Warning System in the HKH Region 175

unleashed under every possible onset of flood events. The recent introduction of thepredictive uncertainty concept enables probabilistic decision thresholds usingmulti-model and multi-run ensembles.
EWSs are meant to be integrated within the wider disaster risk-reduction strat-egy, rather than be a stand-alone solution. A flood EWS can protect livelihoods andproperties and save lives only if people act on the warnings. The core purpose ofany people-centric EWS is to empower individuals to act in sufficient time and in anappropriate manner to minimize as much as possible the loss and damage to people,property, and the environment. UNDRR (2006) recognizes four interrelated ele-ments (Fig. 9.4) in a comprehensive and effective EWS; they are risk knowledge;monitoring and warning service; communication and dissemination; and responsecapability. But they must be grounded in good governance and supportive insti-tutional arrangement that underscore multi-hazard readiness, community partici-pation, and social inclusion.
EWSs do not always fit the circumstances under which they are considered assolutions to flood-risk management, nor are such systems without pitfalls in thesetup and operation. Early warning dissemination and distribution rely on goodtelecommunication networks that may not be accessible in every flood-prone areaof interest. Besides, purpose-built alternatives could turn out to be technically andeconomically infeasible, especially if the flood-affected sites happen to be in remoteand inaccessible locations. As with everything pertaining to the future, early
INFORMATION SOURCES
Meteorological forecasts
Rainfall triggers
Alert ini ated
Flood warning
Severeflood warning
Emergencymobiliza on
Downgradingof warnings
Rainfall radar
First-stage river-level triggers
Local observers
Local observers
Telemetry river gauges and river gauges
Higher stage triggers
ALERTING FACILITIES
FLOODSTATUS
RESPONSE ACTIONS
River risecommences
Out of bankflow
Extensiveinunda on
Damage andthreat to life
Decline of river levels
OPERATIONSCENTRE
Real- me datacollec on
Modeling andforecas ng
Early warning dissemina on
Decisionsupport
Response towarning
Fig. 9.4 Framework of a common approach in flood early warning (adapted from WMO 2011)
176 K. Tsering et al.
warnings inevitably involve handling uncertainties in ways that enable arisk-informed decision-making process. Similarly, floods cannot be predicted withabsolute certainty because of imperfect understanding about the physical processand because of aspects of randomness that are inherent in the evolution of theprocess. Such limitations can sometimes result in false alarms which besidesincurring unnecessary costs and inconveniences, can actually diminish trust in thesystem, thereby rendering it ineffective. Although a typical flood early warningsystem is devised around water-level sensors placed at sufficient distance from theimpact zone, the warning lead time is usually extended, based on model predictions.Good quality real-time observational data are used for model calibration and theruns, but these may not be readily available or accessible. These problems continueto frustrate efforts in making EWSs more robust and credible despite significantadvances in science, technology, and related approaches.
9.3 Societal Values of EWSs
9.3.1 Situational Awareness and Preparedness
The achievement of desired societal benefits is predicated on the effective com-munication of early warnings to those exposed to flood risk. A lingering challengehas been the integration of systems operating at different spatio-temporal scales toprovide a more coordinated, comprehensive, usable, and effective early warninginformation. Early warnings of a flood event, combined with early warnings ofunderlying societal problems and processes, can lead to a strengthening of resi-lience and a reduction in vulnerability (Glantz 2009). EWSs are the stabilizingaccessories of a nation’s social, political, and economic systems; it may be tenuousat times and full of surprises, but never dispensable. It empowers governments toprotect citizenries and maintain political stability. The benefits of EWSs lie in ourappreciation of the knowable surprises. A case in point is the fact that whileinformation on the flood-prone areas is known beforehand, the timing of the flood,its magnitude, and the extent of its impact may be difficult to determine accurately.Based on the historical experience of flooding vulnerability, every government mustbe guided by the precautionary principle to sensibly invest in operational floodEWSs in order to protect lives and properties, and reduce losses.
As noted above and to again emphasize the criticality, an effective EWS typi-cally consists of a credible forecasting structure, a reliable communication service,and a proactive response mechanism. However, an EWS is not a static contraptionbut must evolve and improve with changing times and technology as we continuallywitness new normals due to climate, economic, and demographic changes. Almostall countries operate one form of forecast and early warning or the other, usingdifferent hydrological models, hydro-informatics, and computing infrastructure ofvarying strengths and capabilities. Very few actually operate basin-wide systems,
9 Enhancing Flood Early Warning System in the HKH Region 177

limiting such services to within respective territorial boundaries and weak mech-anism for information sharing. All countries follow the WMO convention of asingle national voice for warning dissemination with authority delegated to singleagency, but the cooperation between countries is weak and ineffective.
National and local governments and disaster-emergency managers have longidentified the need for a fully functional early warning system to disseminateinformation well in advance of a flood situation. While it is not possible to stopnatural floods from occurring, the impacts can be mitigated and the associated risksto lives and properties can be reduced through effective early warning systems.However, early flood warnings are situational and contextual in that their formu-lation and issuance are scale-specific and often isolated from the consequent out-comes in terms of reception and response from the intended users. Withoutexception, forecast-based EWSs are produced to increase the warning lead-time andthe level of certainty of an event of a certain magnitude occurring at a certain timeand place. Early flood information can also be verified through comparison withother forecasts that are freely available at national and regional levels. Theco-benefits are numerous, ranging from stronger cooperation and better partnershipnetworks and information exchange.
9.3.2 Loss and Damage Reduction
The costs of flood disasters from damage and loss are difficult to estimate and it iseven more difficult to assess the socioeconomic and monetary benefits of EWSs interms of the costs avoided or reduced. As a general practice, a typical cost-benefitanalysis would involve knowing the index of loss and the cost of damage, as well asthe cost of developing and operating an EWS, besides the cost associated with theuse of an EWS service (Perera et al. 2019). An effective EWS can deliver signif-icant benefits at all stages in the flood-risk management cycle and reduce humanfatalities and injuries, loss of livelihoods, and damage to properties and infras-tructure. Continuous operation of EWSs can actually lead to a better understandingof the flood situation and greater awareness about the risks that are involved. Theimportance of building resilience and the need to implement preparedness measureswill receive greater attention as communities and authorities gain deeper insightinto the urgency, severity, and the certainty of the flooding information provided byEWSs. There is also the potential to realize substantial benefits in terms of reducedcosts in relief, recovery, and reconstruction if warnings are issued with sufficientlead time for preparedness action.
178 K. Tsering et al.
9.3.3 Extending the Lead Time
Warnings must be conveyed in a timely manner, particularly in vulnerable andremote locations, using clear information expressed in non-technical language; theyshould also identify and specifically mention the areas at risk, as well as explain thepotential losses, all within certain time frames (UNDRR 2006). In most of thecountries in the HKH region, warnings are formulated and issued without standardprotocols in terms of the technical format, dissemination mechanism, and com-munication channels; so, difficulties emerge in the understanding of the messageand in setting up appropriate response mechanisms. It is also crucial to emphasizethat early warnings need to be followed through with early actions, but this is easiersaid than done because response plans are not framed to account for every warningsituation. However, the situation is a lot better now, with better access to groundand satellite data, as well as due to global and continental-scale forecasting systemsthat predict floods over a longer lead time with a credible probabilistic scale tosupplement national services. Longer lead times obviously lead to better pre-paredness and response measures (Smith et al. 2017). One such example is theCopernicus Emergency Management Service (CEMS), GloFAS (http://www.globalfloods.eu/), that couples state-of-the-art weather forecasts with a hydrologi-cal model to provide global flood overviews. Resolving GloFAS to local scales atfiner resolution entails downscaling the global outputs through the integration ofspatially granular information about the basins of interest and weather parameters.Through the SERVIR-HKH initiative, the countries in the HKH region are nowequipped with customized systems to access global information through localapplications. Moreover, the platforms that host and process cloud-computing andEO data are now available for running local-area models and performing complexanalysis under various programs (Soille et al. 2016).
The next few sections are devoted to the efforts at ICIMOD to develop productsand services aimed at bridging the knowledge and technology gaps in generatingstreamflow forecasts which can enhance the regional and national capacity toprovide reliable and effective flood early warnings and thereby reduce risks andminimize loss and damage. The approaches leverage recent advances in scientificknowledge and cutting-edge computing technologies in flood prediction to push thelimits of predictability in terms of timing, magnitude, and forecast horizons.
9.4 Flood Early Warning System (FEWS) Servicesand Tools in SERVIR-HKH
The SERVIR-HKH EWS service includes an operational 10-days streamflowforecast application based on the GloFAS direct runoff field routed with RAPID(Routing Application for Parallel Computation of Discharge) model (David 2019).The gridded flow predictions are downscaled to vector river network. The forecast
9 Enhancing Flood Early Warning System in the HKH Region 179
is meant for larger rivers at designated locations agreed by the partner agencies inBangladesh and Nepal. For Bangladesh, the forecast is implemented for 17boundary rivers and in the case of Nepal, for all its large rivers. A customizedweb-based information portal has been developed to communicate warnings to theintended users. The service also includes 48–54 h of short-fused flood predictionsfrom a quantitative precipitation forecast field generated through HIWAT (HighImpact Weather Assessment Tool), an extreme weather prediction system targetedat small “flashy” rivers mainly in Nepal and north-eastern Bangladesh.
9.4.1 Flood Prediction Tools
The streamflow prediction tools (SPTs) based on HIWAT and ECMWF (EuropeanCenter for Medium-Range Weather Forecasts) present an unprecedented opportu-nity for an integrated end-to-end flood forecasting system that can extend thecurrently possible lead times (Snow et al. 2016). Both the tools are based onensemble runs using perturbed physics and the sampling probability distribution ofinitial and boundary conditions in order to constrain uncertainties and provide aprobabilistic forecast for improved decision-making. The tools were developedthrough scientific collaboration between ICIMOD, the NASA Applied ScienceTeam (AST) from Brigham Young University, the NASA Marshall Space FlightCenter (MSFC), and the Jet Propulsion Laboratory (JPL).
HIWAT is a severe convection-allowing weather forecasting system that predictsextreme weather phenomena spawned by localized convective instabilities likethunderstorm, lightning, windstorm, hailstorm, and cloudbursts. The HIWAT system(Chap. 12) was implemented on a cluster at the SERVIR Global computing infras-tructure and runs during the pre-monsoon and monsoon seasons from April toSeptember every year. A visualization application runs on an open-source Tethysplatform (Swain et al. 2016a, b) in ICIMOD to disseminate the forecast. HIWAT isalso a severe-weather ensemble model based on the Weather Research andForecasting (WRF) community model with a 12 km outer and 4 km nested domainpositioned over South Asia. It provides daily 48 h forecasts with 1800 UTC(Universal Time Coordinate) initialization. The 12-member ensemble is created fromvarying planetary boundary layers and microphysics schemes that areconvection-permitting. Different GEFS (Global Ensemble Forecast System) mem-bers are used to initialize each ensemble member. The model outputs are available onan hourly frequency and post-processed to generate information on severe weatherproducts, one of which is the accumulated precipitation thresholds, the probabilitymatched mean of which is used to force the RAPIDmodel for flash-flood forecasting.
In the case of ECMWF-SPT, river discharge is simulated by RAPID in routingthe ensemble surface run-off fields processed by HTESSEL (HydrologyTiled ECMWF Scheme for Surface Exchange over Land) of ECMWF’s (Balsamoet al. 2009) coupled land-atmosphere IFS (Integrated Forecast System). RAPID is amatrix version of the Muskingum method (David et al. 2016) that produces 51
180 K. Tsering et al.
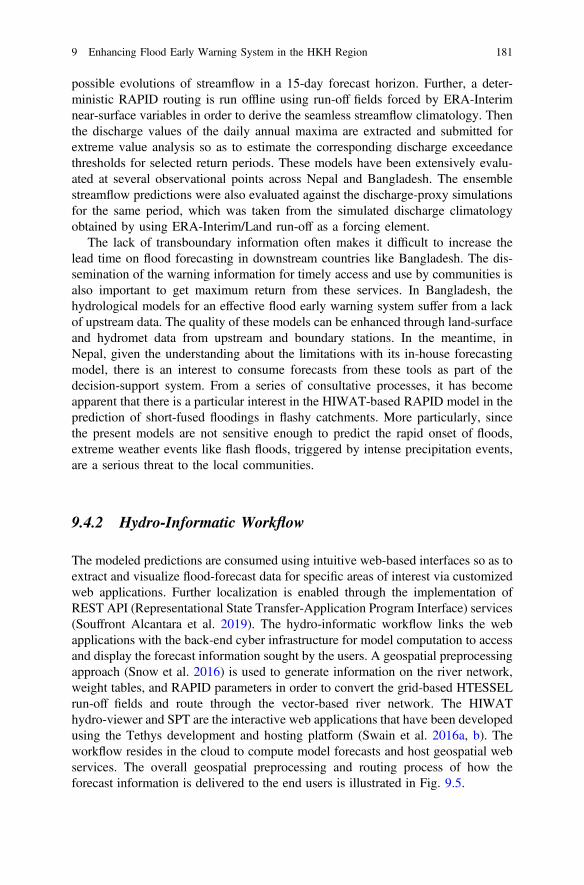
possible evolutions of streamflow in a 15-day forecast horizon. Further, a deter-ministic RAPID routing is run offline using run-off fields forced by ERA-Interimnear-surface variables in order to derive the seamless streamflow climatology. Thenthe discharge values of the daily annual maxima are extracted and submitted forextreme value analysis so as to estimate the corresponding discharge exceedancethresholds for selected return periods. These models have been extensively evalu-ated at several observational points across Nepal and Bangladesh. The ensemblestreamflow predictions were also evaluated against the discharge-proxy simulationsfor the same period, which was taken from the simulated discharge climatologyobtained by using ERA-Interim/Land run-off as a forcing element.
The lack of transboundary information often makes it difficult to increase thelead time on flood forecasting in downstream countries like Bangladesh. The dis-semination of the warning information for timely access and use by communities isalso important to get maximum return from these services. In Bangladesh, thehydrological models for an effective flood early warning system suffer from a lackof upstream data. The quality of these models can be enhanced through land-surfaceand hydromet data from upstream and boundary stations. In the meantime, inNepal, given the understanding about the limitations with its in-house forecastingmodel, there is an interest to consume forecasts from these tools as part of thedecision-support system. From a series of consultative processes, it has becomeapparent that there is a particular interest in the HIWAT-based RAPID model in theprediction of short-fused floodings in flashy catchments. More particularly, sincethe present models are not sensitive enough to predict the rapid onset of floods,extreme weather events like flash floods, triggered by intense precipitation events,are a serious threat to the local communities.
9.4.2 Hydro-Informatic Workflow
The modeled predictions are consumed using intuitive web-based interfaces so as toextract and visualize flood-forecast data for specific areas of interest via customizedweb applications. Further localization is enabled through the implementation ofREST API (Representational State Transfer-Application Program Interface) services(Souffront Alcantara et al. 2019). The hydro-informatic workflow links the webapplications with the back-end cyber infrastructure for model computation to accessand display the forecast information sought by the users. A geospatial preprocessingapproach (Snow et al. 2016) is used to generate information on the river network,weight tables, and RAPID parameters in order to convert the grid-based HTESSELrun-off fields and route through the vector-based river network. The HIWAThydro-viewer and SPT are the interactive web applications that have been developedusing the Tethys development and hosting platform (Swain et al. 2016a, b). Theworkflow resides in the cloud to compute model forecasts and host geospatial webservices. The overall geospatial preprocessing and routing process of how theforecast information is delivered to the end users is illustrated in Fig. 9.5.
9 Enhancing Flood Early Warning System in the HKH Region 181

The web-based prediction services include an operational 15-day flood forecastbased on ECMWF, and HIWAT based flash flood tool that forecast out to 48–54 h.Both tools use RAPID model to route direct runoff through drainage networksencompassing designated locations agreed by the partner agencies in Bangladeshand Nepal.
The implementation of a forecast-based EWS requires both human and com-puting resources to support not only the development of the system but to operate itand maintain it through time. What sets apart the SERVIR flood forecasting ser-vices from the mainstream systems is the simplification of complex processeswithout sacrificing the power of emerging science and technological innovations.Users can now concentrate on making informed decisions in managing flood riskswithout being distracted by the tedious and costly routines in collecting and pro-cessing data, setting up and running models, forecast production, and dissemina-tion. The disconnect and seeming incoherence between the components of theservice-value chain no longer constrains reliable and timely service provision.
9.4.3 Implementation of Innovative, Customizable Tools
Customized web-based applications for Nepal and Bangladesh were developed anddeployed in collaboration with ASTs to retrieve model outputs and visualize theinformation products required by the users. The HIWAT-based flash flood tool isalso customized and hosted as an online application using the same Tethys plat-form. These tools have undergone several iterations in response to user commentsand feedback on the interfaces. The SPT workflow for hydrological modeling usingRAPID is also in the process of being transferred to the ICIMOD server, and once
Weight tables/River Network
Dissemina on
Overview of Streamflow Predic on Tool
ECMWF/GLOFASForecast
Input Output
Rapid process
Python
Database
HistoricReturnPeriodForecastRiverNetwork
API centre
Fig. 9.5 Schema of the parallel computing framework and web-based dissemination of forecastsand warnings incorporated into the SPT web application
182 K. Tsering et al.

this migration is completed, the latent time from model run to ingestion and productrendering by the web application is expected to reduce significantly.
The web-based SPT system was co-developed with the help of ICIMOD’sregional partners. The system is now being enhanced with inputs from the partners.It has also been customized in order to accommodate the requirements of thepartners and also for them to have an easy access to the system. The system isin-built with analytical tools by which the user can interact with the system throughthe website. Upon clicking the desired river section, the user can view the forecastcharts for that section, along with information on the rate of discharge at anyparticular time of the day. The SPT web application facilitates user access toforecast information in an intuitive and comprehensible format (Fig. 9.6). Themajor components of the chart are:
• High-resolution forecast (10 days)• Standard deviation and mean, maximum, and minimum flow forecasts (gener-
ated through 51 ensemble forecasts, inclusive of the ensemble control run)• Information on two-, ten-, and twenty-year return periods.
The table below the chart provides the possibilities of the return period dischargein percentage, using 51 ensemble data sets from the model. The user can also viewthe model historical data set starting from 1980 and also the flow-duration curve;besides, there is an option to download the data set.
The enhancement in the system is to indicate the high-risk river section withproper color codes related to the return periods. The risk-to-river section is updateddaily to provide near-real-time information and show the condition of the river at
Fig. 9.6 Visualization of SPT forecasts and associated statistics, along with data on exceedancethresholds showing the probability of occurrence along a 10-day forecast range
9 Enhancing Flood Early Warning System in the HKH Region 183

first glance. During the co-development process with our partner, Nepal’sDepartment of Hydrology and Meteorology (DHM), we also incorporated the rivernames, administrative boundaries, and the locations of the hydro-met stations intothe system. The landing page for SPT-Nepal is given in Fig. 9.7.
Another successful integration has been the Bangladesh transboundary predic-tion system. This unique system is based on the 17 transboundary stations (points)provided by the Flood Forecasting and Warning Centre (FFWC) under theBangladesh Water Development Board (BWDB). The system provides a 10-dayforecast to their internal model which increases the warning/alert lead time withinthe country and hence saves lives and livelihoods.
Model consistency is achieved through the use of the same hydrological modeland meteorological product to derive both streamflow forecasts and the reanalysisdata set used to derive the thresholds. While it is difficult to accurately represent thetrue-flow conditions along a river network, early warning systems developed withexceedance thresholds derived from discharge simulation based on the reanalysisdata lend greater meaning and provide a consistent, historical context to the modelpredictions.
9.5 Current State of Service Implementationand Validation
9.5.1 Dissemination and Delivery
In Bangladesh, the FFWC monitors water levels and provides deterministic fore-casts of five days at 54 stations on 21 rivers. SERVIR’s collaboration with the
Fig. 9.7 HIWAT-based flood early warning system
184 K. Tsering et al.
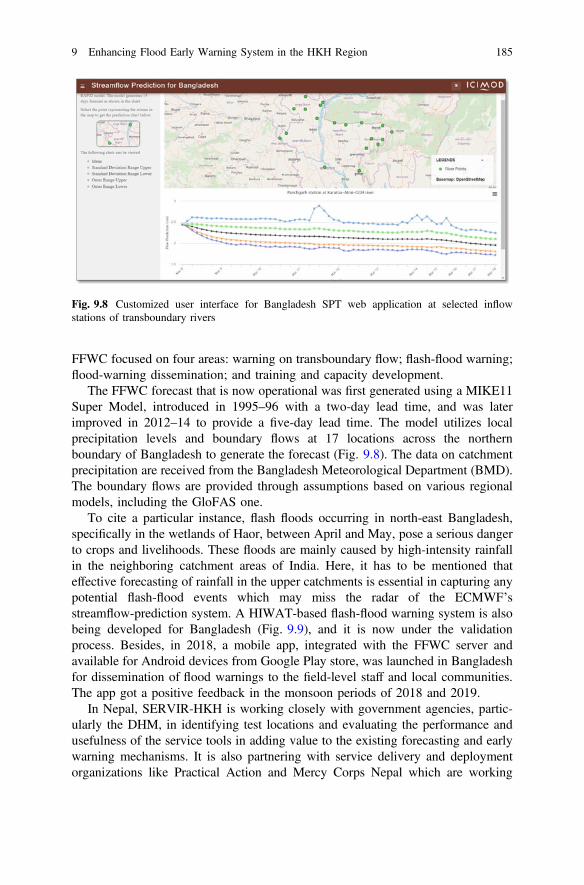
FFWC focused on four areas: warning on transboundary flow; flash-flood warning;flood-warning dissemination; and training and capacity development.
The FFWC forecast that is now operational was first generated using a MIKE11Super Model, introduced in 1995–96 with a two-day lead time, and was laterimproved in 2012–14 to provide a five-day lead time. The model utilizes localprecipitation levels and boundary flows at 17 locations across the northernboundary of Bangladesh to generate the forecast (Fig. 9.8). The data on catchmentprecipitation are received from the Bangladesh Meteorological Department (BMD).The boundary flows are provided through assumptions based on various regionalmodels, including the GloFAS one.
To cite a particular instance, flash floods occurring in north-east Bangladesh,specifically in the wetlands of Haor, between April and May, pose a serious dangerto crops and livelihoods. These floods are mainly caused by high-intensity rainfallin the neighboring catchment areas of India. Here, it has to be mentioned thateffective forecasting of rainfall in the upper catchments is essential in capturing anypotential flash-flood events which may miss the radar of the ECMWF’sstreamflow-prediction system. A HIWAT-based flash-flood warning system is alsobeing developed for Bangladesh (Fig. 9.9), and it is now under the validationprocess. Besides, in 2018, a mobile app, integrated with the FFWC server andavailable for Android devices from Google Play store, was launched in Bangladeshfor dissemination of flood warnings to the field-level staff and local communities.The app got a positive feedback in the monsoon periods of 2018 and 2019.
In Nepal, SERVIR-HKH is working closely with government agencies, partic-ularly the DHM, in identifying test locations and evaluating the performance andusefulness of the service tools in adding value to the existing forecasting and earlywarning mechanisms. It is also partnering with service delivery and deploymentorganizations like Practical Action and Mercy Corps Nepal which are working
Fig. 9.8 Customized user interface for Bangladesh SPT web application at selected inflowstations of transboundary rivers
9 Enhancing Flood Early Warning System in the HKH Region 185

directly with the vulnerable communities and local administrations like the DEOC(District Emergency Operation Center) and the LEOCs (Local EmergencyOperation Centers) in building capacities in flood preparedness and response. InNepal, community-based partners are committed to augmenting new and existingcommunity-based flood early warning schemes that have been widely adopted inflood-prone areas. The SERVIR-HKH project expects to use the information on theestimation of flood inundation to develop hazard maps in 10 watersheds spanningthe Mahakali, Rapti, and Karnali basins. A network of flood warning systems hasalso been piloted by Mercy Corps Nepal in five watersheds of the Bagmati, Kandra,Kamala, Kankai, and Macheli using the HIWAT flash-flood prediction application.Such level of interest and engagement with a multitude of service intermediarieshave led to a growth in the user base of SERVIR-HKH products and services. Byincreasing the lead time on warnings and by articulating forecasts in probabilisticterms, there has been a redefinition of approach in dealing with flood forecasts, andthis has led to more effective preparedness and response procedures.
9.5.2 Capacity Development
Under SERVIR’s capacity building program, equal attention has been paid to theprofessional development of the ICIMOD staff working in the SERVIR-HKHprojects and to the partners in training them on the overall scientific basis,browser-based user interface, and access and interpretation of products and appli-cations under different contexts of flood management. Following the trainingschedule, the group of IT personnel and programmers have acquired sufficient skillsand competence to further improve on the modeling structure, implement enhanced
a b
Fig. 9.9 a HIWAT-based flash-flood warning system for Bangladesh; and b mobile-app interfacefor early warning dissemination to the public
186 K. Tsering et al.
visualization and system automation, and resolve issues that regularly come to theirattention. The customized web applications on the Tethys platform continue togrow as new demands from the partners and users are being serviced. Now thestreamflow-prediction model is slated to be run entirely from the in-house com-puting infrastructure. Besides, the control of the HIWAT run on theSCO-SOCRATES (SERVIR Coordination Office-SERVIR Operational ClusterResource for Applications—Terabytes for Earth Science) cluster is being trialed fora phased handover. In all this, HIWAT’s capabilities to enrich decision-makinghave been confirmed by several kinds of end-users (like the BMD and DHM).
The relevant staff of the FFWC in Bangladesh and other agencies with a stake inflood management have been trained on forecast validation to evaluate modelperformance and verify forecasts in order to understand the uncertainties andlimitations in the forecasting models and to know about the ways in which they canbe improved as reliable information for warnings. Later, a group of hydrologicalforecasters from Bangladesh, Bhutan, and Nepal, together with FEWS advocatesand practitioners from community-based organizations, were put through a similartraining program of in-depth exploration of the prediction tools and deployment inthe operational mode. The participants were trained on using tools that createsituational awareness and to apply products in a variety of decision-making con-texts of water resources and flood management. Moreover, aspects of geoinfor-mation technology in bringing processing and analytical focus on a specific area ofinterest were embedded perceptively into the practical sessions and hands-onexercises.
Skill and knowledge transfer through dedicated training runs have also beenfurther strengthened through broadened participation in consultative workshops andknowledge fora. Hydrostats, a Tethys application, was extensively used for com-puting error metrics in the course of validating model forecasts and for assessingmodel skills in predicting an observed event. It is reasonable to state that theimplementing partners and the key stakeholders have been provided with theknowledge and tools to interact, access the service products via the web interface orprogrammatically, and interpret and apply information to better manage waterresources and reduce flood-disaster risks.
9.5.3 Validation
The forecast modeling tools have been calibrated and validated against severalobserved data sets collected from different locations around the world (Jackson2018; Jackson et al. 2019; Snow et al. 2016; Swain et al. 2016a, b;Souffront-Alcantara et al. 2019; Nelson et al. 2019). Results from earlier validationefforts were optimistic that the modeled predictions were consistent with outputsfrom other systems using the same set of meteorological forcings and land-surfacemodel (LSM) fields. Earlier validation works had also found out that the grid tovector adaptation did not alter the results, and showed good correspondence with
9 Enhancing Flood Early Warning System in the HKH Region 187
the observed data from several locations around the world (Sikder et al. 2019).However, the studies were largely limited to either evaluating the ensemble meanforecasts against the simulated discharge climatology or comparing the latter withobservations from selected stations.
A final round of forecast validation is being conducted focusing on predictionsgenerated in real-time, which is archived on a daily basis to evaluate and investigateinto the performance skills of the SERVIR-HKH flood-forecasting tools, i.e.HIWAT-driven flash-flood and ECMWF-IFS-based SPT tools. The approachextended the validation process to also assess the performance of ensemble fore-casts in probabilistic terms using graphical measures like reliability, Talagrand,likelihood diagrams, and the Area Under the Receiver Operating Characteristics(AUROC). Brier score and skill score were used as numerical summary metrics toevaluate probabilistic forecasts in detecting flood days ahead of the actual occur-rence. Besides, the forecast information primarily finds application in the devel-opment of flood early warning systems, which require an effective verification andvalidation method to understand the uncertainties and limitations that could be usedin ways to improve the forecast and warning services. Accordingly, the forecastswere verified at each lead time with reference to observational records madeavailable to the validation team by the partner agencies. Finally, the matching of theobserved data sets were combined with modeled data sets for same time periodsusing a scheme of confusion tables to evaluate the tools’ ability to correctly predictthe dichotomous flooding events using binary scores, including, but not limited to,Probability of Detection (POD), Probability of False Detection (POFD), andGilbert, Peirce, and Heidke skill scores. Forecasts were also evaluated againstobservations using a set for deterministic performance metrics using the mean of 51ensemble members to assess temporal, bias, and spread vs skill errors. The forecastskills were demonstrated by benchmarking the forecast performance against cli-matology and persistence discharge upon which forecast runs were initialized on adaily basis. The validation period differed across the three countries depending onthe observed time series of the discharge.
Altogether, SPT forecasts were validated against observations from 20 hydro-logical stations in Nepal, eight stations in Bangladesh, and 10 stations in Bhutan.Table 9.1 presents the summary scores and related statistics for a selected site fromeach country in order to illustrate the validation results, which are expressed asfunctions of prediction error and goodness of fit between modeled and observeddata for the countries and stations provided with usable observational data from 1January 2014 to the end of the observation dates. The validation exercise wasperformed specifically to check on the verified claims of quality, value, and relia-bility of the coupled ECMWF-RAPID flood-prediction model. The HIWAT-RAPID flash-flood prediction system has been evaluated and validated only at afew sites in Nepal and Bangladesh due to want of quality observations from thesites prone to flash flooding. HIWAT-based predictions present a unique challengefor validation, as the model outputs do not follow the normal hydrologic responseof watersheds since the precipitation forecasts are directly translated into stream-flow without adequately accounting for surface and groundwater processes.
188 K. Tsering et al.

Therefore, summary statistics and error metrics convey very limited meaningfulinformation on the forecast performance. Graphical visuals are mainly used tovalidate the correspondence in timing and magnitude of flood peaks betweenforecasts and the observations; while qualitative verification is supplemented withcategorical statistics computed from the elements of the contingency table.
The SPT-sourced predictions are an ensemble of 51 members to capture the levelof uncertainty in the modeled forecasts based on the initial conditions of pertur-bation. The goal of validation is to assess the quality and value of SPT forecastproducts to accurately and reliably predict flooding events so that robust flood earlywarning systems are established. In order to demonstrate the full benefit of SPT, itis crucial that the service is assessed not only in the measurement space but also inthe probability space to quantify uncertainties for better decision-making.Figure 9.10 shows the performance measure in probabilistic terms using reliability,talagrand, likelihood, sharpness, and ROC plots, assuming equal likelihood of eachmember in post-processing the ensemble timeseries to dichotomous flood events.For the purpose of this validation exercise, the 90th percentile of the observeddischarge time series was selected as the threshold to distinguish between flood andnon-flood situations over the period of evaluation. The exceedance probability wasderived from the fraction of ensemble forecasts equaling or exceeding the thresholddischarge. Brier score and Brier skill score (BSS) were computed for probabilisticforecasts as a composite score for reliability, resolution, and uncertainty. Theprobability forecast skill (BSS) of forecast performance is evaluated against initialstate and climatology. Several other common metrics were also calculated in ver-ifying the ensemble mean.
The average correspondence between individual forecasts and the events theypredict as shown with ensemble error metrics suggests the acceptability quotient ofthe forecasts. Although there was generally a good linear relationship between whatwas observed and what was forecast (Pearson coefficient, R), the predictive abilityof the model chains was consistently poor in the case of all the stations that wereevaluated (in terms of NSE and KGE). While the GloFAS-RAPID system has atendency to over-predict in mountainous areas (Bhutan), it generally under-predictsflood situations in the low-lying plain areas (Bangladesh), and the error terms andthe level of bias are less than acceptable. However, overall, both the SPT andECMWF-RAPID forecasting systems were able to capture the peaks and lows inthe observed hydrographs as shown by the relatively high values of the SpectralAngle (SA) (Roberts et al. 2018) metric that compares the shape of the hydrographtime series over time. These results apparently point to the fact that the performanceof the models, the ECMWF-RAPID combination in particular, could be improvedfurther with the recalibration of the parameters of RAPID to more closely representthe local situation. Nonetheless, there was skill in the forecasting system comparedto the reference persistence forecast based on using the last simulated or observeddischarge, despite the fact that there was great uncertainty associated with theobserved data sets shared by the collaborating national agencies. Although thecoupled ECMWF-RAPID modeling system is able to predict streamflow with a
9 Enhancing Flood Early Warning System in the HKH Region 189

Tab
le9.1
Summaryscores
ofSP
Tforecastperformance
andits
evolutionov
era15
-day
forecastho
rizon
Leadtim
e
12
34
56
78
910
1112
1314
15
Gandaki,Nepal
BS
0.08
0.05
0.05
0.05
0.05
0.05
0.05
0.05
0.05
0.05
0.12
0.06
0.06
0.06
0.06
BSS
p0.41
0.62
0.60
0.62
0.62
0.62
0.63
0.64
0.61
0.60
0.06
0.58
0.55
0.52
0.52
KGE
0.62
0.75
0.72
0.70
0.68
0.67
0.67
0.67
0.66
0.64
0.12
0.47
0.51
0.52
0.53
NSE
0.45
0.62
0.61
0.61
0.60
0.59
0.60
0.59
0.58
0.57
−0.11
0.55
0.56
0.54
0.54
Pbias
0.33
0.07
0.02
0.03
0.03
0.03
0.05
0.04
0.02
−0.01
0.68
0.16
0.03
−0.01
−0.05
R0.82
0.80
0.79
0.78
0.77
0.77
0.77
0.77
0.76
0.76
0.60
0.76
0.77
0.75
0.76
RMSE
82.31
68.50
69.11
69.50
70.82
70.95
70.71
70.91
72.42
72.85
117.20
74.51
73.84
75.79
75.92
Sarighat,Bangladesh
BS
0.05
0.05
0.06
0.06
0.06
0.06
0.07
0.06
0.07
0.07
0.08
0.08
0.08
0.08
0.08
BSS
p0.37
0.33
0.30
0.28
0.23
0.21
0.19
0.20
0.16
0.11
0.07
0.02
0.02
0.00
−0.01
KGE
0.31
0.23
0.24
0.27
0.28
0.29
0.30
0.31
0.32
0.33
0.38
0.31
0.31
0.31
0.31
NSE
0.40
0.31
0.29
0.32
0.30
0.31
0.33
0.36
0.36
0.35
0.32
0.26
0.26
0.24
0.23
Pbias
−0.31
−0.33
−0.33
−0.33
−0.34
−0.35
−0.36
−0.37
−0.38
−0.38
−0.36
−0.39
−0.40
−0.41
−0.41
R0.77
0.75
0.74
0.74
0.72
0.70
0.70
0.70
0.70
0.68
0.66
0.63
0.62
0.60
0.59
RMSE
147.77
159.52
161.02
157.69
159.86
159.32
156.56
153.47
153.01
154.55
157.38
164.92
165.16
167.22
168.28
Wangdi,Bhutan
BS
0.06
0.05
0.06
0.07
0.07
0.07
0.07
0.07
0.07
0.08
0.08
0.08
0.08
0.08
0.08
BSS
p0.30
0.42
0.30
0.27
0.23
0.23
0.21
0.21
0.19
0.17
0.16
0.18
0.19
0.18
0.17
KGE
0.78
0.88
0.85
0.83
0.81
0.80
0.79
0.79
0.77
0.76
0.76
0.75
0.75
0.75
0.74
NSE
0.71
0.82
0.80
0.78
0.75
0.74
0.73
0.72
0.71
0.69
0.69
0.69
0.69
0.68
0.68
Pbias
0.16
−0.04
−0.09
−0.11
−0.12
−0.13
−0.13
−0.14
−0.15
−0.16
−0.16
−0.16
−0.17
−0.17
−0.17
R0.88
0.91
0.90
0.89
0.88
0.87
0.87
0.86
0.86
0.86
0.86
0.86
0.86
0.85
0.85
RMSE
154.62
120.97
128.35
135.04
142.00
146.17
147.70
151.00
153.93
157.35
158.11
158.03
158.04
159.88
162.16
BSbrierscore;BSSpbrierskill
scorewrtpersistence;
KGEKlin
g-Guptaefficiency
(modified);NSE
Nash-Su
tcliffe
efficiency;P
bias
percentb
ias;rPearsoncorrelationcoefficient;
RMSE
root
meansquare
error
190 K. Tsering et al.

15-day lead time, the forecasts are skillful only to a maximum of 10 days in themajority of the cases, after which the performance deteriorates rapidly.
Successful validation is expected to raise confidence in the forecast systems, andpave the way for the integration of the SERVIR-HKH system with the existingsystems that have been operational for many years in Bangladesh andNepal. The finalintegrated forecast will increase the lead time from the present two–three days to 10–15 days for river flow, and at least 40 h ahead of an extreme convection-driven flashflooding. The results from successful validation should promote the adoption of suchtools as operational resource for the national hydromet services in order to improveaccuracy and disseminate actionable warnings and alerts.
Small- to medium-sized basins in countries across the HKH region need suchopen and accessible service tools to downscale authoritative global forecast prod-ucts to the level of localized ones that can create real impacts on the ground. Scalingthe services up and out within the SERVIR-HKH focal countries and in the regioncan provide a common operating picture for countries to work and learn together inan atmosphere of shared responsibility when it comes to flood management. The
– Gandaki,NepalSarighat,Bangladesh–
Fig. 9.10 Performance measure in probabilistic terms using reliability, Talagrand, likelihood,sharpness, and ROC plots for selected validation sites (one each from three countries as exemplar(Day-5 lead time)
9 Enhancing Flood Early Warning System in the HKH Region 191

prediction tools are in an advanced stage of joint evaluation under different basinscales—small, medium, and large—using river-flow observations obtained from thenational partner agencies. Eventually, the service tools are pipelined for integrationinto respective national forecasting and warning systems so as to supportdecision-making and best practices in flood-risk management.
The validation process was designed around a tripartite engagement amongNASA’s AST, ICIMOD, and partners in Nepal and Bangladesh, and was laterextended to include Bhutan. The actual validation was supported through thecapacity building of partners on validation methodologies, data collection, andassemblage for target locations identified in consultation with the partners. Thesuccessful completion of the validation process will clear the products for use inoperational settings.
9.5.4 Transition to Operational Service
The success in the adoption and use of flood-prediction services involves theengagement of multiple stakeholders who each have specific roles and responsi-bilities. A sense of ownership about the system that generates the services andadoption of the system by the local authorities responsible for disaster-emergencyresponse operations at the district level and by the community workers at the locallevel are vital for sustained improvement and application. This entails continuousengagement with different levels of stakeholders.
9.5.4.1 Bangladesh
The FFWC is the mandated agency in Bangladesh to generate flood forecasts andprovide early warning. The FFWC receives information on water levels from theautomated stations installed by the BWDB; information on cross-border flow fromthe Joint River Commission (JRC); and on rainfall forecast from the BMD. Thesedata are then used as input to a hydrodynamic model developed on a MIKE-IIplatform to generate water-level forecasts five days in advance. This forecast isdisseminated through the FFWC website for consumption by the stakeholders,including the BWDB field operatives. With the introduction of the SERVIRstreamflow prediction tool for boundary rivers, the FFWC is now initializing themodel with inputs from the SPT. A mobile app has also been developed withsupport from SERVIR that enables wider dissemination (Fig. 9.11). And, to supportthe institutionalization of the process, ICIMOD and the BWDB have signed anMoU under which the FFWC officials are trained to use the system. Currently, theinput from the SPT are manually ingested into the flood-forecasting model. Infuture, integration is planned to automatically synchronize the SPT with theflood-forecasting model to automatically ingest the boundary river flow.
192 K. Tsering et al.
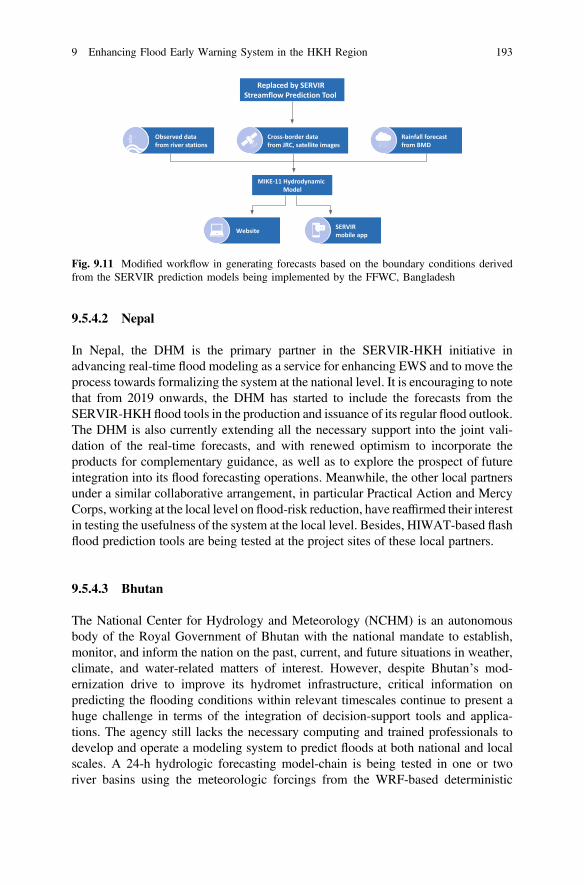
9.5.4.2 Nepal
In Nepal, the DHM is the primary partner in the SERVIR-HKH initiative inadvancing real-time flood modeling as a service for enhancing EWS and to move theprocess towards formalizing the system at the national level. It is encouraging to notethat from 2019 onwards, the DHM has started to include the forecasts from theSERVIR-HKH flood tools in the production and issuance of its regular flood outlook.The DHM is also currently extending all the necessary support into the joint vali-dation of the real-time forecasts, and with renewed optimism to incorporate theproducts for complementary guidance, as well as to explore the prospect of futureintegration into its flood forecasting operations. Meanwhile, the other local partnersunder a similar collaborative arrangement, in particular Practical Action and MercyCorps, working at the local level on flood-risk reduction, have reaffirmed their interestin testing the usefulness of the system at the local level. Besides, HIWAT-based flashflood prediction tools are being tested at the project sites of these local partners.
9.5.4.3 Bhutan
The National Center for Hydrology and Meteorology (NCHM) is an autonomousbody of the Royal Government of Bhutan with the national mandate to establish,monitor, and inform the nation on the past, current, and future situations in weather,climate, and water-related matters of interest. However, despite Bhutan’s mod-ernization drive to improve its hydromet infrastructure, critical information onpredicting the flooding conditions within relevant timescales continue to present ahuge challenge in terms of the integration of decision-support tools and applica-tions. The agency still lacks the necessary computing and trained professionals todevelop and operate a modeling system to predict floods at both national and localscales. A 24-h hydrologic forecasting model-chain is being tested in one or tworiver basins using the meteorologic forcings from the WRF-based deterministic
Replaced by SERVIR Streamflow Prediction Tool
MIKE-11 Hydrodynamic Model
Website SERVIR mobile app
Observed data from river stations
Rainfall forecast from BMD
Cross-border data from JRC, satellite images
Fig. 9.11 Modified workflow in generating forecasts based on the boundary conditions derivedfrom the SERVIR prediction models being implemented by the FFWC, Bangladesh
9 Enhancing Flood Early Warning System in the HKH Region 193

weather forecasts. Besides, the ECMWF-RAPID computational forecastingframework, coupled with the SPT web application on the Tethys platform, offersfree access to vital flood information which can complement the local setup toprovide situational awareness and outlook with quantified uncertainties. TheHIWAT-RAPID modeling system is also set to be extended to predictions forsmaller rivers which are naturally flashy because of severe convection-drivenprecipitation inputs.
Recognizing the benefits of these systems, the NCHM has decided to work closelywith SERVIR-HKH in evaluating the system performance in major river basins inBhutan. In the last one year, a group of hydromet engineers and forecasters from theNCHM participated in every capacity development event organized by ICIMOD.Recently, a combined product dissemination and model validation workshop wasconducted in Bhutan to include the wider government stakeholders that are likely tobenefit from the information products generated by the SERVIR-HKH tools. Theevent received good response from the government agencies responsible for riverinfrastructure, hydropower, and disaster-emergency management. Further, theNCHM has committed to strengthening collaboration in improving the systems bysharing resources, data, and experiences under a mutually agreed institutionalmechanism. In the meantime, it has identified several gauging sites to validate thereliability and value of the systems in water-resource management and flood-riskreduction.
9.6 Learnings and Future Direction
9.6.1 Challenges and Opportunities
Flood frequency related thresholds that make use of recurrence intervals are foundto misrepresent actual flood levels with serious implications for building trust in thesystem. The flow magnitudes of thresholding return periods do not always matchwith actual observation on the ground. The color-coded threshold envelops aremisconstrued as warning levels, which, in fact, are still pending a reality checkthrough systematic calibration with actual observations on the ground. In an idealsituation, these color bands should be associated with the magnitude of the likelyimpact from a flood event falling within a specific threshold band. Regardless,color-coded thresholding is unlikely to trigger response action without interpretiveguidance or making sufficient efforts in raising awareness on what the colorssignify.
ERA5 (Hersbach et al. 2018) is the latest climate reanalysis data set produced byECMWF and distributed through the Copernicus Climate Change Service (C3S).ERA5 is superior to its predecessor, ERA-Interim, in that it incorporates more than10 years of improvement in the numerical weather prediction system, higher spatialresolution, improved data assimilation, and near-real-time updates for the
194 K. Tsering et al.

intermittent version, ERA5T. Using ERA5 data sets with the RAPID routingmethod in SPT could improve the discharge timeseries that is used in estimatingflood thresholds based on frequency analysis for the return periods. In 2019, Alfeiriet al. indicated that setting discharge thresholds based on a ranged forecast horizonwould be actually more informative while deploying SPT as an extension of floodearly warning systems. Setting range-dependent thresholds, instead oftime-invariant ones, has produced consistency along the entire forecast range, and islikely to improve the estimation of the magnitude of upcoming extreme events overlonger forecast ranges.
The RAPID model, based on the traditional Muskingum formulation, routes onlythe surface run-off field from the ECMWF land-surface module along a vectorizedriver network, and does not account for the vertical water fluxes or the groundwaterstorage in the floodplains, or the interactions between surface and groundwater. Themodel can be improved further by replacing the simplistic Muskingum method withthe numerical solution of the kinematic wave equation and incorporating routinesfor groundwater storage and transport. This enhancement to the routing processcould reduce the overall model tendency to under-predict discharge in many rivernetworks. And even if the Muskingum approach is maintained, there is ample scopeto optimize its routing parameters to better represent the hydrologic characteristicsof the HKH basins through a systematic calibration with the observed conditions.The other contributory features worth incorporating into a future scheme ofenhancement could include simulation of transmission loss along channel reaches,and interaction with other components of river hydrology. With increasing humaninterference in the natural flow regime, it is also crucial that the model is capable ofrouting flow through channels modified by flow regulating and control structurescausing backwater effects.
Flood prediction is not an end in itself; it must logically transit towards mappingthe depth and extent of inundation to assess areas that are likely to be impacted tovarying degrees of severity, in terms of potential costs and losses. Merely providinginformation on river discharge or water level will not induce appropriate responseactions unless such information is translated into differential implications for livesand livelihood, asset, and infrastructure. To meet this requirement, the back-endmodeling system of the prediction tools needs to be retrofitted with the capability ofhydraulic simulation, or other means of implementing a flood-mapping system in anend-to-end flood early warning service chain. While the tools have inherent value inextending the lead time to actual hazard manifestation as events unfold, there arealso weaknesses and limitations in any forecasting and warning services; these arisefrom the stochastic nature of the hydrometeorological process; for example, thenon-linearity of flood hazards with no set pattern of expression. Moreover, thesystems are not designed to be perceptive about societal exposures and vulnera-bilities, nor do they account for the response capability in comprehending floodforecast and warning messages. Being web-based and without a localized anddedicated mobile version, the scope for widespread uptake is limited by the unequalaccess to the internet. Providing decision-support services online can be construed
9 Enhancing Flood Early Warning System in the HKH Region 195
as discriminatory, favoring access by a capable few; whereas, the lower classes whoare most at risk generally have no access to the internet. Thus, further customizationis necessary to make the systems truly fit-for-purpose.
9.6.2 Way Forward
The scientific community in hydrological modeling is constantly developingimproved methods of producing ensemble forecasts and data assimilation tech-niques to address the inherent uncertainty in the hydrologic modeling process. AI,machine learning, and data-mining techniques are increasingly being used forvulnerability assessment (e.g. analysis of satellite images to identify communities atrisk) and also for risk calculation (Saravi et al. 2019). Through the advances anddevelopment in the last decade, these techniques have now been made available toeven less developed countries through various collaborative platforms and assis-tance windows, thereby opening up a whole new avenue for operational FEWS.
As a result of the challenges posed by the complexity involved in inundationforecasting via predicted discharges, research efforts have expanded in recent yearsto seek out simplified approaches to inundation mapping, based on databases ofsimulated scenarios of flooding events by employing the similarity theory.However, there are major issues in recompiling the database as riverbed mor-phology changes over time, or significant changes occur in the land-use systems,such as the erection of artificial structures. Nonetheless, better flood-mitigation andflood-forecast planning strategies can be developed by visualizing the inundationscenarios of different magnitudes of floods and also by studying the variousquantiles shown by discharge hydrographs.
As individuals are becoming more technology-bound than ever before due tosmartphones, the internet, and the social media, all of these are being integrated intothe warning dissemination systems by flood-forecasting centers and disaster man-agers worldwide. This will lead to more people acting as disseminators—com-municating timely warnings widely via electronic and social media channels.Confidence and trust in FEWS are expected to increase as warnings are tailored tothe needs of communities to enable them to make risk-informed decisions. Hereinlies the relevance of impact-based forecasting and warning in bringing togetherproviders and users on the same wavelength to connect the different components ofearly warning systems with specific focus on the sectors of interest.
9.7 Conclusion
The conventional ways of developing a hydrological modeling system for the pur-poses of flood forecasting and early warning present enormous challenges forcountries that do not have the needed resources and technical capacity to develop,
196 K. Tsering et al.

operationalize, and maintain such complex systems. The SERVIR approach of set-ting the modeling infrastructure in the cloud and facilitating hydro-informatics usingopen-source web technologies to deliver forecast results with visuals and statisticalinterpretation has systematically lowered those barriers in fulfilling the informationneeds about water in the HKH region. The approach has also addressed the com-munication challenges in disseminating forecast products and services that arecomprehensible and usable under pressing decision contexts. The ECMWF-RAPIDhydrologic modeling chain has addressed many application constraints identified inthe GloFAS services used extensively by countries in the HKH region.
The streamflow-prediction system to which the web application tools serve asthe intuitive and interactive user front-end has significantly enhanced the forecastcapability in the HKH region by extending the forecast lead time to 15 days, and toa large extent, has quantified the uncertainties associated with deterministic fore-casts. It has also reduced the processing latency in translating forecasts into earlywarning services by framing forecast results in the historical context of thresholdexceedance in terms of the return periods. The intuitive interface and dynamicfront-end processing and visualization system, with routines to access and retrieveoutputs, are some of the benefits offered by the system, allowing the users to focuson the more critical and priority aspects of flood-emergency management to savelives and protect properties.
The HIWAT flash-flood prediction system is now appreciated by all nationalhydromet agencies within the region for its ability to forecast floods triggered byextreme precipitation events. The local convection-allowing physics configurationenables the meteorologic model to predict such events forcing the RAPID routingmodel. The services are especially crucial during the pre- and post-monsoon sea-sons when severe weather phenomena occur, and also in places dominated byconditions of poor surface infiltration and small watersheds. Flash flooding is a rareevent, but the impact and consequences are far greater than those caused by sea-sonal riverine flooding. It is particularly important for communities settled aroundflashy stream beds and organizations engaged in actions of community well-beingto have such reliable early warning service with sufficient lead time to plan and takeaction. While the system has only a 48 h forecast horizon, it provides far superiorhead-start than any instrument-based alternative. The outlook is promising, andSERVIR has brought cutting-edge technologies within the reach of researchcommunities, government decision makers, emergency responders, and the generalpublic of a region with global hydroclimatic significance.
References
Akhtar Hossain ANH (2003) Bangladesh: flood management in integrated flood management casestudy. TSU, WMO/GWP Associated Programme on Flood Management
Alfieri L, Zsoter E, Harrigan S, Aga Hirpa S, Lavaysse C, Prudhomme C, Salamon P (2019)Range-dependent thresholds for global flood early warning. J Hydrol X. https://doi.org/10.1016/j.hydroa.2019.100034
9 Enhancing Flood Early Warning System in the HKH Region 197

Bakker MHN (2009) Transboundary river floods: examining countries, international river basinsand continents. Water Policy 11(2009):269–288
Balsamo G, Viterbo P, Beljaars A, van den Hurk B, Hirschi M, Betts AK, Scipal K (2009) Arevised hydrology for the ECMWF model: verification from field site to terrestrial waterstorage and impact in the integrated forecast system. J Hydrometeorol 10:623–643
David CH (2019) RAPID, Zenodo. https://doi.org/10.5281/zenodo.593867David CH, Famiglietti JS, Yang Z-L, Habets F, Maidment DR (2016) A Decade of RAPID—
reflections on the development of an open source geoscience code. Earth Space Sci 3:1–19.https://doi.org/10.1002/2015EA000142
Elalem S, Pal I (2014) Mapping the vulnerability hotspots over Hindu-Kush Himalaya region toflooding disasters. Weather Clim Extremes. https://doi.org/10.1016/j.wace.2014.12.001
Etienne E et al (2019) From results analysis to intervention planning. Flood ResilienceAlliance-FRMC
EMDAT/CRED (2020)—Human cost of disasters. An overview of the last 20 years 2000–2019.https://cred.be/sites/default/files/CRED-Disaster-ReportHuman-Cost2000-2019.pdf
Fakhruddin B (2010) Enhancing flood forecasting and warning system (EFWS). https://www.researchgate.net/publication/230642130
GDACS (2019) Summary report and session outcomes at the HNPW 2019. Geneva, Switzerland,5 Feb 2019. https://www.gdacs.org/Knowledge/archivedocuments.aspx
Glantz MH (ed) (2009) Heads up!: early warning systems for climate, water and weather-relatedhazards. UNU
Hersbach H, de Rosnay P, Bell B, Schepers D, Simmons AJ, Soci C, Abdalla S, Balmaseda MA,Balsamo G, Bechtold P, Berrisford P, Bidlot J, de Boisséson E, Bonavita M, Browne P,Buizza R, Dahlgren P, Dee DP, Dragani R, Diamantaki M, Flemming J, Forbes R, Geer AJ,Haiden T, Hólm EV, Haimberger L, Hogan R, Horányi A, Janisková M, Laloyaux P, Lopez P,Muñoz Sabater J, Peubey C, Radu R, Richardson D, Thépaut JN, Vitart F, Yang X, Zsótér E,Zuo H (2018) Operational global reanalysis: progress, future directions and synergies withNWP. ERA Report Series no. 27, ECMWF, Reading, UK
Hirpa FA, Salamon P, Beck HE, Lorini V, Alfieri L, Zsoter E, Dadson SJ (2018) Calibration of theglobal flood awareness system (GloFAS) using daily streamflow data. J Hydrol 566:595–606.https://doi.org/10.1016/j.jhydrol.2018.09.052
Jackson EK (2018) An analysis of using error metrics to determine the accuracy of modeledhistorical streamflow on a global scale. All theses and dissertations, 6750. https://scholarsarchive.byu.edu/etd/6750
Jackson E, Roberts W, Nelsen B, Willliams GP, Nelson EJ, Ames DP (2019) Introductoryoverview: error metrics for hydrologic modelling—a review of common practices and an opensource library to facilitate use and adoption. Environmental Modeling and Software, May2019. https://doi.org/10.1016/j.envsoft.2019.05.001
Nelson EJ, Pulla ST, Matin MA, Shakya K, Jones N, Ames DP, Ellenburg WL, Markert KN,David CH, Zaitchik BF, Gatlin P, Hales R (2019) Enabling stakeholder decision-making withearth observation and modeling data using Tethys platform. Front Environ Sci 7:148. https://doi.org/10.3389/fenvs.2019.00148
Pappenberger F, Cloke H, Parker D, Watterhall F, Richardson D, Thielen J (2015) The monetarybenefit of early flood warnings in Europe. Environ Sci Policy 51:278–291. https://doi.org/10.1016/j.envsci.2015.04.016
Perera et al (2019) Flood early warning systems: a review of benefits, challenges and prospects.UNU-INWEH report series, issue 08. United Nations University Institute for Water,Environment and Health, Hamilton, Canada
Qiao X, Nelson EJ, Ames DP, Li Z, David CH, Williams GP, Roberts W, Sanchez JL, Edwards C,Souffront MA, Matin MA (2019) A systems approach to routing global gridded runoff throughlocal high-resolution stream networks for flood early warning systems. Environ Model Softw120(104501). https://doi.org/10.1016/j.envsoft.2019.104501
198 K. Tsering et al.
Roberts W, Williams GP, Jackson E, Nelson EJ, Ames DP (2018) HydroStats: a python packagefor characterizing errors between observed and predicted time series. J Hydrol 5(4). https://doi.org/10.3390/hydrology5040066
Saravi S, Kalawsky R, Joannou D, Rivas-Casado M, Fu G, Meng F (2019) Use of artificialintelligence to improve resilience and preparedness against adverse flood events. Water 11(5):973–986. https://doi.org/10.3390/w11050973
Shrestha MS, Grabs WE, Khadgi VR (2015) Establishment of a regional flood information systemin the Hindu Kush Himalayas: challenges and opportunities. Int J Water Resour Dev 31(2):238–252. https://doi.org/10.1080/07900627.2015.1023891
Sikder S, David CH, Allen GH, Qiao X, Nelson EJ, Matin MA (2019) Evaluation of availableglobal runoff datasets through a river model in support of transboundary water management inSouth and Southeast Asia. Front Environ Sci Landsurface Dyn. https://doi.org/10.3389/fenvs.2019.00171
Smith PJ, Brown S, Dugar S (2017) Community-based early warning systems for flood riskmitigation in Nepal. Nat Hazards Earth Syst Sci 17(3):423–437. https://doi.org/10.5194/nhess-17-423-2017
Snow Alan D, Christensen Scott D, Swain Nathan R, James Nelson E, Ames Daniel P, JonesNorman L, Ding D, Noman Nawajish S, David Cedric H, Pappenberger F, Zsoter E (2016) Ahigh-resolution national-scale hydrologic forecast system from a global ensemble land surfacemodel. J Am Water Resour Assoc 52(4):950–964. https://doi.org/10.1111/1752-1688.12434
Soille P, Burger A, Rodriguez D, Syrris V, Vasilev V (2016) Towards a JRC earth observationdata and processing platform. In: Proceedings of the conference on big data from space(BiDS’16), Santa Cruz de Tenerife, pp 15–17. http://dx.doi.org/10.2788/854791
Souffront Alcantara MA, Nelson EJ, Shakya K, Edwards C, Roberts W, Krewson C, Ames DP,Jones NL, Gutierrez A (2019) Hydrologic modeling as a service (HMaaS): a new approach toaddress hydroinformatic challenges in developing countries. Front Environ Sci 7:158. https://doi.org/10.3389/fenvs.2019.00158
Swain NR, Christensen SD, Snow AD, Dolder H, Espinoza-Dávalos G, Goharian E, Jones NL,Nelson EJ, Ames DP, Burian SJ (2016a) A new open source platform for lowering the barrierfor environmental web app development. https://www.sciencedirect.com/science/article/pii/S136481521630462583d339ef534741da754fcb8f9345b826
Swain NR, Christensen SD, Snow AD, Dolder H, Espinoza-Dávalos G, Goharian E et al (2016b)A new open source platform for lowering the barrier for environmental web app development.Environ Model Soft 85:11–26. https://doi.org/10.1016/j.envsoft.2016.08.003
Thielen del Pozo J, Thiemig V, Pappenberger F, Revilla-Romero B, Salamon P, De Groeve T,Hirpa F (2015) The benefit of continental flood early warning systems to reduce the impact offlood disasters. Joint Research Centre, the European Commission. Available at http://publications.jrc.ec.europa.eu/repository/bitstream/JRC97266/lbna27533enn.pdf
UNDRR—United Nations Office for Disaster Risk Reduction (2004) Early warning as a matter ofpolicy. Retrieved from https://www.UNDRR.org/files/8290_earlywarningasamatterofpolicy.pdf
UNDRR—United Nations Office for Disaster Risk Reduction (2006) Global survey of early warningsystems: an assessment of capacities, gaps and opportunities towards building a comprehensiveglobal early warning system for all natural hazards. Retrieved from https://www.UNDRR.org/2006/ppew/info-resources/ewc3/Global-Survey-of-Early-Warning-Systems.pdf
UNESCO (2007) Disaster preparedness and mitigationUNISDR (2006) Developing early warning systems: a checklist. United Nations International
Strategy for Disaster Reduction. In: EWC III third international conference on early warning.Available at: http://www.unisdr.org/2006/ppew/info-resources/ewc3/checklist/English.pdf
United Nations Development Programme (UNDP) (2018) Five approaches to build functionalearly warning systems
WMO/GWP (2013) Integrated flood management tools series flood forecasting and early warning.Associated Programme on Flood Management (APFM), World Meteorological Organization(WMO), Global Water Partnership (GWP), issue 19, May 2013
9 Enhancing Flood Early Warning System in the HKH Region 199

WMO (2009) Guidelines on analysis of extremes in a changing climate in support of informeddecisions for adaptation. WMO/TD- No. 1500; WCDMP- No. 72
WMO—World Meteorological Organization (2013) Integrated flood management tools series:flood forecasting and early warning. Retrieved from https://library.wmo.int/doc_num.php?explnum_id=4269
World Meteorological Organization (WMO) (2011) Manual on flood forecasting and warning(WMO-No. 1072)
Open Access This chapter is licensed under the terms of the Creative Commons Attribution 4.0International License (http://creativecommons.org/licenses/by/4.0/), which permits use, sharing,adaptation, distribution, and reproduction in any medium or format, as long as you give appro-priate credit to the original author(s) and the source, provide a link to the Creative Commonslicense, and indicate if changes were made.The images or other third party material in this chapter are included in the chapter’s Creative
Commons license, unless indicated otherwise in a credit line to the material. If material is notincluded in the chapter’s Creative Commons license and your intended use is not permitted bystatutory regulation or exceeds the permitted use, you will need to obtain permission directly fromthe copyright holder.
200 K. Tsering et al.

Chapter 10Rapid Flood Mapping UsingMulti-temporal SAR Images:An Example from Bangladesh
Kabir Uddin, Mir A. Matin, and Rajesh Bahadur Thapa
10.1 Introduction
In the HKH region, large areas in Afghanistan, Bangladesh, China, India,Myanmar, Nepal, and Pakistan get inundated by floodwater during every rainyseason. Among them, Bangladesh has been experiencing record-high floods wherefour types prevail: flash flood, local rainfall flood, monsoon river flood, andstorm-surge flood; and these occur almost every year due to Bangladesh’s uniquegeographical setting as the most downstream country in the HKH region (Ozaki2016; FFWC 2020). On an average, about 26,000 km2 of Bangladesh is inundatedduring the monsoon season (Fig. 10.1). Among all the disaster years, the floods of1988 were the most catastrophic when more than 2379 people were killed, 45million were affected, and 82,000 km2 of land was inundated (Dewan 2015; Rasidand Pramanik 1993).
For the mitigation of flood disaster impacts, it is very critical to know whichareas are inundated and which are not. Based on timely information on inundation,disaster and relief agencies can speed up emergency response for relief and rescuemeasures. At the same time, the flood-affected people can also find safe shelters(Manjusree et al. 2012; Uddin et al. 2013). Therefore, flood early warning, nearreal-time (NRT) inundation information and preparedness are the best options inflood disaster management (Uddin et al. 2019). Flood maps provide essential inputstoward assessing the progression of inundation area and the severity of the floodsituation (Amarnath and Rajah 2016; Cigna and Xie 2020). Satellite-based Earthobservation (EO) techniques are used for preparing such flood maps that help inassessing damages to residential property, infrastructure, and crops (Hill 2016;Uddin and Shrestha 2011).
K. Uddin (&) � M. A. Matin � R. B. ThapaInternational Centre for Integrated Mountain Development, Kathmandu, Nepale-mail: [email protected]
© The Author(s) 2021B. Bajracharya et al. (eds.), Earth Observation Science and Applications for RiskReduction and Enhanced Resilience in Hindu Kush Himalaya Region,https://doi.org/10.1007/978-3-030-73569-2_10
201
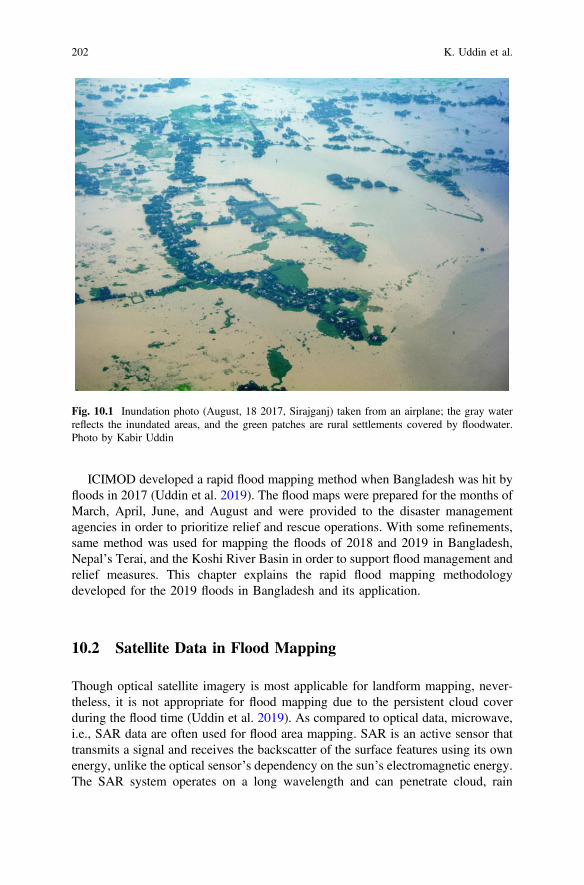
ICIMOD developed a rapid flood mapping method when Bangladesh was hit byfloods in 2017 (Uddin et al. 2019). The flood maps were prepared for the months ofMarch, April, June, and August and were provided to the disaster managementagencies in order to prioritize relief and rescue operations. With some refinements,same method was used for mapping the floods of 2018 and 2019 in Bangladesh,Nepal’s Terai, and the Koshi River Basin in order to support flood management andrelief measures. This chapter explains the rapid flood mapping methodologydeveloped for the 2019 floods in Bangladesh and its application.
10.2 Satellite Data in Flood Mapping
Though optical satellite imagery is most applicable for landform mapping, never-theless, it is not appropriate for flood mapping due to the persistent cloud coverduring the flood time (Uddin et al. 2019). As compared to optical data, microwave,i.e., SAR data are often used for flood area mapping. SAR is an active sensor thattransmits a signal and receives the backscatter of the surface features using its ownenergy, unlike the optical sensor’s dependency on the sun’s electromagnetic energy.The SAR system operates on a long wavelength and can penetrate cloud, rain
Fig. 10.1 Inundation photo (August, 18 2017, Sirajganj) taken from an airplane; the gray waterreflects the inundated areas, and the green patches are rural settlements covered by floodwater.Photo by Kabir Uddin
202 K. Uddin et al.

showers, and fog, making monitoring possible during flooding. Furthermore, theinundated areas often remain calm making the water surface smooth which resultsin less signal returned to the satellite. As a result, the inundated areas in the radarimage appear darker in contrast to other land areas. These characteristics of SARadd significant values in terms of determining flood extent mapping and accuratemeasurement of streams, lakes, and wetlands (Ajmar et al. 2017; Amarnath andRajah 2016; Ohki et al. 2016; Voormansik et al. 2014). Currently, satellites likeALOS-2, RADARSAT-2, TerraSAR, and Sentinel-1 are in operation and providingglobally consistent SAR data. These satellites operate in different bands ofmicrowave wavelength: ALOS-2 in L; RADARSAT-2 and Sentinel-1 in C; andTerraSAR in X. There are many flood mapping applications available from thesesatellites in the scientific literature, and it is suggested that compared to other bands,the L-band data provides the best results due to its longer wavelength and betterpenetration capability (Longépé et al. 2011; Shimada et al. 2014). However,ALOS-2, RADARSAT-2, and TerraSAR are operated on a commercial basis whichinvolves procurement process that costs time and money. Therefore, Sentinel-1SAR images are mostly preferred in flood mapping as it is available soon after thedata acquisition, it is web-based open access and free for all and maintains rela-tively high-frequent observations.
So, for rapid flood mapping, we can take advantage of the Sentinel-1 dataavailable in the public domain. The great asset of Sentinel-1 SAR images is that thedata are freely available within a few hours of capture which helps to support NRTemergency responses.
10.3 SAR Data Processing Tools
There are many SAR data processing and analysis tools available in both openaccess—MapReady, Sentinel Application Platform (SNAP), Google Earth Engine(GEE), InSAR Scientific Computing Environment (ISCE), Generic InSARAnalysis Toolbox (GIAnt), Repeat Orbit Interferometry PACkage (ROI_PAC),Delft Institute of Earth Observation and Space Systems (DORIS), Generic MappingTools Synthetic Aperture Radar (GMTSAR), and PolSAR. In commercial modes—GlobalSAR, SARscape, Photomod Radar, SARPROZ, PCI, and GAMMA. Thecommonly used SAR processing tools on the open-access platform are MapReady,SNAP, GEE, and PolSAR Pro. These tools consist of proper documentation andcan easily be handled by even non-expert flood analyst. In the commercial domain,the GAMMA software tool is widely used due to its availability on both desktops aswell as cloud-computing platforms. The software is also popular among the SARuser communities for its capability inaccurate terrain correction. However, the costfactor of such commercial tools may be an issue with some users.
As for cloud-based data processing platforms like GEE, they provide excellentopportunity to process a large volume of satellite images at planetary scale at nomonetary cost (Saah et al. 2020; Uddin et al. 2019; Kumar and Mutanga 2018;
10 Rapid Flood Mapping Using Multi-temporal SAR Images … 203

Uddin et al. 2020). GEE maintains a data catalog and processing engine based onthe programming languages, JavaScript and Python. The users can build the pro-cessing algorithm either in JavaScript or Python which directly access data fromGEE’s main repository or from its users’ asset stored in the GEE cloud space andthen apply the algorithm for processing the data.
10.4 Use of SAR Flood Mapping for Emergency Responsein the HKH Region
In order to deploy rescue and relief operations, disaster management and human-itarian authorities need to know urgently about real-time flood situations.Nevertheless, the traditional flood mapping system has many limitations in terms ofproviding timely and updated information on the wider flood-prone landscape. In2008, recognizing that flood maps are necessary for disaster preparedness, ICIMODstarted its initiative of SAR image-based flood mapping (Uddin and Shrestha 2011).However, inundation mapping at the level of river basins was only initiated in 2016when the Koshi River Basin, including India’s most flood-prone state, Bihar, washit by massive floods. So, in order to obtain reliable information on the Koshi RiverBasin, ICIMOD prepared a district-level flood inundation map for the Bihar StateDisaster Management Authority (BSDMA). In this process, images from AdvancedLand Observing Satellite - Phased Array L-band Synthetic Aperture Radar(ALOS-PALSAR) were used (Hill 2016; Bhubaneshwar 2016).
This map provided an estimate of the inundated areas, including of agriculturallands, grasslands, barren fields, built-up spaces, and fishponds. The map becameuseful for the BSDMA in its search-and-rescue operations and in managing reliefcamps (Bhubaneshwar 2016). However, due to their commercial nature, the datafrom ALOS-PALSAR were forbidding in terms of the expenses involved inmapping large areas and doing so every year. So, in 2017, for the first time inBangladesh, rapid flood mapping via Sentinel-1 SAR was initiated which was thencontinued with when the country faced floods in 2019 (Fig. 10.3). The next sectiondescribes the methodology of mapping and the emergency response mechanism thatwere followed during the recent floods inundation in Bangladesh.
10.5 Rapid Flood Mapping—Bangladesh, 2019
For the mapping, 11 Sentinel-1 images were downloaded for Bangladesh directlyfrom the Copernicus Open-Access Hub (https://scihub.copernicus.eu/dhus/#/home)as the data were available in a few hours from the time of acquisition. These imageswere in the interferometric-wide (IW) mode, with a minimum of 250-km groundswath in the C-band. The IW-mode data for the country were available as dualpolarizations—vertical transmission and the horizontal received (VH) and vertical
204 K. Uddin et al.
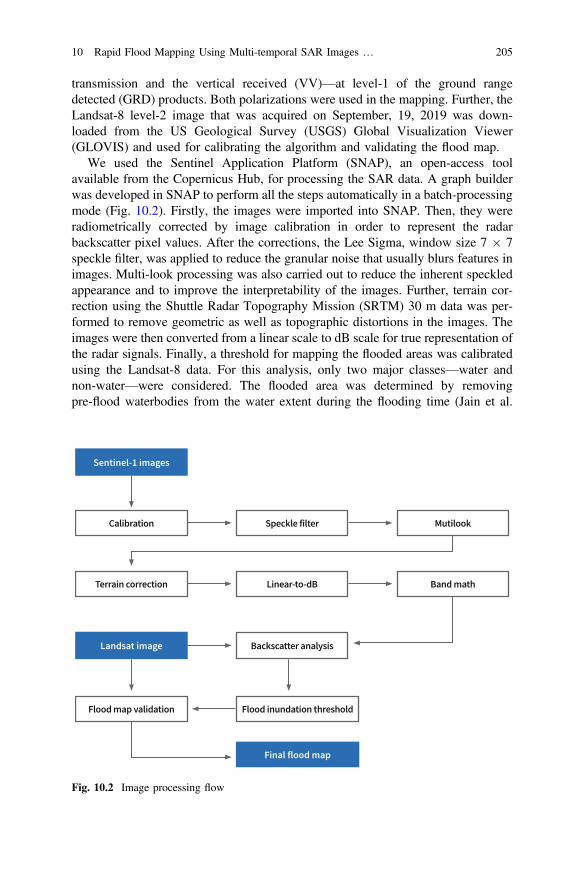
transmission and the vertical received (VV)—at level-1 of the ground rangedetected (GRD) products. Both polarizations were used in the mapping. Further, theLandsat-8 level-2 image that was acquired on September, 19, 2019 was down-loaded from the US Geological Survey (USGS) Global Visualization Viewer(GLOVIS) and used for calibrating the algorithm and validating the flood map.
We used the Sentinel Application Platform (SNAP), an open-access toolavailable from the Copernicus Hub, for processing the SAR data. A graph builderwas developed in SNAP to perform all the steps automatically in a batch-processingmode (Fig. 10.2). Firstly, the images were imported into SNAP. Then, they wereradiometrically corrected by image calibration in order to represent the radarbackscatter pixel values. After the corrections, the Lee Sigma, window size 7 � 7speckle filter, was applied to reduce the granular noise that usually blurs features inimages. Multi-look processing was also carried out to reduce the inherent speckledappearance and to improve the interpretability of the images. Further, terrain cor-rection using the Shuttle Radar Topography Mission (SRTM) 30 m data was per-formed to remove geometric as well as topographic distortions in the images. Theimages were then converted from a linear scale to dB scale for true representation ofthe radar signals. Finally, a threshold for mapping the flooded areas was calibratedusing the Landsat-8 data. For this analysis, only two major classes—water andnon-water—were considered. The flooded area was determined by removingpre-flood waterbodies from the water extent during the flooding time (Jain et al.
Fig. 10.2 Image processing flow
10 Rapid Flood Mapping Using Multi-temporal SAR Images … 205
2006). The waterbodies that had water before mid-April were considered asperennial water bodies. The April 2019 waterbodies were separated from those ofthe months of June, July, August, and September, and the map was reclassified toindicate perennial waterbodies, flood areas, and other classes. To have confidencein the analyzed flood maps, we used 500 validation reference points from theLandsat image. The overall accuracy of the flood map in September 2019 as againstthe reference data was 98 percent. After that, an overlay analysis was carried out totrace the rise in flood and its recession between June and September 2019.
The inundation maps of multiple months were also analyzed for assessing thechanges in flood situation during different times of the flooding period. An exampleof such analysis for the floods in 2017 revealed that while the total flood periodspanned from April to August, there were some differences in the inundation pat-terns in different months. Some of the areas suffered from sustained flooding; insome others, the water had receded; while some areas were newly flooded.Comparatively, in the months of April and June in 2019, an area of 257,729 ha wasinundated in both the months; an area of 38,776 ha had recovered from the inun-dation; and an area of 410,853 ha was newly flooded. At the same time, during themonths of June and August in 2019, an area of 532,173 ha was flooded for both themonths; some 136,406 ha had recovered from the floods; while an area of502,927 ha was newly inundated. The 2019 rapid flood mapping exercise for entireBangladesh went on to produce inundation maps for the months of June, July,August, and September (Fig. 10.3).
10.6 Dissemination and Outcome
One of the best outcomes of the flood mapping exercise was the rapid generation ofinundation maps and sharing of that information with the relevant people usingdifferent communication channels. In addition to generating digital maps, thegeo-referenced inundation data layers were also disseminated to a wider group ofusers through an information portal to enable further analysis by the users (WFP2017). A web-based portal was also created for flood map visualization withoverlay option showing different administrative boundaries. Such flood-associatedinformation, maps, and data were downloadable to support further analysis by theusers (Fig. 10.4). Digital maps of A1-size were also disseminated to disastermanagement committees for printing and using offline. The rapid inundation mapswere widely used for responses and were appreciated by humanitarian agencies(Fig. 10.4).
206 K. Uddin et al.
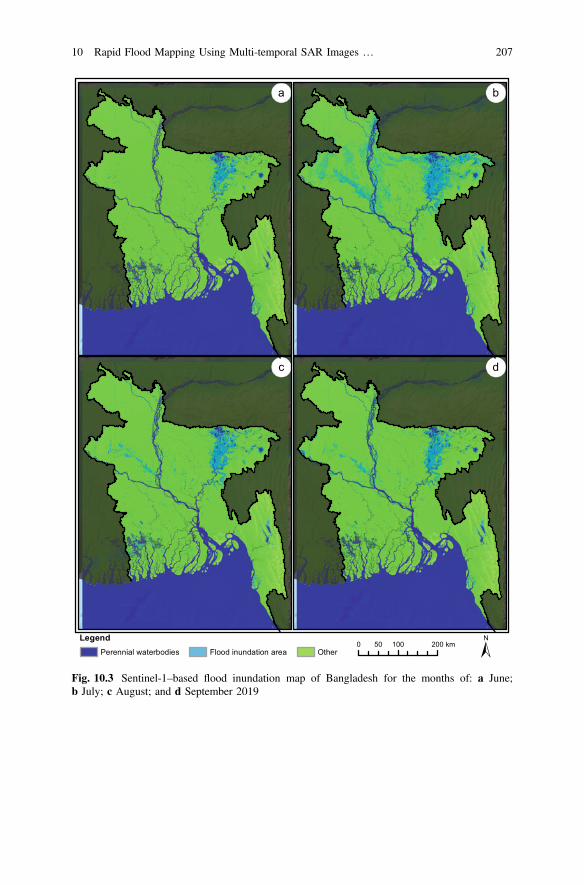
b
c d
a
0 100 20050 kmLegend
Perennial waterbodies Flood inundation area Other
Fig. 10.3 Sentinel-1–based flood inundation map of Bangladesh for the months of: a June;b July; c August; and d September 2019
10 Rapid Flood Mapping Using Multi-temporal SAR Images … 207
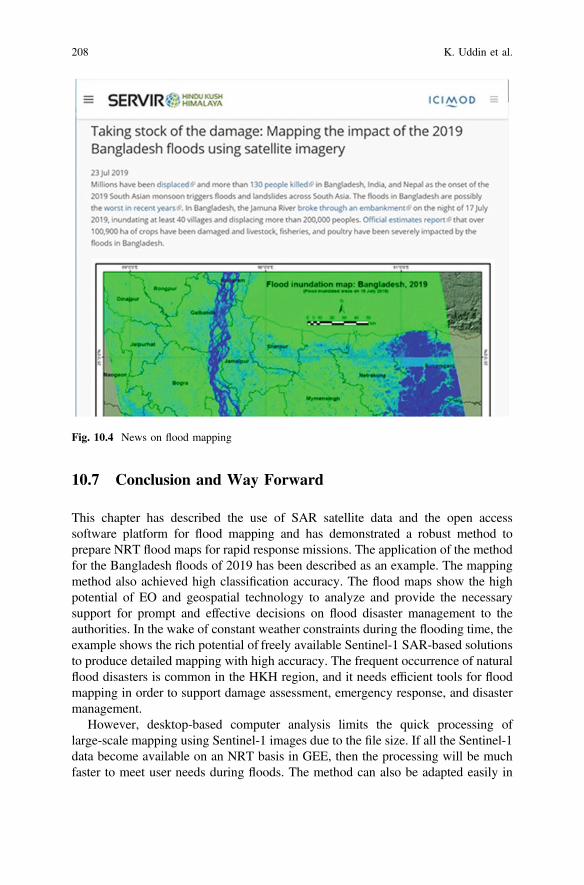
10.7 Conclusion and Way Forward
This chapter has described the use of SAR satellite data and the open accesssoftware platform for flood mapping and has demonstrated a robust method toprepare NRT flood maps for rapid response missions. The application of the methodfor the Bangladesh floods of 2019 has been described as an example. The mappingmethod also achieved high classification accuracy. The flood maps show the highpotential of EO and geospatial technology to analyze and provide the necessarysupport for prompt and effective decisions on flood disaster management to theauthorities. In the wake of constant weather constraints during the flooding time, theexample shows the rich potential of freely available Sentinel-1 SAR-based solutionsto produce detailed mapping with high accuracy. The frequent occurrence of naturalflood disasters is common in the HKH region, and it needs efficient tools for floodmapping in order to support damage assessment, emergency response, and disastermanagement.
However, desktop-based computer analysis limits the quick processing oflarge-scale mapping using Sentinel-1 images due to the file size. If all the Sentinel-1data become available on an NRT basis in GEE, then the processing will be muchfaster to meet user needs during floods. The method can also be adapted easily in
Fig. 10.4 News on flood mapping
208 K. Uddin et al.
the earth engine platform. In the case of Bangladesh, the operational mappingapplications have produced a flood map with the best precision at a national scale.Nevertheless, there were some issues with the flood maps due to existenceof floating vegetation. The SAR Sentinel-1 images sometimes showed paddy fieldsas flooded areas while that was not the case. In those cases, local knowledge couldplay a significant role.
References
Ajmar A, Boccardo P, Broglia M, Kucera J, Giulio-Tonolo F, Wania A (2017) Response to floodevents: the role of satellite-based emergency mapping and the experience of the copernicusemergency management service. Flood Damage Surv Assess New Insights Res Pract 228:213
Amarnath G, Rajah A (2016) An evaluation of flood inundation mapping from MODIS and ALOSsatellites for Pakistan. Geomatics, Nat Hazards Risk 7(5):1526–1537. https://doi.org/10.1080/19475705.2015.1084953
Bhubaneshwar (2016) Most flood-prone state Bihar aided by new satellite mapping. FinancialExpress
Cigna F, Xie H (2020) Imaging floods and glacier geohazards with remote sensing.Multidisciplinary Digital Publishing Institute, Switzerland
Dewan TH (2015) Societal impacts and vulnerability to floods in Bangladesh and Nepal. WeatherClim Extremes 7:36–42
FFWC (2020) Definitions-the floods in Bangladesh. Flood Forecasting and Warning Centre,Bangladesh Water Development Board (BWDB). Accessed 01 Sept 2020
Hill E (2016) India—Palsar remote sensing enables accurate flood-mapping of Bihar State. FloodList
Jain SK, Saraf AK, Goswami A, Ahmad T (2006) Flood inundation mapping usingNOAA AVHRR data. Water Resour Manage 20(6):949–959
Kumar L, Mutanga O (2018) Google Earth Engine applications since inception: usage, trends, andpotential. Remote Sens 10(10):1509
Longépé N, Rakwatin P, Isoguchi O, Shimada M, Uryu Y, Yulianto K (2011) Assessment ofALOS PALSAR 50 m ortho rectified FBD data for regional land cover classification bysupport vector machines. IEEE Trans Geosci Remote Sens 49(6):2135–2150
Manjusree P, Kumar LP, Bhatt CM, Rao GS, Bhanumurthy V (2012) Optimization of thresholdranges for rapid flood inundation mapping by evaluating backscatter profiles of high incidenceangle SAR images. Int J Disaster Risk Sci 3(2):113–122
Ohki M, Watanabe M, Natsuaki R, Motohka T, Nagai H, Tadono T, Suzuki S, Ishii K, Itoh T,Yamanokuchi T (2016) Flood area detection using ALOS-2 PALSAR-2 data for the 2015heavy rainfall disaster in the Kanto and Tohoku Area, Japan. J Remote Sens Soc Japan 36(4):348–359. https://doi.org/10.11440/rssj.36.348
Ozaki M (2016) Disaster risk financing in Bangladesh. Working Paper Series No. 46, September2016. ADB South Asia. http://dx.doi.org/10.2139/ssrn.2941319
Rasid H, Pramanik M (1993) Areal extent of the 1988 flood in Bangladesh: how much did thesatellite imagery show? Nat Hazards 8(2):189–200
Saah D, Tenneson K, Poortinga A, Nguyen Q, Chishtie F, San Aung K, Markert KN, Clinton N,Anderson ER, Cutter P (2020) Primitives as building blocks for constructing land cover maps.Int J Appl Earth Obs Geoinf 85:101979
Shimada M, Itoh T, Motooka T, Watanabe M, Shiraishi T, Thapa R, Lucas R (2014) New globalforest/non-forest maps from ALOS PALSAR data (2007–2010). Remote Sens Environ155:13–31
10 Rapid Flood Mapping Using Multi-temporal SAR Images … 209

Uddin K, Gurung DR, Giriraj A, Shrestha B (2013) Application of Remote Sensing and GIS forflood hazard management: a case study from Sindh Province, Pakistan. Am J Geogr Inf Syst 2(1):1–5. https://doi.org/10.5923/j.ajgis.20130201.01
Uddin K, Khanal N, Chaudhary S, Maharjan S, Thapa RB (2020) Coastal morphological changes:Assessing long-term ecological transformations across the northern Bay of Bengal. EnvironChallenges 1:100001
Uddin K, Matin MA, Meyer FJ (2019) Operational flood mapping using multi-temporal sentinel-1SAR images: a case study from Bangladesh. Remote Sens 11(13):1581
Uddin K, Shrestha B (2011) Assessing flood and flood damage using remote sensing: a case studyfrom Sunsari, Nepal. Paper presented at the 4th international conference on water and floodmanagement, Dhaka
Voormansik K, Praks J, Antropov O, Jagomagi J, Zalite K (2014) Flood mapping withTerraSAR-X in forested regions in Estonia. IEEE J Sel Topics Appl Earth ObservationsRemote Sens 7(2):562–577
WFP (2017) Terai flood 72 hour assessment [Version 1], August 2017. WFP, Kathmandu
Open Access This chapter is licensed under the terms of the Creative Commons Attribution 4.0International License (http://creativecommons.org/licenses/by/4.0/), which permits use, sharing,adaptation, distribution and reproduction in any medium or format, as long as you give appropriatecredit to the original author(s) and the source, provide a link to the Creative Commons license andindicate if changes were made.The images or other third party material in this chapter are included in the chapter’s Creative
Commons license, unless indicated otherwise in a credit line to the material. If material is notincluded in the chapter’s Creative Commons license and your intended use is not permitted bystatutory regulation or exceeds the permitted use, you will need to obtain permission directly fromthe copyright holder.
210 K. Uddin et al.
Chapter 11Monitoring of Glaciers and GlacialLakes in Afghanistan
Sudan Bikash Maharjan, Finu Shrestha, Fayezurahman Azizi,Esmatullah Joya, Birendra Bajracharya,Mohammad Tayib Bromand, and Mohammad Murtaza Rahimi
11.1 Introduction
During the needs assessment in Afghanistan, the General Directorate of WaterResources (GDWR) of the National Water Affairs Regulation Authority (NWARA)(previously Water Resource Department (WRD) of the Ministry of Energy andWater (MEW)) emphasized that the compilation of comprehensive data on theglaciers in the country is a national priority.
Glaciers are of paramount importance in arid and semi-arid places likeAfghanistan and serve as sources of freshwater for a large proportion of its popu-lation. Globally, the considerable evidence on retreat and shrinkage of glaciers, andthe formation and expansion of glacial lakes have become a hot topic forresearchers, scientists, and policymakers. The clear evidence of glacial retreat inAfghanistan, as found by ICIMOD’s studies, poses a serious threat to the country’swater security.
Worldwide, most glaciers have undergone major retreat since the end of theLittle Ice Age (Marshall 2014; Zemp et al. 2014). This retreat was first noticed inthe 1960s (Grotzbach 1964; Gilbert et al. 1969; Braslau 1972), and it accelerated inthe last three decades (Gardent et al. 2014; Bajracharya et al. 2014a, b; Mernildet al. 2013). The HKH region has the highest concentration of snow and glaciersoutside the polar regions and they play a pivotal role in supplying water to 10 majorriver basins (Bajracharya and Shrestha 2011). Glacial changes are also a valuableindicator of climate change (Wester et al. 2019; Nie et al. 2017; Song et al. 2017;Bajracharya et al. 2014a). By the end of the twenty-first century, the global surface
S. B. Maharjan (&) � F. Shrestha � E. Joya � B. Bajracharya � M. M. RahimiInternational Centre for Integrated Mountain Development, Kathmandu, Nepale-mail: [email protected]; [email protected]
F. Azizi � M. T. BromandGeneral Directorate of Water Resources, National Water Affairs Regulation Authority, Kabul,Afghanistan
© The Author(s) 2021B. Bajracharya et al. (eds.), Earth Observation Science and Applications for RiskReduction and Enhanced Resilience in Hindu Kush Himalaya Region,https://doi.org/10.1007/978-3-030-73569-2_11
211

temperature is likely to exceed by 1.5 °C (IPCC 2013). In the case of Afghanistan,the reanalysis data from the period 1951 to 2010 show that the mean annualtemperature increased in all parts of the country by 1.8 °C, with the highest increaseof 2.4 °C recorded in the south, 1.6 and 1.7 °C in north and central part of thecountry, and 1 °C in the Hindu Kush Region (Aich et al. 2017). It is also observedthat the warming in the main glaciated region of Afghanistan (Badakhshan) isbetween 0.3 and 0.7 °C. Moreover, the projection of mean temperature under RCP4.5 indicates that by the 2050s, the strongest warming in the country is set to takeplace in the Wakhan Corridor—by over 2 °C—followed by the Central Highlands—by 1.75 to 2 °C (Aich et al. 2017). This rise in temperature will obviously lead tothe melting of glaciers, trigger variability in snow cover, and change the othercomponents of the cryosphere. Further, the combination of dust storms—mainlyoriginating from the Central Asian countries and the northern deserts ofAfghanistan—and the aerosols resulting from anthropogenic activities complicatethe interaction between the atmosphere and the dynamics of the glaciers (Prasadet al. 2011).
It is all too well known that changes in glaciers will have a significant impact onthe water resources—it will reduce water availability and the hydropower potentialand change the seasonality of flows in the region. Glacier retreats often lead toformation of glacial lakes, the expansion of existing glacial lakes, and to GlacialLake Outburst Floods (GLOFs). In this regard, several catastrophic GLOFs havealready been reported from the region (Gurung et al. 2017; Allen et al. 2015;Bajracharya et al. 2007). A recent GLOF in a tributary of Panjshir River (on 12 July2018) not only devastated the village of Peshghor in Khenj but also dammed thePanjshir River, thereby inundating the main river valley for up to 1.7 km from theriver confluence. This GLOF was due to the sudden release of glacial lake waterfrom newly developed and rapidly expanded glacial lake on the surface of theglacier ice covered by debris due to melting of glacier ice and snow. The glaciallake water released through the sub-glacial channel due to melting and erosion ofunderneath ice and debris (Maharjan 2018; Afghanistan Times 2018; Flood List2018). The flood took place at midnight, thereby trapping the people who wereasleep. Ten people lost their lives, while there were severe damages to livestock andproperty—some 300 houses were swept away, over 20 villages were affected, and amarket in the Peshghor area also bore the brunt (Afghanistan Times 2018). It is insuch a context that the monitoring of glaciers and glacial lakes in Afghanistan gainscritical importance; in-depth studies must be conducted to understand the responseof glaciers to climate change and on how climate change affects the overallhydrology of the country.
In Afghanistan, glaciers serve as the headwaters of the Panj-Amu (Amu Darya)River Basin and the Kabul River Basin which contribute to the Indus river basin.However, there is very little information on the country’s glacier extent and onperiodic glacial changes because of the complex topography, paucity of field work,and geopolitical restrictions. This means there is not enough understanding aboutfreshwater availability, potential glacial hazards, and future scenarios on wateravailability in Afghanistan. As regards addressing the gaps in information on the
212 S. B. Maharjan et al.
periodic changes in glaciers and glacial lakes, since 2017, ICIMOD has beenworking closely with the GDWR to develop the capacity of Afghan professionals inthis area and to prepare detailed information on the status and changes in glaciersand glacial lakes. This collaborative research has helped to comprehend the recent(2015) and decadal (1990, 2000, and 2010) scenario of glaciers and glacial lakes; ithas also generated a four-period database that would shed more light on glacial meltand glacial hazards, and thus predict the future scenario of water availability in thecountry.
11.2 Glacier and Glacial Lake Monitoring Approach
Glaciers and glacial lakes are interwoven components of the cryosphere. Glaciersare composed of snow, ice, water, and rock/debris which move slowly down thegradient and melt due to changes in temperature. Glacial lakes are formed by theimpoundment of meltwater in the lowlands formed by glacier erosion and/orblocked by the glacier-deposited moraine.
In general practice, the mapping and monitoring of glaciers and glacial lakes aredone either through field practices or through remote sensing. Field-based moni-toring is widely practiced to gauge glacier mass changes. It also helps in gatheringinformation about the physical characteristics of a glacial lake, its moraine dam, andother surrounding features so that the risk of GLOF is mitigated. The demarcationof the boundary of a glacier and glacial lake is conducted using various surveyinstruments like total stations and the differential Global PositioningSystem (dGPS) in the field. Although the field-based method provides moreaccurate information, it is only applicable in the case of a few accessible glaciers;the rest is almost inaccessible due to rugged terrain and extreme weather conditions;there’s also the factor of time and resources.
Before the availability of satellite images, glaciers were mostly studied viafieldwork. A few scientists have conducted field-based studies on some of theAfghan glaciers; this was before the 1980s. In 1964, Grotzbach noted a generalglacier retreat in the Khwaja Mohammed mountains; in 1969, Gilbert et al. studieda small glacier near Mir Samir in central Hindu Kush; (in 1972, Braslau) studied thegeneral recession of the Keshnikhan glacier at the entrance to the Wakhan Corridor;in 1976, Breckle and Frey (1976a, b) noticed relatively strong glaciation in east andsouth-east Afghanistan near the Pakistan border; in 1974, Austrian investigators(Patzelt 1978) measured the glacier orientation, maximum and minimum elevation,length, total area and debris-covered area, glacier hypsometry, and glacier changesin the South Issik glacier; Patzelt also studied the transient snow lines, the lateralmoraine altitude, and the daily ablation rates of the glacier (Haritashya et al. 2009).
In the past, field and aerial photographs were widely used to study glacialchanges. The Russians were very much interested in the glaciers of Afghanistanbecause of the meltwater resources that flow out of the country, towards the north.They conducted an intensive study in some parts of the Wakhan area (Haritashya
11 Monitoring of Glaciers and Glacial Lakes in Afghanistan 213

et al. 2009). They carried out stereo-aerial photography covering one-third of thenorthern part of Afghanistan (Shroder 1980, 1989). In 1974, they began to prepare aglacier inventory of Afghanistan using incomplete sets of small-scale topographicmaps derived from the aerial photographs taken in 1958–1959.
The recent development in RS and GIS techniques offer great potential formapping and monitoring glaciers and glacier lakes on a larger scale and in shortertime periods (Paul et al. 2002; Bhambri and Bolch 2009; Bolch et al. 2010). Thesetechniques enable automated image analysis, thereby reducing the time and cost toanalyze the changes during various time periods. They also allow for geodeticsurveys of individual and the entire river basin system.
In 2014, a team from Global Land Ice Measurements from Space (GLIMS)published a book on glacier studies at the global scale, which also carries a separatechapter on the study of glaciers using remote sensing in Afghanistan and Pakistan.This study, using various satellite images, reported the retreat of glaciers inAfghanistan, but could not come up with a digital data set of glacial changes for thewhole of Afghanistan. In 2011, ICIMOD published a report on the status of glaciersin the HKH region, which also covers the glaciers in Afghanistan. However, thereport does not cover the glacial area changes in Afghanistan; it provides onlyone-time data. Hence, the present study was initiated to prepare a database on thechanges in glacier and glacier lakes in Afghanistan; this database is based on RSand GIS tools and techniques.
11.3 Implementation
The study adopted a semi-automatic method using an object-based image classi-fication (OBIC) (Bajracharya and Shrestha 2011; Bajracharya et al. 2014a, 2018),to prepare the clean-ice (CI) and debris-covered (DC) glacier as a separate entity.For consistency, the same approach of mapping was applied for glacial lakes with
Fig. 11.1 Detailed methodology of mapping glaciers and glacial lakes
214 S. B. Maharjan et al.

the images used for glacier mapping (Fig. 11.1). The overall process of mappingconsisted of separate algorithms for CI and DC glaciers as also for glacial lakes butwith some manual intervention. The detailed multistage process of mapping gla-ciers and glacial lakes is summarized in Fig. 11.1.
The study used a series of Landsat (TM, ETM+ , and OLI) images which arefreely accessible and have a long historical record from 1980s. However,throughout the study area, due to topographic and climatic variability, it was dif-ficult to get ideal images without cloud cover and least snow cover during the sametime period. So, the images were selected with a one-year buffer of the represen-tative year—for example, Landsat images from 2014 to 2016 were considered formapping to represent the year 2015.
The classification of multispectral images, combined with the digital elevationmodel (DEM), was processed in the eCognition software. At first, the Landsatimages of 2015 were used to prepare the status of glaciers and glacial lakes ofAfghanistan. In this process, the image was segmented using multi-resolutionsegmentation mechanism which creates the image objects based upon spectralreflectance, shape, texture, and the relation to neighboring objects. These imageobjects were then classified based on spectral and spatial characteristics. Separatealgorithms were used for mapping CI and DC glaciers and for glacial lakes. The CIpart of the glaciers was mapped using the Normalized Difference Snow Index(NDSI); however, here it has to be noted that the threshold value of NDSI alsocaptures the snow cover and other features such as shadows and waterbodies. Thesemisclassified features were then eliminated by using various filters. Similarly, theDC part of the glaciers was mapped using the slope from the remaining unclassifiedobjects, and various filters were used to eliminate the misclassified features(Fig. 11.1). For glacial lakes, the Normalized Difference Water Index (NDWI) wasused to map the lake boundary. Sometimes, ice cliffs and walls of supra-glaciallakes are misclassified as glacial lakes, which were corrected by using various filterslike Hue, Normalized Difference Vegetative Index (NDVI), and Land and WaterMask (LWM) (Fig. 11.1). The final output of the image classification was exportedas vector data sets. The minor visual corrections, as well as quality checks andgeneration of parameters for the glaciers and glacial lakes, were conducted in theGIS environment. The other time data sets from the years 1990, 2000, and 2010were generated by manually editing the 2015 data overlaying on the respectiveimages of those three years. For higher accuracy and data quality, the results werefurther refined manually by backdropping the respective Landsat images andcross-checking on the available high-resolution images in Google Earth.
11 Monitoring of Glaciers and Glacial Lakes in Afghanistan 215
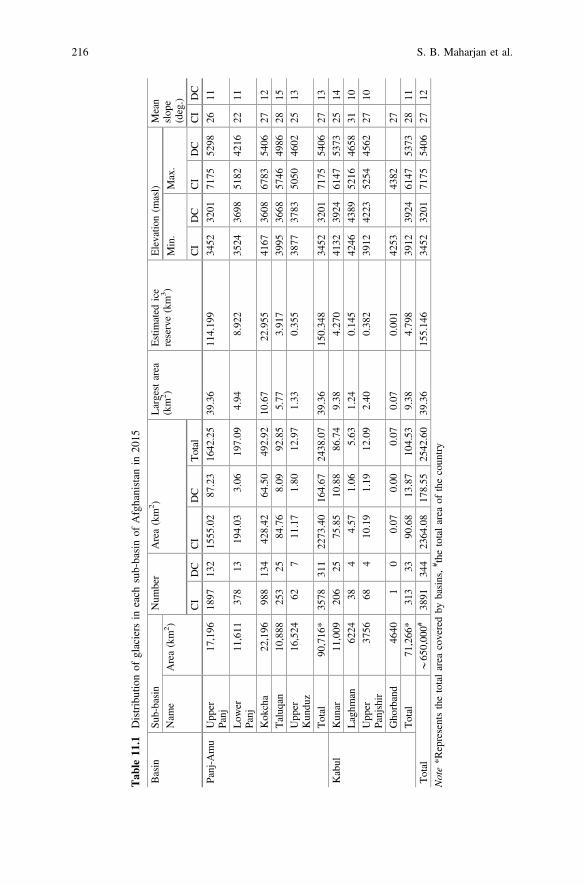
Tab
le11
.1Distributionof
glaciers
ineach
sub-basinof
Afghanistan
in20
15
Basin
Sub-basin
Num
ber
Area(km
2 )Largestarea
(km
2 )Estim
ated
ice
reserve(km
3 )Elevatio
n(m
asl)
Mean
slop
e(deg.)
Nam
eArea(km
2 )Min.
Max.
CI
DC
CI
DC
Total
CI
DC
CI
DC
CI
DC
Panj-A
mu
Upp
erPanj
17,196
1897
132
1555.02
87.23
1642.25
39.36
114.19
934
5232
0171
7552
9826
11
Low
erPanj
11,611
378
1319
4.03
3.06
197.09
4.94
8.922
3524
3698
5182
4216
2211
Kok
cha
22,196
988
134
428.42
64.50
492.92
10.67
22.955
4167
3608
6783
5406
2712
Taluq
an10
,888
253
2584
.76
8.09
92.85
5.77
3.917
3995
3668
5746
4986
2815
Upp
erKun
duz
16,524
627
11.17
1.80
12.97
1.33
0.355
3877
3783
5050
4602
2513
Total
90,716
*35
7831
122
73.40
164.67
2438.07
39.36
150.34
834
5232
0171
7554
0627
13Kabul
Kun
ar11
,009
206
2575
.85
10.88
86.74
9.38
4.270
4132
3924
6147
5373
2514
Laghm
an62
2438
44.57
1.06
5.63
1.24
0.145
4246
4389
5216
4658
3110
Upp
erPanjshir
3756
684
10.19
1.19
12.09
2.40
0.382
3912
4223
5254
4562
2710
Gho
rband
4640
10
0.07
0.00
0.07
0.07
0.001
4253
4382
27Total
71,266
*31
333
90.68
13.87
104.53
9.38
4.798
3912
3924
6147
5373
2811
Total
*65
0,00
0#38
9134
423
64.08
178.55
2542.60
39.36
155.14
634
5232
0171
7554
0627
12Note*R
epresentsthetotalarea
coveredby
basins,# the
totalarea
ofthecoun
try
216 S. B. Maharjan et al.
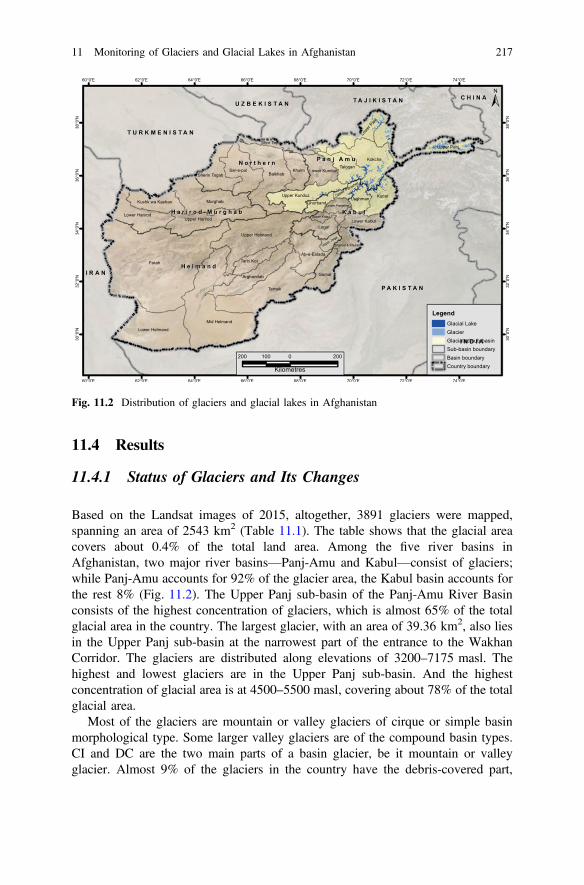
11.4 Results
11.4.1 Status of Glaciers and Its Changes
Based on the Landsat images of 2015, altogether, 3891 glaciers were mapped,spanning an area of 2543 km2 (Table 11.1). The table shows that the glacial areacovers about 0.4% of the total land area. Among the five river basins inAfghanistan, two major river basins—Panj-Amu and Kabul—consist of glaciers;while Panj-Amu accounts for 92% of the glacier area, the Kabul basin accounts forthe rest 8% (Fig. 11.2). The Upper Panj sub-basin of the Panj-Amu River Basinconsists of the highest concentration of glaciers, which is almost 65% of the totalglacial area in the country. The largest glacier, with an area of 39.36 km2, also liesin the Upper Panj sub-basin at the narrowest part of the entrance to the WakhanCorridor. The glaciers are distributed along elevations of 3200–7175 masl. Thehighest and lowest glaciers are in the Upper Panj sub-basin. And the highestconcentration of glacial area is at 4500–5500 masl, covering about 78% of the totalglacial area.
Most of the glaciers are mountain or valley glaciers of cirque or simple basinmorphological type. Some larger valley glaciers are of the compound basin types.CI and DC are the two main parts of a basin glacier, be it mountain or valleyglacier. Almost 9% of the glaciers in the country have the debris-covered part,
Fig. 11.2 Distribution of glaciers and glacial lakes in Afghanistan
11 Monitoring of Glaciers and Glacial Lakes in Afghanistan 217

accounting for almost 7% of the total glacial area in the country. The number andarea-wise distribution of the DC glaciers are higher in the Upper Panj and Kokchasub-basins of the Panj-Amu River Basin. The average slope and elevation distri-bution of the DC part is lower than the CI part of glaciers.
The glacier change database of the years 1990, 2000, 2010, and 2015 shows that13.8% of the glacial area was lost within this 25-year period (Fig. 11.3). The rate ofarea loss was 3.6% between 1990 and 2000; 4.7% between 2000 and 2010; and 2–7% from 1990 to 2000. But this rate increased to 4–12% from 2000 to 2010 in mostof the sub-basins. The area loss was about 6.1% in the five years from 2010 to2015. This indicates that the area-loss percentage has been higher in recent decades.
Fig. 11.3 Percentage of glacial area changes in Afghanistan
-25
-20
-15
-10
-5
0
5
Class 1(<0.5)
Class 2(0.5–1.0)
Class 4(5.0–10.0)
Class 5(≥10.0)
Perc
enta
ge
Class 3(1.0–5.0)
Area classes (km2)
Area (km2) Number
Fig. 11.4 Number and change percentage in each area size class from 1990 to 2015
218 S. B. Maharjan et al.

The study covered all the glaciers of sizes greater than or equal to 0.02 km2. Theglacial area size distribution of five classes is shown in Fig. 11.4, which demon-strates that the number of glaciers has decreased in 25 years except in the case ofsmaller ones. The area of the glaciers has also decreased in all size classes, with ahigher percentage of decline among the larger ones. This indicates that the glaciersin Afghanistan are shrinking and retreating at a quick rate. And due to the shrinkageand fragmentation of the larger glaciers, the number of smaller ones has increased.At the same time, the smaller glaciers have also shrunk, with some of themshrinking to an area less than the threshold of 0.02 km2; besides, some of thesmaller glaciers have disappeared altogether, leading to a reduction in the numberof glaciers in Afghanistan.
In Fig. 11.5, the area-wise distribution of glaciers shows the variations in arealoss at different elevations. The maximum area loss was at elevations from 4700 to5200 masl. In 25 years, the largest glacial area loss was 47 km2 at elevations from4900 to 5000. There have been no significant changes in the glacial areas above5500 masl, whereas the glacial areas below 3200 masl have completelydisappeared.
11.4.2 Status of Glacial Lake and Its Changes
Based on Landsat images, the current study mapped the glacial lakes of sizesgreater than or equal to 0.003 km2. This study covered all the waterbodies that aresituated proximal to present glaciers as well as those located in lowland areas that
Fig. 11.5 Distribution of glacial area and changes in area from 1990 to 2015 at 100 m elevationzone
11 Monitoring of Glaciers and Glacial Lakes in Afghanistan 219

were formed by paleo-glaciation (Maharjan et al. 2018). These lakes were analyzedbased on size, altitude, and morphological classification using the availableSRTM DEM (Shuttle Radar Topography Mission—Digital Elevation Model) andhigh-resolution images from Google Earth. These lakes were classified into seventypes based on their damming condition and morphological location: (a) morainedammed—end moraine (M(e)), lateral moraine (M(l)), and other moraine dammed(M(o)); (b) ice-dammed—supra-glacial (I(s)) and dammed by valley glacier (I(v));(c) bedrock dammed—cirque (B(c)) and other glacier erosional (B(o)); and(d) other dammed lakes (O)—dammed by landslides, debris flow, etc. lying onglaciated valleys and fed by glaciers.
In total, 1942 glacial lakes, covering an area of almost 89 km2, were mapped viathe Landsat images of 2015. The lakes are distributed within the two major riverbasins of the country—Panj Amu and Kabul. The Panj-Amu basin has the largestnumber of glacier lakes, around 64% of such lakes in the country, covering almost74% of the total area covered by glacial lakes in Afghanistan (Table 11.2). The sizeof the lakes ranges from 0.003 to 14.63 km2, with a mean size of 0.5 km2. Themajority of the lakes are smaller than 0.5 km2; only 10 lakes are larger than 0.5 km2
and most of these either other dammed or bedrock dammed lakes except two lakesare moraine dammed (Fig. 11.6). The smallest lakes (of size less than 0.02 km2)account for 52% (number = 1009) of the total lakes in the country. More than 71%of the lakes are bedrock-dammed ones which are mostly formed on the erosional
I(v)I(s)M(1)
Fig. 11.6 Number and area-wise distribution at different size classes and types of glacial lakes
220 S. B. Maharjan et al.
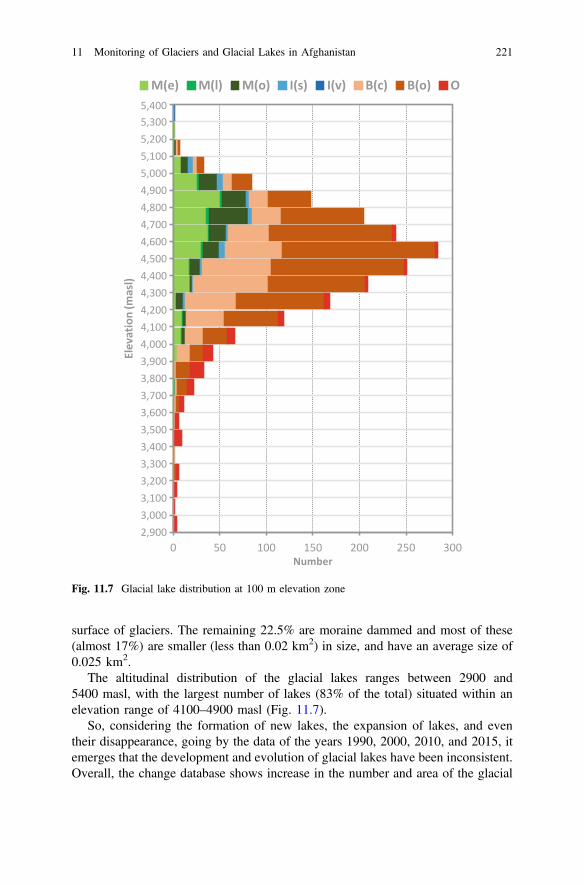
surface of glaciers. The remaining 22.5% are moraine dammed and most of these(almost 17%) are smaller (less than 0.02 km2) in size, and have an average size of0.025 km2.
The altitudinal distribution of the glacial lakes ranges between 2900 and5400 masl, with the largest number of lakes (83% of the total) situated within anelevation range of 4100–4900 masl (Fig. 11.7).
So, considering the formation of new lakes, the expansion of lakes, and eventheir disappearance, going by the data of the years 1990, 2000, 2010, and 2015, itemerges that the development and evolution of glacial lakes have been inconsistent.Overall, the change database shows increase in the number and area of the glacial
0 50 100 150 200 250 300Number
)lsam(
noitavelE
M(e) M(l) M(o) I(s) I(v) B(c) B(o) O
2,9003,0003,1003,2003,3003,4003,5003,6003,7003,8003,9004,0004,1004,2004,3004,4004,5004,6004,7004,8004,9005,0005,1005,2005,3005,400
Fig. 11.7 Glacial lake distribution at 100 m elevation zone
11 Monitoring of Glaciers and Glacial Lakes in Afghanistan 221

Tab
le11
.2Distributionof
glaciallakesin
Afghanistan
(201
5)
Gltype
Panj-A
mu
Kabul
Afghanistan
Num
ber
Area
Num
ber
Area
Num
ber
Area
Count
%km
2%
Count
%km
2%
Count
%km
2%
Moraine
dammed
(M)
End-m
oraine-dam
med
lakes—
M(e)
229
18.4
8.138
12.5
294.2
0.575
2.5
258
13.3
8.713
9.8
Lateral
moraine-dam
med
lakes—
M(l)
151.2
0.232
0.4
10.1
0.01
0.0
160.8
0.242
0.3
Other
moraine-dam
med
lakes—
M(o)
143
11.5
1.716
2.6
162.3
0.198
0.9
159
8.2
1.914
2.2
Icedammed
(I)
Supra-glaciallakes—
I(s)
272.2
0.201
0.3
50.7
0.035
0.2
321.7
0.236
0.3
Other
ice-dammed
lakes—
I(v)
10.1
0.007
0.0
00.0
00.0
10.1
0.007
0.0
Bedrock
dammed
(B)
Cirquelakes—
B(c)
216
17.4
9.119
14.0
249
35.6
9.608
41.0
465
23.9
18.727
21.1
Other
bedrock-dammed
lakes—
B(o)
538
43.3
23.893
36.5
388
55.5
12.036
51.4
926
47.7
35.929
40.5
Other
dammed—
O74
6.0
22.078
33.8
111.6
0.952
4.1
854.4
23.03
25.9
Total
1243
100.0
65.384
100.0
699
100.0
23.414
100.0
1942
100.0
88.798
100.0
Percent
6474
3626
100
100
222 S. B. Maharjan et al.

lakes. In the 25-year period, the number has increased by 8% and the area by 10%(Fig. 11.8). The changes are inconsistent, as they depend on the type of lake and theelevation range. It’s mostly the moraine dammed lakes that are in contact withglaciers which have expanded (Fig. 11.9). The expansion of these lakes is mostlytowards the direction of glaciers, in the space left by the glacier retreat. New lakes
1797
1893
1925
1942
80.4
55
82.7
14
85.4
5 1
88.7
98
1
10
100
1000
10000
1990 2000 2010 2015Year
Number Area(km2)
Fig. 11.8 Number and area of glacial lakes in four time periods from 1990 to 2015 in Afghanistan
Fig. 11.9 The formation and expansion of glacial lakes; an example from the Taloqan sub-basinof the Panj-Amu River Basin
11 Monitoring of Glaciers and Glacial Lakes in Afghanistan 223
were formed due to shrinking and melting of glaciers, which is indicated by theincrease in the number of lakes of smaller size (less than 0.05 km2). And thecomparatively higher rate of expansion took place among lakes with an area of 0.5–0.5 km2. The number of moraine-dammed lakes increased in both decades 1990–2000 and 2000–2010, whereas the number of bedrock-dammed lakes and other laketypes showed a decline. Mostly, the changes in lake size and the formation of newlakes are evident in the 4000–5100 masl elevation range, with the highest rate at therange of 4500–5100 masl. More than 6% of the new lakes were formed from 1990to 2015 within the 4500–5100 masl elevation range, and they expanded by about6.6%.
11.5 Institutional Collaboration
The need for a comprehensive database on glaciers and glacial lakes in Afghanistanemerged in a number of consultations carried out with the stakeholders. However,instead of carrying out the task all by itself, SERVIR-HKH adopted the approach ofco-development where NWARA was an equal partner in the implementation pro-cess. A team of six professionals was formed at NWARA, including two nominatedby NWARA and four research associates supported by SERVIR-HKH. The teamworked solely on the mapping application and were trained, guided, and supervisedby the SERVIR-HKH staff at ICIMOD. The main objective of this approach was toenable NWARA to carry out such exercises independently by Afghan professionalsin the future.
11.5.1 Capacity Development
The capacity development of Afghan professionals on glacier and glacial lakeresearch has been one of the successful endeavors in SERVIR’s institutionalcapacity-building initiative. The experts from ICIMOD provided several hands-onand on-the-job trainings to initiate the work. In the beginning, a general hands-ontraining program was organized at GDWR to foster a better understanding aboutglaciers and glacial lakes and to develop the participants’ ability to generate and usedata on their own for monitoring and assessing glaciers and glacial lakes inAfghanistan. Later, the team of six staff at NWARA was provided severalon-the-job trainings for preparing the glacier and glacial lake database ofAfghanistan (Fig. 11.10). The team proved successful in preparing the database andin developing a detailed analysis report; this was carried out under the directsupervision and with technical guidance from the experts at ICIMOD. Through thisoverall exercise, the team has developed the skills and confidence in applying RSand GIS techniques in the mapping, monitoring, and assessment of glaciers andglacial lakes. Then, the team members, as resource persons, organized several
224 S. B. Maharjan et al.

Fig. 11.11 The mapping team being provided training on glacier mapping and monitoring. Photoby Esmatullah Joya
Fig. 11.10 On-the-job training at ICIMOD for the team preparing the glacier and glacial lakedatabase. Photo by Jitendra Raj Bajracharya
11 Monitoring of Glaciers and Glacial Lakes in Afghanistan 225

trainings for other professionals in NWARA, thus replicating the capacity-buildingefforts in a more sustainable way (Fig. 11.11).
11.5.2 Dissemination
The first comprehensive glacier database of Afghanistan was launched at a dis-semination workshop (Fig. 11.12) on 2 July 2018, and Glacial lake database waslaunched on 23 Nov 2020 which were organized at the NWARA office in Kabul.An online application was also launched during the occasion which provides accessto the database and an interactive visualization of the glaciers and the changes overtime. The general public, students, and researchers can also access glacier andglacial lake data for all periods through the Regional Database System (RDS),ICIMOD website (rds.icimod.org).
The professionals and policymakers at the dissemination workshop emphasizedthe importance of the glacier database and portal for better management of waterresources in Afghanistan. The discussions also touched upon the following: theneed to validate data through field surveys; the use of high-resolution imagery in thecase of some selected glaciers for further detailed study on glacier melts and massbalances; and the installation of automatic weather stations and hydro-climaticstations in some of the selected glaciers so that there would be more in-depthunderstanding about glaciers as well as more realistic information on the
Fig. 11.12 Participants of the dissemination workshop held at NWARA on 2 July 2018. Photo byUtsav Maden
226 S. B. Maharjan et al.
glacier-melting processes. The professionals also called for better coordinationamong all the stakeholders concerned, including academicians, to enablelonger-time monitoring of the glaciers. Further, they sought the support of all therelevant organizations to ensure the sustainability of the database and its efficientuse.
11.6 Lessons Learnt
The main aim of SERVIR-HKH was to build the capacity of the national profes-sionals of Afghanistan on the application of EO and GIS technology for glacier andglacial lake mapping and monitoring while generating a national database. Since theengaged professionals did not have a previous background of working on EO andglacier mapping, the initial trainings were quite taxing. Moreover, the experts atICIMOD had to guide and supervise the team in Kabul remotely which was quitechallenging and required many iterations for the finalization of the database.
There were also technical challenges in the mapping processes. The NDSI andNDWI indices are effective in mapping CI glaciers and glacial lakes, but not formapping larger areas as that involves hindrances such as shadows, clouds, seasonalsnow, turbid/frozen pro-glacial lakes, and some permanent snow cover. In thiscontext, the algorithms do not work properly in the case of the ice in the shadowareas and for turbid or frozen pro-glacial lakes. These regions need to be checkedcarefully and need some manual correction. But there exists no best algorithm forDC glacier mapping which can be applied for the larger regions without somemanual corrections of the boundaries and terminus. The smooth textural surface ofthe debris-covered part compared to other regions in the HKH added more chal-lenges in accurately delineating its boundary and terminus. The textural variationbetween the DC glaciers and its surrounding moraine and barred rock areas wasdifficult to differentiate through the Landsat images. Also, cross-checking of thehigher-resolution images in the Google Earth environment was not possible due tothe low quality of the images. Hence, the manual correction of the debris-coveredpart required special attention.
11.7 Way Forward
Based on Landsat images, the study provides a comprehensive picture of the statusand changes in glaciers and glacial lakes over the period of a quarter century—from1990 to 2015. This is a big achievement for Afghanistan. The generated data canalso be utilized in monitoring and understanding the dynamics of glacier and glaciallakes in the future and for other purposes such as for modeling the availability ofwater resources, glacial hazard prediction, and to know more about the impacts ofclimate change on glaciers.
11 Monitoring of Glaciers and Glacial Lakes in Afghanistan 227

Apart from this information, the project also strengthened cooperation andcollaboration with local partners and enhanced their knowledge on the mapping andmonitoring of glaciers and glacial lakes. The trained human resources in this area ofmapping and monitoring are indeed a great asset to the country and can contributesignificantly to the vital area of water management. Now the system should befurther developed to enable regular monitoring, at least at five- or ten-year intervals,so that the relevant agencies are up to date about the trends in glacial changes. Moreinvestigations are also required in spheres such as geodetic glacier mass changes,glacio-hydrological models, and glacier and snowmelt modeling. This will come inhandy in important catchment areas and give a clearer picture on the availability ofwater resources, the risks of glacial hazards, and on the overall changes in theglacial environment. It can also be utilized to identify some representative glaciersfor long-term in situ monitoring.
Since Afghanistan is an arid and semi-arid country, irrigation is essential forfood production. Any in-depth information on the country’s glaciers and theirrun-off would be of critical value to establish a reliable and equitable irrigationsystem; and this would have positive impacts on agricultural productivity, foodsecurity, and income, while also reducing the vulnerability of farmers to droughts.
Most of Afghanistan’s rivers have hydropower potential. It is estimated that thecountry can generate 23,000 MW of hydropower (Ahmadzai and McKinna 2018).In such a scenario, a scientific documentation of the present and periodic changes inglacial lakes would be valuable when it comes to constructing hydropower plantsupstream, near glacial lakes, and in identifying the risks involved in building aparticular plant.
Coming to GLOFs, the time-series glacial lake data can be utilized to identify thepotentially dangerous glacier lakes in the country and to list the lakes in terms oftheir danger quotient. A GLOF risk reduction strategy should be established notonly to reduce risk but also to increase the resilience of the vulnerable communities.A policy should also be developed to strengthen national and institutional capacitiesin the establishment of GLOF-resilient development pathways.
References
Afghanistan Times (2018) Flash floods kill 10 in Panjshir, July 12, 2018, latest updates, http://www.afghanistantimes.af/flash-floods-kill-10-panjshir/
Ahmadzai S, McKinna A (2018) Afghanistan electrical energy and trans-boundary water systemsanalyses: challenges and opportunities. Energy Rep 4:435–469
Aich V, Akhundzadah N, Knuerr A, Khoshbeen A, Hattermann F, Paeth H, Scanlon A, …,Paton E (2017) Climate change in afghanistan deduced from reanalysis and coordinatedregional climate downscaling experiment (CORDEX)—South Asia Simulations. Climate 5:38,https://doi.org/10.3390/cli5020038
Allen SK, Rastner P, Arora M, Huggel C, Stoffel M (2015) Lake outburst and debris flow disasterat Kedarnath, June 2013: hydrometeorological triggering and topographic predisposition.Landslides 13(6):1479–1491. https://doi.org/10.1007/s10346-015-0584-3
228 S. B. Maharjan et al.

Bajracharya SR, Maharjan SB, Shrestha F (2018) Training manual on Application of remotesensing and geographic information systems for mapping and monitoring of glaciers usingeCognition software. ICIMOD, Kathmandu
Bajracharya SR, Maharjan SB, Shrestha F, Bajracharya OR, Baidya S (2014a) Glacier status inNepal and decadal change from 1980 to 2010 based on landsat data. ICIMOD, Kathmandu
Bajracharya SR, Maharjan SB, Shrestha F (2014b) The status and decadal change of glaciers inBhutan from 1980s to 2010 based on the satellite data. Ann Glaciol 55(66):159–166. https://doi.org/10.3189/2014aog66a125
Bajracharya SR, Shrestha B (eds) (2011) The status of glaciers in the Hindu Kush-Himalayanregion. ICIMOD, Kathmandu, http://lib.icimod.org/record/9419
Bajracharya SR, Mool PK, Shrestha BR (2007) Impact of climate change on Himalayan glaciersand glacial lakes-case studies on GLOF and associated hazards in Nepal and Bhutan. ICIMOD,Kathmandu
Bhambri R, Bolch T (2009) Glacier mapping: a review with special reference to the IndianHimalayas. Prog Phys Geogr 33(5):672–704
Bolch T, Menounos B, Wheate RD (2010) Landsat-based inventory of glaciers in western Canada,1985–2005. Remote Sens Environ 114(1):127–137
Braslau D (1972) The glaciers of Keshnikhan. In: Gratzl K (ed) Hindukusch-ÖsterreichischeForschungsexpedition in den Wakhan 1970. Akademische Druck-u, Verlagsanstalt, Graz,Austria, pp 112–116
Breckle SW, Frey W (1976a) Die hochsten Berge im Zentralen Hindukusch [The highestmountains in the central Hindu Kush]. Afghanistan J 3(3):91–94
Breckle SW, Frey W (1976b) Beobachtungen zur heutigen Vergletscherung der Hauptkette desZentralen Hindukusch [Observations of the present-day glacierization of the principalmountain ranges in the central Hindu Kush]. Afghanistan J 3(3):95–100
FloodList (2018) Afghanistan–deadly floods wreak Havoc in Panjshir Province. Flood List Newsin Asia, http://floodlist.com/asia/afghanistan-floods-panjshir-province-july-2018
Gardent M, Rabatel A, Dedieu JP, Deline P (2014) Multitemporal glacier inventory of the FrenchAlps from the late 1960s to the late 2000s. Glob Planet Chang 120:24–37. https://doi.org/10.1016/j.gloplacha.2014.05.004
Gilbert O, Jamieson D, Lister H, Pendlington A (1969) Regime of an Afghan glacier. J Gkciol 8(52):51–65
Grotzbach E (1964) Munchner Hindukusch-Kundfahrt 1963. Die Erde, Bd. 95, Ht. 4, 29:1–98Gurung DR, Khanal NR, Bajracharya SR, Tsering K, Joshi S, Tshering P, Chhetri LK, Lotay Y,
Penjor T (2017) Lemthang Tsho glacial Lake outburst flood (GLOF) in Bhutan: cause andimpact. Geoenviron Disasters 4:4–17. https://doi.org/10.1186/s40677-017-0080-2
Haritashya UK, Bishop MP, Shroder JF, Bush ABG, Bulley HNN (2009) Space-based assessmentof glacier fluctuations in the Wakhan Pamir, Afghanistan. Climatic Change 94(1–2):5–18
IPCC (2013) The physical basis: contribution of working group I to the fifth assessment report ofthe intergovernmental panel on climate change. IPCC, Cambridge, UK, New York, NY, USA
Maharjan SB, Mool PK, Lizong W, Xiao G, Shrestha F, Shrestha RB, Khanal NR,Bajracharya SR, Joshi S, Shahi S, Baral P (2018) The status of glacial lakes in the HinduKush Himalaya. ICIMOD Research Report 2018/1. ICIMOD, Kathmandu
Maharjan SB (2018) Assessment of Peshghor flood in Khenj district, Panjshir Province,Afghanistan, rapid assessment report submitted to MEW, ICIMOD. Online: story map https://www.arcgis.com/apps/MapJournal/index.html?appid=e842d20e0fb74abea6d57edc785b3a78
Marshall SJ (2014) Meltwater runoff from Haig Glacier, Canadian rocky mountains, 2002–2013.Hydrol Earth Syst Sci Discuss 11:8355–8407. https://doi.org/10.5194/hessd-11-8355-2014
Mernild SH, Lipscomb WH, Bahr DB, Radić V, Zemp M (2013) Global glacier changes: a revisedassessment of committed mass losses and sampling uncertainties. Cryosphere 7(5):1565–1577.https://doi.org/10.5194/tc-7-1565-2013
Nie Y, Liu Q, Nie Y, Sheng Y, Song C, Liu L, Zhang Y, …, Liu S (2017) A regional-scaleassessment of Himalayan glacial lake changes using satellite observations from 1990 to 2015.Remote Sens Environ 189:1–13. http://dx.doi.org/10.1016/j.rse.2016.11.008
11 Monitoring of Glaciers and Glacial Lakes in Afghanistan 229

Prasad AK, Elaskary HM, Asrar GR, Kafatos M, Jaswal A (2011) Melting of major glaciers inHimalaya: role of desert dust and anthropogenic aerosols. In: Carayannis E (ed) Planet earth2011—global warming challenges and opportunities for policy and practice. https://doi.org/10.5772/902
Patzelt G (1978) Gletscherkundliche Untersuchlungen im ‘Grossen Pamir’. In: Grancy R,Kostka R (eds) Grosser Pamir. Akademische Druck-u, Graz, pp 131–149
Paul F, Kaab A, Maisch M, Kellenberger T, Haeberli W (2002) The new remote-sensing-derivedSwiss glacier inventory: I. methods. Ann Glaciol 34:355–361. https://doi.org/10.3189/172756402781817941
Shroder JF Jr (1980) Special problems of glacial inventory in Afghanistan. Hydrol Sc Bull126:142–147, World Glacier Inventory Proceedings, Reideralp Workshop, September 1978(IAHS-AISH)
Shroder JF Jr (1989) Glacierized areas of Afghanistan. In: Haeberli W, Bosch H, Scherler K,Ostrem G, Wallen CC (eds) World glacier inventory, status 1988. IAHS (ICSI)-UNEP-UNESCO, Teufen, C39–C40, C346–C353
Song C, Sheng Y, Madson A, Wang J, Ke L, Nie Y (2017) Heterogeneous glacial lake changesand links of lake expansions to the rapid thinning of adjacent glacier termini in the Himalayas.Geomorphology 280:30–38. https://doi.org/10.1016/j.geomorph.2016.12.002
Wester P, Mishra A, Mujherji A, Shrestha AB (eds) (2019) The Hindu Kush Himalaya assessment—mountains, climate change, sustainability and people. Springer, Switzerland AG, Cham
Zemp M, Amstrong R, Gärnter-Roer I, Haeberli W, Hoelzle M, Kääb A, Kargel JS, Khalsa SJS,Leonard GJ, Paul F, Raup BH (2014) Introduction: global glacier monitoring—a long-termtask integrating in situ observations and remote sensing. In: Kargel JS, Leonard GJ,Bishop MP, Kääb A, Raup BH (eds) Global land ice measurements from space. Springer,Berlin
Open Access This chapter is licensed under the terms of the Creative Commons Attribution 4.0International License (http://creativecommons.org/licenses/by/4.0/), which permits use, sharing,adaptation, distribution and reproduction in any medium or format, as long as you give appropriatecredit to the original author(s) and the source, provide a link to the Creative Commons license andindicate if changes were made.The images or other third party material in this chapter are included in the chapter’s Creative
Commons license, unless indicated otherwise in a credit line to the material. If material is notincluded in the chapter’s Creative Commons license and your intended use is not permitted bystatutory regulation or exceeds the permitted use, you will need to obtain permission directly fromthe copyright holder.
230 S. B. Maharjan et al.
Chapter 12The High-Impact Weather AssessmentToolkit
Patrick N. Gatlin, Jonathan L. Case, Jayanthi Srikishen,and Bhupesh Adhikary
12.1 Introduction
Of the various types of weather phenomena, thunderstorms produce some of themost immediate and impactful hazards—damaging winds and hail, frequent light-ning, and intense rainfall. Resilience to high-impact weather can be attainedthrough investment in several key areas: proper infrastructure; effective emergencymanagement; public education; and well-informed weather forecasting services.Unfortunately, some of the most intense thunderstorms occur in developing nationsthat have yet to build sufficient resilience to such weather hazards. Although there isa perceived cost associated with establishing National Hydrological andMeteorological Services (NHMS), investment in these services can boost thesocioeconomic well-being of a developing nation (e.g., Nepal) by a factor of 10(Perrels 2011). Early warning services are identified as providing the greatest andmost immediate socioeconomic benefit amongst other types of disaster riskreduction strategies (Hallegatte 2012).
The Hindu-Kush Himalaya (HKH) region is host to some of the most intensethunderstorms on Earth (Zipser et al. 2006), primarily during the pre-monsoonseason (Cecil and Blankenship 2012), and is routinely plagued by the hazards theypose (e.g., Das et al. 2014; Bikos et al. 2015; NIRAPAD 2018). Their impact is
P. N. Gatlin (&)NASA Marshall Space Flight Center, Huntsville, AL, USAe-mail: [email protected]
J. L. CaseENSCO, Inc, Huntsville, AL, USA
J. SrikishenUniversities Space Research Association, Huntsville, AL, USA
B. AdhikaryInternational Centre for Integrated Mountain Development, Kathmandu, Nepal
© The Author(s) 2021B. Bajracharya et al. (eds.), Earth Observation Science and Applications for RiskReduction and Enhanced Resilience in Hindu Kush Himalaya Region,https://doi.org/10.1007/978-3-030-73569-2_12
231
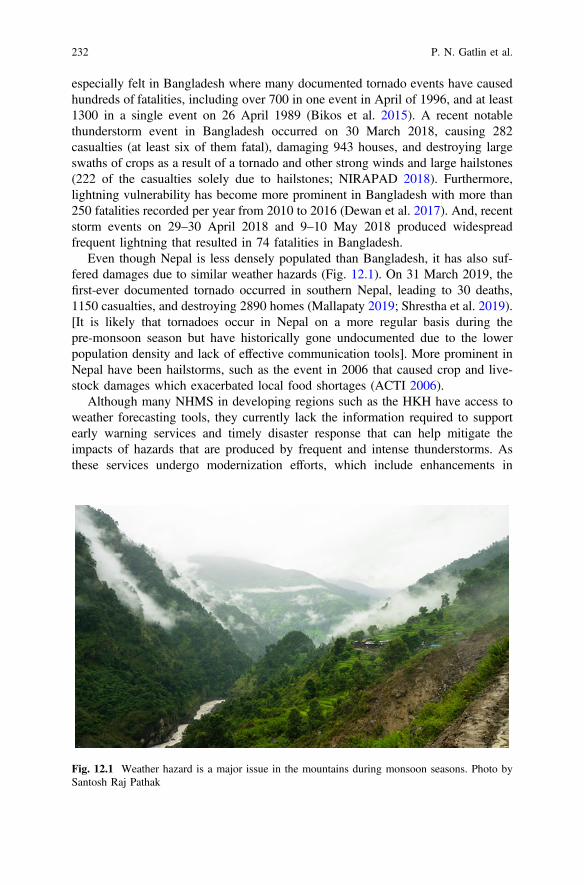
especially felt in Bangladesh where many documented tornado events have causedhundreds of fatalities, including over 700 in one event in April of 1996, and at least1300 in a single event on 26 April 1989 (Bikos et al. 2015). A recent notablethunderstorm event in Bangladesh occurred on 30 March 2018, causing 282casualties (at least six of them fatal), damaging 943 houses, and destroying largeswaths of crops as a result of a tornado and other strong winds and large hailstones(222 of the casualties solely due to hailstones; NIRAPAD 2018). Furthermore,lightning vulnerability has become more prominent in Bangladesh with more than250 fatalities recorded per year from 2010 to 2016 (Dewan et al. 2017). And, recentstorm events on 29–30 April 2018 and 9–10 May 2018 produced widespreadfrequent lightning that resulted in 74 fatalities in Bangladesh.
Even though Nepal is less densely populated than Bangladesh, it has also suf-fered damages due to similar weather hazards (Fig. 12.1). On 31 March 2019, thefirst-ever documented tornado occurred in southern Nepal, leading to 30 deaths,1150 casualties, and destroying 2890 homes (Mallapaty 2019; Shrestha et al. 2019).[It is likely that tornadoes occur in Nepal on a more regular basis during thepre-monsoon season but have historically gone undocumented due to the lowerpopulation density and lack of effective communication tools]. More prominent inNepal have been hailstorms, such as the event in 2006 that caused crop and live-stock damages which exacerbated local food shortages (ACTI 2006).
Although many NHMS in developing regions such as the HKH have access toweather forecasting tools, they currently lack the information required to supportearly warning services and timely disaster response that can help mitigate theimpacts of hazards that are produced by frequent and intense thunderstorms. Asthese services undergo modernization efforts, which include enhancements in
Fig. 12.1 Weather hazard is a major issue in the mountains during monsoon seasons. Photo bySantosh Raj Pathak
232 P. N. Gatlin et al.

observational infrastructure (e.g., Rigaud 2015; World Bank Group-PPCR 2015;World Bank 2017), investments in new computational tools that will supportenhanced early warning services are also necessary.
12.2 Forecasting High-Impact Weather
Numerical weather prediction (NWP) is the primary tool used by NHMS to produceweather forecasts. In particular, the Weather Research and Forecasting(WRF) model (Powers et al. 2017) has become the most widely used regionalforecast and simulation tool in the weather community (e.g., Kain et al. 2006; Taoet al. 2016; Schwartz et al. 2019), including by NHMS in the HKH region (e.g.Ahasan et al. 2014; Kotal et al. 2015). Operationally, the WRF model is typicallyconfigured to provide hourly regional weather forecast guidance up to three or fourdays. Although WRF is a powerful tool, it still cannot replace a sufficiently denseobservational network when it comes to monitoring and nowcasting (i.e., 0–1 hforecasts) rapidly unfolding weather such as thunderstorms. However, in countriessuch as Nepal such observations are often limited due to the terrain or lack ofinvestment in Doppler weather radar networks that are critical to assessing suchhigh-impact storms. Thus, it is critical that NHMS possess highly relevant andskillful NWP to gain proper situational awareness of potential weather hazardsduring the forecast period.
12.2.1 Challenges of Forecasting Thunderstorms
Regional models such as WRF also require input from the global NWP in order torepresent the initial state and evolution of the atmosphere on a larger scale that canorchestrate high-impact weather events through their interaction with land andocean. Hence, it is important to properly represent the initial state of the land–atmosphere–ocean system for regional modeling applications, which entailsbringing observations into the NWP framework via data assimilation methods.Since in situ observations are rather limited across the globe, NWP in such regionsoften incorporates the geophysical variables retrieved via satellite-based remotesensing into data assimilation algorithms using radiative transfer models to relatesatellite observations to NWP model state variables (Barker et al. 2012; Geer et al.2017). However, satellite retrievals are not straightforward and introduce additionaluncertainty in the model initial conditions. Furthermore, there are a variety of dataassimilation techniques, some of which can provide significant improvements to theforecast (e.g., Huang et al. 2009), but they can be rather complex and computa-tionally expensive, especially for real-time applications.
Proper forecast of thunderstorm hazards requires the use of a convection-permitting model (i.e., its horizontal grid spacing must be on the scale of 4–5 km or
12 The High-Impact Weather Assessment Toolkit 233

finer). This model must adequately depict all physical processes and interactionsbetween the land/ocean and atmosphere that lead to cloud and precipitationdevelopment and decay. Since explicitly simulating all of these interactions andprocesses is not feasible, they must be parameterized (i.e., approximated) within themodel (Stensrud 2007). Convection-permitting (also referred to as cloud-resolving)models often include parameterizations of sub-grid-scale motions (e.g., turbulentmotions within the boundary layer), mixed-phase microphysics, and radiativeprocesses (Guichard and Couvreux 2017). Decades of research have gone intodeveloping cloud-resolving models and parameterizations of these physical pro-cesses (Tao 2007). As a result, numerous parameterization schemes have beenincorporated into the Advanced Research WRF for simulating thunderstorms(UCAR 2020). This is promising for improving the skill of model forecasts, but itrequires choosing the appropriate ones for the application at hand. There have beena multitude of sensitivity tests of parameterization schemes (e.g., Milbrandt andYau 2006; Cohen et al. 2015; Fan et al. 2017), but no single combination ofparameterizations works best for all thunderstorm hazards, weather regimes, andgeographical regions.
12.2.2 Ensemble-Based, Convection-Allowing NWP
In light of this wide variety of potential configurations, model uncertainty, anddiffering assumptions within individual parameterizations, a solution has been toperform ensemble NWP by running a suite of different model runs. Each model runmay be configured with a different combination of parameterizations and/or initialconditions. The main idea of ensemble NWP is to capture the range of possiblesolutions (e.g., Fig. 12.2), and thereby enable probabilistic-based forecast infor-mation that facilitates a more well-informed decision. To improve thunderstormforecasts in the United States, regional WRF-based convection-allowing models(e.g., Kain et al. 2006, 2010) have been used in an ensemble configuration (e.g.,Clark et al. 2012; Schwartz et al. 2019) to support severe weather and excessiveprecipitation forecast experiments in the National Oceanic and AtmosphericAdministration (NOAA) annual Hazardous Weather Testbed’s ExperimentalForecast Program (Clark et al. 2012). This particular forecast system included overtwo dozen different model simulations that produced hourly forecasts out to 30 h atconvection-allowing grid spacings (1–4 km) spanning the continental U.S. Similarexperimental ensemble forecast demonstrations have been undertaken by theNational Center for Atmospheric Research (NCAR) and have received much fan-fare from the weather community (Schwartz et al. 2019), but their relatively largecomputational burden hinders their implementation by operational agencies withrelatively limited resources.
234 P. N. Gatlin et al.
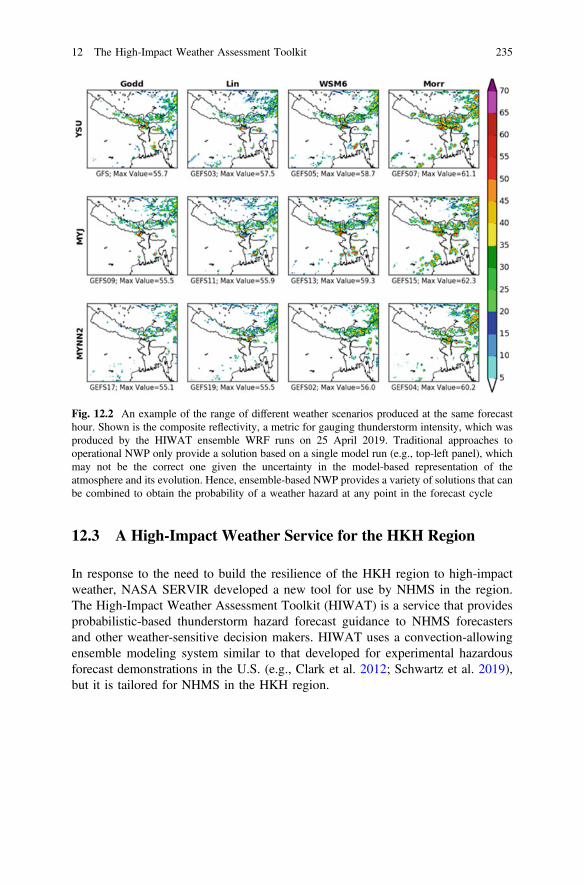
12.3 A High-Impact Weather Service for the HKH Region
In response to the need to build the resilience of the HKH region to high-impactweather, NASA SERVIR developed a new tool for use by NHMS in the region.The High-Impact Weather Assessment Toolkit (HIWAT) is a service that providesprobabilistic-based thunderstorm hazard forecast guidance to NHMS forecastersand other weather-sensitive decision makers. HIWAT uses a convection-allowingensemble modeling system similar to that developed for experimental hazardousforecast demonstrations in the U.S. (e.g., Clark et al. 2012; Schwartz et al. 2019),but it is tailored for NHMS in the HKH region.
Fig. 12.2 An example of the range of different weather scenarios produced at the same forecasthour. Shown is the composite reflectivity, a metric for gauging thunderstorm intensity, which wasproduced by the HIWAT ensemble WRF runs on 25 April 2019. Traditional approaches tooperational NWP only provide a solution based on a single model run (e.g., top-left panel), whichmay not be the correct one given the uncertainty in the model-based representation of theatmosphere and its evolution. Hence, ensemble-based NWP provides a variety of solutions that canbe combined to obtain the probability of a weather hazard at any point in the forecast cycle
12 The High-Impact Weather Assessment Toolkit 235
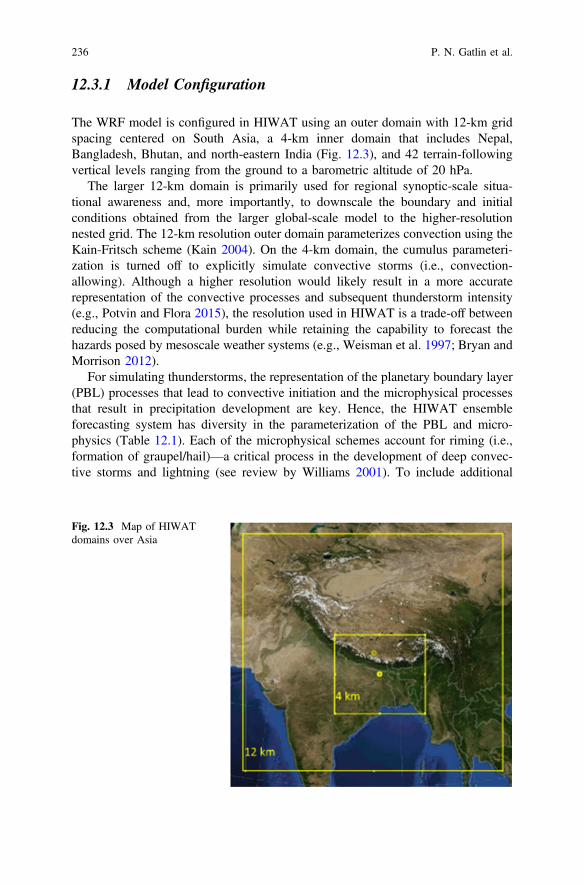
12.3.1 Model Configuration
The WRF model is configured in HIWAT using an outer domain with 12-km gridspacing centered on South Asia, a 4-km inner domain that includes Nepal,Bangladesh, Bhutan, and north-eastern India (Fig. 12.3), and 42 terrain-followingvertical levels ranging from the ground to a barometric altitude of 20 hPa.
The larger 12-km domain is primarily used for regional synoptic-scale situa-tional awareness and, more importantly, to downscale the boundary and initialconditions obtained from the larger global-scale model to the higher-resolutionnested grid. The 12-km resolution outer domain parameterizes convection using theKain-Fritsch scheme (Kain 2004). On the 4-km domain, the cumulus parameteri-zation is turned off to explicitly simulate convective storms (i.e., convection-allowing). Although a higher resolution would likely result in a more accuraterepresentation of the convective processes and subsequent thunderstorm intensity(e.g., Potvin and Flora 2015), the resolution used in HIWAT is a trade-off betweenreducing the computational burden while retaining the capability to forecast thehazards posed by mesoscale weather systems (e.g., Weisman et al. 1997; Bryan andMorrison 2012).
For simulating thunderstorms, the representation of the planetary boundary layer(PBL) processes that lead to convective initiation and the microphysical processesthat result in precipitation development are key. Hence, the HIWAT ensembleforecasting system has diversity in the parameterization of the PBL and micro-physics (Table 12.1). Each of the microphysical schemes account for riming (i.e.,formation of graupel/hail)—a critical process in the development of deep convec-tive storms and lightning (see review by Williams 2001). To include additional
Fig. 12.3 Map of HIWATdomains over Asia
236 P. N. Gatlin et al.

diversity and spread in the HIWAT ensemble, the initial conditions are varied. Theoperational run of the Global Forecast System (GFS; Zhou et al. 2019) andmembers from the Global Ensemble Forecast System (GEFS; e.g., Guan et al. 2015;Zhou et al. 2017), which are run every 6 h by the U.S. National Centers forEnvironmental Prediction (NCEP) Environmental Modeling Center’s (EMC) andfreely obtained from them, are used to initialize the WRF model employed byHIWAT. Also, HIWAT ingests a 2-km resolution, northern-hemispheric sea surfacetemperature (SST) composite product derived from NASA’s MODIS and VIIRSsatellite measurements (Zavodsky et al. 2017), which improves upon the consid-erably coarser SST analysis in the GFS/GEFS models. To execute the ensembleWRF model runs, HIWAT employs the Unified Environmental Modeling System(UEMS; Rozumalski 2019), which greatly simplifies the complex workflowinvolved in NWP by managing data acquisition, initialization, pre- andpost-processing, and generating derived fields.
12.3.2 Probabilistic Forecast Products
The primary guidance products generated by HIWAT are probabilistic forecasts ofthe thunderstorm hazards associated with tornadoes, damaging wind and hail,frequent lightning, and intense rainfall. These are provided at each hour of theforecast cycle and temporally composited into daily summary probability maps thatcan readily facilitate the convective outlooks of thunderstorm hazards (Fig. 12.4),which is a capability recommended in the report on the Bara-Parsa (Nepal) tornadoof 31 March 2019 (Shrestha et al. 2019). Furthermore, products such as dailysummaries provide a weather-sensitive decision maker the information in a concise
Table 12.1 Ensemble configuration of the 4-km resolution domain of the WRF-basedprobabilistic forecasting system used in HIWAT-HKH
Key: ensemble member initialcondition
Microphysical parameterization
Goddard(Tao et al.2016)
Purdue Lin(Chen andSun 2002)
WSM6(Hong andLim 2006)
Morrison2-moment(Morrison et al.2009)
PBLparameterization
YSU (Honget al. 2006)
HKH1:GFS
HKH2:GEFS 03
HKH3:GEFS 05
HKH4: GEFS07
MYJ (Janjić1994)
HKH5:GEFS 09
HKH6:GEFS 11
HKH7:GEFS 13
HKH8: GEFS15
MYNN2(Nakanishiand Niino2009)
HKH9:GEFS 17
HKH10:GEFS 19
HKH11:GEFS 02
HKH12: GEFS04
The NCEP/EMC model used for initial/boundary conditions is listed beneath each namedensemble member
12 The High-Impact Weather Assessment Toolkit 237

manner to quickly assess future thunderstorm impact(s). Because of uncertainties inmodel forecast accuracy, combined with convective features that typically haverelatively small footprints (e.g., Kain et al. 2010), a 20-km spatial neighborhood(i.e., grid points within 20 km) is first applied to the individual ensemble memberthunderstorm hazard fields prior to computing the probabilities. Additionally, aGaussian smoother is used to produce smoother and more visually appealingprobability maps. Such neighborhood approaches can result in more skillfulprobabilistic forecasts (Schwartz and Sobash 2017).
An example of the Day-2 summary forecast from HIWAT (i.e., a 25–48 hforecast period) is shown in Fig. 12.4. This gives the probability of the indicatedweather hazard within 20 km of a point at any time of the Day-2 forecast period.Using composite reflectivity exceeding 50 dBz as a proxy for storms with signif-icant precipitation rates (i.e., intense storms), we see there is greater than a 90%probability of intense storms occurring from southeastern Nepal across northern andeastern Bangladesh into southern Bhutan and Northeast India. A Day-2 convectiveoutlook would highlight this region. The next question is the likelihood of specifichazards within this region. We see intense rainfall that might lead to flash-floodingshould not be a major concern, but there are greater probabilities of damagingwinds, hail, rotating storms, and frequent lightning across this region of intense
Fig. 12.4 HIWAT probabilistic forecast of thunderstorm-related weather hazards for the Day-2time period. Intense storms are defined as composite reflectivity exceeding 50 dBZ. Damagingwinds are defined as the maximum 10-m wind speed in the previous hour (Kain et al. 2010)exceeding 40 kts. Rotating storms are defined as the maximum 2–5 km updraft helicity (Kain et al.2008) in the previous hour exceeding 200 m2s−2. Intense rainfall is defined as the 3-houraccumulated precipitation exceeding 75 mm. Damaging hail is defined as the maximumcolumn-integrated graupel in the previous hour (Kain et al. 2010) exceeding 30 kg m−2.Frequent lightning is defined as one lightning flash per minute produced by the diagnostic WRFLightning Forecast Algorithm (McCaul et al. 2009, 2020)
238 P. N. Gatlin et al.

storms. Furthermore, the higher probability of rotating storms in northernBangladesh being aligned with the relatively enhanced probability of damagingwind and hail suggest that tornadoes are more probable in northern Bangladesh thanin eastern Bangladesh. This analysis of Fig. 12.4 is akin to the forecast process usedby NOAA’s Storm Prediction Center in the U.S. to determine future convectivehazards (Jirak et al. 2014).
12.4 HIWAT Forecast Demonstrations
Two forecast demonstrations of HIWAT took place during the pre-monsoon(March-May) and monsoon seasons (June–August) of 2018 and 2019, with theBangladesh Meteorological Department (BMD) and Nepal’s Department ofHydrology and Meteorology (DHM). For these demonstrations, HIWAT used thepublic release of WRF version 3.7.1 (included in UEMS version 15.99.1), whileNASA’s SERVIR program provided the virtual computing cluster needed to run it.This virtual cluster consisted of 13 nodes, each with 16 dual-core Intel Xenon2.10 GHz processors and 128 GB of RAM. It produced 0–48 h HIWAT-HKHforecast products within 6 h of HIWAT initialization. This resulted in a proba-bilistic forecast guidance covering two diurnal maximums in the convective activityin the HKH region (e.g., Romatschke et al. 2010; Mäkelä et al. 2014; Dewan et al.2018).
During these demonstrations, HIWAT trainings were held in Kathmandu andDhaka to familiarize the operational forecasters at DHM and BMD with HIWATand its probabilistic-based thunderstorm hazard forecasting products. The productswere made available to forecasters via two web-based display tools. An imageviewer, which was contributed and hosted by NASA’s Short-term PredictionResearch and Transition Center (SPoRT; Jedlovec 2013), provided quick looks andanimations of all current and archived HIWAT forecast products. Also, selectHIWAT products were packaged (i.e., separate from the full model output suite)into a netCDF format for an interactive (i.e., pan, zoom, query) web-based appli-cation, which was produced within the Tethys platform (Nelson et al. 2019), toenable efficient interrogation of the forecasts within a web-mapping service. TheTethys-based HIWAT Model Viewer App (Fig. 12.5) provides users with thecapability to quickly determine where, when, and how likely a thunderstorm hazardmay occur. It also has the capability to provide the spatiotemporal statistics of aforecast variable (e.g., as to when maximum rainfall will occur within the selectedarea). Figure 12.5 shows the HIWAT forecast run from 29 March 2018 whichindicates that a high-impact weather event is possible across the northern half ofBangladesh. The time-series plots of the forecast across this area show a greaterthan 60% chance of rotating thunderstorms, with a 45–55% chance of damagingwinds and hail at the selected points between 11:00 and 15:00 UTC on 30 March2018.
12 The High-Impact Weather Assessment Toolkit 239
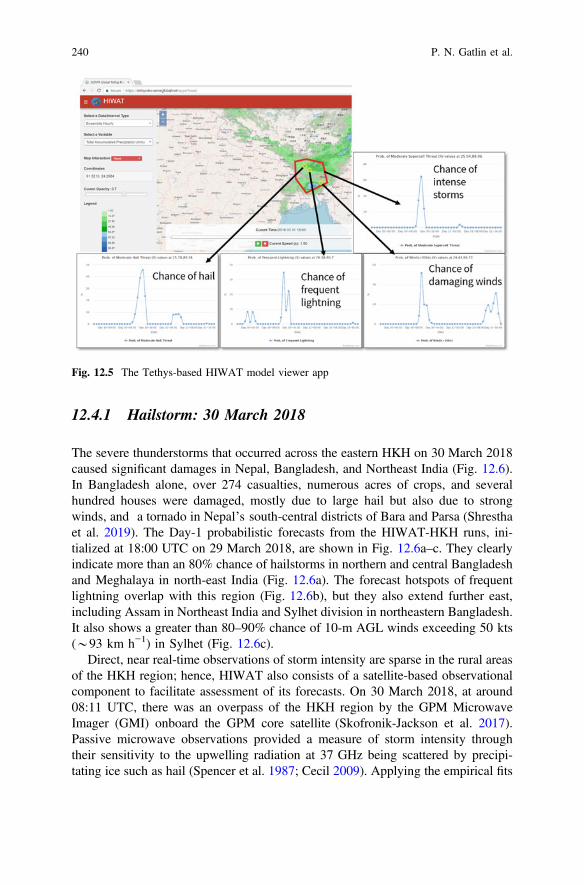
12.4.1 Hailstorm: 30 March 2018
The severe thunderstorms that occurred across the eastern HKH on 30 March 2018caused significant damages in Nepal, Bangladesh, and Northeast India (Fig. 12.6).In Bangladesh alone, over 274 casualties, numerous acres of crops, and severalhundred houses were damaged, mostly due to large hail but also due to strongwinds, and a tornado in Nepal’s south-central districts of Bara and Parsa (Shresthaet al. 2019). The Day-1 probabilistic forecasts from the HIWAT-HKH runs, ini-tialized at 18:00 UTC on 29 March 2018, are shown in Fig. 12.6a–c. They clearlyindicate more than an 80% chance of hailstorms in northern and central Bangladeshand Meghalaya in north-east India (Fig. 12.6a). The forecast hotspots of frequentlightning overlap with this region (Fig. 12.6b), but they also extend further east,including Assam in Northeast India and Sylhet division in northeastern Bangladesh.It also shows a greater than 80–90% chance of 10-m AGL winds exceeding 50 kts(*93 km h−1) in Sylhet (Fig. 12.6c).
Direct, near real-time observations of storm intensity are sparse in the rural areasof the HKH region; hence, HIWAT also consists of a satellite-based observationalcomponent to facilitate assessment of its forecasts. On 30 March 2018, at around08:11 UTC, there was an overpass of the HKH region by the GPM MicrowaveImager (GMI) onboard the GPM core satellite (Skofronik-Jackson et al. 2017).Passive microwave observations provided a measure of storm intensity throughtheir sensitivity to the upwelling radiation at 37 GHz being scattered by precipi-tating ice such as hail (Spencer et al. 1987; Cecil 2009). Applying the empirical fits
Fig. 12.5 The Tethys-based HIWAT model viewer app
240 P. N. Gatlin et al.
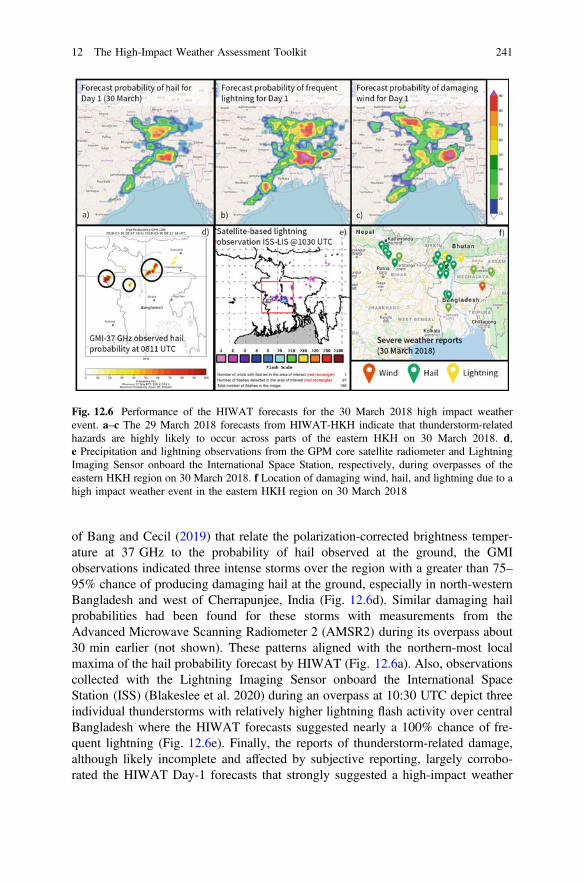
of Bang and Cecil (2019) that relate the polarization-corrected brightness temper-ature at 37 GHz to the probability of hail observed at the ground, the GMIobservations indicated three intense storms over the region with a greater than 75–95% chance of producing damaging hail at the ground, especially in north-westernBangladesh and west of Cherrapunjee, India (Fig. 12.6d). Similar damaging hailprobabilities had been found for these storms with measurements from theAdvanced Microwave Scanning Radiometer 2 (AMSR2) during its overpass about30 min earlier (not shown). These patterns aligned with the northern-most localmaxima of the hail probability forecast by HIWAT (Fig. 12.6a). Also, observationscollected with the Lightning Imaging Sensor onboard the International SpaceStation (ISS) (Blakeslee et al. 2020) during an overpass at 10:30 UTC depict threeindividual thunderstorms with relatively higher lightning flash activity over centralBangladesh where the HIWAT forecasts suggested nearly a 100% chance of fre-quent lightning (Fig. 12.6e). Finally, the reports of thunderstorm-related damage,although likely incomplete and affected by subjective reporting, largely corrobo-rated the HIWAT Day-1 forecasts that strongly suggested a high-impact weather
Fig. 12.6 Performance of the HIWAT forecasts for the 30 March 2018 high impact weatherevent. a–c The 29 March 2018 forecasts from HIWAT-HKH indicate that thunderstorm-relatedhazards are highly likely to occur across parts of the eastern HKH on 30 March 2018. d,e Precipitation and lightning observations from the GPM core satellite radiometer and LightningImaging Sensor onboard the International Space Station, respectively, during overpasses of theeastern HKH region on 30 March 2018. f Location of damaging wind, hail, and lightning due to ahigh impact weather event in the eastern HKH region on 30 March 2018
12 The High-Impact Weather Assessment Toolkit 241

event unfolding from eastern Nepal to Northeast India and central Bangladesh(Fig. 12.6f).
12.4.2 Lightning
Lightning-related casualties have increased in Bangladesh in recent years (Dewanet al. 2017; Holle et al. 2018), so much so that the government declared lightning asa national disaster in 2016. During the 2018 pre-monsoon season, there were 275reported casualties (215 of them fatal) due to lightning in Bangladesh, with 181 ofthese occurring during a two-week period in late April and early May (Fig. 12.7a).Although agricultural practices in Bangladesh during the annual peak lightningmonths of April and May contribute to the vulnerabilities (Dewan et al. 2017; Holleet al. 2019), a lack of capacity to forecast lightning is also a factor.
Fig. 12.7 Impact of lightning activity on Bangladesh and select forecasts from HIWAT-HKHduring April and May 2018. a Lightning-related casualties reported in Bangladesh between Apriland May 2018 (Source NIRAPAD 2018). b–d The mean 24-hour (i.e., Day-1) forecast flash ratedensity from the HIWAT-HKH ensemble for three different periods centered on the peak numberof lightning-related casualties in panel a
242 P. N. Gatlin et al.

One of the tools used in HIWAT is the Lightning Forecast Algorithm (LFA),which uses the convection-allowing WRF-simulated fields important to the stormelectrification process as inputs, and computes a calibrated total lightning (bothcloud-to-ground and cloud flashes) flash rate density (McCaul et al. 2009, 2020).This total lightning prognostic field is produced for each of the HIWAT ensemblemembers to produce the hourly and daily probabilistic lightning forecasts across themodel domain (e.g., Figs. 12.5 and 12.6). Figure 12.7b–d provides a daily sum-mary of the HIWAT lightning forecasts from 17 April to 22 May 2018. The amountof lightning being forecast increases from mid-April to early May, then decreasesby mid-May, especially across northeastern Bangladesh and Northeast India. Thistrend compares very well with the trend in lightning casualties reported inBangladesh during this time period (Fig. 12.7a). Also, Holle et al. (2019) found thatthe farming districts in northeastern Bangladesh are especially susceptible tolighting-related fatalities during April and May. Lightning safety education, espe-cially related to agricultural practices (e.g., best times of day to tend or harvestcrops), can greatly help reduce the adverse impacts of thunderstorms in the region.However, it is not every day that thunderstorms will occur in the same location atthe same time, and it is not practical to halt work every afternoon during the peakharvesting months (April and May) of Boro rice, potato, and wheat. Hence, accessto more informative weather forecasts such as those provided by HIWAT canfacilitate better planning of day-to-day activities.
12.4.3 High-Intensity Rainfall Forecasting
Another reason for using ensemble NWP is to enable the forecasting of flash floodsin the regions affected by localized, intense rainfall associated with thunderstorms(Fig. 12.1). In an ensemble system such as HIWAT, hydrologists can access theinformation provided by the system’s multiple precipitation forecasts in such amanner to concisely convey the expected outcome with a higher degree of confi-dence. This can be in the form of probabilities of rainfall exceeding some thresholdin a given basin, which may not be readily known, or in the form of an envelope ofstreamflow forecasts for each basin. Most streamflow models require a singledeterministic input of precipitation instead of a probability of precipitation.However, simply averaging the precipitation forecasts of each ensemble memberwill simultaneously over-predict the areal coverage of rainfall and reduce theamplitude of more intense rainfall events that are often the cause of the flashflooding in the smaller basins and urban areas. Hence, HIWAT employs a statis-tical technique known as the probability matched mean (PMM; Clark 2017) toprovide a single precipitation forecast that represents a “most probable solution”from all its ensemble forecast members. The PMM not only retains thehigher-amplitude precipitation intensity from the individual ensemble members butalso retains the more spatially accurate pattern of the ensemble mean, with the biasat any precipitation threshold being about the same as the average bias of the
12 The High-Impact Weather Assessment Toolkit 243
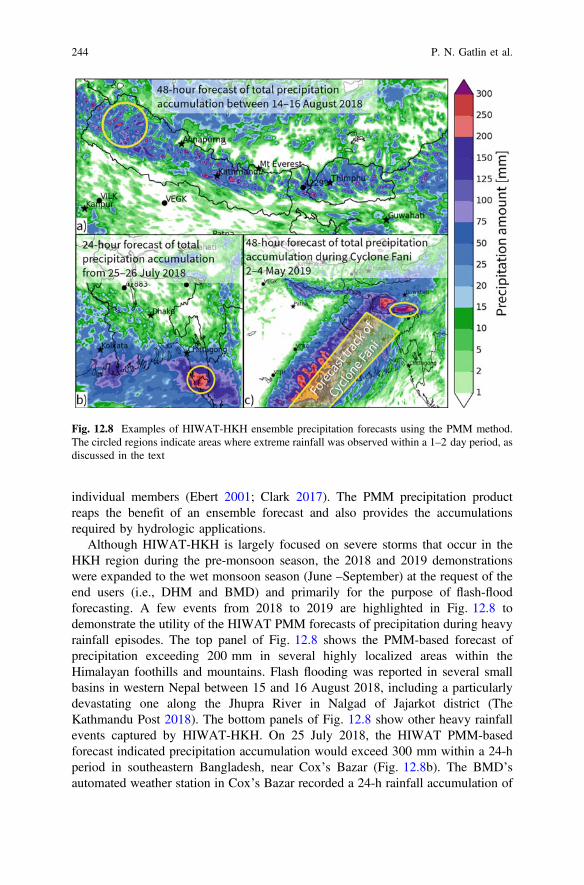
individual members (Ebert 2001; Clark 2017). The PMM precipitation productreaps the benefit of an ensemble forecast and also provides the accumulationsrequired by hydrologic applications.
Although HIWAT-HKH is largely focused on severe storms that occur in theHKH region during the pre-monsoon season, the 2018 and 2019 demonstrationswere expanded to the wet monsoon season (June –September) at the request of theend users (i.e., DHM and BMD) and primarily for the purpose of flash-floodforecasting. A few events from 2018 to 2019 are highlighted in Fig. 12.8 todemonstrate the utility of the HIWAT PMM forecasts of precipitation during heavyrainfall episodes. The top panel of Fig. 12.8 shows the PMM-based forecast ofprecipitation exceeding 200 mm in several highly localized areas within theHimalayan foothills and mountains. Flash flooding was reported in several smallbasins in western Nepal between 15 and 16 August 2018, including a particularlydevastating one along the Jhupra River in Nalgad of Jajarkot district (TheKathmandu Post 2018). The bottom panels of Fig. 12.8 show other heavy rainfallevents captured by HIWAT-HKH. On 25 July 2018, the HIWAT PMM-basedforecast indicated precipitation accumulation would exceed 300 mm within a 24-hperiod in southeastern Bangladesh, near Cox’s Bazar (Fig. 12.8b). The BMD’sautomated weather station in Cox’s Bazar recorded a 24-h rainfall accumulation of
Fig. 12.8 Examples of HIWAT-HKH ensemble precipitation forecasts using the PMM method.The circled regions indicate areas where extreme rainfall was observed within a 1–2 day period, asdiscussed in the text
244 P. N. Gatlin et al.
315 mm on 26 July 2018. The third example (Fig. 12.8c) is the 48-h PMM-basedprecipitation forecast of the tropical cyclone Fani, which developed in the Bay ofBengal and made its landfall southwest of Kolkata, India, on 2 May 2019. Thespread of the 12-member ensemble runs indicated that after landfall, Fani wouldmove north-east along the coastline and significantly weaken as it crossed intoBangladesh. Typically, cyclones bring a significant flooding threat to Bangladesh,but according to the HIWAT forecast Fani carried a low risk of flooding as theheaviest corridor of rainfall was forecast to stay west of Bangladesh and in theNortheast Indian state of Meghalaya. The 48-h forecast predicted over 250–300 mm of rainfall around Cherrapunjee in Northeast India (Fig. 12.8c), where anautomated weather station recorded 276 mm of rainfall between 3 and 4 May 2018.
The HIWAT demonstrations during 2018 and 2019 also included a hydrologiccomponent in which the PMM-based forecast precipitation accumulations wereused as input to the model of Routing Application for Parallel computation ofDischarge (RAPID; David et al. 2011) in order to produce streamflow forecasts forthe HKH region (Nelson et al. 2019). The HIWAT forecasts were used in thissystem primarily for forecasting flash floods due to intense rainfall in the smallerbasins that are often not captured by the coarser-resolution global weather forecastmodels.
12.5 Summary, Challenges, and Way Forward
A probabilistic weather forecasting system such as HIWAT demonstrates theimportance of ensemble-based NWP in building resilience to high-impact weatherin the HKH region. The wealth of information it provides can improvedecision-making and enhance weather services. Extreme-weather forecasting isoften plagued with uncertainty and cannot be captured nor effectively conveyedthrough a single weather model. However, a convection-allowing ensemble fore-casting system depicts a range of possible scenarios of intense thunderstorm haz-ards and thereby can help convey the amount of confidence and/or uncertainty ofthese hazards in the forecast. In order to effectively carry this out, the ensemble hasto be properly configured to address the weather phenomena, including theuncertainty in the physical understanding and representation of it. Additionally, theensemble forecasts, which may include hundreds of potential visualization prod-ucts, must be made easily digestible for the decision makers. Some of theseproducts for assessing potential threats from severe weather events have beenpresented herein and others can be found in a review by Roberts et al. (2019).
A big challenge for NHMS, especially in the case of developing nations, is thecomputational resources that are required by the ensemble weather forecastingsystems. The computational load depends upon the number of ensemble members,the number and geographical size of the modeling domains, their spatial resolution,and the designated number of forecast hours. The complexity of the forecast system(i.e., workflow) must also be considered. Additionally, reliable and high-speed
12 The High-Impact Weather Assessment Toolkit 245

internet access is needed to obtain the global models that initialize and provideboundary conditions to regional forecast systems such as HIWAT. Another chal-lenge for NHMS lies in the novelty of the ensemble NWP, especially as a tool forthunderstorm forecasting. Also, continued education on advancements in meteo-rological forecasting techniques are needed since many meteorologists in devel-oping nations have not received formal training on probabilistic-based weatherforecasting.
The HIWAT service was designed with these challenges in mind. Although theHIWAT demonstrations consist of 12 separate WRF runs, HIWAT is fully cus-tomizable (in terms of domain size, number of ensemble members, and forecasthours) to accommodate porting the service to other regions. Also, and just asimportant, the myriad outputs from the individual ensemble members are combinedinto a handful of meaningful products relevant to addressing high-impact weather.These products are designed to be efficiently interpreted and are used to effectivelyconvey the probability of thunderstorm hazards. HIWAT has demonstrated toNHMS in the HKH region the capability to build or enhance its capacity to provideservices related to extreme-weather events. However, local NHMS may need tocollaborate with scientific researchers to further customize the toolkit usingthresholds that are based on more geographically-specific observations. The defaultthresholds used in the HIWAT demonstrations are primarily based on investigationsfocused on severe weather in the U.S. Furthermore, while information on familiarmeteorological variables such as temperature, humidity, pressure, and wind areavailable from many regional observation networks operating in developingnations, more detailed information is needed to assess the storm prediction fieldsprovided by a system such as HIWAT. Weather radars, especially those withDoppler and polarimetric capabilities, and lightning detection networks can providecritical observational evidence to evaluate the performance of this type ofconvection-allowing modeling system as well as enable additional refinement of thetoolkit. This process of obtaining appropriate data, analyzing it, and using it tofine-tune the system to address local needs underscores the need for governments toestablish a collaboration between their NHMS and the research community, eitherlocally or abroad.
References
ACTI (2006) Nepal: winter drought and hailstorm cause hunger, p 1. http://reliefweb.int/report/nepal/nepal-winter-drought-and-hailstorm-cause-hunger
Ahasan MN, Quadir DA, Khan KA, Haque MS (2014) Simulation of a thunderstorm event overBangladesh using WRF-ARW model. J Mech Eng 44:124–131
Bang SD, Cecil DJ (2019) Constructing a multifrequency passive microwave hail retrieval andclimatology in the GPM domain. J Appl Meteorol Climatol. https://doi.org/10.1175/JAMC-D-19-0042.1
246 P. N. Gatlin et al.

Barker D et al (2012) The weather research and forecasting model’s community variational/ensemble data assimilation system: WRFDA. Bull Am Meteorol Soc 93:831–843. https://doi.org/10.1175/BAMS-D-11-00167.1
Bikos D, Finch J, Case JL (2015) The environment associated with significant tornadoes inBangladesh. Atmos Res 167:183–195. https://doi.org/10.1016/j.atmosres.2015.08.002
Blakeslee RJ, Lang TJ, Koshak WJ, Buechler D, Gatlin P, Mach DM, Stano GT, Virts KS,Walker TD, Cecil DJ, Ellett W, Goodman SJ, Harrison S, Hawkins DL, Heumesser M, Lin H,Maskey M, Schultz CJ, Stewart M, Bateman M, Chanrion O, Christian H (2020) Three years ofthe lightning imaging sensor onboard the international space station: expanded global coverageand enhanced applications. J Geophys Res Atmos 125:e2020JD032918. https://doi.org/10.1029/2020JD032918
Bryan GH, Morrison H (2012) Sensitivity of a simulated squall line to horizontal resolution andparameterization of microphysics. Mon Weather Rev 140:202–225. https://doi.org/10.1175/MWR-D-11-00046.1
Cecil DJ (2009) Passive microwave brightness temperatures as proxies for hailstorms. J ApplMeteorol Climatol 48:1281–1286. https://doi.org/10.1175/2009JAMC2125.1
Cecil DJ, Blankenship CB (2012) Toward a global climatology of severe hailstorms as estimatedby satellite passive microwave imagers. J Clim 25:687–703. https://doi.org/10.1175/JCLI-D-11-00130.1
Chen S-H, Sun W-Y (2002) A one-dimensional time dependent cloud model. J Meteorol SocJapan Ser II 80:99–118. https://doi.org/10.2151/jmsj.80.99
Clark AJ (2017) Generation of ensemble mean precipitation forecasts from convection-allowingensembles. Weather Forecast 32:1569–1583. https://doi.org/10.1175/WAF-D-16-0199.1
Clark AJ et al (2012) An overview of the 2010 hazardous weather test bed experimental forecastprogram spring experiment. Bull Am Meteorol Soc 93:55–74. https://doi.org/10.1175/bAms-d-11-00040.1
Cohen AE, Cavallo SM, Coniglio MC, Brooks HE (2015) A review of planetary boundary layerparameterization schemes and their sensitivity in simulating southeastern U.S. cold seasonsevere weather environments. Weather Forecast 30:591–612. https://doi.org/10.1175/WAF-D-14-00105.1
Das S et al (2014) The SAARC STORM: a coordinated field experiment on severe thunderstormobservations and regional modeling over the South Asian region. Bull Am Meteorol Soc95:603–617. https://doi.org/10.1175/BAMS-D-12-00237.1
David CH, Maidment DR, Niu G-Y, Yang Z-L, Habets F, Eijkhout V (2011) River networkrouting on the NHDPlus dataset. J Hydrometeorol 12:913–934. https://doi.org/10.1175/2011JHM1345.1
Dewan A, Hossain MF, Rahman MM, Yamane Y, Holle RL (2017) Recent lightning-relatedfatalities and injuries in Bangladesh. Weather Clim Soc 9:575–589. https://doi.org/10.1175/WCAS-D-16-0128.1
Dewan A, Ongee ET, Rahman MM, Mahmood R, Yamane Y (2018) Spatial and temporal analysisof a 17-year lightning climatology over Bangladesh with LIS data. Theor Appl Climatol134:347–362. https://doi.org/10.1007/s00704-017-2278-3
Ebert EE (2001) Ability of a poor man’s ensemble to predict the probability and distribution ofprecipitation. Mon Weather Rev 129:2461–2480. https://doi.org/10.1175/1520-0493(2001)129%3c2461:AOAPMS%3e2.0.CO;2
Fan J et al (2017) Cloud-resolving model intercomparison of an MC3E squall line case: part I—convective updrafts. J Geophys Res Atmos 122:9351–9378. https://doi.org/10.1002/2017JD026622
Geer AJ et al (2017) The growing impact of satellite observations sensitive to humidity, cloud andprecipitation. Q J R Meteorol Soc 143:3189–3206. https://doi.org/10.1002/qj.3172
Guan H, Cui B, Zhu Y, Springs C, I. M. S. Group (2015) Improvement of statisticalpost-processing using GEFS reforecast information. 841–854, https://doi.org/10.1175/WAF-D-14-00126.1
12 The High-Impact Weather Assessment Toolkit 247

Guichard F, Couvreux F (2017) A short review of numerical cloud-resolving models. Tellus ADyn Meteorol Oceanogr 69:1373578. https://doi.org/10.1080/16000870.2017.1373578
Hallegatte S (2012) A cost effective solution to reduce disaster losses in developing countries:hydro-meteorological services, early warning, and evacuation. The World Bank
Holle RL et al (2018) Lightning fatalities and injuries in Bangladesh from 1990 through 2017. In:25th international lightning detection conference and 7th international lightning meteorologyconference, Fort Lauderdale, FL, Vaisala. https://my.vaisala.net/en/events/ildcilmc/archive/Documents/Lightning, Fatalities and Injuries in Bangladesh from 1990 through 2017_R.L.Holle et al.pdf
Holle RL, Dewan A, Said R, Brooks WA, Hossain MF, Rafiuddin M (2019) Fatalities related tolightning occurrence and agriculture in Bangladesh. Int J Disaster Risk Reduct 41: https://doi.org/10.1016/j.ijdrr.2019.101264
Hong S-Y, Lim S (2006) The WRF single-mement microphysics scheme (WSM6). J KoreanMeteorol Soc 42:129–151
Hong S-Y, Noh Y, Dudhia J (2006) A new vertical diffusion package with an explicit treatment ofentrainment processes. Mon Weather Rev 134:2318–2341. https://doi.org/10.1175/MWR3199.1
Huang X-Y et al (2009) Four-dimensional variational data assimilation for WRF: formulation andpreliminary results. Mon Weather Rev 137:299–314. https://doi.org/10.1175/2008MWR2577.1
Janjić ZI (1994) The Step-mountain eta coordinate model: further developments of the convection,viscous sublayer, and turbulence closure schemes. Mon Weather Rev 122:927–945. https://doi.org/10.1175/1520-0493(1994)122%3c0927:TSMECM%3e2.0.CO;2
Jedlovec G (2013) Transitioning research satellite data to the operational weather community: theSPoRT paradigm [organization profiles]. IEEE Geosci Remote Sens Mag 1:62–66. https://doi.org/10.1109/MGRS.2013.2244704
Jirak IL, Melick CJ, Weiss SJ (2014) Combining probabilistic ensemble information from theenvironment with simulated storm attributes to generate calibrated probabilities of severeweather hazards. In: 27th conference on severe local storms, Madison, Wisconsin, AmericanMeteorological Society, https://ams.confex.com/ams/27SLS/webprogram/Paper254649.html
Kain JS (2004) The Kain-Fritsch convective parameterization: an update. J Appl Meteorol 43:170–181. https://doi.org/10.1175/1520-0450(2004)043%3c0170:TKCPAU%3e2.0.CO;2
Kain JS, Weiss SJ, Levit JJ, Baldwin ME, Bright DR (2006) Examination of convection-allowingconfigurations of the WRF model for the prediction of severe convective weather: The SPC/NSSL Spring Program 2004. Weather Forecast 21:167–181. https://doi.org/10.1175/WAF906.1
Kain JS et al (2008) Some practical considerations regarding horizontal resolution in the firstgeneration of operational convection-allowing NWP. Weather Forecast 23:931–952. https://doi.org/10.1175/WAF2007106.1
Kain JS, Dembek SR, Weiss SJ, Case JL, Levit JJ, Sobash RA (2010) Extracting uniqueinformation from high-resolution forecast models: monitoring selected fields and phenomenaevery time step. Weather Forecast 25:1536–1542. https://doi.org/10.1175/2010WAF2222430.1
Kathmandu Post (2018) Flood wrecks havoc in Nalgad, Jajarkot. Kathmandu PostKotal SD, Bhattacharya SK, Bhowmik SKR, Kundu PK (2015) Development of NWP-based
cyclone prediction system for improving cyclone forecast service in the country. High-impactweather events over the SAARC region. Springer, Cham, Switzerland, pp 111–128
Mäkelä A, Shrestha R, Karki R (2014) Thunderstorm characteristics in Nepal during thepre-monsoon season 2012. Atmos Res 137:91–99. https://doi.org/10.1016/j.atmosres.2013.09.012
Mallapaty S (April 2019) Nepali scientists record country’s first tornado. NatureMcCaul EW, Goodman SJ, LaCasse KM, Cecil DJ (2009) Forecasting lightning threat using
cloud-resolving model simulations. Weather Forecast 24:709–729. https://doi.org/10.1175/2008WAF2222152.1
248 P. N. Gatlin et al.
McCaul EW, Priftis G, Case JL, Chronis T, Gatlin PN, Goodman SJ, Kong F (2020) Sensitivitiesof the WRF lightning forecasting algorithm to parameterized microphysics and boundary layerschemes. Weather Forecast. WAF-D-19-0101.1, https://doi.org/10.1175/WAF-D-19-0101.1
Milbrandt JA, Yau MK (2006) A multimoment bulk microphysics parameterization. part IV:sensitivity experiments. J Atmos Sci 63:3137–3159. https://doi.org/10.1175/JAS3817.1
Morrison H, Thompson G, Tatarskii V (2009) Impact of cloud microphysics on the developmentof trailing stratiform precipitation in a simulated squall line: comparison of one- andtwo-moment schemes. Mon Weather Rev 137:991–1007. https://doi.org/10.1175/2008MWR2556.1
Nakanishi M, Niino H (2009) Development of an improved turbulence closure model for theatmospheric boundary layer. J Meteorol Soc Japan 87:895–912. https://doi.org/10.2151/jmsj.87.895
Nelson EJ et al (2019) Enabling stakeholder decision-making with earth observation and modelingdata using tethys platform. Front Environ Sci 7:148. https://doi.org/10.3389/fenvs.2019.00148
NIRAPAD (2018) Monthly hazard incident report, March, April, May. https://www.nirapad.org.bd/home/resources/monthlyHazard
Perrels A (2011) Social economic benefits of enhanced weather services in NepalPotvin CK, Flora ML (2015) Sensitivity of idealized supercell simulations to horizontal grid
spacing: implications for warn-on-forecast. Mon Weather Rev 143:2998–3024. https://doi.org/10.1175/MWR-D-14-00416.1
Powers JG et al (2017) The weather research and forecasting model: overview, system efforts, andfuture directions. Bull Am Meteorol Soc 98:1717–1737. https://doi.org/10.1175/BAMS-D-15-00308.1
Rigaud KK (2015) PPCR fundamentals. In: 8th PPCR pilot countries Meeting, Frascati, Italy,Climate Investment Funds, https://www-cif.climateinvestmentfunds.org/sites/default/files/PPCR_Fundamentals_v3_KKR_Final.pdf. Accessed 25 Mar 2016
Roberts B, Jirak IL, Clark AJ, Weiss SJ, Kain JS (2019) Post processing and visualizationtechniques for convection-allowing ensembles. Bull Am Meteorol Soc 100:1245–1258. https://doi.org/10.1175/BAMS-D-18-0041.1
Romatschke U, Medina S, Houze RA (2010) Regional, seasonal, and diurnal variations of extremeconvection in the South Asian region. J Clim 23:419–439. https://doi.org/10.1175/2009JCLI3140.1
Rozumalski RA (2019) UEMS. http://strc.comet.ucar.edu/software/uems/Schwartz CS, Sobash RA (2017) Generating probabilistic forecasts from convection-allowing
ensembles using neighborhood approaches: a review and recommendations. Mon Weather Rev145:3397–3418. https://doi.org/10.1175/MWR-D-16-0400.1
Schwartz CS, Romine GS, Sobash RA, Fossell KR, Weisman ML (2019) NCAR’s real-timeconvection-allowing ensemble project. Bull Am Meteorol Soc 100:321–343. https://doi.org/10.1175/BAMS-D-17-0297.1
Shrestha A, Pradhananga D, Karmacharya J (2019) Report on Bara-Parsa Tornado, p 82. http://www.smallearth.org.np/wp-content/uploads/2019/04/Report-on-Bara-Parsa-Tornado.pdf
Skofronick-Jackson G, Petersen WA, Berg W, Kidd C, Stocker EF, Kirschbaum DB, Kakar R,Braun SA, Huffman GJ, Iguchi T, Kirstetter PE, Kummerow C, Meneghini R, Oki R,Olson WS, Takayabu YN, Furukawa K, Wilheit T (2017) The global precipitationmeasurement (GPM) mission for science and society. Bull Am Meteorol Soc 98(8):1679–1695. https://doi.org/10.1175/BAMS-D-15-00306.1
Spencer RW, Howland MR, Santek DA (1987) Severe storm identification with satellitemicrowave radiometry: an initial investigation with Nimbus-7 SMMR data. J Clim ApplMeteorol 26:749–754. https://doi.org/10.1175/1520-0450(1987)026%3c0749:SSIWSM%3e2.0.CO;2
Stensrud DJ (2007) Parameterization schemes: keys to understanding numerical weather predictionmodels. Cambridge University Press, Cambridge, p 459
Tao W-K (2007) Cloud resolving modeling. J Meteorol Soc Japan Ser II 85B:305–330. https://doi.org/10.2151/jmsj.85B.305
12 The High-Impact Weather Assessment Toolkit 249
Tao W-K, Wu D, Lang S, Chern J-D, Peters-Lidard C, Fridlind A, Matsui T (2016)High-resolution NU-WRF simulations of a deep convective-precipitation system duringMC3E: Further improvements and comparisons between Goddard microphysics schemes andobservations. J Geophys Res Atmos 121:1278–1305. https://doi.org/10.1002/2015JD023986
UCAR (2020) WRF users page. https://www2.mmm.ucar.edu/wrf/users/Weisman ML, Skamarock WC, Klemp JB (1997) The resolution dependence of explicitly modeled
convective systems. Mon Weather Rev 125:527–548. https://doi.org/10.1175/1520-0493(1997)125%3c0527:TRDOEM%3e2.0.CO;2
Williams ER (2001) The electrification of severe storms. In: Severe convective storms, AmericanMeteorological Society, pp 527–561
World Bank (2017) Bangladesh and World Bank sign $113 million to improve weather forecastingand early warning systems. Press Release. http://www.worldbank.org/en/news/press-release/2017/04/05/bangladesh-and-world-bank-sign-113-million-to-improve-weather-forecasting-and-early-warning-systems. Accessed 8 May 2019
World Bank Group—PPCR (2015) Key lessons from the pilot program for climate resilience (FullReport), p 50. https://www-cif.climateinvestmentfunds.org/knowledge-documents/key-lessons-pilot-program-climate-resilience-full-report
Zavodsky BT, LaFontaine FJ, Berndt E, Meyer P, Jedlovec GJ (2017) Satellite data product anddata dissemination updates for the SPoRT Sea Surface Temperature composite product. In:13th symposium new generation operational environmental satellite systems, Seattle, WA,American Meteorological Society, https://ams.confex.com/ams/97Annual/webprogram/Paper315476.html
Zhou L, Lin S-J, Chen J-H, Harris LM, Chen X, Rees SL (2019) Toward convective-scaleprediction within the next generation global prediction system. Bull Am Meteorol Soc100:1225–1243. https://doi.org/10.1175/BAMS-D-17-0246.1
Zhou X, Zhu Y, Hou D, Luo Y, Peng J, Wobus R (2017) Performance of the new NCEP globalensemble forecast system in a parallel experiment. Weather Forecast 32:1989–2004. https://doi.org/10.1175/WAF-D-17-0023.1
Zipser EJ, Liu C, Cecil DJ, Nesbitt SW, Yorty DP (2006) Where are the most intensethunderstorms on earth? Bull Am Meteorol Soc 87:1057–1071. https://doi.org/10.1175/BAMS-87-8-1057
Open Access This chapter is licensed under the terms of the Creative Commons Attribution 4.0International License (http://creativecommons.org/licenses/by/4.0/), which permits use, sharing,adaptation, distribution and reproduction in any medium or format, as long as you give appropriatecredit to the original author(s) and the source, provide a link to the Creative Commons license andindicate if changes were made.The images or other third party material in this chapter are included in the chapter’s Creative
Commons license, unless indicated otherwise in a credit line to the material. If material is notincluded in the chapter’s Creative Commons license and your intended use is not permitted bystatutory regulation or exceeds the permitted use, you will need to obtain permission directly fromthe copyright holder.
250 P. N. Gatlin et al.
Chapter 13Geospatial Information Technologyfor Information Managementand Dissemination
Sudip Pradhan, Birendra Bajracharya, Kiran Shakya,and Bikram Shakya
13.1 Introduction
Over the last few decades, the development of geospatial technologies has con-verged with a variety of formal information technology disciplines (Zwartjes 2018;Jackson and Schell 2009). The rapidly growing location-based services seamlesslyintegrate data and technologies from Earth observation (EO), GeographicInformation System (GIS), Geographic Position System (GPS), and wireless andmobile communications (Huang et al. 2018). The emerging technologies forlarge-scale data storage, processing, and analytics and the increased availability andquality of the geospatial data have created unprecedented opportunities with broadimplications for both technology and society (Liu et al. 2019). Today, we see thepresence of various kinds of information systems in the Web, ranging from verybasic data visualization to more advanced applications that do rigorous spatialanalysis on the fly and present the results to the user over the Internet.
Looking back at the evolution of Geospatial Information Technology (GIT), thedesktop GIS was prevalent in the world up until the early 2000s. Early Webmapping applications were mostly limited to simple interactive visualization of dataas maps without much sophistication, and there were very few map servers avail-able at the time, like Environmental Systems Research Institute (Esri) ArcIMS andMinnesota MapServer. Based on user requests, these servers generated maps in theform of images in formats such as Portable Network Graphics (PNG) and JointPhotographic Experts Group (JPEG) and sent them back to the Web browser forvisualization of data. For each action on the user’s part, such as zooming in or out,the map server generated new maps dynamically and sent the outputs to the user’sbrowser. The servers back then were not powerful and could handle only limited
S. Pradhan (&) � B. Bajracharya � K. Shakya � B. ShakyaInternational Centre for Integrated Mountain Development, Kathmandu, Nepale-mail: [email protected]
© The Author(s) 2021B. Bajracharya et al. (eds.), Earth Observation Science and Applications for RiskReduction and Enhanced Resilience in Hindu Kush Himalaya Region,https://doi.org/10.1007/978-3-030-73569-2_13
251

map requests at a time. When the number of visitors using the map exceeded theserver’s handling capacity, it would slow down and, at times, crash.
All of this changed in 2005 with the arrival of Google Maps and Google Earthwhich gave everyone access to geographic information in a fairly democratic way.The ability to explore one’s neighbourhood in 3D through high-resolution satelliteimages and navigation tools instigated spatial thinking in common people who didnot have any technical background or specialized skills (Goodchild and Janelle2010). Google Maps relied on serving pre-generated map tiles for each fixed zoomlevel instead of creating dynamic maps upon getting requests from the users; thisoptimized the map services and made them efficient. Google Maps also provided anumber of base maps such as street map, satellite image, and terrain that acted asreference maps while allowing the users to overlay their own data on top of them.This became the industry standard and was adopted by many other agencies in theworld. Today, there are several base maps available from different organizationssuch as Esri, Google, OpenStreetMap, MapBox, and Carto, and Web mappingapplications are mostly built using base maps and overlaying the users’ own data ontop of them.
There has been a corresponding evolution on the application development front.Appropriate JavaScript application programming interfaces (APIs) such as Leaflet,OpenLayers, ArcGIS JavaScript API, and Google Maps JavaScript API havebecome available primarily to develop such Web mapping applications. In addition,there has been tremendous advancement in mapping servers as well in the past twodecades. These days, server technologies such as ArcGIS Server and GeoServer arequite powerful. They are capable of serving a huge volume of data, carry outon-the-fly GIS operations, and are able to handle requests from numerous clients.Further, they support Open Geospatial Consortium (OGC) interoperability stan-dards like Web Map Service (WMS), Web Feature Service (WFS), and WebCoverage Service (WCS), thereby enabling users to access data from differentmapping servers and integrate them in their applications using the client software oftheir choice.
Another technological innovation of recent times is cloud computing which isbecoming increasingly common and popular across the globe. The cloud offers highscalability in terms of processing and storage capacity with different modalities ofpayment that suit the users. There are numerous cloud-based applications andsolutions that we use on a daily basis (e.g. Google Drive, Dropbox, and Microsoft365). Esri’s ArcGIS Online, which is popular among the GIS community, runs onAmazon Web Services (AWS) and provides a content management system thatallows users to create and share maps, stories, and applications without writing anysingle line of code. Taking it forward, the advent of geospatial cloud computingplatforms has brought paradigm shifts in the way we use GIS and remote sensing.A large number of satellites—fitted with various sensors—capture the data of ourplanet regularly, producing a huge volume of data at various geographic andtemporal resolutions. A number of EO data such as MODIS, Landsat, Sentinel, andGlobal Precipitation Measurement (GPM) are freely available and have provided anopportunity to develop data products that are useful to decision-makers in various
252 S. Pradhan et al.

application areas. In traditional desktop-based remote sensing, individual scenes ofsatellite imagery are acquired, and specialized image processing software is used togenerate the data products. As such, it would take a long time to produce dataproducts that cover whole countries, and this would become much more complexwhen it comes to developing regional-level data products for multiple time periods.The geospatial cloud computing platforms such as GEE, Radiant Earth, and AWS,on the other hand, provide access to a huge collection of EO and geospatial dataalong with powerful computing facility to carry out image processing and analysisat the planetary scale. As an alternative to these platforms, the Open Data Cube(ODC) offers free and open-source solution for access, management, and analysis ofa large collection of EO and geospatial gridded data.
There are increasing atmospheric and hydrologic applications using land-surfacemodels which deal with data assimilation from various sources with complex andlarge range of spatial and temporal scales. There has been considerable progress inthe development of data assimilation on continental surfaces in conjunction with theEO systems (Jean et al. 2016). Such applications are made possible by using highperformance computing (HPC) clusters that consist of a collection of servermachines connected together. In fact, HPCs are also implemented on the cloudusing service from any of the key providers such as AWS, Google Cloud, andMicrosoft Azure.
13.2 Adoption of GIT at SERVIR-HKH
SERVIR-HKH emphasizes the use of EO and geospatial technologies for envi-ronmental monitoring, food and water security, natural resources management toimprove the resilience of the region to the impacts of climate change and othershocks and stresses. To achieve these overarching goals, it focuses on improvedawareness of and access to geospatial data, products, and tools and increasedprovision of user-tailored geospatial services for informed decision-making in theHKH region. The evolution of technologies and their applications in the globalcontext has influenced the way SERVIR-HKH is exploiting the opportunities ofGIT to serve the region. The HKH region, like elsewhere in the globe, has seen agreat improvement in Internet connectivity, with its presence becoming more andmore ubiquitous, along with a significant increase in bandwidth and a sharp declinein price (Digital Nepal Framework 2019; ITU 2020). These factors have contributedgreatly to making the Web the preferred platform for developing tools and appli-cations. Although ICIMOD had been serving various GIS data and applications topartners through the Internet, including simple Web mapping applications forvisualization since early 2000, the real journey of developing Web-based servicesbegan with the launching of SERVIR-HKH in 2010. SERVIR-HKH has beenclosely following the technological advancement and trends globally in the field ofGIT. It has worked towards bringing the latest innovative tools and solutions to theHKH region by customizing them as per the local needs in ICIMOD’s regional
13 Geospatial Information Technology for Information Management … 253
member countries. The options for platforms and technologies and the developmentapproaches adopted for different GIT solutions are presented in the followingsections.
13.3 Platforms and Technologies
The choice of platforms and technologies is generally guided by the desiredfunctions, technological development, market trends, and available resources.Being the global leader, Esri technologies have been the primary choice since theintroduction of GIS by ICIMOD in the early 1990s (Chap. 1). The technologyoptions and platforms have been more diverse in recent years. The adoption ofcloud computing is growing and increasingly becoming mainstream across theglobe. Big data is another trend that allows analysis of extensive sets of informationto generate the desired knowledge products. Besides, mobile devices have takenboth the business world and the personal realm by storm, and the number ofapplications have skyrocketed in recent years. The key technologies and platformsthat are used for developing applications and information services underSERVIR-HKH are presented here.
Esri’s ArcGIS Technology: ICIMOD has been using Esri technologies as one of thecore components of its geospatial infrastructure. The institution has implementedEnterprise GIS using the ArcGIS enterprise geo-database, and ArcGIS Desktop isthe primary GIS client software used by its staff members. Most of the onlinemapping applications under SERVIR-HKH to date have been developed usingArcGIS JavaScript API, along with maps published through ArcGIS Server. Also, anumber of data visualization applications and Story Maps have been developedusing ArcGIS Online technology. Further, Esri’s Survey123 for ArcGIS is used tobuild mobile field data collection for various services under SERVIR-HKH. NepalForest Fire Detection and Monitoring System, Land Cover Dynamics in Bhutan,and Glacier Dynamics in Afghanistan are some of the examples of the use ofArcGIS Server technology.
Google Earth Engine and Google App Engine: GEE is Google’s cloud-basedplatform that enables environmental data analysis at the planetary scale. The GEEplatform has been used by SERVIR-HKH to develop a number of applications suchas annual land cover mapping for the entire HKH region and in-season cropmapping in selected countries. In addition, it is being used for big data analysis invarious application areas. Further, a combination of GEE and Google App Enginehas been used to develop Web mapping applications that allow users to doon-the-fly data analysis and present the results to the users; for example, theanalysis of the normalized difference vegetation (NDVI) anomaly and wheat areamapping for Afghanistan.
254 S. Pradhan et al.
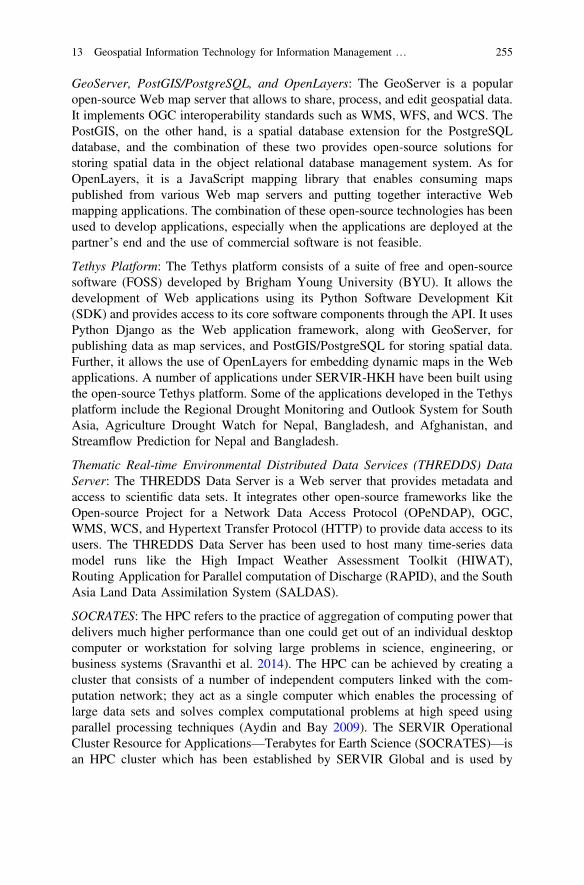
GeoServer, PostGIS/PostgreSQL, and OpenLayers: The GeoServer is a popularopen-source Web map server that allows to share, process, and edit geospatial data.It implements OGC interoperability standards such as WMS, WFS, and WCS. ThePostGIS, on the other hand, is a spatial database extension for the PostgreSQLdatabase, and the combination of these two provides open-source solutions forstoring spatial data in the object relational database management system. As forOpenLayers, it is a JavaScript mapping library that enables consuming mapspublished from various Web map servers and putting together interactive Webmapping applications. The combination of these open-source technologies has beenused to develop applications, especially when the applications are deployed at thepartner’s end and the use of commercial software is not feasible.
Tethys Platform: The Tethys platform consists of a suite of free and open-sourcesoftware (FOSS) developed by Brigham Young University (BYU). It allows thedevelopment of Web applications using its Python Software Development Kit(SDK) and provides access to its core software components through the API. It usesPython Django as the Web application framework, along with GeoServer, forpublishing data as map services, and PostGIS/PostgreSQL for storing spatial data.Further, it allows the use of OpenLayers for embedding dynamic maps in the Webapplications. A number of applications under SERVIR-HKH have been built usingthe open-source Tethys platform. Some of the applications developed in the Tethysplatform include the Regional Drought Monitoring and Outlook System for SouthAsia, Agriculture Drought Watch for Nepal, Bangladesh, and Afghanistan, andStreamflow Prediction for Nepal and Bangladesh.
Thematic Real-time Environmental Distributed Data Services (THREDDS) DataServer: The THREDDS Data Server is a Web server that provides metadata andaccess to scientific data sets. It integrates other open-source frameworks like theOpen-source Project for a Network Data Access Protocol (OPeNDAP), OGC,WMS, WCS, and Hypertext Transfer Protocol (HTTP) to provide data access to itsusers. The THREDDS Data Server has been used to host many time-series datamodel runs like the High Impact Weather Assessment Toolkit (HIWAT),Routing Application for Parallel computation of Discharge (RAPID), and the SouthAsia Land Data Assimilation System (SALDAS).
SOCRATES: The HPC refers to the practice of aggregation of computing power thatdelivers much higher performance than one could get out of an individual desktopcomputer or workstation for solving large problems in science, engineering, orbusiness systems (Sravanthi et al. 2014). The HPC can be achieved by creating acluster that consists of a number of independent computers linked with the com-putation network; they act as a single computer which enables the processing oflarge data sets and solves complex computational problems at high speed usingparallel processing techniques (Aydin and Bay 2009). The SERVIR OperationalCluster Resource for Applications—Terabytes for Earth Science (SOCRATES)—isan HPC cluster which has been established by SERVIR Global and is used by
13 Geospatial Information Technology for Information Management … 255

various SERVIR hubs as a shared resource. It is used to run the HIWAT system bySERVIR-HKH.
Amazon Web Services (AWS): Apart from on-premises servers, SERVIR-HKH alsouses AWS to implement a number of online applications. For example, theRegional Drought Monitoring and Outlook System for South Asia and NationalAgricultural Drought Watch (Nepal) have been hosted on AWS.
Open Data Kit (ODK): ODK is a free and open-source software that allows rapiddevelopment and deployment of Android mobile-based data collection application.Along with Survey123, the ODK Collect has been used extensively for field datacollections under SERVIR-HKH. For example, in the past, an ODK-based cropsurvey application was developed and used in collecting crop-related information inNepal.
13.4 Development Approach
SERVIR-HKH follows a standard set of procedures when it comes to the devel-opment of services and related applications. Stakeholder consultation workshopsand meetings are held to capture the requirements for each of the services in thecountries where they are being built for. SERVIR-HKH uses the service planningapproach wherein the users are placed at the centre at each stage of the design anddevelopment process (Chap. 2). The consideration of who the primary and sec-ondary users are, what their needs are, and how the service will address those needsin terms of tackling issues on the ground is given utmost priority while designingand developing data products and applications. The tools and applications aredesigned and developed in close consultation with the primary users. Workshopsand meetings are conducted to also capture the requirement regarding how the userswill interact with the application. Regular meetings and exchanges are held with theprimary users to gather their feedback at various stages of system development.
The institutional capacity of partners in terms of their existing IT infrastructureand technical skills are assessed to identify the gaps that need to be fulfilled tooperationalize the services. The capacity building activities are embedded in theservice development process such that the partners’ technical capacity in terms ofunderstanding and using the tools and information products of the services are builtalong with the development of the services.
Co-development is one of the key mantras of SERVIR-HKH, and whereverpossible, it works jointly with its key partners in developing applications. Forexample, SERVIR-HKH and NASA’s Applied Science Teams (ASTs) workedclosely together to develop customized data and applications for various servicessuch as Agriculture Drought Watch for Nepal and Streamflow Prediction for Nepaland Bangladesh. Together, they also regularly interfaced with key national agenciesin generating and validating data products and developing customized applicationsto meet their requirements.
256 S. Pradhan et al.
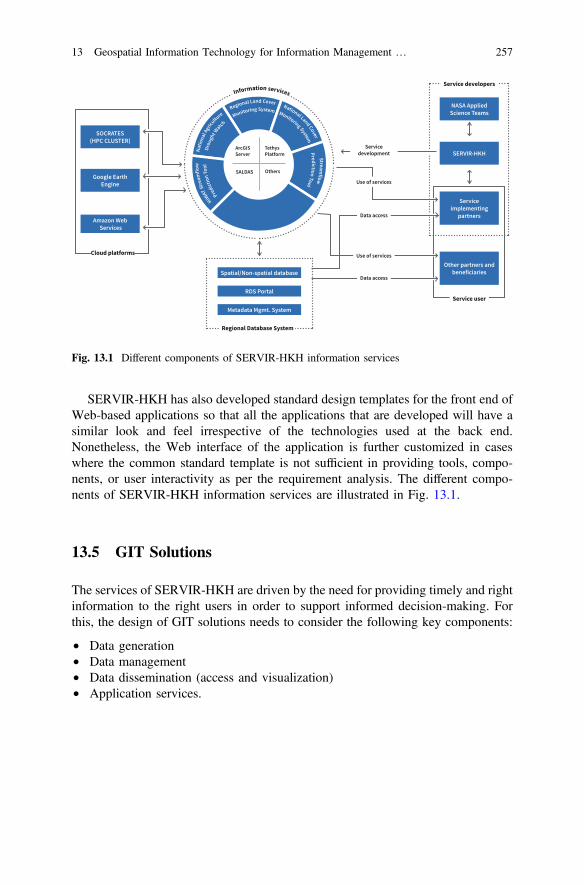
SERVIR-HKH has also developed standard design templates for the front end ofWeb-based applications so that all the applications that are developed will have asimilar look and feel irrespective of the technologies used at the back end.Nonetheless, the Web interface of the application is further customized in caseswhere the common standard template is not sufficient in providing tools, compo-nents, or user interactivity as per the requirement analysis. The different compo-nents of SERVIR-HKH information services are illustrated in Fig. 13.1.
13.5 GIT Solutions
The services of SERVIR-HKH are driven by the need for providing timely and rightinformation to the right users in order to support informed decision-making. Forthis, the design of GIT solutions needs to consider the following key components:
• Data generation• Data management• Data dissemination (access and visualization)• Application services.
Fig. 13.1 Different components of SERVIR-HKH information services
13 Geospatial Information Technology for Information Management … 257

13.5.1 Data Generation
The nature of services under SERVIR-HKH involves dealing with spatial data fromvarious national and global data sets, including satellite images from differentsensors and resolutions. Similarly, there are increasing data from field activitiessuch as from forest and crop surveys, socio-economic surveys, and modellingactivities which need to deal with model-specific input and output data. It isimportant to ensure that the data are collected and generated according to theindustry standards for data consistency, quality, greater opportunity for data inte-gration and aggregation, increased opportunities for sharing data, improved docu-mentation and understanding of data and information resources, and data updatingand security.
Various kinds of software and operational systems have been used to developdata products under different SERVIR-HKH services. The major data generation iscarried out through the analysis of satellite images. In the first phase ofSERVIR-HKH, the ERDAS Imagine and eCognition software were used primarilyto develop data products such as land cover, glaciers and glacial lakes, and croparea. Aligning with the emerging trends, the GEE is being increasingly used inimage analysis for applications such as developing the annual land cover data forthe entire HKH region. Also, it is being used for big data analysis in variousapplication areas under SERVIR-HKH.
Another set of data generation is from model runs such as SALDAS establishedat SERVIR-HKH. SALDAS is employed as the backbone of the Regional DroughtMonitoring and Outlook System for South Asia and Agriculture Drought Watch forNepal, Bangladesh, Pakistan, and Afghanistan. It is the implementation of theGlobal Land Data Assimilation System (GLDAS) developed by NASA for theSouth Asia region and provides, on a daily basis, the model run outputs for variousdrought indicator parameters such as precipitation, temperature, evapotranspiration,and soil moisture.
Similarly, HIWAT provides 48-h extreme weather predictions for lightningstrikes, high-impact winds, thunderstorms, high rainfall rates, hail, and otherweather events. It uses a mesoscale numerical weather prediction model and theGPM constellation of satellites. It is run during the pre-monsoon and monsoonseasons from April to September every year. The HIWAT system is implementedon SOCRATES, the HPC cluster at the SERVIR Global computing infrastructure.
13.5.2 Data Management
All the data generated under SERVIR-HKH are stored in ICIMOD’s RegionalDatabase System (RDS). The RDS is a central data repository for different thematicareas of the HKH region. A combination of ArcGIS enterprise geo-database and theMicrosoft SQL Server is used to store spatial data, and the Microsoft SQL Server
258 S. Pradhan et al.

on its own to store non-spatial tabular data in the RDS. In addition, proper metadatais created and stored for all the data sets in GeoNetwork. GeoNetwork is anopen-source metadata management system developed by the FAO. Depending uponthe nature of the data, various metadata standards are used, such as the NorthAmerican Profile (NAP) of the International Organization for Standardization(ISO) 19115-2003 for GIS and RS data, Global Biodiversity Information Facility(GBIF), Ecological Metadata Language (EML), Metadata profile for biodiversitydata, and so on.
A backup strategy of incremental backup and a full backup plan is followed asper ICIMOD’s IT guidelines to ensure safe and reliable data storage while alsocomplying with the IT audit. Further, the Database Replica Server, a direct replicaof a working database server, including both software and hardware, is imple-mented to ensure uninterrupted data services and to reduce the shutdown time ofapplications using these databases.
13.5.3 Data Dissemination
Data dissemination supports data discovery, access, exploration, visualization, anddownload functions. The RDS portal (https://rds.icimod.org)—a core component ofthe RDS—serves as ICIMOD’s clearinghouse for data curation and disseminationand ensures easy access to the curated data sets which include those developedunder SERVIR-HKH (Fig. 13.2). The portal provides free-text search and advancedsearch capabilities so that users can search by defining the title, abstract, keyword,or geographic extent. The search result would show a list of records consisting ofthe title, abstract, and thumbnail. The users can narrow down the search resultsusing the provided filters and also view the detailed metadata of any record. Further,the users can download ICIMOD’s published data sets after following a simpleregistration process. The portal offers specific tools to allow the download oftemporal data (e.g. soil moisture or evapotranspiration) and climate projection datafor a user-specified geographic area, time period, and other relevant parameters.
For the data which have been published as map service, the portal provides thefacility to view the data as an interactive Web map using a Data Viewer applicationdeveloped for the purpose.
All the data produced under SERVIR-HKH are publicly available on the RDSPortal for downloads. ICIMOD’s Data Sharing Policy aligns with the philosophy ofopen and free access to scientific information and knowledge, and the data that aremade available to the public by ICIMOD are licensed under Creative CommonsAttribution (CC-BY) which allows the users to share and adapt the data as long asthe creator is appropriately credited. In order to promote easier access to data on theInternet and also to facilitate proper citation, unique digital object identifiers (DOIs)are generated for the public data sets. A DOI is a persistent handle that identifies aparticular data set uniquely on the internet (https://www.doi.org).
13 Geospatial Information Technology for Information Management … 259
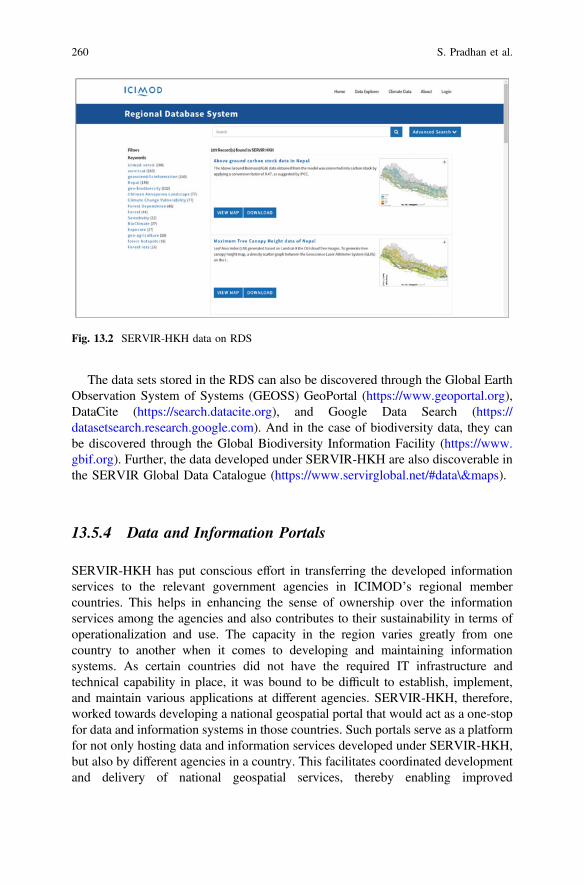
The data sets stored in the RDS can also be discovered through the Global EarthObservation System of Systems (GEOSS) GeoPortal (https://www.geoportal.org),DataCite (https://search.datacite.org), and Google Data Search (https://datasetsearch.research.google.com). And in the case of biodiversity data, they canbe discovered through the Global Biodiversity Information Facility (https://www.gbif.org). Further, the data developed under SERVIR-HKH are also discoverable inthe SERVIR Global Data Catalogue (https://www.servirglobal.net/#data\&maps).
13.5.4 Data and Information Portals
SERVIR-HKH has put conscious effort in transferring the developed informationservices to the relevant government agencies in ICIMOD’s regional membercountries. This helps in enhancing the sense of ownership over the informationservices among the agencies and also contributes to their sustainability in terms ofoperationalization and use. The capacity in the region varies greatly from onecountry to another when it comes to developing and maintaining informationsystems. As certain countries did not have the required IT infrastructure andtechnical capability in place, it was bound to be difficult to establish, implement,and maintain various applications at different agencies. SERVIR-HKH, therefore,worked towards developing a national geospatial portal that would act as a one-stopfor data and information systems in those countries. Such portals serve as a platformfor not only hosting data and information services developed under SERVIR-HKH,but also by different agencies in a country. This facilitates coordinated developmentand delivery of national geospatial services, thereby enabling improved
Fig. 13.2 SERVIR-HKH data on RDS
260 S. Pradhan et al.
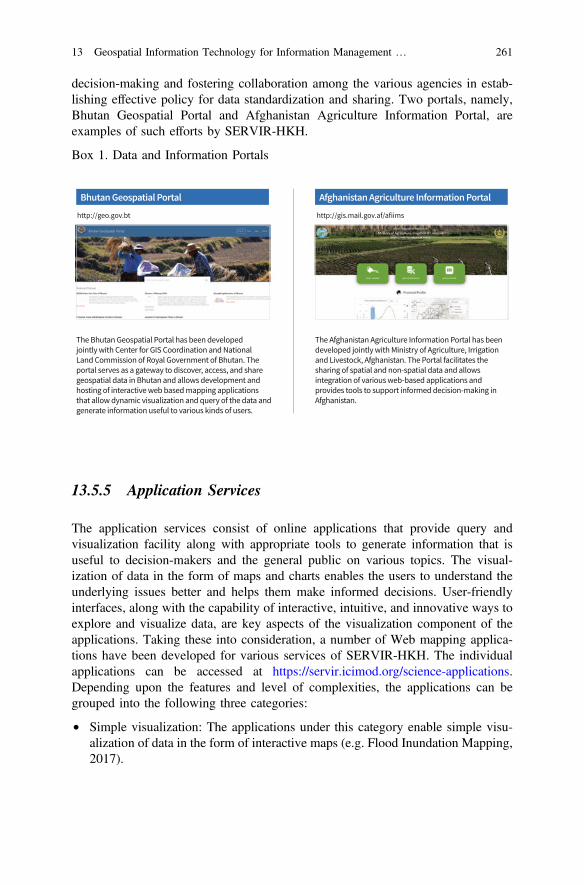
decision-making and fostering collaboration among the various agencies in estab-lishing effective policy for data standardization and sharing. Two portals, namely,Bhutan Geospatial Portal and Afghanistan Agriculture Information Portal, areexamples of such efforts by SERVIR-HKH.
Box 1. Data and Information Portals
13.5.5 Application Services
The application services consist of online applications that provide query andvisualization facility along with appropriate tools to generate information that isuseful to decision-makers and the general public on various topics. The visual-ization of data in the form of maps and charts enables the users to understand theunderlying issues better and helps them make informed decisions. User-friendlyinterfaces, along with the capability of interactive, intuitive, and innovative ways toexplore and visualize data, are key aspects of the visualization component of theapplications. Taking these into consideration, a number of Web mapping applica-tions have been developed for various services of SERVIR-HKH. The individualapplications can be accessed at https://servir.icimod.org/science-applications.Depending upon the features and level of complexities, the applications can begrouped into the following three categories:
• Simple visualization: The applications under this category enable simple visu-alization of data in the form of interactive maps (e.g. Flood Inundation Mapping,2017).
13 Geospatial Information Technology for Information Management … 261
• User interactive: Most of the applications developed under SERVIR-HKH fallinto this category. The applications offer tools to query and visualize data in theform of interactive maps and charts based on user-selected parameters andgeographic regions.
• Fully automated: These applications run on their own without any humanintervention. They carry out tasks such as assimilation and processing of data,analysis and generation of statistics, and disseminating them through Webmapping applications in an automated manner (e.g. Nepal Forest Fire Detectionand Monitoring System, Regional Drought Monitoring and Outlook System forSouth Asia, and Streamflow Prediction for Nepal).
As described earlier, standard Web design templates have been developed such thatall the applications have a similar look and feel irrespective of the back-end andfront-end technologies that have been used in developing those applications. Thetemplates have been developed using Bootstrap, a front-end Web developmentframework, which ensures that the applications are responsive and are displayedwell in variety of devices and screen sizes (e.g. desktop computers, tablets, etc.).
The applications consist of various common features such as map and chartsections for showing maps and charts. Likewise, a layer control section present inthe application allows for the turning on/off map layers, while a tool control sectionlets the users to select parameters to view data and information in the form of mapsor charts. Further, the applications also contain a section that provides briefinformation about the application and a link section that provides links to therelevant publication and to those for downloading data from ICIMOD’s RDSportal. Finally, a feature to switch between English and the national language (e.g.Nepali) has been offered in a number of applications.
In addition to providing the facility to query and visualize data in the form ofinteractive maps through various online applications, SERVIR-HKH also allowsdirect access to data and map services to users with advanced technical capabilities.It also promotes the use of interoperable technologies and publishes its maps asOGC WMS services such that the users can readily integrate the data in theirapplications (e.g. https://bipad.gov.np). Further, SERVIR-HKH also provides theAPIs used in the various applications to the partners on a request basis so that theycan directly query the data in various SERVIR-HKH information systems andintegrate the results in their applications.
13.5.6 Mobile Applications
The term “citizen science” was first used in 1969 and gained popularity in the 1990s(Haklay 2015). It is defined as “scientific work, for example collecting information,that is done by ordinary people without special qualifications, in order to help thework of scientists” (https://dictionary.cambridge.org/dictionary/english/citizen-science). A Web-based citizen science application was developed in the first
262 S. Pradhan et al.

phase of SERVIR-HKH to collect feedback on the land cover data of Nepal for2010. The application allowed people to zoom to their familiar location or area andprovide their feedback by selecting an option from a predefined list of land coverclasses and also to type in their comments in the box provided. These days, mobileapplications are predominantly used for field data collection as well as for gettingfeedback from the users.
A number of SERVIR-HKH services need field-based data either as trainingsample points that are required to develop data products or as data to validate andimprove RS-based products. In this regard, a number of mobile applications forfield data collections have been developed using Esri’s Survey123 to supportongoing works of different services under SERVIR-HKH. A few of the examples ofsuch applications include a Land Cover Survey App for Bangladesh and Nepal tocollect sample points for validating the land cover data prepared in those countriesunder the National Land Cover Mapping System (NLCMS) and a Crop Survey Appto collect various crop-related information such as on dominant winter crops,weather conditions, irrigation facilities, and cultivation status in order to support theAgriculture Drought Monitoring service in Nepal under SERVIR-HKH. The LandCover Survey App is also planned to be used in the coming days to gather feedbackfrom the citizens on the land cover data for the year 2019 for Nepal andBangladesh.
Likewise, a mobile application for disseminating flood-related information hasbeen developed jointly with Flood Forecasting and Warning Center (FFWC) of theBangladesh Water Development Board, Bangladesh (Fig. 13.3). The applicationuses data from SERVIR-HKH’s Streamflow Prediction along with other informa-tion products from the FFWC to provide forecast on the water levels at selecteddischarge stations in Bangladesh.
Fig. 13.3 Mobile application for disseminating flood-related information in Bangladesh
13 Geospatial Information Technology for Information Management … 263
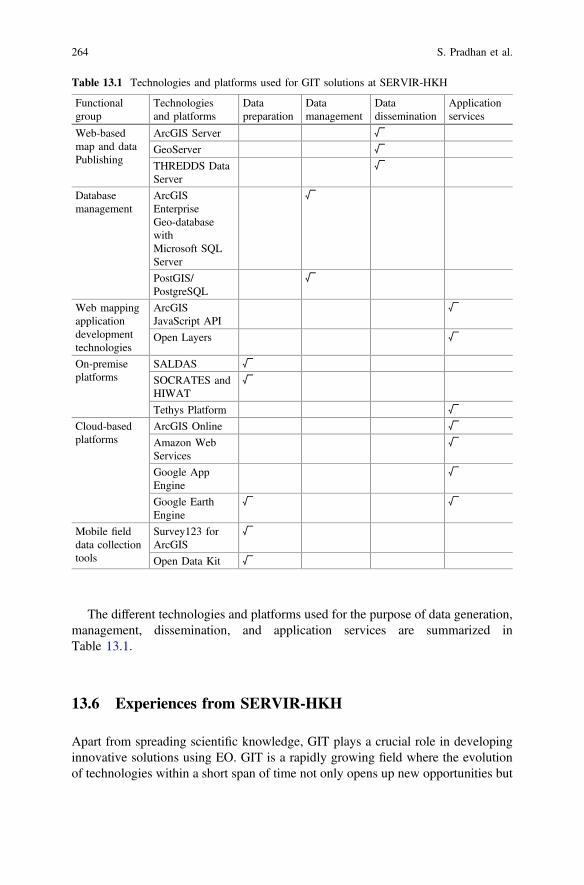
The different technologies and platforms used for the purpose of data generation,management, dissemination, and application services are summarized inTable 13.1.
13.6 Experiences from SERVIR-HKH
Apart from spreading scientific knowledge, GIT plays a crucial role in developinginnovative solutions using EO. GIT is a rapidly growing field where the evolutionof technologies within a short span of time not only opens up new opportunities but
Table 13.1 Technologies and platforms used for GIT solutions at SERVIR-HKH
Functionalgroup
Technologiesand platforms
Datapreparation
Datamanagement
Datadissemination
Applicationservices
Web-basedmap and dataPublishing
ArcGIS Server √
GeoServer √
THREDDS DataServer
√
Databasemanagement
ArcGISEnterpriseGeo-databasewithMicrosoft SQLServer
√
PostGIS/PostgreSQL
√
Web mappingapplicationdevelopmenttechnologies
ArcGISJavaScript API
√
Open Layers √
On-premiseplatforms
SALDAS √
SOCRATES andHIWAT
√
Tethys Platform √
Cloud-basedplatforms
ArcGIS Online √
Amazon WebServices
√
Google AppEngine
√
Google EarthEngine
√ √
Mobile fielddata collectiontools
Survey123 forArcGIS
√
Open Data Kit √
264 S. Pradhan et al.

also influences the efforts made on application development. The emergence ofcloud-based platforms like GEE has enabled the development of applications tocarry out big data analysis on the fly and present the results to the users quickly.There is an increasing trend of using artificial intelligence (AI) and machinelearning algorithms in geospatial and EO applications. SERVIR-HKH has signifi-cantly enhanced the capacity of ICIMOD in terms of GIT infrastructure which hashelped in making great strides towards implementing EO and geospatial solutions.ICIMOD has been making conscious efforts to train its human resources in theseemerging fields and adopt them in various applications. This provides opportunitiesfor executing more robust solutions that cater to the needs of the countries in theHKH region in the coming years. SERVIR-HKH has been providing regulartrainings to staff from the partner institutions on the use of existing as well asemerging technologies which has helped in the co-development of applications andservices. However, one of the major challenges is the limited capacity of thepartners in terms of adequate GIT infrastructure; there is also the problem offrequent transfer of the staff who have been trained by SERVIR-HKH.
Regular monitoring and maintenance are necessary for the smooth operation ofthe applications and services. A number of fully automated systems developed bySERVIR-HKH rely on assimilation of data and on model outputs from globalsystems. In the event of a failure in data acquisition which happens a couple oftimes a year due to technical issues at the data provider’s end, the operationalsystem will not be able to generate information products.
One of the key considerations is the timely maintenance and upgrading of thehardware and software; this plays a crucial role keeping the applications opera-tional. In some instances, the technologies used to develop applications change overtime such that the existing applications need to be upgraded with the latest versionof the software even during the development period. Also, certain applications needto be customized in order to add new functionalities as per requests from thepartners. Further, the server hardware hosting the applications needs to be upgradedafter certain years. Therefore, the provision of adequate financial as well as humanresources is very important for the sustainability of the applications and services.
SERVIR-HKH has greatly benefitted from international collaborations inadopting the emerging technologies and keeping itself up to date with the globaltrends in the development of GIT applications. Co-development and close collab-oration with AST projects have also provided the opportunity to develop the latestinnovative data products and tools which are quite useful to partner agencies in theirdecision-making. Platforms such as SALDAS and Tethys were introduced throughcollaborations with the Applied Science projects. Similarly, partnerships withSERVIR-Mekong, the United States Forest Services (USFS), and Google helped inapplications development using GEE. These collaborations were found to be a veryuseful learning process for all the institutions involved.
The main objective of SERVIR-HKH in developing applications and services isto enable the partners in using EO and geospatial information effectively.SERVIR-HKH has been making concerted efforts to ultimately transfer these
13 Geospatial Information Technology for Information Management … 265
applications to the partner organizations. A good understanding of the usefulness ofthe products and services has had a positive impact in terms of their adoption by thepartners. The use of forest fire detection and monitoring system and streamflowpredictions for flood early warning by national agencies in Nepal and Bangladeshare some of the examples. Further, the Bangladesh Meteorological Department(BMD) has initiated the process to establish the HIWAT system in the organization.
Our experiences show that while smart choices and use of technologies are keyin designing innovative and effective applications to address the users’ needs, thecapacity building of partners and co-development are extremely important foradoption and sustainability of these applications and services. In this context, globalnetworks and partnerships are indispensable to keep abreast of the latest techno-logical advancements and to learn from each other, thereby building synergiesamong the GIT communities.
References
Aydin S, Bay, OB (2009) World conference on educational sciences 2009: building a highperformance computing clusters to use in computing course applications. In: Procedia socialand behavioral sciences, vol 1, pp 2396–2401
Digital Nepal Framework (2019) 2019 digital framework. Government of Nepal Ministry ofCommunication and Information Technology
Goodchild MF, Janelle DG (2010) Toward critical spatial thinking in the social sciences andhumanities. GeoJournal 75(1):3–13. https://doi.org/10.1007/s10708-010-9340-3
Haklay M (2015) Citizen science and policy: a European perspective (PDF). Woodrow WilsonInternational Center for Scholars, p 11. Archived (PDF) from the original on 18 October 2016.Retrieved 3 June 2016
https://dictionary.cambridge.org/dictionary/english/citizen-science. Retrieved 20 September 2020Huang H, Gartner G, Krisp JM, Raubal M, de Weghe NV (2018) Location based services: ongoing
evolution and research agenda. J Location Based Serv 12(2):63–93. https://doi.org/10.1080/17489725.2018.1508763
ITU (2020) Individuals using Internet (% of Population)—South Asia, Nepal, Afghanistan,Bangladesh, Bhutan, Pakistan. World Telecommunication/ICT Indicators Database (database).https://data.worldbank.org/indicator/IT.NET.USER.ZS?locations=8S-AF-BD-BT-NP-PK.Retrieved 27 November 2020
Jackson, M, Schell, D (2009) The evolution of geospatial technology calls for changes ingeospatial research, education and government management, directions magazine, April 7
Jean CC, Rosnay PD, Barbu AL, Boussetta S (2016) Satellite data assimilation: application to thewater and carbon cycles. In: Baghdadi N, Zribi M (eds) Land surface remote sensing incontinental hydrology. Elsevier and ISTE Press Ltd., Netherlands
Liu Z, Foresman T, van Genderen J, Wang L (2019) Understanding digital earth. In: Guo H,Goodchild MF, Annoni A (eds) Manual of digital earth. SpringerOpen, Berlin
Sravanthi G, Grace B, Kamakshamma V (2014) A review of high performance computing. IOSR JComput Eng (IOSR-JCE) 16(1):36–43. e-ISSN: 2278-0661, ISSN: 2278-8727, Ver. VII
Zwartjes L (2018) Developing geospatial thinking learning lines in secondary education: the Gilearner project. Eur Geogr 9(4):138–151
266 S. Pradhan et al.

Open Access This chapter is licensed under the terms of the Creative Commons Attribution 4.0International License (http://creativecommons.org/licenses/by/4.0/), which permits use, sharing,adaptation, distribution and reproduction in any medium or format, as long as you give appropriatecredit to the original author(s) and the source, provide a link to the Creative Commons license andindicate if changes were made.The images or other third party material in this chapter are included in the chapter’s Creative
Commons license, unless indicated otherwise in a credit line to the material. If material is notincluded in the chapter’s Creative Commons license and your intended use is not permitted bystatutory regulation or exceeds the permitted use, you will need to obtain permission directly fromthe copyright holder.
13 Geospatial Information Technology for Information Management … 267

Chapter 14Strengthening the Capacityon Geospatial Information Technologyand Earth Observation Applications
Rajesh Bahadur Thapa, Poonam Tripathi, Mir A. Matin,Birendra Bajracharya, and Betzy E. Hernandez Sandoval
14.1 Introduction
The innovative transformation in geospatial information technology (GIT) andEarth observation (EO) data provides a significant opportunity to study the Earth’senvironment and enables an advanced understanding of natural and anthropogenicimpacts on ecosystems at the local, regional, and global levels (Thapa et al. 2015;Flores et al. 2019; Leibrand et al. 2019; Chap. 1). The major advantages of thesetechnologies can be briefly categorized into five broad areas: multidisciplinary;innovative and emerging; providing platforms for analysis, modelling, and visu-alization; capability to support decision-making; and impact on policies (Shresthaand Bajracharya 2002; Revenga 2005; Thapa et al. 2014; Xia et al. 2014; Nelsonet al. 2019). As such, EO can support solutions by supplying information on trendsvia spatiotemporal monitoring and can also assist in disaster early warning andresponse. On the other hand, GIT can deliver analysis and modelling of potentialresource-related supply-and-demand scenarios, evaluate impacts, and providevisualization to relay information and assist the end users in decision making—allof this would contribute towards achieving the sustainable development goals(Ofori-Amoah 2008; Manfré et al. 2012; Ingole et al. 2015; Scott and Rajabifard2017). Currently, the profound impact of EO and GIT is recognized worldwide,including in the HKH region, where it plays a significant role in monitoring,investigating, and evaluating processes such as land use and land cover change,deforestation, vegetation growth, disaster risk and damage, forest fire, and glacierdynamics in the context of climate resilience (Chap. 1). However, research in theseaspects needs a more robust understanding so as to effectively implement
R. B. Thapa (&) � P. Tripathi � M. A. Matin � B. BajracharyaInternational Centre for Integrated Mountain Development (ICIMOD), Kathmandu, Nepale-mail: [email protected]
B. E. Hernandez SandovalNASA SERVIR Science Coordination Office, Huntsville, AL, USA
© The Author(s) 2021B. Bajracharya et al. (eds.), Earth Observation Science and Applications for RiskReduction and Enhanced Resilience in Hindu Kush Himalaya Region,https://doi.org/10.1007/978-3-030-73569-2_14
269
science-based policies and management processes. The HKH region is an extremelydiverse area; it also hosts the highest mountain range in the world and is known forits highly rugged terrains that pose a daunting challenge of accessibility to collectand manage data and information. It’s here the combination of GIT and EO has animportant role to play—they provide access to remote regions and offer feasibleways to address critical data and information gaps.
That said, the region lacks enough professionals and trained specialists in EOand GIT (Thapa et al. 2019; Chap. 3). The progressive development of thesetechnologies demands rapid support via building capacity through education,training, and developing more professionals and specialists. For this purpose, on theone hand, a strategic framework is required to meet the challenge of providing awell-trained workforce, and on the other, the trained professionals ought to beencouraged to apply their knowledge in various spheres. The SERVIR-HKH pro-gram (Chap. 1) is working on bridging such gaps in the region and aims to:strengthen the ability of governments and other development stakeholders toincorporate EO and GIT into the decision-making process; promote free and openinformation sharing through national and regional platforms and collaborations;develop innovative, user-tailored analyses, decision-support products, and trainingsthat advance scientific understanding; and deliver information to those who need it.Capacity building is one of the key pillars of the SERVIR program. In this chapter,we present SERVIR-HKH’s capacity building approach and its implementation inthe HKH region, as also its achievements and the lessons that have been learntalong the way.
14.2 Capacity Gap in the Region: A Brief Outlook
In order to successfully develop and implement capacity development activities, weneed to understand the basic requirements of the national institutions and the endusers so that they can utilize and apply such knowledge in the decision-makingprocess. The emergence and advancement in technologies and their innovativeapplications also generate certain capacity building needs. In this regard, variousconsultation workshops have been organized by SERVIR-HKH in Afghanistan,Bangladesh, Nepal, and Pakistan (Chap. 3). During these consultation workshops,the participants were asked a set of guiding questions on data, capacity, and servicesrelated to their countries. The feedback from the groups were summarized, asses-sed, and ranked on a priority basis. The basic priorities, requirements, and gapswere identified in terms of: data and knowledge; capacity gap and gender disparity;and lack of institutional and technical capacities. The data and knowledge gapsgenerally pointed to the lack of human resources, geospatial capacity, infrastructure,and data availability. The capacity gap in terms of EO and GIT in the HKH is largedue to the lack of an appropriate strategy to sustain long-term projects; this leads tochallenges in maintaining and improving the infrastructure, updating geospatialdata, and in strengthening human resources after the completion of projects (Thapa
270 R. B. Thapa et al.
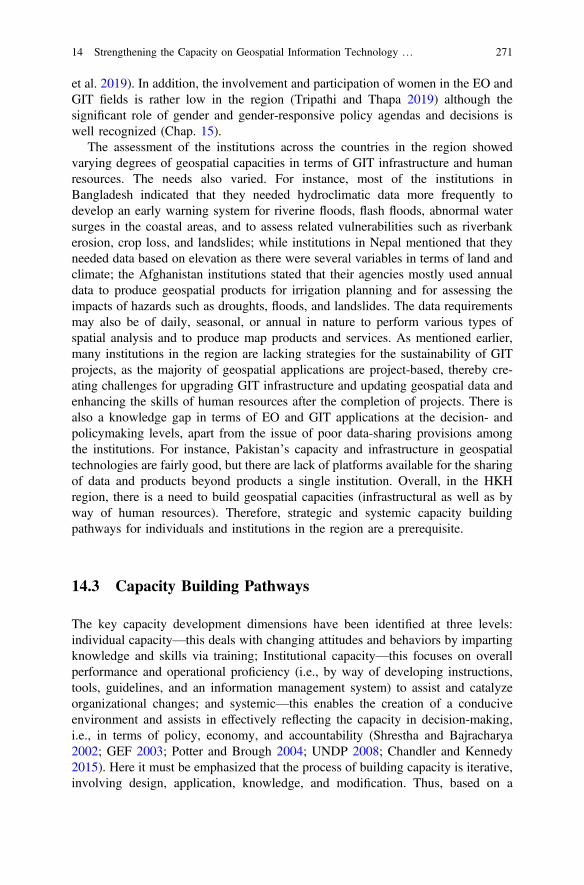
et al. 2019). In addition, the involvement and participation of women in the EO andGIT fields is rather low in the region (Tripathi and Thapa 2019) although thesignificant role of gender and gender-responsive policy agendas and decisions iswell recognized (Chap. 15).
The assessment of the institutions across the countries in the region showedvarying degrees of geospatial capacities in terms of GIT infrastructure and humanresources. The needs also varied. For instance, most of the institutions inBangladesh indicated that they needed hydroclimatic data more frequently todevelop an early warning system for riverine floods, flash floods, abnormal watersurges in the coastal areas, and to assess related vulnerabilities such as riverbankerosion, crop loss, and landslides; while institutions in Nepal mentioned that theyneeded data based on elevation as there were several variables in terms of land andclimate; the Afghanistan institutions stated that their agencies mostly used annualdata to produce geospatial products for irrigation planning and for assessing theimpacts of hazards such as droughts, floods, and landslides. The data requirementsmay also be of daily, seasonal, or annual in nature to perform various types ofspatial analysis and to produce map products and services. As mentioned earlier,many institutions in the region are lacking strategies for the sustainability of GITprojects, as the majority of geospatial applications are project-based, thereby cre-ating challenges for upgrading GIT infrastructure and updating geospatial data andenhancing the skills of human resources after the completion of projects. There isalso a knowledge gap in terms of EO and GIT applications at the decision- andpolicymaking levels, apart from the issue of poor data-sharing provisions amongthe institutions. For instance, Pakistan’s capacity and infrastructure in geospatialtechnologies are fairly good, but there are lack of platforms available for the sharingof data and products beyond products a single institution. Overall, in the HKHregion, there is a need to build geospatial capacities (infrastructural as well as byway of human resources). Therefore, strategic and systemic capacity buildingpathways for individuals and institutions in the region are a prerequisite.
14.3 Capacity Building Pathways
The key capacity development dimensions have been identified at three levels:individual capacity—this deals with changing attitudes and behaviors by impartingknowledge and skills via training; Institutional capacity—this focuses on overallperformance and operational proficiency (i.e., by way of developing instructions,tools, guidelines, and an information management system) to assist and catalyzeorganizational changes; and systemic—this enables the creation of a conduciveenvironment and assists in effectively reflecting the capacity in decision-making,i.e., in terms of policy, economy, and accountability (Shrestha and Bajracharya2002; GEF 2003; Potter and Brough 2004; UNDP 2008; Chandler and Kennedy2015). Here it must be emphasized that the process of building capacity is iterative,involving design, application, knowledge, and modification. Thus, based on a
14 Strengthening the Capacity on Geospatial Information Technology … 271
situational analysis of the HKH region and acknowledging the lessons that werelearnt, the ADIM approach was developed, which addresses Assessment, Design,Implementation, and Monitoring (Thapa et al. 2019). This is briefly presented inFig. 14.1.
14.3.1 Capacity Assessment
As capacity needs differ among various institutions at the regional and nationallevels, it is essential to assess the existing capacity and future needs to determine thepriorities at various levels in order to design effective plans. It can be characterizedas analyzing the preferred capacity compared to the existing one and offeringsystematic methods to gather critical information and data on the capacity resourcesand needs. This is the pillar of any capacity development formulation that addressesthe demands and needs to strengthen and optimize the existing capacity; it therefore
Fig. 14.1 Capacity building framework within SERVIR-HKH
272 R. B. Thapa et al.

incorporates such steps as mobilization and design, conduct and summarization,and then interprets the assessment results. So, various country consultation work-shops were organized along these lines during the years 2015 and 2016 inAfghanistan, Pakistan, Bangladesh, and Nepal. These workshops helped in thesystematic assessment of gaps, needs and priorities, as well as evaluated thecapacities of each country (Chap. 3). These gaps and needs were subsequentlygrouped into the four major thematic areas of SERVIR: agriculture and foodsecurity (AFS); land use, land cover, and ecosystems (LULC&E); water resourcesand hydro-climatic disasters (WRHD); and weather and climate services (WCS).This assessment process played a significant role in promoting active userengagement, ongoing partnerships, and in identifying more engagements andpartners; it also served as an input for our capacity development pathways.
14.3.2 Capacity Building Design
The appropriate designing of capacity building interventions is crucial during theformulation phase. The emphasis here is on strategic thinking based on innovationsto ensure that the implementation methodology is more progressive and effectivewith an adaptive vision to utilize emerging technologies such as SAR, GEE,machine learning, cloud computing, and open access tools. After the assessmentprocess, the key design considerations involve priority issues, key opportunities,sequenced activities, and a realistic selection of activities. For this purpose, con-sultations were held with the subject matter experts (SMEs) and the priority issueswere selected as part of the implementation aspect. Four major types of capacitybuilding activities were identified which would enhance the individual, institu-tional, and systemic capacities at national and regional levels: on-the-job training(OJT); standard training (ST); training of trainers (ToT); and exposure and learning(EL). The OJT and ToT exercises were considered as institutional capacity buildingactivities, while the other two were seen as individual capacity building activities(Thapa et al. 2019).
The OJT activities were semi-structured, focusing on enhancing the capacity ofpartner institutions to develop, operate, and maintain specific applications andservices. They had been designed keeping in mind the background knowledge andskills of the participants who then worked with the SMEs on a rotational basis andlearnt how to carry out certain tasks. Upon completion of the training (a period ofone to two weeks), the participants were assigned to work independently on thetarget applications that needed to be completed in a certain time period. The ToTswere focused on training the teaching staff and were aimed at institutional capacitybuilding in order to reach out to more participants via academic institutions. Thistraining lay emphasis on content, skills, knowledge, and effective communicationand presentation skills; it also got the participants to develop exercises and refinethe materials with local data. The ST module focused on general GIT and EOperspectives and their applications on specific subjects; this module saw the
14 Strengthening the Capacity on Geospatial Information Technology … 273
participation of professionals from diverse fields. The EL segment impartedawareness on recent developments and applications in GIT and EO and alsoexplained the benefits and prospects of these technologies. All these short-termtrainings were primarily targeted at career-seeking youngsters and senior managersfor exposure; they were thus exposed to academic and technical exchanges duringprofessional conferences, workshops, and competitions. SERVIR-HKH alsoworked closely with the thematic SMEs to design a curriculum that incorporatedaspects such as learning objectives, expected outcomes, target audience, and dailyagenda. Besides, the development of various theoretical and practical materials,including training modules, manuals, reading materials, hands-on exercises, andPPTs, were part of this phase.
14.3.3 Implementing Capacity Building Activities
This phase of the ADIM approach refers to the execution of the capacity buildingactivities wherein the four modules of ToT, OJT, ST, and EL were offered to theparticipants. They were then divided into three categories: policymakers/decisionmakers; technical professionals; and youth. The policymakers and decision makersformed the top level of the hierarchy; they represented leadership and were the oneswho could influence the capacity of GIT and EO services in partner institutions. Thetechnical professionals represented the middle level of the hierarchy and would bemostly involved in the development of databases and in the application of GIT andEO in different thematic areas; so, they were the one who would prepare the productsto be used by the leaders. The youth, while representing the lower level of thehierarchy, were nevertheless accorded high importance since they were the ones whoneeded to be aware and convinced of the recent technology; they were the ones whowould be able to forge networks during climate emergencies (Thapa et al. 2019).
Meanwhile, various national- and regional-level collaborative activities tookplace in capacity building in partnership with local institutions of partner countriesand the private sector. In line with ICIMOD’s Midterm Action Plan-IV (MTAP-IV)for 2018–2022, SERVIR-HKH has been aiming to overcome the persistent genderinequalities in all sectors by identifying these inequalities and the gaps inaddressing them; it has been proactive in redressing the discriminatory social andgender norms and has also been tackling the practices, attitudes, and power rela-tions that help in the prevalence of such norms. (A more elaborate account ofSERVIR-HKH’s gender-inclusion strategies is discussed in Chap. 15.) In a nut-shell, in terms of capacity building, ICIMOD has been focusing on the followingareas: providing training on the methods and tools for gender-disaggregated datacollection and analysis; enhancing the tools of gender analysis; building women’sleadership by proactively including them in equal numbers in trainings, workshops;encouraging young women professionals and students to take to this discipline;fostering “gender champions” in SERVIR-HKH; and collaboratively developingand testing services with the targeted groups.
274 R. B. Thapa et al.

14.3.4 Monitoring and Evaluating the Impact of CapacityBuilding Activities
Fundamentally, monitoring and evaluation (M&E) is the measurement that helps tointerpret the performance of capacity building approaches; it takes into consider-ation such aspects as design, implementation, learning, performance, and the impactof capacity building pathways. And while monitoring implies an ongoing mea-surement, evaluation is a periodic measurement (Ortiz and Taylor 2009; Chap. 18).In the area of capacity building and its effectiveness, M&E gives priority to thefollowing two points: clarity of purpose, i.e., for what, why, and for whom; thenature of the information that is required and choose the way in which data have tobe collected—for example, by way of a well-conceived and targeted surveyquestionnaire. The M&E process pays attention to both short- and long-termindicators; while the short-term indicators give insights into specific actions andsteps and show whether a particular capacity building effort has worked or not, thelong-term ones seek to describe the results of a particular capacity building activityover a period of time.
Long-term monitoring under the SERVIR-HKH program follows the Planning,Monitoring, Evaluation, and Learning (PMEL) framework based on the Theory ofChange (ToC) and Participatory Impact Pathway Analysis (PIPA) (Chap. 18). Asfor short-term monitoring, it looks at the capacity that has already been built; here,pre- and post-assessment surveys are conducted for each activity (excludingexposure and learning) in order to gauge the participant’s expectations, skills, andknowledge, and also to get their feedback on improving the approach. For thispurpose, pre- and post-training evaluation surveys were conducted so as to knowwhether the participants had improved their knowledge and skills in the subjectmatter. The surveys were composed of three different sections: basic informationand expectations from the participants (pre-assessment) and the relevance of thetraining for different topics (post-assessment); the incorporation of scientificknowledge—this related to self-assessment of the basic knowledge on the subjectand assessing the technical skills related to the subject; and feedback and reflection,wherein the responses were mapped via four levels of knowledge and skills—“Low/No”, “Basic”, “Intermediate/Relatively High”, and “Advanced/High”.
14.4 Mapping the Impact Pathways
Mapping the impact of capacity building activities is a key indicator of successfulimplementation; it provides a means to map the direct and indirect cause-and-effectlinkages. Figure 14.2 presents the impact pathway of the ADIM approach andshows significant capacity development in the HKH region. This is briefly dis-cussed below.
14 Strengthening the Capacity on Geospatial Information Technology … 275

14.4.1 Training Modules, Contents and Materials
Based on the needs assessment and country consultation workshops, an elaboratedevelopment of the capacity building modules under the four thematic areas wascarried out (Table 14.1). In addition to these four thematic areas, the common needsand priorities of all the countries were captured under a crosscutting theme. InSERVIR-HKH Phase II, all the topics under the thematic areas were secured within27 distinct modules and were used to deliver capacity building training during theyears 2016, 2017, 2018, and 2019. These modules covered theoretical and hands-onknowledge on subjects such as climate data analysis, land use, land cover, crops,glacier mapping and monitoring, hydrological modelling, advanced RS and GITapplications, and WebGIS application development. Overall, five modules were
Fig. 14.2 The capacity building impact framework
276 R. B. Thapa et al.
designed under AFS themes, serving two for OJT and three for ST; twelve moduleswere designed under WRHD and LULC&E themes, including one each for OJTand ToT respectively. The WCS themes consisted of only one module owing to asingle service (i.e., SALDAS), while the crosscutting themes incorporated ninedistinct modules serving six for ST, one each for OJT and ToT, and two forexposure and learning activities.
14.4.2 Strengthening Institutional and Individual Capacity
During the past four years, SERVIR-HKH has organized 62 capacity buildingevents in the HKH region (Table 14.2). Overall, 1354 participants benefited fromthese activities, including professionals, policymakers, decision makers, and youth,representing 290 distinct institutions in the region and beyond. The participantsrepresented various government ministries, organizations, institutions, localdepartments and offices, research centers, academic institutions, the private sector,and INGOs and NGOs. The breakdown of the events goes thus: one in 2016; 19each in 2017 and 2018; and 23 in 2019. Among them, five each were under TOTand OJT; eight under the exposure and learning segment; and 44 under ST.Although the number of OJT and ToT events were less during the four years, yetthey were effective in strengthening the institutional capacity of the partner orga-nizations as these were targeted at specific applications for setting up self-managedinformation systems to meet organizational requirements. The OJTs were focusedon professionals of partner institutions from Bangladesh, Afghanistan, and Nepal;and these trainings dealt with glacial lake mapping, drought mapping and moni-toring, and WebGIS development. As for the ToTs, they helped to enable thetrainers to conduct independent courses and transfer the knowledge to a wideraudience.
The SERVIR program has successfully trained professionals and faculties fromvarious institutions in three countries: Nepal’s Agriculture and Forestry University,Kathmandu University, Tribhuvan University, and Pokhara University;Afghanistan’s Kabul University; and Bangladesh’s Jahangirnagar University. Thebroad topics and theories that were covered included advancement in the applica-tions of GIT and EO in water resource management, the application of SAR, andbig data analysis using GEE. At present, the OJT and TOT segments are serving asthe core part of the capacity development activities in the region which are to betaken forward and replicated by the partners and professionals in the respectivecountries. For example, Kabul University, independently and in collaboration, hasorganized nearly 10 trainings on the topics of land cover mapping and monitoring,and water resource management (Box 14.1), while the Pashchimanchal Campus ofTribhuvan University organized a training in 2019 on SAR and GEE for thegraduating students. Similarly, Jahangirnagar University organized a training inGEE in Dhaka in 2019.
14 Strengthening the Capacity on Geospatial Information Technology … 277
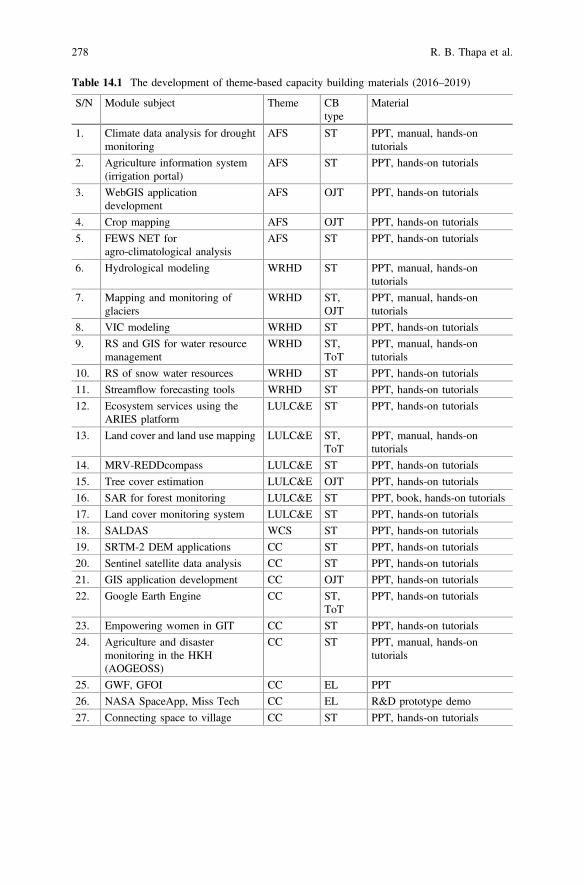
Table 14.1 The development of theme-based capacity building materials (2016–2019)
S/N Module subject Theme CBtype
Material
1. Climate data analysis for droughtmonitoring
AFS ST PPT, manual, hands-ontutorials
2. Agriculture information system(irrigation portal)
AFS ST PPT, hands-on tutorials
3. WebGIS applicationdevelopment
AFS OJT PPT, hands-on tutorials
4. Crop mapping AFS OJT PPT, hands-on tutorials
5. FEWS NET foragro-climatological analysis
AFS ST PPT, hands-on tutorials
6. Hydrological modeling WRHD ST PPT, manual, hands-ontutorials
7. Mapping and monitoring ofglaciers
WRHD ST,OJT
PPT, manual, hands-ontutorials
8. VIC modeling WRHD ST PPT, hands-on tutorials
9. RS and GIS for water resourcemanagement
WRHD ST,ToT
PPT, manual, hands-ontutorials
10. RS of snow water resources WRHD ST PPT, hands-on tutorials
11. Streamflow forecasting tools WRHD ST PPT, hands-on tutorials
12. Ecosystem services using theARIES platform
LULC&E ST PPT, hands-on tutorials
13. Land cover and land use mapping LULC&E ST,ToT
PPT, manual, hands-ontutorials
14. MRV-REDDcompass LULC&E ST PPT, hands-on tutorials
15. Tree cover estimation LULC&E OJT PPT, hands-on tutorials
16. SAR for forest monitoring LULC&E ST PPT, book, hands-on tutorials
17. Land cover monitoring system LULC&E ST PPT, hands-on tutorials
18. SALDAS WCS ST PPT, hands-on tutorials
19. SRTM-2 DEM applications CC ST PPT, hands-on tutorials
20. Sentinel satellite data analysis CC ST PPT, hands-on tutorials
21. GIS application development CC OJT PPT, hands-on tutorials
22. Google Earth Engine CC ST,ToT
PPT, hands-on tutorials
23. Empowering women in GIT CC ST PPT, hands-on tutorials
24. Agriculture and disastermonitoring in the HKH(AOGEOSS)
CC ST PPT, manual, hands-ontutorials
25. GWF, GFOI CC EL PPT
26. NASA SpaceApp, Miss Tech CC EL R&D prototype demo
27. Connecting space to village CC ST PPT, hands-on tutorials
278 R. B. Thapa et al.
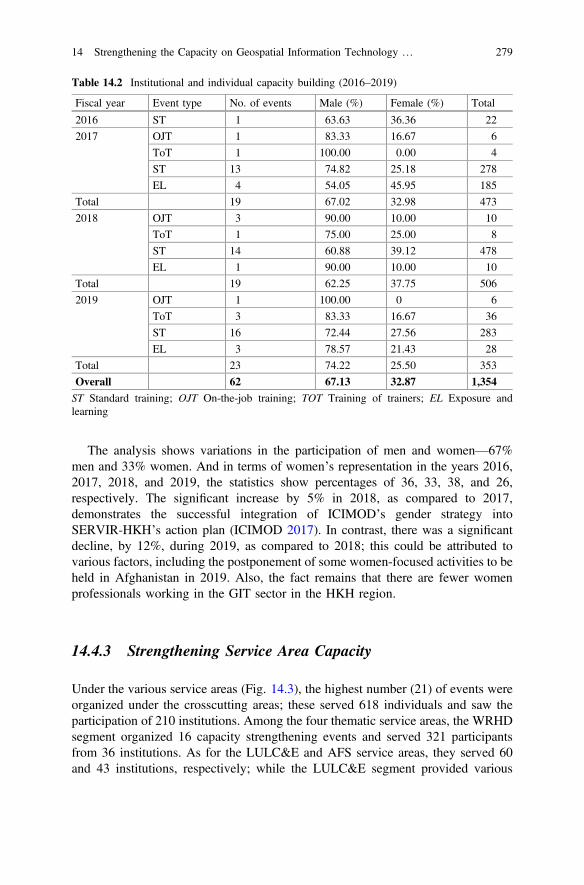
The analysis shows variations in the participation of men and women—67%men and 33% women. And in terms of women’s representation in the years 2016,2017, 2018, and 2019, the statistics show percentages of 36, 33, 38, and 26,respectively. The significant increase by 5% in 2018, as compared to 2017,demonstrates the successful integration of ICIMOD’s gender strategy intoSERVIR-HKH’s action plan (ICIMOD 2017). In contrast, there was a significantdecline, by 12%, during 2019, as compared to 2018; this could be attributed tovarious factors, including the postponement of some women-focused activities to beheld in Afghanistan in 2019. Also, the fact remains that there are fewer womenprofessionals working in the GIT sector in the HKH region.
14.4.3 Strengthening Service Area Capacity
Under the various service areas (Fig. 14.3), the highest number (21) of events wereorganized under the crosscutting areas; these served 618 individuals and saw theparticipation of 210 institutions. Among the four thematic service areas, the WRHDsegment organized 16 capacity strengthening events and served 321 participantsfrom 36 institutions. As for the LULC&E and AFS service areas, they served 60and 43 institutions, respectively; while the LULC&E segment provided various
Table 14.2 Institutional and individual capacity building (2016–2019)
Fiscal year Event type No. of events Male (%) Female (%) Total
2016 ST 1 63.63 36.36 22
2017 OJT 1 83.33 16.67 6
ToT 1 100.00 0.00 4
ST 13 74.82 25.18 278
EL 4 54.05 45.95 185
Total 19 67.02 32.98 473
2018 OJT 3 90.00 10.00 10
ToT 1 75.00 25.00 8
ST 14 60.88 39.12 478
EL 1 90.00 10.00 10
Total 19 62.25 37.75 506
2019 OJT 1 100.00 0 6
ToT 3 83.33 16.67 36
ST 16 72.44 27.56 283
EL 3 78.57 21.43 28
Total 23 74.22 25.50 353
Overall 62 67.13 32.87 1,354ST Standard training; OJT On-the-job training; TOT Training of trainers; EL Exposure andlearning
14 Strengthening the Capacity on Geospatial Information Technology … 279

trainings to 260 individuals, the AFS segment catered to 115 individuals. Thelowest number of activities was recorded by the WCS service, which tended to 11institutions and their 40 professionals. Among the participants, the gender gap wasfound to be wider in the AFS and WRHD (<20% of female participants) segmentsas compared to the LULC&E and WCS service areas; this was despite severalefforts and measures being taken to bring in more women participants to thetraining programs. Here, it has to be noted that the participants in these service areaswere selected based on institutional nominations and that these institutions haveless women professionals working in them. Interestingly, the crosscutting areas hadthe best gender balance, with the participation rate of women at 48%; this mighthave been because some of the events in the crosscutting areas were open to all whomet the minimum criterion and they did not require nominations.
14.4.4 Capacity Building Outreach to Institutionsand Country
Although the major capacity building events were focused on Afghanistan,Bangladesh, Nepal, and Pakistan under the SERVIR-HKH program, the other fourregional member countries of ICIMOD (Myanmar, Bhutan, China, and India) and20 other countries also benefited from the capacity building activities (Table 14.3).Out of the total 62 events, Nepal participated in 36, followed by Afghanistan in 28,Bangladesh in 19, Pakistan in 11, Bhutan in nine, and India and Myanmar in eighteach. Other countries, too, participated significantly in 16 events, sending 76
Fig. 14.3 Service area-based capacity building events. Note: The number displayed over each bardepicts total number participants
280 R. B. Thapa et al.
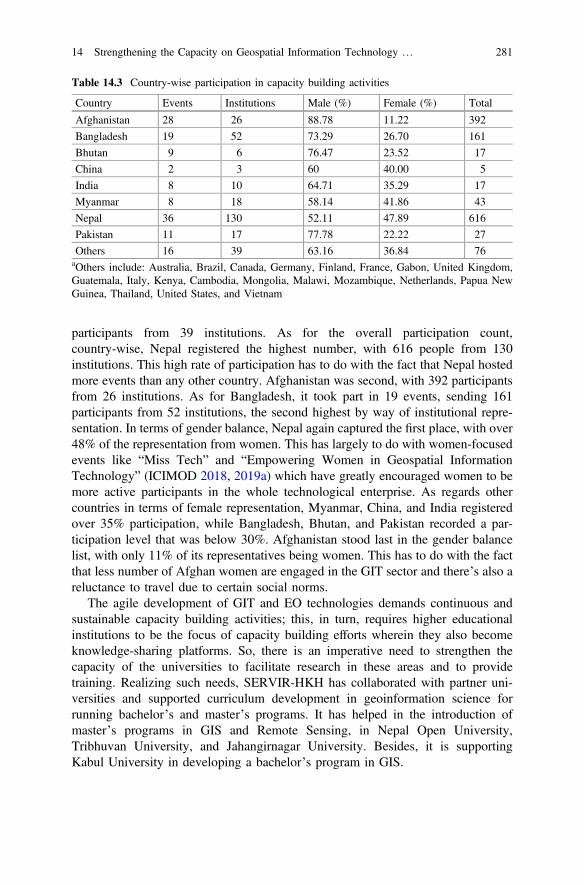
participants from 39 institutions. As for the overall participation count,country-wise, Nepal registered the highest number, with 616 people from 130institutions. This high rate of participation has to do with the fact that Nepal hostedmore events than any other country. Afghanistan was second, with 392 participantsfrom 26 institutions. As for Bangladesh, it took part in 19 events, sending 161participants from 52 institutions, the second highest by way of institutional repre-sentation. In terms of gender balance, Nepal again captured the first place, with over48% of the representation from women. This has largely to do with women-focusedevents like “Miss Tech” and “Empowering Women in Geospatial InformationTechnology” (ICIMOD 2018, 2019a) which have greatly encouraged women to bemore active participants in the whole technological enterprise. As regards othercountries in terms of female representation, Myanmar, China, and India registeredover 35% participation, while Bangladesh, Bhutan, and Pakistan recorded a par-ticipation level that was below 30%. Afghanistan stood last in the gender balancelist, with only 11% of its representatives being women. This has to do with the factthat less number of Afghan women are engaged in the GIT sector and there’s also areluctance to travel due to certain social norms.
The agile development of GIT and EO technologies demands continuous andsustainable capacity building activities; this, in turn, requires higher educationalinstitutions to be the focus of capacity building efforts wherein they also becomeknowledge-sharing platforms. So, there is an imperative need to strengthen thecapacity of the universities to facilitate research in these areas and to providetraining. Realizing such needs, SERVIR-HKH has collaborated with partner uni-versities and supported curriculum development in geoinformation science forrunning bachelor’s and master’s programs. It has helped in the introduction ofmaster’s programs in GIS and Remote Sensing, in Nepal Open University,Tribhuvan University, and Jahangirnagar University. Besides, it is supportingKabul University in developing a bachelor’s program in GIS.
Table 14.3 Country-wise participation in capacity building activities
Country Events Institutions Male (%) Female (%) Total
Afghanistan 28 26 88.78 11.22 392
Bangladesh 19 52 73.29 26.70 161
Bhutan 9 6 76.47 23.52 17
China 2 3 60 40.00 5
India 8 10 64.71 35.29 17
Myanmar 8 18 58.14 41.86 43
Nepal 36 130 52.11 47.89 616
Pakistan 11 17 77.78 22.22 27
Others 16 39 63.16 36.84 76aOthers include: Australia, Brazil, Canada, Germany, Finland, France, Gabon, United Kingdom,Guatemala, Italy, Kenya, Cambodia, Mongolia, Malawi, Mozambique, Netherlands, Papua NewGuinea, Thailand, United States, and Vietnam
14 Strengthening the Capacity on Geospatial Information Technology … 281

14.4.5 Focus on Women and Underprivileged Communities
Despite the profound infiltration of GIT and EO in its planning anddecision-making processes, the concepts are still rudimentary or nonexistent inschool education across the HKH region. A lack of skilled human resources andinstitutional capacities and gaps in communication hinder schoolteachers fromintroducing these concepts and their applications to students. In this regard, in 2019,SERVIR-HKH introduced a novel capacity building program called “ConnectingSpace to Village” to address the needs of the village communities. Under thistheme, it organized a teachers’ training program in 2019 which focused onimparting GIT knowledge to the local communities. This event brought together 19high-schoolteachers from nine schools located in different parts of Nepal; thespecific aim was to train these teachers on the use of SERVIR-HKH EO and GITapplication services and data so that they could transfer this knowledge to schoolstudents and the local communities.
As regards having a gender-balanced workforce in the region, SERVIR-HKHhas initiated a specially designed capacity building program for targeted groups ofyoung and early career women of Nepal. This program was held in 2018 and 2019and brought together young women from different backgrounds. These events sawtheoretical and hands-on exercises on the use of EO and GIT which covered a rangeof topics, including the four thematic service areas of SERVIR. The replication ofthis initiative is now being sought by Bangladesh, Afghanistan, and Pakistan. And,as previously mentioned, ICIMOD also supported the holding of “Miss Tech 2017”in Kathmandu, a major national competition aimed at promotingtechno-entrepreneurship among women; the theme of this particular event was“Transformational Changes through Technology”. Such initiatives have not onlyhelped women in starting and navigating their geospatial careers but also gearedthem towards providing leadership in the field of GIT.
14.4.6 Monitoring and Evaluation of Capacity BuildingActivities
For the evaluation of the capacity building activities, we targeted short-termmonitoring to assess the knowledge gained by the participants; it also evaluated thesuccess and shortcomings of the implementation procedure. This gave a broadpicture about the experience of the participants. An evaluation response case as anexample is presented here from a training on “Introductory Course on SyntheticAperture Radar”, which aimed to provide theoretical and practical knowledge onSAR data and its applications for crop monitoring in Afghanistan. The training,delivered by two resource persons from ICIMOD, was attended by 10 professionalsfrom three institutions in Afghanistan. This seven-day training covered the fol-lowing aspects: image formation; polarimetric SAR; backscattering mechanisms;
282 R. B. Thapa et al.
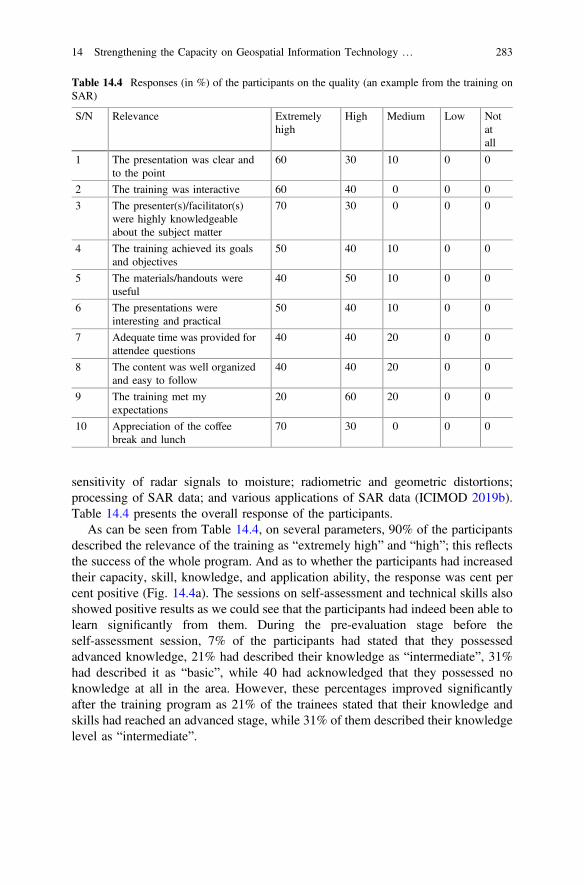
sensitivity of radar signals to moisture; radiometric and geometric distortions;processing of SAR data; and various applications of SAR data (ICIMOD 2019b).Table 14.4 presents the overall response of the participants.
As can be seen from Table 14.4, on several parameters, 90% of the participantsdescribed the relevance of the training as “extremely high” and “high”; this reflectsthe success of the whole program. And as to whether the participants had increasedtheir capacity, skill, knowledge, and application ability, the response was cent percent positive (Fig. 14.4a). The sessions on self-assessment and technical skills alsoshowed positive results as we could see that the participants had indeed been able tolearn significantly from them. During the pre-evaluation stage before theself-assessment session, 7% of the participants had stated that they possessedadvanced knowledge, 21% had described their knowledge as “intermediate”, 31%had described it as “basic”, while 40 had acknowledged that they possessed noknowledge at all in the area. However, these percentages improved significantlyafter the training program as 21% of the trainees stated that their knowledge andskills had reached an advanced stage, while 31% of them described their knowledgelevel as “intermediate”.
Table 14.4 Responses (in %) of the participants on the quality (an example from the training onSAR)
S/N Relevance Extremelyhigh
High Medium Low Notatall
1 The presentation was clear andto the point
60 30 10 0 0
2 The training was interactive 60 40 0 0 0
3 The presenter(s)/facilitator(s)were highly knowledgeableabout the subject matter
70 30 0 0 0
4 The training achieved its goalsand objectives
50 40 10 0 0
5 The materials/handouts wereuseful
40 50 10 0 0
6 The presentations wereinteresting and practical
50 40 10 0 0
7 Adequate time was provided forattendee questions
40 40 20 0 0
8 The content was well organizedand easy to follow
40 40 20 0 0
9 The training met myexpectations
20 60 20 0 0
10 Appreciation of the coffeebreak and lunch
70 30 0 0 0
14 Strengthening the Capacity on Geospatial Information Technology … 283
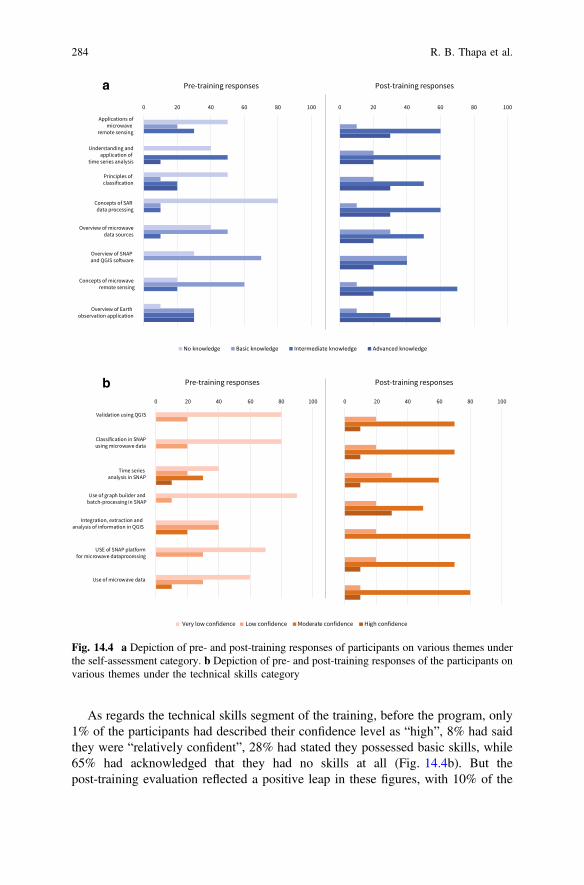
As regards the technical skills segment of the training, before the program, only1% of the participants had described their confidence level as “high”, 8% had saidthey were “relatively confident”, 28% had stated they possessed basic skills, while65% had acknowledged that they had no skills at all (Fig. 14.4b). But thepost-training evaluation reflected a positive leap in these figures, with 10% of the
a
b
Fig. 14.4 a Depiction of pre- and post-training responses of participants on various themes underthe self-assessment category. b Depiction of pre- and post-training responses of the participants onvarious themes under the technical skills category
284 R. B. Thapa et al.

trainees saying that their confidence level was high, while 60% stated that theirconfidence level had improved. More remarkably, approximately 65% of the par-ticipants who had come to the training without any skills stated that after thetraining, they had acquired basic knowledge and that their confidence level wasbetter.
14.5 Challenges and Opportunities
In this chapter, we have presented the approach that has been adopted for buildingthe capacity of individuals and organizations in EO and GIT applications in theHKH region; we have mentioned that, over the last four years, we conducted 62events successfully in this area of capacity building. Some institutional successstories, such as establishing a GIS Lab, preparing a glacier data inventory, andmany more are documented in http://servir.icimod.org/stories. However, there areseveral challenges ahead; there are also several opportunities that are waiting to betapped (Table 14.5).
Box 14.1. A snapshot of institutional capacity building activities in Afghanistan
14 Strengthening the Capacity on Geospatial Information Technology … 285

Table 14.5 Key challenges and opportunities
Challenges Opportunities
Collaboration with stakeholders• Bringing key stakeholders to countryconsultations and prioritizing capacityneeds
• Getting policy-level personnel to providewider inputs on gaps and needs
• Bringing stakeholders closer and engagingin the assessment of capacity building gapsand needs
• Preparing a priority list to design activitiesand implementation
Emerging EO and GIT techniques• Frequent updating of the capacity ofindividuals and institutions
• New curriculum, materials, and programson capacity building
• Resource stress and lack of availability ofappropriate SMEs
• Cost-effective choices on:– Training material development and
implementing capacity building activities– Availability of open-access tools and
data for individuals and institutions• Acquiring cutting-edge expert knowledgeby engaging SMEs
Capacity building events• Irrelevant nominations for highly technicaltrainings
• Difficulties in ensuring gender balance• Geopolitical tension among the regionalmember countries
• Enabling a variety of people—from youth toprofessionals and technicians—to set policyagendas for the larger benefit of societyMultiplying the effects of learning, addingvalue to knowledge, and instilling a greatersense of ownership among the stakeholders
Women’s participation• Less women professionals in the EO GITfields
• Social and religious obligations hinderingwomen’s participation
• Designing women-focused capacitybuilding programs
• Nurturing a gender-balanced workforce
Monitoring and evaluationParticipants’ reluctance to provide trueresponses and a lack of motivation to respondto survey questionnaires
• Understanding the expectations and learningfrom the achievements
• Tracing the impact of an activity and takingthe necessary measures to improve it
Sustainability• Staff turnover at partner institutions• Problem in the continuation of services andplans because of the finite nature of projects
• Ensuring an overlap between outgoing andincoming staff, and transferring knowledgeto retain capacity
• Conducting periodic refresher trainings tobring the new staff up to the mark
• Engaging with the senior management topromote the utilization of the newknowledge for decision-making
Others• Language barrier• Retaining professionals for long term
• Interacting with people from diverse socialbackgrounds
• Forging stronger partnerships andprofessional networks
286 R. B. Thapa et al.

14.6 Conclusion and Way Forward
Increasing the influence and potential of EO data and GIT for making geographicallyinformed decisions in resource planning has been a much sought-after goal in theHKH region. The rapid developments and new paradigms on EO and GIT appli-cations, the lack of skilled human resources and institutional capacities in the regiondemand robust capacity building activities to reap the benefits of these applications.This chapter has presented in detail the ADIM—assessment, design, implementa-tion, and monitoring—framework adopted by SERVIR-HKH in strengtheningcapacity enhancing activities. Through this approach, we have been able to identifythe gaps and needs, design efficient capacity building programs, implement plans toachieve lasting impacts, and monitor the results. In this regard, we have not onlyengaged with subject matter experts but also decision makers for the efficientapplication of these frontier technologies. We have also given priority to genderequity. While the challenges have been aplenty, our programs such as ToT, OJT, ST,and EL have played an instrumental and significant role in strengthening thecapacities of individuals from all levels as well as institutions and organizations onthe use of these emerging technologies. We have also integrated the M&E approachto gather regular feedback, thereby improving the overall quality of the capacitybuilding ventures. We believe that by sharing our experiences, we are widening theknowledge pool for the capacity building practitioners in the HKH region andbeyond. However, there is a lot more that needs to be done in this vital area ofcapacity building. In the upcoming years, the following areas could be looked at:
• Applying uniform formats for training manuals and materials among the serviceareas;
• Conducting virtual trainings and organizing distance learning capacity buildingevents through digital platforms such as Microsoft Teams, Zoom. AWS Cloud,and edX;
Box 14.2. Adoption of online capacity building activities
14 Strengthening the Capacity on Geospatial Information Technology … 287

• Developing a web portal with self-learning training materials which will notonly help enhance the capacities in the region but also beyond;
• Prioritizing the use of open-source GIS/RS software; and• Conducting regular organizational capacity assessments and tracer surveys to
monitor the impacts of the capacity building efforts and to identify the emergingneeds in the region.
References
Chandler J, Kennedy KS (2015) A network approach to capacity building. National Council ofNonprofits, Washington, DC. Available online at: www.councilofnonprofits.org
Flores A, Herndon K, Thapa RB, Cherrington E (eds) (2019) SAR handbook: comprehensivemethodologies for forest monitoring and biomass estimation. NASA Publication. https://doi.org/10.25966/nr2c-s697, 307 pages
GEF (Global Environment Facility) (2003) Strategic approach to enhance capacity building. GEFICIMOD (2017) Fourth medium-term action plan 2018–2022. Available online at: https://www.
icimod.org/resource/30287. Accessed 30 May 2019ICIMOD (2018) Empowering women in GIT. Training report, Kathmandu, Nepal, 25–28 June
2018ICIMOD MTAP-IV Medium-Term Action Plan (2018–2022)ICIMOD (2019a) Empowering women in GIT. Training report, Kathmandu, Nepal, 25–28 June
2019ICIMOD (2019b) Introductory course on synthetic aperture radar. Training report, Delhi, India,
15-21 April 2019Ingole NA, Ram RN, Ranjan R, Shankhwar AK (2015) Advance application of geospatial
technology for fisheries perspective in Tarai region of Himalayan state of Uttarakhand. SustainWater Res Manag 1(2):181–187. International Disaster Database: www.cred.be
Leibrand A, Thomas A, Sadoff N, Maslak T (2019) Using Earth observations to help developingcountries improve access to reliable, sustainable and modern energy. Front Environ Sci 7:123
Manfré LA, Hirata E, Silva JB, Shinohara EJ, Giannotti MA, Larocca AP, C et al (2012) Ananalysis of geospatial technologies for risk and natural disaster management. ISPRS. Int JGeo-Inform 1:166–185. https://doi.org/10.3390/ijgi1020166
Nelson EJ, Pulla ST, Matin MA, Shakya K, Jones N, Ames DP, Ellenburg WL, Markert KN,David CH, Zaitchik BF, Gatlin P (2019) Enabling stakeholder decision-making with Earthobservation and modeling data using Tethys platform. Front Environ Sci
Ofori-Amoah B (2008) Building capacity to use geospatial technology for development in Africa:lessons from the Uganda GIS project. Global dialogue on emerging science and technology(GDEST) Cape Town, South Africa, pp 2001–2009
Ortiz A, Taylor P (2009) Learning purposefully in capacity development. Why, what and when tomeasure, vol 1, p 49
Potter C, Brough R (2004) Systemic capacity building: a hierarchy of needs. Health Policy Plan19:336–345. https://doi.org/10.1093/heapol/czh038
Revenga C (2005) Developing indicators of ecosystem condition using geographic informationsystems and remote sensing. Reg Environ Chang 5:205–214
Scott G, Rajabifard A (2017) Sustainable development and geospatial information: a strategicframework for integrating a global policy agenda into national geospatial capabilities.Geo-Spat inform Sci 20(2):59–76
288 R. B. Thapa et al.
Shrestha B, Bajracharya B (2002) GIS education—experiences from the Hindu Kush-Himalayan(HKH) region. In: Proceedings of the 23rd Asian conference on remote sensing, Kathmandu,Nepal
Thapa RB, Itoh T, Shimada M, Watanabe M, Motohka T, Shiraishi T (2014) Evaluation ofALOS PALSAR sensitivity for characterizing natural forest cover in wider tropical areas.Remote Sens Environ 155:32–42
Thapa RB, Motohka T, Watanabe M, Shimada M (2015) Time-series maps of aboveground carbonstocks in the forests of central Sumatra. Carbon Balance Manage 10(23):1–13. https://doi.org/10.1186/s13021-015-0034-5
Thapa RB, Matin MA, Bajracharya B (2019) Capacity building approach and application:utilization of Earth observation data and geospatial information technology in the Hindu KushHimalaya. Front Environ Sci 7:165
Tripathi P, Thapa RB (2019) Efforts on gender balance capacity building in GIT. Int ArchPhotogrammetry Remote Sens Spatial Inform Sci 42:149–152
UNDP (2008) Supporting capacity development: the UNDP approach. United NationsDevelopment Programme
Xia J, Lin L, Lin J, Nehal L (2014) Development of a GIS-based decision support system fordiagnosis of river system health and restoration. Water 6(10):3136–3151
Open Access This chapter is licensed under the terms of the Creative Commons Attribution 4.0International License (http://creativecommons.org/licenses/by/4.0/), which permits use, sharing,adaptation, distribution and reproduction in any medium or format, as long as you give appropriatecredit to the original author(s) and the source, provide a link to the Creative Commons license, andindicate if changes were made.The images or other third party material in this chapter are included in the chapter’s Creative
Commons license, unless indicated otherwise in a credit line to the material. If material is notincluded in the chapter’s Creative Commons license and your intended use is not permitted bystatutory regulation or exceeds the permitted use, you will need to obtain permission directly fromthe copyright holder.
14 Strengthening the Capacity on Geospatial Information Technology … 289
Chapter 15Gender Integration in EarthObservation and Geo-informationTechnology Applications: Correlationand Connections
Chanda Gurung Goodrich, Kamala Gurung, and Menaka Hamal
15.1 Introduction
As technological innovation and advancement is sweeping across the world,transforming economies, countries, and societies, Earth observation (EO) andgeo-information technologies (GIT) have come closer to the public realm andbecome exceedingly an all-encompassing part in the daily lives of people, withmore uses and users. These technologies today are not just “research and visual-ization tools”, but they touch upon all aspects of people’s lives, bringing inadvantages as well as challenges for different groups of people (McLafferty2005:38). These technologies and applications present opportunities for people toget information, to connect to one another, to explore and link to new markets andnew areas of resource pools which could lead to innovations, increase efficiencyand productivity, and also help in the delivery of effective public services (WorldBank 2019). These technologies and applications can also be used by people,institutions, and corporations to exercise power over others, and it could influencegendered social relations and spaces in all spheres—social, economic, and political(McLafferty 2005; Stephens 2013). Thus, EO and GIT have significant implicationsfor social and economic development, as well as for human rights and gender andsocial equality as they “can be engines of economic growth, offering new possi-bilities in health care, education, communication and productivity”—for example, acase of health, with the application of EO and GIT, can be built on geospatial datato track virus spread, identify vulnerabilities, manage facilities, and target responses
C. G. Goodrich (&) � K. Gurung � M. HamalInternational Centre for Integrated Mountain Development, Kathmandu, Nepale-mail: [email protected]
© The Author(s) 2021B. Bajracharya et al. (eds.), Earth Observation Science and Applications for RiskReduction and Enhanced Resilience in Hindu Kush Himalaya Region,https://doi.org/10.1007/978-3-030-73569-2_15
291
(United Nations 2020:2). Therefore, geospatial information is the foundation forvarious social and economic development activities, apart from its commercial uses(Ibid).
Technologies are set in the dynamics of the prevalent gender, social, and eco-nomic relations, which influence how the technologies are developed and how,where, and by whom they are used (McLafferty 2005). The prevalent unequalpower relations between women and men from different socioeconomic back-grounds are bound to influence the development of, access to, and control overthese technologies as well as the impacts they will have on them. Therefore, it iscritical to expand our view and consider how these technologies are connected withthe everyday lives of women and men in the society, given their position, status,and location. This means that it is crucial to explore and examine the correlationsand connections between gender and EO and GIT.
This chapter seeks to explore the connections between gender and technologyover the decades, examine the correlation between gender and EO and GIT, anddiscuss how SERVIR-HKH integrates gender concerns in its programs andactivities.
15.2 The Gender and Technology Question
Links between gender and technology in terms of symbols, identities, access,control, and use have always been critical issues of discussion in the gender anddevelopment sector. This relationship between gender and technology has beenshifting over time, but in general, “technology itself cannot be fully understoodwithout reference to gender” (Cockburn and Ormrod 1993:32). Industrial capitalismassociated technology with hegemonic masculinity, whereby technologies were formen—to be produced, wielded, and controlled by them (Caputi 1988; Faulkner2001). Vast advances have been made in technology, particularly EO and GIT, andsimilarly, much transformation is taking place in women’s spaces in terms of theirrights, education, roles, and relations at the household and community levels. As aresult, the relationship between gender and the array of EO and GIT applicationsand tools have also undergone changes. Deliberations on the importance of thesetechnologies and applications and on their social, political, and ethical implicationsbegan in the 1980s with the view that EO and GIT technologies can have bothpositive and negative impacts on the people, and that the nature of the impact variesdepending on the social groups (Bourgue and Warren 1987; Harding 1986).However, more critical debates and discourses on these technologies and applica-tions and their links to society emerged in the 1990s (Chrisman 1987; Craig et al.2002).
During that time, the main thread of the gender and technology discourse, interms of EO and GIT, revolved around pro-technology and anti-technology per-spectives (Fig. 15.1). The pro-technology perspective viewed these technologiesand applications as tools for liberating women from the drudgery-ridden daily tasks,
292 C. G. Goodrich et al.

while the anti-technology view regarded these technologies and applications astools that perpetuate and reproduce gender inequality (Faulkner 2001). This more orless simple discourse then shifted to whether EO and GIT is masculinist or neutralin nature. These technologies and applications have often been termed as mas-culinist for the reason that they were mostly used for generating scientific knowl-edge for national defense, land management, and environmental assessment—sectors that were/are typically male dominated, which also rely only on secondarydata, often not including social dimensions into the whole equation (Roberts andSchein 1995; Sheppard et al. 1999). The other view considers these technologies asgender neutral and not masculine and therefore can be positive for women in manyaspects (Henwood 1993; Plant 1997; Oldenziel 1999). It is then argued that thesetechnologies and applications rely on data exploration and layering and visualiza-tions which can be used to construct and generate social and gender dimensions(Kwan 2002a; McLafferty 2005; Schuurman 2002).
Over time, the gender and technology discourse has moved away from thesebinary views, and the recent literature presents a more nuanced view that focuses onthe social construction of technologies and their impacts on gendered social rela-tions (Bray 2007; Faulkner 2001; McLafferty 2005; Wajcman 2000). Stemmingfrom the view that both gender and technology are socially constructed and sociallypervasive, this perspective would have it that there are “tight connections betweenthem with technology shaping gender and gender shaping technology” (Lermanet al. 2003:5); and that the two are mutually constituted and “one cannot understandtechnology without reference to gender” and similarly, “one cannot understandgender without reference to technology’’ (Faulkner 2001:90).
Fig. 15.1 Discourse on gender and GIT during a training event. Photo by Rajendra Shakya
15 Gender Integration in Earth Observation and Geo-information … 293

With this perspective, began the emergence of feminist scholarship within thefield of technological studies and the use of the term “feminization” by McLafferty(2005:39) in the context of GIS; she argued that by bringing in changes in the use,construction, and application of GIS, technology can be rendered “more compatiblewith feminist understandings of research and practice”. Several important GISresearchers also emphasize that community participation leads to a public partici-pation GIS (PPGIS) platform which brings together diverse disciplines, includingthose of political economy, community development anthropology, political ecol-ogy, and the social sciences (Craig et al. 2002). These innovative efforts andinitiatives have led to the incorporation of qualitative multimedia information intoEO and GIT to complement each other and have allowed researchers to portray andreveal the multilayered and multifaceted dimensions of communities and places andgive voice to the research subjects (Matthews et al. 2001). The influence of feministgeographers and social scientists has moved EO and GIT technologies far “beyondthe detached, command-driven systems that predominated two decades ago”, butthis influence “is unevenly spread across” EO and GIT research and applications(McLafferty 2005:40).
15.3 Gender and EO&GIT: Without and Within
EO and GIT technologies and applications are accessible to a wide range of usersand touch people’s lives closely. Hence, this calls for a closer look and analyses ofthe technologies as well as beyond their technological uses. Focusing only on thetechnology means to ignore those social, political, and economic structures ofpower that affect and shape these technologies and applications (Bosak andSchroeder 2005; Pavlovskaya 2018). Considering these technologies outside the“context of power” may not only reinforce the unequal power relations but alsolimit the role of these in “conservative social projects and stifle [the] progressiveconstructions” of these technologies (Pavlovskaya 2018:5). It is vital to (a) under-stand how technologies impact the lives of women and men, and how they influ-ence and shape gendered social relations; and (b) examine how gender norms affectthe development and content of, as well as access to, these technologies.
Therefore, we examine the gender and EO and GIT correlation from two aspects:broader gender concerns of access to and impacts of these technologies—we termthis aspect “Without”; the inclusion or exclusion of gender concerns in the EO andGIT sector and content—we term this “Within”.
15.3.1 Without
“Without” is used for the broader concerns that lie outside of the actual content anddiscipline of EO and GIT. Thus, this depicts the correlation between gender and EO
294 C. G. Goodrich et al.

and GIT in terms of the differential access to these technologies based on genderand social norms and practices and the differential impacts on the diverse genderand socioeconomic groups.
Access: Access to and control over resources is gendered (Gammage et al. 2016),and EO and GIT are very powerful and important resources as these applicationsoffer a wide range of opportunities for instance, agriculture- and health-relatedinformation services. Gender norms and practices play an important role on whoaccesses these technologies. Due to this, access to and adoption of these tech-nologies have not been uniform and vary based on gender, age, socioeconomicstatus, class, and geographic location. The gender structure and norms assignwomen a subordinate position vis-à-vis men, and they face numerous barriers interms of finances, knowledge, skills, and mobility due to patriarchal relations in thehousehold and community. For example, the gender division of labor plays a majorrole in the use of EO and GIT. Women, due to their conventional gender role oftaking care of the household and family, which takes much of their time, are lesslikely to use these technologies and tools, whether it is for adding information (suchas in maps) or for getting information (Liff et al. 2004; Stephens 2013). Anotherexample is of people from lower socioeconomic groups having less access due totheir financial status, while those living in remote locations also have a problem ofaccess because of the non-availability of these technologies in their areas. Thus,access to such technologies is shaped by gender and social norms, economic (fi-nancial) resources, and geographical location (Kwan 2002b, c; McLafferty 2005).This has resulted in a nuanced digital divide between women and men, betweensocioeconomic classes, and between geographic locations, leaving those withoutaccess to these technologies more disadvantaged (United Nations 2020:2).
Impacts: EO and GIT have become more widespread with its uses ranging fromcomplex and formal ones—such as for policy development and planning; man-agement of resources, disasters, and risks; and warfare and surveillance—to themore common everyday uses such as for information, education, and shopping.This has extended the impacts of these technologies into many realms of everydaylife. However, the impacts vary by gender as well as by age, class, and socioeco-nomic status since sociocultural norms and practices have a strong bearing on whatkind of EO and GIT diverse people seek, how and for what they use them, and howthey respond to these (Faulkner 2001; Chen et al. 2002). These technologies areinfluencing women and men’s activities and behaviors and also changing theirsocial and spatial interactions and boundaries.
EO and GIT are also being widely used for surveillance and monitoring byinstitutions, corporations as well as by individuals, which shows a clear link topower. Those in power are the ones who use the technologies for this purpose, andby doing so, it further augments their power (Haklay 2013; Leszczynski andElwood 2015). This has enormous implications for both women and men, but theremay be gender differences in the nature of the impacts. Women’s greater domesticroles and responsibilities may make them more vulnerable than men to tracking bybusiness houses in relation to purchases. There are numerous examples of how
15 Gender Integration in Earth Observation and Geo-information … 295

women’s choices in household purchases are tracked, and based on this tracking,business houses flood women’s social media and mailing sites with messagesadvertising the products they are likely to buy. These act as strong influencers ontheir choices and how they spend their money. At a more alarming level, thetracking systems can be used to perpetuate discriminatory and exploitative gendernorms on women. For instance, exploitative partners, spouses, and family memberscan easily use these technologies to monitor women’s movements and ensure theircompliance with family or cultural norms and punish those women who violatethese norms, thus reinforcing traditional gender roles and relations (Dobson andFisher 2003).
Opportunities: EO and GIT tools and applications have the potential to reshapegender roles and relations in favor of women. These technologies open up manyopportunities for women to ease their workload by enabling them to pursue alter-native ways of carrying out household tasks; they also provide them with options towork remotely (Goyal 2011). This could lead to changes in the gender division oflabor, and as with more time on their hands, women will get more opportunities totake up professional, paid work (Kotkin 2001). These technologies are also avaluable resource for social capital as they provide a huge scope for social networks(Boneva and Kraut 2002). They allow people to maintain and expand their contacts,which are particularly useful for women, giving them a sense of connectivity andsupport that can be empowering, given their lower mobility. This can be particu-larly significant for women in cases of domestic violence as the technologies cangive them quick access to help and support. Another great example of EO and GITas an opportunity for women is when these applications are used forgender-sensitive urban and town planning that respond to their needs and reducespaces of violence. For instance, a simple streetlight can thwart violence. So, suchtechnologies secure for women spaces they can safely operate in (Fenster 2005;Fesenko and Bibik 2017; Shirazi 2018; Carpio-Pinedo et al. 2019).
15.3.2 Within
The term “Within” is used for the aspects that fall inside or within the content,discipline, and sector of EO and GIT. Feminist geographers have indicated thatpower relations shape the construction and use of technologies such as EO and GIT,and that the development of these technologies in a particular context is influencedby the prevailing power relations (Sheppard et al. 1999). Thus, “Within” examinesthe questions of inclusion or exclusion of gender concerns in EO and GIT content,discipline, and sector.
The EO and GIT discipline is dominated by men, both in the academia and in theworkforce (Haggar 2000; Schuurman 2002). The underlying reason for this is thegender structure whereby gender norms and practices that favor men have histor-ically given men the edge with regard to education and technology. Despite efforts
296 C. G. Goodrich et al.
toward supporting more women to enter this discipline and profession, they are stilllagging behind, particularly at the professional level in this field (Holmes et al.2015; Bernard and Cooperdock 2018; UNESCO Institute of Science 2018; andPopp et al. 2019). Studies also show that women do not have great interest orconfidence to work in this field (Rome’s et al. 2007; Yau and Cheng 2012).
This compels the need to critically analyze how and in what ways such tech-nologies and applications as well as the discipline and profession get gendered(Faulkner 2001). Many studies have shown how gender bias is widespread andingrained in the discipline and profession itself. For instance: there still exists hiringbiases against young women as they may leave the job or interrupt their careers tostart a family, and this would impact scientific outputs (Williams and Ceci 2015);female geoscientists are more likely to experience negative gender bias at theirworkplaces and in scientific organizations than their male counterparts in the formof unequal opportunities in research funding/grants, less opportunity to get higherand prestigious scientific roles and positions (King et al. 2018; Vila-Concejo et al.2018); the work environment usually is women-unfriendly since there is lack offlexibility in work timing and inadequate infrastructure to support working mothers;and there is also the issue of lack of same-gender role models, mentors, andwomen-oriented networks (Hill et al. 2010; Reuben et al. 2014; Holmes et al.2015).
On the content side, the advances made in these technologies allow the public tocontribute to the user-generated content of EO and GIT, especially with the newand welcome concepts of open access and citizen science. But yet, the shadow ofmale domination looms large. A study by Stephens (2013:994) shows that there is agendered difference in the quantity of contributions and “this gendered differenti-ation manifests with women as users of the maps and men as expert reviewers oflocal knowledge, which has the potential to reproduce and reinforce the genderinequalities because men who document their local knowledge are documentingtheir own norms, traditions and biases”.
On the positive side, EO and GIT open up new information, data, understand-ings, and innovations that are valuable process-questioning and problem-solvingtools when applied as an integrated and thematic-based application (e.g., in thecases of forestry and drinking water); this can be used in a range of sectors and toaddress critical issues that are faced by communities and governments (Sharp 2005;McGinn and Duever 2018). These technologies can support integrated evaluationsof the gender dimensions of any sector through a combination of tools and appli-cations (Walker and Vajjhala 2011). There are now growing efforts to incorporateand overlay gender-related qualitative information on EO and GIT which arecontributing to the increasing interface of gender with these technologies(SERVIR-Mekong 2015). These tools are now being extensively applied byorganizations and governments in areas such as transport, health, urban and envi-ronmental planning, and disaster risk management. Along with these, it is critical tointegrate gender to address the issues of the most vulnerable and marginalizedgroups in society (Kwan 2002c; Walker and Vajjhala 2011; Shirazi 2018;Carpio-Pinedo et al. 2019).
15 Gender Integration in Earth Observation and Geo-information … 297

It is self-evident that EO and GIT can promote and enable social transformationin important ways, such as by empowering women and marginalized groups,transforming gendered spaces, and by creating opportunities for a wider section ofpeople to contribute to scientific content, advocacy, and to the establishment andrunning of community organizations and networks (Elwood 2008; Coulton et al.2011; Pavlovskaya 2018).
15.4 Engendering the SERVIR-HKH Program
Gender is taken as a critical aspect in SERVIR Global, of which SERVIR-HKH is apart of, and in ICIMOD, wherein SERVIR-HKH is housed. SERVIR Globaladvocates and promotes interface of its services with inclusion of gender and socialissues. It has also formed a SERVIR Network Gender Strategy with the overall goalto capture and disseminate lessons on improving gender equality, specifically withrespect to making GIS/RS technologies and professions more gender responsiveand equal. On similar lines, ICIMOD, with its overarching vision of “improvedwell-being of men, women and children of the HKH” and a strategic goal ofadvancing gender equality and inclusive development, gives high priority to genderin all its programs, and gender is taken as a crosscutting thematic area. Thus,SERVIR-HKH is mandated to integrate gender in the program, including in itsapproach, activities, services, and products. Integrating the aspect of gender is alsocritical for SERVIR-HKH to achieve its goal of improving upon the sustainable useof EO and GIT for environmental management and enhancing the resilience of thevulnerable population to climate change in the HKH region.
Looking back at the past decades, there are two major projects where ICIMODworked on integrated gender and social aspects in GIS. The first project took placein 1996–1997 as an assessment of the comparative development status of Nepal’sdistricts; this was conducted in collaboration with the Netherlands DevelopmentAssistance (SNV-Nepal). The primary aim was to provide a means of selectingpriority districts for development assistance. The study used GIS to map the indi-cators of development at the district level. Indicators were developed for each of thefollowing four dimensions: poverty and deprivation; socioeconomic, institutional,and infrastructural development; women’s empowerment; and natural resourceendowment and management. These were combined with physical topography, i.e.,slope steepness, to construct a development index for each district (ICIMOD 1997).The second project took place in 2003 when ICIMOD partnered with the CentralBureau of Statistics, Nepal, and SNV-Nepal to update the report using more recentdata. The updated study used as much as possible the same indicators as in theprevious study and also followed the same methodology so that the two studieswould be comparable (ICIMOD 2003).
A more systematic and focused approach on integrating gender took shape morerecently when SERVIR-HKH developed a gender strategy and a detailed genderaction plan. The gender strategy was developed to ensure systematic and focused
298 C. G. Goodrich et al.

gender integration and guide the program. The gender strategy identified three areasof concern where there was a need to integrate gender: in content; in access; and inprofessional-level participation.
Content: Incorporating gender-related information into the content in terms ofgeospatial products, services, and applications was crucial so that these could beused as tools for raising awareness on gender-related issues, influencing policies,and enabling communities to minimize gender-unequal risks and thereby helpaddress gender inequality for more sustainable development (SERVIR-Mekong2015).
Access: The information and products generated by SERVIR-HKH should beaccessible to all the different gender and social groups in society, irrespective oftheir educational, gender, and other socioeconomic status. Furthermore, the tech-nical information available in the form of maps and other applications should betranslated, tailored, and narrated in a language that is readable and understandablefor people with limited knowledge on maps and applications. These are also criticalto achieve the ultimate goal of SERVIR-HKH: connecting space to village.Moreover, this part of the strategy gives due weightage to effective disseminationchannels and mechanisms that can reach out to women and different socioeconomicgroups.
Professional participation: As discussed in Sect. 15.3.2, there is a visible gendergap at professional levels in the geospatial professions. Globally, the number ofwomen professionals in the geospatial sector is minimal and same is the case withHKH. A study says that among the researchers in the world in this field, only 19%are women (UNESCO Institute of Science 2018). This study reports that althoughwomen’s enrolment in bachelor’s degree in the fields of science, technology,engineering, and mathematics is equal or even slightly higher than men, theirnumber in higher studies is rather low. This indicates that while women have theenthusiasm to pursue a career in geospatial studies, they cannot sustain it at thehigher level and build a career in research. Numerous studies, which are cited inSect. 15.3.2, show that women face different hurdles compared to men at work.Thus, there is an urgent need for the HKH region to address the issue of women’srepresentation at the professional level.
SERVIR-HKH has adopted a “services” approach for ensuring the effectivenessof its services to help developing countries resolve the challenges in the priorityservice areas. The approach, therefore, is to integrate gender in all the services andmake these services gender (as also socially) sensitive and responsive. The strategyis to frame the services so as to address gender needs and concerns in content,interpretation, and analysis. This entails systematically considering and addressinggender disparities, constraints, and opportunities to ensure that: the services undereach of the thematic areas are gender sensitive and responsive; the disseminationprocesses of the services are designed in such a way that they are accessible towomen and men of various socioeconomic groups; and the approaches that areadopted are affirmative as to bridge the gender gap at the professional level. In this
15 Gender Integration in Earth Observation and Geo-information … 299
regard, three strategies were adopted to integrate gender in order to achieve thethree strategic objectives:
(i) Integrate gender in the Theory of Change (ToC) and in the monitoring, eval-uation, and learning plan:
Integrating gender in TOC and in the monitoring, evaluation, and learning plan iscrucial as this paves the way to practically and realistically mainstream gender at allstages and activities of a program. Hence, the strategy of the SERVIR-HKH ToC isto appropriately consider and integrate gender by setting up, from the verybeginning, gender targets wherever necessary and relevant and establishgender-disaggregated monitoring data to support gender analysis; this also entailsdocumentation and sharing of gender integration in ToC. (More details on ToC arein Chap. 18.)
(ii) Combine various gender methods, tools, and sensitivities during servicedesign and implementation:
It is essential to integrate the geospatial information with appropriategender-disaggregated data for developing gender-sensitive/-responsive services.Therefore, while developing the services, the interpretation and analysis will notonly limit to EO, but rather the ultimate conclusion will be drawn based on inte-grating the geospatial data with social and gender analysis. For instance,SERVIR-HKH aims to generate community-level gender-disaggregated data toinform gender-responsive policymaking in Nepal. The Community Forest UserGroups (CFUGs) in Nepal are in a position to gather local-level data and insights,and there is also in place a new national policy that encourages more women toparticipate in their management. In this regard, in partnership with Hariyo Ban, datafrom specific districts in Nepal are being collected to understand how women’saccess to CFUG decision-making will have an impact on forest conditions, thetypes of natural resources the community focuses on managing or collecting, and onhow the CFUGs spend the money that is collected.
SERVIR-HKH believes that gathering such data paves the way for analysis andcan be used by the government to design appropriate gender-responsive policies toencourage further engagement of women in decision-making spaces. This data canalso be used by the government to determine funding allocation to the CFUGs.Though the data collection process has not yet begun, SERVIR-HKH anticipatesserving an important role in the Hariyo Ban project in the following ways: it hopesto address the quantitative data gap in the project, develop data visualizations usingGIS services, and convincingly present the data to the government. SERVIR-HKH,through Hariyo Ban, aims to have a lasting impact on policymaking in Nepal.
In the user-engagement process too, gender dimensions will be taken into con-sideration. For SERVIR-HKH, users are mainly partners who are involved at theservice level in the development of the products and services either as co-creators,co-designers, co-implementers, and as ultimate or potential beneficiaries.
For this, SERVIR-HKH will engage and partner not only with the governmentagencies that are the immediate users of the services, but also with the end
300 C. G. Goodrich et al.
beneficiaries such as federations and associations of women and men farmers, waterand forest users’ associations, and community disaster management groups. Thiswill benefit by way of ensuring that the services incorporate gendered perspectivesin the analysis and interpretation of the information that is produced. (More detailson how user engagement considers the gender perspective are given in Chaps. 17and 18.)
The dissemination of the information that is available from the services will alsoconsider gender dimensions in various ways, such as preparing these in a languagethat is suitable for the ultimate users and also disseminate through user organiza-tions via printed material and audio-visual media. (Details in Chap. 17.) Moreover,the most effective dissemination channels and mechanisms will be identified toreach out to women and other socioeconomic groups.
(iii) Build women’s leadership and create gender champions in SERVIR:
As has been discussed in Sect. 15.3.2, the EO and GIT field is male dominated, andas long as women remain in low numbers in this field, the working environmentwill continue to be biased against them, and patriarchal attitudes and processes willcontinue to reign. Therefore, it is imperative that more women enter this field. Thestrategy for this is to proactively seek and recruit women in the sector by applyingaffirmative actions and a positive discriminatory policy; include women in train-ings, workshops, and related events by reserving 33–50% seats for them andbringing women as speakers and resource persons in seminars, conferences, andworkshops; empower and support young women in this field through targetedcapacity building programs; and build and foster gender champions within theSERVIR-HKH program.
In addition to the gender strategy, SERVIR-HKH has also developed a detailedgender action plan. In 2017, based on the recommendations of the gender audit of2016, ICIMOD initiated the development of a gender plan of action for all itsprograms and initiatives as well as for the institution as a whole, with the aim ofincreasing gender responsiveness in its works and processes. The main goals of thisare threefold: ensure gender integration at ICIMOD; operationalize the genderpolicy; and create an accountability mechanism. A detailed procedure was laid outto develop the gender action plan that began with the outcome statement of theregional program of ICIMOD associated with.
This procedure was followed rigorously by the programs, includingSERVIR-HKH (Table 15.1). In this way, the gender strategy is used as a guide andapproach to integrate the gender aspect in SERVIR-HKH, while the gender actionplan outlines the objectives and actions, spells out the gender-specific indicators tomonitor and track, lists the inputs and resources that are required, identifies theresponsible person/team, and sets a timeline. The implementation of the genderaction plan will come up for evaluation in 2021. This will investigate, throughmeetings/workshops, as to whether the targets and actions have been accomplished
15 Gender Integration in Earth Observation and Geo-information … 301

and then submit a progress report to the Strategic Planning, Monitoring andEvaluation (SPME) Unit of ICIMOD.
15.5 Conclusion
With EO and GIT entering the public realm with more uses and users, there is nodoubt that they made an immense impact on several spheres of people’s lives.Exploring and examining the connections and correlations between EO and GITand gender shed light on the interlinkages between the two. It is evident that eventoday, this sector is predominately male dominated, which is linked to the gendernorms that are prevalent in society, due to which knowledge and products are oftendeveloped by men. However, it is also clear that this scenario is undergoing rapidchanges. EO and GIT have gone through transformations over time with inputsfrom feminist geographers which have been (and are still being) enriched byincorporating novel ways of thinking, thereby signaling a shift from the priorityaccorded to the methods of dominant technology and quantitative data, to com-bining these with methods that allow incorporation of contextualized, qualitative
Table 15.1 Procedure for developing the gender action plan
302 C. G. Goodrich et al.

information. And riding on such a merger, these technologies and applications canaid in informing, broadening, and visualizing additional, and sometimes new,information in gender and feminist studies and discourses.
For SERVIR-HKH, the connection between EO and GIT and gender and socialissues lies in the fact that these applications and technologies, when combined withthe methods that address the needs, interests, and priorities of women and othermarginalized groups, can contribute to equitable socioeconomic development,poverty reduction, and increased resilience. An example of this has been given asection in this chapter on generating community-level gender-disaggregated data toinform gender-responsive policymaking in Nepal. SERVIR-HKH has effectivelylaid down the gender-integrated approach in its programs and activities. Thechallenge has been in getting the technical professionals to internalize these com-plex and nuanced understandings. This is compounded by the involvement of veryfew gender and social scientists (in terms of numbers and time) in theSERVIR-HKH project; this makes it difficult to ensure that the plans, steps, andactivities laid down in the gender strategy are followed thoroughly.
One of the ways forward is to strengthen gender integration in the EO and GITsector as well as SERVIR-HKH; this would mean roping in more gender and socialscientists as part of a core group who are as closely involved as the technicalprofessionals. Such a strategy would go a long way in making both sets of pro-fessionals understand each other’s views, and then, they could move forwardtogether in a meaningful way, whether by capacity building through varioustrainings and workshops or through other means that are tailored according to theneeds of the activity, output, or outcome. In the HKH region where climatic andsocioeconomic changes are having an adverse impact on natural resources andlivelihoods, the need to integrate gender in EO and GIT is critical and urgent as thiswill bear two important results: It will enable researchers and practitioners to setbetter target interventions for women and men on the ground in a wider geo-graphical space; and second, it can fashion the applications or services in aneffective and powerful manner whereby there is heightened awareness about genderissues. All this will also contribute to empowerment and address gender inequalityby enabling communities to minimize gender-based unequal risks in various con-texts and situations (for instance, in the areas of disaster risk reduction and buildingadaptation and resilience). Thus, on a broader note, EO and GIT can serve as acatalyst for transformative change—by addressing the issues of gender and socialinequality as well as the unfair power distribution systems that are at play, thesetechnologies have the wherewithal to create a just and level-playing field.
15 Gender Integration in Earth Observation and Geo-information … 303

References
Bernard RE, Cooperdock EH (2018) No progress on diversity in 40 years. Nat Geosci 11(5):292–295. https://doi.org/10.1038/s41561-018-0116-6
Boneva B, Kraut R (2002) Email, gender and personal relationships. In: Wellman B,Haythornthwaite C (eds) The internet in everyday life. Blackwell, Malden, MA, pp 372–403
Bosak K, Schroeder K (2005) Using geographic information systems (GIS) for gender anddevelopment. Development in practice, vol 15, no. 2. Routledge, Taylor & Francis, pp 231–237. ISSN: 09614524
Bourgue CS, Warren BK (1987) Technology, gender and development. Learning about women:gender, politics, and power (Fall, 1987), vol 116, no 4, pp 173–197
Bray F (2007) Gender and technology. Annu Rev Anthropol 36:37–53Caputi Jane (1988) Seeing elephants: the myths of phallotechnology. Feminist Stud 14(3):487–524Carpio-Pinedo J, Hurtado SDG, De Madariaga IS (2019) Gender mainstreaming in urban
planning: the potential of geographic information systems and open data sources. Plann TheorPract. https://doi.org/10.1080/14649357.2019.1598567
Chen W, Boase J, Wellman B (2002) The global villagers: comparing internet users and usesaround the world. In: Wellman B, Haythornthwaite C (eds) The internet in everyday life.Blackwell, Malden, MA, pp 74–113
Chrisman NR (1987) Design of geographic information systems based on social and cultural goals.Photgrammetric Eng Remote Sens 53(10):1367–1370
Cockburn C, Ormrod S (1993) Gender and technology in the making. Sage, LondonCoulton C, Chan T, Mikelbank K (2011) Finding place in community change initiatives: using
GIS to uncover resident perceptions of their neighborhoods. J Commun Pract 19(1):10–28.https://doi.org/10.1080/10705422.2011.550258
Craig WJ, Harris TM, Weiner D (eds) (2002) Community participation and geographicinformation systems. Taylor and Francis, London
Dobson J, Fisher P (2003) Geoslavery. IEEE Technology and Society Magazine (spring), pp 47–52
Elwood S (2008) Grassroots groups as stakeholders in spatial data infrastructures: challenges andopportunities for local data development and sharing. Int J Geogr Inf Sci 22(1/2):71–90
Faulkner W (2001) The technology question in feminism: a view from feminist technologystudies. Women’s Stud Int Forum 24:79–95
Fenster T (2005) The Right to the gendered city: different formations of belonging in everyday life.J Gender Stud 14(3):217–231. https://doi.org/10.1080/09589230500264109
Fesenko G, Bibik N (2017) The safe city: developing of GIS tools for gender-oriented monitoring(on the example of Kharkiv city, Ukraine). Information technology. Eastern-Eur J EnterpTechnol 3/2(87). ISSN 1729-3774: 25
Gammage S, Kabeer N, van der Meulen Rodgers Y (2016) Voice and agency: where are we now?Feminist Econ 22(1):1–29. https://doi.org/10.1080/13545701.2015.1101308
Goyal A (2011) Developing women: why technology can help. Inf Technol Develop 17(2):112–132. https://doi.org/10.1080/02681102.2010.537252
Haggar R (2000) GIS: gendered information systems. Paper read at the annual meeting of theassociation of american geographers, 6 April, Pittsburgh, PA
Haklay M (2013) Neogeography and the delusion of democratization. Environ Planning 45(1):55–69
Harding S (1986) The science question in feminism. Cornell Univ. Press, Ithaca, NYHenwood Flis (1993) Establishing gender perspectives on information technology: problems,
issues and opportunities. In: Green E, Owen J, Pain D (eds) Gendered by design? Informationtechnology and office systems. Taylor and Francis, London, pp 31–52
Hill C, Corbett C, St. Rose A (2010) Why so few? Women in science, technology, engineering,and mathematics. AAUW
304 C. G. Goodrich et al.
Holmes MA, O’Connell S, Dutt K (2015) Women in the geosciences—practical, positive practicestoward parity. Wiley, Hoboken, New Jersey
International Centre for Integrated Mountain Development (ICIMOD) (1997) Districts of Nepalindicators of development. ICIMOD, Kathmandu
King L, MacKenzie L, Tadaki M, Cannon S, McFarlane K, Reid D, Koppes M (2018) Diversity ingeoscience: Participation, behaviour, and the division of scientific labour at a Canadiangeoscience conference. FACETS 3(1):415–440. https://doi.org/10.1139/facets-2017-0111
Kotkin J (2001) The new geography: how the digital revolutions reshaping the Americanlandscape. Random House, New York
Kwan MP (2002a) Is GIS for women? Reflections on the critical discourse in the 1990s. GenderPlace Culture 9:271–279
Kwan MP (2002b) Feminist visualization: re-envisioning GIS as a method in feminist geographicresearch. Ann Assoc Am Geogr 92:645–661
Kwan MP (2002c) Introduction: feminist geography and GIS. Gender Place Culture 9:261–262Lerman NE, Oldenziel R, Mohun AP (2003) Introduction: interrogating boundaries. In:
Lerman NE, Oldenziel R, Mohun AP (eds) Gender and technology—a reader. John HopkinsUniversity Press, pp 1–9
Leszczynski A, Elwood S (2015) Feminist geographies of new spatial media. Can Geogr 59(1):12–28
Liff S, Shepherd A, Wajcman J, Rice R, Hargittai E (2004) An evolving gender digital divide? OIIInternet Issue Brief
Matthews S, Burton L, Detwiler J (2001) Viewing people and places: conceptual andmethodological issues in coupling geographic information analysis and ethnographic research.Paper read at conference on GIS and critical geographic research, 25 February, New York, NY
McGinn E, Duever M (2018) Building maps: GIS and student engagement. Library Hi Tech News35(4):9–12. https://doi.org/10.1108/LHTN-12-2017-0089
McLafferty S (2005) Women and GIS: geospatial technologies and feminist geographies.Cartographic Int J Geogr Inf Geovisualization 40(4):37–45. https://doi.org/10.3138/1341-21jt-4p83-1651
Oldenziel R (1999) Making technology masculine: men, women and modern machines inAmerica. Amsterdam University Press, Amsterdam
Pavlovskaya M (2018) Critical GIS as a tool for social transformation. Can Geogr Le GeographerCanadian 1–15. https://doi.org/10.1111/cag.12438
Plant Sadie (1997) Zeros and ones: digital women and the new technoculture. Fourth Estate,London
Popp AL, Lutz SR, Khatami S, van Emmerik THM, Knoben WJM (2019) Perceptions and impactsof gender inequality in the geosciences are strongly gendered. EarthArXiv Preprint
Reuben E, Sapienza P, Zingales L (2014) How stereotypes impair women’s careers in science.PNAS 111(12):4403–4408. https://doi.org/10.1073/pnas.1314788111
Roberts S, Schein R (1995) Earth shattering: global imagery and GIS. In: Pickles J (ed) Groundtruth: the social implications of geographic information systems. Guilford, New York, pp 171–195
Rome’s EWM, Overbeek G, Engels RCME, De Kemp RAT, Scholte RHJ (2007) ‘I’m notinterested in computers’: gender-based occupational choices of adolescents. Inf Commun Soc10(3):299–319
Schuurman N (2002) Women and technology in geography: a cyborg Manifesto for GIS. CanGeogr 46:262–265
SERVIR-Mekong (2015) Gender and GIS: guidance notes. Asian Disaster Preparedness Center,Bangkok, Thailand
Sharp J (2005) Geography and gender: feminist methodologies in collaboration and in the field.Prog Hum Geogr 29:304–309
Sheppard E, Couclelis H, Graham S, Harrington J, Onsrud H (1999) Geographies of theinformation society. Int J Geog Inf Sci 13:797–823
15 Gender Integration in Earth Observation and Geo-information … 305

Shirazi MR (2018) Mapping neighbourhood outdoor activities: space, time, gender and age.J Urban Des. https://doi.org/10.1080/13574809.2018.1458607
Stephens M (2013) Gender and the GeoWeb: divisions in the production of user-generatedcartographic information. GeoJournal 78:981–996. https://doi.org/10.1007/s10708-013-9492-z
UNESCO Institute of Statistics (2018) Women in science. http://uis.unesco.org/apps/visualisations/women-in-science/#overview
United Nations (2020) World social report 2020—inequality in a rapidly changing world.Department of Economic and Social Affairs, United Nations
Vila-Concejo A, Gallop SL, Hamylton SM, Esteves LS, Bryan KR, Delgado-Fernandez I,Splinter K (2018) Steps to improve gender diversity in coastal geoscience and engineering.Palgrave Common. 4(1):103. https://doi.org/10.1057/s41599-018-0154-0
Walker W, Vajjhala SP (2011) Gender and GIS: mapping the links between spatial exclusion,transport access and the millennium development goals in Lesotho, Ethiopia and Ghana. SSRNElectron J. http://doi.org/10.2139/ssrn.1473931
Wajcman J (2000) Reflections on gender and technology. In what state is the art? Soc Stud Sci30:447–464
Williams WM, Ceci SJ (2015) National hiring experiments reveal 2:1 faculty preference forwomen on STEM tenure track. PNAS 112(17):5360–5365. https://doi.org/10.1073/pnas.1418878112
World Bank (2019) World development report 2019: The changing nature of work. World Bank,Washington, DC. https://doi.org/10.1596/978-1-4648-1328-3 License: Creative CommonsAttribution. CC BY 3.0 IGO
Yau HK, Cheng ALF (2012) Gender difference of confidence in using technology for learning.J Technol Stud 38(2):74–79. https://doi.org/10.21061/jots.v38i2.a.2
Open Access This chapter is licensed under the terms of the Creative Commons Attribution 4.0International License (http://creativecommons.org/licenses/by/4.0/), which permits use, sharing,adaptation, distribution and reproduction in any medium or format, as long as you give appropriatecredit to the original author(s) and the source, provide a link to the Creative Commons license andindicate if changes were made.The images or other third party material in this chapter are included in the chapter’s Creative
Commons license, unless indicated otherwise in a credit line to the material. If material is notincluded in the chapter’s Creative Commons license and your intended use is not permitted bystatutory regulation or exceeds the permitted use, you will need to obtain permission directly fromthe copyright holder.
306 C. G. Goodrich et al.
Chapter 16Communicating Science for InformedDecision-Making
Birendra Bajracharya, Utsav Maden, Devrin Weiss, and Leah Kucera
16.1 Introduction
SERVIR’s primary objective is to use Earth observation (EO) information andgeospatial information technologies (GIT) to address challenges in areas of societalconcern such as food security, land use and land cover, water resources, weather,and natural disasters. With a tagline of “connecting space to village”,SERVIR-HKH aims to build the capacities of people and institutions in the HKHregion to integrate science and technology into the decision-making processes. Toachieve these broad and ambitious objectives, SERVIR-HKH provides scientificinformation to a wide range of audiences with different societal contexts (Chap. 1).A picture is worth a thousand words, they say; EO satellites provide pictures of theEarth surface which help scientists to understand the dynamics of natural andanthropogenic processes. Similarly, GIT tools enable analysis and visualization ofdata, not only for scientific exploration but also to help communicate the infor-mation to the intended users in the form of maps and charts. The cartographicprinciples applied during the map-making process ensure that the scientific infor-mation undergoes minimum distortion while communicating to the targetaudiences.
People, typically, consider their own needs, knowledge and skills, values andbeliefs as well as scientific information while making decisions. Therefore, theywill make choices consistent with scientific evidence only if the science is
B. Bajracharya (&) � U. MadenInternational Centre for Integrated Mountain Development, Kathmandu, Nepale-mail: [email protected]
D. WeissSERVIR Support Team/Chemonics International, Washington, DC, USA
L. KuceraNASA SERVIR Science Coordination Office, Huntsville, AL, USA
© The Author(s) 2021B. Bajracharya et al. (eds.), Earth Observation Science and Applications for RiskReduction and Enhanced Resilience in Hindu Kush Himalaya Region,https://doi.org/10.1007/978-3-030-73569-2_16
307
communicated effectively (NASEM 2017). Different or contradictory messagesconveyed by multiple sources often generate uncertainty in the science or itsimplications, and usually do not aid informed decisions (Burns et al. 2003).Therefore, SERVIR must ensure that the information and knowledge are shared anddelivered to people through relevant channels in appropriate formats, and atappropriate timings, to enable them to make informed decisions. This requires aneffective communication system aimed at helping people understand the sciencerelevant to a decision while also recognizing that other factors will affect theiractions (NASEM 2017).
The recent technological advancements have also brought about enormousopportunities in scientific communication. The advent of mobile devices andsmartphones and wider penetration of the internet ensures that a wider audience hasaccess to the scientific information that is being disseminated through a widevariety of media such as web portals, blogs, videos, and social media. Currenttechnological advancements have also made it possible to develop customizedinformation services for the targeted users; they have also enabled and facilitateduser feedback and aided in gauging the social impact of the information services.
In the context of SERVIR, the communication means help in raising awarenessabout its applications and services; they enable the sharing of information generatedby these applications with the targeted users, thereby aiding the decision-makingprocess; they also open up many platforms to generate and receive feedback. As theusers are central to SERVIR’s service planning approach (Chap. 2), communicationis an integral part of user engagement for the development of constructive, col-laborative, and enduring stakeholder relationships (UNGGIM 2020).Communication plays a fundamental role in fostering social awareness and infacilitating public democratic dialogue, thereby building a shared understandingand contributing to evidence-based policy (Hovland 2005). Here, we present theapproaches and practices adopted by SERVIR-HKH for effective communicationand sharing of its products and services, and our learnings from the HKH region.
16.2 Knowledge Management and CommunicationStrategy
A strategic communication framework is important for successful exposure andbranding, user engagement and for the effective delivery of data, information, andknowledge products and services. As SERVIR-HKH primarily deals withgeospatial information and modeled data, it needs to follow appropriate mappingconventions for effective visualization of data and analyses. Therefore, the properidentification of the target audiences and their access to various media platforms arefundamental considerations while designing an effective knowledge managementand communication strategy. While ICIMOD has its knowledge management andcommunication strategy and institutional branding policies in place, SERVIR-HKH
308 B. Bajracharya et al.

also needs to account for the co-branding requirements (USAID 2016) as part of aglobal network led by USAID and NASA. In this context, while the visual brandingrequirements of the host and donor organizations set precedence, SERVIR-HKHalso needs to ensure scientific accuracy and relevance in the knowledge it generatesand the messaging it carries out. The marketing collateral that is produced alsoneeds to portray the positive connection between satellites and people and connectwith a regional audience.
Taking these requirements into account, SERVIR-HKH developed a KnowledgeManagement and Communication (KMC) Strategy to guide targeted communica-tions, sharing, and dissemination of its information and knowledge for greaterimpact, better and broader outreach, and efficient internal communications. Thestrategy aims to support the uptake of its services, products, and applications by thetarget audiences in order to bring about behavioral change, thereby influencingpositive policy and development outcomes. The different target audiences, their
Table 16.1 Communication strategy for different audience type adapted from ICIMOD (2013and 2018).
16 Communicating Science for Informed Decision-Making 309

importance, the adopted communications channels, activities, and the end goalsidentified in the strategy are presented in Table 16.1.
16.3 When Communication has a Key Role to Play?
Communication plays an important role in all aspects of SERVIR-HKH’s programdesign and implementation. More specifically, communication plays a critical rolein the areas identified below
• User engagement during needs assessment and user consultations• Dissemination of scientific data and information through the SERVIR-HKH
services• Capacity-building activities• Promoting SERVIR-HKH on the web, social media, and other platforms• Documenting use—use cases to capture how a service is used• Regional knowledge forums and global outreach.
The design and development of knowledge products and marketing collateralneed specific considerations for each of the aforementioned areas.
16.4 User Engagement During Needs Assessmentand User Consultations
As part of the service planning process (Chap. 2), SERVIR-HKH identifies its usersand engages with them further to assess their needs. It organizes consultationworkshops at the national and regional levels with the key stakeholders working inthe SERVIR-HKH’s service areas to carry out a thorough needs assessment of userrequirements (Chap. 3). Effective two-way communication plays a crucial role hereto help understand the users’ needs and priorities, and also to express the capabilityto address the needs through the existing EO data, GIT infrastructure, and scientificmethods, as well as through other available resources.
Such workshops are designed with two-way communication in mind—bothlistening to and learning from the invited stakeholders and sharing information onSERVIR’s capabilities and available resources. These consultations begin with asession focusing on information exchange where the participating institutionshighlight their mandates, priorities, and relevant work activities through shortpresentations at the plenary. This learning and sharing process ensures that all theparticipants are well informed and helps explore areas of commonality oroverlap. The sessions that follow focus on collective thinking on problems andopportunities. As for the facilitated group activities, they discuss challenges,identify opportunities and connections, set priorities, and leverage the collective
310 B. Bajracharya et al.

expertise and points of view of the attending quorum to set a course for relevant,demand-driven activities.
The needs assessments process at user consultations help identify the keypartners in the co-development of services. The follow-up meetings with theidentified partners help to develop work plans, find agreement on the methodologiesand data-sharing arrangements, and enable the calibration and validation of com-ponents as part of the co-development process. The organization of regularface-to-face and virtual meetings with the identified national partners also helps inreviewing progress and communicating updates.
During the service development cycle, national outreach and disseminationworkshops are conducted in collaboration with the national partners to help com-municate the programmatic developments and to solicit feedback from the relevantstakeholders. These national outreach workshops are carried out inSERVIR-HKH’s focus countries—Afghanistan, Bangladesh, Myanmar, Nepal, andPakistan—and are often delivered in the vernacular language and led by thenational partner wherein SERVIR-HKH provides technical oversight.
For example, organizing dissemination workshops for flood-prone areas inBangladesh in partnership with the Bangladesh Water Development Board(BWDB)/Flood Forecasting and Warning Centre (FFWC) was instrumental inreaching out to the relevant stakeholders and in informing them about assistancefrom SERVIR-HKH in developing appropriate flood warnings. Similarly,Afghanistan’s first comprehensive glacier database was launched at a disseminationworkshop organized at the Ministry of Energy and Water’s campus in Kabul. Theseevents served to showcase services and launch joint knowledge products whilesoliciting and strengthening further partnerships and collaborations.
16.5 Dissemination of Scientific Data and Information
SERVIR-HKH’s core objective is to generate scientific information to supportinformed decision-making. Under the four priority service areas identified forSERVIR-HKH (Chap. 1), several services have been developed which produceinformation products in the form of maps, charts, and expert interpretations. Theseservices include web-based applications, also referred to as science applications,and are designed to help the users address specific problems under the designatedservice area.
All the science applications developed under SERVIR-HKH follow a particularschema that defines the placement of different components and controls so as toenable the users to know intuitively where a component is placed. All theseapplications implement a responsive design, use the approved color palette, andinclude an acknowledgement/additional information section to provide moreinformation about a particular application. Each science application has a specificURL, follows a common nomenclature for easy reference, and is linked to thescience applications page on the SERVIR-HKH website.
16 Communicating Science for Informed Decision-Making 311
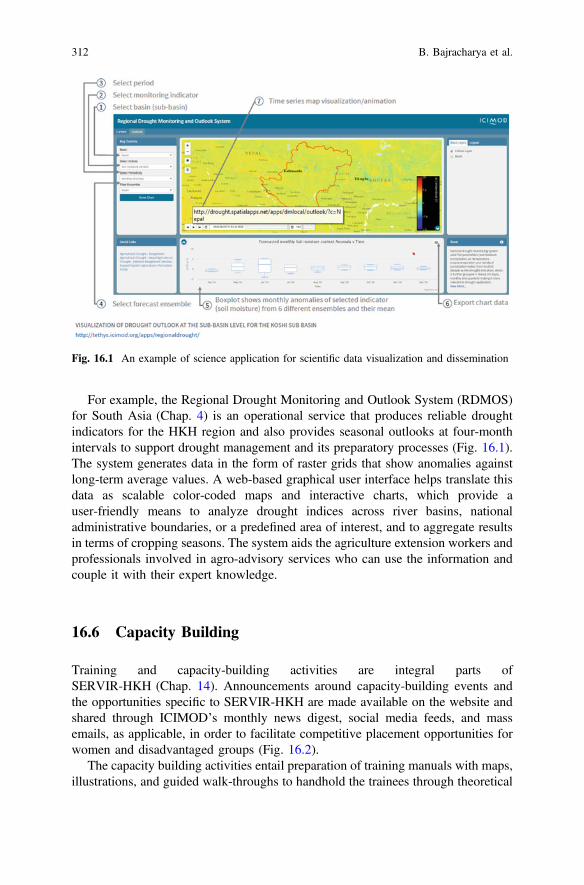
For example, the Regional Drought Monitoring and Outlook System (RDMOS)for South Asia (Chap. 4) is an operational service that produces reliable droughtindicators for the HKH region and also provides seasonal outlooks at four-monthintervals to support drought management and its preparatory processes (Fig. 16.1).The system generates data in the form of raster grids that show anomalies againstlong-term average values. A web-based graphical user interface helps translate thisdata as scalable color-coded maps and interactive charts, which provide auser-friendly means to analyze drought indices across river basins, nationaladministrative boundaries, or a predefined area of interest, and to aggregate resultsin terms of cropping seasons. The system aids the agriculture extension workers andprofessionals involved in agro-advisory services who can use the information andcouple it with their expert knowledge.
16.6 Capacity Building
Training and capacity-building activities are integral parts ofSERVIR-HKH (Chap. 14). Announcements around capacity-building events andthe opportunities specific to SERVIR-HKH are made available on the website andshared through ICIMOD’s monthly news digest, social media feeds, and massemails, as applicable, in order to facilitate competitive placement opportunities forwomen and disadvantaged groups (Fig. 16.2).
The capacity building activities entail preparation of training manuals with maps,illustrations, and guided walk-throughs to handhold the trainees through theoretical
Fig. 16.1 An example of science application for scientific data visualization and dissemination
312 B. Bajracharya et al.

concepts and hands-on exercises (Fig. 16.3). There are also customized trainingmanuals for training on applications of EO and GIT in the different service areas;these consider the level of the targeted trainees, ranging from beginners to advancedusers. As for event-specific materials—background notes, agenda, training mate-rials, tutorials, and resource books—they undergo edits for consistency of languageand to ensure the use of gender-aware language. Then there are the marketingcollaterals developed for flagship training events which take into considerationregional sensitivities in the imagery and the illustrations that are used.
Post-event communication materials in the form of news, video clips, testimo-nials from participants who have benefitted from a particular training, and successstories highlighting how certain users have gained from the adoption of a product orservice are important in telling the SERVIR-HKH story.
As an example of the broad range of events organized by SERVIR-HKH, a listof consultations and training workshops on the flood early warning system forBangladesh is presented in Table 16.2.
16.7 Promoting SERVIR-HKH on the Web, Social Media,and other platforms
Promoting SERVIR-HKH for visibility at local, national, regional, and global levelsis a major objective of the SERVIR-HKH KMC strategy. This entails a coordinatedeffort in creating and retaining a brand image, and in the timely communication ofSERVIR-HKH’s achievements and impacts. The major activities involve:
Fig. 16.2 Illustration for use in email campaigns and social media during the open call forapplication
16 Communicating Science for Informed Decision-Making 313

Fig. 16.3 The “connecting space to village” poster designed as a giveaway for a schoolteachertraining programme (https://lib.icimod.org/record/34552)
314 B. Bajracharya et al.
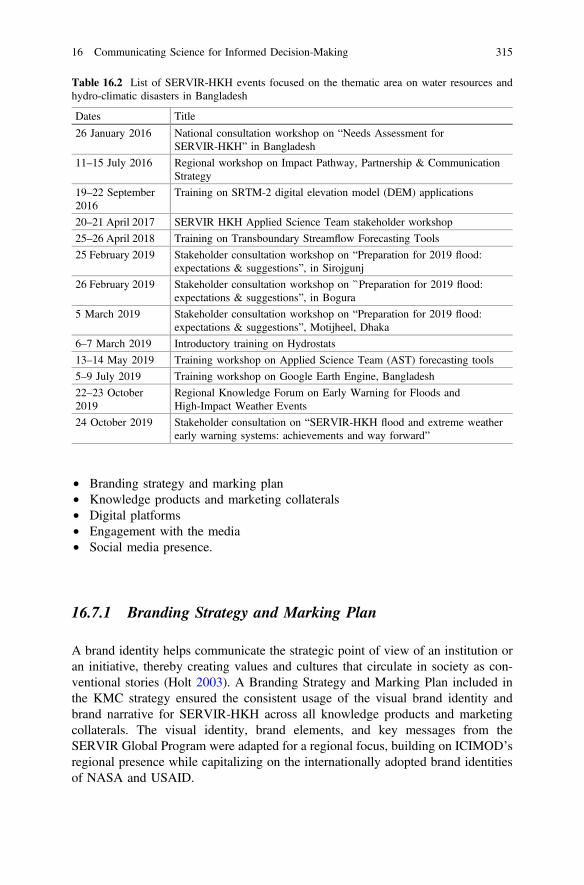
• Branding strategy and marking plan• Knowledge products and marketing collaterals• Digital platforms• Engagement with the media• Social media presence.
16.7.1 Branding Strategy and Marking Plan
A brand identity helps communicate the strategic point of view of an institution oran initiative, thereby creating values and cultures that circulate in society as con-ventional stories (Holt 2003). A Branding Strategy and Marking Plan included inthe KMC strategy ensured the consistent usage of the visual brand identity andbrand narrative for SERVIR-HKH across all knowledge products and marketingcollaterals. The visual identity, brand elements, and key messages from theSERVIR Global Program were adapted for a regional focus, building on ICIMOD’sregional presence while capitalizing on the internationally adopted brand identitiesof NASA and USAID.
Table 16.2 List of SERVIR-HKH events focused on the thematic area on water resources andhydro-climatic disasters in Bangladesh
Dates Title
26 January 2016 National consultation workshop on “Needs Assessment forSERVIR-HKH” in Bangladesh
11–15 July 2016 Regional workshop on Impact Pathway, Partnership & CommunicationStrategy
19–22 September2016
Training on SRTM-2 digital elevation model (DEM) applications
20–21 April 2017 SERVIR HKH Applied Science Team stakeholder workshop
25–26 April 2018 Training on Transboundary Streamflow Forecasting Tools
25 February 2019 Stakeholder consultation workshop on “Preparation for 2019 flood:expectations & suggestions”, in Sirojgunj
26 February 2019 Stakeholder consultation workshop on `̀ Preparation for 2019 flood:expectations & suggestions”, in Bogura
5 March 2019 Stakeholder consultation workshop on “Preparation for 2019 flood:expectations & suggestions”, Motijheel, Dhaka
6–7 March 2019 Introductory training on Hydrostats
13–14 May 2019 Training workshop on Applied Science Team (AST) forecasting tools
5–9 July 2019 Training workshop on Google Earth Engine, Bangladesh
22–23 October2019
Regional Knowledge Forum on Early Warning for Floods andHigh-Impact Weather Events
24 October 2019 Stakeholder consultation on “SERVIR-HKH flood and extreme weatherearly warning systems: achievements and way forward”
16 Communicating Science for Informed Decision-Making 315

The three institutional logos—USAID’s, NASA’s, and ICIMOD’s—and theSERVIR-HKH logo formed the primary visual identity of SERVIR-HKH, sup-ported by iconography representing the four key service areas: agriculture and foodsecurity; land cover and land-use change and ecosystems; water resources andhydro-climatic disasters; and weather and climate services (Fig. 16.4).The SERVIR logo depicts a human figure at the centre of the Earth and represents auser-centric approach. These brand elements were reproduced across all knowledgeproducts, ranging from the website to printed materials—information sheets, pos-ters, and branded marketing collaterals—for a consistent look and feel across allproducts. The brand elements communicate the essence of the science applicationsbeing presented, while also making them visually appealing.
16.7.2 Knowledge Products and Marketing Collaterals
SERVIR-HKH commissioned and updated brochures, factsheets, informationsheets, posters, and infographics in local languages (as needed) for dissemination tothe target audiences (Table 16.1). Editorial photographs from the region andbespoke illustrations help convey the connection between space to village, and theseverity of natural disaster situations like droughts and extreme weather events. Theuse of such materials helped provide the context for the marketing collateralsdeveloped for different outreach events—such as consultation workshops,country-specific fairs, and exhibitions and conferences. The marketing collateralsdeveloped for country-specific fairs and exhibitions (Fig. 16.5) made SERVIRscience more accessible and comprehensible to visitors.
While participating in the regional and country-specific fairs and exhibitions,and during the celebration of international days—GIS Day, Earth Day—thathighlighted the contributions of EO and GIT to societal welfare, such collateralsprovided good outreach opportunities for SERVIR while also helping it spreadawareness on and spike interest in EO and GIT.
SERVIR-HKH also developed training manuals and video walk-throughs forrelevant science applications, and short multimedia primers around the thematictopics and/or products and services. The training materials—presentations, exer-cises, and workbooks developed for different training—are available for free
Fig. 16.4 Brand elements around the four thematic priorities developed for usage as marketingcollateral
316 B. Bajracharya et al.
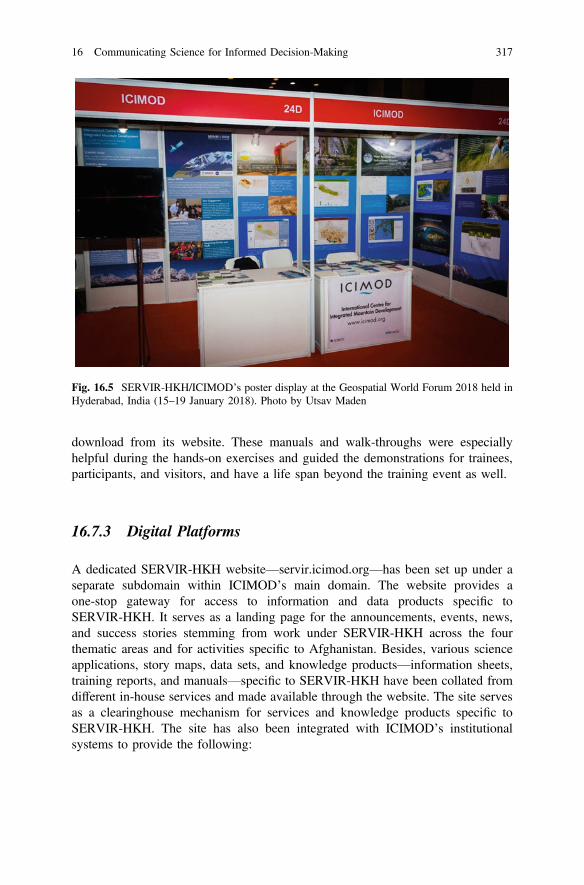
download from its website. These manuals and walk-throughs were especiallyhelpful during the hands-on exercises and guided the demonstrations for trainees,participants, and visitors, and have a life span beyond the training event as well.
16.7.3 Digital Platforms
A dedicated SERVIR-HKH website—servir.icimod.org—has been set up under aseparate subdomain within ICIMOD’s main domain. The website provides aone-stop gateway for access to information and data products specific toSERVIR-HKH. It serves as a landing page for the announcements, events, news,and success stories stemming from work under SERVIR-HKH across the fourthematic areas and for activities specific to Afghanistan. Besides, various scienceapplications, story maps, data sets, and knowledge products—information sheets,training reports, and manuals—specific to SERVIR-HKH have been collated fromdifferent in-house services and made available through the website. The site servesas a clearinghouse mechanism for services and knowledge products specific toSERVIR-HKH. The site has also been integrated with ICIMOD’s institutionalsystems to provide the following:
Fig. 16.5 SERVIR-HKH/ICIMOD’s poster display at the Geospatial World Forum 2018 held inHyderabad, India (15–19 January 2018). Photo by Utsav Maden
16 Communicating Science for Informed Decision-Making 317
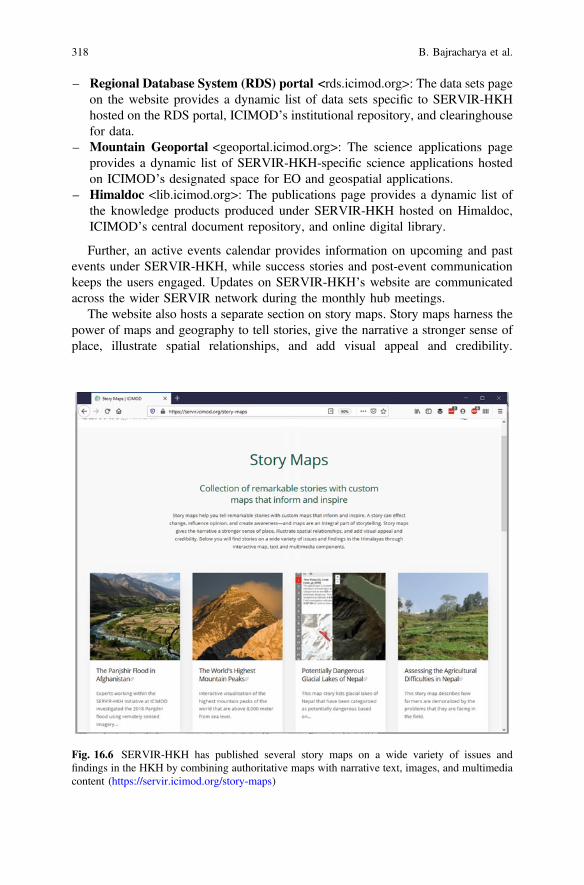
– Regional Database System (RDS) portal <rds.icimod.org>: The data sets pageon the website provides a dynamic list of data sets specific to SERVIR-HKHhosted on the RDS portal, ICIMOD’s institutional repository, and clearinghousefor data.
– Mountain Geoportal <geoportal.icimod.org>: The science applications pageprovides a dynamic list of SERVIR-HKH-specific science applications hostedon ICIMOD’s designated space for EO and geospatial applications.
– Himaldoc <lib.icimod.org>: The publications page provides a dynamic list ofthe knowledge products produced under SERVIR-HKH hosted on Himaldoc,ICIMOD’s central document repository, and online digital library.
Further, an active events calendar provides information on upcoming and pastevents under SERVIR-HKH, while success stories and post-event communicationkeeps the users engaged. Updates on SERVIR-HKH’s website are communicatedacross the wider SERVIR network during the monthly hub meetings.
The website also hosts a separate section on story maps. Story maps harness thepower of maps and geography to tell stories, give the narrative a stronger sense ofplace, illustrate spatial relationships, and add visual appeal and credibility.
Fig. 16.6 SERVIR-HKH has published several story maps on a wide variety of issues andfindings in the HKH by combining authoritative maps with narrative text, images, and multimediacontent (https://servir.icimod.org/story-maps)
318 B. Bajracharya et al.
SERVIR-HKH has published several story maps on a wide variety of issues andfindings in the HKH by combining authoritative maps with narrative text, images,and multimedia content (Fig. 16.6). These story maps serve as an important tool forpublic engagement and have been made available on the SERVIR-HKH website.These maps are also periodically shared via the institutional social media handles.
The underpinning of SERVIR-HKH’s digital presence requires dedicated andskilled human resources conversant in knowledge management and communica-tion, web development and standards, and also in geospatial information andstandards. Besides, an editorial calendar, regular internal communication, andstandardized operating procedures in-house and across the network, as well asmonitoring and regular follow-ups ensure uptime and synchronize updates betweenthe different systems.
16.7.4 Engagement with the Media
Often, the media does not fully appreciate the inherent importance of science due toinadequate scientific education and tends to misrepresent or obstruct rather thanfacilitate communication between scientists and the public. Close cooperationbetween scientists and journalists is important to fulfil the media’s social respon-sibility to inform and educate the public (Fjæstad 2007). Engaged appropriately, themedia can act as an intermediary and help translate our science into more accessibleforms and relay it to a general audience. The media can help amplify our reach andhelp us with quality assurance by letting us know if our messaging needs to besimplified or fine-tuned. SERVIR-HKH releases press statements and media briefsaround major regional and national outreach events and product launches. It alsoworks closely with ICIMOD’s media unit to identify relevant journalists to par-ticipate and contribute to outreach events. This engagement with the media hasresulted in positive outcomes and reportage of SERVIR’s work in major nationaland vernacular outlets in SERVIR-HKH’s focus countries. Also, the links to mediareports about SERVIR-HKH’s work are routinely captured and made available as“media coverage” on its website.
Inviting journalists to national outreach and dissemination workshops as well asto regional knowledge forums were especially helpful in getting the message out onSERVIR-HKH’s work in the region, while also educating the mediapersons on theongoing work and capabilities of EO and GIT applications. In this regard, part-nerships and engagement with the media through media-centric training workshops,editorial and knowledge partnerships, and story grants could help us in promotingand translating SERVIR-HKH’s science, while also making it more accessible to awider audience.
16 Communicating Science for Informed Decision-Making 319

16.7.5 Social Media Presence
The evolution of social media platforms and their growing use by all sectors of thesociety provide unprecedented opportunities to reach large audiences, therebyenabling active engagement through online two-way communication (Third Wave2013). Social media makes it possible to share and participate in a variety ofactivities and represent an increasingly important way for brands to communicatewith the attractive audience segments (Ashley and Tuten 2015). These platforms areespecially effective in real-time information dissemination, strategic communica-tion, research, user relationship management, and brand promotion. SERVIR-HKHmade use of ICIMOD’s institutional social media handles on multiple platformssuch as Facebook, Instagram, LinkedIn, and Twitter to engage with its audiences.#SERVIRHKH, #space2village #Data2Action were used as the hashtag to distin-guish posts specific to SERVIR-HKH (Fig. 16.7). Its social media presence wasactively supported by daily media monitoring and social listening to captureinstances of SERVIR-HKH’s work being featured in the media and social media.A dedicated social media calendar made optimal use of international days andmajor events to create campaigns for greater visibility and reach forSERVIR-HKH’s services. SERVIR-HKH also supported the resharing of postsrelated to activities of other SERVIR hubs and the SERVIR Global Program.
Our social media campaigns have provided much-needed visibility to our workand directed traffic to the SERVIR-HKH website. For instance, when we collab-orated with the SERVIR Global Program’s social media campaign revolving theInternational Women’s Day in 2018, it helped promote and highlight women’s rolewithin the SERVIR Global network. We believe that dedicated social mediacampaigns around outreach events and product launches will definitely help increating a better profile for SERVIR among the public. Despite an overall spurt inthe use of social media by individuals, the use of this platform and the web is still ata nascent stage as far as the governments and institutions of the HKH areconcerned.
16.8 Documentation: Use Cases to Capture How a ServiceIs Used
Use cases help illustrate how SERVIR-HKH services—tools, products, data,training, etc.—are being applied in the real world. These use cases help capture theactual use by a particular user and document how a user interfaced withSERVIR-HKH and how its service was utilized, which then leads to tangible,positive outcomes. They help tell the story of a service, its application, and wherethe impact was either realized or expected, or both. A SERVIR-HKH application/service can have multiple instances of use, and so multiple use cases per institutionor user. Use cases are periodically developed in coordination with the users, the
320 B. Bajracharya et al.

SERVIR Support team, and the SERVIR Science Coordination Office, and pub-lished on the SERVIR Global website and service catalogue. For instance, the usecases of the FFWC in Bangladesh and the Department of Hydrology andMeteorology (DHM) in Nepal have been published, which documented how thetwo institutions availed of the Streamflow Prediction Tools (Fig. 16.8).
Fig. 16.7 SERVIR-HKH in social media
16 Communicating Science for Informed Decision-Making 321
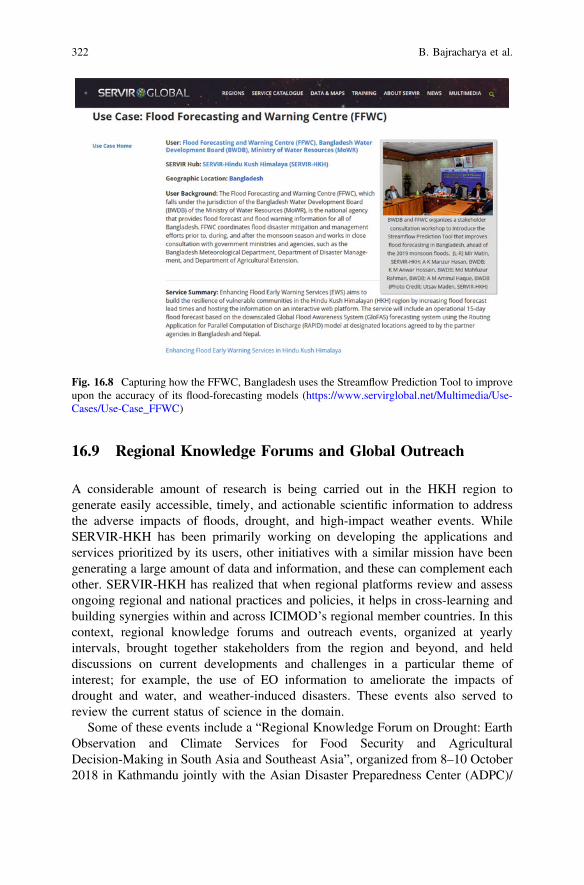
16.9 Regional Knowledge Forums and Global Outreach
A considerable amount of research is being carried out in the HKH region togenerate easily accessible, timely, and actionable scientific information to addressthe adverse impacts of floods, drought, and high-impact weather events. WhileSERVIR-HKH has been primarily working on developing the applications andservices prioritized by its users, other initiatives with a similar mission have beengenerating a large amount of data and information, and these can complement eachother. SERVIR-HKH has realized that when regional platforms review and assessongoing regional and national practices and policies, it helps in cross-learning andbuilding synergies within and across ICIMOD’s regional member countries. In thiscontext, regional knowledge forums and outreach events, organized at yearlyintervals, brought together stakeholders from the region and beyond, and helddiscussions on current developments and challenges in a particular theme ofinterest; for example, the use of EO information to ameliorate the impacts ofdrought and water, and weather-induced disasters. These events also served toreview the current status of science in the domain.
Some of these events include a “Regional Knowledge Forum on Drought: EarthObservation and Climate Services for Food Security and AgriculturalDecision-Making in South Asia and Southeast Asia”, organized from 8–10 October2018 in Kathmandu jointly with the Asian Disaster Preparedness Center (ADPC)/
Fig. 16.8 Capturing how the FFWC, Bangladesh uses the Streamflow Prediction Tool to improveupon the accuracy of its flood-forecasting models (https://www.servirglobal.net/Multimedia/Use-Cases/Use-Case_FFWC)
322 B. Bajracharya et al.

SERVIR-Mekong and the International Maize and Wheat Improvement Center(CIMMYT); this forum established an expert working group, comprising of rep-resentatives from different institutions working on drought early warning systemsand agricultural advisory services, to foster regional cooperation on agriculture,drought monitoring, and management. Another was a regional workshop in August2019 where the RDMOS was unveiled; this was organized by ICIMOD, CIMMYT,and the South Asian Association for Regional Cooperation’s (SAARC’s)Agriculture Centre in Islamabad, and was attended by policymakers, scientists, andgovernment officials. Similarly, a “Regional Knowledge Forum on Early Warningfor Flood and High Impact Weather Events” was organized in October 2019 inKathmandu to showcase developments in the Streamflow Prediction Tool and theHigh-Impact Weather Assessment Toolkit (HIWAT); this provided a platform todiscuss the challenges associated with the development, implementation, dissemi-nation, and sustained use of information services for water and weather-induceddisasters. Besides, SERVIR-HKH, together with SERVIR-Mekong and theNASA SERVIR Science Coordination Office, have regularly organized sessions onEO applications in South and Southeast Asia during the Annual AmericanGeophysical Union (AGU) fall meetings. The AGU event promotes discoveries inEarth and space science that have benefited humanity, and is the biggest gatheringof scientists across the globe. It provides a unique opportunity for scientists topresent their work and network with the global community. SERVIR-HKH has alsobeen regularly participating in the Group on Earth Observation (GEO) Summit andin the Geospatial World Forum which are global platforms to promote activities onEO/GIT, network with professionals and policymakers, and develop deeper col-laborations. Dedicated SERVIR exhibits at these events have been useful inreaching out to larger audiences. SERVIR-HKH has also collaborated with otherregional and international initiatives like Asia-Oceania GEO, Global ForestObservations Initiative (GFOI), and SIlvaCarbon, among others, to carry out more
Table 16.3 Key global and regional events organized/participated by SERVIR-HKH to showcaseits work
Date/venue Events
October 2018/Kathmandu
Regional Knowledge Forum on Drought: Earth Observation andClimate Services for Food Security and Agricultural Decision-makingin South Asia and Southeast Asia
October 2019/Kathmandu
Regional Knowledge Forum on Early Warning for Floods andHigh-Impact Weather Events
Annual/Differentcountries
Group on Earth Observation (GEO) Summit
Annual/Differentcountries
Asia-Oceania GEO Symposium
Annual/Differentcountries
Geospatial World Forum
Annual/USA American Geophysical Union (AGU) fall meetings
16 Communicating Science for Informed Decision-Making 323

capacity-building activities in the HKH region. The key global and regional eventsorganized by SERVIR-HKH and those in which it participates regularly are listed inTable 16.3.
16.10 Experiences and Way Forward
The diversity of SERVIR-HKH’s user base and the nature of information andservices it generates demand a comprehensive communications approach. TheService Planning Toolkit and SERVIR-HKH’s KMC Strategy have guided thedesign of outreach activities and the development of knowledge products andmarketing collaterals. Though the strategy provides a broader overview, theknowledge products, and marketing collaterals need to be customized to suit users’needs and contexts which vary at national and local levels.
After receiving comprehensive feedback from the users, the design and imple-mentation of the SERVIR-HKH applications and services underwent changes andwere further refined during the development process. We also recognized thatmarketing collaterals have to be updated frequently to account for these changes.Knowledge products and marketing collaterals undergo a rigorous review processin-house by designers, editors, and country focal persons before being released tothe public. The wider SERVIR network, comprising five hubs across the world,have lauded our approach—of bespoke illustrations, success stories, and story maps—at virtual and in-person meetings.
The primary user base of SERVIR-HKH’s services consists of informationproducers and decision makers. We have carried out language localization for someof our services; we also work with our partners to organize consultations, trainings,and outreach events in the vernacular language, and translate the knowledgeproducts into the vernacular language when required. These efforts could bemaximized to widen our user base and reach out to more beneficiaries.
While we do invite media persons and agencies to our outreach events andregional fora and pen op-eds in the newspapers, there’s a lot more to be done toeducate the media in becoming better science communicators and knowledgeintermediaries. The decision makers too have to be familiarized with the ways ofscientific communication.
Most SERVIR-HKH staff have academic backgrounds in science, technology,engineering, and mathematics (STEM), and their writing style is oriented towardsscientific conferences and forums. Therefore, we also prepare posters and socialmedia graphics using simplified infographics to cater to general audiences.However, given the scientific nature of SERVIR-HKH’s work, it is difficult tocapture and translate the scientific messages accurately to a lay audience.
SERVIR-HKH’s digital presence is underpinned through a dedicatedSERVIR-HKH website, which serves as the primary channel for data, information,and science applications, as well as for updates on training events and meetings.The news and stories posted on the website help in conveying information to the
324 B. Bajracharya et al.
general public in a timely manner. Ensuring that the information on different sci-ence applications are up to date is important as disruptions in data links, server, andcore software updates, and internet outages can affect uptime and the functioning ofthe science applications. User complaints received via the feedback form listed onthe SERVIR-HKH website and through conventional emails often alert the team ofsuch problems. Additionally, information about the science applications needs to beperiodically updated to account for changes in the focus and scope of theseapplications. Assigning dedicated human resources to monitor uptime, informationaccuracy, and relevance, and periodic calendared health checks and informationappraisals can be helpful in taking the appropriate measures.
A basic metric of digital engagement is the number of visitors to the website andthe number of downloads. We would experience a surge in the number of visitorswhen a major outreach event is around the corner or when there’s an open call forapplications, and this number would drop in the weeks that follow. Regular pro-motional campaigns—via email, social media, and in-person—are important todraw and sustain the attention of more users.
Social media presence is characterized by continuity and a focus on dialoguewith the users. Timing and dialogue are important considerations to understandwhich messaging strategies are most effective in achieving user engagement. Thesocial media landscape is constantly evolving, and brands and institutions areconstantly vying to increase their social media presence. However, complying withprotocols for institutional clearance while engaging with the media and social mediaaffect timeliness and relevance. What’s required is a clear strategy and process forengaging the media and also to respond to comments and feedback on social media.
Information about the actual impact of science communication on policy deci-sions is rather sparse as it is difficult to study, assess, and attribute how policy-makers are affected by scientific information and how they use it. It is almostimpossible to know with any certainty that a specific decision made by an indi-vidual or a group resulted from a specific encounter with a relevant piece ofinformation (NASEM 2017). SERVIR-HKH has been documenting all referenceson the use of its data or publications by national governments in their reporting orpolicy documents. While counting the number of website visits and engagementrates on social media do provide good proxy measures, more robust monitoring andevaluation tools are needed to capture outcomes and impacts. Now, with theCovid-19 pandemic in place and the resultant restrictions on travel and face-to-facemeetings, user engagement has shifted more towards virtual engagement, adoptingasynchronous modes of communication, and the need to over-communicate. Thisalso means there’s a need to reassess the existing modes of knowledge sharing andoutreach, as well as user engagement, and that there’s an opportunity to invent andadopt new modalities of communication. Ultimately, SERVIR’s goal of“Connecting Space to Village” can only be achieved through effective and efficientcommunication.
16 Communicating Science for Informed Decision-Making 325

References
Ashley C, Tuten T (2015) Creative strategies in social media marketing: an exploratory study ofbranded social content and consumer engagement. Psychol Market 32(1):15–27
Burns TW, O’Connor DJ, Stocklmayer SM (2003) Science communication: a contemporarydefinition. Public Understand. Sci. 12:183–202 (SAGE PUBLICATIONS www.sagepublica-tions.com)
Fjæstad B (2007) Why journalists report science as they do? In: Bauer MW, Bucchi M(eds) Journalism, science and society: science communication between news and publicrelations, Routledge studies in science, technology and society. Routledge Taylor & FrancisGroup. ISBN 978-0-415-37528-3
Holt DB (2003) Brands and Branding, Cultural Strategy GroupHovland I (2005) Successful communication: a toolkit for researchers and civil society
organisationsNASEM (National Academies of Sciences, Engineering, and Medicine) (2017). Communicating
science effectively: a research agenda. The National Academies Press, Washington, DC.https://doi.org/10.17226/23674
ICIMOD (2013) ICIMOD knowledge management & communication strategy. Internal document:unpublished
ICIMOD (2018) SERVIR hindu kush himalaya (SERVIR-HKH) knowledge management andcommunications strategy 2017/2018. Internal Document (unpublished)
Third Wave (2013) Social media strategy framework: a comprehensive guide to develop andimplement strategies for communicating on the social web. Version 1.1
UNIGGIM (2020) Strategic pathway 9: communication and engagement, Global ConsultationDraft, United Nations International Group on Geospatial Information Management
USAID (2016) USAID graphic standards manual and partner co-branding guide. USAID. https://www.usaid.gov/branding/gsm
Open Access This chapter is licensed under the terms of the Creative Commons Attribution 4.0International License (http://creativecommons.org/licenses/by/4.0/), which permits use, sharing,adaptation, distribution and reproduction in any medium or format, as long as you give appropriatecredit to the original author(s) and the source, provide a link to the Creative Commons license andindicate if changes were made.The images or other third party material in this chapter are included in the chapter’s Creative
Commons license, unless indicated otherwise in a credit line to the material. If material is notincluded in the chapter’s Creative Commons license and your intended use is not permitted bystatutory regulation or exceeds the permitted use, you will need to obtain permission directly fromthe copyright holder.
326 B. Bajracharya et al.
Chapter 17User Engagement for SustainingServices
Naina Shakya, Santosh Pathak, Birendra Bajracharya,and Mir A. Matin
17.1 Introduction
“Users’ Need First” was one of the significant lessons from the first phase ofSERVIR-HKH. There was a disconnect between the cutting-edge technologyproducts that were developed and the specific needs of the users. Thus,SERVIR-HKH needed a way to encourage and involve the users to actively col-laborate during the development and rollout of SERVIR’s products. SERVIRGlobal then developed a service planning approach (SPA), shifting the focus fromproducts to comprehensive services that put the users’ need first (Chap. 2). Serviceplanning provides a framework for actively engaging the stakeholders and endusers, starting from the design of the service to its delivery and adoption by theuser. This approach to user engagement improves the quality of the services byaddressing user feedback and also builds sustainability into the services from thevery beginning.
User engagement has multiple definitions, and there is no single definition thatcovers the term entirely. Since the last two decades, the human–computer inter-action community has become progressively interested in comprehending,designing for, and measuring user engagement with various computer-based fea-tures (Hassenzahl and Tractinsky 2006) involving education, gaming, social andnews media as well as search applications. User engagement, in the corporatesector, is the degree to which the users find products, services, and processes thatare interesting or useful. User engagement depends on the usability of the productsand services, the look and feel factor, the usefulness of the information, the scopefor interaction and participation of the users, and productivity that reflects theaccomplishment of the user’s goals (Spacey 2017). Thus, user engagement con-siders the ability and capacity to engage as well as sustain the engagement (O’Brien
N. Shakya (&) � S. Pathak � B. Bajracharya � M. A. MatinInternational Centre for Integrated Mountain Development, Kathmandu, Nepale-mail: [email protected]
© The Author(s) 2021B. Bajracharya et al. (eds.), Earth Observation Science and Applications for RiskReduction and Enhanced Resilience in Hindu Kush Himalaya Region,https://doi.org/10.1007/978-3-030-73569-2_17
327

et al. 2018). The engagement of the user is important because engagement andbehavior are implicitly connected to the level of individual interest. For example,the more time a person engages with a product, this means he or she is interested inthe product. The task of businesses is to find ways to improve user engagement andto ensure that the user spends more time with the product or service (CodeFuel2015).
With the primary objectives to promote the applications of geospatial tech-nologies and EO information, SERVIR-HKH works with diverse sets of userswhich include government agencies, development agencies, research/academicorganizations, non-governmental organizations, community-based organizations,and the private sector. For SERVIR-HKH, user engagement is a multifaceted,multi-stakeholder, and multi-country complex process with its challenges as well asopportunities. Systematic engagement with the users is important for a betterunderstanding of the problems and developing solutions to address these problems.In this regard, partnerships with key stakeholders for co-development, ownership aswell as for feedback from the broader stakeholders help in the sustainable impact ofthe services.
SPA (Chap. 2) recommends the engagement of various users in service planningdiscussions, starting with the identification of problems and culminating in thedelivery of products, tools, and services. The user engagement strategy andapproach were employed to guide the engagement with the user institutions in orderto build long-term mutually beneficial relationships with each user.
This chapter aims to introduce the concept of user engagement in the context ofSERVIR-HKH and its execution within the service planning framework; it alsodwells on the lessons that have been learnt. The chapter also gives prominence toexamples of user engagement case studies as well as to the tools and techniques thathave been adopted for successful user engagement. It also describes the insights,achievements, and experiences during the implementation process of the userengagement module in the HKH region.
17.2 User Landscape of SERVIR-HKH
SERVIR defines users as “individuals or institutions that consult SERVIR data,products or tools to fulfill a particular purpose. They can be analysts ordecision-makers who are often responsible for communicating to beneficiaries”(Chap. 2, Service Planning Toolkit 2017). The users include mandatory lineagencies on the thematic areas such as government ministries and departments,meteorological agencies, and census bureaus; academic and research organizationssuch as universities and research centers; and larger stakeholders such as subna-tional offices, extension agents, NGOs, media, relevant donor-funded projects,private-sector associations, and cooperatives. These users can be divided into threemain categories: primary users; secondary users, and end users. Below are thedescriptions of each of these categories of users.
328 N. Shakya et al.

Primary users
Primary users are organizations with institutional mandates to collect, analyze, andgenerate data or make policy decisions in a particular service area. They are usuallygovernment ministries and departments with which non-binding agreements havebeen signed, namely: memorandum of understanding (MoU) and letter of intent(LoI). In the case of SERVIR-HKH, while MoUs were signed with ministry-levelgovernmental agencies of Afghanistan, Bangladesh, Nepal, and Pakistan, LoIs weresigned with the relevant departments of government agencies, academic institu-tions, and international development organizations working in these countries.Primary users are the immediate users of a service and are in a position to supportthe uptake and enhance the development impact of the service by usage and dis-semination. SERVIR-HKH collaborated with these users right from the stage ofscoping and needs assessment.
Secondary users
The second category of users comprises organizations that are part of the con-stituency of primary users; they are expected to use the services to support theirdecision-making process but are not directly involved in data generation or analysis.In this regard, formal agreements with SERVIR-HKH may not be established.However, they are associated through certain service-level activities in terms ofreviewing service products, providing inputs for improvements, and also using theproducts. SERVIR-HKH works with these users directly or through the primaryusers. These secondary users are in a position to support the uptake and enhance thedevelopment impact of a service via usage and dissemination.
End users/beneficiaries
The third category comprises those who will benefit from the use of the servicesby the primary and secondary users. SERVIR-HKH tries to ensure innovativeapproaches for enhancing products and services uptake with the end users. Endusers could also be representatives from under-represented audiences, especiallythose marginalized by gender, geography, or by access to technology;community-level agencies; researchers; private-sector entities; and identified orpotential users, including individuals who are not directly involved in the designprocess. Their needs and expectations are addressed to the extent possible throughthe inputs of the primary users who are mainly responsible towards these users.Though these set of users may not have been consulted during the productdevelopment process, they are critical in achieving the intended impacts from theservice. Thus, through service planning as an inclusive process, creating anddelivering customizable solutions to the end users are envisaged in the longerterm.
17 User Engagement for Sustaining Services 329
17.3 User Engagement Strategy
The diversity and landscape of the users are constantly changing and this has animpact on how to keep the users engaged. In this context, innovative engagementstrategies, plans, and methods are required to be proactively more reachable,inclusive, and versatile than ever before (IGIF 2018). There are a set of processes toensure that the services and products respond to the needs of the users and/or createnew needs. The services and products that SERVIR-HKH develops are intended tosupport informed decision-making and are to be used by agencies to serve theirneeds. Therefore, it is important not only to engage the users but also to co-createthe products with the users. Each user has his or her own individual priorities, waysof working, and systems, depending on the constituencies they serve. Theco-creation process entails open discussions on these priorities and the ways ofworking in alignment with the product features, user interface, and to ensure thatthere is a sense of ownership among the users with a greater likelihood of theproducts and services being used effectively. Therefore, an engagement approachwas adopted for a meaningful and fit-for-purpose user engagement and adds valueto the products and processes with more connect and sense of ownership.
SERVIR-HKH has in place a comprehensive User Engagement Strategy. Thisstrategy serves as a guiding document for systematically engaging the users throughclose interactions and has helped in fostering understanding among SERVIR’snational, regional, and global partners. This has also helped in the users being at theforefront of technological innovations and has enhanced the value of the products tothe users, thereby ensuring that the products are used more appropriately.Furthermore, the strategy explains the user types, levels of engagements, and thetools and techniques that are to be used in developing appropriate platforms forsustained upscaling and enhancement of product uptake.
The User Engagement Strategy is a general plan to achieve effectiveservice-level user engagement at different phases of service planning and design,and to ensure that the services and products are co-designed and co-implementedwith the partners. This strategy of SERVIR-HKH is composed of two main parts:the user engagement approach; and the user engagement cycle which includesrelated activities that can strengthen user engagement.
17.3.1 User Engagement Approach
The user engagement approach of SERVIR-HKH has been adapted from thepartnership module of the Partnership Brokers Association (PBA, www.partner-shipbrokers.org) which is based on internationally recognized principles, frame-works, and partnership cycles. The approach is grounded in the key principles ofdiversity, equity, openness, mutual benefit, and courage (ICIMOD 2017).
330 N. Shakya et al.

Diversity means that all the users will have different ideas, unique expertise,knowledge, and institutional culture, which should be embraced for creating newvalues and innovations. For SERVIR-HKH, it is very important to acknowledgethese regional diversities and variations that each user brings, and to use them tobuild on effective user engagement with the aim of creating new values.
Equity means that all the users are treated equitably, that their voices are heard,and their contributions are valued. For SERVIR-HKH, this means that all the usersin the region, irrespective of their size, have an equal right to be heard and tocontribute. It means that SERVIR-HKH and the users will each contribute to thepartnership from their areas of competence and strength, and will respect anduphold each other’s commitments. Where genuine equity exists, the users are muchmore likely to value and respect each other’s contributions.
Openness refers to enabling an environment of transparency. SERVIR-HKH’spractices are open and honest in their dealings with the users; they do not inten-tionally withhold information and they make decisions based on dialogue andmutual understanding. It is all too well known that transparency plays a vital role inbuilding trust, which, in turn, ensures accountability among the users.
Mutual benefit recognizes that different users may be involved in projects/initiatives for different reasons, but all of them are striving towards achieving thesame goals. For SERVIR-HKH, it is important to be able to discuss and recognizeeach user’s individual reasons for being involved and ensure that these are met.When mutual benefits exist, there is a greater possibility that the users will continueto engage and look for solutions even in difficult situations. Thereby, services arelikely to be much more sustainable.
Courage refers to encouraging users to work together more closely in areas ofuncertainty in order to achieve breakthrough results. Equipped with the courage toconfront challenging situations and take the user into confidence, SERVIR-HKHwill be able to take up new innovations and approaches that can add value to theoverall objectives.
17.3.2 User Engagement Cycle
The user engagement cycle (ICIMOD 2017) has been designed along three keystages. The cycle follows a step-by-step process with a series of practical guidelinesand procedures for developing, managing, and maintaining user engagement(Fig. 17.1). Each of the steps indicated in the cycle are explained below as well asthe related activities.
i. Needs Assessment
Stakeholder mapping and consultations
The major activities during the needs assessment phase were stakeholder mappingand holding stakeholder consultation workshops. An important aspect of
17 User Engagement for Sustaining Services 331

stakeholder mapping from the SERVIR perspective is to understand the flow ofinformation, mandates, and functions. As explained in Chap. 2, stakeholder-mapping exercises are conducted in order to understand the user landscape for aparticular service area. The stakeholder-mapping exercise helped in the identifica-tion of primary and secondary users and beneficiaries. This initial approach entailedscoping and identifying the users through consultation workshops conducted ineach country on the relevant thematic areas. Through these exercises, the identifi-cation and assessment of potential users, along with their needs, existing gaps,expectations, and possible contributions, were discussed. This exercise involved awide range of stakeholders in each service area in the target countries. This provedeffective in mapping the relevant set of users for further engagement with SERVIR.The workshops were consciously designed to create an environment of open dis-cussion, exchange of information, and negotiations; these also helped in creating abetter understanding among the SERVIR-HKH team and its potential partnersabout the activities that were to be undertaken.
Thus, even if a potential partner had the mandate in a particular service area,there was the need to align goals, objectives, and interests between the potentialpartner and SERVIR-HKH. In this regard, there were some pertinent questions tobe taken into consideration: what would be the complementary contribution ofSERVIR-HKH; is there a duplication in effort; and, is the organization willing to
Fig. 17.1 User engagement cycle and activities
332 N. Shakya et al.

take the ownership of the service and continue in a sustainable manner? Then,capacity assessments of the potential partners (Chap. 3) were carried out to identifytheir capacity-building needs in terms of human resources, data-generation/sharingpolicies and practices, and the mandated services provided to the end users.
ii. Service design
During the service design phase, user engagement involved a number of activitiesthat included establishing formal partnerships with the primary stakeholders,holding consultation workshops for users’ orientation and feedback, carrying outregular interactions for strengthening relationships, and preparing documents.
Forming partnerships
In the context of SERVIR service planning, the primary and secondary users thatwere identified were mainly government ministries, departments/subnational offi-ces, and other relevant organizations. The discussions with these governmentagencies veered around co-developing the applications with support mainly fortechnology transfer and capacity-building activities. Thus, to develop a sense ofownership and strengthen the commitment of these primary users, partnershipinstruments such as MoU and LoI were designed. The signing of such an agreementhelped in building a strong partnership—keeping in mind the principles of equity,transparency, and mutual respect. The MoU was signed for agreement on broaderareas of institutional collaboration, while the LoI was a non-binding partnershipinstrument without financial obligations to either organization in order to establishstrategic alliance in the areas of mutual interest, especially in the areas of knowl-edge sharing and research. The overall agreement outlined the alliance in jointactivities and listed out the complementary values that each partner would bring tothe partnership. The partnership instruments thus expedited and formalized theprocesses of user engagement and also helped to outline mutual commitment andresponsibilities. The partnership landscape of SERVIR-HKH in terms of the serviceareas is presented in Fig. 17.2.
Consultation workshops for user orientation and feedback
Focused service-wise workshops were conducted in each country for orientationand discussions on the methodologies, outputs, and design aspects of the productsand services. The workshops were tailor-designed to initiate discussions and tobrainstorm in order to have clarity on the co-development of the service products.Discussions were also held on ToC and the User Engagement Strategy andapproach. These workshops helped to create a common understanding among allthe stakeholders so as to facilitate better and effective exchange of ideas andknowledge, and to get feedback on the service design. The workshops also con-tributed to strengthening the SERVIR network and presence in the membercountries and fostered collaboration in the implementation of the activities. Overall,these workshops helped the SERVIR-HKH team to arrive at a better understandingabout its roles and responsibilities as well as about the expectations of the users andthereby agree on a set of joint activities.
17 User Engagement for Sustaining Services 333

Relationship-building interactions
Relationship-building activities were conducted with potential partners and usersthrough meetings and discussions, followed by negotiations and planning withthese organizations for mutual consent, and finally developing an appropriatepartnership instrument/agreement to formalize the partnership. It was important tolay emphasis on the fact that each of these organizations added value and that therewould be clear benefits for these organizations; it was also emphasized that therewould be minimal institutional risks and that the overall aim was to aid effectivedecision-making and support the stakeholders.
Fig. 17.2 Consolidated user landscape according to a service area, b country. Note AfghanistanMeteorological Department (AMD), Bangladesh Meteorological Department (BMD), BangladeshAgricultural Research Council (BARC), Bangladesh Space Research and Remote SensingOrganization (SPARRSO); Centre for Environmental and Geographic Information Services(CEGIS), International Maize and Wheat Improvement Center (CIMMYT); Department ofAgriculture (DoA); Department of Agricultural Extension (DAE); Department of Hydrology andMeteorology (DHM); Department of Forests and Soil Conservation (DoFSC); Department ofDisaster Management (DDM); Famine Early Warning Systems Network (FEWS-NET); Food andAgriculture Organization (FAO)-Afghanistan; Flood Forecasting and Warning Centre (FFWC);Forest Department (FD); Forest Research and Training Center (FRTC); Federation of CommunityForestry Users Nepal (FECOFUN); BUET—Institute of Water and Flood Management (IWFM);Institute of Water Modelling (IWM); Jahangirnagar University—Institute of Remote Sensing(JU-IRS); Kabul University (KU); Local Government Engineering Department (LGED); MercyCorps (MC); Ministry of Agriculture, Irrigation and Livestock (MAIL); Ministry of Agricultureand Livestock Development (MoALD); Ministry of Home Affairs (MoHA); National WaterAffairs Regulation Authority (NWARA); National Environmental Protection Agency (NEPA);Nangarhar University (NU); Nepal Agricultural Research Council (NARC); Practical Action (PA);Pakistan Meteorological Department (PMD); Pakistan Council of Research in Water Resources(PCRWR); Pakistan Agriculture Research Council (PARC); World Food Programme (WFP);World Wide Fund (WWF)
334 N. Shakya et al.
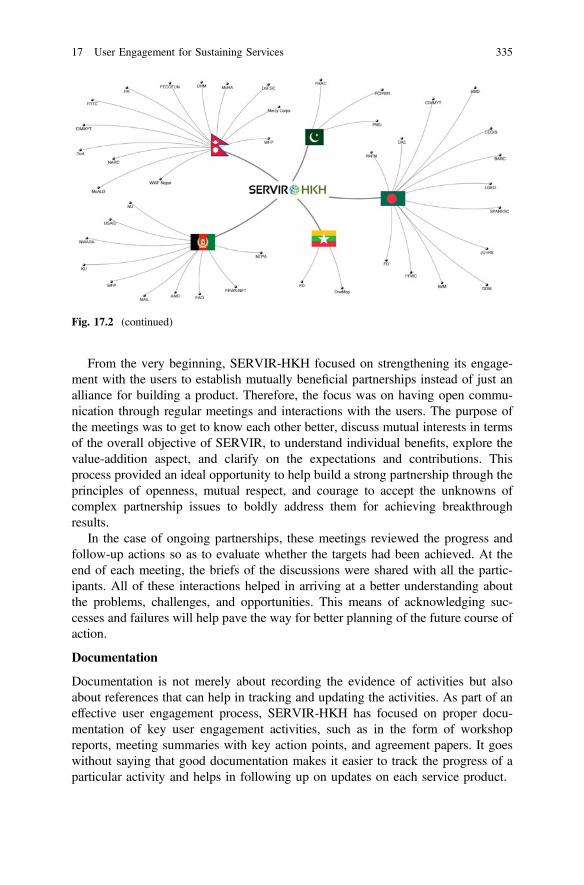
From the very beginning, SERVIR-HKH focused on strengthening its engage-ment with the users to establish mutually beneficial partnerships instead of just analliance for building a product. Therefore, the focus was on having open commu-nication through regular meetings and interactions with the users. The purpose ofthe meetings was to get to know each other better, discuss mutual interests in termsof the overall objective of SERVIR, to understand individual benefits, explore thevalue-addition aspect, and clarify on the expectations and contributions. Thisprocess provided an ideal opportunity to help build a strong partnership through theprinciples of openness, mutual respect, and courage to accept the unknowns ofcomplex partnership issues to boldly address them for achieving breakthroughresults.
In the case of ongoing partnerships, these meetings reviewed the progress andfollow-up actions so as to evaluate whether the targets had been achieved. At theend of each meeting, the briefs of the discussions were shared with all the partic-ipants. All of these interactions helped in arriving at a better understanding aboutthe problems, challenges, and opportunities. This means of acknowledging suc-cesses and failures will help pave the way for better planning of the future course ofaction.
Documentation
Documentation is not merely about recording the evidence of activities but alsoabout references that can help in tracking and updating the activities. As part of aneffective user engagement process, SERVIR-HKH has focused on proper docu-mentation of key user engagement activities, such as in the form of workshopreports, meeting summaries with key action points, and agreement papers. It goeswithout saying that good documentation makes it easier to track the progress of aparticular activity and helps in following up on updates on each service product.
Fig. 17.2 (continued)
17 User Engagement for Sustaining Services 335

iii. Service delivery
Wider dissemination and uptake
Once the services segment was completed, dissemination workshops were held forthe wider user community. Also, there was a seeking of additional partners andpotential beneficiaries who could take up the services and ensure their sustainableuse. Multi-stakeholder workshops were also conducted in order to extensivelydisseminate the service products and to strengthen user engagement for wideradoption and use of the services. Aligned with the service planning approach, theobjective of these workshops was to work together with the users and a wider rangeof stakeholders, thereby enabling the sharing of the various SERVIR-HKH serviceproducts and also building awareness. The workshops also helped ensure that theservices and products were of interest and that there were potential beneficiarieswho would use and upscale these products. Besides, the workshops and learningsessions were platforms for sharing experiences and ideas. This provided a greatopportunity for cross-learning among the users.
The final set of workshops also hoped to receive feedback on the sustainable useof the service products beyond the sphere of SERVIR-HKH and on constructiveinputs for the next phase. An important objective of the meetings and discussionswas also to explore potential for outscaling and uptake from a wider range ofrelevant stakeholders, including professionals and researchers from governmentagencies, the private sector, academia, NGOs, and other institutions engaged inproviding similar services. The process also considered the interest and engagementof the users beyond the life of SERVIR-HKH. Besides, the dissemination work-shops and interactions with the users sought how to increase user engagement andcapacity building, keeping in mind the aspect of gender and social inclusion as perthe mandate of ToC. Targeted communication products were also designed anddistributed to increase the outreach and visibility of SERVIR-HKH in the regionand beyond.
17.3.3 Crosscutting Activities
Integration with service support functions
As part of the user engagement process, close integration with the other servicesupport functions was equally important. These functions included monitoring andevaluation (Chap. 18), the aspect of gender (Chap. 15), communication (Chap. 16),and capacity building (Chap. 14). Thus, the user engagement process ensured thatthese functions were in sync with the service planning approach. This was executedthrough an integrated approach while designing and conducting workshops andtraining events with the users; there were also regular internal meetings to shareprogress/updates and discuss the challenges. The institutionalization of the user
336 N. Shakya et al.
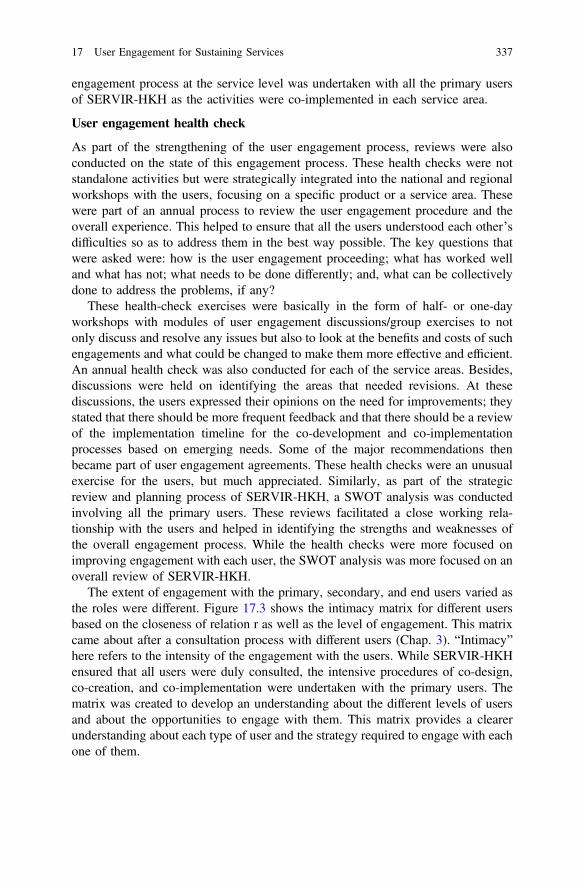
engagement process at the service level was undertaken with all the primary usersof SERVIR-HKH as the activities were co-implemented in each service area.
User engagement health check
As part of the strengthening of the user engagement process, reviews were alsoconducted on the state of this engagement process. These health checks were notstandalone activities but were strategically integrated into the national and regionalworkshops with the users, focusing on a specific product or a service area. Thesewere part of an annual process to review the user engagement procedure and theoverall experience. This helped to ensure that all the users understood each other’sdifficulties so as to address them in the best way possible. The key questions thatwere asked were: how is the user engagement proceeding; what has worked welland what has not; what needs to be done differently; and, what can be collectivelydone to address the problems, if any?
These health-check exercises were basically in the form of half- or one-dayworkshops with modules of user engagement discussions/group exercises to notonly discuss and resolve any issues but also to look at the benefits and costs of suchengagements and what could be changed to make them more effective and efficient.An annual health check was also conducted for each of the service areas. Besides,discussions were held on identifying the areas that needed revisions. At thesediscussions, the users expressed their opinions on the need for improvements; theystated that there should be more frequent feedback and that there should be a reviewof the implementation timeline for the co-development and co-implementationprocesses based on emerging needs. Some of the major recommendations thenbecame part of user engagement agreements. These health checks were an unusualexercise for the users, but much appreciated. Similarly, as part of the strategicreview and planning process of SERVIR-HKH, a SWOT analysis was conductedinvolving all the primary users. These reviews facilitated a close working rela-tionship with the users and helped in identifying the strengths and weaknesses ofthe overall engagement process. While the health checks were more focused onimproving engagement with each user, the SWOT analysis was more focused on anoverall review of SERVIR-HKH.
The extent of engagement with the primary, secondary, and end users varied asthe roles were different. Figure 17.3 shows the intimacy matrix for different usersbased on the closeness of relation r as well as the level of engagement. This matrixcame about after a consultation process with different users (Chap. 3). “Intimacy”here refers to the intensity of the engagement with the users. While SERVIR-HKHensured that all users were duly consulted, the intensive procedures of co-design,co-creation, and co-implementation were undertaken with the primary users. Thematrix was created to develop an understanding about the different levels of usersand about the opportunities to engage with them. This matrix provides a clearerunderstanding about each type of user and the strategy required to engage with eachone of them.
17 User Engagement for Sustaining Services 337
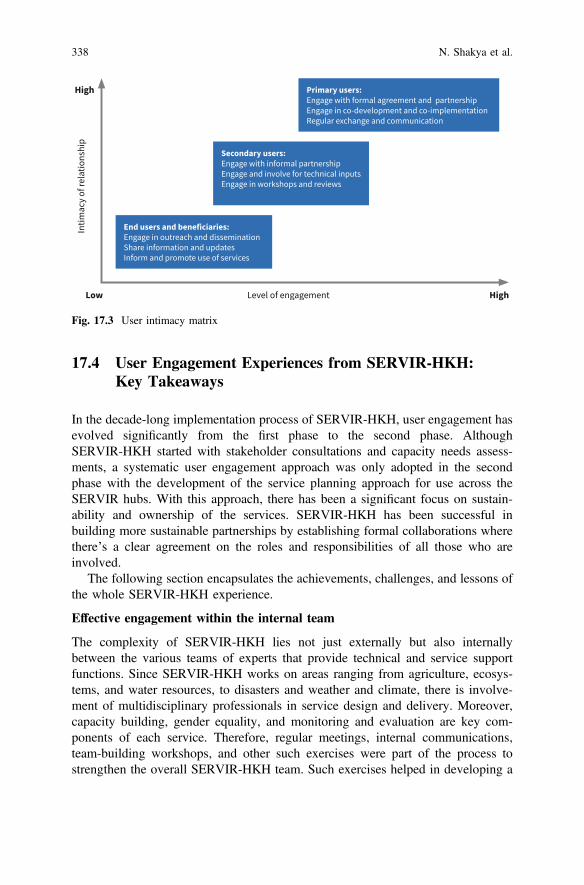
17.4 User Engagement Experiences from SERVIR-HKH:Key Takeaways
In the decade-long implementation process of SERVIR-HKH, user engagement hasevolved significantly from the first phase to the second phase. AlthoughSERVIR-HKH started with stakeholder consultations and capacity needs assess-ments, a systematic user engagement approach was only adopted in the secondphase with the development of the service planning approach for use across theSERVIR hubs. With this approach, there has been a significant focus on sustain-ability and ownership of the services. SERVIR-HKH has been successful inbuilding more sustainable partnerships by establishing formal collaborations wherethere’s a clear agreement on the roles and responsibilities of all those who areinvolved.
The following section encapsulates the achievements, challenges, and lessons ofthe whole SERVIR-HKH experience.
Effective engagement within the internal team
The complexity of SERVIR-HKH lies not just externally but also internallybetween the various teams of experts that provide technical and service supportfunctions. Since SERVIR-HKH works on areas ranging from agriculture, ecosys-tems, and water resources, to disasters and weather and climate, there is involve-ment of multidisciplinary professionals in service design and delivery. Moreover,capacity building, gender equality, and monitoring and evaluation are key com-ponents of each service. Therefore, regular meetings, internal communications,team-building workshops, and other such exercises were part of the process tostrengthen the overall SERVIR-HKH team. Such exercises helped in developing a
Fig. 17.3 User intimacy matrix
338 N. Shakya et al.
common understanding and bringing uniformity among the SERVIR-HKH teammembers while interacting with the partners. They also helped to increase the teamsynergy and efficiency because of better coordination.
Every user has its own strengths and challenges
When a service is successfully implemented with a user, it doesn’t mean the samewill happen with the others as well. Each user has its own set of unique issues andstrengths, and therefore, the engagement should be focused on addressing theproblems and complementing the strengths. Mechanisms such as SWOT analysis,scoping, and consultation workshops are helpful in understanding these aspects.Having the “right” or “fit-for-purpose” partner is critical, so a lot of effort has to gointo the selection of partners. This means following the due diligence process thatinvolves scoping and identifying the users through stakeholder mapping, consul-tations, and needs assessment. All of these help in forming a better understandingabout the users and their capacities, and about their interests as well as expectations.SERVIR-HKH used these processes and they were really helpful in getting to knowabout the perspectives of the users in terms of the challenges, opportunities, andtheir level of satisfaction. By knowing more about the users and their expectations,the path became smoother in co-developing and co-implementing the services.
Deepening the engagement
For an initiative like SERVIR-HKH or a similar one that focuses on co-design andco-development, it is important to lay emphasis on continuous and close engage-ment with the users. This requires constant communication, consultations, andmeetings. Also, there should be formal agreements (whether legally binding or not)with the users, especially when it comes to working with government users whereinthe bureaucratic structures often cause the transfer of some key focal persons;without any written agreements/documents, it is often difficult to follow up on aproject once the focal person gets transferred. This also means redundance in termsof sharing information and it even can bring a project to a standstill. In suchsituations, having an agreement is really helpful in that it reminds the focal personabout the agreement and the commitment he or she had made. However, it isimportant to draft this agreement in a way that it not only reflects the obligations butalso the roles. SERVIR-HKH has had such agreements with 15 users and thesewere instrumental in building a common understanding and clarity about mutualexpectations.
It is also important to understand that negotiations take time. SERVIR-HKHspent a good amount of the initial project period to identify the key implementingpartners and to negotiate on possible collaborations. These negotiations can betime-consuming and frustrating at times, especially with government agencies thathave their own processes and procedures. It took over two years with one of thepartners in Nepal and three years with another partner in Bangladesh to sign MoUswith SERVIR-HKH. However, this is a very important step to bring mutual clarityaround the roles and contributions from all the engaged users, and the collabora-tions with FRTC and BMD are seen as successes of SERVIR-HKH.
17 User Engagement for Sustaining Services 339
Thinking together and clarifying expectations
Co-design and co-implementation demand a lot of collective effort on the part of thestakeholders and users, especially when the applications are to be ultimately ownedby the users; so, a lot of effort and resources need to be invested on consultations,meetings, and workshops. During the implementation phases of SERVIR-HKH, alot of such physical and virtual events were conducted. And through this constantprocess of communication and sharing of experiences, there came about a clarity onthe expectations, thereby increasing mutual trust in the partnership. It is alsoimportant to understand that partnerships will be successful only if there is mutualbenefit. SERVIR-HKH often received one common question from most of theusers: “What will we get out of this partnership?” Working together and exploringbenefits from partnerships are really important to maintain consistent interestamong the users. This was possible with the implementation of the engagementapproach and the engagement cycle, which really helped in forging partnerships.This also helped in developing a common understating and clarifying expectationsfrom each other. The key principles of diversity, equity, openness, mutual benefit,and courage helped the partners to engage and communicate in a more effectiveway.
Unique situations with partners
SERVIR-HKH works in five countries, mainly with the mandated governmentagencies as the implementing partners. The engagements in these different countriesare also guided by varying policies, institutional setups, human resources, and ITcapacities. Therefore, a single approach is not suitable for all kinds of partnerships,and the engagement process with each of the partners requires specific considera-tions. What is more important is the development of a broader strategy and workaround each separate partnership. The patterns of user engagement may comeacross as unpredictable and unexpected at times. A case from Afghanistan is worthmentioning here. Afghanistan’s MAIL is a key partner of SERVIR-HKH.Following the initial needs assessment process, wheat-area mapping was expressedas a priority of the country and SERVIR-HKH was requested for its support.Responding to the need, SERVIR developed a methodology together with NASAfor in-season wheat mapping using both optical and SAR images on the GEEplatform. During the co-development process, SERVIR-HKH trained the MAILstaff on the methodology and the tools. However, by the time the results were beingfinalized, the official mandate of wheat mapping was transferred from MAIL to theNational Statistic and Information Authority (NSIA) and all the staff trained bySERVIR-HKH left MAIL to join other institutions.
Investment in human resources
It is ultimately the human resources who will be ensuring the quality of work andhelping to deliver, and it has no substitute. Therefore, it is always critical to investin human resources and improve their capacity and skills. Particularly in the case ofSERVIR-HKH, which is heavy on science and technology, it is important to ensure
340 N. Shakya et al.
that the human resources have the required knowledge and are on par with theupdates. The higher the level of ownership and satisfaction among the humanresources, the higher the effectiveness and innovations in the implementation of aproject. In this context, SERVIR-HKH accords high priority to training the staff ofthe partner organizations, especially via on-the-job trainings. This has been aneffective and rewarding process as the capacity of these staffs has been enhancedand now they conduct such trainings to other beneficiaries independently. One suchimpact was when SERVIR-HKH conducted a training on “Remote Sensing &Geographical Information System for Water Resource Management” to represen-tatives from Kabul University. Subsequently, the professors from this universityindependently conducted this training to a wider group of beneficiaries inAfghanistan; this was also included as part of a course in the university. While suchan approach builds the confidence of the staff on the use of tools and technologies,this also helps in building inter-personal relations among partner organizations andSERVIR-HKH.
Project is what partnership delivers
Often, while implementing projects, the focus is around output, outcome, andsuccessful closure. In that process, very often, one tends to forget that the success ofa project depends on the success of partnerships. Right from the beginning, enoughattention should be paid to selecting the right user, establishing good relations withthe user institutions, and then managing and maintaining these relationships. It’sultimately mutual trust that delivers a successful project.
Learn to listen to “no” and say ‘no” when needed
One of the lessons learnt has been that one has to be prepared to listen to negativefeedback from the user. Partner institutions may not always agree with all theprocedures of a project; they may even walk out of the project. So, it’s important tobe prepared for such surprises and work around a thorny issue to find solutions oralternatives. At times, it is also important to say “no” when the user expectations arebeyond a project’s mandate. For the sake of transparency, saying “no” is equallyimportant as saying “yes”, but both have to be backed up with the right reasons.
References
CodeFuel (2015) What is user engagement? User engagement. https://www.codefuel.com/blog/what-is-user-engagement/
Hassenzahl M, Tractinsky N (2006) User experience—a research agenda. Behav Inform Technol25:91–97. https://doi.org/10.1080/01449290500330331
ICIMOD (2017) Partnership manualIGIF (2018) Integrated geospatial information framework a strategic guide to develop and
strengthen national geospatial information management part 1: overarching strategicframework
17 User Engagement for Sustaining Services 341

O’Brien HL, Caims P, Hall M (2018) A practical approach to measuring user engagement with therefined user engagement scale (UES) and new UES short form. Int J Hum Comput Stud112:28–39. Elsevier Publication. https://doi.org/10.1016/j.ijhcs.2018.01.004
Service Planning Toolkit (SPT) (2017) https://www.servirglobal.net/Portals/0/Documents/436ServicePlanningToolkit_2017-09-19.pdf
Spacey J (2017) 7 examples of user engagement, simplicable. https://simplicable.com/new/user-engagement
Open Access This chapter is licensed under the terms of the Creative Commons Attribution 4.0International License (http://creativecommons.org/licenses/by/4.0/), which permits use, sharing,adaptation, distribution and reproduction in any medium or format, as long as you give appropriatecredit to the original author(s) and the source, provide a link to the Creative Commons license andindicate if changes were made.The images or other third party material in this chapter are included in the chapter’s Creative
Commons license, unless indicated otherwise in a credit line to the material. If material is notincluded in the chapter’s Creative Commons license and your intended use is not permitted bystatutory regulation or exceeds the permitted use, you will need to obtain permission directly fromthe copyright holder.
342 N. Shakya et al.
Chapter 18Approach and Process for EffectivePlanning, Monitoring, and Evaluation
Lalu Maya Kadel, Farid Ahmad, and Ganesh Bhattarai
18.1 Introduction
The use of Earth observation (EO) information and geospatial information tech-nologies (GIT) for evidence-based decision making is a growing opportunity becauseof open access and increased availability of data. The services from EO have asignificant impact on all aspects of everyday life and were recognized at the 2018United Nations World Geospatial Information Congress for their utility in social,economic, and environmental development (Sheldon et al. 2018). It is a cost-effectivesolution for advanced understanding of both natural and human-induced global orregional changes through real-time monitoring data. The use of EO and GIT aims atimproving understanding about complex environmental and social interactions andenables decision making based on scientific evidence, thus helping in enhancing thewell-being and livelihood of the people (Leibrand 2019).
The relevance of science and technology to the HKH region is even higherbecause of the difficult terrain; the region is also undergoing rapid changes drivenby stressors such as climate change and human conflicts, and factors like global-ization, infrastructure development, migration, tourism, and urbanization (Sharmaet al. 2019). It also faces a data gap that hinders the overall assessment of the region(IPCC 2007; Singh et al. 2011). ICIMOD, therefore, has been working as aSERVIR hub to leverage EO science and GIT toward the region’s developmentsince 2010 (Chap. 1). The SERVIR-HKH program aims to strengthen the capacityof the member countries to incorporate EO information and GIT into developmentdecision making in order to address complex problems. The SERVIR-HKH hubworks with diverse partners from local, regional and global levels, and each of themhave their own priorities and interests. More than science, the issues are geopoliticalat the HKH front. Further, socioeconomic issues strongly prevail in the region,
L. M. Kadel (&) � F. Ahmad � G. BhattaraiInternational Centre for Integrated Mountain Development, Kathmandu, Nepale-mail: [email protected]
© The Author(s) 2021B. Bajracharya et al. (eds.), Earth Observation Science and Applications for RiskReduction and Enhanced Resilience in Hindu Kush Himalaya Region,https://doi.org/10.1007/978-3-030-73569-2_18
343
influencing lives and livelihoods. Understanding these complexities is essential inorder to answer some important questions regarding the successful implementationof the SERVIR program and achieving its objective. These questions are as follows:
• What motivates the stakeholders to use EO and GIT in decision-making?• What hinders them to promote these applications?• Who should be engaged and why in the process of creating positive change?
Monitoring and evaluation (M&E) can, but does not always answer thesequestions. Traditional M&E generally uses the logical framework approach whichdescribes the relationship between different components of a program but does nottake into account the emerging needs, processes, and results when the context isuncertain to deal with (James 2011). To answer difficult questions, there should bein-depth understanding of complexities; the problem with traditional M&E indealing with a complex program is that it does not pay enough attention to thechange process that unfolds in the midterm; this is an obstacle to achievinglong-term goals (Weiss 1995).
On the other hand, modern M&E approaches such as theory of change(ToC) and participatory impact pathway analysis (PIPA) are aware of the com-plexities, bring stakeholders together, and address the difficult questions thatmanage large, complex programs. Harnessing complexity requires close observa-tions and interactions at different levels (Douthwaite et al. 2020). The approachpromotes collective understanding, reviews, reflections, and adaptive managementpractices in the SERVIR program.
This chapter carries out an after-action review of the deployment and imple-mentation experiences of SERVIR-HKH and its M&E system that was aware of allthe complexities involved; so that many others can learn and adopt such approachesin implementing their programs.
18.2 The Planning, Monitoring, and Evaluation Approach
18.2.1 Theory of Change and Participatory Impact PathwayAnalysis
ToC and PIPA are innovative approaches that are being increasingly used tounderstand the complexity of a program where the desired changes are uncertain(Isabel 2012; Alvarez et al. 2010). According to Davies (2012), ToC is thedescription of a sequence of events that is expected to lead to a particular desiredoutcome. From that perspective, ToC helps the relevant practitioners to gain a betterunderstanding about the pathways of change that lead to outcomes and impactswhich are often nonlinear and complex. ToC is about the central processes ordrivers—such as psychological, social, physical, or economic—through whichchange comes about in individuals, groups, or communities; this could derive from
344 L. M. Kadel et al.

a formal research-based theory or an unstated, tacit understanding about how thingswork (Funnell and Rogers 2011).
PIPA in SERVIR-HKH involves an actor-based approach bringing togetherdifferent stakeholders who are also users of EO products and services; they thendevelop a collective understanding about the project-impact pathways, and theunderlying assumptions of change. ToC adds to an impact pathway by describingthe causal assumptions behind the links in the pathway—meaning, what has tohappen for the causal linkages to be realized (Mayne and Johnson 2015).
By applying these approaches in planning, monitoring, and evaluation (PM&E),SERVIR-HKH aims for a better understanding of and harnessing of the complexityof the program for navigating change toward outcomes and impacts. Ensuring theadoption and use of EO services for societal benefit is the major objective; societalbenefit is obtained when any support has a meaningful impact on the well-being ofsociety (Giovannini et al. 2011), and it can be measured (Bornmann 2012).Result-oriented PM&E focuses on achievements and guarantees that resourceallocation and planning are closely tied up with the outcomes and impacts ratherthan inputs and activities. Comparing what we achieve with what we wanted toachieve provides an opportunity to reflect and learn. It also helps policy anddecision makers to demonstrate the impact of a given intervention or policy (Kusekand Rist 2004).
18.2.2 Implementation Framework
The implementation of a framework walks along the project cycle, starting at thedesign of ToC (Fig. 18.1, left). The use of ToC and PIPA in PM&E along theproject cycle aims to facilitate three key functions: accountability, learning, andadaptive management (Fig. 18.1, right). These three functions are interlinked witheach other for navigating change in any program or project. The framework showshow the PM&E system (left, outer circle) is based on ToC and how PIPA supportsthe program cycle (left, inner circle) in terms of the three key functions (right). Theimplementation of the framework aims at navigating change beyond EO productstoward impact for adoption and use of services for societal benefit.
Accountability in development may refer to the obligations of the partners to actaccording to clearly defined responsibilities, roles, and performance expectations,often with respect to the prudent use of resources (OECD 2002). Result-orientedM&E helps to collect evidence and demonstrates whether results have beenachieved and also justifies value for money, while performance data can be col-lected at different levels of a program or project’s result hierarchy.
Learning as a function of result-oriented M&E is drawn especially through theassessment of the response to a particular policy, program, or project. M&E alsoinvolves the wider context of knowledge management as an element of organiza-tional learning and one that strengthens performance (Adrien et al. 2008).
18 Approach and Process for Effective Planning … 345

In this regard, adaptive management helps decision makers or managers torespond to an emerging situation, especially in a complex program, to achieve thedesired impacts. M&E provides an opportunity to compare the emerging changeswith the desired ones and to reflect on learnings and make adjustment in plans.Thus, adaptive management helps to choose the right path, but the goal remains thesame. Knowing the path and the destination also guide us in following the moreimportant path (Örtengren 2016).
18.3 Implementation Process
The implementation of the framework in our model followed eight steps in abroader three-phase project cycle (Fig. 18.2). The planning phase began with PIPAfor developing the program’s ToC and the plan for a monitoring, evaluation, andlearning (MEL). The implementation of the plan involved the capacity building ofthe staff on MEL, based on ToC and process documentation. After a while of theimplementation process, the remaining steps began. Reality checks, assessments,and evaluations were carried out, along with documentation of the evidence ofchange. Then, the progress was periodically reported in order to address theinformation needs of the stakeholders. Later, learning syntheses, reviews, andreflections were carried out to facilitate learning among the stakeholders. Finally,based on the lessons learnt from M&E, the plans were adjusted or revised accordingto ToC.
Fig. 18.1 Framework for planning, monitoring, and evaluation
346 L. M. Kadel et al.

The aspect of gender has been considered across the PM&E framework as a partof the attempt to mainstream gender and social inclusion in EO and GIT applica-tions and services. We adopted a seven-step framework (Kadel et al. 2017) in theprocess of project cycle management and encouraged for gender focus right fromthe beginning at design and planning.
18.3.1 Participatory Impact Pathway Analysis
PIPA was the first step in the PM&E cycle which began with country consultationsworkshop attended by diverse stakeholders. PIPA is a forward-looking approach builton the past experiences of the stakeholders and provided an opportunity to developclarity and collective understanding about the program in terms of ToC and perfor-mance indicators. The stakeholders systematically followed the seven steps(Fig. 18.3) to come up with a gender-responsive ToC and performance indicatorswhich provided a good basis for program implementation,monitoring, and evaluation.
Fig. 18.2 Implementation process of PM&E framework
18 Approach and Process for Effective Planning … 347
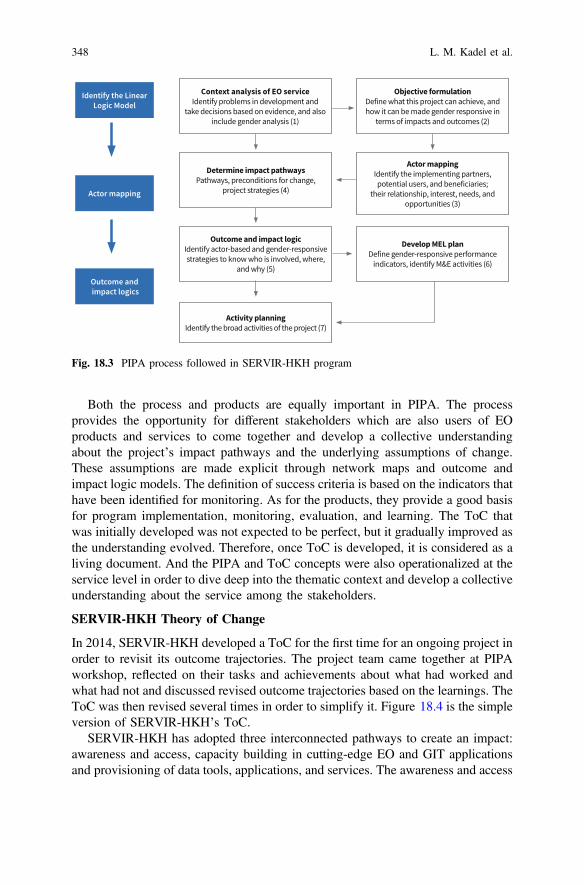
Both the process and products are equally important in PIPA. The processprovides the opportunity for different stakeholders which are also users of EOproducts and services to come together and develop a collective understandingabout the project’s impact pathways and the underlying assumptions of change.These assumptions are made explicit through network maps and outcome andimpact logic models. The definition of success criteria is based on the indicators thathave been identified for monitoring. As for the products, they provide a good basisfor program implementation, monitoring, evaluation, and learning. The ToC thatwas initially developed was not expected to be perfect, but it gradually improved asthe understanding evolved. Therefore, once ToC is developed, it is considered as aliving document. And the PIPA and ToC concepts were also operationalized at theservice level in order to dive deep into the thematic context and develop a collectiveunderstanding about the service among the stakeholders.
SERVIR-HKH Theory of Change
In 2014, SERVIR-HKH developed a ToC for the first time for an ongoing project inorder to revisit its outcome trajectories. The project team came together at PIPAworkshop, reflected on their tasks and achievements about what had worked andwhat had not and discussed revised outcome trajectories based on the learnings. TheToC was then revised several times in order to simplify it. Figure 18.4 is the simpleversion of SERVIR-HKH’s ToC.
SERVIR-HKH has adopted three interconnected pathways to create an impact:awareness and access, capacity building in cutting-edge EO and GIT applicationsand provisioning of data tools, applications, and services. The awareness and access
Fig. 18.3 PIPA process followed in SERVIR-HKH program
348 L. M. Kadel et al.

pathway helped the country partners to increase their access to EO data, applica-tions, and tools; this was enabled by awareness about open access to alreadyavailable data, developing data portals, improved networks, and sharing mecha-nisms. The capacity pathway enabled in updating a particular hub’s knowledge oncutting-edge EO and GIT applications, thereby transferring the same to the regionalmember countries. Both women and men were part of this process. These twopathways also built synergy with the third pathway to co-develop user-tailored andgender-responsive EO services. The immediate results of the three pathways led tothe applications and services that were developed and tailored to the needs of userswhich increased adoption and use of EO and GIT applications for evidence-baseddecision making. Ultimately, the adoption and use at scale would lead to improvedenvironmental management and resilience to climate change.
Actor analysis plays a big role in creating a better understanding about thepathways and makes them explicit by striking out all the assumptions.Understanding how this logic works is crucial in order to stabilize or amplify thebeneficial outcome trajectories for achieving the expected change, this was acontinuous process during the implementation of the program. When clarity wasachieved about the ToC, the stakeholders were in a better position to discuss howthe program would be monitored or measured. These discussions led to identifyingthe performance indicators and due consideration was given to make them genderresponsive.
Fig. 18.4 Theory of change of SERVIR-HKH
18 Approach and Process for Effective Planning … 349

18.3.2 Developing a Plan for Monitoring and Evaluation
M&E depends on efficient planning and clarity about what is being monitored(Simister and Smith 2010). The indicators identified in the first step were furtherexplained or defined for everyone’s understanding about what kind of data wouldbe collected and why. Agreement was also reached on M&E activities. Thus, thedevelopment of the MEL plan was completed in two steps: preparation of indicatorreference sheet and developing the M&E activity plan.
The indicator reference sheet covered details about indicator data, so as to ensurequality and consistency in data collection, compilation, analysis, and use. To guidethis process, a standard format was developed which covered important elementslike definition, data disaggregation, baseline, target, source of information, the datacollection method, frequency of data collection, responsibilities, analysis, and use.The aim of tracking results and measuring change was that the managers would beheld more accountable and responsible for achieving results beyond the applicationor service development. Besides, wherever possible, the setting ofgender-disaggregated target was encouraged.
The timely planning of MEL activities was another important part, which isoften neglected in practice. This not only ensured budgetary control but also pro-vided enough time to prepare for the implementation of important activities.Systematically planned M&E functions are more effective as they help in timelyexecution and retain focus. Apart from the factor of indicator data, periodic reviews,assessments, evaluations, learning synthesis, and revision of ToC are important foraccountability and adaptive management.
18.3.3 Orientation and Building Staff Capacity
To ensure the adoption and use of EO-based solutions for societal benefit, themanagers and data scientists in SERVIR-HKH are expected to think beyond the EOapplications. While the staff involved in this program are experts in their subject,they had not been trained in approaches like results-based management (RBM).Thus, the participatory process used for PM&E and M&E trainings, refresherworkshops, reviews, reflections, and guidelines helped to build their capacity inRBM. At the monthly staff meetings, M&E was part of the discussion agendawhich helped to maintain a continuous focus on this function. The M&E guidelineswere also simplified for the benefit of non-M&E professionals.
350 L. M. Kadel et al.
18.3.4 Process Documentation
While moving to the implementation phase, process documentation became a pri-ority. Process data were important for monitoring the targets and tracking theresults. An online event database system was set up for systematic collection,compilation, and analysis of progress data. A standard data collection format wasestablished which could also support data disaggregation. This system has alsohelped in addressing the problem of duplication.
Besides, pre- and post-training assessment tools were used which helped inmaking the necessary adjustments in content and method, so as to best fit theparticipants. While the pre-training assessment mechanism solved for the man-agement the prickly issue of selecting the right candidate, the post-trainingassessment mechanism paved the way for follow-up actions that needed to be takento achieve the outcomes envisaged by the ToC.
18.3.5 Reality Checks and Gathering Evidence
After a while into the implementation stage, the partners and stakeholders wereexpected to respond to the project activities. Both formal and informal processeswere used to assess the emerging situation and measure the changes. Knowingwhether the targeted stakeholders were adopting and using EO and GIT in decisionmaking or not, and why, helped the managers and the data scientists to adapt to theemerging situation.
Formal tools were used to validate the information collected through theinformal process and also to address the information gaps. Tracer studies wereconducted to know whether the trainees were using the knowledge and skillsacquired at the trainings. This helped in assessing the relevance and effectiveness ofthe training programs. Besides, periodic assessments were carried out on theorganizational capacity levels of the different countries. A post approach to revis-iting impact pathways was also adopted, so that the stakeholders could collectivelyassess as to what was working and what was not. Further, using the ToC, evalu-ations were carried out to measure the success or failure rate of each EO service.And be it success or failure, all of it has been documented.
The informal process was adopted more at the individual level of EO profes-sionals. After a certain duration of implementation, they were able to closelyobserve the emergent and expected changes. This also helped them in reflecting ontheir work to see whether it had made any difference to the overall scheme ofthings. As for the gender aspect, both formal and informal processes addressed thearea.
18 Approach and Process for Effective Planning … 351

Box 1. FFWC Bangladesh taking ownership of strengthening FEWSAs a result of a series of trainings, the engineers at the flood forecasting andwarning center (FFWC) of Bangladesh have developed a better understandingof the streamflow of upstream rivers, thereby significantly improving theircapacity to deliver better and more effective flood warnings. They are now ina position to calibrate and validate model outputs with the data collectedduring the 2018 floods.
In order to stabilize and amplify this outcome trajectory of strengthenedflood early warning system, SERVIR-HKH has been working closely withthe FFWC engineers; this has also helped to strengthen these engineers’capacity. Besides, enough care is being taken to build a sense of ownershipover the process and achievements so as to bolster the flood early warningsystem (FEWS) in Bangladesh.
18.3.6 Reporting and Quality Control
Reports were prepared to fulfill the information needs of the different stakeholdersto whom the program is accountable. It was therefore important in the M&E processto ensure that the reports were of a high quality. In this regard, factors such as dataconsistency and evidence were of prime concern. These were assessed periodicallyby a dedicated team and by the donors. This helped in improving the overall systemof data collection and validation. And all along, gender was made a mandatory partof the reporting process
18.3.7 Reviews, Reflections, and Learnings
Different mechanisms such as program advisory committee meetings, biannualreviews, and monthly staff meetings provided opportunities for collective under-standing, reviews, reflections, and learnings. In all of this, monitoring and evalu-ation played a big part, and evidence seeking was accorded high priority. It was alsoimportant to ensure maximum participation at these gatherings, both of women andmen. The meetings were also avenues for individuals to reflect upon their work andconclude whether it had made any difference to the entire program.
352 L. M. Kadel et al.

18.3.8 Revisiting ToC and Adjusting Plans
One of the important steps in the MEL framework is to help managers and decisionmakers adjust their plans and adapt to any emerging situation. Comparing what ishappening with what was expected and planned for helps determine how a programcan adjust its plans and responses (Douthwaite et al. 2018). In this regard, biannualreviews and planning workshops and learning synthesis were duly conducted.These reviews shed light on what was working and what was not and created abetter understanding about the emerging situation, thereby helping populate theoriginal ToC with greater detail and paving the way for necessary amendments,whether minor or major (Douthwaite et al. 2018). The ToC for this project was firstdeveloped in 2014 was later revised in 2016 in order to bring about a stronger focuson user engagement and to sustain the impact of EO services (see Chap. 2 for moredetails). As things stand, the plans are usually adjusted biannually if the need arises.
18.4 Results and Discussions
The implementation of the framework based on ToC and PIPA has produced someresults; some of them are briefly described below.
18.4.1 The Ability of the Implementing Staff to ChangeDirection
Since its inception in 2010, SERVIR-HKH has carried out decadal mapping of landcover to record changes and to support monitoring system in the region. In 2015,the Development Alternatives Incorporated (DAI) evaluated this system. Its reportsays that the country partners were reluctant to use this system, and the accuracy ofthe products was their major concern.
But the situation has changed by 2020. The scientists, together with the countrystakeholders, have developed a ToC for the system. This has helped the stake-holders and the experts to not only develop clarity on the objectives, but has alsoprovided them the opportunity to tailor the system to the needs and priorities of theusers. The system has now been upgraded with capability to generate annual landcover map. The Forest Research and Training Center (FRTC) of Nepal which is thekey partner and user has now pre launched the Nepal land cover monitoring system(NLCMS) and has allocated fund for the field-based validation process. This showsa sense of full ownership and a buy-in of the system. Now Bangladesh’sDepartment of Forest is planning to adopt this at the national scale after it suc-cessfully launched a pilot. ICIMOD is providing support for the system in both thecountries.
18 Approach and Process for Effective Planning … 353

This example demonstrates the fact that the EO data scientists and the stake-holders are now giving more importance to adoption and use rather than merely tothe application. With this shift in focus, the scientists have proactively started toengage the users in the process of formal and informal service development. As aresult and because of the increased trust, the service is now more tailored to theneeds of the users. The individuals concerned have also deepened theevidence-based reflection process, whereby they evaluate as to whether their workchoices have made any changes as explained by the ToC.
The implementation of this ToC and PIPA approach in planning, monitoring,and evaluation has made the managers and decision makers to change the directionof their work toward one that makes impact. ToC and PIPA continuously focus onthe outcome right from the design stage. The PIPA process through which the ToCand performance indicators were developed has brought in clarity, and a collectiveunderstanding about how EO and GIT applications should be used for addressingcomplex problems. Once the managers understood the pathways to ensure theadoption and use of EO products and services, their management priority changedto one of appropriately adapting to any emergent situation. The focus is now moreon outcomes and impacts rather than inputs and activities.
18.4.2 Staff Buy-in to the Approach
The staff at SERVIR-HKH has also been slowly able to develop an interest in thisapproach; this came about after they understood the facet and value of account-ability, learning, and adaptive management. Several things have helped in instillingthis interest. For example, PIPA has provided an opportunity to the stakeholders tohave a better grasp on the pathways of change. Besides, they have found that theToC which was developed at the PIPA workshop has been extremely useful instrengthening their communication network. This has also helped them to sys-tematically plan, monitor, and evaluate the program, so as to achieve the statedobjectives. Now, in discussions and management decisions, the ToC has become apermanent feature.
Once the managers and decision makers understood the value of this approach aswell as of monitoring and evaluation, there has been a key change in the man-agement culture. At the individual level, the people concerned are reflecting on theirown actions, so as to engage in a process of continuous learning and adaptation tochange (Schon 1983). The staff and the stakeholders have now started to ask criticalquestions of each other at meetings and discussions, and all of these are based onthe program’s ToC. This has also ushered in a culture of learning and sharing. Atstaff meetings, M&E is a prime agenda, and the focus is on regular reflections onactions to achieve the best possible results. As there is now a systematic approach toresult tracking and measurement, evidence seeking and trust have become anintrinsic part of the work culture. These reflections have also made individualsbreak away from the traditional patterns of thinking and acting (Klerkx et al. 2012).
354 L. M. Kadel et al.
Thus, there has been a palpable change in the management approach of the sci-entists, whereby they place the welfare of the stakeholders at the forefront. And,they are reflecting on their work to see if their work choices have brought anychanges, so as to make right choices from best possible way.
18.4.3 Partners Able to Bring Multiple Perspectives
The earlier flood early warning system (FEWS) of Bangladesh, with a four-day leadtime, had been unable to reduce the loss and damage from floods. So, the country’sflood forecasting and warning center (FFWC) decided to increase the lead time withsupport from ICIMOD. While the discussions focused on the impact pathways tochange, the stakeholders realized that merely increasing the lead time of thewarning would not be as effective if it was not combined with information on theflood-risk level and its impact on the ground. Therefore, FEWS was strengthenedby increasing the lead time to 15 days, and a provision was also set up to provideinformation on the potential impact of the flood. Further, there was the realizationthat the field staff played an important role and that there should be communityaccess to such information.
This case demonstrates that the data scientists and the stakeholders were able tothink differently by bringing in multidimensional perspectives on service design.There was also an increased focus on outcomes, impacts, reviews, and reflections,all guided by ToC and PIPA. This is a continuous process facilitated by PIPA thatallows different stakeholders to come up with diverse ideas, so as to tailor a projectaccording to the practical context on the ground. Moreover, this flexible processhelps in adapting to any emerging situation and paves way for out-of-the-boxsolutions. Open dialog among all the stakeholders also helps them to analyze andreflect on their actions to determine what is working and what is not (Earth Village2020). This improves the mechanism of informed decision making to achieve theintended results.
18.4.4 Stakeholders Able to Develop a Sense of Ownershipand Trust
A sense of ownership and trust among stakeholders is important for the adoptionand use of EO and GIT services. The implementation of this framework based onToC and PIPA has helped the stakeholders to feel a better sense of ownership andtrust mainly in three ways. The first has to do with the overall PIPA process. It hasprovided an opportunity for the stakeholders to be engaged right from the beginningof the program, at the design stage itself. This has helped them to have a deeperunderstanding about the project or service and its relevance to their needs. This
18 Approach and Process for Effective Planning … 355
made for a good beginning in terms of building trust. The collective process ofPIPA has also helped the staff and stakeholders to be properly motivated aboutimplementing their respective projects (Douthwaite et al. 2020). Secondly, beingable to co-create and co-develop solutions have also fostered a heightened sense ofownership. The third aspect has to do with improved relations among all the rel-evant parties. The continual formal and informal process of user engagement hasimproved the relationship between the data scientists and the country stakeholderswhich has also helped to increase trust among them. The stakeholders, by beingincreasingly engaged, feel more responsible toward the products and services, andalong the way, interpersonal trust is also built, thereby leading to greater adoptionand internalization of technology (Lippert and David 2016).
18.4.5 Breaking the Gender Silence in Data Service
Mainstreaming gender tends to be context-specific as opposed to an “off-the-shelf”process (Kadel et al. 2017). The field of EO–GIT is considered especially chal-lenging in terms of mainstreaming gender. So, the aspect of gender was given primepriority when it came to developing the ToC for SERVIR-HKH. PIPA organizedwith multidisciplinary team became a good enabler to bring exclusive gender lens atdesign stage itself. This process initially triggered heated discussions between thedata scientists and the social scientists, with the former opposing the idea and thelatter supporting it. They had an argument that mainstreaming gender would notalways be possible and EO and GIT field could be the one. Finally, they agreed totwo key mainstreaming approaches: consider gender while developing the EOproducts, so as to reduce gender gaps and promote gender balance in participationin project events and in staffing. This step helped managers to develop a gendermainstreaming framework for the entire SERVIR-HKH program (Chap. 15). Butwhile the silence on gender has been broken in the EO and GIT field, much moreremains to be done.
18.5 Challenges
18.5.1 Iterative Learning Process
The staff involved in this project are experts in EO and GIT but not trained inapproaches such as RBM. In several cases, they had to teach themselves about theseapproaches. As mentioned earlier, the use of ToC and PIPA are aimed at creating abetter understanding about all the complexities involved in a program. This is moreabout “learning-by-doing” for which the staff and the stakeholders have to possessthe requisite patience. However, at the same time, the managers are under pressure
356 L. M. Kadel et al.

to produce results. They cannot keep trying out things for too long. They should beable to make the best choice by keenly observing and monitoring the emergingsituation. But all said, it is always a challenge to strike a balance between thelearning process and achieving results.
18.5.2 Balancing Simple and Complex Theories
The implementation of the ToC and PIPA approach demands the engagement ofdiverse groups; so, to keep their interest alive, it is essential to simplify the wholeprocess. But it is also equally important not to ignore the complex part and over-simplify matters. Striking a balance between these two is challenging. The idea is tokeep things as simple as possible but not at the cost of losing important information.
In SERVIR-HKH, we have localized the ToC and PIPA approach at the servicelevel to facilitate deeper analysis. A tabular format of the ToC with all the necessaryelements has further simplified the process. This tabular format has helped diversestakeholders to engage in the PIPA process, especially at the early stage ofdeveloping the EO service. Once clarity came about, the staff and stakeholdersagain referred to the ToC diagram with its feedback loops as it nicely summarizeshow and why change happens. We have always been for simplifying the ToCdiagram as far as possible but without losing important information. This is becausesuch simplification will make it easier for the non-M&E professionals to understandthe pathways better and use them frequently for communication, reflection, andlearning. But the accompanying narrative is still important, particularly to explainthe feedback loops and assumptions that can be subsequently tested (Barnett andGregorowski 2013). Besides, it is important that M&E professionals work closelywith other staff and stakeholders to strengthen this process.
18.5.3 Impact Assessment
EO and GIT aims at supporting evidence-based decision making for addressing theproblems that people face. The larger society will benefit only if the decisions areimplemented properly; the primary consideration is that these applications andproducts ought to be widely adopted and used at different levels. It has also got tobe accepted that the impact on the beneficiaries or the wider civil society may not beseen until well after the time frame of a particular project or a program (Simisterand Smith 2010). Therefore, the purpose of capacity building of the countrystakeholders to generate and use EO data and GIT services in most cases is lessdiscussed and loosely defined. Impact assessment in such a situation becomesdifficult. There are also many people working in this field who argue that measuringthe effect of adoption and use of EO applications and services is beyond the scopeof this entire program.
18 Approach and Process for Effective Planning … 357
18.6 Lessons Learnt
18.6.1 Transformation Requires Support from TopManagement
In our decade-long experience, we have observed a big behavioral change in theSERVIR staff involved in project management. The availability and access to EOdata and products were the primary goals in the early days of SERVIR-HKH. Now,the focus has shifted to the adoption and use of EO services for societal benefit.
This change would not have been possible without support from the seniormanagement. Trust and support from the senior management in terms of theseapproaches have encouraged the staff to embrace the new ways. Learning from bothsuccess and failure is important, as is also understanding the complexity of aprogram and the pathways of change. In this context, incentives need to be in placeto regularly collect evidence around a theory, test it periodically, and then reflectand reconsider its relevance and assumptions (Barnett and Gregorowski 2013). Thisrequires consistent commitment and support from the top management. Buy-infrom the top (Schuetz et al. 2017) and acceptance by the managers and decisionmakers enable effective implementation of such approaches and strategies.
18.6.2 Localized Approach Simplifies Operation
While there is a general understanding that a ToC has to be placed at the higherlevel of a program on the complexity front, the SERVIR-HKH experience showsthat equal importance ought to be accorded to a localized approach at the servicelevel. This localized approach helps to contextualize the broader concept andrenders the operations more effective. In fact, each EO service is a unique case interms of issues, partnerships, and opportunities. The PIPA process adopted todevelop EO services in SERVIR-HKH has provided the opportunity to understandthe context better and align the service with the needs of the stakeholders and theusers. And the ToC keeps the common goals intact and helps the stakeholders innurturing them during the implementation phase.
18.6.3 Building Individuals’ “MEL Value Perspective”
Value perspective plays a big role in the RBM and learning process. “MEL valueperspective” refers to a different way of looking at and working with MEL valueswhere individual work choices are driven by continuous learning through evidenceseeking, monitoring, and evaluation (Hyatt and Ciantis 2014). Our decade-longexperience with this program shows that developing an MEL value perspective in
358 L. M. Kadel et al.
scientists is a slow and complex process, but it is important if they are also man-agers of a complex program or project. Institutionalizing collective planning andlearning as a part of M&E requires the capacity building of staff, and they also haveto be properly motivated (Douthwaite et al. 2018). The staff may be experts in theirsubject but they may not have had training in the ToC and PIPA approach andRBM. This was reflected in the early days of the SERVIR-HKH program, whereinthe EO applications could only be put to limited use (DAI 2015; Morrison et al.2017). Ensuring that EO applications benefit people in need is more about man-agement rather than science. The effective management of a complex program forsustainable impact is a continuous learning process. In this regard, a multidisci-plinary work culture where different views are valued requires to be promoted forcollective understanding and learning.
At SERVIR-HKH, we place more value on the participatory process and con-tinued reflections, in line with the ToC, at both individual and group levels.Breaking away from the earlier practice, M&E has become a regular feature at staffmeetings. Besides, practical trainings and refresher workshops have been held,focusing on the individual’s M&E roles and responsibilities, thereby enabling themto contribute toward achieving the bigger objective. As a result, the scientists arenow more open to different views and learnings in the overall process of deliveringEO services. The user has also been placed at the forefront of this process—recognizing that it is the needs and interests of the user that matter the most, anduser engagement has been accorded the topmost priority in the SERVIR-HKHprogram.
18.6.4 Flexibility Matters
The ToC and PIPA approach is used to build better understanding about a complexprogram or change process. This aspect of complexity may not always be fullyunderstood, at least in the beginning (Barnett and Gregorowski 2013). Therefore,the flexibility of accepting imperfection in the ToC at the beginning is important. Itwill be improved upon as the understanding develops over time. Flexibility mayalso be required in the steps and overall process since a diverse set of stakeholdersmay be involved in a particular program.
18.7 Conclusion
In the context of SERVIR-HKH, the ToC and PIPA used in planning, monitoring,and evaluation has helped managers and decision makers to push the boundarybeyond EO applications and toward creating meaningful impact. The successfuladoption of this approach has helped managers, data scientists, and country stake-holders to change direction; wherein the focus now is on results, developing a sense
18 Approach and Process for Effective Planning … 359

of ownership, and building trust in the EO applications, this has led to a spurt in theuse and adoption of these applications. The PIPA approach has allowed the stake-holders and users to come together in order to arrive at a common understandingabout how EO and GIT applications would help in addressing the problems of theHKH region. And the ToC produced through PIPA has provided a good basis forprogram implementation, monitoring, and evaluation. The participatory approachused in the implementation of the program has not only helped in harnessing thecomplexity of the program, but has also tailored the services to suit the needs of theusers; the inclusion of the aspect of gender is a good example here.
Nevertheless, several challenges are yet to be overcome. It is important here toemphasize upon the iterative nature of the learning process; so, the staff andstakeholders need to be patient all through the whole process. In this, support fromthe top management also has a vital role to play. Another challenge is in simplifyingthe whole process while there are several complex elements to it. It has also got tobe borne in mind that programs like SERVIR-HKH follows a long pathway by itsnature to create impact. But in the first place, the impact part has to be clearlydefined, so as to avoid ambiguity about the bigger picture and to accurately measurethe impact.
The focus of SERVIR-HKH has been on adopting a localized approach tooperationalize the bigger picture, so that there is complete understanding about thecontext in which the program is being run. While having a ToC in place is a goodbeginning, it is as important to make adjustments as the project cycle wheels alongand the strategy being adopted matters for the best results.
References
Adrien et al (2008) Bridging the gap. The role of monitoring and evaluation in evidence-basedpolicy making
Alvarez S, Douthwaite B, Thiele G, Mackay R, Cordoba D, Tehelen K (2010) Participatory impactpathways analysis: a practical method for project planning and evaluation. Dev Pract 20:946–958. https://doi.org/10.2307/20787374
Barnett C, Gregorowski R (2013) Learning about theories of change for the monitoring andevaluation of research uptake IDS PRACTICE PAPER IN BRIEF 14
Bornmann L (2012) Measuring the societal impact of research. EMBO Rep 13(8):673–676DAI (2015) SERVIR-Himalaya land cover tool evaluation. Evaluation reportDavies R (2012) Blog post ‘Rick on the road’ dated April 5, 2012: Criteria for assessing the
evaluability of a theory of changeDouthwaite B, Ahmad F, Shah G (2020) Putting theory of change into use in complex settings.
Can J Prog Eval/La Revue canadienne d’évaluation de programme. https://doi.org/10.3138/cjpe.43168
Douthwaite B, Ahmad F, Shah GM, Schreinemachers P, Kassie M, Williams F, Ciolina D, Ishrat J,Nagarajan L, Feldman A, Ahmad T, Kadel L, Devkota P (2018) Strengthening AIRCAmonitoring and evaluation systems. ICIMOD Working Paper 2018/8. Kathmandu: ICIMOD
Earth Village (2020, 01 21). Retrieved from https://www.villageearth.org/training/the-role-of-participatory-monitoring-and-evaluation-in-community-based-development/
360 L. M. Kadel et al.

Funnell SC, Rogers PJ (2011) Purposeful program theory-effective use of theories of change andlogic models
Giovannini E, Hall J, Morrone A, Ranuzzi G (2011) A framework to measure the progress ofsocieties. Revue d’économie politique 121(1):93–118
Hyatt K, Ciantis C (2014) What’s important: understanding and working with values perspectives.http://kairios.com/resources/. Accessed 25.04.2019
IPCC (2007) The fourth assessment report: climate change 2007, Synthesis Report. CambridgeUniversity Press, Cambridge, UK
Isabel V (2012) DFID review of the use of ‘Theory of Change’ in international developmentJames C (2011) Theory of change review: report commissioned by comic reliefKadel LM, Lacey J, Ahmad F, Hayes K, Gurung Goodrich C, Cruz Lopez D, Milne G, Darbas T,
Olsen K (2017) Making gender count: leveraging M&E to mainstream genderKlerkx L, van Mierlo B, Leeuwis C (2012) Evolution of systems approaches to agricultural
innovation: concepts, analysis and interventions. In: Farming systems research into the 21stcentury: the new dynamic. Springer, New York, pp 457–483
Kusek JZ, Rist RC (2004) Ten steps to a results-based monitoring and evaluation system: ahandbook for development practitioners. World Bank Group
Leibrand A, Thomas A, Sadoff N, Maslak T (2019) Using earth observations to help developingcountries improve access to reliable, sustainable and modern energy. Front Environ Sci 7:123.https://doi.org/10.3389/fenvs.2019.00123
Lippert SK, David M (2016) A conceptual model integrating trust into planned change activities toenhanc technology adoption behavior
Mayne J, Johnson N (2015) Using theories of change in the CGIAR research program onagriculture for nutrition and health. Evaluation 21(4):409
Morrison I, Berenter J, Schumacher J (2017) SERVIR performance evaluation: evaluationquestion 1 report (Revised August 28, 2018)
OECD (2002) Glossary of key terms in evaluation and results based managementÖrtengren K (2016) A guide to results-based management (RBM), efficient project planning with
the aid of the logical framework approach (LFA). Swedish International DevelopmentCooperation Agency (SIDA)
Schon D (1983) The reflective practitioner: how professionals think in action. Aldershot, England,Ashgate
Schuetz T, F€orch W, Thornton P, Vasileiou I (2017) Pathway to impact: supporting andevaluating enabling environments for research for development. ISBN 978-3-319-43701-9.ISBN 978-3-319-43702-6 (eBook). https://doi.org/10.1007/978-3-319-43702-6
Sharma E, Molden D, Rahman A, Khatiwada YR, Zhang L, Singh SP et al (2019) Introduction tothe hindu kush himalaya assessment. In: Wester P, Mishra A, Mukherji A, Shrestha AB(eds) The Hindu Kush Himalaya assessment—mountains, climate change, sustainability andpeople. Springer Nature Switzerland AG, Cham, pp 1–16
Sheldon A, Chief KW, Hayden K, Dispert I, Ahmed ST, Dutta R, Roeder E, Bonapace T (2018)Good practices and emerging trends on geospatial technology and information applications forthe sustainable development goals in Asia and the Pacific
Simister N, Smith R (2010) Monitoring and evaluating capacity building: is it really that difficult?Praxis Paper 23
Singh SP, Bassignana-Khadka I, Karky BS, Sharma E (2011) Climate change in the HinduKush-Himalayas: the state of current knowledge. ICIMOD, Kathmandu
Weiss C (1995). Nothing as practical as good theory: exploring theory-based evaluation forcomprehensive community initiatives for children and families. In: New approaches toevaluating community initiatives. Aspen Institute
18 Approach and Process for Effective Planning … 361

Open Access This chapter is licensed under the terms of the Creative Commons Attribution 4.0International License (http://creativecommons.org/licenses/by/4.0/), which permits use, sharing,adaptation, distribution and reproduction in any medium or format, as long as you give appropriatecredit to the original author(s) and the source, provide a link to the Creative Commons license andindicate if changes were made.The images or other third party material in this chapter are included in the chapter’s Creative
Commons license, unless indicated otherwise in a credit line to the material. If material is notincluded in the chapter’s Creative Commons license and your intended use is not permitted bystatutory regulation or exceeds the permitted use, you will need to obtain permission directly fromthe copyright holder.
362 L. M. Kadel et al.
Chapter 19Lessons and Future Perspectivesof Earth Observation and GITin the HKH
Mir A. Matin, Birendra Bajracharya, and Rajesh Bahadur Thapa
19.1 Introduction
During the last decade, SERVIR has been striving for realizing its vision of “Spaceto Village” by implementing services that provide innovative solutions to improvelivelihoods and foster self-reliance with the help of EO and geospatialtechnologies (Chap. 1). Over these years, there has been significant development inthe field of EO and geospatial technology. However, the capacity of the key agenciesto utilize these advancements to produce, disseminate, and use information has notbeen able to catch up with these developments. As cited in the previous chapters,SERVIR-HKH has been working with various partners and stakeholders inco-developing and implementing applied, user-driven EO and geospatial informa-tion services in the HKH region. SERVIR-HKH recognizes that the sustainability ofinformation products and applications and their use requires an understanding ofusers and their needs. Understanding the user’s needs and organizational context isthe key to delivering effective services. As illustrated in Chaps. 2 and 3, the needsassessment study revealed that the use of geospatial data in the region started in theearly 1990s, but there are still gaps in the institutionalization and sharing of infor-mation. Often, individual agencies produce geospatial information for their ownpurpose and do not share it due to lack of policies. Besides, in most cases, theinformation would have been generated through specific projects funded by externalagencies without proper sustainability planning. And as has happened in many cases,those services could not be continued due to lack of resources and capacity.
SERVIR-HKH has gone through a continuous learning process to improve andinnovate the service design and delivery approach. From the experiences of the firstphase, it was realized that systematic service planning was required to define theroles of the partners at different stages of service development, delivery, and
M. A. Matin (&) � B. Bajracharya � R. B. ThapaInternational Centre for Integrated Mountain Development, Kathmandu, Nepale-mail: [email protected]
© The Author(s) 2021B. Bajracharya et al. (eds.), Earth Observation Science and Applications for RiskReduction and Enhanced Resilience in Hindu Kush Himalaya Region,https://doi.org/10.1007/978-3-030-73569-2_19
363
maturity. The service planning approach (Chap. 2) adopted by SERVIR facilitates aclear understanding of the implementation pathway of service from conceptual-ization to sustainable adoption by the partners. Well-designed toolkits to provideguidance at each step of service planning, including needs assessment, design,monitoring, and delivery, supported by a strategy for user engagement, commu-nication, gender, capacity development, and M&E have been the fundamentalaspects of successful implementation of the service planning approach. The specificfocus on gender and social inclusiveness were important to ensure that the serviceswere beneficial for the marginalized populations. The participatory impact pathwayand the theory of change, together with the monitoring and evaluation process, havealso been helpful in keeping the process on track to achieve the expected outcome.
Institutional arrangements with partners are critical to their engagement in thedevelopment and implementation process. In this regard, the systematic capacitybuilding of the partners to use the applications and interpret the informationproducts is necessary. The support from subject matter experts and the AppliedScience Team from US universities and institutes also enabled to build the capacityof the regional hub and develop information solutions to cater to the users’ needs.Further, the global SERVIR network led by NASA facilitated the incorporation ofthe latest methods in data analysis and system development; while the integration ofNASA’s applied science project with the service design process enabled the hubteam to use state-of-the art methodology and build the capacity of the team and thepartner agencies.
In this chapter, we look at the key lessons that have been learnt and the futuredirections of the EO applications through initiatives like SERVIR.
19.2 Lessons from the Thematic Services
As described in earlier sections, SERVIR-HKH prioritized four broad service areas:agriculture and food security; land use, land cover change, and ecosystems; waterand hydro-climatic disasters; and weather and climate. The specific services weredeveloped through recommendations after the needs assessment stage. Although acommon approach of service planning was used in service design and development,each thematic area in different countries had their specific needs and challenges. Inthe following sections, we present our experiences in implementing the service inthe different service areas.
19.2.1 Agriculture and Food Security
SERVIR-HKH has focused on drought monitoring and crop area mapping as two ofits primary services (Chaps. 4 and 5). Early assessment of the cereal crop area andproduction helps in providing critical information in terms of managing food
364 M. A. Matin et al.

security. In this context, the availability of EO images from the optical and SARsensor with high spatial and temporal frequency enables the assessment of crop areaand assists in monitoring crop health across a large geographic area, thereby sup-plying critical insights into potential production loss. Also, the availability of freecloud-based access and processing platforms like GEE opens up more opportunitiesto develop a standard automatic data-processing system that reduces dependence onhighly skilled human resources and computing hardware. The work with theAfghanistan Ministry of Agriculture, Irrigation, and Livestock (MAIL) for devel-oping a wheat-area mapping system is an example of establishing one such system.The collaboration with the Bangladesh Agricultural Research Council for mappingwinter rice in the country has also delivered promising results.
While the automation of the data-processing system reduces the requirement ofhighly skilled geospatial professionals in the respective agencies, there is still aneed for some field data collection for training and validation of the image clas-sification results. SERVIR-HKH has developed mobile applications to standardizethe field data collection process. With a short training, such a system could suc-cessfully be used for collecting field data. For example, we have trained the staff ofthe field agencies of Nepal’s Ministry of Agriculture and Livestock Development(MoALD) virtually (due to the COVID-19 pandemic), and they have gone on toconduct such fieldwork. This online arrangement made it possible to carry out theactivities effectively and on time, even when the movement was limited due to thepandemic.
Meanwhile, the RS-based crop area mapping has been done with more than 80%accuracy. This accuracy could be improved through the estimation of statisticaluncertainty and bias adjustment using ground samples. The combination ofRS-based mapping and bias correction models could provide the most accurateestimate of the crop area. While an RS-based crop area map provides a goodindication as to whether there has been any potential deviation from the averageyield, there is still a need for a quantitative forecast of the actual yield. Theassessment of the crop area does provide a good understanding of crop production,but a more in-depth understanding of the potential yield is important for bettermanagement of food security. In this regard, the satellite-based NDVI monitoring ofcrop growth is a good tool to analyze the deviations in greenness at different growthstages. This information is adding more insights into assessing the condition ofcrops and gives prior signals about any yield loss.
Traditionally, crop yield is estimated using the crop-cut survey in which sys-tematic samples are collected from the crop fields. Yield estimation could be doneeither empirically using statistical or machine learning model or using processbased models. The crop area from remote sensing together with historical yield datacould be used for the development of empirical yield model. The crop area and theinput from the drought monitoring model could be integrated to developprocess-based yield model. Monitoring drought-related stress on crops at differentstages of their growth can also help in managing irrigation and thereby reduce therisk of production loss.
19 Lessons and Future Perspectives of Earth Observation … 365
While a seasonal drought warning system can provide important information thatcan be used for agriculture planning, the uncertainties involved in such a predictionand the lack of understanding about those uncertainties by the farmers limit the useof such a system. Thus, capacity building of the agriculture extension workers andfarmers in the interpretation and effective use of the drought forecasting system isvital for the broader uptake of drought predictions.
19.2.2 Land Use, Land Cover Change, and Ecosystem
Land cover mapping is one of the oldest applications of remote sensing. Over thelast decades, the HKH countries implemented many land cover mapping projectswith funding and technical support from different international agencies. Dependingon the funding sources and the available images and expertise, these projects useddifferent data sources and methodologies for land cover mapping. But these landcover maps, due to their differences in resolution, classification schema, and classdefinition, are not suitable for change analysis which is required for variousreporting purposes. The methodology used for land cover map generation was alsorather tedious and producing land cover maps for multiple years was time con-suming and costly. With the progress in cloud-based access to time series satelliteimages and processing platforms, land cover maps can be generated relativelyeasily for all the countries within HKH. For example, the archive of Landsat imageswith GEE was instrumental in developing the Regional Land Cover MonitoringSystem (RLCMS) algorithm and tools (Chap. 6) to produce annual land cover mapsfor the years 2000–2018 for the entire HKH region. Meanwhile, SERVIR-HKH hasalso helped develop country-level systems for Afghanistan, Bangladesh, Myanmar,and Nepal in partnership with the corresponding national departments.
While RLCMS has provided an approach and process for consistent time seriesland cover data, there have been some limitations and challenges beyond thecontrol of the system development team. While the land cover maps for earlieryears suffers from lack of quality reference data, the maps produced via the newmethod do not match with the legacy data or the published statistics; so, govern-ment agencies are hesitant to adopt the new data. While developing land covermaps, it is important that all the potential users of the data sets understand and agreewith the definition of different land cover classes. However, despite all the efforts todevelop a classification schema with the unambiguous class definition, there aresome classes where the users do not agree on the definition.
The lack of adequate human resources and frequent transfer of officials havebeen some of the key challenges in the sustainable use of the new mapping method.While the process of co-development of the national land cover maps forAfghanistan and Nepal has built the capacity of the partner agencies, it is importantto have regular feedback and the mechanism of backstopping to sustain the pro-duction of future land cover maps. Also, the Landsat-based maps are not adequatefor more detailed classification of some land covers classes; this can be improved
366 M. A. Matin et al.
by using higher-resolution images like Sentinel II or through the fusion of imagesfrom multiple sensors. Besides, the improvements in the machine learning algo-rithms can be used for enhancing the accuracy of the existing classes or theinclusion of new ones.
While RLCMS provides information on the forest cover extent and the changedynamics that are useful for monitoring deforestation, in the HKH region, forestsare also going through degradation, resulting in a thinning of canopy density, lossof biodiversity, and increase in the occurrence of invasive plants (this is particularlycritical in the case of Nepal). Degradation happens due to both anthropogenic andnatural processes. To address this issue, SERVIR-HKH has developed a climateresilient forest management system (CRFMS) to analyze how climate change canlead to forest degradation (Chap. 7). This information can be used for sustainableforest management by integrating it in the planning and management of forestecosystems. Apart from analyzing the impact of climate change on the naturalprocesses, CRFMS considers the various aspects of forest use and users.
One of the primary contributors to forest degradation in the region has beenforest fires (Chap. 8). The fire-risk maps for Nepal developed by SERVIR-HKHhas been useful for the development of a management plan based on the risk levelof different districts. However, there are several limitations to the MODIS-basedfire-monitoring mechanism due to its coarse resolution. Also, as in the case ofNepal, satellite-based observations do not really provide information on the damagecaused by forest fires since most of these are understory fires. To capture and assessthe fires and the damages they have caused, it is necessary to deploy a feedbacksystem that collects information from the field. As for the larger HKH region, whilethe monitoring system has been useful in keeping an eye on fire incidence, afire-risk forecasting system would be more effective in better planning of resources.In this regard, the capacity of the respective government agencies to operate thesystem is critical.
Our experiences show that partnerships and iterative engagements with useragencies from the very beginning are critical to ensuring the effective use of themonitoring system. In this context, the forest user groups should also give dueweightage to the gender aspect in forest conservation. While the system wasdeveloped within the forest management context of Nepal, the efforts to outscale itin Myanmar have shown that the system can be useful across the region. However,this will require understanding different management contexts and identifyingcommon issues through stakeholder consultations and participation. This will thenpave for resilient forest management in the region and beyond.
19.2.3 Water and Hydro-climatic Disasters
Floods create havoc every year in the region during the monsoon season. There havebeen numerous efforts made by the national agencies and humanitarian organizationsto improve upon the prior warning system for floods that can help save lives and
19 Lessons and Future Perspectives of Earth Observation … 367

properties. SERVIR-HKH has made efforts to enhance the flood early warningsystem in the region through its streamflow forecasting system (Chap. 9). Thestreamflow forecasting system has been highly effective in reducing the gap in floodforecasting in the region. For example, this regional system has provided dischargeinformation for rivers without gauges which gave a better idea about transboundaryflows in the case of Bangladesh. This system, based on a 15-day ECMWF (EuropeanCenter for Medium-Range Weather Forecasts) projection, has produced very goodresults in capturing riverine flood. However, it has failed to capture events such aslocalized flash floods in the smaller catchments of the mid-hills. To address thisissue, another forecast system, integrated with the High Impact Weather AssessmentTool (HIWAT) weather prediction model, has been developed, and this has shownthe potential to capture such events (Chap. 12). For this purpose, systematic vali-dation of the system with in situ data is crucial, but this has been a challenge sincemost of the small rivers do not have field stations. Another issue is access to suchdata which is limited due to the data policy and processing schedule of the respectiveagencies. Support from the Department of Hydrology and Meteorology (DHM) inNepal and the Flood Forecasting and Warning Center (FFWC) in Bangladesh in thevalidation of the systems has been very useful. The experiences in the region showthat coordination with the national agencies is crucial for the implementation of thesesystems; thus, it is important to build the confidence and capacity levels of thenational agencies so that the system is used effectively.
Another information that is sought during flood events is on the extent of theflooded area; this information is required to support relief and response measures.The efforts of SERVIR-HKH in near-real-time mapping of inundation using SARimages (Chap. 10) have been effective in responding during flood events, especiallyin a context wherein cloud cover is a major limitation in the case of optical EOapplications. These inundation maps are also highly accurate. Some of the chal-lenges in terms of SAR have been about the availability of these images, thetemporal frequency of data, and the time delay between the satellite acquisition ofimages and the availability of them for analysis. The SAR-based analysis alsoenables information on the water extent during a flood season; however, it cannotdifferentiate the floodwaters from the existing waterbodies and this hinders themapping of the actual flood extent.
Another challenge is that while the system of streamflow prediction captures therise and fall of water level within a stream, it is unable to provide any informationon the damages to people and properties. Thus, the ultimate need is for a systemthat predicts flood extent and depth and also integrates population and socioeco-nomic data in it, thereby aiding in the assessment of damages and in the setting upof better response planning.
Under the thematic area of water and hydro-climatic disasters, another applicationundertaken by SERVIR-HKH has been the mapping of glaciers and glacial lakes ofAfghanistan for the years 1990, 2000, 2010, and 2015 (Chap. 11). Being an arid andsemiarid country, irrigation in Afghanistan is highly dependent on water from glaciermelt. Thus, the assessment of glacier meltwater becomes important, also in terms of
368 M. A. Matin et al.
planning for hydropower. The impacts of climate change on the glacial environmenthave been one of the major concerns in the HKH region, especially Afghanistan.Thus, information on glacier area and volume, and changes over time are crucial forwater resources and food security of Afghanistan. To address this gapSERVIR-HKH collaborated with the National Water Affairs Regulation Authority(NWARA) of Afghanistan to develop a glacier database for the country.
While the collaboration has led to the acquisition of glacier data for 1990–2015,at a five-year-intervals, the database needs to be duly updated and maintained withmore recent data. More frequent annual data would also provide an option foranalyzing glacier changes, along with other climatic variables. One of the technicalchallenges in the development of an updated glacier database is about identifyingglaciers in areas with shadow, cloud, seasonal snow, or debris. This requires manualcorrection through visual interpretation, which is a labor-intensive process. One ofthe immediate applications of the time series glacial lake data is to identify thepotentially dangerous glacier lakes in the country and to prioritize the riskiestglacial lakes depending on the physical and socioeconomic parameters for itscontinuous monitoring. A GLOF risk reduction strategy can also be established toreduce the risk and increase the resilience of the vulnerable communities. A policyto strengthen national and institutional capacities in order to implementGLOF-resilient development pathways will be very important for the country.
19.2.4 Weather and Climate
A reliable system to provide location-based forecast of extreme weather events likethunderstorm, hailstorm, and lightning has been needed in the region for a longtime. The ensemble-based probabilistic forecast by HIWAT has been effective infilling some of the gaps in weather prediction in the HKH region (Chap. 12). Theprobability matched means from this ensemble forecast of precipitation also pro-vides a more reliable prediction of high-intensity precipitation that might cause aflash flood in the mountainous river catchments. But while the forecast generatedthrough HIWAT has shown a high degree of accuracy in predicting extremeweather, there is a lot of scope for improving the model and the configurations. Asthings stand, the data dissemination system now provides better access to forecastfor meteorologists in the national agencies. But the current visualization systemneeds to be made easily understandable to the decision makers.
Currently, the system is implemented in NASA’s SOCRATES, an HPC systemset up for supporting the regional hubs. SERVIR-HKH’s strategy for sustainabilityof this system has been to deploy it at the national agencies. However, the resourcesrequired for HPC is a significant bottleneck in this regard, even though theBangladesh Meteorological Department (BMD) has made good progress ininstalling this system. Although SERVIR-HKH has organized several trainingevents for the professionals from national agencies to use the system, more
19 Lessons and Future Perspectives of Earth Observation … 369
specialized training are required for the independent operation and maintenance ofthe system.
19.3 Lessons from Crosscutting Areas
SERVIR-HKH services are constantly guided by the intent to fill the major gapsand needs in the field of EO and geospatial applications in the region. The serviceshave been developed to come up with the desired information products that cansupport decision-making at various levels. In this context, a number of crosscuttingcomponents play a crucial role in creating an enabling environment that can ensurethe successful implementation of the services. These components are well identifiedin the service planning toolkit, and our experiences in these areas are presentedbelow.
19.3.1 Geoinformation Technology
The approach of SERVIR-HKH toward selecting GIT solutions has been based onthe institutional capacity of the partner agencies, and it has focused on the capacityenhancement of these agencies, thereby resulting in better adoption of the geoin-formation system (Chap. 13). The glacier monitoring system in Afghanistan,streamflow forecasting in Bangladesh, and the National Land Cover MonitoringSystem in Nepal are some of the successful examples. SERVIR-HKH has also triedto improve the accessibility to these services by the rural communities who areconstrained by poor internet connectivity and bandwidth limits. While thecloud-based processing system for a large volume of satellite data was a break-through in the development of land cover mapping and flood information servicesin the region, the existing capacity—in terms of IT infrastructure and technicalskills—of the partner agencies in adopting these systems is still a major challenge.Besides, the rapid evolution of GIT and the need for maintenance and frequentupdating of hardware and software have become critical constraints for the sus-tainability of these services.
19.3.2 Capacity Building
The capacity gap in the region was identified as one of the challenges for thesuccessful implementation and use of geoinformation services. These challengesrelated to: selecting the right people from the partner organizations; keeping up todate with fast emerging and changing technologies; reducing the gender gap inparticipation; and ensuring the use of the learnings in actual operations. The
370 M. A. Matin et al.

multi-tier capacity development program of SERVIR-HKH, focusing on individ-uals and institutions, has produced very good results (Chap. 14). The combinationof topic-based trainings in technologies and on-the-job trainings in system devel-opment and its use has been found to be useful in the successful co-developmentand deployment of the services in the partner agencies. Specialized trainings wereconducted for the faculty of universities have been highly appreciated as they havealso helped in developing a curriculum for geospatial science. Another highlight ofthe SERVIR-HKH training module to promote geospatial technologies has been itsfocus on women.
Our overall experience tells us that capacity building must be made a strongcomponent of SERVIR-HKH service development and delivery. Our learning hasalso been that a more innovative approach needs to be adopted for reaching out towider communities. The capacity building of the end user of the services is alsovital to ensure the effective use of the systems. Besides, customized trainings andorientation programs for the higher management and policymakers are importantfor better adoption of these systems within the government agencies. In this regard,a number of events were also organized virtually during the COVID-19 phase, andthis has given us new insights into online training approaches. While there weresome limitations due to lack of face-to-face interactions, these virtual trainingssuccessfully organised; also, they were cost-effective in terms of logistics and couldaccommodate a larger number of participants.
19.3.3 Gender Inclusion
Like other science and technology fields, there exists a considerable gender gap inthe field of EO and GIT in the HKH region. There are far fewer women profes-sionals in this field compared to men. There is a great need for improving women’saccess to geoinformation and their role in decision-making. For this, the servicesand products require customization for generating gender-inclusive information andbuilding the capacity of women to use these products.
Gender inclusiveness is part of the SERVIR-HKH framework (Chap. 15). Ourefforts to increase women’s participation in capacity building through explicitwomen-focused events were successful in reaching out to more women. Theseevents generated awareness as well as gave young women an opportunity to learnabout the prospects of the GIT field. While some of the services could integrategender and social issues, a lot more needs to be done in this area. A big issue inincluding more women professionals in the co-development process was that thereis a lack of such professionals in the partner agencies. Targeted capacity buildingactivities have to be carried out in this regard through universities and other relevantplatforms. It is obvious that more gender-integrated studies as well as informationproducts tailored for women and other marginalized groups would be helpful inextending the reach of these information services.
19 Lessons and Future Perspectives of Earth Observation … 371

19.3.4 Communication
Strategic communication (Chap. 16) is important for successful service design,delivery, and adoption. At the beginning of a service design process, communi-cation is mainly internal and focused on ensuring that all the partners and stake-holders have the same knowledge and understanding of the products and services.At this stage, the communication activities aim to prepare materials on the productand services targeting the co-development partners to elaborate on the purpose andfeatures of the services. At the later stages of the service delivery process, thecommunication activity focuses on the development of outreach materials targetingthe end users. For effective communication, translation of some of the materials andinterfaces in multiple languages are sometimes required. As communication is acontinuous process, the materials need to be updated as per the progress of servicedevelopment and delivery. While scientific articles or technical documentations arerequired for building the confidence of partners and the scientific community,descriptive materials are equally necessary for the wider users to build awarenessabout the services. The narration of success stories also helps to demonstrate the useand impact of the services. Besides developing communication materials, con-ducting regular communication campaigns is also crucial. These can be by way oftechnical and dissemination workshops, forums, newsletters, and social mediacampaigns. Constant engagement with media outlets is also an important facet ofeffective communication.
19.3.5 User Engagement
Systematic engagement with partners and stakeholders is an integral part of theservice design and delivery process. The user engagement process withinSERVIR-HKH has evolved over time and a dedicated user engagement mechanismwas included in the service design and implementation from the beginning of thesecond phase (Chap. 17). The concept of co-design and co-development wasadopted as a key strategy. Our experiences have been that the users are nothomogeneous in terms of their situation, need, and capacity. For effectiveengagement, the collaboration strategy should be tailored to the situation of indi-vidual users. Continuous engagement with the key partners is also important andformal partnership agreements like MoU (Memorandum of Understanding) andLoI (Letter of Intent) are helpful in facilitating the process. Also, the involvementof various other stakeholders should not be overlooked. And it goes without sayingthat co-design and co-development are essential for the long-term sustenance ofthese services.
372 M. A. Matin et al.
19.3.6 Monitoring and Evaluation
Creating sustainable impacts in society through informed decision-making is theultimate goal of SERVIR-HKH. The theory of change (ToC) approach adopted bySERVIR has been instrumental in aligning the service delivery process with out-comes and impacts on the ground (Chap. 18). The PIPA process has helped inbuilding collective understanding between the SERVIR team and the partners foranalyzing and developing the ToC for the services. This was important in terms ofclarifying expectations and co-designing and implementing the services. This hasalso helped in the collective monitoring of progress and achievement. The PIPAprocess introduced at the service planning stage in the second phase has led to animprovement in aligning the service design and delivery components with userneeds. However, PIPA, ToC, and MEL involve iterative processes and flexibility toadapt to the changing needs. For example, revisiting the ToC as per the projecttimeline helps partners to re-evaluate the products and services and thereby makethe necessary adjustments. Moreover, defining clear indicators to track the changesin terms of outcomes and impacts, based on regular data collection and analysis, isimportant to ensure that the efforts are going in the right direction.
19.4 Future Directions in EO Applicationsand Opportunities
The opportunities for applications of EO in the HKH region are highly influencedby the global trends and the priorities set by the nations that are leading the spacerace. In addition to NASA as the leader in space exploration, the new strategy of theUSA in deep space exploration has clearly identified the potential roles of thedifferent government departments and the private sector (White House 2020). Theachievements of SpaceX (www.spacex.com), a private company, in the develop-ment and reuse of orbital-class launch vehicles, thereby reducing substantial costsin the space industry, can be expected to bring a paradigm shift in the design andlaunching of EO satellites in the coming decades. Among the many planned mis-sions of NASA, Landsat 9 is expected to provide continuity to the current moni-toring applications, and NASA-ISRO Synthetic Aperture Radar (NI-SAR) willprovide opportunities for many new applications on disasters, water resources, andvegetation monitoring (www.nasa.gov). Similarly, the Copernicus SpaceComponent of the European Union has plans for expanding the Sentinel system toincorporate six high-priority missions: Anthropogenic CO2 Monitoring (CO2M);Land Surface Temperature Monitoring (LSTM); Polar Ice and Snow TopographyAltimeter (CRISTAL): Copernicus Imaging Microwave Radiometer (CIMR);Copernicus Hyperspectral Imaging Mission for the Environment (CHIME); and theRadar Observing System for Europe in L-band (ROSE-L) (FutureEarth 2020). Withthe policy of Copernicus being to provide free access to Sentinel data, the EO
19 Lessons and Future Perspectives of Earth Observation … 373
community is highly optimistic about new and enhanced services in the areas ofatmospheric, oceanic, cryospheric, and land global monitoring. There are alsonumerous space missions planned by Japan, Korea, China, India, and many othercountries. Besides, the initiatives of the Committee on Earth Observation Satellites(CEOS) on international coordination of civil space-based EO programs in thedevelopment of compatible data products, formats, services, applications, andpolicies, and to optimize societal benefits, have been commendable in buildingcollaborations and synergies. These efforts are also being supplemented by theGroup on Earth Observation (GEO) with its many regional initiatives like AOGEOand thematic initiatives such as GeoGLOWS, GEOGLAM, GEOBON, and GEOMountains, which are relevant to addressing the many concerns of the HKH region.The GEO has a dedicated initiative on EO for sustainable development (EO4SDG)to support the UN 2030 Agenda, in order to organize and help realize the potentialof EO and enable societal benefits through the achievement of the SDGs (Andersonet al. 2017). In the context of all the HKH countries striving to achieve the SDGs,such initiatives provide frameworks and guidance on the applications of EO forvarious indicators.
Besides these trends in the field of EO, many disruptive technologies are pro-gressing rapidly that will change the way we utilize EO data and information in thenear future. To list a few of them, the Internet of things (IoT) will support billions ofconnected devices to sense the essential elements of our Earth environment anddevelop innovative paradigms for distributed computing. AI is another rapidlyevolving technology that is increasingly being applied in the analysis of largevolumes of EO data to extract meaningful information accurately and efficiently.The integrated use of AI, powerful cloud-based computing infrastructure, and new5G connectivity with sensor networks in IoT is expected to bring in unprecedentedopportunities at both local and global levels (Genderen et al. 2020).
In the context of the HKH, we see many opportunities due to a huge gap in data,capacities, and services in EO and GIT, and also because of the increasingacceptance of these technologies by the national agencies as a means to improve thedecision-making process. The signing of a declaration by the eight governments ofthe region supporting ICIMOD’s HKH Call to Action during the “Hindu KushHimalaya Ministerial Mountain Summit 2020” on 15 October 2020 shows agrowing commitment to strengthening regional cooperation, promoting a unitedvoice for the HKH at regional and global levels, and enhancing the uptake ofscientific evidence for improving policies in the region on mountain environmentsand livelihoods (ICIMOD 2020a). Out of the six immediate actions identified by thecall, Action 6 calls for promoting regional data and information sharing and scienceand knowledge cooperation in order to fill the data gaps and develop actionableknowledge that is mountain focused and HKH specific (ICIMOD 2020b). Theefforts being made by SERVIR-HKH will directly contribute to addressing this call.SERVIR has also come up with its “SERVIR Strategic Plan 2020–2025” whichstates that one of its three strategic goals is to enhance its leadership power andinfluence globally. This reflects that the knowledge and experience generated by theSERVIR-HKH hub, in collaboration with its partners, have firmly established it as
374 M. A. Matin et al.

the regional center of excellence in the application of EO information. There is nowgrowing confidence among the partners about SERVIR-HKH’s applications andservices. Indeed, the SERVIR network, with its many institutions worldwide and itsregional hubs across the globe, provides a unique opportunity for cross-hublearning and working on innovative solutions using the current and future devel-opments in EO and geospatial technologies.
References
Anderson K, Ryan B, Sonntag W, Kavvada A, Friedl L (2017) Earth observation in service of the2030 agenda for sustainable development. Geo-spat Inf Sci. https://doi.org/10.1080/10095020.2017.1333230
FutureEarth (2020) Plans for a new wave of European sentinel satellites. https://futureearth.org/publications/explainers/plans-for-a-new-wave-of-european-sentinel-satellites/
Genderen Jv, Goodchild MF, Guo H, Yang C, Nativi S, Wang L, Wang C (2020) Digital earthchallenges and future trends. In: Guo H, Goodchild MF, Annoni A (eds) Manual of digitalearth. SpringerOpen, Berlin
ICIMOD (2020a) Hindu Kush Himalaya Ministerial Mountain Summit 2020 (https://www.icimod.org/hkhmms/)
ICIMOD (2020b) The HKH call to action to sustain mountain environments and improvelivelihoods in the Hindu Kush Himalaya. ICIMOD, Kathmandu
White House (2020) A new era for deep space exploration and development, The white housenational space council. https://www.whitehouse.gov/wp-content/uploads/2020/07/A-New-Era-for-Space-Exploration-and-Development-07-23-2020.pdf
Open Access This chapter is licensed under the terms of the Creative Commons Attribution 4.0International License (http://creativecommons.org/licenses/by/4.0/), which permits use, sharing,adaptation, distribution, and reproduction in any medium or format, as long as you give appro-priate credit to the original author(s) and the source, provide a link to the Creative Commonslicense, and indicate if changes were made.The images or other third party material in this chapter are included in the chapter’s Creative
Commons license, unless indicated otherwise in a credit line to the material. If material is notincluded in the chapter’s Creative Commons license and your intended use is not permitted bystatutory regulation or exceeds the permitted use, you will need to obtain permission directly fromthe copyright holder.
19 Lessons and Future Perspectives of Earth Observation … 375
Related Documents