Earth and Planetary Science Letters 480 (2017) 147–157 Contents lists available at ScienceDirect Earth and Planetary Science Letters www.elsevier.com/locate/epsl Relationships between along-fault heterogeneous normal stress and fault slip patterns during the seismic cycle: Insights from a strike-slip fault laboratory model Yannick Caniven a,∗ , Stéphane Dominguez a , Roger Soliva a , Michel Peyret a , Rodolphe Cattin a , Frantz Maerten b a University of Montpellier, Géosciences Montpellier Laboratory, France b Schlumberger, Information Solutions Division, Montpellier, France a r t i c l e i n f o a b s t r a c t Article history: Received 29 March 2017 Received in revised form 26 September 2017 Accepted 5 October 2017 Available online 2 November 2017 Editor: R. Bendick Keywords: seismic cycle analog modeling earthquakes strike-slip fault tectonics stress We use a strike-slip fault analog model to study experimentally the role played by along-fault non- uniform and asymmetric applied normal stress on both coseismic slip and long-term fault behavior. Our model is based on a visco-elasto-plastic multi-layered rheology that allows to produce several hundreds of scaled analog microquakes and associated seismic cycles. Uniform or heterogeneous applied normal stress along the fault plane is imposed and maintained constant during the whole experiment durations. Our results suggest that coseismic slip patterns are strongly controlled by spatial normal stress variations and subsequent accumulated shear stress along fault strike. Major microquakes occur preferentially in zones of major shear stress asperities. Coseismic slip distributions exhibit a pattern similar to the along-fault applied normal stress distribution. The occurrence of isolated low to moderate microquakes where residual stresses persist around secondary stress asperities, indicates that stress conditions along the fault also control the whole variability of fault slip events. Moreover, when fault slip stability conditions are modulated by normal stress distribution, our experiments suggest that the along- fault stress heterogeneity influences the seismic cycle regularity and, consequently, long-term fault slip behavior. Uniform applied normal stress favors irregular seismic cycles and the occurrence of earthquakes clustering, whereas non-uniform normal stress with a single high amplitude stress asperity generates strong characteristic microquake events with stable return periods. Together our results strengthen the assumption that coseismic slip distribution and earthquake variability along an active fault may provide relevant information on long term tectonic stress and could thus improve seismic hazard assessment. © 2017 Elsevier B.V. All rights reserved. 1. Introduction One of the main measurable parameters that allow character- izing earthquake dynamics is short- and long-term fault slip kine- matics. Studying coseismic fault slip distribution provides crucial data to better constrain earthquake mechanics (e.g. Scholz, 1982; King and Wesnousky, 2007), and has also strong implications on seismic hazard assessment (e.g. Stein et al., 1997). Nowadays, re- cent technological advances in remote sensing measurements as well as the development of dense and permanent geodetic net- works provide a detailed analysis of surface deformation along active faults. The 2013 Mw = 7.7 Balochistan earthquake is a typ- * Corresponding author at: UMR-5243, Géosciences Montpellier Laboratory, Uni- versity of Montpellier, CC.60, 34095 Montpellier cedex 5, France. E-mail address: [email protected] (Y. Caniven). ical example. The inversion of near and far field ground deforma- tion obtained from InSAR and sub-pixel optical images correlation provided coseismic slip distribution on the fault plane and led to a better understanding of the mechanical processes activated during this earthquake (Avouac et al., 2014). From such studies, coseismic slip distribution along the fault rupture appears usu- ally heterogeneous, with zones of high slip, referred as asperities, separated by zones of low to zero slip (e.g. Peltzer et al., 2001; Mai and Beroza, 2002; Avouac et al., 2014). The observed variability in earthquake fault slip distribu- tions can be attributed to many factors (Bizzarri, 2009) includ- ing tectonic context, fault plane geometry (e.g. Robinson et al., 2006), earthquake triggered processes such as fluid pressurization (Faulkner and Rutter, 2001), inelastic deformation in the ambi- ent rocks (e.g. Bürgmann et al., 1994; Kaneko and Fialko, 2011) or interactions between nearby faults (e.g. Andrews, 1994). In- vestigations based on the analysis of earthquakes data catalog https://doi.org/10.1016/j.epsl.2017.10.009 0012-821X/© 2017 Elsevier B.V. All rights reserved.

Welcome message from author
This document is posted to help you gain knowledge. Please leave a comment to let me know what you think about it! Share it to your friends and learn new things together.
Transcript

Earth and Planetary Science Letters 480 (2017) 147–157
Contents lists available at ScienceDirect
Earth and Planetary Science Letters
www.elsevier.com/locate/epsl
Relationships between along-fault heterogeneous normal stress and
fault slip patterns during the seismic cycle: Insights from a strike-slip
fault laboratory model
Yannick Caniven a,∗, Stéphane Dominguez a, Roger Soliva a, Michel Peyret a, Rodolphe Cattin a, Frantz Maerten b
a University of Montpellier, Géosciences Montpellier Laboratory, Franceb Schlumberger, Information Solutions Division, Montpellier, France
a r t i c l e i n f o a b s t r a c t
Article history:Received 29 March 2017Received in revised form 26 September 2017Accepted 5 October 2017Available online 2 November 2017Editor: R. Bendick
Keywords:seismic cycleanalog modelingearthquakesstrike-slip faulttectonicsstress
We use a strike-slip fault analog model to study experimentally the role played by along-fault non-uniform and asymmetric applied normal stress on both coseismic slip and long-term fault behavior. Our model is based on a visco-elasto-plastic multi-layered rheology that allows to produce several hundreds of scaled analog microquakes and associated seismic cycles. Uniform or heterogeneous applied normal stress along the fault plane is imposed and maintained constant during the whole experiment durations. Our results suggest that coseismic slip patterns are strongly controlled by spatial normal stress variations and subsequent accumulated shear stress along fault strike. Major microquakes occur preferentially in zones of major shear stress asperities. Coseismic slip distributions exhibit a pattern similar to the along-fault applied normal stress distribution. The occurrence of isolated low to moderate microquakes where residual stresses persist around secondary stress asperities, indicates that stress conditions along the fault also control the whole variability of fault slip events. Moreover, when fault slip stability conditions are modulated by normal stress distribution, our experiments suggest that the along-fault stress heterogeneity influences the seismic cycle regularity and, consequently, long-term fault slip behavior. Uniform applied normal stress favors irregular seismic cycles and the occurrence of earthquakes clustering, whereas non-uniform normal stress with a single high amplitude stress asperity generates strong characteristic microquake events with stable return periods. Together our results strengthen the assumption that coseismic slip distribution and earthquake variability along an active fault may provide relevant information on long term tectonic stress and could thus improve seismic hazard assessment.
© 2017 Elsevier B.V. All rights reserved.
1. Introduction
One of the main measurable parameters that allow character-izing earthquake dynamics is short- and long-term fault slip kine-matics. Studying coseismic fault slip distribution provides crucial data to better constrain earthquake mechanics (e.g. Scholz, 1982;King and Wesnousky, 2007), and has also strong implications on seismic hazard assessment (e.g. Stein et al., 1997). Nowadays, re-cent technological advances in remote sensing measurements as well as the development of dense and permanent geodetic net-works provide a detailed analysis of surface deformation along active faults. The 2013 Mw = 7.7 Balochistan earthquake is a typ-
* Corresponding author at: UMR-5243, Géosciences Montpellier Laboratory, Uni-versity of Montpellier, CC.60, 34095 Montpellier cedex 5, France.
E-mail address: [email protected] (Y. Caniven).
https://doi.org/10.1016/j.epsl.2017.10.0090012-821X/© 2017 Elsevier B.V. All rights reserved.
ical example. The inversion of near and far field ground deforma-tion obtained from InSAR and sub-pixel optical images correlation provided coseismic slip distribution on the fault plane and led to a better understanding of the mechanical processes activated during this earthquake (Avouac et al., 2014). From such studies, coseismic slip distribution along the fault rupture appears usu-ally heterogeneous, with zones of high slip, referred as asperities, separated by zones of low to zero slip (e.g. Peltzer et al., 2001;Mai and Beroza, 2002; Avouac et al., 2014).
The observed variability in earthquake fault slip distribu-tions can be attributed to many factors (Bizzarri, 2009) includ-ing tectonic context, fault plane geometry (e.g. Robinson et al., 2006), earthquake triggered processes such as fluid pressurization (Faulkner and Rutter, 2001), inelastic deformation in the ambi-ent rocks (e.g. Bürgmann et al., 1994; Kaneko and Fialko, 2011) or interactions between nearby faults (e.g. Andrews, 1994). In-vestigations based on the analysis of earthquakes data catalog
148 Y. Caniven et al. / Earth and Planetary Science Letters 480 (2017) 147–157
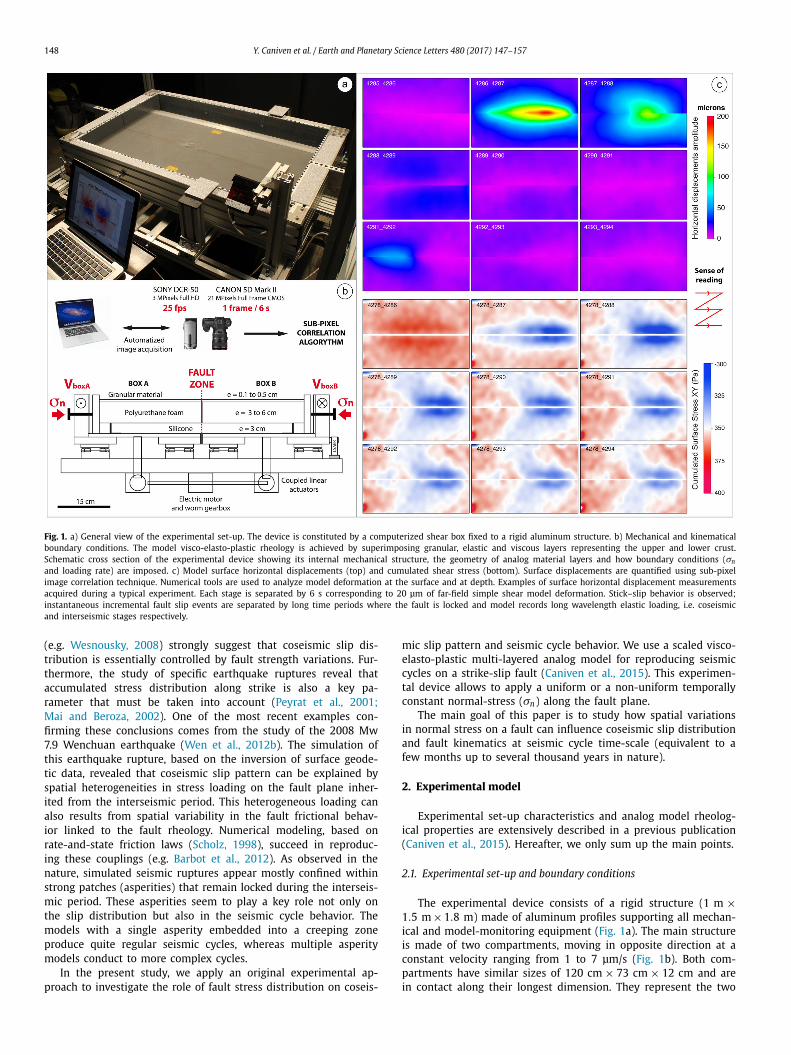
Fig. 1. a) General view of the experimental set-up. The device is constituted by a computerized shear box fixed to a rigid aluminum structure. b) Mechanical and kinematical boundary conditions. The model visco-elasto-plastic rheology is achieved by superimposing granular, elastic and viscous layers representing the upper and lower crust. Schematic cross section of the experimental device showing its internal mechanical structure, the geometry of analog material layers and how boundary conditions (σn
and loading rate) are imposed. c) Model surface horizontal displacements (top) and cumulated shear stress (bottom). Surface displacements are quantified using sub-pixel image correlation technique. Numerical tools are used to analyze model deformation at the surface and at depth. Examples of surface horizontal displacement measurements acquired during a typical experiment. Each stage is separated by 6 s corresponding to 20 μm of far-field simple shear model deformation. Stick–slip behavior is observed; instantaneous incremental fault slip events are separated by long time periods where the fault is locked and model records long wavelength elastic loading, i.e. coseismic and interseismic stages respectively.
(e.g. Wesnousky, 2008) strongly suggest that coseismic slip dis-tribution is essentially controlled by fault strength variations. Fur-thermore, the study of specific earthquake ruptures reveal that accumulated stress distribution along strike is also a key pa-rameter that must be taken into account (Peyrat et al., 2001;Mai and Beroza, 2002). One of the most recent examples con-firming these conclusions comes from the study of the 2008 Mw 7.9 Wenchuan earthquake (Wen et al., 2012b). The simulation of this earthquake rupture, based on the inversion of surface geode-tic data, revealed that coseismic slip pattern can be explained by spatial heterogeneities in stress loading on the fault plane inher-ited from the interseismic period. This heterogeneous loading can also results from spatial variability in the fault frictional behav-ior linked to the fault rheology. Numerical modeling, based on rate-and-state friction laws (Scholz, 1998), succeed in reproduc-ing these couplings (e.g. Barbot et al., 2012). As observed in the nature, simulated seismic ruptures appear mostly confined within strong patches (asperities) that remain locked during the interseis-mic period. These asperities seem to play a key role not only on the slip distribution but also in the seismic cycle behavior. The models with a single asperity embedded into a creeping zone produce quite regular seismic cycles, whereas multiple asperity models conduct to more complex cycles.
In the present study, we apply an original experimental ap-proach to investigate the role of fault stress distribution on coseis-
mic slip pattern and seismic cycle behavior. We use a scaled visco-elasto-plastic multi-layered analog model for reproducing seismic cycles on a strike-slip fault (Caniven et al., 2015). This experimen-tal device allows to apply a uniform or a non-uniform temporally constant normal-stress (σn) along the fault plane.
The main goal of this paper is to study how spatial variations in normal stress on a fault can influence coseismic slip distribution and fault kinematics at seismic cycle time-scale (equivalent to a few months up to several thousand years in nature).
2. Experimental model
Experimental set-up characteristics and analog model rheolog-ical properties are extensively described in a previous publication (Caniven et al., 2015). Hereafter, we only sum up the main points.
2.1. Experimental set-up and boundary conditions
The experimental device consists of a rigid structure (1 m ×1.5 m × 1.8 m) made of aluminum profiles supporting all mechan-ical and model-monitoring equipment (Fig. 1a). The main structure is made of two compartments, moving in opposite direction at a constant velocity ranging from 1 to 7 μm/s (Fig. 1b). Both com-partments have similar sizes of 120 cm × 73 cm × 12 cm and are in contact along their longest dimension. They represent the two
Y. Caniven et al. / Earth and Planetary Science Letters 480 (2017) 147–157 149
compartments of a strike-slip vertical fault. Compartment displace-ments are controlled using a laser telemeter and image monitoring techniques (sub-pixel spectral correlation). For all the considered experiments in this paper, the shear sense is left-lateral. Analog materials filling the two compartments undergo, then a localized left-lateral shear deformation at a constant loading rate. The ana-log model material can be loaded laterally to scale σn along the fault plane (from 50 to 1000 Pa) and also to adjust the threshold of static and dynamic friction (Fig. 1b).
2.2. Model rheology and scaling
The analog model rheology intends to simulate the mechani-cal behavior of an idealized continental crust. With this aim, the model is formed with three superimposed layers of different ana-log materials (Fig. 1). The basal layer is 3 cm thick and is made of a visco-elastic silicone compound (PDMS-SGM 36, Dow Corning Ltd., viscosity about 50 kPa s at room temperature) for simulat-ing the viscous deformation and strain hardening behavior of the lower crust (Rudolf et al., 2016). The intermediate layer is 4 to 6 cm thick and it is made of a high resilience Polyurethane foam (Young modulus = 95 ± 10 kPa, Poisson ratio = 0.06 ± 0.02, Shear modulus = 45 ± 5 kPa, V p = 100 m/s, V s = 68 m/s). The foam al-lows for the simulation of the elastic deformation characterizing the mechanical behavior of the upper crust at the seismic cycle time scale (Caniven et al., 2015). The upper-most layer is 0.2 to 0.5 cm thick and is formed by a granular material mixture (silica powder and graphite). It represents the uppermost few kilometers of the shallow crust where deformation is considered as essentially brittle.
The contact zone between the two foam plates constitutes the fault plane. It measures 1 m long and extends vertically 8–10 cm from the base of the two rigid aluminum profile compartments up to the model surface, through the silicone, the polyurethane foam and the granular material layers. Thus, friction properties vary ver-tically along the fault plane. In the basal silicone layer, the fault zone broadens into a 3 cm thick ductile shear zone, whose resis-tance is shear-rate dependent. The main frictional interface is con-stituted by the intermediate layer along which the two foam plates slip in opposite direction. The fault plane is coated using a colored epoxy resin to obtain a static friction coefficient μs = 0.65 ± 0.05and a dynamic friction coefficient μd = 0.42 ± 0.05. At fault tips, two low friction patches, 3 cm long, are stuck on each side of the fault plane to limit boundary effects. These patches induce a local stable sliding of the foam plates at both tips of the locked fault, restricting the stick–slip events to the main central part of the ex-perimental device.
Extrapolation of analog modeling results to nature is based on the scaling theory elaborated by Hubbert (1937) and later refined by Cobbold and Jackson (1992). Using analog material and nature physical properties, we estimate the geometric factor (L∗) to be in the range between 3 × 10⁻⁶ to 5 × 10⁻⁶ (1 cm in the model ∼2–3 km in nature).
The upper crust is modeled using a polyurethane foam plate which has a low density (ρ = 40 kg m−3) compared to upper crust density (2700 kg m−3). As a result, the lithostatic stress and the normal stress along the fault plane are very low, inducing pos-sible model scaling distortion. We compensate this limitation by imposing the normal stress σn along the fault plane (∼500 Pa) so that it scales to nature (∼150 MPa) using the geometric fac-tor (L∗ ∼ 4 × 10⁻⁶). Similarly, we select a specific polyurethane foam whose shear modulus (G = 45 ± 5 kPa) scales to nature (G ∼ 10–30 GPa) using the same factor (L∗).
Similarity between model and nature in term of slip stability can be established by comparing rate-and-state frictional proper-ties (Scholz, 1998). It concerns (1) the (a − b) parameter, which
describes the velocity dependence of friction, and (2) the critical slip distance Dc , referred as the slip amount necessary for friction to change in response to a velocity variation. This leads to the de-termination of the critical length Lc of the slipping region above which instability occurs, i.e. the so-called nucleation size. At first order, the model scaling is considered to be correct if (a − b) is conserved between model and nature (dimensionless), and if Dcand Lc scale to nature using the geometric factor L∗ .
For (a − b) ≥ 0, the material is “velocity-strengthening” and the system is intrinsically stable whereas for (a − b) ≤ 0, the material is “velocity-weakening” and the system becomes unstable at a crit-ical value of σn . For our experiments, (a −b) has been estimated to −0.017 ± 0.005 (Caniven et al., 2015), consistent with determined values for rocks in the velocity-weakening domains (e.g. Scholz, 1998). Estimates of Dc and Lc and theoretical concepts are de-tailed in the provided supplementary material. We estimate Dc in the model to about 30 μm (scaling to ∼7 m using L∗) consistent with natural earthquakes values ranging from decimeters to sev-eral meters (e.g. Fukuyama and Suzuki, 2016). The critical length Lc in the model is estimated to about 1 mm (scaling to ∼250 m using L∗), consistent with typical values for natural earthquakes in the order of hectometers to kilometers (e.g, Kaneko et al., 2016).
Following Rosenau et al. (2009) and Corbi et al. (2011) tem-poral scaling evaluation can be achieved by defining two different timescales for the interseismic and the coseismic periods (Caniven et al., 2015). Due to slow interseismic deformation, inertia forces are negligible and viscous forces in the silicone layer, representing the lower crust, become dominant. Using silicone SGM36 proper-ties and scaling rules, we obtain an interseismic timescale of T ∗
i ∼2.5 ×10⁻⁹ (i.e., 1 s in the model ∼10–15 yr in nature). The coseis-mic timescale (T ∗
c ) can be estimated considering that the Froude number should remain constant. As a result, T ∗
c = √L∗ = 2 × 10⁻³
(1 s in the model ∼500 s in nature). As proposed by Rosenau et al.(2009), we estimate the interseismic and coseismic stage velocities using the ratios between L∗ and T ∗
i and L∗ and T ∗c . We obtain for
interseismic: 5 mm/h in the model versus ∼27 mm/yr in nature and for coseismic 3 × 10⁻³ m/s in the model versus ∼1.5 m/s in nature. More details concerning the model scaling can be found in Caniven et al. (2015).
2.3. Kinematics monitoring, data processing and analysis
Model surface deformation is monitored using a digital cam-era, located at the top of the experimental device. It records a high-resolution image (21 Mpixels) every 6 s (Fig. 1). These data are processed using a sub-pixel spectral correlation algorithm to derive the two components of horizontal surface displacements (X and Y , the parallel and normal directions to the fault strike). Typical measurements accuracy and spatial resolution reach 2 μmand 5 mm, respectively leading to a total of about 20.000 indepen-dent measurements every 6 s. Horizontal displacement data are, then, filtered and formatted to study model surface kinematics.
Model strain and stress states evolution can be analyzed in de-tail using the large catalog of surface displacements. Note that the vertical component of surface displacements is not measured, and cannot be used to calculate strain and stress. However, because the fault has a pure strike-slip kinematics, amplitude of vertical displacements are estimated to be one to two orders of magni-tude smaller than horizontal displacements (Okada, 1985). Thus, we consider that plane strain conditions (2D) can be assumed and the components of model surface strain ε and stress tensors σ are, then, derived from the horizontal surface displacements. Assuming linear elasticity, the stress tensor σ is obtained from the Hooke’s law:
σi j = 2Gεi j + λϕ�i j (1)
150 Y. Caniven et al. / Earth and Planetary Science Letters 480 (2017) 147–157
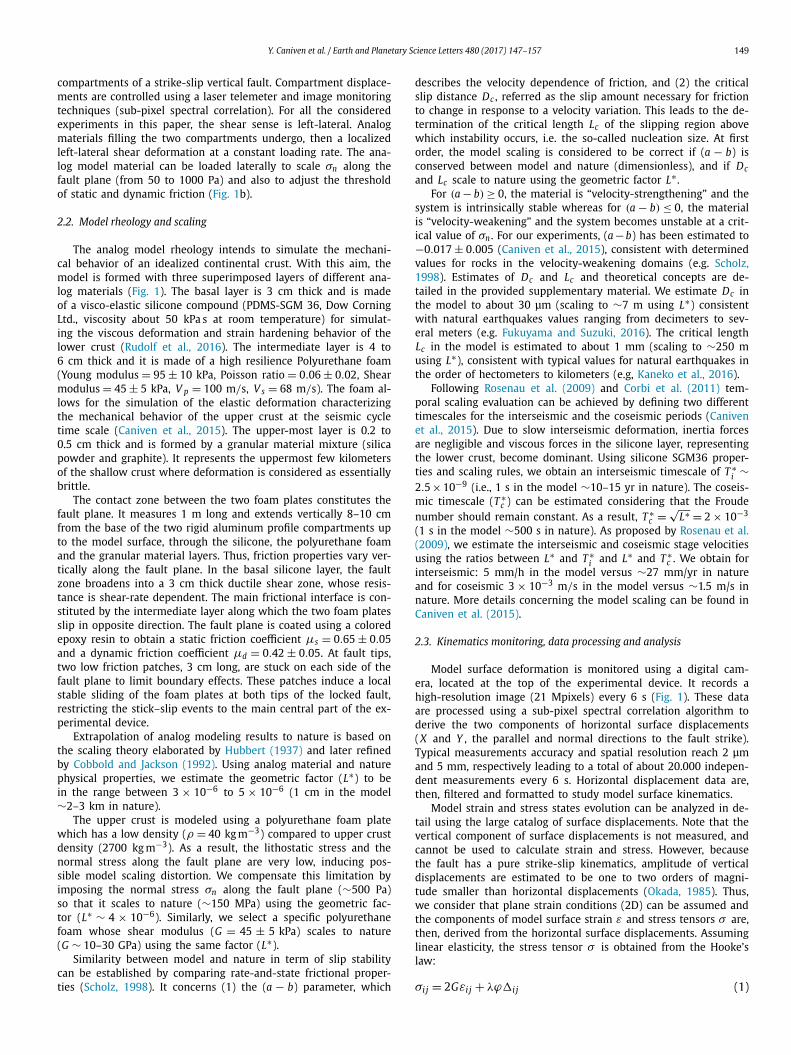
Fig. 2. a) Model rheology and boundary conditions. b) Surface horizontal displacement amplitude and vector field showing the pre-stressing of the fault plane (up) and calculated σyy . c) σyy distribution (absolute value) along the fault trace from the σyy map in (b).
with ϕ the first invariant of strain tensor, � the Kronecher’s delta, G and λ, the shear modulus and Lamé coefficient, respectively. By convention, tension and right-lateral shear stress are positive. An increase of σxy is, then, associated with a drop in left-lateral stress induced by a fault slip event.
In all of our experiments, after a transient time period of gen-eral elastic loading (typically after 10 mm of bulk shearing), stick–slip behavior and seismic-cycle like phases of deformation are observed and measured. This phase is characterized by the occur-rence of instantaneous incremental slip events separated by peri-ods (lasting from a few seconds to a few minutes) during which the fault appears to be partially or totally locked. Fig. 1c shows a short sequence, lasting 1 min, extracted from a typical experi-ment monitored every 6 s. The first stage corresponds to the end of the previous interseismic stage during which the fault was totally locked. Besides, using Eq. (1), derived cumulated σxy of this prece-dent stage indicates a global loading of the model surface with a slight concentration around the fault central part. The next stage shows the occurrence of a strong coseismic event (fault slip of about 200 μm) characterized by an asymmetric distribution of slip along the rupture. It is immediately followed by a model surface deformation pattern interpreted as a postseismic stage (Caniven et al., 2015). Surface cumulated σxy map shows a relaxation along and in the vicinity of the rupture with a maximum stress drop lo-cated in the maximum slip region. Then, the fault relocks before slipping again but with a lower amplitude as shown by a moder-ate event that occurs to the left and relaxes locally the shear stress in this zone.
3. Results
3.1. Studied experiment and boundary conditions
To present and discuss our results, we have selected one demonstrative experiment among the 51 performed to investigate model behavior. This experiment is characterized by a constant far field left-lateral loading rate of 20 mm/h ± 2 mm/h and a non-uniform and asymmetric applied normal stress σyy along the fault trace (Fig. 2). Normal stress distribution is maintained con-stant during the whole experiment duration. At a local scale, σyy
variations along the fault depend on irregularities of the contact geometry between the two polyurethane foam plates induced by industrial cutting. Such fault surfaces irregularities have amplitudes of 0–5 mm in the Y -direction over wavelengths of up to 30 cm in the X-direction. These oscillations induce variations of σyy when the foam plates are brought into contact. The amplitude of σyy
along the fault plane is set using lateral screws. Strain associated to this pre-stressing stage is quantified by subpixel correlation of two photos taken before and after putting the foam plates in con-tact (Fig. 2b). σyy value along the surface fault trace is estimated using the measured strain field, the foam Young modulus and the Hooke’s law.
For the present experiment, the absolute σyy peak value reaches 650 ± 30 Pa and is located between x-coordinates x =600 mm and x = 750 mm where σyy is above 550 Pa (Fig. 2b and 2c). A second lower peak is observed between x = 280 mmand x = 350 mm where σyy exceeds 400 Pa with a maximum of 430 ± 30 Pa. Following the definition proposed by Schellart and Rawlinson (2013), this zone of highest σyy can be considered
Y. Caniven et al. / Earth and Planetary Science Letters 480 (2017) 147–157 151
as a “stress asperity”. Such an asperity is described as a delim-ited portion of the fault plane where the mechanical coupling is significantly higher than in the surroundings (Kanamori, 1981;Lay et al., 1982).
The duration of the presented sequence is 40 min (∼24000 yrs) from which we derived and analyzed 400 successive surface dis-placement fields. It was extracted far enough from the beginning of the experiment (90 mm of cumulative displacement) to be sure that the model has reached its long-term evolution, i.e. the cycle-invariance and that these measurements were acquired sig-nificantly after model spin-up time (Hetland and Hager, 2006). The time sampling is 6 s (∼50–100 yrs) which corresponds to ∼33 μm of far field horizontal displacement parallel to the fault. Because fault plane coating covers uniformly the foam sides in contact and does not deteriorate with time, the frictional properties along the fault plane can be considered homogeneous and constant during the whole experiment duration.
3.2. Slip event classes
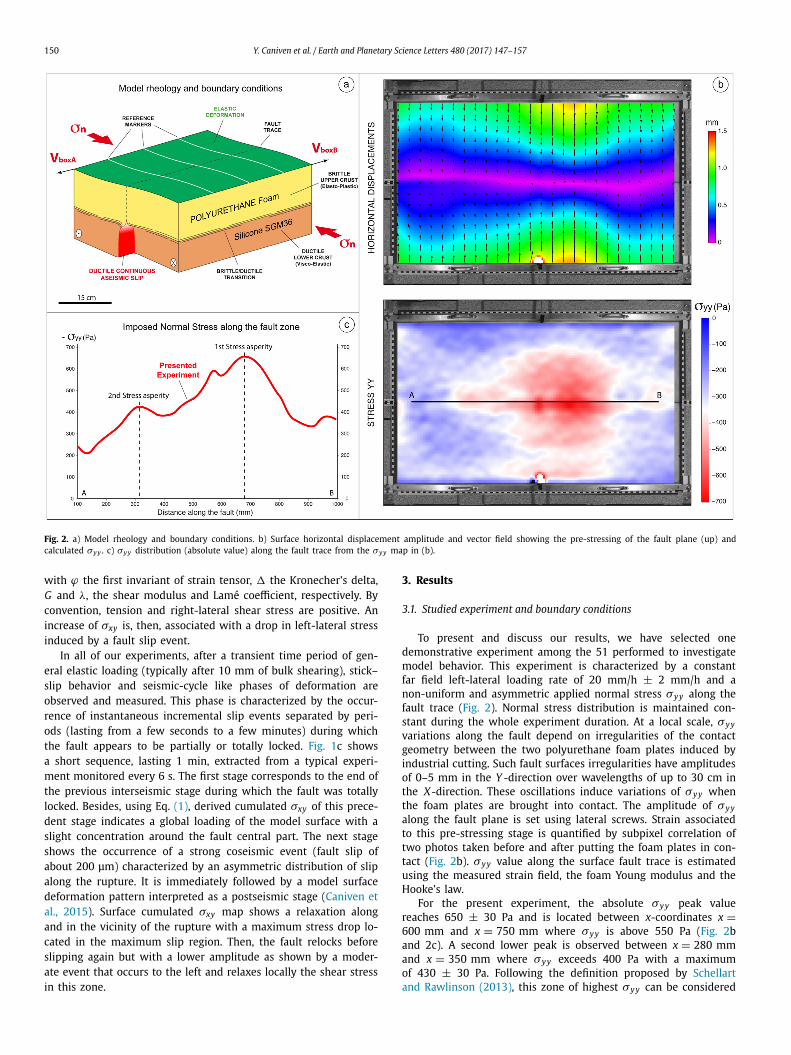
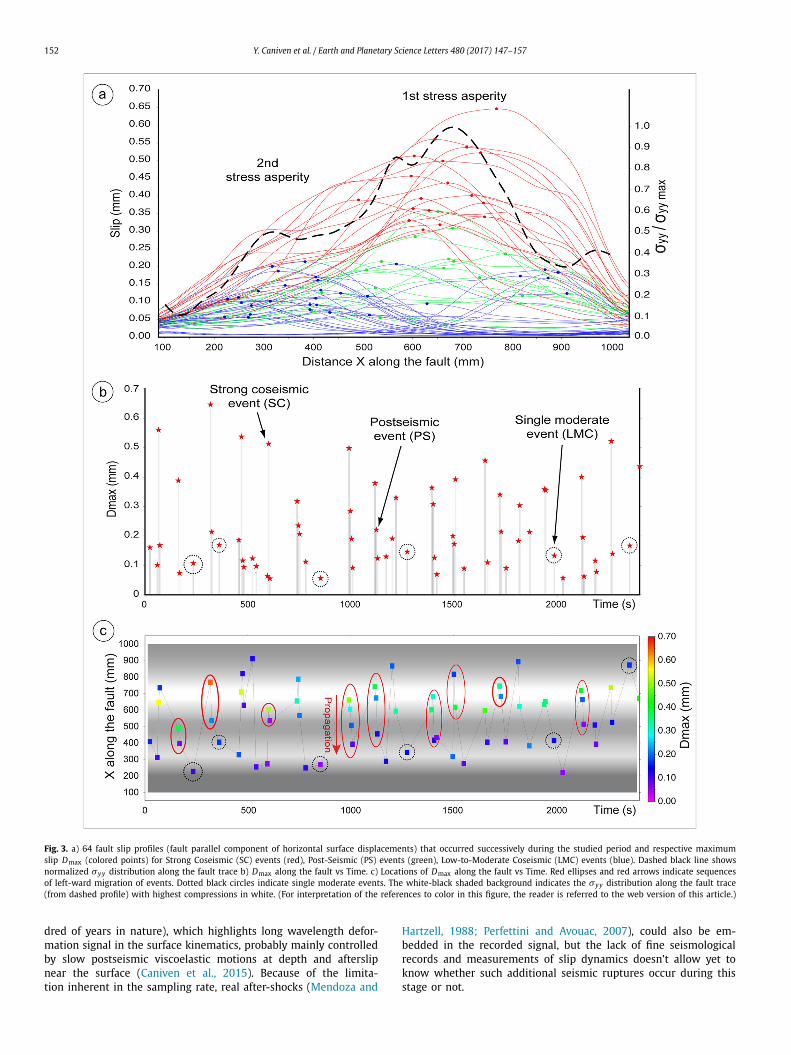
To characterize the kinematics of each fault slip events (mi-croquakes and creep) that occurred during the studied period, we focused on the fault parallel component of horizontal surface displacements along the fault. For each recorded measurements, raw data were first pre-processed to extract fault slip events with amplitudes greater than the imposed far field displacement, i.e. ∼33 μm during the 6 s sampling interval. Considering the mea-surement accuracy (∼2 μm) and rare but potential variation of compartments relative velocities (±10 μm), we adjusted the detec-tion limit to 50 μm, i.e. slightly above the critical slip distance Dc . Consequently, we assumed that most of the slip events associated with slow aseismic fault creep were filtered out from the dataset. Data catalog and model kinematics are summed up in Fig. 3. Fig. 3a shows 64 fault slip profiles (fault parallel component of horizon-tal surface displacements) that occurred successively during the studied period. The temporal distribution of fault slip events is presented in Fig. 3b using the location of maximum slip (Dmax) of each event.
To constrain time, location and size of fault slip events, we combine information of slip profiles along the fault (Fig. 3a) with time-position of their maximum slip (Fig. 3b) to build a syn-thetic diagram illustrating fault slip dynamics (Fig. 3c). Based on this dataset, 3 classes of slip events were defined based on their magnitudes, locations and fault slip properties. Class 1 cor-responds to large slip events with maximum displacements (Dmax) greater than 250 μm. They are referenced as “Strong coseismic events” (SC) (red profiles in Fig. 3a). Class 2 is constituted by slip events occurring immediately after class 1 events. As shown hereafter, they correspond to postseismic fault slip triggered by major microquakes. They are referred as “Postseismic events” (PS) (green profiles in Fig. 3a). Finally, Class 3 concerns single coseis-mic slip events of lower magnitudes. They are referenced as “Low to moderate coseismic events” (LMC) (blue profiles in Fig. 3a). For each event class, maximum slip (Dmax) values and locations as well as recurrence-time Tr were determined and analyzed (Fig. 4).
3.2.1. Strong coseismic events (SC)The 18 SC events that occurred during the considered period,
have typical Dmax ranging between 250 μm and 700 μm (Fig. 3a and 4-A) and generally broke the whole fault. Based on a cam-corder (25 frame/s) and acoustic sensor records, we know that the duration of these large events generally does not exceed 100 ms (Caniven et al., 2015). Furthermore, their slip amplitude is much larger than the critical slip distance Dc , as required for the nucle-ation of fast dynamic instabilities. They can be interpreted as ma-
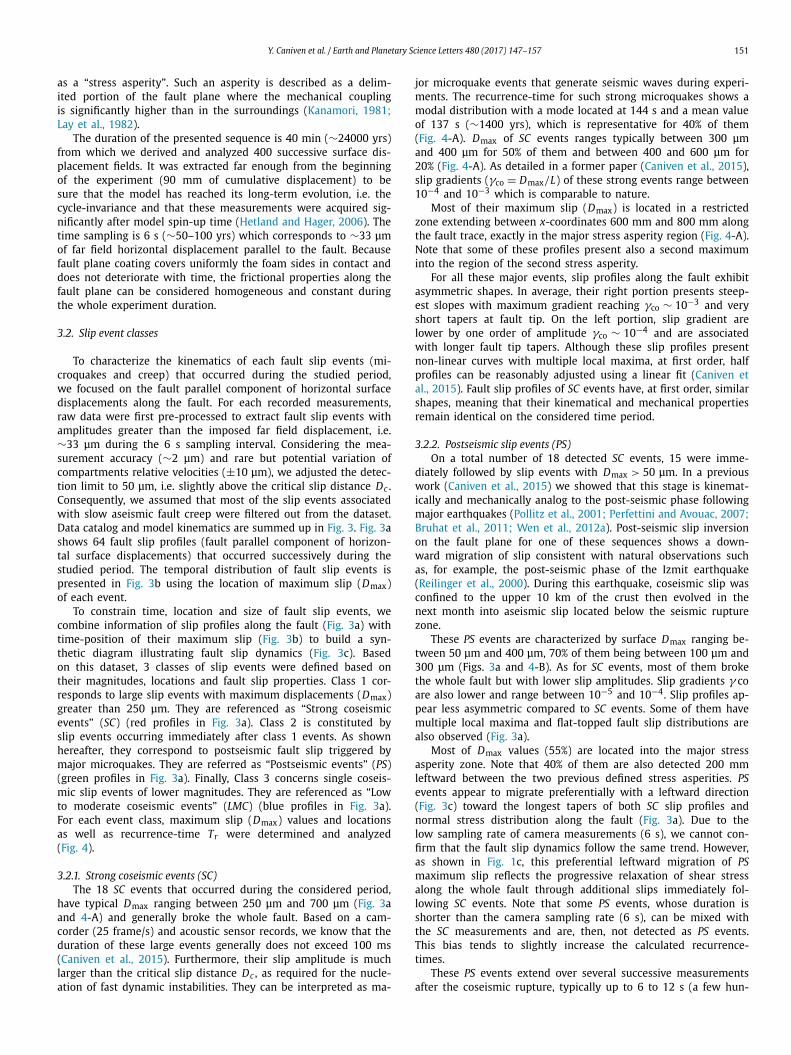
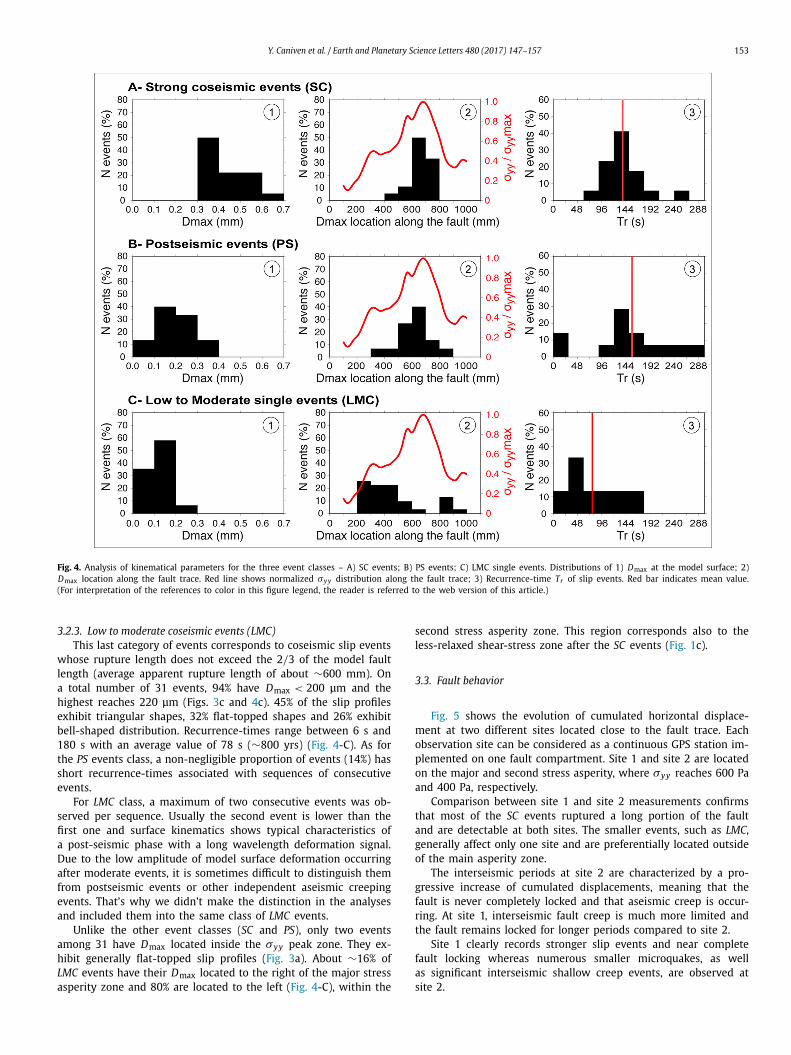
jor microquake events that generate seismic waves during experi-ments. The recurrence-time for such strong microquakes shows a modal distribution with a mode located at 144 s and a mean value of 137 s (∼1400 yrs), which is representative for 40% of them (Fig. 4-A). Dmax of SC events ranges typically between 300 μm and 400 μm for 50% of them and between 400 and 600 μm for 20% (Fig. 4-A). As detailed in a former paper (Caniven et al., 2015), slip gradients (γco = Dmax/L) of these strong events range between 10−4 and 10−3 which is comparable to nature.
Most of their maximum slip (Dmax) is located in a restricted zone extending between x-coordinates 600 mm and 800 mm along the fault trace, exactly in the major stress asperity region (Fig. 4-A). Note that some of these profiles present also a second maximum into the region of the second stress asperity.
For all these major events, slip profiles along the fault exhibit asymmetric shapes. In average, their right portion presents steep-est slopes with maximum gradient reaching γco ∼ 10−3 and very short tapers at fault tip. On the left portion, slip gradient are lower by one order of amplitude γco ∼ 10−4 and are associated with longer fault tip tapers. Although these slip profiles present non-linear curves with multiple local maxima, at first order, half profiles can be reasonably adjusted using a linear fit (Caniven et al., 2015). Fault slip profiles of SC events have, at first order, similar shapes, meaning that their kinematical and mechanical properties remain identical on the considered time period.
3.2.2. Postseismic slip events (PS)On a total number of 18 detected SC events, 15 were imme-
diately followed by slip events with Dmax > 50 μm. In a previous work (Caniven et al., 2015) we showed that this stage is kinemat-ically and mechanically analog to the post-seismic phase following major earthquakes (Pollitz et al., 2001; Perfettini and Avouac, 2007;Bruhat et al., 2011; Wen et al., 2012a). Post-seismic slip inversion on the fault plane for one of these sequences shows a down-ward migration of slip consistent with natural observations such as, for example, the post-seismic phase of the Izmit earthquake (Reilinger et al., 2000). During this earthquake, coseismic slip was confined to the upper 10 km of the crust then evolved in the next month into aseismic slip located below the seismic rupture zone.
These PS events are characterized by surface Dmax ranging be-tween 50 μm and 400 μm, 70% of them being between 100 μm and 300 μm (Figs. 3a and 4-B). As for SC events, most of them broke the whole fault but with lower slip amplitudes. Slip gradients γ coare also lower and range between 10−5 and 10−4. Slip profiles ap-pear less asymmetric compared to SC events. Some of them have multiple local maxima and flat-topped fault slip distributions are also observed (Fig. 3a).
Most of Dmax values (55%) are located into the major stress asperity zone. Note that 40% of them are also detected 200 mm leftward between the two previous defined stress asperities. PSevents appear to migrate preferentially with a leftward direction (Fig. 3c) toward the longest tapers of both SC slip profiles and normal stress distribution along the fault (Fig. 3a). Due to the low sampling rate of camera measurements (6 s), we cannot con-firm that the fault slip dynamics follow the same trend. However, as shown in Fig. 1c, this preferential leftward migration of PSmaximum slip reflects the progressive relaxation of shear stress along the whole fault through additional slips immediately fol-lowing SC events. Note that some PS events, whose duration is shorter than the camera sampling rate (6 s), can be mixed with the SC measurements and are, then, not detected as PS events. This bias tends to slightly increase the calculated recurrence-times.
These PS events extend over several successive measurements after the coseismic rupture, typically up to 6 to 12 s (a few hun-
152 Y. Caniven et al. / Earth and Planetary Science Letters 480 (2017) 147–157
Fig. 3. a) 64 fault slip profiles (fault parallel component of horizontal surface displacements) that occurred successively during the studied period and respective maximum slip Dmax (colored points) for Strong Coseismic (SC) events (red), Post-Seismic (PS) events (green), Low-to-Moderate Coseismic (LMC) events (blue). Dashed black line shows normalized σyy distribution along the fault trace b) Dmax along the fault vs Time. c) Locations of Dmax along the fault vs Time. Red ellipses and red arrows indicate sequences of left-ward migration of events. Dotted black circles indicate single moderate events. The white-black shaded background indicates the σyy distribution along the fault trace (from dashed profile) with highest compressions in white. (For interpretation of the references to color in this figure, the reader is referred to the web version of this article.)
dred of years in nature), which highlights long wavelength defor-mation signal in the surface kinematics, probably mainly controlled by slow postseismic viscoelastic motions at depth and afterslip near the surface (Caniven et al., 2015). Because of the limita-tion inherent in the sampling rate, real after-shocks (Mendoza and
Hartzell, 1988; Perfettini and Avouac, 2007), could also be em-bedded in the recorded signal, but the lack of fine seismological records and measurements of slip dynamics doesn’t allow yet to know whether such additional seismic ruptures occur during this stage or not.
Y. Caniven et al. / Earth and Planetary Science Letters 480 (2017) 147–157 153
Fig. 4. Analysis of kinematical parameters for the three event classes – A) SC events; B) PS events; C) LMC single events. Distributions of 1) Dmax at the model surface; 2) Dmax location along the fault trace. Red line shows normalized σyy distribution along the fault trace; 3) Recurrence-time Tr of slip events. Red bar indicates mean value. (For interpretation of the references to color in this figure legend, the reader is referred to the web version of this article.)
3.2.3. Low to moderate coseismic events (LMC)This last category of events corresponds to coseismic slip events
whose rupture length does not exceed the 2/3 of the model fault length (average apparent rupture length of about ∼600 mm). On a total number of 31 events, 94% have Dmax < 200 μm and the highest reaches 220 μm (Figs. 3c and 4c). 45% of the slip profiles exhibit triangular shapes, 32% flat-topped shapes and 26% exhibit bell-shaped distribution. Recurrence-times range between 6 s and 180 s with an average value of 78 s (∼800 yrs) (Fig. 4-C). As for the PS events class, a non-negligible proportion of events (14%) has short recurrence-times associated with sequences of consecutive events.
For LMC class, a maximum of two consecutive events was ob-served per sequence. Usually the second event is lower than the first one and surface kinematics shows typical characteristics of a post-seismic phase with a long wavelength deformation signal. Due to the low amplitude of model surface deformation occurring after moderate events, it is sometimes difficult to distinguish them from postseismic events or other independent aseismic creeping events. That’s why we didn’t make the distinction in the analyses and included them into the same class of LMC events.
Unlike the other event classes (SC and PS), only two events among 31 have Dmax located inside the σyy peak zone. They ex-hibit generally flat-topped slip profiles (Fig. 3a). About ∼16% of LMC events have their Dmax located to the right of the major stress asperity zone and 80% are located to the left (Fig. 4-C), within the
second stress asperity zone. This region corresponds also to the less-relaxed shear-stress zone after the SC events (Fig. 1c).
3.3. Fault behavior
Fig. 5 shows the evolution of cumulated horizontal displace-ment at two different sites located close to the fault trace. Each observation site can be considered as a continuous GPS station im-plemented on one fault compartment. Site 1 and site 2 are located on the major and second stress asperity, where σyy reaches 600 Pa and 400 Pa, respectively.
Comparison between site 1 and site 2 measurements confirms that most of the SC events ruptured a long portion of the fault and are detectable at both sites. The smaller events, such as LMC, generally affect only one site and are preferentially located outside of the main asperity zone.
The interseismic periods at site 2 are characterized by a pro-gressive increase of cumulated displacements, meaning that the fault is never completely locked and that aseismic creep is occur-ring. At site 1, interseismic fault creep is much more limited and the fault remains locked for longer periods compared to site 2.
Site 1 clearly records stronger slip events and near complete fault locking whereas numerous smaller microquakes, as well as significant interseismic shallow creep events, are observed at site 2.

154 Y. Caniven et al. / Earth and Planetary Science Letters 480 (2017) 147–157
Fig. 5. a) Evolution of the cumulated horizontal displacement (fault-parallel component) at two different sites located close to the fault trace. The zoom on top shows both curves over stacked, with cumulated fault displacement normalized to maximum value (Norm. Displacement). This allows to better compare the slip behavior at the two sites. The inset right-below shows the σyy distribution along the fault trace and locations of observation sites. b) Instantaneous horizontal displacement parallel to the fault at the two sites.
4. Discussion
Compared to nature, the model is, of course, over-simplified. Consequently, the interpretation of experimental results and their extrapolation to nature face inevitable limitations. However, as demonstrated hereafter, analog modeling is a relevant approach to better understand the physical processes and the mechanical couplings controlling earthquake and seismic cycle dynamics (see Rosenau et al., 2017 for a review).
4.1. Size of events and slip patterns
In the presented experiment, fault kinematics is dominated by the occurrence of strong microquakes characterized by a maximum coseismic slip located close to the normal-stress peak. This obser-vation is consistent with the second Amontons’s law implying that frictional strength on a fault plane is proportional to the normal load to this plane. Therefore, slip profiles of these events share similar shapes and show, at first order, similar trends compared to the imposed normal stress distribution along the fault.
As proposed by Wesnousky (2008) for real earthquakes, coseis-mic slip patterns in our experiments seem to be also controlled by the variations in fault strength and accumulated stress along fault strike. We note also that Wesnousky (2008) favors this interpreta-tion rather than a dependence on rupture dynamic properties such as the size of initial slip pulse (Heaton, 1990).
The variability of events and coseismic slip distributions along the fault plane appear heterogeneous, similarly to what has been widely observed for earthquakes (Wen et al., 2012b; Reilinger et al., 2000; Peltzer et al., 2001). Thus, we suggest that most of this
heterogeneity can be explained by strength conditions of the fault rather than by coseismic processes alone.
Rupture dynamic simulations performed by Lapusta and Liu(2009) are also consistent with our results. They showed that, de-spite no long-term effect on dynamic rupture, the presence of a persistent small patch of high normal compression on the fault plane influences long-term slip patterns in the model. It is shown that a high normal compressional stress patch alters the along strike symmetry of fault properties, resulting in asymmetric fault behavior. In absence of stress heterogeneity, aseismic events may occur before coseismic events with variable directions of propaga-tion. In the case of stress patch, these slow events become unidi-rectional and propagate toward the stress asperity. When a slow slip reaches this patch, a seismic event nucleates because a larger effective normal stress here implies a smaller nucleation size Lc , thus favoring rupture nucleation in this asperity region. That’s why in our experiments, all the SC events localize in the major stress asperity zone. Moreover, as demonstrated in Caniven et al. (2015), aseismic transients can occur during the interseismic phase along the fault where lower normal stress favors stable-slip and can play a key role in the stress transfer which leads to the occurrence of SC events.
4.2. Post-seismic slip propagation
The postseismic displacements observed in our experiments, exhibit also interesting slip patterns comparable with their equiv-alent in nature. In our analog model, postseismic period is char-acterized by a non-linear time decay of fault displacement re-lated to the viscoelastic relaxation at depth (Pollitz et al., 2001;Freed and Bürgmann, 2004) and/or a deepening of slip on the

Y. Caniven et al. / Earth and Planetary Science Letters 480 (2017) 147–157 155
fault plane (Caniven et al., 2015). These features have also been evidenced following the 1999 Mw 7.5 Izmit earthquake (Reilinger et al., 2000). Microquake postseismic phase in our experiments shows similar surface slip patterns that could be attributed to aseismic creep along the fault plane at depth. Indeed, although most of surface maximum postseismic slips locate into the major stress asperity zone, a large proportion (40%) lies between the two dominant stress asperities that are also the location of higher slip amplitude of multi-maxima SC events profiles. Such an observation has been evidenced for the 2001 Mw 7.8 Kokoxili earthquake for which maximum postseismic slip was located in the middle of two relatively high coseismic slip patches (Wen et al., 2012a). These au-thors suggested that after-slip could be a plausible mechanism to explain the observed surface kinematics coupled with viscoelastic relaxation. The applied σn thus seem to also control the location of observed aseismic events and the global postseismic slip pattern evolution observed after strong microquakes.
4.3. Isolated low to moderate events
At first order, the kinematics of the fault is mainly dominated by the occurrence of strong characteristic slip events. However, iso-lated LMC single events are also frequently observed. Unlike the two other event classes, they occur preferentially away from the major stress asperity zone, on both sides, with a preferential loca-tion into the second stress asperity zone where significant shear stress persists after the postseismic phase following SC events (Fig. 1c). We never observed the occurrence of LMC events across the major stress asperity zone. A hypothesis has been already pro-posed to explain the occurrence of such isolated events on active faults, especially along the North Anatolian fault (NAF). Pondard et al. (2007) proposed that the occurrence of isolated events can be explained by a non-uniform stress relief that persists after the oc-currence of major earthquakes sequences.
Therefore, initial stress distribution along the fault appears to control not only the slip distribution of strong earthquakes but also the location and size of all slip events.
In our experiments, such a non-uniform cumulated shear stress results on the one hand from the imposed normal stress variation along the fault and, on the other hand, from the occurrence of SCevents and associated postseismic slip (Fig. 1c).
Strong events nucleate where the fault is the strongest and isolated events occur where residual stresses persist, with prefer-ential locations around other secondary preexisting stress hetero-geneities.
The size of isolated events into the second stress asperity de-pends on the local slip amplitude of the precedent major coseismic event. After SC events, characterized by multi-maxima slip profiles, the next isolated events have a lower magnitude because most of the shear stress has been relaxed.
4.4. Seismic cycle regularity
Experimental seismic cycles appear mostly regular. Strong mi-croquakes occur with a relatively constant return period, size and location along the fault, consistent with the definition of a char-acteristic earthquake fault behavior (Schwartz and Coppersmith, 1984).
Regular seismic cycles have been also evidenced in nature for example along the San Andreas fault (SAF) near the locality of Parkfield (Bakun and Lindh, 1985). Here, between 1857 and 1966, a sequence of six moderate earthquakes occurred with a quite regular recurrence-time (∼22 yrs), size (M ∼ 6) and location. Re-markably, all these events occurred close to the transition be-tween the creeping central part of the SAF, northwest of Park-field, and the locked portion of the SAF in the southeast (Titus et
al., 2011). Based on the San Andreas Fault Observatory at Depth (SAFOD) borehole data, it has been proposed that the creeping behavior could be enhanced by the presence at depth of velocity-strengthening material such as serpentinite (e.g. Carpenter et al., 2011; Lockner et al., 2011). After the last (and late) 2004 earth-quake, Ma et al. (2008) speculated that along strike variations of fault frictional properties could induce differential interseismic stress accumulation patterns on the locked portion of the SAF and at the locked-creeping transition zone favoring, then, a character-istic earthquake behavior.
In our experiments, interseismic cumulated shear stress distri-bution preceding each strong seismic event is correlated with the location of the major stress asperity and surrounding normal com-pression pattern (Fig. 1c, first shear stress map and Fig. 4). In the range of the applied normal stress, high normal compression ap-pears to favor stick–slip, whereas low normal compression induces aseismic creep, resulting into a specific pattern; a single asperity embedded into a creeping zone.
Although such a pattern for the Parkfield example is controlled by along-fault frictional properties rather than by normal stress variations, It generates the same mechanical behavior, i.e. reg-ular seismic cycles. Furthermore, fault slip behavior along real faults can also be directly modulated by normal stress variations linked to spatial changes of elastic properties. This is well known for subduction cases where slow slip events are recorded in re-gions where the fault stiffness is reduced by local high fluid pore pressure (Leeman et al., 2016). This suggests that, in addition to the fault frictional properties, along-fault normal stress variations could play a significant role in the regularity of the seismic cycle as observed in our experiments.
In the case of uniform loading, the occurrence of earthquakes seems to mostly depend on the location of previous seismic events that redistribute the stresses along the fault (e.g. King et al., 1994;Stein et al., 1997; Pondard et al., 2007). Ruptures occur, then, at variable locations over the long-term system evolution and the seismic cycle appears less regular.
4.5. Clustering
Remarkably, the propagation of successive individual coseismic slip events rupturing progressively the whole fault was never ob-served in the presented experiment. However, microquakes “clus-tering” is frequent in other experiments where the normal stress distribution along the fault is more homogeneous (Caniven et al., 2015), i.e. without well-individualized stress asperity (Fig. S1). In these experiments, typical sequences of three to four successive microquakes rupturing the whole fault in a short time period (18 s, equal to ∼200 yr) after a long quiescence interseismic period (180 s, equal to ∼2000 yr) are often observed. During a clustering sequence, microquakes migration can occur unidirectionally, bidi-rectionally or even randomly and so, for the same experiment.
This mechanical behavior has been already evidenced in sev-eral natural cases such as the NAF which experienced in the last centuries clustering sequences with both uni-directional and variable-directional earthquakes migrations (e.g. King et al., 1994;Stein et al., 1997; Nalbant et al., 1998; Pondard et al., 2007). Pondard et al. (2007) proposed that clustering sequences are fa-vored when stress loading is uniform along the fault as it is the case along the most linear fault segments of the NAF. Indeed, as noticed by Pondard et al. (2007), propagating earthquake se-quences do not occur every seismic cycle along a fault system, suggesting that the loading has to be in a particular state of stress (close to failure and uniform) all along a considered fault segment to trigger propagating earthquake sequences. That’s, most probably, also the reason why such sequences are observed, during uniform applied normal stress analog experiments (Caniven et al., 2015).

156 Y. Caniven et al. / Earth and Planetary Science Letters 480 (2017) 147–157
5. Conclusion
To investigate the role of fault stress heterogeneity on coseis-mic and long term fault slip kinematics, we used a scaled visco-elasto-plastic multi-layered analog model, which reproduces scaled microquakes and seismic cycles on an analog strike-slip fault. Ex-perimental results show that major coseismic slip events system-atically locate into the major stress asperity zone along the fault with maximum slips located close to the normal stress peak. Inter-estingly, coseismic slip profiles of major slip events show similar trends compared to the imposed normal stress distribution along the fault.
The stress distribution along the fault appears to control not only strong earthquake properties but also the variability of slip events that occur during the experiments. Indeed, postseismic slip, following strong microquakes, tend to propagate from the major stress asperity toward both fault tips and low to moderate isolated events occur generally outside the main stress asperity zone, in re-gions where residual stresses persist around secondary order stress asperities.
Finally, in cases where fault slip stability conditions are modu-lated by σn distribution, experimental results reveal that the σn
variations along strike controls the ability of the fault to gen-erate irregular or regular seismic cycles and produce clustering sequences. A non-uniform σn characterized by a high amplitude single stress asperity favors the occurrence of strong characteristic microquakes sharing similar location, magnitudes and return peri-ods. In that case, the seismic cycle is time- and slip-predictable. For more homogeneous σn , the seismic cycles appear more ir-regular and mostly unpredictable using cumulated slip and return period alone. Microquakes magnitudes and return periods extend over large ranges and episodic earthquake clustering is also ob-served.
Our results reinforce the hypothesis that interseismic and co-seismic slip distribution may provide relevant informations on the absolute fault stress state and associated stress heterogeneities im-proving, then, seismic hazard assessment.
Acknowledgements
This project has been funded by CNRS-INSU and University of Montpellier grants. We thank the editor Rebecca Bendick, the re-viewer Michele Cooke and the two other anonymous reviewers for helping to improve the manuscript, C. Romano for technical assis-tance, S. Nielsen for very useful remarks and suggestions, J. Chéry, S. Preuss, A.-M. and J.-P. Guyot for fruitful discussions. Data sup-porting Fig. 3 and Fig. 5 are available in supplementary material (Table_Fig3.xlsx and Table_Fig5.xlsx, respectively).
Appendix A. Supplementary material
Supplementary material related to this article can be found on-line at https://doi.org/10.1016/j.epsl.2017.10.009.
References
Andrews, D.J., 1994. Fault geometry and earthquake mechanics. Ann. Geophys. 37 (6). http://dx.doi.org/10.4401/ag-4136.
Avouac, J.-P., Ayoub, F., Wei, S., Ampuero, J.-P., Meng, L., Leprince, S., Jolivet, R., Duputel, Z., Helmberger, D., 2014. The 2013, Mw 7.7 Balochistan earthquake, energetic strike-slip reactivation of a thrust fault. Earth Planet. Sci. Lett. 391, 128–134. http://dx.doi.org/10.1016/j.epsl.2014.01.036.
Bakun, W.H., Lindh, A.G., 1985. The Parkfield, California, earthquake prediction ex-periment. Science 229 (4714), 619–624. http://dx.doi.org/10.1126/science.229.4714.619.
Barbot, S., Lapusta, N., Avouac, J.-P., 2012. Under the hood of the Earthquake ma-chine: toward predictive modeling of the seismic cycle. Science 336, 707–710. http://dx.doi.org/10.1126/science.1218796.
Bizzarri, A., 2009. What does control earthquake ruptures and dynamic faulting? A review of different competing mechanisms. In: Vinciguerra, S., Bernabé, Y. (Eds.), Rock Physics and Natural Hazards. Birkhäuser, Basel, pp. 741–776.
Bruhat, L., Barbot, S., Avouac, J.-P., 2011. Evidence for postseismic deformation of the lower crust following the 2004 Mw6.0 Parkfield earthquake. J. Geophys. Res. 116 (B8), B08401. http://dx.doi.org/10.1029/2010JB008073.
Bürgmann, R., Pollard, D.D., Martel, S.J., 1994. Slip distributions on faults: effects of stress gradients, inelastic deformation, heterogeneous host-rock stiffness, and fault interaction. J. Struct. Geol. 16 (12), 1675–1690. http://dx.doi.org/10.1016/0191-8141(94)90134-1.
Caniven, Y., Dominguez, S., Soliva, R., Cattin, R., Peyret, M., Marchandon, M., Romano, C., Strak, V., 2015. A new multilayered visco-elasto-plastic experimental model to study strike-slip fault seismic cycle. Tectonics 34, 232–264. http://dx.doi.org/10.1002/2014TC003701.
Carpenter, B.M., Marone, C., Saffer, D.M., 2011. Weakness of the San Andreas Fault revealed by samples from the active fault zone. Nat. Geosci. 4 (4), 251–254. http://dx.doi.org/10.1038/ngeo1089.
Cobbold, P.R., Jackson, M.P.A., 1992. Gum rosin (colophony): a suitable material for thermomechanical modelling of the lithosphere. Tectonophysics 210, 255–271. http://dx.doi.org/10.1016/0040-1951(92)90325-Z.
Corbi, F., Funiciello, F., Faccenna, C., Ranalli, G., Heuret, A., 2011. Seismic variability of subduction thrust faults: insights from laboratory models. J. Geophys. Res. 116, B06304. http://dx.doi.org/10.1029/2010JB007993.
Faulkner, D.R., Rutter, E.H., 2001. Can the maintenance of overpressured flu-ids in large strike-slip fault zones explain their apparent weakness? Ge-ology 29 (6), 503–506. http://dx.doi.org/10.1130/0091-7613(2001)029<0503:CTMOOF>2.0.CO;2.
Freed, A.M., Bürgmann, R., 2004. Evidence of power-law flow in the Mojave desert mantle. Nature 430 (6999), 548–551. http://dx.doi.org/10.1038/nature02784.
Fukuyama, E., Suzuki, W., 2016. Near-fault deformation and Dc′′ during the 2016 Mw7.1 Kumamoto earthquake. Earth Planets Space 68, 194. http://dx.doi.org/10.1186/s40623-016-0570-6.
Heaton, T.H., 1990. Evidence for and implications of self-healing pulses of slip in earthquake rupture. Phys. Earth Planet. Inter. 64, 1–20. http://dx.doi.org/10.1016/0031-9201(90)90002-F.
Hetland, E.A., Hager, B.H., 2006. Interseismic strain accumulation: spin-up, cycle in-variance, and irregular rupture sequences. Geochem. Geophys. Geosyst. 7 (5). http://dx.doi.org/10.1029/2005GC001087.
Hubbert, M.K., 1937. Theory of scale models as applied to the study of geologic structures. Bull. Geol. Soc. Am. 48, 1459–1520.
Kanamori, H., 1981. The nature of seismicity patterns before large earthquakes. In: Simpson, D.W., Richards, P.G. (Eds.), Earthquake Predictions, an International Re-view. In: Maurice Ewing Series, vol. 4. American Geophysical Union, Washington, DC, pp. 1–19.
Kaneko, Y., Fialko, Y., 2011. Shallow slip deficit due to large strike-slip earthquakes in dynamic rupture simulations with elasto-plastic off-fault response. Geophys. J. Int. 186, 1389–1403.
Kaneko, Y., Nielsen, S.B., Carpenter, B.M., 2016. The onset of laboratory earthquakes explained by nucleating rupture on a rate-and-state fault. J. Geophys. Res., Solid Earth 121, 6071–6091. http://dx.doi.org/10.1002/2016JB013143.
King, G., Stein, R., Lin, J., 1994. Static stress changes and the triggering of earth-quakes. Bull. Seismol. Soc. Am. 84 (3), 935–953.
King, G.C.P., Wesnousky, S.G., 2007. Scaling of fault parameters for continental strike-slip earthquakes. Bull. Seismol. Soc. Am. 97 (6), 1833–1840. http://dx.doi.org/10.1785/0120070048.
Lapusta, N., Liu, Y., 2009. Three-dimensional boundary integral modeling of sponta-neous earthquake sequences and aseismic slip. J. Geophys. Res., Solid Earth 114, B09303.
Lay, T., Kanamori, H., Ruff, L., 1982. The asperity model and the nature of large subduction zone earthquakes. Earthq. Predict. Res. 1 (1), 3–71.
Leeman, J.R., Saffer, D.M., Scuderi, M.M., Marone, C., 2016. Laboratory observations of slow earthquakes and the spectrum of tectonic fault slip modes. Nat. Com-mun. 7. http://dx.doi.org/10.1038/ncomms11104.
Lockner, D.A., Morrow, C., Moore, D., Hickman, S., 2011. Low strength of deep San Andreas fault gouge from SAFOD core. Nature 472 (7341), 82–85. http://dx.doi.org/10.1038/nature09927.
Ma, S., Custódio, S., Archuleta, R.J., Liu, P., 2008. Dynamic modeling of the 2004 Mw 6.0 Parkfield, California, earthquake. J. Geophys. Res. 113 (B2), B02301. http://dx.doi.org/10.1029/2007JB005216.
Mai, P.M., Beroza, G.C., 2002. A spatial random field model to characterize com-plexity in earthquake slip. J. Geophys. Res. 107 (B11), 2308. http://dx.doi.org/10.1029/2001JB000588.
Mendoza, C., Hartzell, S.H., 1988. Aftershock patterns and main shock faulting. Bull. Seismol. Soc. Am. 78 (4), 1438–1449.
Nalbant, S.S., Hubert, A., King, G.C.P., 1998. Stress coupling between earthquakes in northwest Turkey and the north Aegean Sea. J. Geophys. Res. 103 (B10), 24469–24486. http://dx.doi.org/10.1029/98JB01491.
Okada, Y., 1985. Surface deformation due to shear and tensile faults in a half-space. Bull. Seismol. Soc. Am. 75 (4), 1135–1154.
Peltzer, G., Crampé, F., Rosen, P., 2001. The Mw 7.1, Hector Mine, California earth-quake: surface rupture, surface displacement field, and fault slip solution from
Y. Caniven et al. / Earth and Planetary Science Letters 480 (2017) 147–157 157
ERS SAR data. C. R. Acad. Sci., Ser. IIA, Earth Planet. Sci. 333, 545–555. http://dx.doi.org/10.1016/S1251-8050(01)01658-5.
Perfettini, H., Avouac, J.-P., 2007. Modeling afterslip and aftershocks following the 1992 Landers earthquake. J. Geophys. Res. 112 (B7). http://dx.doi.org/10.1029/2006JB004399.
Peyrat, S., Olsen, K., Madariaga, R., 2001. Dynamic modeling of the 1992 Lan-ders earthquake. J. Geophys. Res., Solid Earth 106 (B11), 26467–26482. http://dx.doi.org/10.1029/2001JB000205.
Pollitz, F.F., Wicks, C., Thatcher, W., 2001. Mantle flow beneath a continental strike-slip fault: postseismic deformation after the 1999 hector mine earthquake. Sci-ence 293 (5536), 1814–1818. http://dx.doi.org/10.1126/science.1061361.
Pondard, N., Armijo, R., King, G.C.P., Meyer, B., Flerit, F., 2007. Fault interactions in the Sea of Marmara pull-apart (North Anatolian Fault): earthquake cluster-ing and propagating earthquake sequences. Geophys. J. Int. 171 (3), 1185–1197. http://dx.doi.org/10.1111/j.1365-246X.2007.03580.x.
Reilinger, R.E., et al., 2000. Coseismic and postseismic fault slip for the 17 August 1999, M = 7.5, Izmit, Turkey earthquake. Science 289 (5484), 1519. http://dx.doi.org/10.1126/science.289.5484.1519.
Robinson, D.P., Brough, C., Das, S., 2006. The Mw 7.8, 2001 Kunlunshan earthquake: extreme rupture speed variability and effect of fault geometry. J. Geophys. Res. 111 (B8). http://dx.doi.org/10.1029/2005JB004137.
Rosenau, M., Corbi, F., Dominguez, S., 2017. Analogue earthquakes and seismic cy-cles: experimental modeling across timescales. Solid Earth 8, 597–635. http://dx.doi.org/10.5194/se-8-597-2017.
Rosenau, M., Lohrmann, J., Oncken, O., 2009. Shocks in a box: an analogue model of subduction earthquake cycles with application to seismotectonic forearc evolution. J. Geophys. Res., Solid Earth 114, B01409. http://dx.doi.org/10.1029/2008JB005665.
Rudolf, M., Boutelier, D., Rosenau, M., Schreurs, G., Oncken, O., 2016. Rheological benchmark of silicone oils used for analog modeling of short- and long-term
lithospheric deformation. Tectonophysics 684, 12–22. http://dx.doi.org/10.1016/j.tecto.2015.11.028.
Schellart, W.P., Rawlinson, N., 2013. Global correlations between maximum mag-nitudes of subduction zone interface thrust earthquakes and physical parame-ters of subduction zones. Phys. Earth Planet. Inter. 225, 41–67. http://dx.doi.org/10.1016/j.pepi.2013.10.001.
Scholz, C.H., 1982. Scaling laws for large earthquakes: consequences for physical models. Bull. Seismol. Soc. Am. 72 (1), 1–14.
Scholz, C.H., 1998. Earthquakes and friction laws. Nature 391, 37–42. http://dx.doi.org/10.1038/34097.
Schwartz, D.P., Coppersmith, K.J., 1984. Fault behavior and characteristic earth-quakes: examples from the Wasatch and San Andreas fault zones. J. Geophys. Res. 89 (B7), 5681–5698. http://dx.doi.org/10.1029/JB089iB07p05681.
Stein, R.S., Barka, A.A., Dieterich, J.H., 1997. Progressive failure on the North Ana-tolian fault since 1939 by earthquake stress triggering. Geophys. J. Int. 128 (3), 594–604. http://dx.doi.org/10.1111/j.1365-246X.1997.tb05321.x.
Titus, S.J., Dyson, M., DeMets, C., Tikoff, B., Rolandone, F., Bürgmann, R., 2011. Ge-ologic versus geodetic deformation adjacent to the San Andreas fault, central California. Geol. Soc. Am. Bull. 123, 794–820. http://dx.doi.org/10.1130/B30150.1.
Wen, Y., Li, Z., Xu, C., Ryder, I., Bürgmann, R., 2012a. Postseismic motion after the 2001 Mw 7.8 Kokoxili earthquake in Tibet observed by InSAR time series. J. Geo-phys. Res., Solid Earth 117, B08405. http://dx.doi.org/10.1029/2011JB009043.
Wen, Y.-Y., Oglesby, D.D., Duan, B., Ma, K.-F., 2012b. Dynamic rupture simulation of the 2008 Mw 7.9 Wenchuan Earthquake with heterogeneous initial stress. Bull. Seismol. Soc. Am. 102 (4), 1892–1898. http://dx.doi.org/10.1785/0120110153.
Wesnousky, S.G., 2008. Displacement and geometrical characteristics of earthquake surface ruptures: issues and implications for seismic-hazard analysis and the process of earthquake rupture. Bull. Seismol. Soc. Am. 98 (4), 1609–1632. http://dx.doi.org/10.1785/0120070111.
Related Documents