Earnings Release April 28, 2011 For the Fiscal Year Ended March 31, 2011 [U.S. GAAP] Name of registrant: NTT DOCOMO, INC. (URL http://www.nttdocomo.co.jp/) Code No.: 9437 Stock exchange on which the Company’s shares are listed: Tokyo Stock Exchange-First Section Representative: Ryuji Yamada, Representative Director, President and Chief Executive Officer Contact: Ken Takeuchi, Senior Manager, General Affairs Department / TEL +81-3-5156-1111 Scheduled date for the general meeting of shareholders: June 17, 2011 Scheduled date for dividend payment: June 20, 2011 Scheduled date for filing of securities report: June 20, 2011 Supplemental material on annual results: Yes Presentation on annual results: Yes (for institutional investors and analysts) (Amounts are rounded off to the nearest 1 million yen.) 1. Consolidated Financial Results for the Fiscal Year Ended March 31, 2011 (April 1, 2010 - March 31, 2011) (1) Consolidated Results of Operations (Millions of yen, except per share amounts) Operating Revenues Operating Income Income before Income Taxes Net Income Attributable to NTT DOCOMO, INC. Year ended March 31, 2011 4,224,273 (1.4)% 844,729 1.3 % 835,338 (0.1)% 490,485 (0.9)% Year ended March 31, 2010 4,284,404 (3.7)% 834,245 0.4 % 836,157 7.1 % 494,781 4.9 % Note: Comprehensive income: For the fiscal year ended March 31, 2011: 450,909 million yen (13.8)% For the fiscal year ended March 31, 2010: 523,091 million yen 28.9 % Basic Earnings per Share Attributable to NTT DOCOMO, INC. Diluted Earnings per Share Attributable to NTT DOCOMO, INC. ROE ROA Operating Income Margin Year ended March 31, 2011 11,797.07 (yen) - 10.3 % 12.3 % 20.0 % Year ended March 31, 2010 11,863.62 (yen) - 11.0 % 12.6 % 19.5 % Note: Equity in net income (losses) of affiliates: For the fiscal year ended March 31, 2011: (5,508)million yen For the fiscal year ended March 31, 2010: (852)million yen (Percentages above represent changes compared to the corresponding previous year) (2) Consolidated Financial Position (Millions of yen, except per share amounts) Total Assets Total Equity (Net Assets) NTT DOCOMO, INC. Shareholders’ Equity Shareholders’ Equity Ratio NTT DOCOMO, INC. Shareholders’ Equity per Share March 31, 2011 6,791,593 4,877,594 4,850,436 71.4 % 116,969.29 (yen) March 31, 2010 6,756,775 4,662,446 4,635,877 68.6 % 111,423.97 (yen) (3) Consolidated Cash Flows (Millions of yen) Cash Flows from Operating Activities Cash Flows from Investing Activities Cash Flows from Financing Activities Cash and Cash Equivalents at Fiscal Year End Year ended March 31, 2011 1,287,037 (455,370) (421,969) 765,551 Year ended March 31, 2010 1,182,818 (1,163,926) (260,945) 357,715 2. Dividends Cash Dividends per Share (yen) Date of Record End of the First Quarter End of the Second Quarter End of the Third Quarter Year End Total Total Cash Dividends for the Year (Millions of yen) Payout Ratio Ratio of Dividends to NTT DOCOMO, INC. Shareholders’ Equity Year ended March 31, 2010 - 2,600.00 - 2,600.00 5,200.00 216,750 43.8 % 4.8 % Year ended March 31, 2011 - 2,600.00 - 2,600.00 5,200.00 215,991 44.1 % 4.6 % Year ending March 31, 2012 (Forecasts) - 2,800.00 - 2,800.00 5,600.00 46.3 % 3. Forecasts of Consolidated Financial Results for the Fiscal Year Ending March 31, 2012 (April 1, 2011 - March 31, 2012) (Millions of yen, except per share amounts) Operating Revenues Operating Income Income before Income Taxes Net Income Attributable to NTT DOCOMO, INC. Basic Earnings per Share Attributable to NTT DOCOMO, INC. Six months ending September 30, 2011 - - - - - - - - - Year ending March 31, 2012 4,230,000 0.1 % 850,000 0.6 % 854,000 2.2 % 502,000 2.3 % 12,105.84 (Percentages above represent changes compared to the corresponding previous year)

Welcome message from author
This document is posted to help you gain knowledge. Please leave a comment to let me know what you think about it! Share it to your friends and learn new things together.
Transcript

Earnings Release April 28, 2011 For the Fiscal Year Ended March 31, 2011 [U.S. GAAP] Name of registrant: NTT DOCOMO, INC. (URL http://www.nttdocomo.co.jp/) Code No.: 9437 Stock exchange on which the Company’s shares are listed: Tokyo Stock Exchange-First Section Representative: Ryuji Yamada, Representative Director, President and Chief Executive Officer Contact: Ken Takeuchi, Senior Manager, General Affairs Department / TEL +81-3-5156-1111 Scheduled date for the general meeting of shareholders: June 17, 2011 Scheduled date for dividend payment: June 20, 2011 Scheduled date for filing of securities report: June 20, 2011 Supplemental material on annual results: Yes Presentation on annual results: Yes (for institutional investors and analysts)
(Amounts are rounded off to the nearest 1 million yen.)
1. Consolidated Financial Results for the Fiscal Year Ended March 31, 2011 (April 1, 2010 - March 31, 2011) (1) Consolidated Results of Operations
(Millions of yen, except per share amounts)
Operating Revenues Operating Income Income before Income Taxes
Net Income Attributable toNTT DOCOMO, INC.
Year ended March 31, 2011 4,224,273 (1.4)% 844,729 1.3 % 835,338 (0.1)% 490,485 (0.9)%Year ended March 31, 2010 4,284,404 (3.7)% 834,245 0.4 % 836,157 7.1 % 494,781 4.9 %
Note: Comprehensive income: For the fiscal year ended March 31, 2011: 450,909 million yen (13.8)% For the fiscal year ended March 31, 2010: 523,091 million yen 28.9 %
Basic Earnings per Share
Attributable to NTT DOCOMO, INC.
Diluted Earnings per Share Attributable to NTT
DOCOMO, INC. ROE ROA Operating Income
Margin
Year ended March 31, 2011 11,797.07 (yen) - 10.3 % 12.3 % 20.0 % Year ended March 31, 2010 11,863.62 (yen) - 11.0 % 12.6 % 19.5 %
Note: Equity in net income (losses) of affiliates: For the fiscal year ended March 31, 2011: (5,508)million yen For the fiscal year ended March 31, 2010: (852)million yen
(Percentages above represent changes compared to the corresponding previous year)
(2) Consolidated Financial Position (Millions of yen, except per share amounts)
Total Assets Total Equity (Net Assets)
NTT DOCOMO, INC.Shareholders’ Equity
Shareholders’ Equity Ratio
NTT DOCOMO, INC. Shareholders’ Equity
per Share March 31, 2011 6,791,593 4,877,594 4,850,436 71.4 % 116,969.29 (yen) March 31, 2010 6,756,775 4,662,446 4,635,877 68.6 % 111,423.97 (yen)
(3) Consolidated Cash Flows
(Millions of yen) Cash Flows from
Operating Activities Cash Flows from
Investing Activities Cash Flows from
Financing Activities Cash and Cash Equivalents
at Fiscal Year End Year ended March 31, 2011 1,287,037 (455,370) (421,969) 765,551 Year ended March 31, 2010 1,182,818 (1,163,926) (260,945) 357,715
2. Dividends Cash Dividends per Share (yen)
Date of Record End of the First Quarter
End of the Second Quarter
End of the Third Quarter Year End Total
Total Cash Dividends
for the Year (Millions of yen)
Payout Ratio Ratio of Dividends to
NTT DOCOMO, INC.Shareholders’ Equity
Year ended March 31, 2010 - 2,600.00 - 2,600.00 5,200.00 216,750 43.8 % 4.8 % Year ended March 31, 2011 - 2,600.00 - 2,600.00 5,200.00 215,991 44.1 % 4.6 % Year ending March 31, 2012
(Forecasts) - 2,800.00 - 2,800.00 5,600.00 46.3 %
3. Forecasts of Consolidated Financial Results for the Fiscal Year Ending March 31, 2012 (April 1, 2011 - March 31, 2012)
(Millions of yen, except per share amounts)
Operating Revenues Operating Income Income before Income Taxes
Net Income Attributable to
NTT DOCOMO, INC.
Basic Earnings per Share Attributable to NTT DOCOMO, INC.
Six months ending September 30, 2011 - - - - - - - - -Year ending March 31, 2012 4,230,000 0.1 % 850,000 0.6 % 854,000 2.2 % 502,000 2.3 % 12,105.84
(Percentages above represent changes compared to the corresponding previous year)

4. Others
(1) Changes in significant subsidiaries None
(Changes in significant subsidiaries for the fiscal year ended March 31, 2011 which resulted in changes in scope of consolidation)
(2) Changes in significant accounting policies, procedures and presentation
i. Changes due to revision of accounting standards and other regulations: None ii. Others: None (3) Number of issued shares (common stock)
i. Number of issued shares (inclusive of treasury stock): As of March 31, 2011: 43,650,000 shares As of March 31, 2010: 43,790,000 shares ii. Number of treasury stock: As of March 31, 2011: 2,182,399 shares As of March 31, 2010: 2,184,258 shares iii. Number of weighted average common shares outstanding: For the fiscal year ended March 31, 2011: 41,576,859 shares For the fiscal year ended March 31, 2010: 41,705,738 shares
* Presentation on the status of audit process:
This earnings release is not subject to the audit process as required by the Financial Instruments and Exchange Act of Japan. As of the date when this earnings release was issued, the audit process on financial statements as required by the Financial Instruments and Exchange Act had not been finalized.
* Explanation for forecasts of operations and other notes:
Forward-looking statements in this earnings release, such as forecasts of results of operations, are based on the information currently available and the certain asumptions that we regard as reasonable, and therefore actual results may differ materially from those contained in, or suggested by, any forward-looking statements. With regard to the assumptions and other related matters concerning forecasts for the fiscal year ending March 31, 2012, please refer to the attachment (pages 18 and 21).
CONTENTS OF THE ATTACHMENT
page Contents of the Attachment···························································································································· 1 1. Information on Consolidated Results ········································································································· 2-22 (1) Operating Results····································································································································· 2-18 (2) Financial Review ····································································································································· 19 (3) Profit Distribution ···································································································································· 20 (4) Special Note Regarding Forward-Looking Statements ············································································· 21-22 2. Condition of the Corporate Group ············································································································· 23-24 3. Management Policies································································································································· 25-27(1) Basic Management Policies······················································································································ 25 (2) Target Management Indicators ················································································································· 25 (3) Medium- and Long-Term Management Strategies···················································································· 25 (4) Issues to be Addressed by the Group ········································································································ 25-27 4. Consolidated Financial Statements ············································································································ 28-33(1) Consolidated Balance Sheets···················································································································· 28 (2) Consolidated Statements of Income and Comprehensive Income ····························································· 29 (3) Consolidated Statements of Shareholders' Equity····················································································· 30 (4) Consolidated Statements of Cash Flows··································································································· 31 (5) Going Concern Assumption ····················································································································· 32 (6) Notes to Consolidated Financial Statements····························································································· 32-33 5. Appendices ················································································································································ 34-36(1) Operating Data for the Fiscal Year Ended March 31, 2011 ······································································· 34 (2) Definition and Calculation Methods of ARPU and MOU········································································· 35 (3) Reconciliations of the Disclosed Non-GAAP Financial Measures to the Most Directly Comparable
GAAP Financial Measures······················································································································· 36
1

Earnings Release for the Fiscal Year Ended March 31, 2011
1. Information on Consolidated Results (1) Operating Results i. Business Overview
As Japan’s mobile telecommunications market continues to mature in line with the rise in cellular penetration
rate, competition among operators remains intense in such areas as acquisition of subscribers and further improvement of service offerings.
Under these market conditions, we developed our new corporate vision “Pursuing Smart Innovation: HEART” with the aim of achieving further growth and delivering new value to society.
In the fiscal year ended March 31, 2011, based on our medium-term action plan “Change and Challenge”, we continued to promote various measures aimed at improving customer satisfaction including, among other things, the enrichment of product lineup, improvement of billing plans and enhancement of after-sales support, which earned us excellent reviews from external research organizations. Positioning this fiscal year as the first year of the execution phase to realize the goals of our “Challenge” programs, we worked to further spread smartphones, launched a new LTE*-based communications service “Xi” (pronounced crossy) and implemented various other measures to respond to the diverse needs of customers. Also, we continued to streamline costs through initiatives such as the reduction of network-related costs and general expenses by measures such as integrating our call centers.
Following the Great East Japan Earthquake on March 11, 2011, some 6,700 base station equipment became temporarily inoperable due to failure of base station facilities, disruption of commercial power supply and/or transmission lines and other reasons. Immediately after the earthquake, we established Disaster Countermeasure Offices in our Tokyo headquarters and the Tohoku Regional Office, and with the help of other NTT Group companies and construction companies, mobilized a total of some 4,000 people to restore our mobile communications services as quickly as possible through the restoration of transmission lines, the deployment of mobile base station vehicles and power supply vehicles, and other measures.
For the fiscal year ended March 31, 2011, with respect to our cellular services revenues, although voice revenues decreased by ¥198.3 billion from the previous fiscal year due to a decline in voice ARPU, packet communications revenues increased by ¥106.0 billion as a result of our efforts to boost packet usage and expand the uptake of packet flat-rate services. Other revenues grew by ¥62.3 billion owing mainly to an increase in the subscriptions to “Mobile Phone Protection & Delivery Service.” Equipment sales revenues dropped by ¥30.1 billion primarily due to a decrease in the wholesale price per unit. Consequently, we recognized operating revenues of ¥4,224.3 billion (a decrease of ¥60.1 billion from the previous fiscal year). Operating expenses declined by ¥70.6 billion from the previous fiscal year to ¥3,379.5 billion as a result of a decrease in network-related costs achieved through efficient use of capital expenditures and other ongoing cost-cutting efforts. As a result of the foregoing, we recorded an operating income of ¥844.7 billion (an increase of ¥10.5 billion from the previous fiscal year). Income before income taxes was ¥835.3 billion and net income attributable to NTT DOCOMO, INC. was ¥490.5 billion.
* LTE (Long Term Evolution) is a next-generation mobile communications standard developed as an advancement of the third-generation (3G)
mobile phone system.
Notes: 1. The information in this earnings release is unaudited.
2. Amounts in this earnings release are rounded off.
2

DOCOMO Earnings Release Fiscal Year Ended March 31, 2011
3
Consolidated results of operations for the fiscal year ended March 31, 2010 and 2011 were as follows:
<Results of operations> Billions of yen Year ended
March 31, 2010 Year ended
March 31, 2011 Increase
(Decrease) Operating revenues ¥ 4,284.4 ¥ 4,224.3 ¥ (60.1) (1.4)%Operating expenses 3,450.2 3,379.5 (70.6) (2.0)Operating income 834.2 844.7 10.5 1.3 Other income (expense) 1.9 (9.4) (11.3) – Income before income taxes 836.2 835.3 (0.8) (0.1)Income taxes 338.2 337.8 (0.4) (0.1)Equity in net income (losses) of affiliates (0.9) (5.5) (4.7) (546.5)Net income 497.1 492.0 (5.1) (1.0)
Less: Net (income) loss attributable to noncontrolling interests (2.3) (1.5) 0.8 35.2
Net income attributable to NTT DOCOMO, INC. ¥ 494.8 ¥ 490.5 ¥ (4.3) (0.9)%EBITDA margin* 36.6 % 37.1 % 0.5 point – ROCE before tax effect* 16.3 % 16.1 % (0.2)point – ROCE after tax effect* 9.7 % 9.5 % (0.2)point – * EBITDA and EBITDA margin, as we use them in this earnings release, are different from EBITDA as used in Item 10(e) of Regulation
S-K and may not be comparable to similarly titled measures used by other companies. For an explanation of our definitions of EBITDA, EBITDA margin, ROCE before tax effect and ROCE after tax effect, see “5. (3) Reconciliations of the Disclosed Non-GAAP Financial Measures to the Most Directly Comparable GAAP Financial Measures” on page 36.

DOCOMO Earnings Release Fiscal Year Ended March 31, 2011
4
<Operating revenues> Billions of yen Year ended
March 31, 2010 Year ended
March 31, 2011 Increase
(Decrease) Wireless services ¥ 3,776.9 ¥ 3,746.9 ¥ (30.0) (0.8)%
Cellular services revenues 3,499.5 3,407.1 (92.3) (2.6)- Voice revenues 1,910.5 1,712.2 (198.3) (10.4)
Including: FOMA services 1,785.5 1,658.9 (126.7) (7.1)- Packet communications revenues 1,589.0 1,694.9 106.0 6.7
Including: FOMA services 1,558.3 1,679.8 121.6 7.8 Other revenues 277.5 339.7 62.3 22.4
Equipment sales 507.5 477.4 (30.1) (5.9)Total operating revenues ¥ 4,284.4 ¥ 4,224.3 ¥ (60.1) (1.4)%
Note: Voice revenues include data communications revenues through circuit switching systems.
<Operating expenses> Billions of yen Year ended
March 31, 2010 Year ended
March 31, 2011 Increase
(Decrease) Personnel expenses ¥ 258.3 ¥ 264.6 ¥ 6.4 2.5 %Non-personnel expenses 2,122.9 2,077.6 (45.3) (2.1)Depreciation and amortization 701.1 693.1 (8.1) (1.2)Loss on disposal of property, plant and equipment and intangible assets 47.0 44.3 (2.7) (5.8)
Communication network charges 281.9 261.3 (20.6) (7.3)Taxes and public dues 38.9 38.7 (0.2) (0.6)
Total operating expenses ¥ 3,450.2 ¥ 3,379.5 ¥ (70.6) (2.0)%

DOCOMO Earnings Release Fiscal Year Ended March 31, 2011
5
ii. Segment Results Mobile phone business—
As of March 31, 2011, the total number of our cellular services subscriptions was 58.01 million, posting a 1.93
million increase in comparison to the number as of March 31, 2010, and our full-year cellular churn rate was 0.47%. The aggregate number of subscriptions to “Fami-wari MAX 50” and other MAX discount programs introduced in August 2007 reached approximately 36.50 million, while the number of subscriptions to the “Value Plan” launched in November 2007 grew to approximately 41.30 million as of March 31, 2011. Although our packet ARPU increased in comparison to the previous fiscal year, due to the impacts of an expanded uptake of “Value Plan” and other factors, our aggregate cellular ARPU decreased 5.2% from the previous fiscal year to ¥5,070.
With regard to equipment sales, both equipment sales revenues and cost of equipment sold recorded a decrease compared to the previous fiscal year primarily due to a decline in purchase and wholesale price per unit.
As a result of the foregoing, operating revenues and operating income from mobile phone business for the fiscal year ended March 31, 2011, were ¥4,090.7 billion (a decrease of ¥77.0 billion from the previous fiscal year) and ¥856.7 billion (an increase of ¥11.1 billion from the previous fiscal year), respectively.
A summary of the specific initiatives implemented during the fiscal year ended March 31, 2011, is provided
below: <<No.1 Customer Satisfaction Ranking>>
Now that the Japanese mobile telecommunications market has entered a period of maturation, we have moved ahead with our business transformation programs from a customer-centric perspective in accordance with our “Change and Challenge” action plan, ensuring a thoroughly hands-on approach to serving customers and uniting the forces of the entire corporate group. We have constantly listened to the voices of our customers through various channels such as docomo Shops and call centers, and strived to respond to them in a steadfast manner. As a consequence, we were awarded the No. 1 ranking in the 2010 Japan Mobile Phone Service StudySM, a consumer satisfaction survey conducted by J.D. Power Asia Pacific*1.
We also received the highest marks among the mobile operators for our enterprise offerings in the 2010 Japan Business Mobile Phone Service StudiesSM by J.D. Power Asia for two consecutive years*2. In addition, we were awarded the highest ranking in the Nikkei BP Consulting customer satisfaction survey of mobile data device users*3for two consecutive years as well.
We were highly evaluated by a broad base of both consumer and enterprise users in various categories including after-sales support and call quality. However, we are determined not to be content with these achievements, and we are committed to continuing our all-out efforts to achieve further improvement in customer satisfaction.
*1: J. D. Power Asia Pacific 2010 Japan Mobile Phone Service StudySM. Study results were based on responses obtained from 7,500
mobile phone users residing in Japan during the period between late July and August 2010. http://www.jdpower.co.jp/
*2: J. D. Power Asia Pacific 2009-2010 Japan Business Mobile Telephone/PHS Service Customer Satisfaction Index StudySM. The study
results were based on 3,222 responses from individuals responsible for supervising or deciding upon telephone services at 2,345
businesses with 100 or more employees. (Each respondent evaluated up to two mobile telephone/PHS providers.)
http://www.jdpower.co.jp/
*3: Nikkei BP Consulting Mobile data devices customer satisfaction survey. Results were based on responses to a web-based customer
satisfaction survey of 1,600 data device users, conducted between March 10 and March 15, 2010.
http://consult.nikkeibp.co.jp/consult/release/mobile100525.html
DOCOMO Earnings Release Fiscal Year Ended March 31, 2011
6
<<Spread of Smartphones>> With the diffusion of packet flat-rate services, smartphones have been rapidly growing popular as a mobile
device which users can enjoy the Internet, music or videos on large screens, or add various applications developed worldwide. To address the diversifying demands of smartphone users, we have enriched our smartphone lineup by releasing models such as XperiaTM *1 and GALAXY S, and implemented the following measures:
In conjunction with the release of XperiaTM on April 1, 2010, we created the “docomo market” portal for smartphones and started offering a wide array of content and applications that can be used on our smartphones.
Also, in September 2010, to improve our customers’ convenience, we launched the “sp-mode” service—an ISP*2 for smartphones that allows users to carry the same i-mode mail address after migrating to smartphones. In addition, we implemented various other measures including, among other things, the introduction of the “Osaifu-Keitai” electronic wallet capabilities on FeliCa-enabled smartphones and transplanting to smartphones the “docomo map navi” navigation service and other services previously accessible only via i-mode.
In addition, we introduced the “Monthly Support” program in March 2011. Under this program, customers with new smartphones will be given certain levels of discounts, which will vary by each model, on their monthly bills for up to 24 months.
As a result of these actions, the number of smartphones sold during the fiscal year ended March 31, 2011, increased significantly from the previous fiscal year to over 2.5 million units. The total number of “sp-mode” subscribers as of March 31, 2011, was 2.09 million.
*1: Xperia is a trademark or registered trademark of Sony Ericsson Mobile Communications AB.
*2: ISP (Internet Service Provider) is a service that provides access to the Internet.
<< Launch of Xi Service>>
On December 24, 2010, we launched the next-generation LTE service featuring high-speed, large-capacity and low-latency transmission under a new service brand, “Xi.” As of March 31, 2011, the total number of Xi base stations installed in the Tokyo/Osaka/Nagoya regions has grown to over 1,000. Customers who signed up for Xi are now enjoying comfortable data access at higher transmission speeds. By the end of March 2012, we plan to roll out a total of some 5,000 Xi base stations in prefectural capital-size cities across Japan to further expand areas in which users can enjoy comfortable data access.
For data access via Xi, we introduced dedicated billing plans “Xi Data Plan” and “Xi Data Plan Ninen”. The latter is a time-binding contract that offers cheaper monthly rates compared to the former to customers committing to a two-year subscription. In view of the limited area coverage in the initial phase, we commenced a special introductory offer “Xi Start Campaign” to provide subscribers with discounts on monthly charges through April 30, 2012.
Going forward, in addition to enhancing the transmission speeds of our existing services through the use of Xi, we will also aim to create a more comfortable communications environment that can satisfy the needs of our customers by delivering new services that take full advantage of LTE’s unique properties such as the distribution of long high-quality videos, tourist guide service using AR technology* and simultaneous translation service.
*AR (Augmented Reality), through the use of computer technology, adds information to the physical reality which users perceive. It
differs from “virtual reality” which presents a world completely created by methods such as computer graphics.
<<Promotion of Packet Usage>> We implemented the following measures aiming to promote the use of packet communications services: Integrated previously separate flat-rate packet billing plans for each handset type into “Pake-hodai Double” to
make our billing structure simpler and easier to understand. Also made a downward revision to the maximum
DOCOMO Earnings Release Fiscal Year Ended March 31, 2011
7
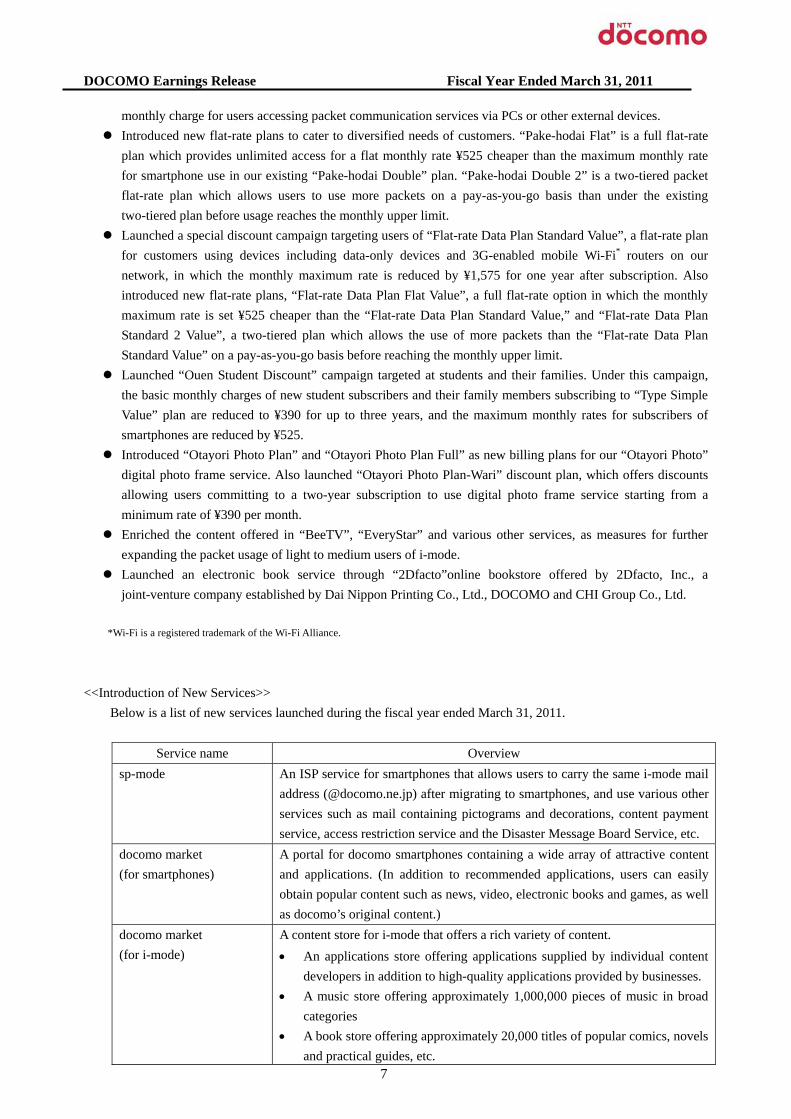
monthly charge for users accessing packet communication services via PCs or other external devices. Introduced new flat-rate plans to cater to diversified needs of customers. “Pake-hodai Flat” is a full flat-rate
plan which provides unlimited access for a flat monthly rate ¥525 cheaper than the maximum monthly rate for smartphone use in our existing “Pake-hodai Double” plan. “Pake-hodai Double 2” is a two-tiered packet flat-rate plan which allows users to use more packets on a pay-as-you-go basis than under the existing two-tiered plan before usage reaches the monthly upper limit.
Launched a special discount campaign targeting users of “Flat-rate Data Plan Standard Value”, a flat-rate plan for customers using devices including data-only devices and 3G-enabled mobile Wi-Fi* routers on our network, in which the monthly maximum rate is reduced by ¥1,575 for one year after subscription. Also introduced new flat-rate plans, “Flat-rate Data Plan Flat Value”, a full flat-rate option in which the monthly maximum rate is set ¥525 cheaper than the “Flat-rate Data Plan Standard Value,” and “Flat-rate Data Plan Standard 2 Value”, a two-tiered plan which allows the use of more packets than the “Flat-rate Data Plan Standard Value” on a pay-as-you-go basis before reaching the monthly upper limit.
Launched “Ouen Student Discount” campaign targeted at students and their families. Under this campaign, the basic monthly charges of new student subscribers and their family members subscribing to “Type Simple Value” plan are reduced to ¥390 for up to three years, and the maximum monthly rates for subscribers of smartphones are reduced by ¥525.
Introduced “Otayori Photo Plan” and “Otayori Photo Plan Full” as new billing plans for our “Otayori Photo” digital photo frame service. Also launched “Otayori Photo Plan-Wari” discount plan, which offers discounts allowing users committing to a two-year subscription to use digital photo frame service starting from a minimum rate of ¥390 per month.
Enriched the content offered in “BeeTV”, “EveryStar” and various other services, as measures for further expanding the packet usage of light to medium users of i-mode.
Launched an electronic book service through “2Dfacto”online bookstore offered by 2Dfacto, Inc., a joint-venture company established by Dai Nippon Printing Co., Ltd., DOCOMO and CHI Group Co., Ltd.
*Wi-Fi is a registered trademark of the Wi-Fi Alliance.
<<Introduction of New Services>>
Below is a list of new services launched during the fiscal year ended March 31, 2011.
Service name Overview sp-mode An ISP service for smartphones that allows users to carry the same i-mode mail
address (@docomo.ne.jp) after migrating to smartphones, and use various other services such as mail containing pictograms and decorations, content payment service, access restriction service and the Disaster Message Board Service, etc.
docomo market (for smartphones)
A portal for docomo smartphones containing a wide array of attractive content and applications. (In addition to recommended applications, users can easily obtain popular content such as news, video, electronic books and games, as well as docomo’s original content.)
docomo market (for i-mode)
A content store for i-mode that offers a rich variety of content. • An applications store offering applications supplied by individual content
developers in addition to high-quality applications provided by businesses. • A music store offering approximately 1,000,000 pieces of music in broad
categories • A book store offering approximately 20,000 titles of popular comics, novels
and practical guides, etc.
DOCOMO Earnings Release Fiscal Year Ended March 31, 2011
8
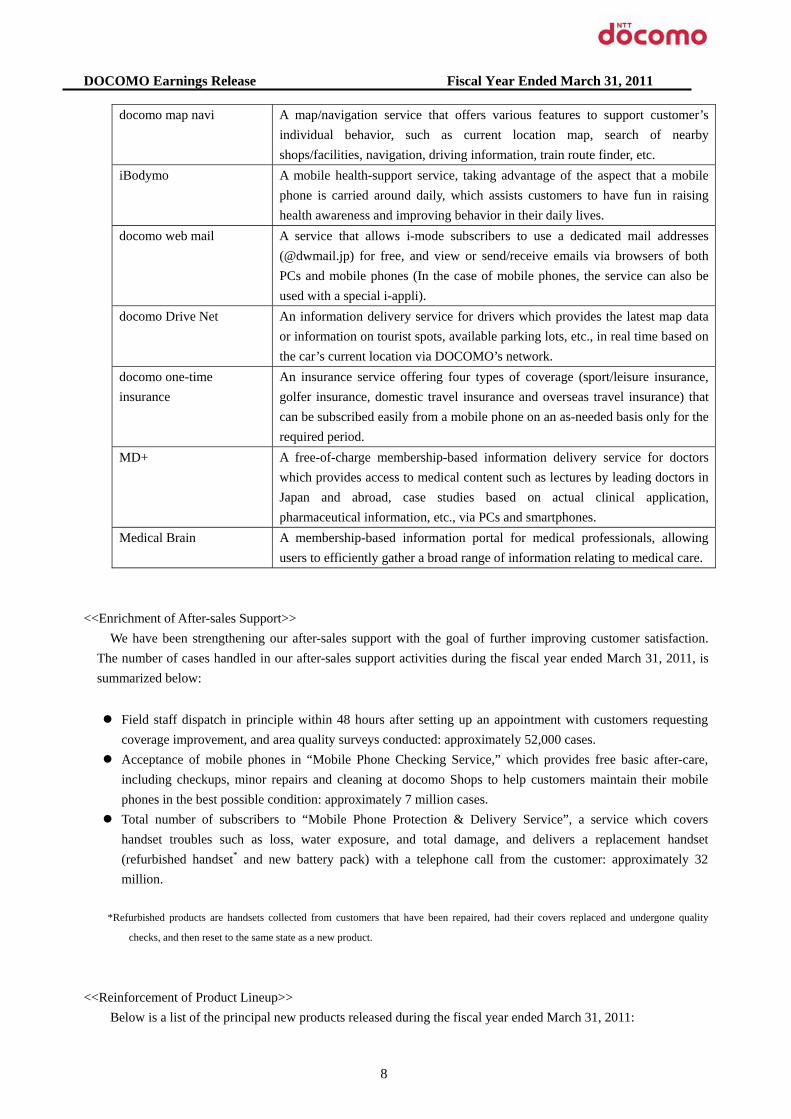
docomo map navi A map/navigation service that offers various features to support customer’s individual behavior, such as current location map, search of nearby shops/facilities, navigation, driving information, train route finder, etc.
iBodymo A mobile health-support service, taking advantage of the aspect that a mobile phone is carried around daily, which assists customers to have fun in raising health awareness and improving behavior in their daily lives.
docomo web mail A service that allows i-mode subscribers to use a dedicated mail addresses (@dwmail.jp) for free, and view or send/receive emails via browsers of both PCs and mobile phones (In the case of mobile phones, the service can also be used with a special i-appli).
docomo Drive Net An information delivery service for drivers which provides the latest map data or information on tourist spots, available parking lots, etc., in real time based on the car’s current location via DOCOMO’s network.
docomo one-time insurance
An insurance service offering four types of coverage (sport/leisure insurance, golfer insurance, domestic travel insurance and overseas travel insurance) that can be subscribed easily from a mobile phone on an as-needed basis only for the required period.
MD+ A free-of-charge membership-based information delivery service for doctors which provides access to medical content such as lectures by leading doctors in Japan and abroad, case studies based on actual clinical application, pharmaceutical information, etc., via PCs and smartphones.
Medical Brain A membership-based information portal for medical professionals, allowing users to efficiently gather a broad range of information relating to medical care.
<<Enrichment of After-sales Support>>
We have been strengthening our after-sales support with the goal of further improving customer satisfaction. The number of cases handled in our after-sales support activities during the fiscal year ended March 31, 2011, is summarized below:
Field staff dispatch in principle within 48 hours after setting up an appointment with customers requesting
coverage improvement, and area quality surveys conducted: approximately 52,000 cases. Acceptance of mobile phones in “Mobile Phone Checking Service,” which provides free basic after-care,
including checkups, minor repairs and cleaning at docomo Shops to help customers maintain their mobile phones in the best possible condition: approximately 7 million cases.
Total number of subscribers to “Mobile Phone Protection & Delivery Service”, a service which covers handset troubles such as loss, water exposure, and total damage, and delivers a replacement handset (refurbished handset* and new battery pack) with a telephone call from the customer: approximately 32 million.
*Refurbished products are handsets collected from customers that have been repaired, had their covers replaced and undergone quality
checks, and then reset to the same state as a new product.
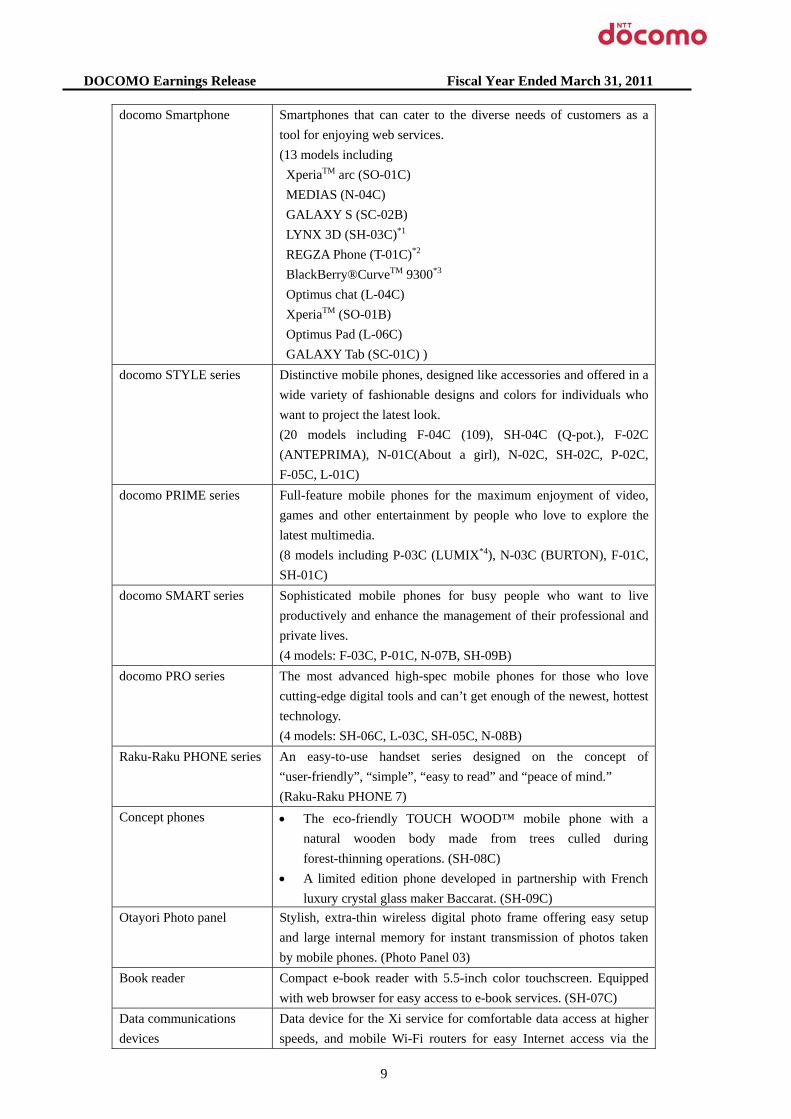
<<Reinforcement of Product Lineup>>
Below is a list of the principal new products released during the fiscal year ended March 31, 2011:
DOCOMO Earnings Release Fiscal Year Ended March 31, 2011
9
docomo Smartphone Smartphones that can cater to the diverse needs of customers as a tool for enjoying web services. (13 models including XperiaTM arc (SO-01C) MEDIAS (N-04C) GALAXY S (SC-02B) LYNX 3D (SH-03C)*1 REGZA Phone (T-01C)*2 BlackBerry®CurveTM 9300*3 Optimus chat (L-04C) XperiaTM (SO-01B) Optimus Pad (L-06C) GALAXY Tab (SC-01C) )
docomo STYLE series Distinctive mobile phones, designed like accessories and offered in a wide variety of fashionable designs and colors for individuals who want to project the latest look. (20 models including F-04C (109), SH-04C (Q-pot.), F-02C (ANTEPRIMA), N-01C(About a girl), N-02C, SH-02C, P-02C, F-05C, L-01C)
docomo PRIME series Full-feature mobile phones for the maximum enjoyment of video, games and other entertainment by people who love to explore the latest multimedia. (8 models including P-03C (LUMIX*4), N-03C (BURTON), F-01C, SH-01C)
docomo SMART series Sophisticated mobile phones for busy people who want to live productively and enhance the management of their professional and private lives. (4 models: F-03C, P-01C, N-07B, SH-09B)
docomo PRO series The most advanced high-spec mobile phones for those who love cutting-edge digital tools and can’t get enough of the newest, hottest technology. (4 models: SH-06C, L-03C, SH-05C, N-08B)
Raku-Raku PHONE series An easy-to-use handset series designed on the concept of “user-friendly”, “simple”, “easy to read” and “peace of mind.” (Raku-Raku PHONE 7)
Concept phones • The eco-friendly TOUCH WOOD™ mobile phone with a natural wooden body made from trees culled during forest-thinning operations. (SH-08C)
• A limited edition phone developed in partnership with French luxury crystal glass maker Baccarat. (SH-09C)
Otayori Photo panel Stylish, extra-thin wireless digital photo frame offering easy setup and large internal memory for instant transmission of photos taken by mobile phones. (Photo Panel 03)
Book reader Compact e-book reader with 5.5-inch color touchscreen. Equipped with web browser for easy access to e-book services. (SH-07C)
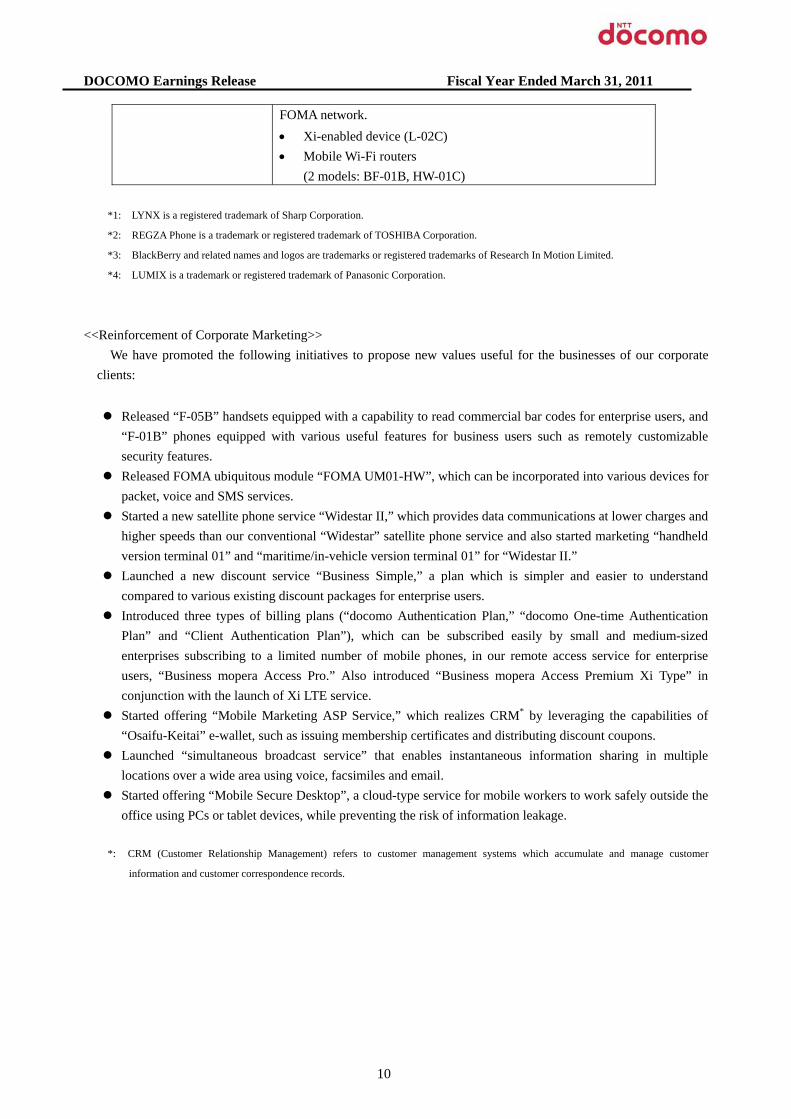
Data communications devices
Data device for the Xi service for comfortable data access at higher speeds, and mobile Wi-Fi routers for easy Internet access via the
DOCOMO Earnings Release Fiscal Year Ended March 31, 2011
10
FOMA network. • Xi-enabled device (L-02C) • Mobile Wi-Fi routers
(2 models: BF-01B, HW-01C)
*1: LYNX is a registered trademark of Sharp Corporation.
*2: REGZA Phone is a trademark or registered trademark of TOSHIBA Corporation.
*3: BlackBerry and related names and logos are trademarks or registered trademarks of Research In Motion Limited.
*4: LUMIX is a trademark or registered trademark of Panasonic Corporation.
<<Reinforcement of Corporate Marketing>>
We have promoted the following initiatives to propose new values useful for the businesses of our corporate clients:
Released “F-05B” handsets equipped with a capability to read commercial bar codes for enterprise users, and
“F-01B” phones equipped with various useful features for business users such as remotely customizable security features.
Released FOMA ubiquitous module “FOMA UM01-HW”, which can be incorporated into various devices for packet, voice and SMS services.
Started a new satellite phone service “Widestar II,” which provides data communications at lower charges and higher speeds than our conventional “Widestar” satellite phone service and also started marketing “handheld version terminal 01” and “maritime/in-vehicle version terminal 01” for “Widestar II.”
Launched a new discount service “Business Simple,” a plan which is simpler and easier to understand compared to various existing discount packages for enterprise users.
Introduced three types of billing plans (“docomo Authentication Plan,” “docomo One-time Authentication Plan” and “Client Authentication Plan”), which can be subscribed easily by small and medium-sized enterprises subscribing to a limited number of mobile phones, in our remote access service for enterprise users, “Business mopera Access Pro.” Also introduced “Business mopera Access Premium Xi Type” in conjunction with the launch of Xi LTE service.
Started offering “Mobile Marketing ASP Service,” which realizes CRM* by leveraging the capabilities of “Osaifu-Keitai” e-wallet, such as issuing membership certificates and distributing discount coupons.
Launched “simultaneous broadcast service” that enables instantaneous information sharing in multiple locations over a wide area using voice, facsimiles and email.
Started offering “Mobile Secure Desktop”, a cloud-type service for mobile workers to work safely outside the office using PCs or tablet devices, while preventing the risk of information leakage.
*: CRM (Customer Relationship Management) refers to customer management systems which accumulate and manage customer
information and customer correspondence records.
DOCOMO Earnings Release Fiscal Year Ended March 31, 2011
11
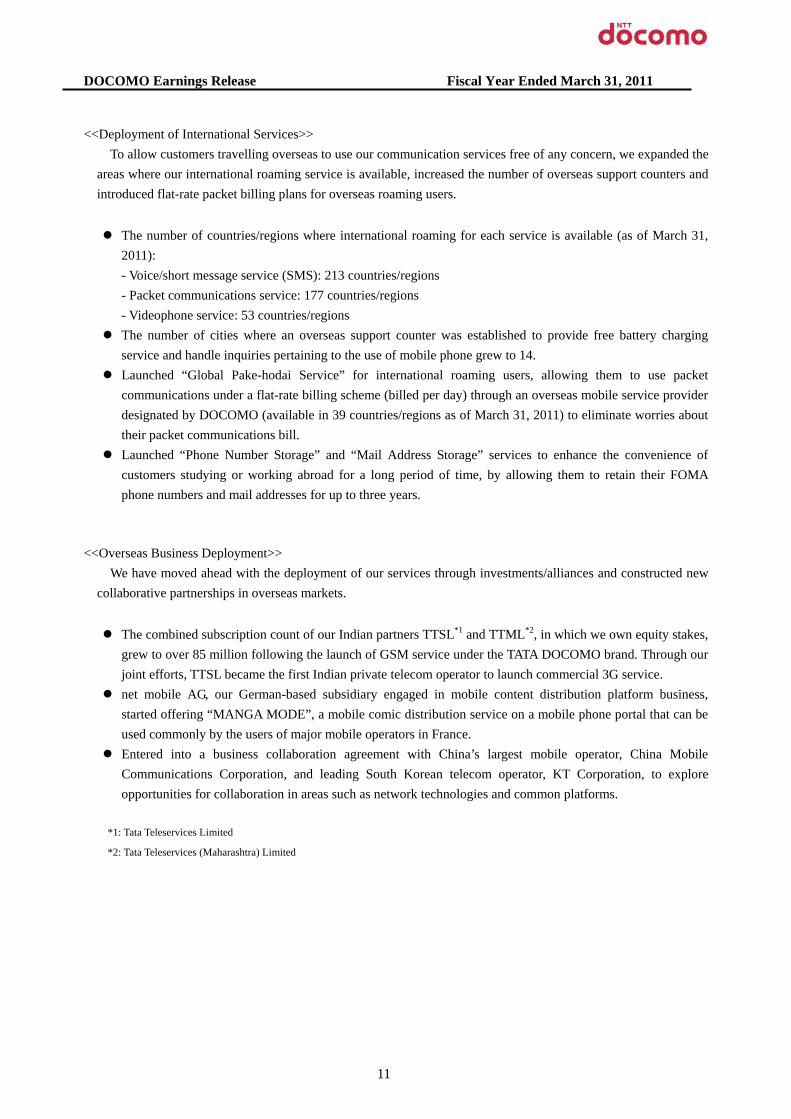
<<Deployment of International Services>>
To allow customers travelling overseas to use our communication services free of any concern, we expanded the areas where our international roaming service is available, increased the number of overseas support counters and introduced flat-rate packet billing plans for overseas roaming users.
The number of countries/regions where international roaming for each service is available (as of March 31,
2011): - Voice/short message service (SMS): 213 countries/regions - Packet communications service: 177 countries/regions - Videophone service: 53 countries/regions
The number of cities where an overseas support counter was established to provide free battery charging service and handle inquiries pertaining to the use of mobile phone grew to 14.
Launched “Global Pake-hodai Service” for international roaming users, allowing them to use packet communications under a flat-rate billing scheme (billed per day) through an overseas mobile service provider designated by DOCOMO (available in 39 countries/regions as of March 31, 2011) to eliminate worries about their packet communications bill.
Launched “Phone Number Storage” and “Mail Address Storage” services to enhance the convenience of customers studying or working abroad for a long period of time, by allowing them to retain their FOMA phone numbers and mail addresses for up to three years.
<<Overseas Business Deployment>> We have moved ahead with the deployment of our services through investments/alliances and constructed new
collaborative partnerships in overseas markets. The combined subscription count of our Indian partners TTSL*1 and TTML*2, in which we own equity stakes,
grew to over 85 million following the launch of GSM service under the TATA DOCOMO brand. Through our joint efforts, TTSL became the first Indian private telecom operator to launch commercial 3G service.
net mobile AG, our German-based subsidiary engaged in mobile content distribution platform business, started offering “MANGA MODE”, a mobile comic distribution service on a mobile phone portal that can be used commonly by the users of major mobile operators in France.
Entered into a business collaboration agreement with China’s largest mobile operator, China Mobile Communications Corporation, and leading South Korean telecom operator, KT Corporation, to explore opportunities for collaboration in areas such as network technologies and common platforms.
*1: Tata Teleservices Limited
*2: Tata Teleservices (Maharashtra) Limited
DOCOMO Earnings Release Fiscal Year Ended March 31, 2011
12
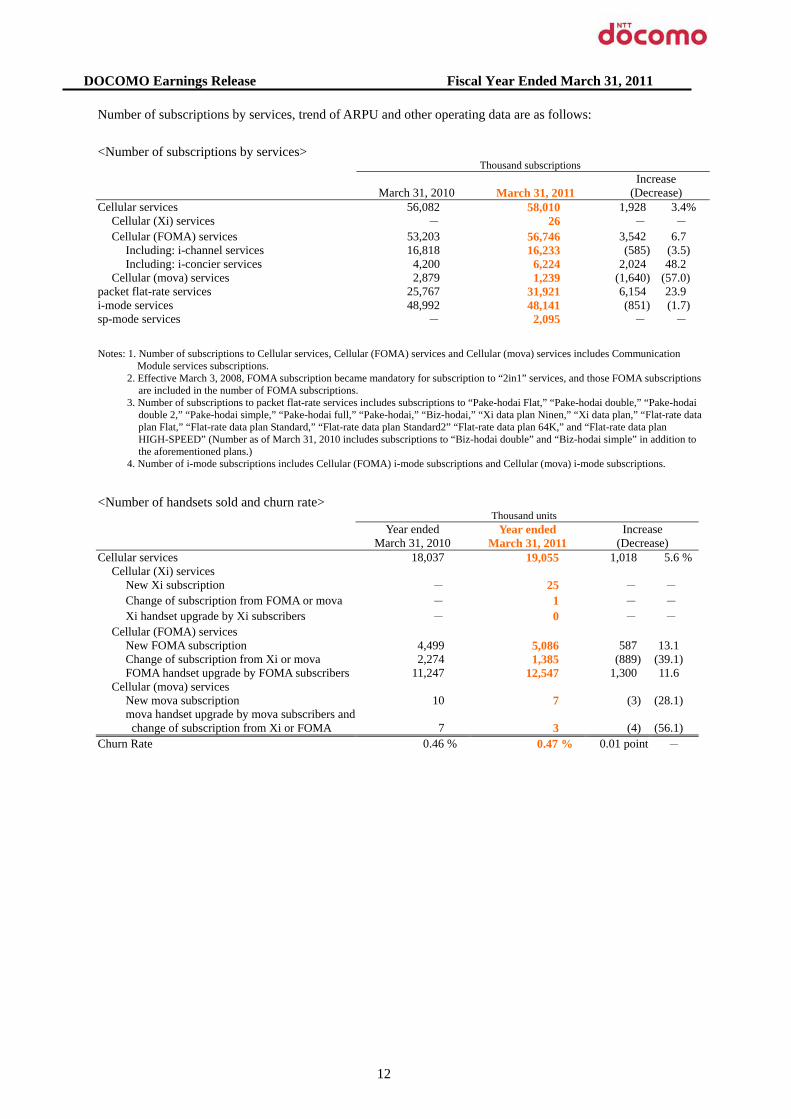
Number of subscriptions by services, trend of ARPU and other operating data are as follows: <Number of subscriptions by services> Thousand subscriptions
March 31, 2010 March 31, 2011 Increase
(Decrease) Cellular services 56,082 58,010 1,928 3.4%
Cellular (Xi) services - 26 - - Cellular (FOMA) services 53,203 56,746 3,542 6.7
Including: i-channel services 16,818 16,233 (585) (3.5) Including: i-concier services 4,200 6,224 2,024 48.2
Cellular (mova) services 2,879 1,239 (1,640) (57.0) packet flat-rate services 25,767 31,921 6,154 23.9 i-mode services 48,992 48,141 (851) (1.7) sp-mode services - 2,095 - - Notes: 1. Number of subscriptions to Cellular services, Cellular (FOMA) services and Cellular (mova) services includes Communication
Module services subscriptions. 2. Effective March 3, 2008, FOMA subscription became mandatory for subscription to “2in1” services, and those FOMA subscriptions
are included in the number of FOMA subscriptions. 3. Number of subscriptions to packet flat-rate services includes subscriptions to “Pake-hodai Flat,” “Pake-hodai double,” “Pake-hodai
double 2,” “Pake-hodai simple,” “Pake-hodai full,” “Pake-hodai,” “Biz-hodai,” “Xi data plan Ninen,” “Xi data plan,” “Flat-rate data plan Flat,” “Flat-rate data plan Standard,” “Flat-rate data plan Standard2” “Flat-rate data plan 64K,” and “Flat-rate data plan HIGH-SPEED” (Number as of March 31, 2010 includes subscriptions to “Biz-hodai double” and “Biz-hodai simple” in addition to the aforementioned plans.)
4. Number of i-mode subscriptions includes Cellular (FOMA) i-mode subscriptions and Cellular (mova) i-mode subscriptions.
<Number of handsets sold and churn rate> Thousand units Year ended
March 31, 2010 Year ended
March 31, 2011 Increase
(Decrease) Cellular services 18,037 19,055 1,018 5.6 %
Cellular (Xi) services New Xi subscription - 25 - - Change of subscription from FOMA or mova - 1 - - Xi handset upgrade by Xi subscribers - 0 - -
Cellular (FOMA) services New FOMA subscription 4,499 5,086 587 13.1 Change of subscription from Xi or mova 2,274 1,385 (889) (39.1) FOMA handset upgrade by FOMA subscribers 11,247 12,547 1,300 11.6
Cellular (mova) services New mova subscription 10 7 (3) (28.1) mova handset upgrade by mova subscribers and change of subscription from Xi or FOMA 7 3 (4) (56.1)
Churn Rate 0.46 % 0.47 % 0.01 point -
DOCOMO Earnings Release Fiscal Year Ended March 31, 2011
13
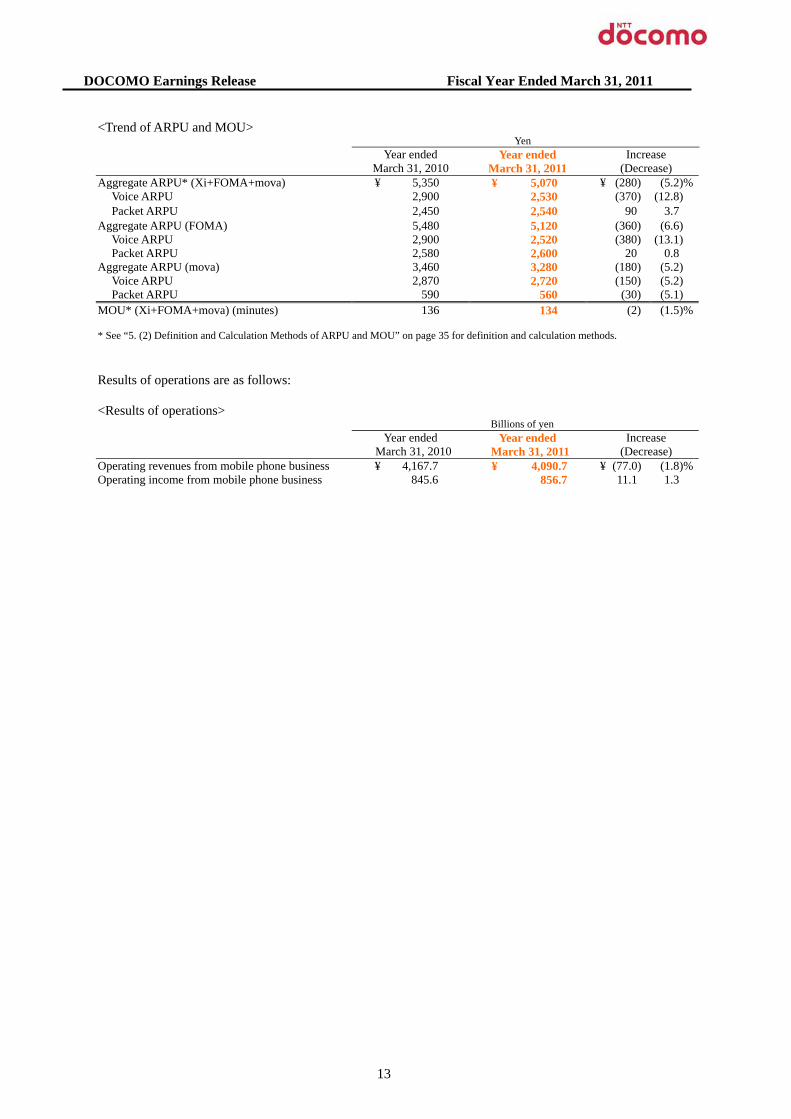
<Trend of ARPU and MOU> Yen Year ended
March 31, 2010 Year ended
March 31, 2011 Increase
(Decrease) Aggregate ARPU* (Xi+FOMA+mova) ¥ 5,350 ¥ 5,070 ¥ (280) (5.2)%
Voice ARPU 2,900 2,530 (370) (12.8) Packet ARPU 2,450 2,540 90 3.7
Aggregate ARPU (FOMA) 5,480 5,120 (360) (6.6) Voice ARPU 2,900 2,520 (380) (13.1) Packet ARPU 2,580 2,600 20 0.8
Aggregate ARPU (mova) 3,460 3,280 (180) (5.2) Voice ARPU 2,870 2,720 (150) (5.2) Packet ARPU 590 560 (30) (5.1)
MOU* (Xi+FOMA+mova) (minutes) 136 134 (2) (1.5)%
* See “5. (2) Definition and Calculation Methods of ARPU and MOU” on page 35 for definition and calculation methods. Results of operations are as follows:
<Results of operations> Billions of yen Year ended
March 31, 2010 Year ended
March 31, 2011 Increase
(Decrease) Operating revenues from mobile phone business ¥ 4,167.7 ¥ 4,090.7 ¥ (77.0) (1.8)%Operating income from mobile phone business 845.6 856.7 11.1 1.3
DOCOMO Earnings Release Fiscal Year Ended March 31, 2011
14
Miscellaneous businesses—
<<Promotion of Credit Business>> We have worked to expand the adoption of our credit brand “iD” and our credit service “DCMX” compatible
with “iD”, which can be used as “Osaifu-Keitai” electronic payment solutions. With respect to our credit brand “iD”, we have worked to increase the member stores where “iD” credit
payment can be used, especially in places frequently visited by users in their everyday activities. We completed the roll-out of “iD” payment terminals in all outlets of Seven-Eleven and Mini-Stop convenience store chains nationwide by July 2010 and January 2011, respectively. Meanwhile, we started offering “iD” service for smartphones equipped with FeliCa IC chips from February 2011. As a result, the total number of “iD” reader terminals installed reached 510,000 units as of March 31, 2011 (an increase of 70,000 units compared to March 31, 2010), and the total number of “iD” subscribers reached 15.84 million as of March 31, 2011.
We also strived to increase the number of subscriptions and boost the usage of our mobile credit payment service, “DCMX”, by revising its loyalty point program, increasing the number of tie-up stores where users can earn “docomo Points”, expanding the number of virtual stores on our Internet shopping site “DCMX docomo Point mall” and conducting various other promotional campaigns. As a result, the combined subscriptions to the “DCMX” services reached 12.32 million as of March 31, 2011 (an increase of 1.06 million from March 31, 2010).
<<Others>>
In addition to the above-mentioned initiatives, we worked to increase our revenues through our home shopping service provided mainly through TV media, our mobile advertisement business primarily on i-mode sites, development and sales of various system solutions leveraging our mobile techniques and know-how, provision of high-speed Internet access service for hotel facilities and other measures mainly in the Asia-Pacific region.
In September 2010, our subsidiary, Multimedia Broadcasting, Inc.*, received the approval from the Ministry of Internal Affairs and Communications of Japan to become the sole commissioned carriage operator for providing nationwide multimedia broadcasting services for mobile devices. In January 2011, Japan Mobilecasting, Inc. was spun off as the operating company providing commissioned multimedia broadcasting services and started preparations toward the service launch scheduled in April 2012.
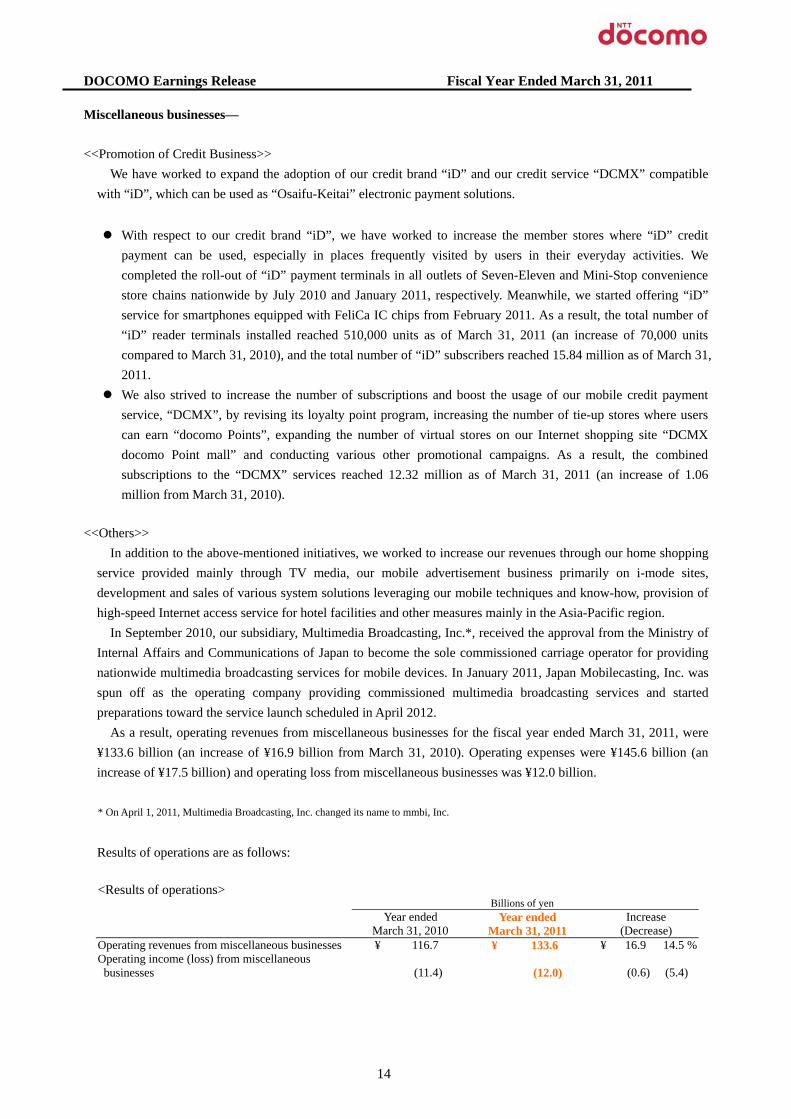
As a result, operating revenues from miscellaneous businesses for the fiscal year ended March 31, 2011, were ¥133.6 billion (an increase of ¥16.9 billion from March 31, 2010). Operating expenses were ¥145.6 billion (an increase of ¥17.5 billion) and operating loss from miscellaneous businesses was ¥12.0 billion.
* On April 1, 2011, Multimedia Broadcasting, Inc. changed its name to mmbi, Inc.
Results of operations are as follows: <Results of operations> Billions of yen Year ended
March 31, 2010 Year ended
March 31, 2011 Increase
(Decrease) Operating revenues from miscellaneous businesses ¥ 116.7 ¥ 133.6 ¥ 16.9 14.5 %Operating income (loss) from miscellaneous businesses (11.4) (12.0) (0.6) (5.4)

DOCOMO Earnings Release Fiscal Year Ended March 31, 2011
15
iii. Trend of Capital Expenditures
Below summarizes the principal capital investments made in the fiscal year ended March 31, 2011. <<Capital Expenditures for Telecommunications Facilities>>
We continued further quality enhancements of FOMA service areas meticulously responding to the requests from customers.
We also continually reinforced our network facilities to provide a comfortable communications environment to users of large-capacity content, and accommodate the growth in traffic resulting from the expanded uptake of smartphones, etc.
As a result of these measures, the total number of FOMA outdoor and indoor base stations installed as of March 31, 2011 grew to 62,800 and 29,200, respectively (an increase of 7,100 units and 4,400 units, respectively, from March 31, 2010). For Xi service, we completed the installation of 700 outdoor and 300 indoor base stations.
<<Initiatives Aimed for Efficiency and Cost Reduction>>
By facilitating the conversion into an IP-based network, we streamlined our network structure and pursued the integration and/or capacity expansion of our existing equipment, while continually working toward the reduction of equipment procurement costs.
We also constructed our service areas and achieved quality improvement in an efficient manner, using the optimal equipment among various options taking into consideration the surrounding environmental conditions, traffic volume and other factors.
As a result of an efficient implementation of the above measures, the total capital expenditures for the fiscal
year ended March 31, 2011, decreased by 2.6% from the previous fiscal year to ¥668.5 billion.
<Capital expenditures> Billions of yen
Year ended March 31, 2010
Year ended March 31, 2011
Increase (Decrease)
Total capital expenditures ¥ 686.5 ¥ 668.5 ¥ (18.0) (2.6)%Mobile phone business 556.8 520.8 (36.1) (6.5)Other (including information systems) 129.7 147.7 18.0 13.9

DOCOMO Earnings Release Fiscal Year Ended March 31, 2011
16
iv. Impact of the Great East Japan Earthquake and Restoration Efforts <<Damages of the Great East Japan Earthquake>>
Following the Great East Japan Earthquake on March 11, 2011, some 6,700 base station equipment became inoperable due to physical damages to these facilities, disruption of commercial power supply and transmission lines and other factors. With regard to docomo Shops, in the immediate aftermath of the earthquake, 159 out of 195 shops in the Tohoku region were forced to close temporarily, and a total of 90 shops including those located in the Kanto region were either completely or partially destroyed.
Immediately after the earthquake, we established Disaster Countermeasures Offices in our headquarters and the
Tohoku Regional Office to create an organizational structure capable of close collaboration 24 hours a day, and activated the “Disaster Message Board Service”. In cooperation with other NTT Group companies and construction companies, we have worked to assess the damages and restore our communication facilities as quickly as possible and initiated support activities for disaster victims.
<< Restoration Activities>>
The specific actions undertaken by our group for the restoration of communication facilities and the support for disaster victims are as follows:
Restoration of Communication Facilities
In our efforts toward the restoration of damaged communication facilities, we mobilized a total of some 4,000 people, and deployed approximately 30 mobile base station vehicles, approximately 30 mobile power supply vehicles and approximately 400 units of portable power generators to supply electricity to base stations and other facilities where commercial power supply was disrupted. We also recovered the transmission lines through the use of optical fiber, micro-wireless circuits and satellite circuits, and deployed base stations employing a large zone scheme* on mountaintops and other locations to resume services as quickly as possible. In areas where access was restricted due to the accident at the Fukushima Daiichi Nuclear Power Plant, we used high-performance antennas to transmit signals from outside the 20-km exclusion zone and replaced the transmission lines inside exchange-office buildings within the 20-km exclusion zone. As a result of these efforts, most of the service areas near the nuclear power plant and along major trunk roads in its vicinity were restored, enabling the resumption of FOMA service. *“Large zone scheme” is a method to cover areas normally covered by multiple stations by utilizing a single station.
Initiatives for Securing Means for Communication
To assist the restoration of disaster-stricken areas, we rented to local administrative institutions and installed at evacuation shelters approximately 900 satellite mobile phones, approximately 1,700 mobile phones and approximately 300 tablet devices. We also established approximately 300 stations where mobile phones can be recharged for free using multi-chargers, solar chargers and other means.
Provision of “Disaster Message Board Service”
We activated the “Disaster Message Board Service” immediately after the earthquake to provide disaster victims with a means of communication. To allow a greater number of people to use this service, we expanded the areas from which messages can be posted to cover the entire nation within one week after the quake, and also enabled its use through smartphones.
Reopening of docomo Shops
To offer assistance to customers whose mobile phones were damaged or lost due to the disaster, we strived to
DOCOMO Earnings Release Fiscal Year Ended March 31, 2011
17
reopen our docomo Shops as quickly as possible. As of March 31, 2011, approximately 90% of our docomo Shops, excluding those in buildings that were severely damaged or those within the exclusion zone around Fukushima Nuclear Power Plant, have reopened. For customers living in areas near shops which could not resume operations, nearby docomo Shops provided on-site services to answer to their needs.
Provision of “Restoration Area Maps”
For the three prefectures of Iwate, Miyagi and Fukushima, which suffered the severest damages from the earthquake, we started providing the “Restoration Area Maps” (Japanese only) on our home page from March 20, 2011, to allow users to confirm on maps such details as areas where FOMA service is available, areas that have been restored or planned to be restored through the use of mobile base station vehicles, locations where satellite mobile phones and free recharging services are available and docomo Shops’ store information.
Support for Disaster Victims
To support our customers affected by the disaster, we provided various services such as the extension of payment deadlines on phone bills, discounts on handset repair charges and free data restoration service for handsets damaged due to water exposure. In addition, for customers affected by the disaster, we decided to refund the basic monthly fees and other charges for the periods when services were not available.
Launch of Charity Drive Website for Affected Areas, etc.
To support the disaster-stricken areas, we launched a website to collect donations from customers through “DOCOMO mobile remittance service”, “DOCOMO Points” and other methods. We have donated ¥780 million, which was collected through March 30, 2011. We have also started accepting donations through the sale of charity applications and content from April 2011, and a total sum of ¥120 million collected by April 13, 2011 was donated. In a separate effort, the Company made a disaster-relief donation of ¥500 million.
As expenses related to the disaster and the above-mentioned restoration and other initiatives, we recorded ¥7.1
billion in operating expenses for the fiscal year ended March 31, 2011. The main items comprising these expenses were losses on disposal of base station and other facilities, personnel and other expenses incurred in response for the disaster.
DOCOMO Earnings Release Fiscal Year Ended March 31, 2011
18
v. Prospects for the Fiscal Year Ending March 31, 2012
As Japan’s mobile phone market continues to mature in line with the rise in cellular penetration rate, competition among operators is expected to remain intense in such areas as acquisition of subscribers and further improvement of service offerings.
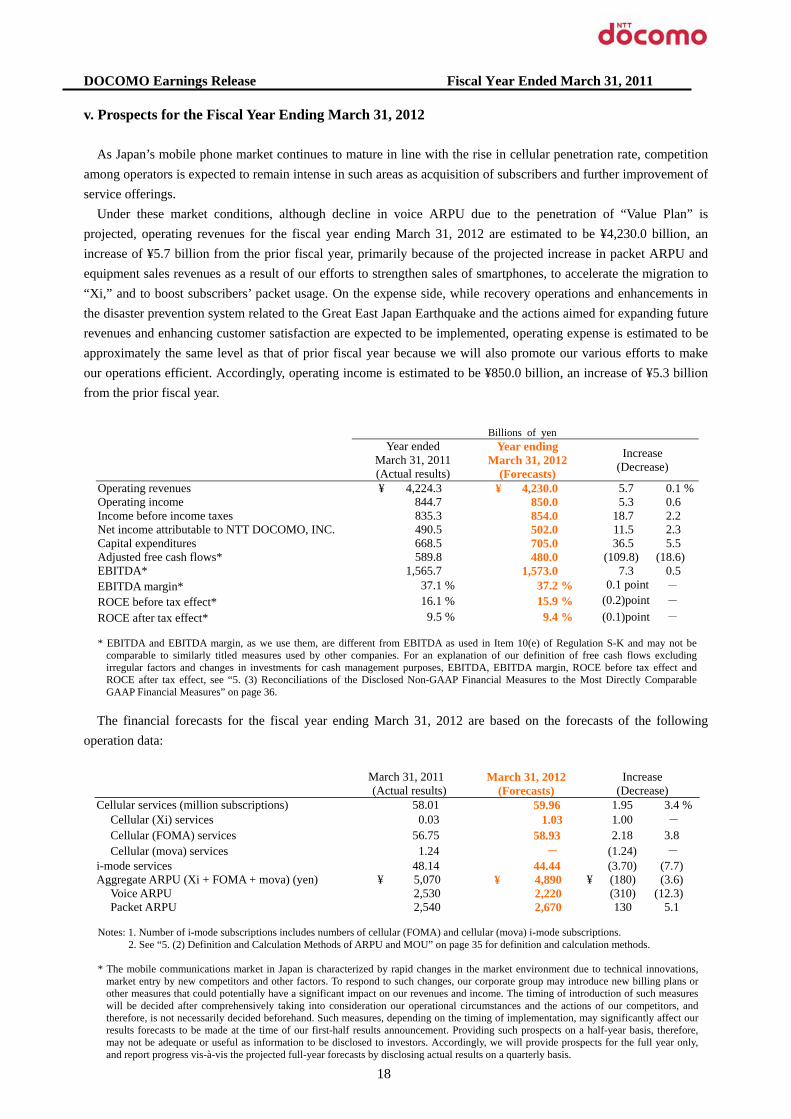
Under these market conditions, although decline in voice ARPU due to the penetration of “Value Plan” is projected, operating revenues for the fiscal year ending March 31, 2012 are estimated to be ¥4,230.0 billion, an increase of ¥5.7 billion from the prior fiscal year, primarily because of the projected increase in packet ARPU and equipment sales revenues as a result of our efforts to strengthen sales of smartphones, to accelerate the migration to “Xi,” and to boost subscribers’ packet usage. On the expense side, while recovery operations and enhancements in the disaster prevention system related to the Great East Japan Earthquake and the actions aimed for expanding future revenues and enhancing customer satisfaction are expected to be implemented, operating expense is estimated to be approximately the same level as that of prior fiscal year because we will also promote our various efforts to make our operations efficient. Accordingly, operating income is estimated to be ¥850.0 billion, an increase of ¥5.3 billion from the prior fiscal year.
Billions of yen
Year ended March 31, 2011 (Actual results)
Year ending March 31, 2012
(Forecasts)
Increase (Decrease)
Operating revenues ¥ 4,224.3 ¥ 4,230.0 5.7 0.1 %Operating income 844.7 850.0 5.3 0.6 Income before income taxes 835.3 854.0 18.7 2.2 Net income attributable to NTT DOCOMO, INC. 490.5 502.0 11.5 2.3 Capital expenditures 668.5 705.0 36.5 5.5 Adjusted free cash flows* 589.8 480.0 (109.8) (18.6) EBITDA* 1,565.7 1,573.0 7.3 0.5 EBITDA margin* 37.1 % 37.2 % 0.1 point - ROCE before tax effect* 16.1 % 15.9 % (0.2)point - ROCE after tax effect* 9.5 % 9.4 % (0.1)point -
* EBITDA and EBITDA margin, as we use them, are different from EBITDA as used in Item 10(e) of Regulation S-K and may not be
comparable to similarly titled measures used by other companies. For an explanation of our definition of free cash flows excluding irregular factors and changes in investments for cash management purposes, EBITDA, EBITDA margin, ROCE before tax effect and ROCE after tax effect, see “5. (3) Reconciliations of the Disclosed Non-GAAP Financial Measures to the Most Directly Comparable GAAP Financial Measures” on page 36.
The financial forecasts for the fiscal year ending March 31, 2012 are based on the forecasts of the following
operation data:
March 31, 2011 (Actual results)
March 31, 2012 (Forecasts)
Increase (Decrease)
Cellular services (million subscriptions) 58.01 59.96 1.95 3.4 %Cellular (Xi) services 0.03 1.03 1.00 - Cellular (FOMA) services 56.75 58.93 2.18 3.8 Cellular (mova) services 1.24 - (1.24) -
i-mode services 48.14 44.44 (3.70) (7.7) Aggregate ARPU (Xi + FOMA + mova) (yen) ¥ 5,070 ¥ 4,890 ¥ (180) (3.6)
Voice ARPU 2,530 2,220 (310) (12.3) Packet ARPU 2,540 2,670 130 5.1
Notes: 1. Number of i-mode subscriptions includes numbers of cellular (FOMA) and cellular (mova) i-mode subscriptions.
2. See “5. (2) Definition and Calculation Methods of ARPU and MOU” on page 35 for definition and calculation methods.
* The mobile communications market in Japan is characterized by rapid changes in the market environment due to technical innovations, market entry by new competitors and other factors. To respond to such changes, our corporate group may introduce new billing plans or other measures that could potentially have a significant impact on our revenues and income. The timing of introduction of such measures will be decided after comprehensively taking into consideration our operational circumstances and the actions of our competitors, and therefore, is not necessarily decided beforehand. Such measures, depending on the timing of implementation, may significantly affect our results forecasts to be made at the time of our first-half results announcement. Providing such prospects on a half-year basis, therefore, may not be adequate or useful as information to be disclosed to investors. Accordingly, we will provide prospects for the full year only, and report progress vis-à-vis the projected full-year forecasts by disclosing actual results on a quarterly basis.

DOCOMO Earnings Release Fiscal Year Ended March 31, 2011
19
(2) Financial Review i. Financial Position
Billions of yen
March 31, 2010 March 31, 2011 Increase
(Decrease) Total assets ¥ 6,756.8 ¥ 6,791.6 ¥ 34.8 0.5 %NTT DOCOMO, INC. shareholders’ equity 4,635.9 4,850.4 214.6 4.6 Liabilities 2,094.3 1,914.0 (180.3) (8.6)
Including: Interest bearing liabilities 610.3 428.4 (182.0) (29.8) Shareholders’ equity ratio (1) 68.6 % 71.4 % 2.8 point - Market equity ratio (2)* 87.7 % 89.3 % 1.6 point - Debt ratio (3) 11.6 % 8.1 % (3.5)point -
Notes: (1) Shareholders’ equity ratio = NTT DOCOMO, INC. shareholders’ equity / Total assets
(2) Market equity ratio = Market value of total share capital** / Total assets (3) Debt ratio = Interest bearing liabilities / (NTT DOCOMO, INC. shareholders’ equity + Interest bearing liabilities)
* See “5. (3) Reconciliations of the Disclosed Non-GAAP Financial Measures to the Most Directly Comparable GAAP Financial Measures” on page 36.
** Market value of total share capital = Closing share price multiplied by the number of outstanding shares (excluding treasury stock) as of the end of the fiscal period
ii. Cash Flow Conditions
For the year ended March 31, 2011, net cash provided by operating activities was ¥1,287.0 billion, an increase of
¥104.2 billion (8.8%) from the prior fiscal year, mainly due to an increase in cash inflow resulting from collections of installment receivables for handsets and a decrease in the payment of income taxes.
Net cash used in investing activities was ¥455.4 billion, a decrease of ¥708.6 billion (60.9%) from the prior fiscal year. This was mainly due to an increase of proceeds from redemption of short-term investments, an increase of proceeds from redemption of short-term bailment for consumption to a related party and a decrease in purchases of non-current assets, which were partially offset by an increase in purchases of short-term investments of more than three months for cash management purpose.
Net cash used in financing activities was ¥422.0 billion, an increase of ¥161.0 billion (61.7%) from the prior fiscal year. This was mainly due to an increase in repayment of long-term debt and an increase in dividends paid.
The balance of cash and cash equivalents was ¥765.6 billion as of March 31, 2011, an increase of ¥407.8 billion (114.0%) from the prior fiscal year end.
Billions of yen Year ended
March 31, 2010 Year ended
March 31, 2011 Increase
(Decrease) Net cash provided by operating activities ¥ 1,182.8 ¥ 1,287.0 ¥ 104.2 8.8 %Net cash used in investing activities (1,163.9) (455.4) 708.6 60.9 Net cash provided by (used in) financing activities (260.9) (422.0) (161.0) (61.7) Free cash flows (1) 18.9 831.7 812.8 - Free cash flows excluding the effects of changes in investments for cash management purposes (2)* 416.9 589.8 172.9 41.5
Liabilities to cash flow ratio (3) 51.6 % 33.3 % (18.3)point - Interest coverage ratio (4) 225.2 256.2 31.0 -
Notes: (1) Free cash flows = Net cash provided by operating activities + Net cash used in investing activities
(2) Changes in investments for cash management purposes = Changes by purchases, redemption at maturity and disposals of financial instruments held for cash management purposes with original maturities of longer than three months
(3) Liabilities to cash flow ratio = Interest bearing liabilities / Net cash provided by operating activities (4) Interest coverage ratio = Net cash provided by operating activities / Interest paid**
* See “5. (3) Reconciliations of the Disclosed Non-GAAP Financial Measures to the Most Directly Comparable GAAP Financial Measures”
on page 36. ** Interest paid is disclosed on “Supplemental disclosures of cash flow information” in “4. (4) Consolidated Statements of Cash Flows” on
page 31
DOCOMO Earnings Release Fiscal Year Ended March 31, 2011
20
(3) Profit Distribution i. Basic Policies for Profit Distribution
Believing that providing adequate returns to shareholders is one of the most important issues in corporate management, the Company plans to pay dividends by taking into account its consolidated results and consolidated dividend payout ratio based on the principle of stable dividend payments, while striving to strengthen its financial position and secure internal reserves. The Company will also continue to take a flexible approach regarding share repurchases. The Company intends to keep the repurchased shares as treasury stock and in principle to limit the amount of such treasury stock to approximately 5% of its total issued shares, and will consider retiring any treasury stock held in excess of this limit in a lump around the end of the fiscal year or at other appropriate times. According to the resolution of the board of directors, the Company repurchased 138,141 shares of its own common stock for an aggregate price of ¥20.0 billion during the fiscal year ended March 31, 2011 and the Company retired 140,000 of its treasury stock (approximately 0.3% of its common stock outstanding before the retirement) as of March 31, 2011.
In addition, the Company will allocate internal reserves to active research and development efforts, capital expenditures and other investments in response to the rapidly changing market environment. The Company will endeavor to boost its corporate value by introducing new technologies, offering new services and expanding its business domains through alliances with new partners. ii. Dividend
The Company paid ¥2,600 per share as an interim dividend for the six months ended September 30, 2010 and plans to pay a year-end dividend of ¥2,600 per share, resulting in a total annual dividend of ¥5,200 per share for the year ended March 31, 2011. iii. Prospect for the next fiscal year
The Company expects to pay a total annual dividend of ¥5,600 per share for the year ending March 31, 2012, consisting of an interim dividend of ¥2,800 and a year-end dividend of ¥2,800 per share.
DOCOMO Earnings Release Fiscal Year Ended March 31, 2011
21
(4) Special Note Regarding Forward-Looking Statements
This earnings release contains forward-looking statements such as forecasts of results of operations, management strategies, objectives and plans, forecasts of operational data such as the expected number of subscriptions, and the expected dividend payments. All forward-looking statements that are not historical facts are based on management’s current plans, expectations, assumptions and estimates based on the information currently available. Some of the projected numbers in this earnings release were derived using certain assumptions that are indispensable for making such projections in addition to historical facts. These forward-looking statements are subject to various known and unknown risks, uncertainties and other factors that could cause our actual results to differ materially from those contained in or suggested by any forward-looking statement. Potential risks and uncertainties include, without limitation, the following:
(1) Changes in the business environment in the telecommunications industry, such as intensifying competition
from other service providers, businesses or other technologies caused by Mobile Number Portability, new market entrants and other factors, or the expansion of the areas of competition could limit our acquisition of new subscriptions and retention of existing subscriptions, or may lead to diminishing ARPU or an increase in our costs and expenses.
(2) Current and new services, usage patterns, and sales schemes introduced by our corporate group may not develop as planned, which could affect our financial condition and limit our growth.
(3) The introduction or change of various laws or regulations or the application of such laws and regulations to our corporate group could restrict our business operations, which may adversely affect our financial condition and results of operations.
(4) Limitations in the amount of frequency spectrum or facilities made available to us could negatively affect our ability to maintain and improve our service quality and level of customer satisfaction.
(5) Other mobile service providers in the world may not adopt the technologies that are compatible with those used by our corporate group’s mobile communications system on a continual basis, which could affect our ability to sufficiently offer international services.
(6) Our domestic and international investments, alliances and collaborations may not produce the returns or provide the opportunities we expect.
(7) As electronic payment capability and many other new features are built into our cellular phones/devices, and services of parties other than those belonging to our corporate group are provided through our cellular handsets/devices, potential problems resulting from malfunctions, defects or loss of handsets/devices, or imperfection of services provided by such other parties may arise, which could have an adverse effect on our financial condition and results of operations.
(8) Social problems that could be caused by misuse of our products and services may adversely affect our credibility or corporate image.
(9) Inadequate handling of confidential business information including personal information by our corporate group, contractors and others, may adversely affect our credibility or corporate image.
(10) Owners of intellectual property rights that are essential for our business execution may not grant us the right to license or otherwise use such intellectual property rights on acceptable terms or at all, which may limit our ability to offer certain technologies, products and/or services, and we may also be held liable for damage compensation if we infringe the intellectual property rights of others.
(11) Events and incidents caused by natural disasters, social infrastructure paralysis such as power shortages, proliferation of harmful substances, terror or other destructive acts, the malfunctioning of equipment or software bugs, deliberate incidents induced by computer viruses, cyber attacks, hacking, unauthorized access and other problems could cause failure in our networks, distribution channels and/or other factors necessary for the provision of service, disrupting our ability to offer services to our subscribers, and may adversely affect our credibility and/or corporate image, or lead to a reduction of revenues and/or increase
DOCOMO Earnings Release Fiscal Year Ended March 31, 2011
22
of costs. (12) Concerns about adverse health effects arising from wireless telecommunications may spread and
consequently may adversely affect our financial condition and results of operations. (13) Our parent company, NIPPON TELEGRAPH AND TELEPHONE CORPORATION (NTT), could
exercise influence that may not be in the interests of our other shareholders. *Names of companies, products, etc., contained in this release are the trademarks or registered trademarks of their respective organizations.
DOCOMO Earnings Release Fiscal Year Ended March 31, 2011
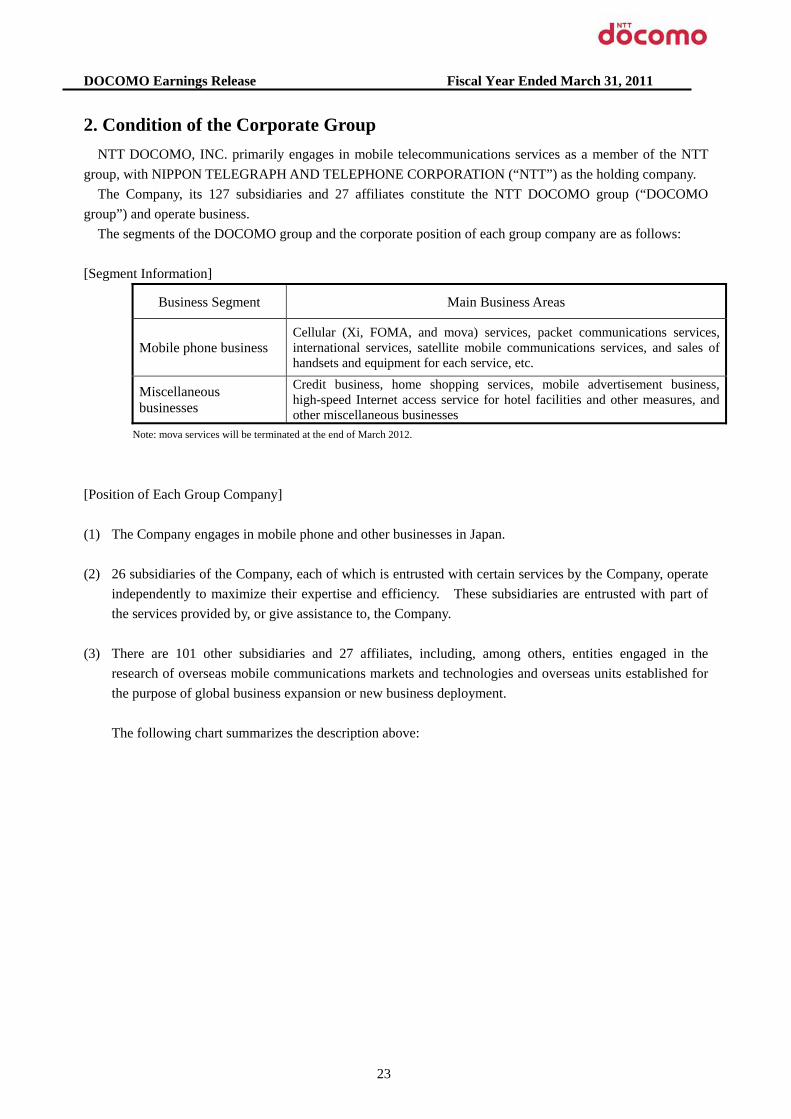
2. Condition of the Corporate Group NTT DOCOMO, INC. primarily engages in mobile telecommunications services as a member of the NTT
group, with NIPPON TELEGRAPH AND TELEPHONE CORPORATION (“NTT”) as the holding company. The Company, its 127 subsidiaries and 27 affiliates constitute the NTT DOCOMO group (“DOCOMO
group”) and operate business. The segments of the DOCOMO group and the corporate position of each group company are as follows:
[Segment Information]
Business Segment Main Business Areas
Mobile phone business Cellular (Xi, FOMA, and mova) services, packet communications services, international services, satellite mobile communications services, and sales of handsets and equipment for each service, etc.
Miscellaneous businesses
Credit business, home shopping services, mobile advertisement business, high-speed Internet access service for hotel facilities and other measures, and other miscellaneous businesses
Note: mova services will be terminated at the end of March 2012.
[Position of Each Group Company] (1) The Company engages in mobile phone and other businesses in Japan. (2) 26 subsidiaries of the Company, each of which is entrusted with certain services by the Company, operate
independently to maximize their expertise and efficiency. These subsidiaries are entrusted with part of the services provided by, or give assistance to, the Company.
(3) There are 101 other subsidiaries and 27 affiliates, including, among others, entities engaged in the
research of overseas mobile communications markets and technologies and overseas units established for the purpose of global business expansion or new business deployment.
The following chart summarizes the description above:
23

DOCOMO Earnings Release Year Ended March 31, 2011
Customers
DOCOMO Service Inc. DOCOMO Engineering Inc. DOCOMO Mobile Inc. DOCOMO Support Inc. DOCOMO Systems, Inc. DOCOMO Technology, Inc. DOCOMO Business Net, Inc.
(Subsidiaries: 26) Business entrustment
Provides wireless telecommunications
services
Company (NTT DOCOMO, INC.)
Mobile Phone Business
Miscellaneous Businesses
Basic R&D/ Group management
NTT(Parent)
DOCOMO Service Hokkaido Inc.DOCOMO Service Tohoku Inc. DOCOMO Service Tokai Inc. DOCOMO Service Hokuriku Inc. DOCOMO Service Kansai Inc. DOCOMO Service Chugoku Inc. DOCOMO Service Shikoku Inc. DOCOMO Service Kyushu Inc.
DOCOMO Engineering Hokkaido Inc. DOCOMO Engineering Tohoku Inc. DOCOMO Engineering Tokai Inc. DOCOMO Engineering Hokuriku Inc. DOCOMO Engineering Kansai, Inc. DOCOMO Engineering Chugoku, Inc. DOCOMO Engineering Shikoku Inc. DOCOMO Engineering Kyushu Inc. DOCOMO Mobile Tokai Inc. DOCOMO i Kyushu Inc. DOCOMO Mobilemedia Kansai, Inc.
Global development, New businesses
Dom
estic
3G Licensing Limited Hutchison Telephone Company Limited Hutchison 3G HK Holdings Limited Philippine Long Distance Telephone Company Robi Axiata Limited Tata Teleservices Limited Telargo Inc. and other companies 2Dfacto, Inc. AEON MARKETING Co. Ltd. Avex Broadcasting & Communications Inc. Boardwalk Inc. Cross Ocean Media, Inc. CXD NEXT CO., LTD. EVERYSTAR Co., Ltd. FeliCa Networks, Inc. Mobile Internet Capital, Inc. NIPPON TELECOMMUNICATIONS NETWORK, CO., LTD NTT Broadband Platform, Inc. NTT Resonant, Inc. Rakuten Auction, Inc. Sumitomo Mitsui Card Company, Limited. The JV, Ltd. Tower Records Japan Inc. Weather Service Co., Ltd. ZENRIN DataCom, CO., LTD.
(Affiliates: 27) DOCOMO Capital, Inc. DOCOMO Communications Laboratories Europe GmbH DOCOMO Communications Laboratories USA, Inc. DOCOMO Europe Limited DOCOMO interTouch Pte. Ltd. DOCOMO PACIFIC, INC. DOCOMO Beijing Communications Laboratories Co., Ltd. DOCOMO China Co., Ltd. Mobile Innovation Company Limited NTT DOCOMO USA, Inc. net mobile AG PacketVideo Corporation and other companies DOCOMO.com, Inc. DOCOMO・Tametan, Inc. Dynastep, Inc. D2 Communications Inc. Multimedia Broadcasting, Inc. NIPPONDATACOM Co., Ltd. OAK LAWN MARKETING, INC. and other companies
(Other Subsidiaries: 101)
Ove
rsea
s
Note: On April 1, 2011, Multimedia Broadcasting, Inc. changed its name to mmbi, Inc. As of March 31, 2011
24
DOCOMO Earnings Release Year Ended March 31, 2011
3. Management Policies
(1) Basic Management Policies
Under the corporate philosophy of “creating a new world of communications culture,” our corporate group aims to contribute to the realization of a rich and vigorous society by reinforcing our core business with a focus on popularizing the FOMA and Xi services, and promoting mobile multimedia services by offering services that are useful for customers’ daily lives and businesses. We will also seek to maximize our corporate value in order to be greatly trusted and highly valued by our valued shareholders and customers.
(2) Target Management Indicators
As Japan’s mobile telecommunications market continues to mature, our group regards EBITDA margin as an important management indicator from the perspective of profitability, to further enhance its management effectiveness. We also consider ROCE an important management indicator in terms of efficiency in its invested capital (NTT DOCOMO, INC. shareholders’ equity + Interest bearing liabilities). The group will exert its utmost efforts to maintain EBITDA margin of at least 35% and achieve ROCE of at least 20% and attempt to maximize its corporate value.
Notes: • EBITDA margin = EBITDA / Operating revenues • EBITDA = Operating income + Depreciation and amortization + Losses on sale or disposal of property, plant and equipment • ROCE = Operating income / (NTT DOCOMO, INC. shareholders’ equity + Interest bearing liabilities)
NTT DOCOMO, INC. shareholders’ equity and interest bearing liabilities are the average of the amounts at the end of the current fiscal year and the previous fiscal year.
(3) Medium- and Long-Term Management Strategies
We developed an action plan, “DOCOMO’s Change and Challenge to Achieve New Growth,” which covers initiatives to be implemented between the fiscal year ended March 31, 2009 and fiscal year ending March 31, 2013.
For more details concerning the action plan, please see our earnings release for the fiscal year ended March 31, 2009 (announced on April 28, 2009). No changes have been made to the descriptions contained in the said earnings release, which can be obtained via the following URL:
(NTT DOCOMO home page) http://www.nttdocomo.co.jp/english/corporate/ir/index.html
(4) Issues to be Addressed by the Group
Based on the aforesaid action plan, “DOCOMO’s Change and Challenge to Achieve New Growth,” in the fiscal year ending March 31, 2012, we will focus on the following priority items to make progress toward our goal to create a safe and secure society which is rich and comfortable for all, and also contribute to its continuous development.
25
DOCOMO Earnings Release Year Ended March 31, 2011 <<DOCOMO’s Change>>
As part of the “Change” programs, we have reviewed every aspect of our business operations—from products/services to customer care to network construction, with the aim of enhancing the satisfaction of our customers. While we received the No. 1 ranking in customer satisfaction in the fiscal year ended March 31, 2011, we are determined not to be content with the present achievements. We, joining the forces of the entire group, are committed to continuing our endeavors to further improve customer satisfaction.
<<DOCOMO’s Challenge>>
With respect to the “Challenge” programs, we position the fiscal year ending March 31, 2012 as the second year of the execution phase of our challenges, to provide services that are tailored to the lifestyle and individual needs of each customer and to contribute to the sustained development of society by providing solutions to pressing issues. We will promptly and steadily implement the following actions:
Expansion of packet usage: We will aim to increase packet ARPU by promoting subscriptions to flat-rate
billing plans for packet access, accelerating subscribers’ migration to smartphones, acquiring more users through subscriptions to second mobile devices (e.g., data communications or tablet devices), and proliferating the use of video services.
Proliferation of smartphones: We will move ahead with our endeavors to offer attractive devices, transplant to smartphones “i-channel”, “i-concier” and various other services that have so far been provided only on i-mode phones, and introduce new services that take advantage of the unique properties of smarphones. We will also put in place organizational structures and systems, etc., to respond to the full-scale proliferation of the smartphone market.
Roll-out of the Xi service and network evolution: To further enrich the Xi service launched in December 2010, we will move ahead with the development of network, devices and services to establish a foundation for promoting a wide array of advanced mobile broadband services. We will also work to further expand network coverage.
Promotion and further advancement of service personalization: We will further advance “i-concier” and introduce this service on smartphones to support the daily life of each customer, and offer a rich portfolio of content tailored to their varying needs or usage opportunities.
Deployment of social-support services: We will continually strive to create new businesses with the full-scale launch of social-support services in fields such as environment, health management and finance, while actively seeking alliances with external partners to secure new revenue sources.
Introduction and promotion of converged services: We will aim to provide more convenient services which are comfortable to use, such as the “Otayori Photo Service,” “docomo Drive Net” navigation and electronic books, and to further expand machine-to-machine businesses which connect devices not incorporated into a network.
Further advancement of devices: We will strengthen the lineup of our smartphones and other products to cater to the needs of broader customer segments. We also plan to add more variety to the lineup of Xi-enabled mobile devices.
Collaboration of devices and networks: We will aim to realize advanced services by optimizing the allocation of functions between devices and networks, leveraging the high-speed, large-capacity and low-latency properties of LTE network.
Basic research aimed at new value creation: We will work on the verification of our research for creating businesses that contribute to the development of society and industries, and aim to realize a richer society that takes advantage of the characteristics of mobile communications. In particular, we will further advance our joint research on “Mobile Spatial Statistics.”
Expansion of international businesses: We will strive to expand the revenues streams from international businesses by further enriching our international services and enhancing our overseas service counters. We
26
DOCOMO Earnings Release Year Ended March 31, 2011
will also seek revenue expansion and sustained growth through overseas business deployment by allying with partners.
Domestic investments and alliances: We will endeavor to expand revenues and achieve sustained growth by creating new businesses and reinforcing our core business through the pursuit of investments and alliances in Japan. We will also drive innovation jointly with our partners and aim to create new values.
With respect to our actions in response to the Great East Japan Earthquake, in order to restore area quality to the
pre-quake standards as quickly as possible, we are continuing our efforts in the restoration of communication and other facilities. Furthermore, taking this as a lesson, we are laying out a new disaster preparedness measure to realize swift responses in the event of a disaster. These measures include preventing interruption of communication services around major facilities, such as prefectural and municipal government offices across the country, and preparing responses in the case of interruptions in communications services affecting large areas and for long periods. We will continue to work towards providing our customers with safety and peace of mind.
Improvement of cost efficiency: To solidify our financial standing for sustained growth, we will optimize our
nationwide operations and streamline our network- and sale-related costs. Corporate Social Responsibility (CSR): Adhering to our CSR message, “We connect people to people, and
people to their worlds. We open the door to the future,” we will listen to each individual customer and to society, and will drive innovation toward the future to create abundance and convenience in life and culture. Specifically, we will undertake various actions focusing on the four key areas of “the individual customer,” “consistent quality,” “safety and security” and “environmental protection.”
Operating income and return to shareholders: We will aim to achieve ¥850.0 billion in operating income for the
fiscal year ending March 31, 2012, and endeavor to continue stable dividend payments. Corporate governance: By establishing and operating an internal control system designed for lawful business
conduct, we will continue to ensure compliance and risk management on all fronts of our group, and work to earn the trust and confidence of all stakeholders.
27

DOCOMO Earnings Release Fiscal Year Ended March 31, 2011
(1) Consolidated Balance Sheets
Increase(Decrease)
ASSETSCurrent assets:
Cash and cash equivalents 357,715¥ 765,551¥ 407,836¥ Short-term investments 403,010 141,028 (261,982)Accounts receivable 838,226 762,411 (75,815)Credit card receivables 126,009 160,446 34,437Allowance for doubtful accounts (15,633) (18,021) (2,388)Inventories 141,277 146,357 5,080Deferred tax assets 100,545 83,609 (16,936)Prepaid expenses and other current assets 109,829 113,918 4,089
Total current assets 2,060,978 30.5% 2,155,299 31.7% 94,321Property, plant and equipment:
Wireless telecommunications equipment 5,478,833 5,569,818 90,985Buildings and structures 830,921 845,588 14,667Tools, furniture and fixtures 516,084 507,914 (8,170)Land 199,018 198,842 (176)Construction in progress 83,608 95,251 11,643Accumulated depreciation and amortization (4,500,874) (4,694,094) (193,220)
Total property, plant and equipment, net 2,607,590 38.6% 2,523,319 37.2% (84,271)Non-current investments and other assets:
Investments in affiliates 578,095 525,456 (52,639)Marketable securities and other investments 151,026 128,138 (22,888)Intangible assets, net 628,691 672,256 43,565Goodwill 198,436 205,573 7,137Other assets 257,911 249,919 (7,992)Deferred tax assets 274,048 331,633 57,585
Total non-current investments and other assets 2,088,207 30.9% 2,112,975 31.1% 24,768Total assets 6,756,775¥ 100.0% 6,791,593¥ 100.0% 34,818¥
LIABILITIES AND EQUITYCurrent liabilities:
Current portion of long-term debt 180,716¥ 173,102¥ (7,614) ¥ Short-term borrowings 78 276 198Accounts payable, trade 632,437 609,337 (23,100)Accrued payroll 54,580 54,801 221Accrued interest 995 916 (79)Accrued income taxes 185,890 162,032 (23,858)Other current liabilities 133,466 122,704 (10,762)
Total current liabilities 1,188,162 17.6% 1,123,168 16.5% (64,994)Long-term liabilities:
Long-term debt (exclusive of current portion) 429,553 255,000 (174,553)Accrued liabilities for point programs 151,628 199,587 47,959Liability for employees’ retirement benefits 138,447 152,647 14,200Other long-term liabilities 186,539 183,597 (2,942)
Total long-term liabilities 906,167 13.4% 790,831 11.7% (115,336)Total liabilities 2,094,329 31.0% 1,913,999 28.2% (180,330)Equity:
NTT DOCOMO, INC. shareholders’ equityCommon stock 949,680 949,680 - Additional paid-in capital 757,109 732,914 (24,195)Retained earnings 3,347,830 3,621,965 274,135Accumulated other comprehensive income (loss) (37,379) (76,955) (39,576)Treasury stock, at cost (381,363) (377,168) 4,195
Total NTT DOCOMO, INC. shareholders’ equity 4,635,877 4,850,436 214,559Noncontrolling interests 26,569 27,158 589
Total equity 4,662,446 69.0% 4,877,594 71.8% 215,148Total liabilities and equity 6,756,775¥ 100.0% 6,791,593¥ 100.0% 34,818¥
Millions of yen
4. Consolidated Financial Statements
March 31, 2010 March 31, 2011
28
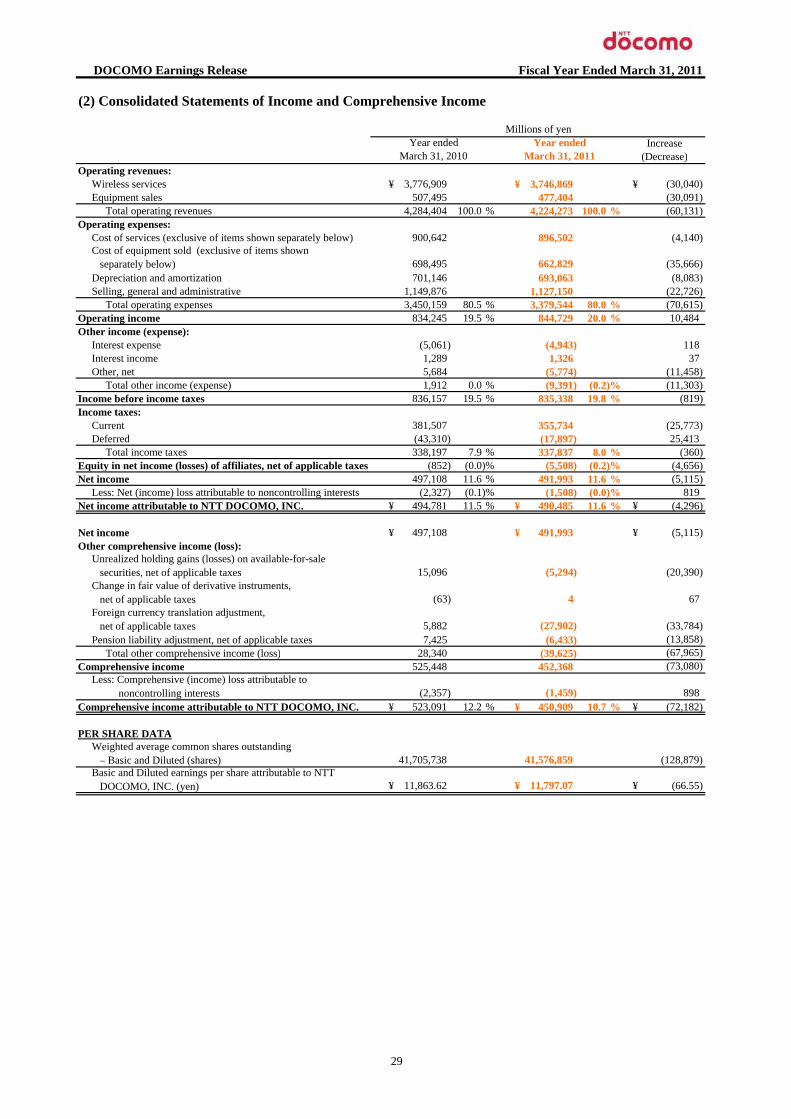
DOCOMO Earnings Release Fiscal Year Ended March 31, 2011
(2) Consolidated Statements of Income and Comprehensive Income
Increase(Decrease)
Operating revenues:Wireless services 3,776,909¥ 3,746,869¥ (30,040) ¥ Equipment sales 507,495 477,404 (30,091)
Total operating revenues 4,284,404 100.0 % 4,224,273 100.0 % (60,131)Operating expenses:
Cost of services (exclusive of items shown separately below) 900,642 896,502 (4,140)
698,495 662,829 (35,666)Depreciation and amortization 701,146 693,063 (8,083)Selling, general and administrative 1,149,876 1,127,150 (22,726)
Total operating expenses 3,450,159 80.5 % 3,379,544 80.0 % (70,615)Operating income 834,245 19.5 % 844,729 20.0 % 10,484Other income (expense):
Interest expense (5,061) (4,943) 118Interest income 1,289 1,326 37Other, net 5,684 (5,774) (11,458)
Total other income (expense) 1,912 0.0 % (9,391) (0.2)% (11,303)Income before income taxes 836,157 19.5 % 835,338 19.8 % (819)Income taxes:
Current 381,507 355,734 (25,773)Deferred (43,310) (17,897) 25,413
Total income taxes 338,197 7.9 % 337,837 8.0 % (360)Equity in net income (losses) of affiliates, net of applicable taxes (852) (0.0)% (5,508) (0.2)% (4,656)Net income 497,108 11.6 % 491,993 11.6 % (5,115)
Less: Net (income) loss attributable to noncontrolling interests (2,327) (0.1)% (1,508) (0.0)% 819Net income attributable to NTT DOCOMO, INC. 494,781¥ 11.5 % 490,485¥ 11.6 % (4,296) ¥
Net income 497,108¥ 491,993¥ (5,115) ¥ Other comprehensive income (loss):
15,096 (5,294) (20,390)
(63) 4 67
5,882 (27,902) (33,784)Pension liability adjustment, net of applicable taxes 7,425 (6,433) (13,858)
Total other comprehensive income (loss) 28,340 (39,625) (67,965)Comprehensive income 525,448 452,368 (73,080)
(2,357) (1,459) 898Comprehensive income attributable to NTT DOCOMO, INC. 523,091¥ 12.2 % 450,909¥ 10.7 % (72,182) ¥
PER SHARE DATA
41,705,738 41,576,859 (128,879)
11,863.62¥ 11,797.07¥ (66.55) ¥
Foreign currency translation adjustment, net of applicable taxes
Less: Comprehensive (income) loss attributable to noncontrolling interests
Weighted average common shares outstanding – Basic and Diluted (shares)Basic and Diluted earnings per share attributable to NTT DOCOMO, INC. (yen)
Change in fair value of derivative instruments, net of applicable taxes
Year endedYear ended
Cost of equipment sold (exclusive of items shown separately below)
Millions of yen
March 31, 2010 March 31, 2011
Unrealized holding gains (losses) on available-for-sale securities, net of applicable taxes
29

DOCOMO Earnings Release Fiscal Year Ended March 31, 2011
(3) Consolidated Statements of Shareholders' Equity
Commonstock
Additionalpaid-incapital
Retainedearnings
Accumulatedother
comprehensiveincome (loss)
Treasurystock,at cost
Balance at March 31, 2009 949,680¥ 785,045¥ 3,061,848¥ (65,689) ¥ (389,299) ¥ 4,341,585¥ 1,723¥ 4,343,308¥ Purchase of treasury stock (20,000) (20,000) (20,000)Retirement of treasury stock (27,936) 27,936 - -
(208,799) (208,799) (208,799)
- (3) (3)
Acquisition of new subsidiaries - 22,588 22,588Others - (96) (96)
Net income 494,781 494,781 2,327 497,108Unrealized holding gains (losses) on available-for-sale securities 15,096 15,096 0 15,096Change in fair value of derivative instruments (63) (63) (63)Foreign currency translation adjustment 5,852 5,852 30 5,882Pension liability adjustment 7,425 7,425 7,425
Balance at March 31, 2010 949,680¥ 757,109¥ 3,347,830¥ (37,379) ¥ (381,363) ¥ 4,635,877¥ 26,569¥ 4,662,446¥ Purchase of treasury stock (20,000) (20,000) (20,000)Retirement of treasury stock (24,195) 24,195 - -
(216,350) (216,350) (216,350)
- (1,243) (1,243)
Acquisition of new subsidiaries - - Others - 373 373
Net income 490,485 490,485 1,508 491,993Unrealized holding gains (losses) on available-for-sale securities (5,293) (5,293) (1) (5,294)Change in fair value of derivative instruments 4 4 4Foreign currency translation adjustment (27,854) (27,854) (48) (27,902)Pension liability adjustment (6,433) (6,433) (6,433)
Balance at March 31, 2011 949,680¥ 732,914¥ 3,621,965¥ (76,955) ¥ (377,168) ¥ 4,850,436¥ 27,158¥ 4,877,594¥
Cash dividends declared to NTT DOCOMO,INC. shareholders
Cash distributions to noncontrolling interests
Millions of yenNTT DOCOMO, INC. shareholders' equity
Noncontrollinginterests
Totalequity
Total NTTDOCOMO, INC.
shareholders'equity
Cash dividends declared to NTT DOCOMO,INC. shareholders
Cash distributions to noncontrolling interests
Comprehensive income
Comprehensive income
30

DOCOMO Earnings Release Fiscal Year Ended March 31, 2011
Year ended Year endedMarch 31, 2010 March 31, 2011
Cash flows from operating activities:Net income 497,108¥ 491,993¥ Adjustments to reconcile net income to net cash provided by operating activities–
Depreciation and amortization 701,146 693,063Deferred taxes (44,550) (22,563)Loss on sale or disposal of property, plant and equipment 32,735 27,936Impairment loss on marketable securities and other investments 4,007 13,424Equity in net (income) losses of affiliates 2,122 10,539Dividends from affiliates 12,854 12,757Changes in assets and liabilities:
(Increase) / decrease in accounts receivable (1,056) 75,200(Increase) / decrease in credit card receivables (30,042) (19,746) Increase / (decrease) in allowance for doubtful accounts 242 2,469(Increase) / decrease in inventories (17,262) (5,217)(Increase) / decrease in prepaid expenses and other current assets 1,582 (2,753)(Increase) / decrease in non-current installment receivable for handsets 13,860 7,029 Increase / (decrease) in accounts payable, trade (21,227) (30,988) Increase / (decrease) in accrued income taxes (53,765) (23,805) Increase / (decrease) in other current liabilities (22,019) (14,464) Increase / (decrease) in accrued liabilities for point programs 57,605 47,959 Increase / (decrease) in liability for employees’ retirement benefits (8,015) 14,203 Increase / (decrease) in other long-term liabilities 35,878 (8,791) Other, net 21,615 18,792
Net cash provided by operating activities 1,182,818 1,287,037Cash flows from investing activities:
Purchases of property, plant and equipment (480,080) (423,119)Purchases of intangible and other assets (245,488) (250,757)Purchases of non-current investments (10,027) (11,746)Proceeds from sale of non-current investments 9,534 3,946Acquisitions of subsidiaries, net of cash acquired (29,209) (7,678)Purchases of short-term investments (377,591) (745,602)Redemption of short-term investments 69,605 917,492Long-term bailment for consumption to a related party - (20,000)Short-term bailment for consumption to a related party (90,000) (20,000)Proceeds from redemption of long-term bailment for consumption to a related party - 110,000Other, net (10,670) (7,906)
Net cash used in investing activities (1,163,926) (455,370)Cash flows from financing activities:
Repayment of long-term debt (29,042) (180,075)Proceeds from short-term borrowings 138,214 717Repayment of short-term borrowings (138,149) (488)Principal payments under capital lease obligations (3,256) (4,597)Payments to acquire treasury stock (20,000) (20,000)Dividends paid (208,709) (216,283)Other, net (3) (1,243)
Net cash provided by (used in) financing activities (260,945) (421,969)Effect of exchange rate changes on cash and cash equivalents 220 (1,862)Net increase (decrease) in cash and cash equivalents (241,833) 407,836Cash and cash equivalents at beginning of year 599,548 357,715Cash and cash equivalents at end of year 357,715¥ 765,551¥ Supplemental disclosures of cash flow information:
Cash received during the year for:Income taxes 1,323¥ 301¥
Cash paid during the year for:Interest, net of amount capitalized 5,251 5,023Income taxes 436,459 378,998
Non-cash investing and financing activities:Assets acquired through capital lease obligations 2,347 5,631Acquisitions of shares through share exchange 15,023 - Acquisitions of exchangeable bonds through share exchange 20,821 - Acquisitions of shares through conversion of exchangeable bonds 26,326 - Retirement of treasury stock 27,936 24,195
Millions of yen(4) Consolidated Statements of Cash Flows
31
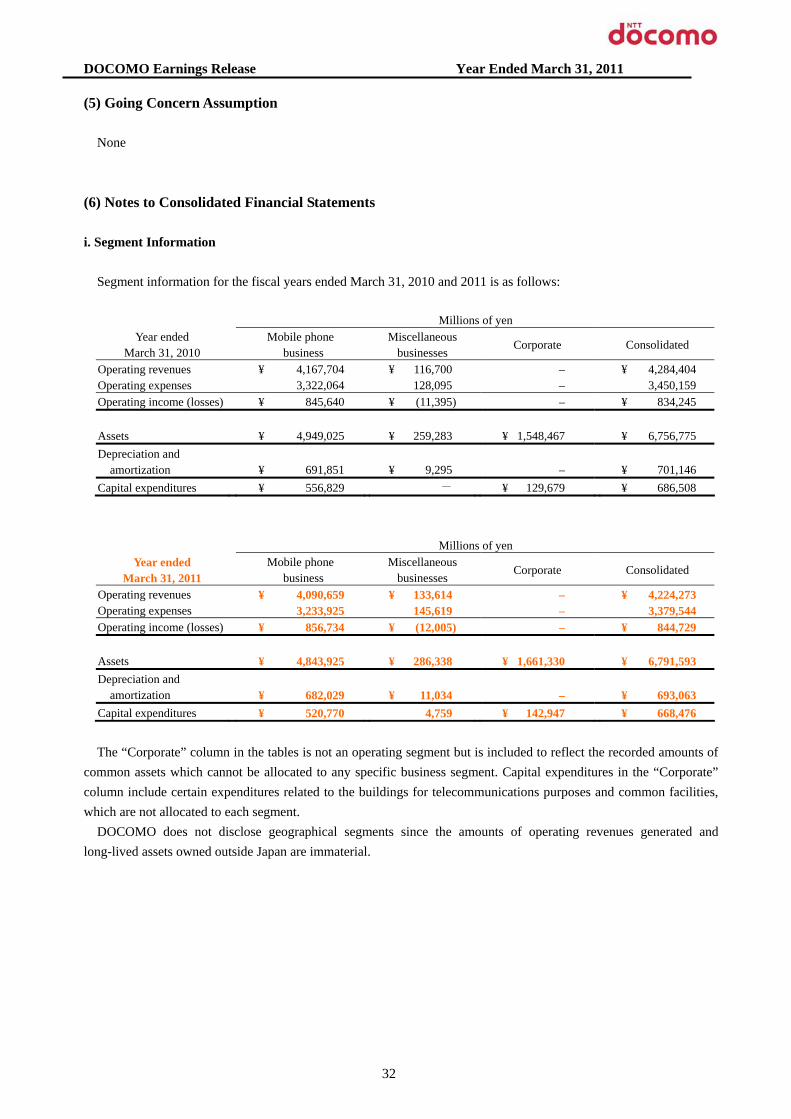
DOCOMO Earnings Release Year Ended March 31, 2011 (5) Going Concern Assumption
None (6) Notes to Consolidated Financial Statements i. Segment Information
Segment information for the fiscal years ended March 31, 2010 and 2011 is as follows:
Millions of yen Year ended
March 31, 2010 Mobile phone
business Miscellaneous
businesses Corporate Consolidated
Operating revenues ¥ 4,167,704 ¥ 116,700 – ¥ 4,284,404 Operating expenses 3,322,064 128,095 – 3,450,159 Operating income (losses) ¥ 845,640 ¥ (11,395) – ¥ 834,245 Assets ¥ 4,949,025 ¥ 259,283 ¥ 1,548,467 ¥ 6,756,775 Depreciation and
amortization ¥ 691,851 ¥ 9,295 – ¥ 701,146 Capital expenditures ¥ 556,829 - ¥ 129,679 ¥ 686,508
Millions of yen Year ended
March 31, 2011 Mobile phone
business Miscellaneous
businesses Corporate Consolidated
Operating revenues ¥ 4,090,659 ¥ 133,614 – ¥ 4,224,273 Operating expenses 3,233,925 145,619 – 3,379,544 Operating income (losses) ¥ 856,734 ¥ (12,005) – ¥ 844,729 Assets ¥ 4,843,925 ¥ 286,338 ¥ 1,661,330 ¥ 6,791,593 Depreciation and
amortization ¥ 682,029 ¥ 11,034 – ¥ 693,063 Capital expenditures ¥ 520,770 4,759 ¥ 142,947 ¥ 668,476
The “Corporate” column in the tables is not an operating segment but is included to reflect the recorded amounts of
common assets which cannot be allocated to any specific business segment. Capital expenditures in the “Corporate” column include certain expenditures related to the buildings for telecommunications purposes and common facilities, which are not allocated to each segment.
DOCOMO does not disclose geographical segments since the amounts of operating revenues generated and long-lived assets owned outside Japan are immaterial.
32
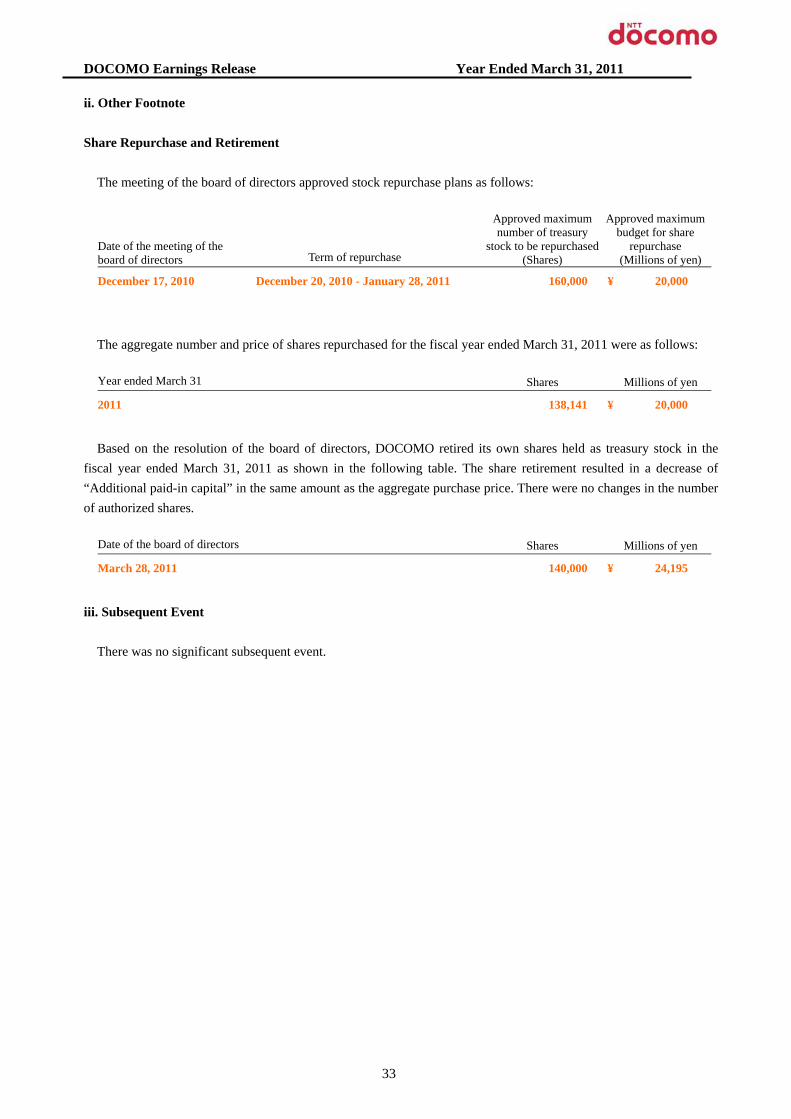
DOCOMO Earnings Release Year Ended March 31, 2011 ii. Other Footnote Share Repurchase and Retirement
The meeting of the board of directors approved stock repurchase plans as follows:
Date of the meeting of the board of directors Term of repurchase
Approved maximum number of treasury
stock to be repurchased (Shares)
Approved maximum budget for share
repurchase (Millions of yen)
December 17, 2010 December 20, 2010 - January 28, 2011 160,000 ¥ 20,000
The aggregate number and price of shares repurchased for the fiscal year ended March 31, 2011 were as follows:
Year ended March 31 Shares Millions of yen
2011 138,141 ¥ 20,000
Based on the resolution of the board of directors, DOCOMO retired its own shares held as treasury stock in the fiscal year ended March 31, 2011 as shown in the following table. The share retirement resulted in a decrease of “Additional paid-in capital” in the same amount as the aggregate purchase price. There were no changes in the number of authorized shares.
Date of the board of directors Shares Millions of yen
March 28, 2011 140,000 ¥ 24,195
iii. Subsequent Event
There was no significant subsequent event.
33

DOCOMO Earnings Release Fiscal Year Ended March 31, 2011
Full-year Forecast: as announced on April 28, 2011
First Quarter(Apr.-Jun. 2010)
Results
Second Quarter(Jul.-Sep. 2010)
Results
Third Quarter(Oct.-Dec. 2010)
Results
Fourth Quarter(Jan.-Mar. 2011)
Results
Number of Subscriptions and Other Operating DataCellular
Subscriptions thousands 56,082 58,010 56,515 56,895 57,210 58,010 59,960Xi thousands - 26 - - 1 26 1,030FOMA (1) thousands 53,203 56,746 54,162 54,940 55,572 56,746 58,930
Communication Module Service (FOMA) thousands 1,081 1,606 1,212 1,349 1,463 1,606 -mova thousands 2,879 1,239 2,352 1,954 1,636 1,239 -
Communication Module Service (DoPa) thousands 521 363 482 454 415 363 -Prepaid thousands 37 21 36 31 26 21 -
Packet Flat-rate Services Subscriptions (2) thousands 25,767 31,921 27,491 28,905 30,174 31,921 -Market Share (3) (4) % 50.0 48.5 49.7 49.3 48.9 48.5 -Net Increase from Previous Period (4) thousands 1,481 1,928 432 380 315 800 1,950
Xi thousands - 26 - - 1 24 1,000FOMA (1) thousands 4,163 3,542 959 778 632 1,173 2,180mova thousands (2,682) (1,640) (526) (398) (318) (398) (1,240)
Churn Rate (4) % 0.46 0.47 0.44 0.49 0.46 0.48 -Number of Handsets (Xi+FOMA+mova) Sold (5) thousands 18,037 19,055 4,615 4,630 4,342 5,469 -
i-modeSubscriptions thousands 48,992 48,141 49,061 48,914 48,530 48,141 44,440
FOMA thousands 47,330 47,541 47,758 47,876 47,686 47,541 44,440i-mode Subscription Rate (4) % 87.4 83.0 86.8 86.0 84.8 83.0 74.2Net Increase from Previous Period thousands 518 (851) 69 (146) (385) (390) (3,700)i-channel Subscriptions thousands 16,818 16,233 16,757 16,747 16,493 16,233 -i-concier Subscriptions thousands 4,200 6,224 4,783 5,410 5,800 6,224 -
sp-modeSubscriptions thousands - 2,095 - 270 936 2,095 7,230
ARPU and MOUARPU
Aggregate ARPU (Xi+FOMA+mova) (6) yen/month/subscription 5,350 5,070 5,190 5,200 5,130 4,760 4,890Voice ARPU (7) yen/month/subscription 2,900 2,530 2,680 2,660 2,590 2,190 2,220Packet ARPU yen/month/subscription 2,450 2,540 2,510 2,540 2,540 2,570 2,670ARPU Generated from International Services (8) yen/month/subscription 80 90 80 90 90 90 90
Aggregate ARPU (FOMA) (6) yen/month/subscription 5,480 5,120 5,260 5,260 5,180 4,790 4,910Voice ARPU (7) yen/month/subscription 2,900 2,520 2,670 2,660 2,580 2,180 2,220Packet ARPU yen/month/subscription 2,580 2,600 2,590 2,600 2,600 2,610 2,690ARPU Generated from International Services (8) yen/month/subscription 80 90 90 90 90 90 90
Aggregate ARPU (mova) (6) yen/month/subscription 3,460 3,280 3,330 3,310 3,290 3,080 3,250Voice ARPU (7) yen/month/subscription 2,870 2,720 2,770 2,750 2,750 2,540 2,680Packet ARPU yen/month/subscription 590 560 560 560 540 540 570ARPU Generated from International Services (8) yen/month/subscription 0 0 0 0 0 0 20
MOUMOU (Xi+FOMA+mova) (6) minute/month/subscription 136 134 133 135 133 135 -MOU (FOMA) (6) minute/month/subscription 142 137 137 138 136 137 -MOU (mova) (6) minute/month/subscription 51 44 45 44 43 44 -
Others DCMX Subscriptions (9) thousands 11,260 12,321 11,640 11,950 12,120 12,321 12,960
5. Appendices(1) Operating Data for the Fiscal Year Ended March 31, 2011
【Ref.】Fiscal Year
Ending Mar. 31, 2012Full-year Forecast
【Ref.】Fiscal Year
Ended Mar. 2010Full-year Results
Fiscal YearEnded Mar. 31, 2011
Full-year Results
* Please refer to "5. (2) Definition and Calculation Methods of ARPU and MOU" for the definition of ARPU and MOU, and an explanation of the methods used to calculate ARPU and the number of active subscriptions.
(1) Effective March 3, 2008, FOMA subscription became mandatory for subscription to "2in1" services, and those FOMA subscriptions are included in the number of FOMA subscribers.(2) Sum of "Pake-hodai FLAT," "Pake-hodai double/double 2," "Pake-hodai simple," "Pake-hodai full," "Pake-hodai," "Biz-hodai," "Xi Data Plan Ninen," "Xi Data Plan," "Flat-rate data plan FLAT (includes Value)," "Flat-rate data plan Standard/Standard 2 (includes Value)," "Flat-rate data plan 64k (includes Value)" and "Flat-rate data plan HIGH-SPEED (includes Value)." (Number of subscriptions for the fiscal year ended March 31, 2010 includes subscriptions to "Biz-hodai double" and "Biz-hodai simple" in addition to the aforementioned plans.)(3) Source for other cellular telecommunications operators: Data announced by Telecommunications Carriers Association(4) Data are calculated including communication module services subscriptions.(5) Sum of new subscriptions, change of subscription from FOMA/mova to Xi, Xi/mova to FOMA, Xi/FOMA to mova, Xi handset upgrade by Xi subscribers, FOMA handset upgrade by FOMA subscribers and mova handset upgrade by mova subscribers(6) Data are calculated excluding communication module services-related revenues and communication module services subscriptions, and Phone Number Storage and Mail Address Storage services-related revenues and those subscriptions.(7) Inclusive of circuit-switched data communication(8) Inclusive of voice communication and packet communication(9) Inclusive of DCMX mini subscriptions
34

DOCOMO Earnings Release Fiscal Year Ended March 31, 2011 (2) Definition and Calculation Methods of ARPU and MOU i. Definition of ARPU and MOU
a. ARPU (Average monthly Revenue Per Unit): Average monthly revenue per unit, or ARPU, is used to measure average monthly operating revenues attributable to designated services on a per subscription basis. ARPU is calculated by dividing various revenue items included in operating revenues from our wireless services, such as basic monthly charges, voice communication charges and packet communication charges, from designated services which are incurred consistently each month, by the number of active subscriptions to the relevant services. Accordingly, the calculation of ARPU excludes revenues that are not representative of monthly average usage such as activation fees. We believe that our ARPU figures provide useful information to analyze the average usage per subscription and the impacts of changes in our billing arrangements. The revenue items included in the numerators of our ARPU figures are based on our U.S. GAAP results of operations. This definition applies to all ARPU figures hereinafter.
b. MOU (Minutes of Use): Average monthly communication time per subscription. ii. ARPU Calculation Methods
a. ARPU (Xi+FOMA+mova) - Aggregate ARPU (Xi+FOMA+mova) = Voice ARPU (Xi+FOMA+mova) + Packet ARPU (Xi+FOMA+mova) - Voice ARPU (Xi+FOMA+mova): Voice ARPU (FOMA+mova) Related Revenues (basic monthly charges,
voice communication charges) / No. of active subscriptions (Xi+FOMA+mova)
- Packet ARPU (Xi+FOMA+mova): Packet ARPU (Xi+FOMA+mova) Related Revenues (basic monthly charges, packet communication charges)/ No. of active subscriptions (Xi+FOMA+mova)
b. ARPU (FOMA) - Aggregate ARPU (FOMA) = Voice ARPU (FOMA) + Packet ARPU (FOMA) - Voice ARPU (FOMA): Voice ARPU (FOMA) Related Revenues (basic monthly charges, voice communication
charges) / No. of active subscriptions (FOMA) - Packet ARPU (FOMA): Packet ARPU (FOMA) Related Revenues (basic monthly charges, packet communication
charges) / No. of active subscriptions (FOMA) c. ARPU (mova)
- Aggregate ARPU (mova) = Voice ARPU (mova) + Packet ARPU (mova) - Voice ARPU (mova): Voice ARPU (mova) Related Revenues (basic monthly charges, voice communication
charges) / No. of active subscriptions (mova) - Packet ARPU (mova): Packet ARPU (mova) Related Revenues (basic monthly charges, packet
communication charges) / No. of active subscriptions (mova)
iii. Active Subscriptions Calculation Methods
Sum of No. of active subscriptions for each month ((No. of subscriptions at the end of previous month + No. of subscriptions at the end of current month) / 2) during the relevant period
Note: Subscriptions and revenues for communication module services and Phone Number Storage and Mail Address Storage services are not included in the ARPU and MOU calculations.
35
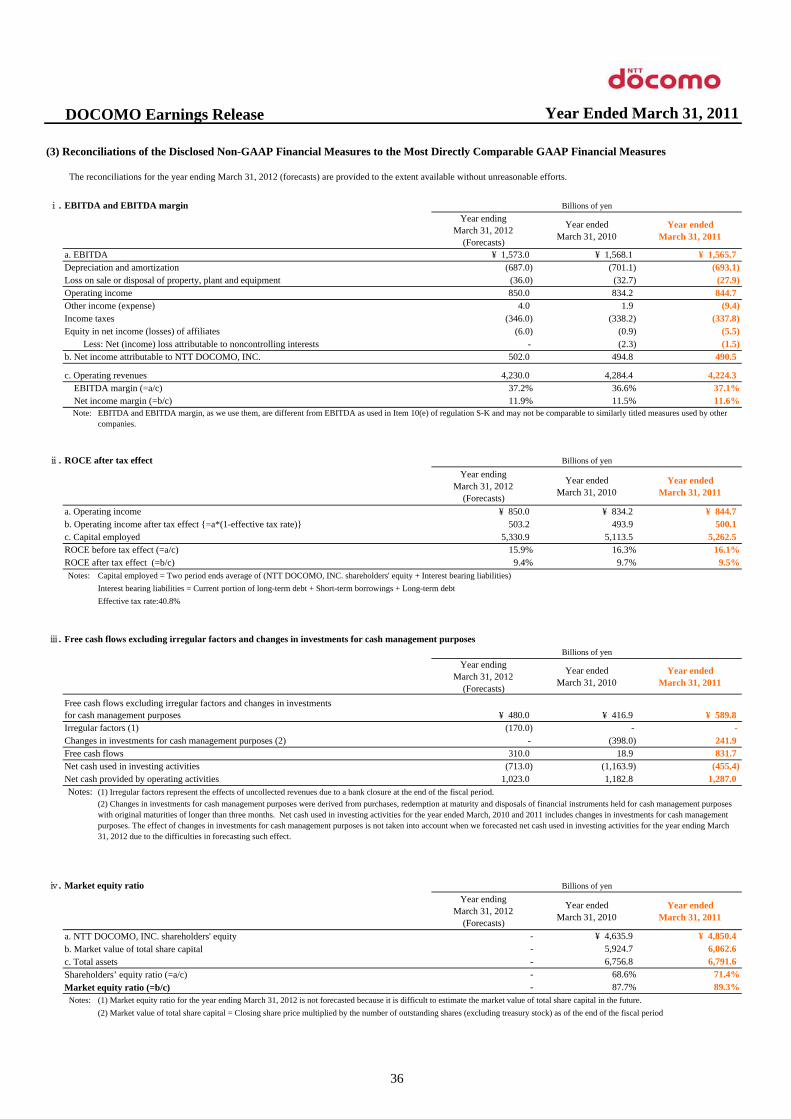
DOCOMO Earnings Release Year Ended March 31, 2011
The reconciliations for the year ending March 31, 2012 (forecasts) are provided to the extent available without unreasonable efforts.
ⅰ. EBITDA and EBITDA margin Billions of yenYear ending
March 31, 2012(Forecasts)
Year endedMarch 31, 2010
Year endedMarch 31, 2011
a. EBITDA ¥ 1,573.0 ¥ 1,568.1 ¥ 1,565.7(687.0) (701.1) (693.1)
(36.0) (32.7) (27.9)850.0 834.2 844.7
4.0 1.9 (9.4)(346.0) (338.2) (337.8)
(6.0) (0.9) (5.5)- (2.3) (1.5)
502.0 494.8 490.5
4,230.0 4,284.4 4,224.337.2% 36.6% 37.1%11.9% 11.5% 11.6%
Note:
ⅱ. ROCE after tax effect Billions of yen
Year endingMarch 31, 2012
(Forecasts)
Year endedMarch 31, 2010
Year endedMarch 31, 2011
¥ 850.0 ¥ 834.2 ¥ 844.7503.2 493.9 500.1
5,330.9 5,113.5 5,262.515.9% 16.3% 16.1%
9.4% 9.7% 9.5%Notes: Capital employed = Two period ends average of (NTT DOCOMO, INC. shareholders' equity + Interest bearing liabilities)
Interest bearing liabilities = Current portion of long-term debt + Short-term borrowings + Long-term debtEffective tax rate:40.8%
ⅲ. Free cash flows excluding irregular factors and changes in investments for cash management purposesBillions of yen
Year endingMarch 31, 2012
(Forecasts)
Year endedMarch 31, 2010
Year endedMarch 31, 2011
¥ 480.0 ¥ 416.9 ¥ 589.8(170.0) - -
- (398.0) 241.9310.0 18.9 831.7
(713.0) (1,163.9) (455.4)1,023.0 1,182.8 1,287.0
Notes: (1) Irregular factors represent the effects of uncollected revenues due to a bank closure at the end of the fiscal period.
ⅳ. Market equity ratio Billions of yenYear ending
March 31, 2012(Forecasts)
Year endedMarch 31, 2010
Year endedMarch 31, 2011
a. NTT DOCOMO, INC. shareholders' equity - ¥ 4,635.9 ¥ 4,850.4b. Market value of total share capital - 5,924.7 6,062.6c. Total assets - 6,756.8 6,791.6Shareholders’ equity ratio (=a/c) - 68.6% 71.4%Market equity ratio (=b/c) - 87.7% 89.3%
Notes:(2) Market value of total share capital = Closing share price multiplied by the number of outstanding shares (excluding treasury stock) as of the end of the fiscal period
a. Operating incomeb. Operating income after tax effect {=a*(1-effective tax rate)}c. Capital employed
Irregular factors (1)
Net cash provided by operating activities
(1) Market equity ratio for the year ending March 31, 2012 is not forecasted because it is difficult to estimate the market value of total share capital in the future.
ROCE before tax effect (=a/c)ROCE after tax effect (=b/c)
EBITDA and EBITDA margin, as we use them, are different from EBITDA as used in Item 10(e) of regulation S-K and may not be comparable to similarly titled measures used by othercompanies.
b. Net income attributable to NTT DOCOMO, INC.
c. Operating revenues EBITDA margin (=a/c) Net income margin (=b/c)
Other income (expense)Income taxesEquity in net income (losses) of affiliates Less: Net (income) loss attributable to noncontrolling interests
Depreciation and amortizationLoss on sale or disposal of property, plant and equipmentOperating income
(3) Reconciliations of the Disclosed Non-GAAP Financial Measures to the Most Directly Comparable GAAP Financial Measures
Free cash flows excluding irregular factors and changes in investmentsfor cash management purposes
(2) Changes in investments for cash management purposes were derived from purchases, redemption at maturity and disposals of financial instruments held for cash management purposeswith original maturities of longer than three months. Net cash used in investing activities for the year ended March, 2010 and 2011 includes changes in investments for cash managementpurposes. The effect of changes in investments for cash management purposes is not taken into account when we forecasted net cash used in investing activities for the year ending March31, 2012 due to the difficulties in forecasting such effect.
Changes in investments for cash management purposes (2)Free cash flowsNet cash used in investing activities
36
Related Documents