AAMJAF, Vol. 6, No. 2, 35–56, 2010 © Asian Academy of Management and Penerbit Universiti Sains Malaysia, 2010 EARNINGS MANAGEMENT THRESHOLDS: THE CASE IN TUNISIA Anis Ben Amar 1* and Ezzeddine Abaoub 2 1 Graduate Business School of Sfax, University of Sfax Airport Road km 4.5 – BP, n 1081-3018, Sfax Tunisia 2 Faculty of Economics Sciences and Management of Tunis, University of Tunis El Manar C.P. 2092 Tunis, El Manar – Tunisia * Corresponding author: [email protected] ABSTRACT Degeorge, Patel and Zeckhauser (1999) show that companies willingly manage their earnings with the aim of meeting or exceeding three earnings targets: zero earnings, last period’s earnings, and analysts' earnings forecasts. In this paper, we focus on earnings management designed to achieve the above earnings thresholds within the framework of the Tunisian market. Applying Burgstahler and Dichev’s (1997) methodology type to the annual data corresponding to the period from 1997 to 2004, our results indicate that Tunisian companies managed earnings to avoid losses and earnings decreases rather than to avoid negative earnings surprises. Keywords: Earnings management, earnings thresholds, earnings distributions and JEL classification: M41 INTRODUCTION It is worth noting that the collapse of Enron and WorldCom in the USA has drawn the attention of numerous researchers in the field of accounting to the issues of earnings management and accounting information transparency (Stubben, 2008). In this respect, several relevant studies (e.g., Degeorge et al., 1999; Brown & Caylor, 2005) have provided systematic evidence of some earnings management objectives that seem to be rather financial market-oriented. Indeed, managers often tend to manipulate accounting information in such manners as to influence the way through which investors view or assess their firms (Degeorge et al., 1999). Among these relevant studies, we can distinguish a ASIAN ACADEMY of MANAGEMENT JOURNAL of ACCOUNTING and FINANCE

Welcome message from author
This document is posted to help you gain knowledge. Please leave a comment to let me know what you think about it! Share it to your friends and learn new things together.
Transcript
AAMJAF, Vol. 6, No. 2, 35–56, 2010
© Asian Academy of Management and Penerbit Universiti Sains Malaysia, 2010
EARNINGS MANAGEMENT THRESHOLDS:
THE CASE IN TUNISIA
Anis Ben Amar1*
and Ezzeddine Abaoub2
1Graduate Business School of Sfax, University of Sfax
Airport Road km 4.5 – BP, n 1081-3018, Sfax Tunisia 2Faculty of Economics Sciences and Management of Tunis,
University of Tunis El Manar
C.P. 2092 Tunis, El Manar – Tunisia
*Corresponding author: [email protected]
ABSTRACT
Degeorge, Patel and Zeckhauser (1999) show that companies willingly manage their
earnings with the aim of meeting or exceeding three earnings targets: zero earnings, last
period’s earnings, and analysts' earnings forecasts. In this paper, we focus on earnings
management designed to achieve the above earnings thresholds within the framework of
the Tunisian market. Applying Burgstahler and Dichev’s (1997) methodology type to the
annual data corresponding to the period from 1997 to 2004, our results indicate that
Tunisian companies managed earnings to avoid losses and earnings decreases rather
than to avoid negative earnings surprises.
Keywords: Earnings management, earnings thresholds, earnings distributions and JEL
classification: M41
INTRODUCTION
It is worth noting that the collapse of Enron and WorldCom in the USA has
drawn the attention of numerous researchers in the field of accounting to the
issues of earnings management and accounting information transparency
(Stubben, 2008). In this respect, several relevant studies (e.g., Degeorge et al.,
1999; Brown & Caylor, 2005) have provided systematic evidence of some
earnings management objectives that seem to be rather financial market-oriented.
Indeed, managers often tend to manipulate accounting information in such
manners as to influence the way through which investors view or assess their
firms (Degeorge et al., 1999). Among these relevant studies, we can distinguish a
ASIAN ACADEMY of
MANAGEMENT JOURNAL
of ACCOUNTING
and FINANCE
Anis Ben Amar and Ezzeddine Abaoub
36
tendency towards the strategy of earnings management to achieve certain earning
thresholds (Burgstahler & Dichev, 1997; Degeorge et al., 1999; Moehrle, 2002;
Holland & Ramsay, 2003; Moreira & Pope, 2007; Jacob & Jorgensen, 2007; Lee,
2007; Charoenwong & Jiraporn, 2009; Caramanis & Lennox, 2008).
Accordingly, firm managers try to run their earnings in such a way as to attain, or
rather exceed, the following three thresholds: zero, last period's earnings, and
consensus analysts' forecasts. The above-mentioned studies have generally
presented empirical distributions of scaled earnings changes, earnings surprises,
and earnings levels. To test the statistical significance of the hypothesised
avoidance of earnings decreases, losses and surprises, they used a statistical test
with the assumption that, under the null hypothesis of no earnings management,
the distributions of scaled earnings changes, surprises and levels are relatively
smooth. They find graphical and statistical evidence (for each threshold earning
studied) that there is a disproportionately low frequency in the partition
immediately to the left of zero and a disproportionately high frequency in the
partition that includes zero. Noteworthy, however, is that most of these empirical
works were focused on Anglo-Saxon countries characterised by outsider
economies with relatively dispersed ownership, strong investor protection, and
large stock markets (Leuz, Nanda & Wysocki 2003; Othman & Zeghal, 2006).
Leuz et al. (2003), for instance, provide evidence based on a cross-country
analysis that outsider economies present lower levels of earnings management
than the insider countries with relatively concentrated ownership, weak investor
protection, and less-developed stock markets. To the best of our knowledge, only
a little attention has been paid to earnings-management motives in countries
characterised by a debt-dominated capital market with concentrated ownership
(Othman & Zeghal, 2006).1
The study of earnings management in Tunisia's emerging stock market is
important for several reasons. First, the country's corporate shareholding is highly
concentrated, and there is a relatively average level of investor protection and
slow Stock Exchange development, despite intense efforts aiming to promote it
(Madani & Sammari, 2009). Accordingly, in this context, the magnitude of
earnings management is greater (Leuz et al., 2003). Second, the Tunisian
accounting system, adopted in 1997, has been inspired by the international
accounting system. The latter leaves a large discretionary margin for managers in
the elaboration of their companies' financial statements. In fact, managers possess
means and possibilities to manage earnings by exploiting the accounting
flexibility permitted under the Generally Accepted Accounting Principles
(GAAP). Indeed, Abaoub and Ben Amar (2008) have discovered that Tunisian
company managers, in their determination to maximise shareholders' wealth,
often try to cause damage to some company's stakeholders by resorting to some
1 This type of financial environment exists in Japan and several European countries.

Earnings Management Thresholds
37
earnings manipulation practices. Third, with an experience of about 14 years in
the application of standards close to the IAS norms, Tunisia serves as a
trustworthy example, supplying results for similar accounting systems, notably
the south Mediterranean countries that have just recently begun or plan to apply
the IAS standards.
Thus, by focusing on earnings management thresholds as a subject matter
of research in a specific country environment different from that of the Anglo-
Saxon countries, we can raise the main question of our research: given the strong
emphasis on meeting or beating earnings targets, do firms "manage" earnings to
meet these targets? Hence, within the framework of this research, we aim at
providing some evidence and reaching two objectives:
(i) To investigate whether earnings management is done to meet or exceed the
three earnings targets: zero earnings, last period's earnings and analysts'
earnings forecasts, and
(ii) To examine the effect of the Tunisian institutional setting in meeting the
earnings targets.
We first proceed by examining a distribution of reported earnings around
key earnings thresholds to observe discontinuities in the distribution. Second,
following Burgstahler and Dichev (1997), we compute the test statistic to
illustrate and test for discontinuities in the distribution.
The empirical evidence obtained from this study shows a discontinuity
around zero for levels and changes in earnings, which is suggestive of earnings
management to avoid reporting losses and earnings decreases. Our results, in
general, corroborate the findings of Burgstahler and Dichev (1997). Yet, contrary
to the work of Degeorge et al. (1999), our research does not provide any evidence
of account manipulation that might allow for avoiding negative earnings
surprises.
Our results are important for several reasons. First, the institutional
setting of this paper is a debt-dominated financial market with concentrated
ownership (that of Tunisia), whereas prior earnings management threshold
studies have mostly dealt with equity-dominated markets (Anglo Saxon context).
It suggests that earnings management with the aim of exceeding thresholds does
exist in different legal and accounting environments and that the results might be
country-specific. Second, our findings have important implications for the
Tunisian regulators as well as those of other emerging countries.

Anis Ben Amar and Ezzeddine Abaoub
38
The remaining part of this article is organised as follows. In the next
section, we discuss Tunisia's institutional background, followed by a brief review
of the literature relevant to the current study. Next, we formulate the research
hypotheses, continued with the discussion of the methodology pursued for
empirical research as well as the obtained results and presentation of additional
analyses. The last section provides a conclusion and suggests future research.
INSTITUTIONAL SETTING/BACKGROUND
The Tunisian Financial Reporting Environment
The examination of accounting history allows us to notice that the accounting
rules in Tunisia have exhibited remarkable progress. We differentiate between
three periods (Thabet, 2000):
(i) Before 1968
(ii) From 1968 to 1997
(iii) From 1997 to present
During the first period (before 1968) the Tunisian accounting was based on the
1947 and 1957 French accounting plans. Later from the year 1968 to 1997, the
general accounting plan (PCG) published by the first Tunisian counsellor (High
accounting counsellor) was used. This accounting plan was, however, not legally
imposed. The third period which is from 1997 to the present is the third event
characterising the accounting rule in Tunisia is the promulgation of the
30/12/1996 law relative to the companies' accounting systems.
According to the fourth article of the previously mentioned law: "The
accounting system includes an accounting conceptual framework and standards.
It forms an intermingled entity". The Tunisian accounting system adopted in
1997 has been inspired by the international accounting system. A total of 41
accounting standards have been pronounced. Accounting earnings are linked to
fiscal rules (Madani & Sammari, 2009). This accounting system leaves a large
discretionary margin for managers in the elaboration of their companies' financial
statements. In fact, managers possess means and possibilities to manage earnings
by exploiting the accounting flexibility permitted under the GAAP.
Financial System of Tunisian Companies
The Tunisian capital market can be viewed as a concentrated bank-dominated
system, compared to the Anglo-Saxon capital market, which is characterised by
Earnings Management Thresholds
39
equity-dominated markets (Kasanen, Kinnunen and Niskanen 1996). In fact, the
financing mode of Tunisian companies is based to a large extent on bank loans
(Madani & Sammari, 2009). Thus, banks have a substantial influence on the
decision making of the firms.
Ownership Structure
If the Anglo-Saxon capital market can be characterised by equity-dominated
markets with a diffuse ownership structure, the Tunisian Companies are
characterised by a concentrated ownership structure. In fact, there are majority
shareholders who represent a majority or important monitoring blocks (Kouki &
Guizani, 2009).2 The shareholders' capital is made up of family firms as well as
other companies (industrial or financial groups) or simply the State (Madani &
Sammari, 2009). "Because capital provided by banks is very significant,
managers pay little attention to the relatively small number of individual and
minority shareholders" (Othman & Zeghal, 2006, p. 410), which is explained by
the opaque nature of the firms' disclosure policies and their shortage of
transparency (Matoussi and Chakroun, 2007).
LITERATURE REVIEW
In recent years, earnings management has received considerable attention from
regulators, practitioners and academicians. Leuz et al. (2003, p. 506) define
earnings management as being the "alteration of firms' reported economic
performance by insiders either to mislead some stakeholders or to influence
contractual outcomes". "Fraudulent financial reporting is distinguishable from
earnings management in respect of the acceptability of accounting treatment
under the GAAP" (Hasnan et al., 2009, p. 2). Nevertheless, the financial situation
does not reflect the true and fair view of the real situation of the company
(Dechow, Sloan & Sweeney, 1996). Previous authors have identified several
potential managerial motivations for earnings management policy, including
influencing capital market outcomes, influencing compensation or debt contracts
and influencing regulatory outcomes (Healy, 1985; Dechow & Sloan, 1991;
McNichols & Wilson, 1988, Duke & Hunt, 1990; Watts & Zimmerman, 1978;
Hagerman & Zmijewski, 1979). Thus, a wide array of models was used to
capture earnings management (Dechow et al., 1995; McNichols, 2000, 2002;
Kothari, Leone & Wasley, 2005; for a review of model features).
2 Kouki and Guizani (2009) show that, in the Tunisian context, the ownership structure is affected by
institutional investors (on average, they hold 35% of the capital).
Anis Ben Amar and Ezzeddine Abaoub
40
As highlighted in the introduction, Burgstahler and Dichev (1997) and
Degeorge et al. (1999) have adopted an alternative approach to examining
earnings management. For instance, Degeorge et al. (1999) suggest that firms
manage reported earnings for three major purposes, namely, to avoid losses, to
avoid earnings decreases, and to meet analysts' earnings expectations. Two
reasons were advanced to explain and support this trend: the prospect theory and
the transaction cost theory.
The prospect theory developed by Kahneman and Tversky (1979)
assumes that decision-makers often establish their assessments on the bases of
gains and losses published in relation to a certain reference point rather than
according to the final level of wealth. In addition, this theory also suggests that
the individuals' utility functions take a concave curve corresponding to gains and
a convex one for losses. Thus, via a certain increase of wealth, the corresponding
increase in value and utility is higher at the moment when wealth increases shift
the individual from a state of loss into a state of gain, concerning a certain
reference point. Hence, the managers' temptations are to avoid negative earnings
variations as well as the nil result (zero).
The transaction cost theory is based on the following two assumptions
(Burgstahler and Dichev, 1997):
(i) Information about profits affects transaction terms concluded between a
firm and its stakeholders. Specifically, these transaction terms are generally
more profitable for those companies that publish higher profits.
(ii) As warehousing, covering and data processing costs are too high, they are
likely to induce some stakeholders to focus on simple heuristics as being
either nil levels or nil variations of profits in the case of decision-making.
Jointly, both suppositions imply that a company that broadcasts a profit
decrease bears higher transaction costs than in the case when it proclaims profit
increases. Thus, such suppositions provide clear explanations of some managers'
motivations to avoid earnings decreases as well as publishing losses.
In addition to the above-mentioned theories, we can also cite other
factors that provide further explanations for earnings management threshold
motivations. First, DeAngelo, DeAngelo and Skinner (1996) have noted that
companies that do not present regularly increasing earnings (i.e., the earnings
growth curve is broken) are more likely to witness consecutive declines in Stock
Exchange rates. Second, according to Myers and Skinner (2002), market
mediators and intervening parties generally tend to focus essentially on firms
publishing regularly increasing earnings. The idea is that investors tend to grant a

Earnings Management Thresholds
41
significant premium to such a category of firms. Hence, the longer the growth
period is, the more important the premium becomes. The last two points raised
may serve as explanations to the managers' motivation to present an increasing
series of earnings. In other words, the earnings management applied by managers
allows them to avoid earnings decreases and losses. Third, Bartov, Givoly and
Hayn (2002) put forward the idea that the market grants a premium (in the form
of Stock Exchange profitability) to firms capable of achieving quarterly earnings
that are equal or superior to analysts' forecasts. Moreover, companies whose
earnings "constitute favourable surprises show, in subsequent years, a higher
growth in sales and earnings than firms with the same earnings performance but
with unfavourable earnings surprises" (p. 203). These mentioned authors also
observe that firms that have presented earnings equal or higher to analysts'
forecasts via accounting manipulations have also recorded a Stock Exchange
profitability higher than those observed for firms whose published earnings are
located below analysts' forecasts. This outcome brings about a motivation to run
their firms in such an efficient way so as to attain or even exceed the level
foreseen by financial analysts.
HYPOTHESES DEVELOPMENT
Agency problems due to the separation of ownership and management are not
severe in family firms (Type I agency problems) (Ali, Chen & Radhakrishnan,
2007). Earnings manipulation due to these Type I agency problems is likely to
occur to a less extent in family firms. These firms face, however, severe agency
problems that arise between controlling and non-controlling shareholders (Type
II agency problems) (Ali et al., 2007). These Type II agency problems may lead
to earnings management. Managers seek, for example, "to hide the adverse
effects of related party transactions or to facilitate family members' entrenchment
in management positions" (Ali et al., 2007, p. 239).
Accounts manipulation is not carried out to resolve agency problems that
arise from the separation of ownership and management. In fact, the asymmetry
of information is not relatively unimportant because monitoring shareholders
tend to possess undiversified and concentrated equity position in their firms. In
the Tunisian context, where companies generally have a monitoring shareholder,
managers are motivated to use managerial discretion to modify the perception of
the company's financial situation (Breton & Schatt, 2003; Graham, Harvey &
Rajgopal, 2005, Bowen, DuCharme & Shores, 1995, 2008; Raman & Shahrur,
2008) on which stakeholders rely (e.g., tax administration, banks, employees, and
customers). Due to Type II agency problems arising between controlling and
non-controlling shareholders, managers seek also "to hide the adverse effects of
related party transactions or to facilitate family members' entrenchment in
Anis Ben Amar and Ezzeddine Abaoub
42
management positions" (Ali et al., 2007, p. 239). If firm mangers find out that the
earnings figures (earnings before any incremental manipulation) are lower than
zero or lower than those of the previous year, they will be more motivated to
avoid earnings decreases and losses. Accordingly, our primary hypotheses (in
alternative form) are as follows:
H1: Managers seek to avoid losses.
H2: Managers seek to avoid earnings decreases.
The Anglo-Saxon capital market can be characterised by equity-dominated
markets with a diffuse ownership structure. Accordingly, shareholders, financial
analysts, and the financial press put great pressure on managers (Othman &
Zeghal, 2006, p. 411). Thus, they have a substantial influence on the decision-
making of firms. Prior studies (Degeorge et al., 1999) have shown that managers
increase earnings to avoid, for example, negative earnings surprises. The idea is
that the market tends to grant a significant premium to such a category of firms
(Bartov et al., 2002).
The large majority of Tunisian firms are family- or state-owned. Like in
France, "equity is not diffused among the public and the capital market has a less
important role in providing finance compared to banks that finance firms through
loans" (Othman & Zeghal, 2006). Compared to many other countries (e.g., the
US), managers' motivation to manipulate earnings in trying to influence the way
through which investors view or assess their firms is not relevant in the Tunisian
context. Thus, we expect that the Tunisian managers are not likely to avoid
negative earnings surprises. The following hypothesis in its alternative form can
be stated as follows:
H3: Managers do seek to avoid negative earnings surprises.
DATA AND EMPIRICAL DESIGN
Sample
The population comprises Tunisian companies listed in the Tunis Stock
Exchange. Despite the advantages of the quotation in the Stock Exchange, the
latter has suffered, for some years, from a limited number of highly rated
companies. There are approximately 50 companies listed on the Tunis Stock
Exchange. The financial institutions as well as companies belonging to particular
regulation industries were excluded for reasons of specificity of their accounting
rules (Burgstahler & Dichev, 1997; Brown & Caylor, 2003). Thus, by eliminating
such companies, our empirical study will only comprise 26 listed Tunisian
Earnings Management Thresholds
43
companies. The annual net earnings, the analysts' forecasts as well as the total
assets were obtained from the following sites: "Stock Exchange of Tunis",
"Tunisie Valeurs" and "Tustex". Due to some missing data and introduction years
relevant to some firms listed in the Tunis Stock Exchange, our final sample
consists of just 132 "firm-years" over the period ranging from 1997 to 2004.3 The
chosen companies prevail in four sectors: industry, service, business and travel.
Earnings Management Threshold Variables
As mentioned previously, the examination of the literature, especially
Burgstahler and Dichev (1997) and Degeorge et al. (1999), has enabled us to
deduce that earnings management thresholds are based upon the desire to achieve
zero earnings as well as earnings N-1 (the results of the previous year) and the
analysts' forecasts.
We define earnings levels as annual net earnings to measure our first
threshold, which is avoiding losses. Annual net earnings changes are defined as
net earnings in N minus net earnings in N-1 to measure our second threshold,
which is avoiding earnings decreases. Earnings surprises are defined as reported
annual net earnings N minus the consensus analyst forecast to measure our third
threshold, which is avoiding negative earnings surprises. We deflate earnings
levels, earnings changes and earnings surprises by the firm's total assets (Mard,
2004) for the sake of reducing the problem of heteroscedasticity.4 Hence, for
every company and for every exercise of the period (1997–2004), we calculated
the following ratios:
3 We are limited to this period, as we do not have any analysts' earnings forecasts available for a more recent
period. 4 In this frame, several approaches were used in the relative accounting and financial literature. Note, for
instance, the market value, the accounting value and sales or total assets (Burgstahler & Dichev, 1997), p. 102.
Net earning N
Total assets N
Net earning N – Net earning N-1
Total assets N
Net earning N – consensus analyst forecast
Total assets N

Anis Ben Amar and Ezzeddine Abaoub
44
RESEARCH METHODOLOGY
The extant literature suggests that firms tend to manipulate accounting numbers
to achieve certain earnings thresholds. To focus on this tendency at the level of
the Tunisian firms' practices, we examine earnings management by employing
"the distributions of earnings method".5 This method, developed by Burgstahler
and Dichev (1997), constitutes an innovative approach to testing for earnings
management. They recommend undergoing a statistical test, which, under the
hypothesis of earnings management absence, indicates that the empirical
distributions of earnings levels, earnings changes and earnings surprises are
relatively smooth.
The mentioned statistical test consists of making the difference between
the actual number of observations and the number of expected ones in an interval
i (to the left of zero) divided by the estimated standard deviation of this
difference. Specifically, the statistical test, as developed by Burgstahler and
Dichev (1997), is formulated as follows:
DS (standardised difference)
= (ni – ni *)/standard deviation of the difference,
where
ni: the number of observations falling in interval i,
ni*: the expected number of observations in interval i, which equals the
average of observations noticed in the intervals i-1 and i+1,
Standard deviation of the difference =
[Npi (1– pi) + ¼ N (pi-1 + pi+1) (1– pi-1 – pi+1)] ½,
where N is the total number of observations in the sample and pi is the probability
that an observation is likely to fall into in interval i. The negative values of DS,
which are equal or superior in absolute value to 2.33, indicate the evidence of
earnings management to achieve thresholds (p-value = 0.01 in a normalised
distribution) (Brown & Caylor, 2005).
Based on the works of Burgstahler and Dichev (1997) as well as those of Brown
and Caylor (2003), we consider a threshold with highly negative values of DS as
being proof of the existence of a more important earnings management.
5 "This approach was further developed by Burgstahler and Dichev (1997), and since then, a substantial
volume of new research has applied this methodology to alternative earnings thresholds and in different operational settings" (Holland & Ramsay, 2003).

Earnings Management Thresholds
45
As already mentioned, several studies (Burgstahler & Dichev, 1997; Degeorge et
al., 1999) "have examined the distribution of reported earnings to assess whether
there is any evidence of earnings management" (Healy & Wahlen, 1999, p. 379).
These studies have important appealing features (Healy & Wahlen, 1999). The
previous research investigates earnings management through discretionary
accruals (Jones, 1991; Dechow et al., 1995). A number of papers have questioned
the reliability and power of this approach (McNichols, 2000). Burgstahler and
Dichev (1997) and Degeorge et al. (1999) contribute an innovative approach to
testing for earnings management by focusing on the distribution of reported
earnings. First, the authors do not have to estimate discretionary accruals; instead,
they inspect the distribution of reported earnings for abnormal discontinuities at
certain thresholds (Healy & Wahlen, 1999). Second, "the power of their approach
comes from the specificity of their predictions regarding which group of firms
will manage earnings, rather than from a better measure of discretion over
earnings" (McNichols, 2000, p. 336). Third, this approach captures the effects of
earnings management through cash flows, which may not be captured by
discretionary accrual measures (Healy & Wahlen, 1999). This methodology also
presents drawbacks. First, "the distribution approach per se is silent on the
approach applied to manipulate earnings. Second, it is also silent on the
incentives for management to achieve specific benchmarks" (McNichols, 2000,
p. 337).
EMPIRICAL RESULTS
The propensity to achieve earnings thresholds has been underlined by the
accounting literature, notably by such authorities as Burgstahler and Dichev
(1997), Degeorge et al. (1999), Holland and Ramsay (2003), Brown and Caylor
(2003), Jacob and Jorgensen (2007), Lee (2007), Caramanis and Lennox (2008),
and Charoenwong and Jiraporn (2009). In what follows, we shall confirm,
empirically, the propensity to avoid losses, earnings decreases and negative
earnings surprises.
Earnings Management to Avoid Losses: Graphical Analysis
Empirical distribution of earnings
Table 1 provides descriptive statistics for the scaled earnings. The total number
of observations is 132. The mean (median) earning is 0.037 (0.044).

Anis Ben Amar and Ezzeddine Abaoub
46
Table 1
Distribution Characteristics of the Sample's Annual Net Earnings
N 132 observations
Mean 0.037
Median 0.044
Skewness –1.297
Kurtosis 11.657
Figure 1 presents the distribution of the net annual earning divided by the total
assets, where each stick of histograms has a width of 0.03. The sample
characteristics are as follows:
Figure 1: Empirical Distribution of the Annual Net Earning (Scaled by Total Assets).
The following distribution has the shape of a bell. It has an asymmetric tail
extending out to the left that is referred to as negatively skewed or skewed to the
left.6 The positive coefficient of concentration indicates a stronger concentration
of the observations than that observed in the normal distribution, meaning that
the distribution is less flattened than a normal distribution.
Figure 1 indicates two major points reflecting managers' desires to avoid losses:
(i) The observed distribution presents a jump of the density at the point zero,
which enables us to confirm the earnings management to avoid losses. In
this respect, it clearly appears that managers have a strong desire to publish
positive earnings.
6 The "skewness" refers to the asymmetry of the distribution.

Earnings Management Thresholds
47
(ii) Similarly, these results depict an ascending knot in the distribution of
earnings starting from –0.06 to –0.03, which indicates that managers have a
desire to "avoid red ink".7
The propensity to avoid losses: The test of Burgstahler and Dichev (1997)
The propensity test designed to avoid publishing losses consists, primarily, of
making the difference between the actual number of observations and the number
of expected ones in an interval i (to the left of zero) divided by the estimated
standard deviation of this difference. Then the second stage consists of
comparing the value of this DS to 2.33. Indeed, some negative values8 of DS,
which are in absolute value equal or superior to 2.33, indicate an earnings
management designed to achieve thresholds.
As far as this study is concerned, the value of the standardised difference
equals –3.28 ( DS > 2.33). The negative value of DS indicates that the frequency
in the partition immediately below zero, the –1 partition (to the left of zero), is
significantly lower than expected. The evidence of earnings management to avoid
losses is statistically significant. Consequently, the hypothesis of non-earnings
management can be rejected. This result indicates that Tunisian company
managers are involved in earnings management to avoid losses. H1 is therefore
accepted.
Earnings Management to Avoid Earnings Decreases: Graphical Analysis
Empirical distribution of earnings changes
Table 2 shows descriptive statistics for the scaled earnings change variable. The
total number of observations is 132. The mean and median earnings changes are
positive (0.001).
Table 2
Distribution Characteristics of the Sample's Annual Net Earnings Variations
N 132 observations
Mean 0.001
Median 0.001
Skewness 0.215
Kurtosis 8.683
7 Managers want to avoid the critical situation that they might find themselves in. The same expression was
used by Degeorge et al. (1999, p. 22). 8 That is to say, the number of expected observations is superior to the actual number of observations.

Anis Ben Amar and Ezzeddine Abaoub
48
Figure 2 below presents the distribution of the annual net earnings changes
divided by the total assets, where each stick of histograms has a width of 0.01.
The sample's characteristics are the following:
Figure 2: Empirical Distribution of Changes in Annual Net Earnings (Scaled by Total
Assets).
The following distribution has the shape of a bell. For this data set, the skewness
is 0.215, and the kurtosis is 8.683, which indicates moderate skewness and
kurtosis. The coefficient of a weak symmetry in the absolute value indicates a
balanced distribution between the strongly negative values (three observations
lower than 8%) and the strongly positive values (two observations superior to
10%). However, the largely positive concentration coefficient indicates a
concentration of observations around the average.
According to the results achieved by the works of Burgstahler and
Dichev (1997), Degeorge et al. (1999), Brown and Caylor (2003) and Jacob and
Jorgensen (2007), to "avoid earnings decreases" constitutes an important
threshold to be targeted by managers. Indeed, the empirical distribution shows a
jump in the density to the point zero, which enables us to confirm earnings
management to avoid earnings decreases.
Propensity to avoid earnings decreases: Test of Burgstahler and Dichev (1997)
As far as this study is concerned, the value of the standardised difference is equal
to –2.504 ( DS > 2.33). The negative value of DS indicates that the frequency in
the partition immediately below zero, the –1 partition (to the left of zero), is
significantly lower than expected. The evidence of earnings management to avoid
earnings decreases is statistically significant. As a consequence, the hypothesis of
non-earnings management can be rejected. This result indicates that managers of

Earnings Management Thresholds
49
Tunisian firms do adopt earnings management to avoid earnings decreases. Thus,
H2 is confirmed.
Earnings Management to Avoid Negative Earnings Surprises:
Graphical Analysis
Empirical distribution of earnings surprises
Table 3 shows descriptive statistics for the scaled earnings surprises variable. The
total number of observations is 132. The mean and median earnings surprises are
negative.
Table 3
Distribution Characteristics of the Sample's Annual Net Earnings Surprises
N 132 observations
Mean –0.018
Median –0.005
Skewness –1.784
Kurtosis 10.473
Figure 3 presents the distribution of the net annual earnings surprises divided by
the total assets, where each stick of histograms has a width of 0.01. The depicted
sample characteristics are the following:
Figure 3: Empirical Distribution of the Net Annual Earnings Surprises (Standardised by
Total Assets).
The following distribution has the shape of a bell. However, the negative
coefficient of symmetry indicates a greater dispersal of negative values
Anis Ben Amar and Ezzeddine Abaoub
50
(11 observations lower than 8%) than positive values (five observations superior
to 4%). The positive concentration coefficient indicates a stronger concentration
of the observations than that observed in the normal distribution, which means
that the distribution is less flattened than a normal distribution.
Notably, the observed distribution does not reflect any net irregularity to
the neighbourhood of zero. Contrary to the results reached by Degeorge et al.
(1999, 2007), Brown and Caylor (2003, 2005) and Lee (2007), to "avoid negative
earnings surprises" does not constitute an important threshold for the Tunisian
firms' managers. Hence, the hypothesis of manipulating accounts so as to avoid
negative earnings surprises does not seem relevant to the Tunisian context.
Propensity to avoid negative earnings surprises: Test of Burgstahler
and Dichev (1997)
The value of the standardised difference appears to be positive in this study (1.2).
The positive value of DS indicates that the frequency in the partition immediately
below zero, the –1 partition (To the left of zero), is significantly higher than
expected. The evidence of earnings management to avoid negative earnings
surprises is statistically non-significant. Therefore, the non-earnings management
hypothesis can be retained. This result indicates that managers of Tunisian firms
are not involved in earnings management to avoid negative earnings surprises.
ADDITIONAL ANALYSIS: DOES SCALING INDUCE THE
DISCONTINUITIES?
The discontinuities at zero in the distribution may be induced by the scaling
procedures used (Jacob & Jorgensen, 2007). Therefore, we conduct further
analyses to verify the robustness of our results. The results are presented in
Figures 4, 5 and 6. It seems to us that results found in the previous section remain
widely unchanged. The results do not support the Durtschi and Easton (2005)
assertions that the Burgstahler and Dichev (1997) and Degeorge et al. (1999)
results on the discontinuity at zero in the distribution of earnings, earnings
changes and earnings surprises are attributable to scaling.

Earnings Management Thresholds
51
Figure 4: Empirical Distribution of the Annual Net Earning (Scaled by Sales).
The deviation from expected frequency is significantly negative in partition –1
(To the left of zero, standardised difference of –4.838, DS > 2.33).
Figure 5: Empirical Distribution of Changes in Annual Net Earnings (Scaled by Sales).
The deviation from expected frequency is significantly negative in partition –1
(to the left of zero, standardised difference of –2.67, DS > 2.33).
Anis Ben Amar and Ezzeddine Abaoub
52
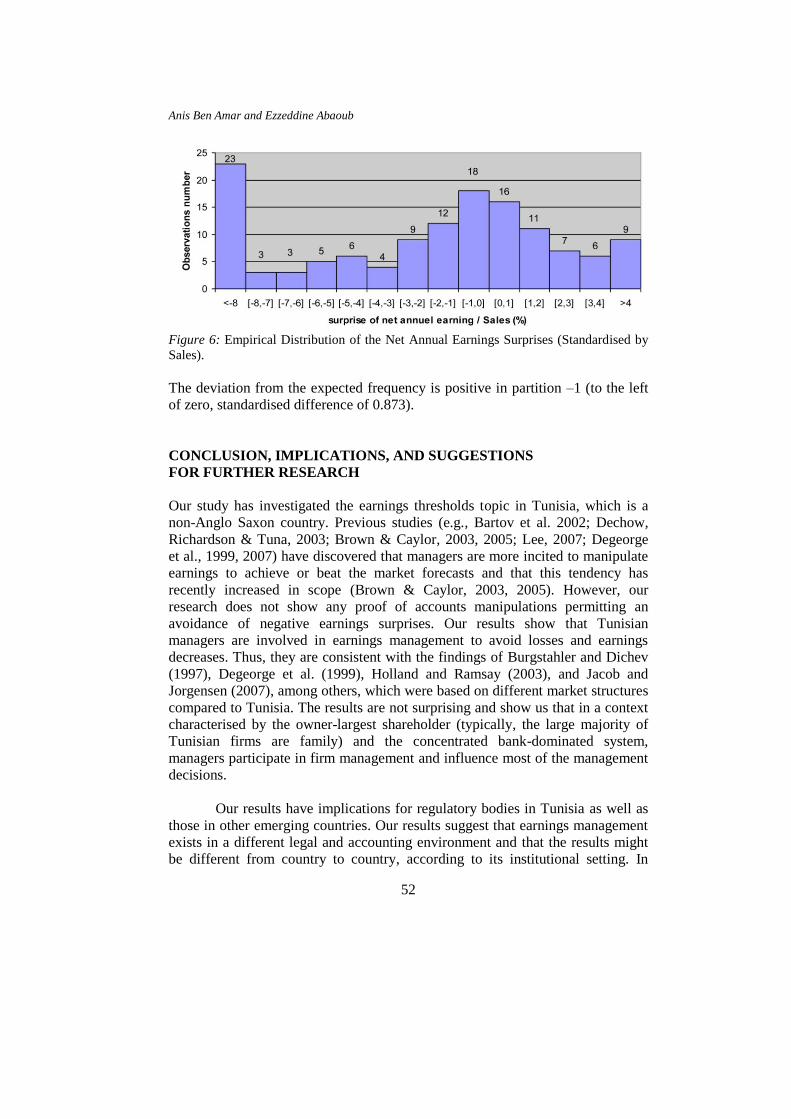
Figure 6: Empirical Distribution of the Net Annual Earnings Surprises (Standardised by
Sales).
The deviation from the expected frequency is positive in partition –1 (to the left
of zero, standardised difference of 0.873).
CONCLUSION, IMPLICATIONS, AND SUGGESTIONS
FOR FURTHER RESEARCH
Our study has investigated the earnings thresholds topic in Tunisia, which is a
non-Anglo Saxon country. Previous studies (e.g., Bartov et al. 2002; Dechow,
Richardson & Tuna, 2003; Brown & Caylor, 2003, 2005; Lee, 2007; Degeorge
et al., 1999, 2007) have discovered that managers are more incited to manipulate
earnings to achieve or beat the market forecasts and that this tendency has
recently increased in scope (Brown & Caylor, 2003, 2005). However, our
research does not show any proof of accounts manipulations permitting an
avoidance of negative earnings surprises. Our results show that Tunisian
managers are involved in earnings management to avoid losses and earnings
decreases. Thus, they are consistent with the findings of Burgstahler and Dichev
(1997), Degeorge et al. (1999), Holland and Ramsay (2003), and Jacob and
Jorgensen (2007), among others, which were based on different market structures
compared to Tunisia. The results are not surprising and show us that in a context
characterised by the owner-largest shareholder (typically, the large majority of
Tunisian firms are family) and the concentrated bank-dominated system,
managers participate in firm management and influence most of the management
decisions.
Our results have implications for regulatory bodies in Tunisia as well as
those in other emerging countries. Our results suggest that earnings management
exists in a different legal and accounting environment and that the results might
be different from country to country, according to its institutional setting. In

Earnings Management Thresholds
53
particular, earnings management will be present in firms in all economies, but the
magnitude is not uniform across countries. Regulators should focus on the
prevailing corporate governance principles and enforce the rules to provide
effective monitoring of earnings management in Tunisian firms.
This study is subject to some limitations. There is evidence that managers
also have incentives to manage quarterly earnings to achieve thresholds
(DeGeorge et al., 1999; Yang & Krishnan, 2005). In addition, the small sample
size may lead us to prudence. Indeed, it is difficult to generalise the results of the
present research. A careful examination of some control mechanisms of financial
statements is needed for further research. It seems necessary, however, as cited
by Van Caneghem (2006), that links between earnings management measured
through the distribution of reported earnings and audit quality should be deeply
and further studied.
REFERENCES
Abaoub, E., & Amar, B. A. (2008). Les transferts de richesse des parties
prenantes vers les actionnaires dans le cadre de la gestion du résultat. La
revue comptable et financière (Recherches en Comptabilité et Finance),
1, 3–27.
Ali, A., Chen, T. Y., & Radhakrishnan, S. (2007). Corporate disclosures by
family firms. Journal of Accounting and Economics, 44(1–2), 238–286.
Bartov, E., Givoly, D., & Hayn, C. (2002). The rewards to meeting or beating
earnings expectations. Journal of Accounting and Economics, 33(2),
173–204.
Breton, G., & Schatt, A. (2003). Manipulation comptable: Les dirigeants et les
autres parties prenantes. La revue du financier, 139, 18–25.
Bowen, R., DuCharme, L. & Shores D. (2008). Economic and industry
determinants of accounting method choice. (Working paper). University
of Washington.
———. (1995). Stakeholders implicit claims and accounting method choice.
Journal of Accounting and Economics, 20(3), 255–295.
Bowen, R., Rajgopal, S., & Venkatachalam, M. (2008). Accounting discretion,
corporate governance, and firm performance. Contemporary Accounting
Research, 25(2), 310–405.
Brown, L. D., & Caylor, M. L. (2005). A temporal analysis of quarterly earnings
thresholds: Propensities and valuation consequences. The Accounting
Review, 80(2), 423–440.
———. (2003). A temporal analysis of earnings management thresholds
(Working paper). GA: J. Mack Robinson College of Business, Georgia
State University, Atlanta.
Anis Ben Amar and Ezzeddine Abaoub
54
Burgstahler, D., & Dichev, I. (1997). Earnings management to avoid decreases
and losses. Journal of Accounting and Economics, 24(1), 99–126.
Burgstahler, D., & Eames, J. (2003). Earnings management to avoid losses and
earnings decreases: Are analysts fooled? Contemporary Accounting
Research, 20(2), 253–294.
Caramanis, C., & Lennox, C. (2008). Audit effort and earnings management.
Journal of Accounting and Economics, 45(1), 116–138.
Charoenwong, C., & Jiraporn, P. (2009). Earnings management to exceed
thresholds: Evidence from Singapore and Thailand. Journal of
Multinational Financial Management, 19(3), 221–236.
DeAngelo, H., DeAngelo, L., & Skinner, D. (1996). Reversal of fortune dividend
signaling and the disappearance of sustained earnings growth. Journal of
Financial Economics, 40(3), 341–371.
Dechow, P. M., & Sloan, R. G. (1991). Executive incentives and the horizon
problem: An empirical investigation. Journal of Accounting and
Economics, 14(1), 51−89.
Dechow, P.M., Richardson, S. A., & Tuna I. (2003). Why are earnings kinky? An
examination of the earnings management explanation. Review of
Accounting Studies, 8, 355–384.
Dechow, P. M., Sloan, R. G., & Sweeney, A. P. (1996). Causes and
consequences of earnings manipulation: An analysis of firms subject to
enforcement actions by the SEC. Contemporary Accounting Research,
13(1), 1–36.
———. (1995). Detecting earnings management. The Accounting Review, 70(2),
193–225.
Degeorge, F., Patel, J., & Zeckhauser, R. (2007). Earnings thresholds and market
responses (Working paper). Retrieved from http://ssrn.com/abstract=
966268
———. (1999). Earnings management to exceed thresholds. Journal of Business,
72(1), 1–33.
Duke, J., & Hunt, H. (1990). An empirical examination of debt covenant
restrictions and accounting-related proxies. Journal of Accounting and
Economics, 12, 45–63.
Durtschi, C., & Easton, P. D. (2005). Earnings management? The shapes of
frequency distributions of earnings metrics are not evidence ipso facto.
Journal of Accounting Research, 43(4), 557–592.
Graham, J., Harvey, C., & S., Rajgopal. (2005). The economic implications of
corporate financial reporting. Journal of Accounting and Economics,
40(1–3), 3–73
Hagerman, R. L., & Zmijewski, M. E. (1979). Some economic determinants of
accounting policy choice. Journal of Accounting and Economics, 1(2),
141–161.
Earnings Management Thresholds
55
Hasnan, S., Rahman, R. A., & Mahenthiran, S. (2009). Management
predisposition, motive, opportunity, and earnings management for
fraudulent financial reporting in Malaysia (Working paper). Retrieved
from http://ssrn.com/abstract=1321455
Healy, P. (1985). The impact of bonus schemes on the selection of accounting
principles. Journal of Accounting and Economics, 7(1–3), 85–107.
Healy, P., & Wahlen, J. (1999). A review of the earnings management literature
and its implications for standard setting. Accounting Horizons, 13(4),
365–383.
Holland, D., & Ramsay, A. (2003). Do Australian companies manage earnings to
meet simple earnings benchmarks? Accounting and Finance, 43(1),
41–62.
Jacob, J., & Jorgensen, N. (2007). Earnings management and accounting income
aggregation. Journal of Accounting and Economics, 43(2–3), 369–390.
Jones, J. (1991). Earnings management during import relief investigations.
Journal of Accounting Research, 29(2), 193–228.
Kahneman, D., & Tversky, A. (1979). Prospect theory: An analysis of decision
under risk. Econometrica, 47(2), 263–92.
Kasanen, E., Kinnunen, J., & Niskanen, J. (1996). Dividend-based earnings
management: Empirical evidence from Finland. Journal of Accounting
and Economics, 22(1), 283–312.
Kothari, S. P., Leone, A. J., & Wasley, C. E. (2005). Performance matched
discretionary accrual measures. Journal of Accounting and Economics,
39(1), 163–197.
Kouki, M., & Guizani, M. (2009). Ownership structure and dividend policy
evidence from the Tunisian Stock Market. European Journal of Scientific
Research, 25(1), 42–53.
Lee, J. (2007). Earnings management to just meet analysts' forecasts (Working
paper). Kellogg Graduate School of Management.
Leuz, C., Nanda, D., & Wysocki, P. D. (2003). Earnings management and
investor protection: An International comparison. Journal of Financial
Economics, 69(3), 505–527.
Madani, W., & Sammari, K. (2009). Gouvernance d’entreprise : La perspective
tunisienne. Special Report, Fitch Ratings, Tunis, Tunisia, 2 November.
Mard, Y. (2004). Les sociétés françaises cotées gèrent-elles leurs chiffres
comptables afin d’éviter les pertes et les baisses de résultats?
Comptabilité, Contrôle, Audit, 10(2), 73–99.
Matoussi, H., & Chakroun, R. (2007). Board composition, ownership structure
and voluntary disclosure in annual reports: Evidence from Tunisia
(Working paper). Tunisia: ISCAE – University of Manouba.
McNichols, M., & Wilson, G. P. (1988). Evidence of earnings management from
the provision of bad debts. Journal of Accounting Research, 26(3), 1–31.

Anis Ben Amar and Ezzeddine Abaoub
56
McNichols, M. F. (2002). Discussion of the quality of accruals and earnings: The
role of accrual estimation errors. The Accounting Review, 77, 61–69.
———. (2000). Research design issues in earnings management studies. Journal
of Accounting and Public Policy, 19(4–5), 313–345.
Moehrle, S. (2002). Do firms use restructuring charge reversals to meet earnings
targets? The Accounting Review, 77(2), 397–413.
Moreira, J. A. & Pope, P. F. (2007). Earnings management to avoid losses: A
cost of debt explanation (Working paper). Research Center on Industrial,
Labour and Managerial Economics.
Myers, L. A., & Skinner, D. J. (2002). Earnings momentum and earnings
management (Working paper). University of Illinois at Urbana-
Champaign and University of Michigan Business School.
Othman, B. H., & Zeghal, D. (2006). A study of earnings-management motives
in the Anglo-American and Euro-Continental accounting models: The
Canadian and French cases. The International Journal of Accounting, 41,
406–435.
Raman, K., & Shahrur, H. (2008). Relationship-specific investments and earnings
management: Evidence on corporate suppliers and customers. The
Accounting Review, 83(4), 1041–1081.
Stubben, S. R. (2008). Discretionary revenues as a measure of earnings
management (Working paper). Chapel Hill: The University of North
Carolina.
Thabet, K. (2000). Le nouveau manuel de comptabilité. Tunis : Editions CLE.
Van Caneghem, T. (2006). Audit quality, materiality and threshold-induced
earnings management. The ICFAI Journal of Audit Practice, 3(2), 60–77.
Watts, R. L., & Zimmerman J. (1978). Towards a positive theory of the
determination of accounting standards. The Accounting Review, 53(1),
112–134.
Yang, S., & Krishnan, J. (2005). Audit committees and quarterly earnings
management. International Journal of Auditing, 9(3), 201–219.
Related Documents