© 2015 Infinite Computer Solutions. All Rights Reserved. Quarter Ending Sep 2015 Quarter Ending Sep 2015 EARNINGS CALL Q2 FY 2016 "Success works as a cycle - growth and contraction, balancing and unbalancing - all while you're encountering hurdles that get higher and higher over time.” Julien Smith, Author of The Flinch

Welcome message from author
This document is posted to help you gain knowledge. Please leave a comment to let me know what you think about it! Share it to your friends and learn new things together.
Transcript

© 2015 Infinite Computer Solutions. All Rights Reserved.
Quarter Ending Sep 2015 Quarter Ending Sep 2015
EARNINGS CALL
Q2 FY 2016
"Success works as a cycle - growth and contraction, balancing and unbalancing - all while you're encountering hurdles that get higher and higher over time.” Julien Smith, Author of The Flinch
© 2015 Infinite Computer Solutions. All Rights Reserved.
Quarter Ending Sep 2015
Safe Harbour
Certain statements in this presentation concerning our future growth prospects are forward-looking statements, which involve a number of risks and uncertainties that could cause actual results to differ materially from those in such forward-looking statements.
The risks and uncertainties relating to these statements include, but are not limited to, risks and uncertainties regarding fluctuations in earnings, our ability to manage growth, intense competition in IT services including those factors which may affect our cost advantage, wage increases in India, our ability to attract and retain highly skilled professionals, time and cost overruns on fixed-price, fixed-time frame contracts, client concentration, restrictions on immigration, industry segment concentration, our ability to manage our international operations, reduced demand for technology in our key focus areas, disruptions in telecommunication networks or system failures, our ability to successfully complete and integrate potential acquisitions, liability for damages on our service contracts, the success of the companies in which the company has made strategic investments, withdrawal of governmental fiscal incentives, political instability and regional conflicts, legal restrictions on raising capital or acquiring companies outside India, and unauthorized use of our intellectual property and general economic conditions affecting our industry.
The Company does not undertake to update any forward-looking statements that may be made from time to time by or on behalf of the Company.
2
© 2015 Infinite Computer Solutions. All Rights Reserved.
Quarter Ending Sep 2015
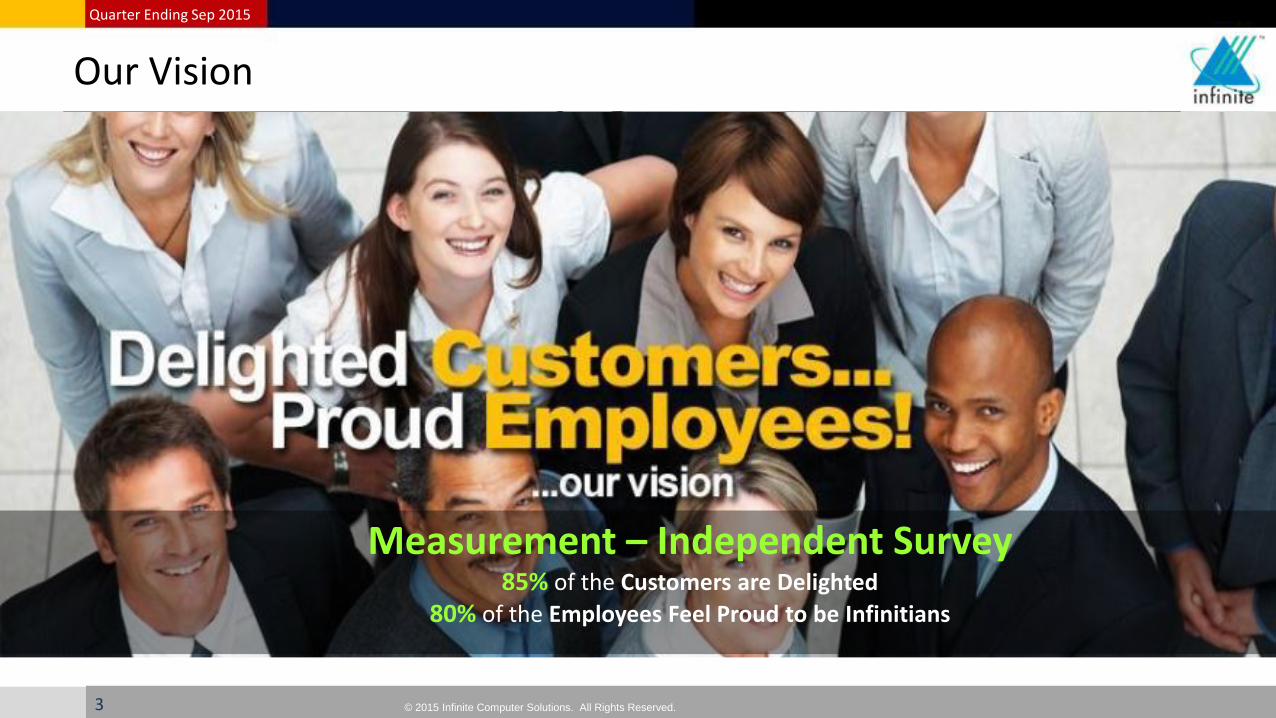
Measurement – Independent Survey 85% of the Customers are Delighted
80% of the Employees Feel Proud to be Infinitians
Our Vision
3

© 2015 Infinite Computer Solutions. All Rights Reserved.
Quarter Ending Sep 2015
Awards & Accolades Established in 1999, Headquartered in Bangalore, India
Publicly listed in 2010 in the Indian Stock Exchange Boards
Our Presence | 16 Offices 7 Delivery Centers - Bangalore, Boston, Chennai, Chicago, Gurgaon, Rockville, Princeton & Knoxville
Our Financials
FY 15
Revenue: USD 284M
EBITDA: USD 31.1M
Our People FY 15
5138 Employees worldwide, 3331 in India
Our Customers
• 99 Active Customers
• Long Standing Relationships with
Fortune 1000 Companies
Infinite Overview
4
© 2015 Infinite Computer Solutions. All Rights Reserved.
Quarter Ending Sep 2015
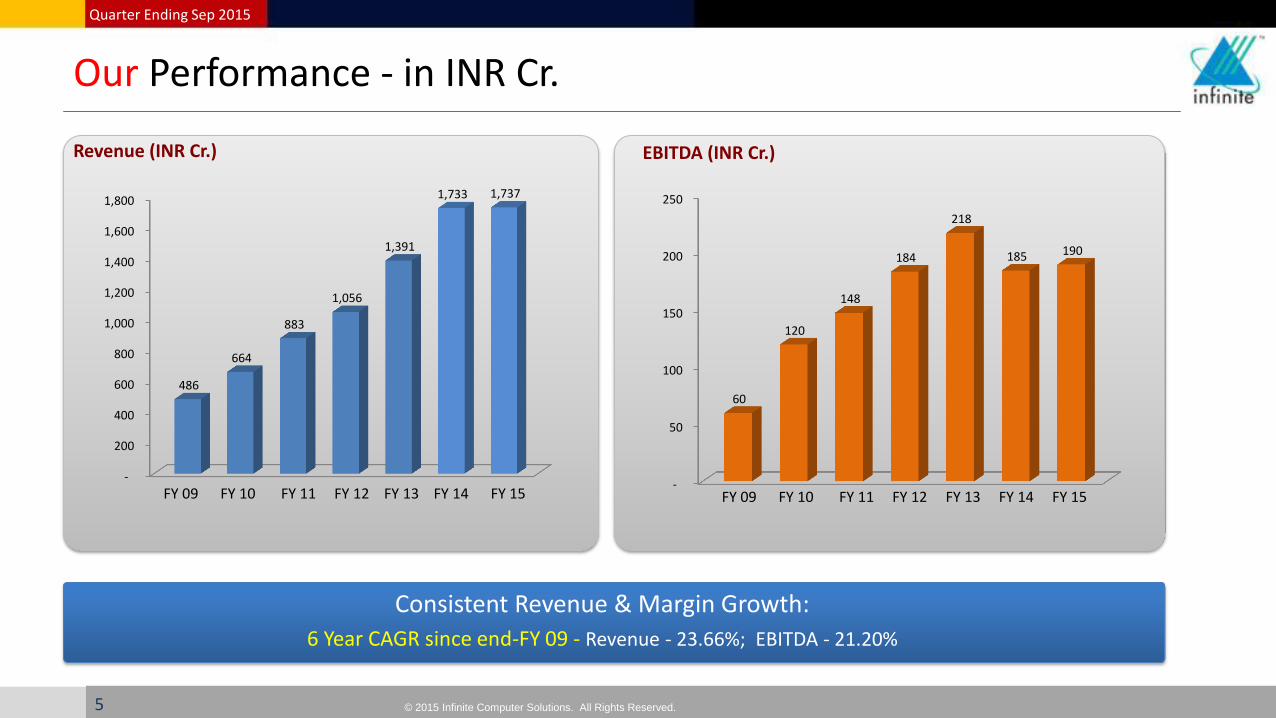
Consistent Revenue & Margin Growth:
6 Year CAGR since end-FY 09 - Revenue - 23.66%; EBITDA - 21.20%
EBITDA (INR Cr.) Revenue (INR Cr.)
Our Performance - in INR Cr.
5
-
200
400
600
800
1,000
1,200
1,400
1,600
1,800
486
664
883
1,056
1,391
1,733 1,737
FY 09 FY 10 FY 11 FY 12 FY 13 FY 14 FY 15 -
50
100
150
200
250
60
120
148
184
218
185 190
FY 09 FY 10 FY 11 FY 12 FY 13 FY 14 FY 15

© 2015 Infinite Computer Solutions. All Rights Reserved.
Quarter Ending Sep 2015
Long Term Relationship With Global Corporates
Large Telecom SP
14+ Years. Application Management Infrastructure Management
Relationship Value
(Last 5 Years) - US$ 200 M
Global Telecom OEM 2
8+ Years. Product Engineering, Platform & Product Devp.
Relationship Value (Last 5 Years) - US$ 30 M
Healthcare Provider 7+ Years Enterprise Application Management , QA testing
Relationship Value (Last 5 Years) - US$ 125 M
Financial Services Provider 5 Years. Enterprise Application Management, SOA Migration, Enterprise Analytics
Relationship Value (Last 5 Years) - US$ 25 M
Tech Support Provider 5+ Years Infrastructure Management
Relationship Value
(Last 5 Years) - US$ 25 M
Leading Global SI
14+ Years.
Application Management
Infrastructure Management
Relationship Value (Last 5 Years) - US$ 400 M
Global Telecom OEM 1
14+ Years. Product Engineering
Relationship Value
(Last 5 Years) - US$ 50 M
Global Telecom OEM 3 6 Years. Mobility & Messaging
Relationship Value
(Last 5 Years) - US$ 130 M
Information Management Services Company 6 Years. Enterprise Application Mgmt. Enterprise Analytics
Relationship Value
(Last 5 Years) - US$ 10 M
6

© 2015 Infinite Computer Solutions. All Rights Reserved.
Quarter Ending Sep 2015
Our Differentiators
Not the typical Indian IT Service provider USA based & Local Partner to USA Clients
Differentiated Income Model Non- conventional Revenue Models
Flexible Business Engagement Models Including Revenue Share & Risk Reward
Long standing relationship with Customers Focused, Flexible and deep association
Business Value Add Led Associations Beyond delivery, measured via a Value Scored(Prism)
Platform based Strategy A Platformization company
Strong Domain Knowledge Intellectual Property leveraged Solutions
CUSTOMER
• Strong Profitability • Positive Cash Generator • Zero Debt • High Return Ratio • High Dividend Yield Policy • High Promoter Holding • Revenue Visibility
SHAREHOLDERS
• Best in our Class Mid Sized Player with Large Complex Project
• Experience with Fortune 100 & 500 Clients
• Retention Rate 85%, Higher than Industry Standards
• Rated 5th Best Employer in India in IDC DQ
EMPLOYEES
7

© 2015 Infinite Computer Solutions. All Rights Reserved.
Quarter Ending Sep 2015
Our Focus Areas
Verticals
• Telecom & Media
• Healthcare
• Hi-Tech
• Technology
• Banking & Finance
Services
• IT Services
• Product Engineering
• Mobility & Messaging Platforms
Niche Expertise • Enterprise Analytics • Enterprise Mobility Solutions • Broadband Networking • SOA Service Oriented Architecture • Quality Assurance • Healthcare Platform • Agile Development • iTASS ; Platform for Tech Support • Next-Gen Messaging Products
Flexible Engagement Models
8
© 2015 Infinite Computer Solutions. All Rights Reserved.
Quarter Ending Sep 2015
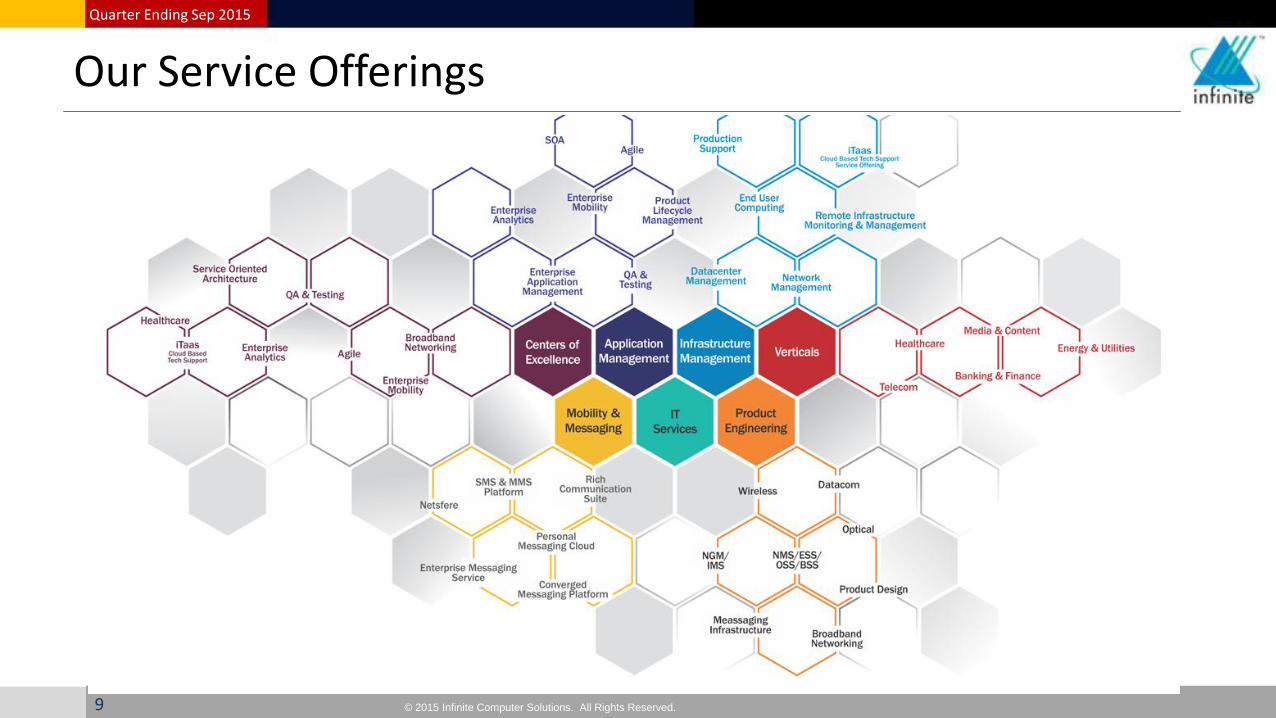
Our Service Offerings
9

© 2015 Infinite Computer Solutions. All Rights Reserved.
Quarter Ending Sep 2015
PlatformizationTM – The Premise
• Paradigm Shift from Traditional People-dependent Delivery Automated Processes
• Focused alignment of ensuring higher throughput from repetitive tasks Service & Solution Platforms
• Platform-plays leading to higher Business Impact Productivity Gains & Lower TCO
Automation & Non-linearity
Platforms as a Service
Solution Accelerator
Business Outcome Focused
Automation at the Core
Productivity Resources
10
© 2015 Infinite Computer Solutions. All Rights Reserved.
Quarter Ending Sep 2015
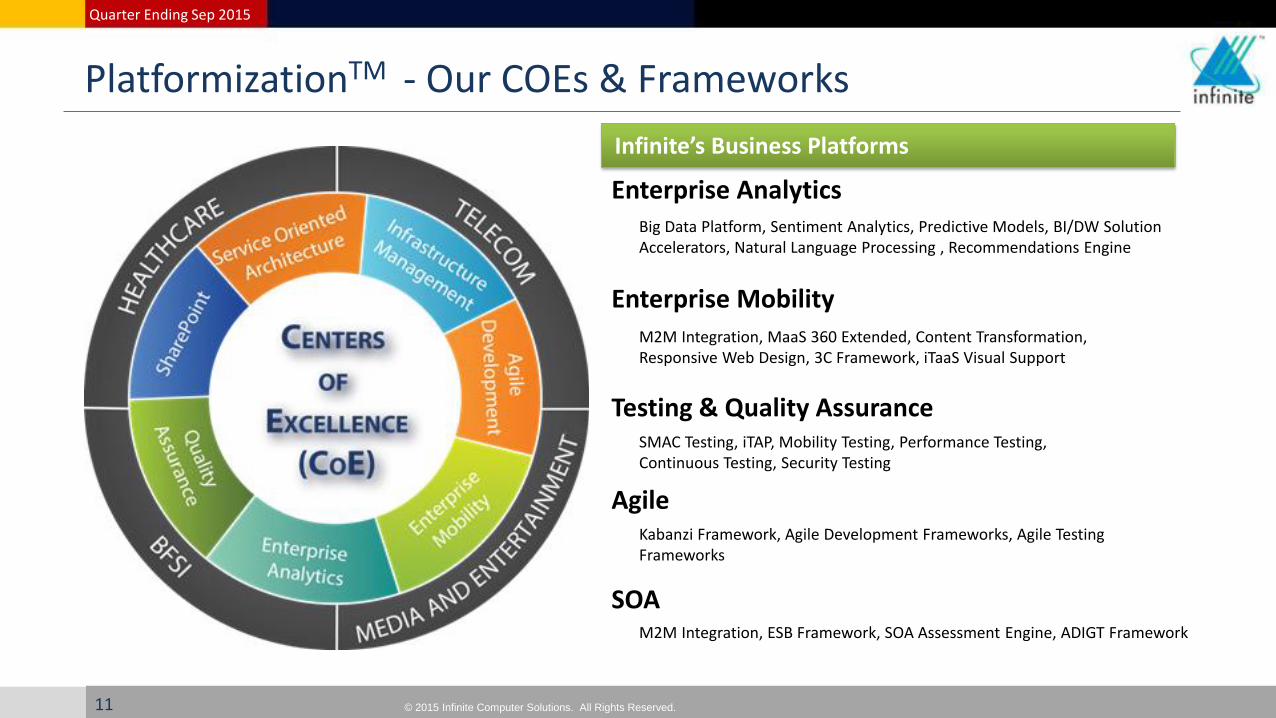
PlatformizationTM - Our COEs & Frameworks
Enterprise Analytics Big Data Platform, Sentiment Analytics, Predictive Models, BI/DW Solution Accelerators, Natural Language Processing , Recommendations Engine
Enterprise Mobility M2M Integration, MaaS 360 Extended, Content Transformation, Responsive Web Design, 3C Framework, iTaaS Visual Support
Testing & Quality Assurance SMAC Testing, iTAP, Mobility Testing, Performance Testing, Continuous Testing, Security Testing
Agile Kabanzi Framework, Agile Development Frameworks, Agile Testing Frameworks
Infinite’s Business Platforms
SOA M2M Integration, ESB Framework, SOA Assessment Engine, ADIGT Framework
11
© 2015 Infinite Computer Solutions. All Rights Reserved.
Quarter Ending Sep 2015
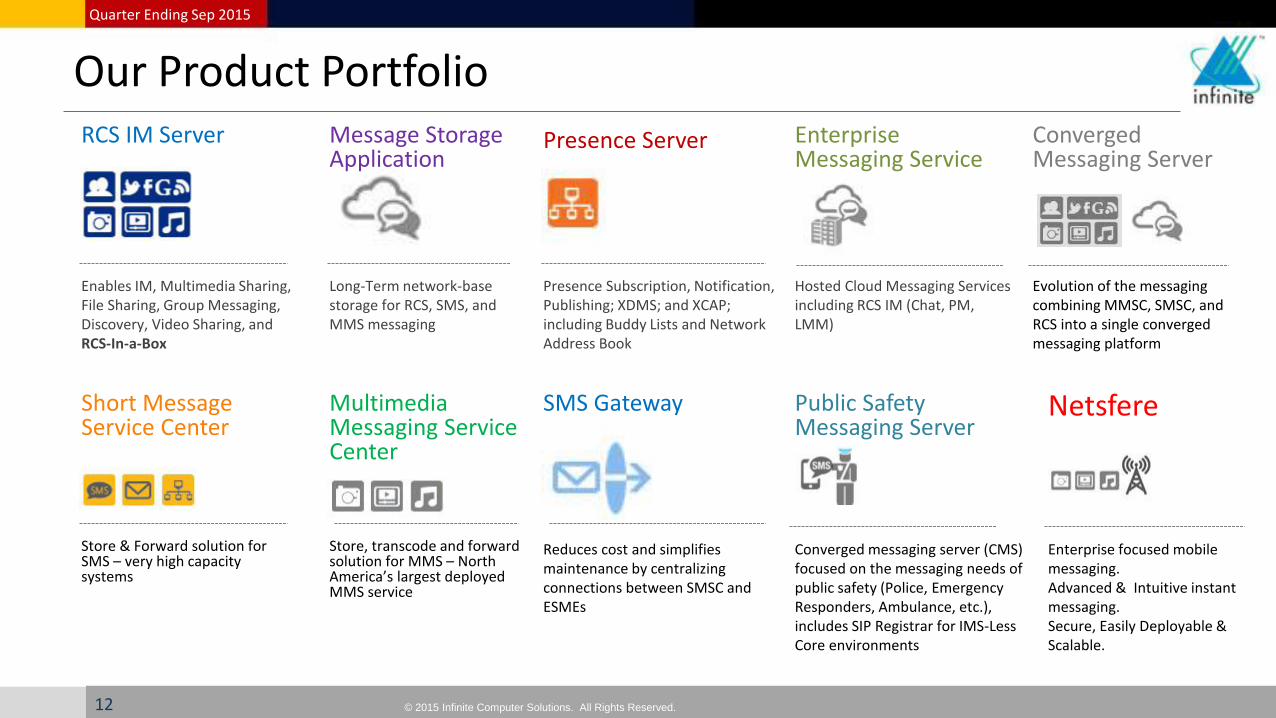
RCS IM Server
Message Storage Application
Presence Server
Enterprise Messaging Service
Converged Messaging Server
Enables IM, Multimedia Sharing, File Sharing, Group Messaging, Discovery, Video Sharing, and RCS-In-a-Box
Long-Term network-base storage for RCS, SMS, and MMS messaging
Presence Subscription, Notification, Publishing; XDMS; and XCAP; including Buddy Lists and Network Address Book
Hosted Cloud Messaging Services including RCS IM (Chat, PM, LMM)
Evolution of the messaging combining MMSC, SMSC, and RCS into a single converged messaging platform
Short Message Service Center
Multimedia Messaging Service Center
SMS Gateway Public Safety Messaging Server
Netsfere
Store & Forward solution for SMS – very high capacity systems
Store, transcode and forward solution for MMS – North America’s largest deployed MMS service
Reduces cost and simplifies maintenance by centralizing connections between SMSC and ESMEs
Converged messaging server (CMS) focused on the messaging needs of public safety (Police, Emergency Responders, Ambulance, etc.), includes SIP Registrar for IMS-Less Core environments
Enterprise focused mobile messaging. Advanced & Intuitive instant messaging. Secure, Easily Deployable & Scalable.
Our Product Portfolio
12

© 2015 Infinite Computer Solutions. All Rights Reserved.
Quarter Ending Sep 2015
Our Enterprise Messaging Product
Operator C
Operator B
Operator A
Infinite Convergence Solutions
HRM
CRM
Inventory
Billing & Invoicing
IT Support
Enterprise Applications
Backend Systems & API Integration
SMTP
HTTP
SMPP
13

© 2015 Infinite Computer Solutions. All Rights Reserved.
Quarter Ending Sep 2015
Enterprise -focused mobile messaging
Intuitive User Experience
Secure
Easily deployed and scalable
Customizable
NetSfere – Our Mobile Messaging Platform
14

© 2015 Infinite Computer Solutions. All Rights Reserved.
Quarter Ending Sep 2015
NetSfere: Features
Advanced & Intuitive Instant Messaging
256 bit Encryption
Multimedia File Transfer
Real-time Presence
Multi-Device Sync
Location Sharing
APIs Location Sharing
Remote Wipe
Message Statistics & Reports
Add & Remove Participants
Active Directory Integration
Private Cloud
15
© 2015 Infinite Computer Solutions. All Rights Reserved.
Quarter Ending Sep 2015
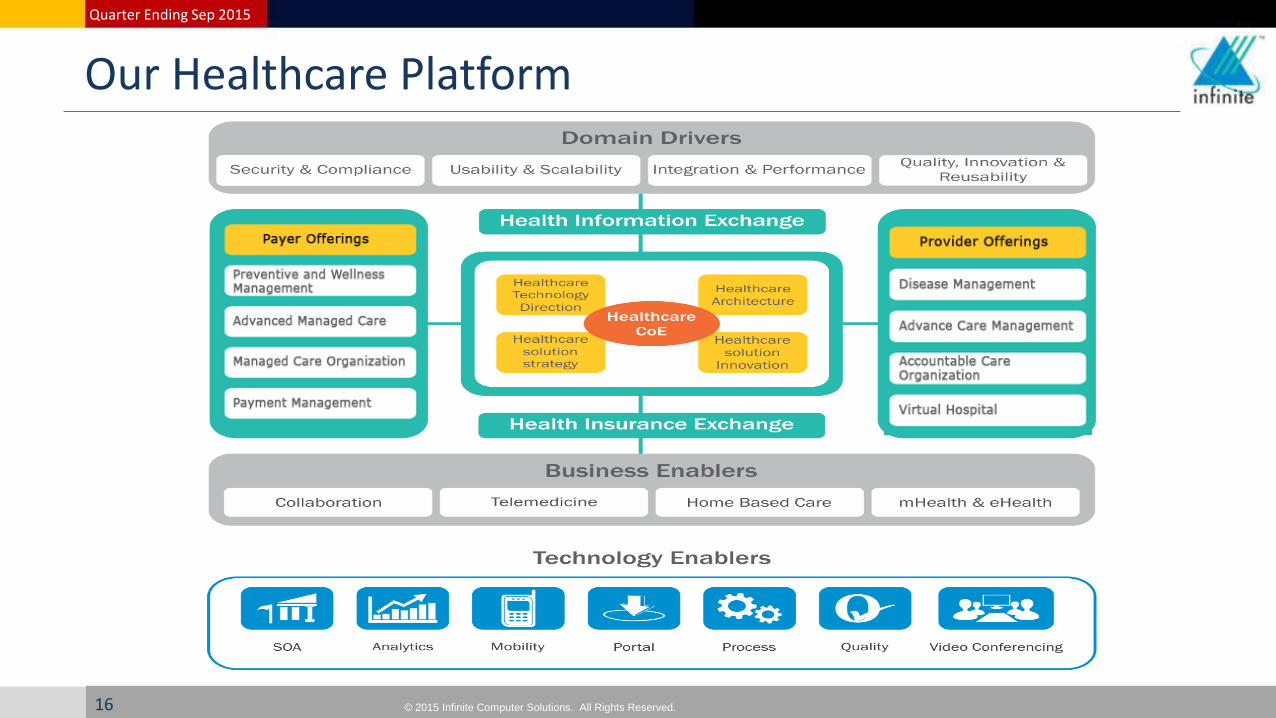
Our Healthcare Platform
16

© 2015 Infinite Computer Solutions. All Rights Reserved.
Quarter Ending Sep 2015
Industry Recognitions
17
Forbes ranks Infinite in Asia 200 Best Under a Billion 2012
Dataquest Magazine Ranks Infinite Top 5 Employer of Choice 2010
Mobile Merit Awards Runner Up
CTIA Emerging Technology Awards Finalist 2012
Hot Companies & Technologies Award 2014, 2013, 2012
Finalist in Red Herring 100 winner
Finalist in WCA
Winner of TMC’s CRM Excellence Award 2014 & 2013
Winner of Fierce Innovation Award 2013
Winner of 2014 Unified Communications Product
of the Year Award
Winner of Gold Stevie 2014 for Relationship Management
Solution
NASSCOM ranks Infinite in Top 20 IT Players in India 2012
Winner of Silver Stevie 2014 for Marketing Solution

© 2015 Infinite Computer Solutions. All Rights Reserved.
Quarter Ending Sep 2015
Executive Overview Q2 FY 2015 - 16
18

© 2015 Infinite Computer Solutions. All Rights Reserved.
Quarter Ending Sep 2015
Overview of Q2, FY 2015 – 16
Highlights of the Quarter
• In-line with expectations / Guidance
• Buy Back completed
19
Earnings IN USD Terms
Revenue USD 77.21 M Up 6.9% y-on-y; Up 4.4% q-on-q
EBITDA USD 6.78 M Down 9.2% y-on-y; Up 12.4% q-on-q
Net Margin USD 4.19 M Down 7.4% y-on-y; Up 4.4 % q-on-q
IN INR Terms
Revenue INR 500.61 Cr Up 14.4 % y-on-y; Up 6.6 % q-on-q
EBITDA INR 43.94 Cr Down 2.9 % y-on-y; Up 14.8 % q-on-q
PAT INR 27.18 Cr Down 0.9 % y-on-y; Up 6.6 % q-on-q
People
Global Employee Headcount at 4991 • India Headcount decreased to 2988
Outside India increased to 2003
• 72 Net Decrease; Attrition 18.46 %
Cash
• Cash & Cash equivalents increased to INR 203.93 Cr. from INR 193.68 Cr at the end of Q1 FY 16
• Free Cash Flow of INR 15.18 Cr.
• Cash Per Share at INR 52.69
• EPS for Q2 FY 16 is INR 6.88
Buyback
• Buyback completed on 20th August and bought back 14.50 lac shares
• Rs 28.68 Cr. Used in Buyback

© 2015 Infinite Computer Solutions. All Rights Reserved.
Quarter Ending Sep 2015
Go Forward Strategy
Re-align & focus on positioning Infinite as
Platformization company
20
Prime investment for
Futuristic Gain Enhancing Current
Platforms & building New Platforms Cloud Based Service Delivery
Focus on
Margin Expansion over the Longer Term
1
2 3
© 2015 Infinite Computer Solutions. All Rights Reserved.
Quarter Ending Sep 2015
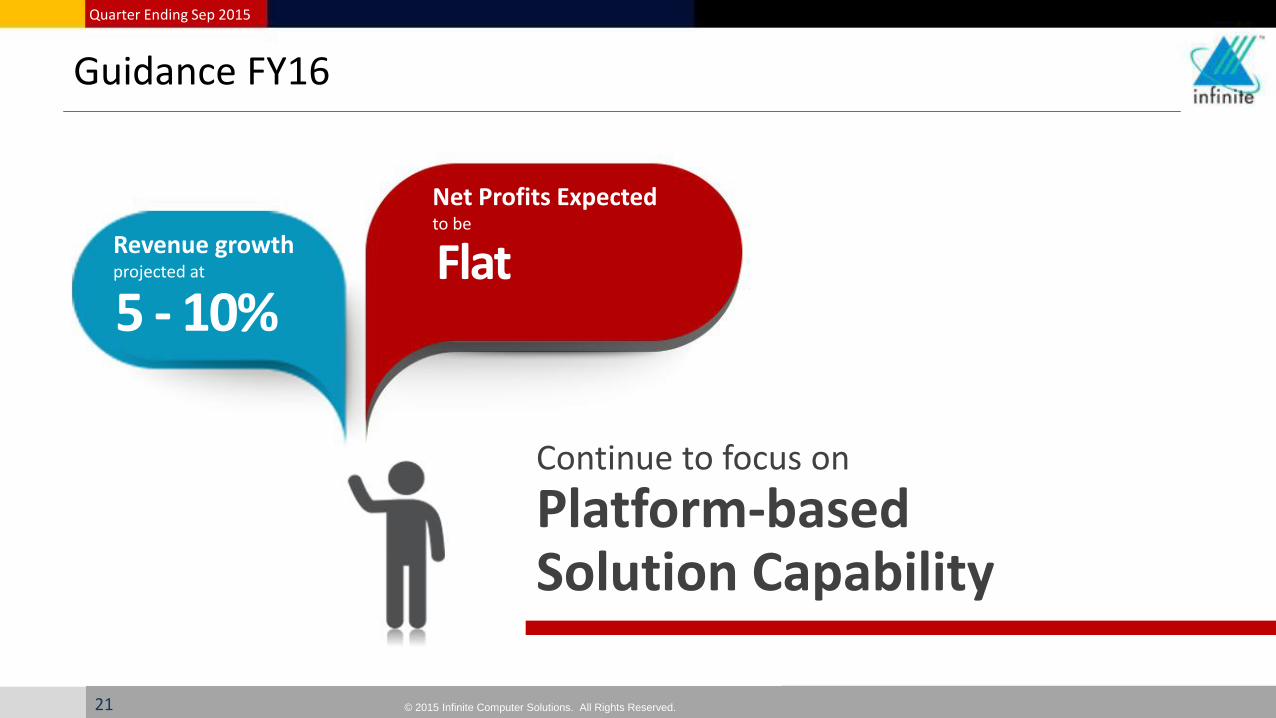
Guidance FY16
21
5 - 10% Flat Revenue growth
projected at
Net Profits Expected to be
Continue to focus on
Platform-based Solution Capability
© 2015 Infinite Computer Solutions. All Rights Reserved.
Quarter Ending Sep 2015
Key Metrics Q2 FY 2015 - 16
22

© 2015 Infinite Computer Solutions. All Rights Reserved.
Quarter Ending Sep 2015
Revenue Analysis
Top Clients Q2 FY 15 Q1 FY 16 Q2 FY 16
Top Client 53.68% 53.91% 51.89%
Top 5 Clients 81.71% 79.83% 80.88%
Top 10 Clients 91.51% 92.17% 92.07%
Client Details Q2 FY 15 Q1 FY 16 Q2 FY 16
US$ 1 M+ 14 15 15
US$ 5 M+ 8 9 9
US$ 10 M+ 6 6 6
US$ 20 M+ 2 2 2
US$ 50 M+ 1 1 1
By Region Q2 FY 15 Q1 FY 16 Q2 FY 16
USA 87.9% 87.6% 88.5%
APAC 5.5% 5.9% 5.2%
Europe 0.1% 0.1% 0.2%
India 6.5% 6.4% 6.1%
By Industry Q2 FY 15 Q1 FY 16 Q2 FY 16
Telecom & Media 38.5 % 33.5% 36.8%
Healthcare 14.9% 18.4% 18.2%
Technology 41.6 % 42.0% 40.3%
BFSI 1.1% 2.3% 1.2%
Others 3.9% 3.8% 3.5%
23
By Offering Q2 FY 15 Q1 FY 16 Q2 FY 16
IT Services 71.6 % 75.5% 72.2%
Product Engineering 12.9 % 13.2% 13.0 %
Messaging Products 15.4 % 11.3% 14.8 %
Revenue By Model Q2 FY 15 Q1 FY 16 Q2 FY 16
Time & Material 68.7% 70.1% 68.0%
Fixed Bid 13.5% 16.3% 16.1%
Revenue Share 17.8% 13.6% 15.9%

© 2015 Infinite Computer Solutions. All Rights Reserved.
Quarter Ending Sep 2015
Business Metrics
People Metrics Q2 FY 15 Q1 FY 16 Q2 FY 16
Total Employees 5325 5063 4991
Employees in India 3485 3157 2988
Employees outside India 1840 1906 2003
Net Addition 246 -75 -72
Attrition - Global 17.92% 18.43% 18.46%
Utilization 78% 79% 81%
Revenue Mix Q2 FY 15 Q1 FY 16 Q2 FY 16
Onsite 83.1% 81.1% 78.0%
Offshore 16.9% 18.9% 22.0%
Financial Metrics Q2 FY 15 Q1 FY 16 Q2 FY 16
DSO as per Financials - Days 133 126 125
DSO w/o unbilled & pass through revenue - Days
74 78 77
Earnings per Share - INR INR 6.83 INR 6.35 INR 6.88
Cash per Share - INR INR 31 INR 48.2 INR 52.69
Net Worth – INR Crore INR 727 INR 825 INR 837
24
Billing Rates – US$ Q2 FY 15 Q1 FY 16 Q2 FY 16
Onsite US$ 71 US$ 80 US$ 84
Offshore US$ 22 US$ 23 US$ 23
Key Financial Ratios Q2 FY 15 Q1 FY 16 Q2 FY 16
Gross Margin to Revenue % 28.5% 27.5% 27.7%
SG&A to Revenue % 18.2% 19.4% 18.9%
EBITDA % 10.3% 8.2% 8.8%
PAT % 6.3% 5.4% 5.4%
Effective Tax Rate % 21.2% 16.5% 25.6%

© 2015 Infinite Computer Solutions. All Rights Reserved.
Quarter Ending Sep 2015
25

© 2015 Infinite Computer Solutions. All Rights Reserved.
FACT SHEET – Q2, FY 2015-16

© 2015 Infinite Computer Solutions. All Rights Reserved.2
Certain statements in this presentation concerning our future growth prospects are forward-looking statements, which involve a numberof risks and uncertainties that could cause actual results to differ materially from those in such forward-looking statements. The risks anduncertainties relating to these statements include, but are not limited to, risks and uncertainties regarding fluctuations in earnings, ourability to manage growth, intense competition in IT services including those factors which may affect our cost advantage, wage increasesin India, our ability to attract and retain highly skilled professionals, time and cost overruns on fixed-price, fixed-time frame contracts,client concentration, restrictions on immigration, industry segment concentration, our ability to manage our international operations,reduced demand for technology in our key focus areas, disruptions in telecommunication networks or system failures, our ability tosuccessfully complete and integrate potential acquisitions, liability for damages on our service contracts, the success of the companies inwhich the company has made strategic investments, withdrawal of governmental fiscal incentives, political instability and regionalconflicts, legal restrictions on raising capital or acquiring companies outside India, and unauthorized use of our intellectual property andgeneral economic conditions affecting our industry. The Company does not undertake to update any forward-looking statements thatmay be made from time to time by or on behalf of the Company.
Safe Harbour
Fact Sheet Quarter ended 30th Sep, 2015 Q2 FY 2015-16

© 2015 Infinite Computer Solutions. All Rights Reserved.3
Fact Sheet Headline Financials Q2 FY 2015-16
Performance (USD Mn.) FY 13 FY 14 FY 15 FY 15 Q1 FY 15 Q2 FY 15 Q3 FY 15 Q4 FY 16 Q1 FY 16 Q2 FY 16 H1Revenue 255.45 286.59 283.94 65.01 72.25 78.47 68.21 73.94 77.21 151.15 EBITDA 40.11 30.67 31.11 7.91 7.47 11.85 3.88 6.03 6.78 12.81 EBIT 29.12 18.67 22.83 5.55 5.59 10.05 1.64 4.49 5.40 9.89 PAT 24.03 14.91 18.47 4.49 4.53 7.81 1.64 4.01 4.19 8.20
EBITDA to Revenue 15.7% 10.7% 11.0% 12.2% 10.3% 15.1% 5.7% 8.2% 8.8% 8.5%EBIT to Revenue 11.4% 6.5% 8.0% 8.5% 7.7% 12.8% 2.4% 6.1% 7.0% 6.5%PAT to Revenue 9.4% 5.2% 6.5% 6.9% 6.3% 10.0% 2.4% 5.4% 5.4% 5.4%
Y on Y Revenue growth rates 15.8% 12.2% -0.9% -9.6% -5.9% 8.2% 4.4% 13.7% 6.9% 10.1%Y on Y EBITDA growth rates 4.8% -23.5% 1.4% 5.9% -13.0% 35.4% -33.8% -23.8% -9.2% -16.7%Y on Y EBIT growth rates -12.0% -35.9% 22.3% -6.4% 2.2% 108.5% -33.1% -19.1% -3.4% -11.2%Y on Y PAT growth rates -4.8% -38.0% 23.9% 2.3% 7.3% 98.7% -30.8% -10.6% -7.4% -9.1%
No. of Shares 42,559,995 40,443,159 40,156,459 40,148,959 40,156,459 40,156,459 40,156,459 40,156,459 38,706,459 38,706,459
Performance (Rs Cr.) FY 13 FY 14 FY 15 FY 15 Q1 FY 15 Q2 FY 15 Q3 FY 15 Q4 FY 16 Q1 FY 16 Q2 FY 16 H1Revenue 1,390.61 1,732.73 1,737.44 388.59 437.74 486.53 424.58 469.55 500.61 970.16 EBITDA 218.42 185.57 190.14 47.28 45.24 73.48 24.14 38.27 43.94 82.21 EBIT 158.54 112.15 139.58 33.17 33.90 62.32 10.19 28.51 35.04 63.55 PAT 130.75 89.77 112.91 26.83 27.43 48.44 10.21 25.49 27.18 52.67
EBITDA to Revenue 15.7% 10.7% 11.0% 12.2% 10.3% 15.1% 5.7% 8.2% 8.8% 8.5%EBIT to Revenue 11.4% 6.5% 8.0% 8.5% 7.7% 12.8% 2.4% 6.1% 7.0% 6.6%PAT to Revenue 9.4% 5.2% 6.5% 6.9% 6.3% 10.0% 2.4% 5.4% 5.4% 5.4%
Y on Y Revenue growth rates 31.7% 24.6% 0.3% -3.4% -8.2% 8.1% 5.2% 20.8% 14.4% 17.4%Y on Y EBITDA growth rates 19.0% -15.0% 2.5% 13.1% -15.2% 35.4% -33.3% -19.1% -2.9% -11.1%Y on Y EBIT growth rates 0.1% -29.3% 24.5% -0.1% -0.1% 108.5% -32.6% -14.0% 3.4% -5.2%Y on Y PAT growth rates 8.3% -31.3% 25.8% 9.2% 4.6% 98.9% -30.2% -5.0% -0.9% -2.9%
EPS (in Rs.) 30.72 21.73 28.08 6.66 6.83 12.05 2.55 6.35 6.88 13.23 Effective Tax Rate 20.0% 22.6% 21.7% 21.0% 21.2% 23.8% 13.2% 16.5% 25.6% 21.5%Average exchange Rate 54.44 60.46 61.15 59.77 60.59 62.00 62.25 63.50 64.84 64.17

© 2015 Infinite Computer Solutions. All Rights Reserved.4
Fact Sheet Growth Analysis Q2 FY 2015-16
Performance by Quarter - USD Mn. FY 13 FY 14 FY 15 FY 15 Q1 FY 15 Q2 FY 15 Q3 FY 15 Q4 FY 16 Q1 FY 16 Q2 FY 16 H1Revenue 255.45 286.59 283.94 65.01 72.25 78.47 68.21 73.94 77.21 151.15 EBITDA 40.11 30.67 31.11 7.91 7.47 11.85 3.88 6.03 6.78 12.81 PAT 29.12 14.91 18.47 4.49 4.53 7.81 1.64 4.01 4.19 8.20 Currency Rate - USD 54.44 60.46 61.15 59.77 60.59 62.00 62.25 63.50 64.84 64.17
Performance by Quarter – Rs. Cr. FY 13 FY 14 FY 15 FY 15 Q1 FY 15 Q2 FY 15 Q3 FY 15 Q4 FY 16 Q1 FY 16 Q1 FY 16 H1Revenue 1,390.61 1,732.73 1,737.44 388.59 437.74 486.53 424.58 469.55 500.61 970.16 EBITDA 218.42 185.57 190.14 47.28 45.24 73.48 24.14 38.27 43.94 82.21PAT 130.75 89.77 112.91 26.83 27.43 48.44 10.21 25.49 27.18 52.67
EBITDA to Revenue 15.7% 10.7% 11.0% 12.2% 10.3% 15.1% 5.7% 8.2% 8.8% 8.5%PAT to Revenue 9.4% 5.2% 6.5% 6.9% 6.3% 10.0% 2.4% 5.4% 5.4% 5.4%
Growth - Key Financials (YoY)In Dollar Terms In Rupee Terms
FY 15 Q3 FY 15 Q4 FY 16 Q1 FY 16 Q2 FY 15 Q1 FY 15 Q2 FY 15 Q3 FY 15 Q4 FY 16 Q1 FY 16 Q2Revenue Growth 8.2% 4.4% 13.7% 6.9% -3.4% -8.2% 8.1% 5.2% 20.8% 14.4%EBITDA Growth 35.4% -33.8% -23.8% -9.2% 13.1% -15.2% 35.4% -33.3% -19.1% -2.9%PAT Growth 98.7% -30.8% -10.6% -7.5% 9.2% 4.6% 98.9% -30.2% -5.0% -0.9%
Growth - Key Financials (Sequential)
In Dollar Terms In Rupee TermsFY 15 Q3 FY 15 Q4 FY 16 Q1 FY 16 Q2 FY 15 Q1 FY 15 Q2 FY 15 Q3 FY 15 Q4 FY 16 Q1 FY 16 Q2
Revenue Growth 8.6% -13.1% 8.4% 4.4% -3.7% 12.6% 11.1% -12.7% 10.6% 6.6%EBITDA Growth 58.6% -67.3% 55.4% 12.4% 30.7% -4.3% 62.4% -67.1% 58.5% 14.8%PAT Growth 72.4% -79.0% 144.7% 4.4% 83.4% 2.2% 76.6% -78.9% 149.7% 6.6%

© 2015 Infinite Computer Solutions. All Rights Reserved.5
Fact Sheet Business Metrics Q2 FY 2015-16
Revenue Client FY13 FY 14 FY 15 FY 15 Q1 FY 15 Q2 FY 15 Q3 FY 15 Q4 FY 16 Q1 FY 16 Q2 FY 16 - H1Top Client 38.80% 52.30% 50.43% 47.45% 53.68% 48.16% 52.45% 53.91% 51.89% 52.88%Top 5 Clients 73.10% 79.40% 80.35% 80.45% 81.71% 81.22% 77.81% 79.83% 80.88% 80.37%Top 10 Clients 89.40% 91.90% 91.20% 92.21% 91.51% 91.15% 89.77% 92.17% 92.07% 92.12%
No. of active clients 73 85 90 88 91 99 No. of clients added 7 9 11 7 11 11
FY13 FY 14 FY 15 FY 15 Q1 FY 15 Q2 FY 15 Q3 FY 15 Q4 FY 16 Q1 FY 16 Q2 FY 16 H1US$ 1 mn Clients 16 14 15 14 14 14 15 15 15 15 US$ 5 mn Clients 11 8 9 8 8 9 9 9 9 9 US$ 10 mn Clients 7 7 6 7 6 6 6 6 6 6 US$ 20 mn Clients 4 2 2 2 2 2 2 2 2 2
Revenue from Repeat Business 99% 99% 99% 99% 99% 99% 99% 99% 99%
Average Bill Rate (in USD) FY13 FY 14 FY 15 FY 15 Q1 FY 15 Q2 FY 15 Q3 FY 15 Q4 FY 16 Q1 FY 16 Q2 FY 16 H1Offshore $20 $21 $ 23 $21 $22 $ 26 $ 23 $ 23 $ 23 $ 23 On-site $66 $69 $ 75 $70 $71 $ 77 $ 81 $ 80 $ 84 $ 82
Revenue -FY13 FY 14 FY 15 FY 15 Q1 FY 15 Q2 FY 15 Q3 FY 15 Q4 FY 16 Q1 FY 16 Q2 FY 16 H1
Engagement ModelFixed Price / SOW / Managed T&M 23.6% 15.8% 15.4% 15.3% 13.5% 15.0% 18.2% 16.3% 16.1% 16.2%Revenue Sharing 16.2% 16.5% 18.6% 21.0% 17.8% 22.3% 12.7% 13.6% 15.9% 14.8%T & M 60.2% 67.5% 66.0% 63.7% 68.7% 62.7% 69.1% 70.1% 68.0% 69.0%
© 2015 Infinite Computer Solutions. All Rights Reserved.6
Fact Sheet Revenue Metrics Q2 FY 2015-16
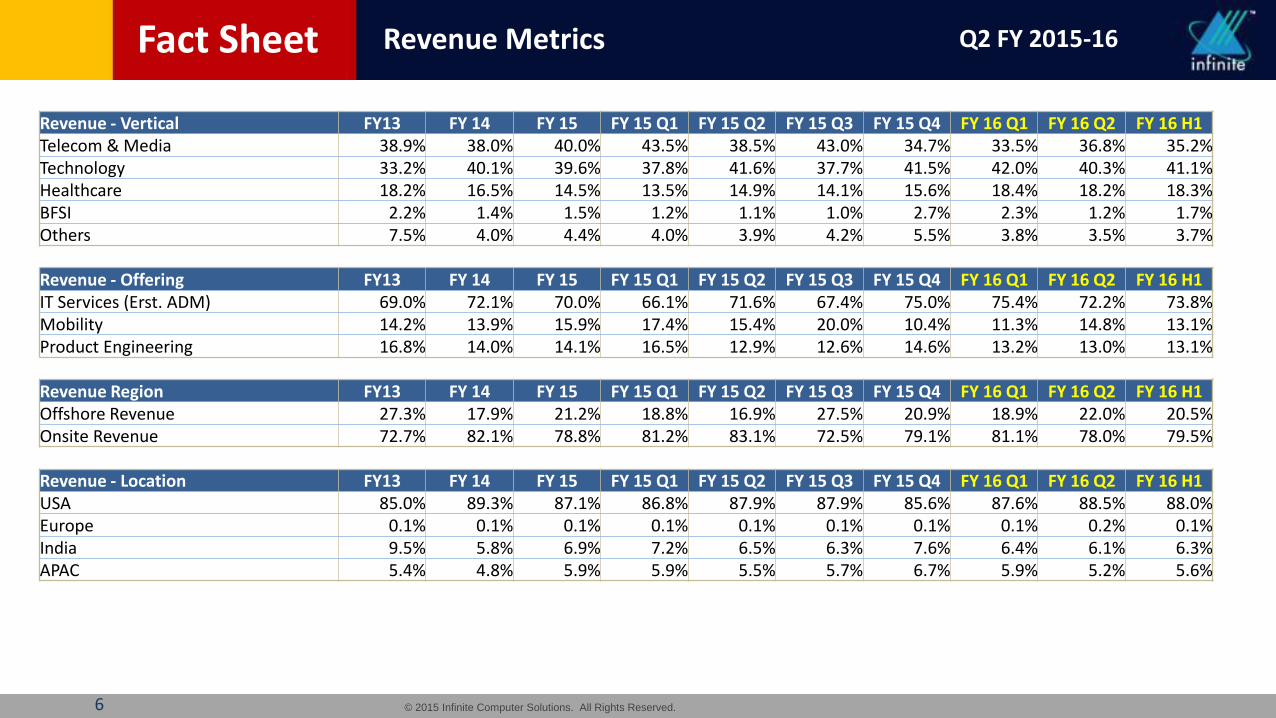
Revenue - Vertical FY13 FY 14 FY 15 FY 15 Q1 FY 15 Q2 FY 15 Q3 FY 15 Q4 FY 16 Q1 FY 16 Q2 FY 16 H1Telecom & Media 38.9% 38.0% 40.0% 43.5% 38.5% 43.0% 34.7% 33.5% 36.8% 35.2%Technology 33.2% 40.1% 39.6% 37.8% 41.6% 37.7% 41.5% 42.0% 40.3% 41.1%Healthcare 18.2% 16.5% 14.5% 13.5% 14.9% 14.1% 15.6% 18.4% 18.2% 18.3%BFSI 2.2% 1.4% 1.5% 1.2% 1.1% 1.0% 2.7% 2.3% 1.2% 1.7%Others 7.5% 4.0% 4.4% 4.0% 3.9% 4.2% 5.5% 3.8% 3.5% 3.7%
Revenue - Offering FY13 FY 14 FY 15 FY 15 Q1 FY 15 Q2 FY 15 Q3 FY 15 Q4 FY 16 Q1 FY 16 Q2 FY 16 H1IT Services (Erst. ADM) 69.0% 72.1% 70.0% 66.1% 71.6% 67.4% 75.0% 75.4% 72.2% 73.8%Mobility 14.2% 13.9% 15.9% 17.4% 15.4% 20.0% 10.4% 11.3% 14.8% 13.1%Product Engineering 16.8% 14.0% 14.1% 16.5% 12.9% 12.6% 14.6% 13.2% 13.0% 13.1%
Revenue Region FY13 FY 14 FY 15 FY 15 Q1 FY 15 Q2 FY 15 Q3 FY 15 Q4 FY 16 Q1 FY 16 Q2 FY 16 H1Offshore Revenue 27.3% 17.9% 21.2% 18.8% 16.9% 27.5% 20.9% 18.9% 22.0% 20.5%Onsite Revenue 72.7% 82.1% 78.8% 81.2% 83.1% 72.5% 79.1% 81.1% 78.0% 79.5%
Revenue - Location FY13 FY 14 FY 15 FY 15 Q1 FY 15 Q2 FY 15 Q3 FY 15 Q4 FY 16 Q1 FY 16 Q2 FY 16 H1USA 85.0% 89.3% 87.1% 86.8% 87.9% 87.9% 85.6% 87.6% 88.5% 88.0%Europe 0.1% 0.1% 0.1% 0.1% 0.1% 0.1% 0.1% 0.1% 0.2% 0.1%India 9.5% 5.8% 6.9% 7.2% 6.5% 6.3% 7.6% 6.4% 6.1% 6.3%APAC 5.4% 4.8% 5.9% 5.9% 5.5% 5.7% 6.7% 5.9% 5.2% 5.6%

© 2015 Infinite Computer Solutions. All Rights Reserved.7
Fact Sheet People Metrics Q2 FY 2015-16
Employees Metrics FY13 FY14 FY 15 FY 15 Q1 FY 15 Q2 FY 15 Q3 FY 15 Q4 FY 16 Q1 FY 16 Q2Total Employees 5075 4882 5138 5079 5325 5365 5138 5063 4991Technical Staff - Billed * 4404 4132 4493 4312 4548 4668 4493 4439 4413Technical Staff - Billed - Offshore 2809 2672 2817 2758 2849 2942 2817 2669 2547Technical Staff - Billed - Onsite 1595 1460 1676 1554 1699 1726 1676 1770 1866Technical Staff – Non-Billable 298 345 281 353 366 320 281 262 222Sales 77 106 96 113 112 98 96 93 88Support Staff 296 299 268 301 299 279 268 269 268
India Headcount 3418 3282 3331 3378 3485 3503 3331 3157 2988Headcount Outside India 1657 1600 1807 1701 1840 1862 1807 1906 2003
Net Additions # 1087 -193 256 197 246 40 -227 -75 -72Attrition Rate - Global 16.81% 16.45% 18.03% 17.43% 17.92% 18.04% 18.74% 18.43% 18.46%* includes consultantsUtilization 89% 84% 79% 80% 78% 80% 78% 79% 81%
Infrastructure Carpet area (sft) No. of seats
Bangalore Campus 94,250 990 Bangalore SEZ 84,694 1,300 Chennai 56,000 457 Gurgaon 21,182 246 Rockville, Maryland 11,270 70 Chicago 3,283 25 Westford, MA 11,051 30 Princeton, NJ 2,675 15 Plano, TX 120 1 Albany, NY 160 2 West Sacramento, CA 1,820 18 Arlington Heights, IL 19,551 138 Total 306,056 3,292

© 2015 Infinite Computer Solutions. All Rights Reserved.8
Fact Sheet DSO Q2 FY 2015-16
The Company does some business in USA which is “Pass Through” in nature where some vendors need to route their business with one of our customers through us, these vendors carry all the risk and liabilities for this business. This business is not core to our activities and carries a very low margin. As a result of this we recognize only the margin from such business as our revenue but the consequent Debtors and Creditors are reflected in our Balance Sheet. Consequently DSO as calculated from our financials is not a true reflection of the efficiency of our receivables, as it does not include the corresponding pass through revenue. The DSO so calculated is reflected in “A” below.
In “B” below the “pass through “revenue is added to the revenue and the DSO is calculated – This is the DSO of our Total Business.
“C” below reflects our DSO from our Core business; i.e. both pass through revenue as well as the corresponding debtors have been removed. The DSO so calculated includes the Unbilled Receivables pertaining to our core business and it is this number which we use to measure the efficiency of realizations.
FY13 FY 14 FY 15 FY 15 Q1 FY 15 Q2 FY 15 Q3 FY 15 Q4 FY 16 Q1 FY 16 Q2A DSO as it appear in
financials =(Debtors + Unbilled Receivables as in Balance Sheet) / Sales in financials)
126 125 139 151 133 122 141 126 125
B DSO of Total Business (Including Pass Thru)
=(Debtors + Unbilled Receivables as in Balance Sheet) / Sales in financials+ Pass thru revenue)
93 99 118 114 116 109 123 111 110
C DSO of Core Business (Excluding Pass Thru)
=(Debtors + Unbilled Receivables as in Balance Sheet) only of core business, ie excluding pass thru Debtors and Unbilled Receivables / Sales as in the financials)
109 106 121 127 116 112 129 115 113
DSO Considering only Receivables (ie Unbilled Receivables are not included)
FY 16 Q2
Total - Only Receivables considered i.e. w/o Unbilled Receivables 77 Core (excluding both Revenue and Debtors of pass through revenue) 77 Financials (including Debtors but excluding Revenue from pass through) 87

© 2015 Infinite Computer Solutions. All Rights Reserved.9
Fact Sheet Net worth Q2 FY 2015-16
Rs in CroreFY13 FY 14 FY 15 FY 16 Q1 FY 16 Q2
Net worth (in Rs. Crores) 596.26 676.30 791.47 825.92 837.47 Return on net worth (after extraordinary and prior period items) 21.90% 13.30% 14.26% 3.09% 3.24%Total cash (in Rs. Crores) * 171.81 112.23 177.63 193.68 203.93 Cash per share 40.37 27.75 44.23 48.23 52.69
The Total Cash is the Amount of Cash & Cash Equivalents, Investment in Liquid Mutual Funds and reduced by the Book Overdraft from Bank
© 2015 Infinite Computer Solutions. All Rights Reserved.10
Fact Sheet Income Statement Q2 FY 2015-16
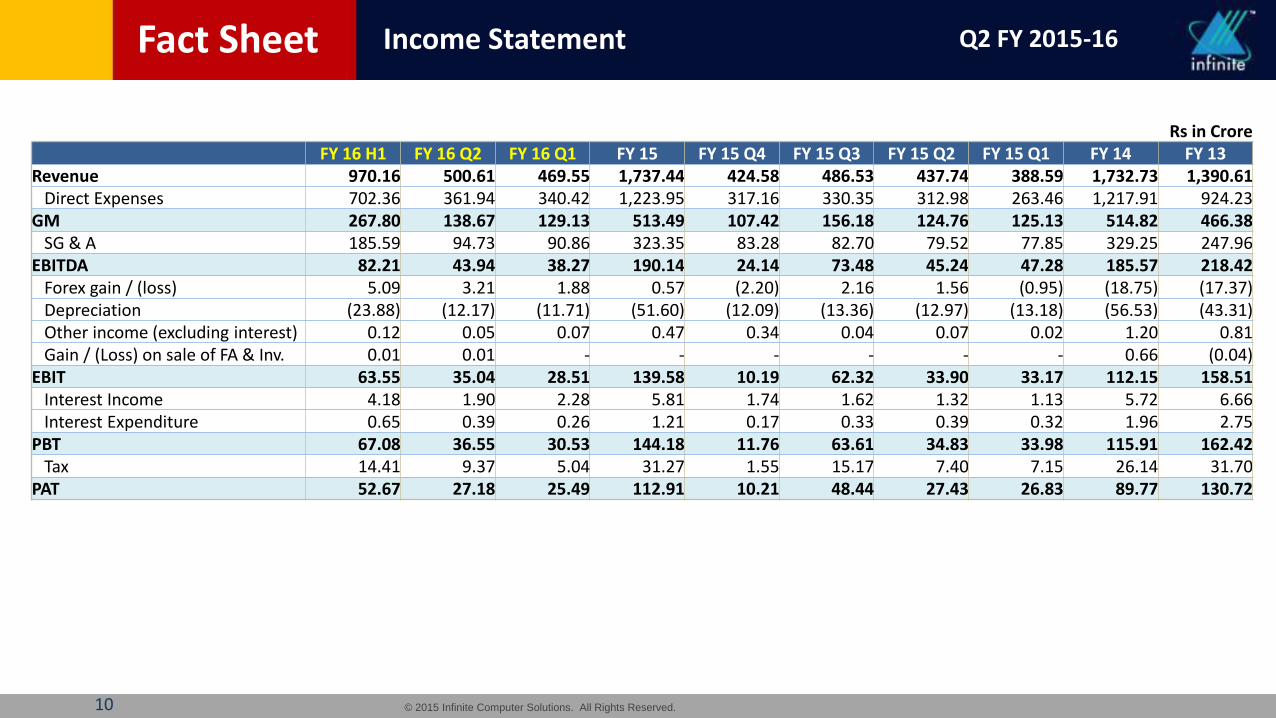
Rs in CroreFY 16 H1 FY 16 Q2 FY 16 Q1 FY 15 FY 15 Q4 FY 15 Q3 FY 15 Q2 FY 15 Q1 FY 14 FY 13
Revenue 970.16 500.61 469.55 1,737.44 424.58 486.53 437.74 388.59 1,732.73 1,390.61 Direct Expenses 702.36 361.94 340.42 1,223.95 317.16 330.35 312.98 263.46 1,217.91 924.23
GM 267.80 138.67 129.13 513.49 107.42 156.18 124.76 125.13 514.82 466.38 SG & A 185.59 94.73 90.86 323.35 83.28 82.70 79.52 77.85 329.25 247.96
EBITDA 82.21 43.94 38.27 190.14 24.14 73.48 45.24 47.28 185.57 218.42 Forex gain / (loss) 5.09 3.21 1.88 0.57 (2.20) 2.16 1.56 (0.95) (18.75) (17.37)Depreciation (23.88) (12.17) (11.71) (51.60) (12.09) (13.36) (12.97) (13.18) (56.53) (43.31)Other income (excluding interest) 0.12 0.05 0.07 0.47 0.34 0.04 0.07 0.02 1.20 0.81 Gain / (Loss) on sale of FA & Inv. 0.01 0.01 - - - - - - 0.66 (0.04)
EBIT 63.55 35.04 28.51 139.58 10.19 62.32 33.90 33.17 112.15 158.51 Interest Income 4.18 1.90 2.28 5.81 1.74 1.62 1.32 1.13 5.72 6.66 Interest Expenditure 0.65 0.39 0.26 1.21 0.17 0.33 0.39 0.32 1.96 2.75
PBT 67.08 36.55 30.53 144.18 11.76 63.61 34.83 33.98 115.91 162.42 Tax 14.41 9.37 5.04 31.27 1.55 15.17 7.40 7.15 26.14 31.70
PAT 52.67 27.18 25.49 112.91 10.21 48.44 27.43 26.83 89.77 130.72
© 2015 Infinite Computer Solutions. All Rights Reserved.11
Fact Sheet Key Financial Ratios Q2 FY 2015-16
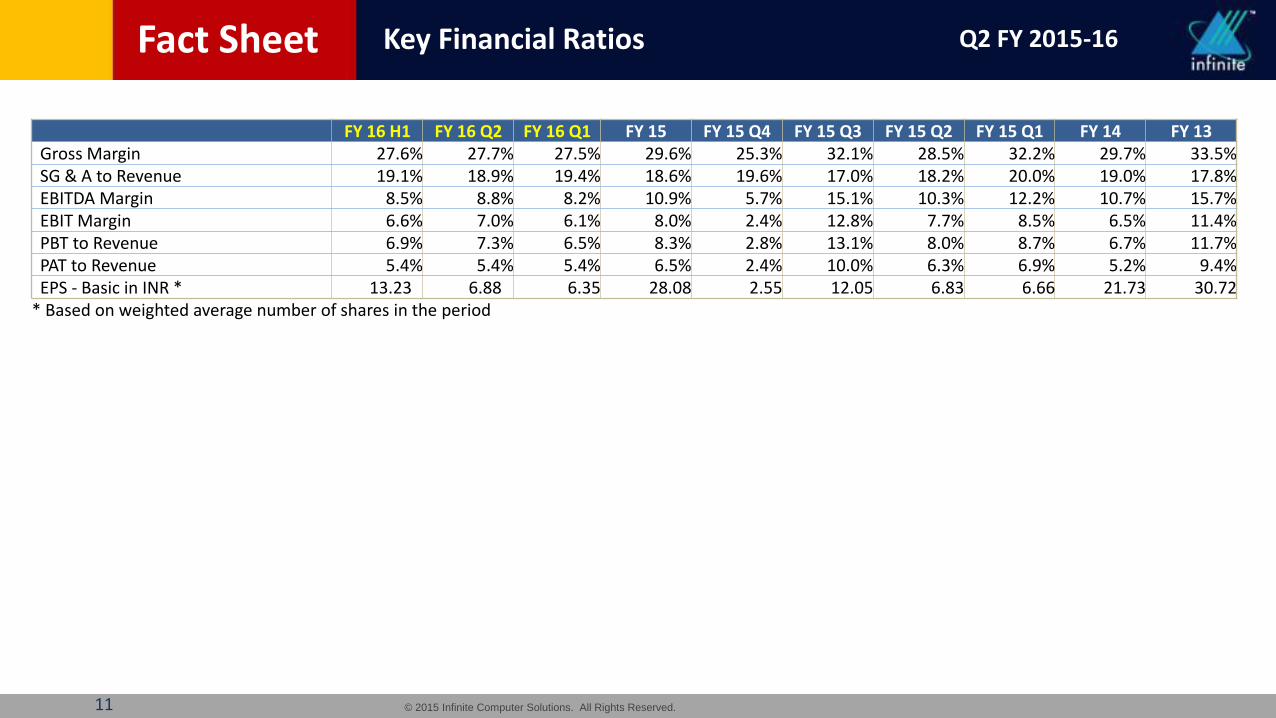
FY 16 H1 FY 16 Q2 FY 16 Q1 FY 15 FY 15 Q4 FY 15 Q3 FY 15 Q2 FY 15 Q1 FY 14 FY 13Gross Margin 27.6% 27.7% 27.5% 29.6% 25.3% 32.1% 28.5% 32.2% 29.7% 33.5%SG & A to Revenue 19.1% 18.9% 19.4% 18.6% 19.6% 17.0% 18.2% 20.0% 19.0% 17.8%EBITDA Margin 8.5% 8.8% 8.2% 10.9% 5.7% 15.1% 10.3% 12.2% 10.7% 15.7%EBIT Margin 6.6% 7.0% 6.1% 8.0% 2.4% 12.8% 7.7% 8.5% 6.5% 11.4%PBT to Revenue 6.9% 7.3% 6.5% 8.3% 2.8% 13.1% 8.0% 8.7% 6.7% 11.7%PAT to Revenue 5.4% 5.4% 5.4% 6.5% 2.4% 10.0% 6.3% 6.9% 5.2% 9.4%EPS - Basic in INR * 13.23 6.88 6.35 28.08 2.55 12.05 6.83 6.66 21.73 30.72
* Based on weighted average number of shares in the period

© 2015 Infinite Computer Solutions. All Rights Reserved.12
Fact Sheet Balance Sheet Q2 FY 2015-16
Rs in CroreFY 16 Q2 FY 16 Q1 FY 15 Q4 FY 15 Q3 FY 15 Q2 FY 15 Q1 FY 14 FY 13
Sources of fundsEquity share capital 38.71 40.16 40.16 40.16 40.16 40.15 40.44 42.56 Reserves 798.76 785.76 751.31 747.63 686.88 649.70 635.86 553.70 Borrowings * 52.37 31.96 59.26 48.70 63.26 50.54 62.33 85.86 Deferred Tax liabilities 24.73 23.91 22.76 22.62 33.25 35.87 34.93 31.13 Long Term Liabilities and Provisions 4.72 4.20 4.14 4.17 4.36 3.66 3.46 3.23 Current Liabilities and Provisions 649.25 606.33 574.12 559.39 517.29 525.64 539.17 480.31 Total Sources of Funds 1,568.54 1,492.32 1,451.75 1,422.67 1,345.20 1,305.56 1,316.19 1,196.79
Application of fundsFixed Assets - Net (including goodwill) 315.20 307.36 295.10 303.25 303.49 304.11 324.35 315.39 Deferred Tax Assets 27.94 24.21 17.61 30.22 19.58 11.90 6.94 11.82 Non Current Investments 1.48 1.43 1.41 1.42 1.39 1.35 1.35 1.22 Current Investments (Short Term Mutual Funds) - - - - - - - 6.71 Long Term Loans and Advances 47.15 48.94 50.50 44.65 42.69 32.84 28.63 23.20 Current Assets 972.84 916.70 901.34 866.65 853.58 846.06 842.69 673.36 Cash and Cash Equivalents 203.93 193.68 185.79 176.48 124.47 109.30 112.23 165.09 Total Uses of Funds 1,568.54 1,492.32 1,451.75 1,422.67 1,345.20 1,305.56 1,316.19 1,196.79
Cash, Mutual Funds less Book Overdraft 203.93 193.68 177.63 175.72 124.47 109.30 112.23 171.81
* For Q2 FY 2016-16: borrowings consist of Rs 51.77 Crores ($ 7.88 mi) from Bank for Working Capital and Rs 0.60 Crores ($ 0.09 mi) Finance Lease for of Vehicles.Working capital loan w.r.t to our US subsidiaries.

© 2015 Infinite Computer Solutions. All Rights Reserved.13
Fact Sheet Cash flow Statement Q2 FY 2015-16
Rs in CroreFY 16 H1 FY 16 Q2 FY 16 Q1 FY 15 FY 15 Q4 FY 15 Q3 FY 15 Q2 FY 15 Q1 FY 14 FY 13
Pre-Tax Profit 67.09 36.55 30.54 144.15 11.76 63.59 34.82 33.98 115.94 162.45 Depreciation 23.88 12.17 11.71 51.60 12.09 13.36 12.97 13.18 56.53 43.31 Other Adjustments (3.53) (1.54) (1.99) (3.90) (1.44) (1.31) (0.36) (0.79) (3.78) (4.38)Change in Working capital 12.32 (16.15) 28.47 (42.87) 3.57 (0.48) (22.82) (23.14) (85.51) (58.52)Taxes Paid (24.13) (6.96) (17.17) (44.34) (19.41) (5.76) (8.27) (10.90) (40.31) (36.14)
Operating Cash Inflow 75.63 24.07 51.56 104.64 6.57 69.40 16.34 12.33 42.87 106.72 Capital Expenditure (26.35) (8.89) (17.46) (18.70) (8.11) (3.56) (3.92) (3.11) (36.66) (79.36)
Free Cash Flow 49.28 15.18 34.10 85.94 (1.54) 65.84 12.42 9.22 6.21 27.36 Changes in Investments - - - - - - - - 6.72 3.37 Interest Received / (Paid) 5.18 3.72 1.46 4.58 1.00 0.54 0.47 2.57 2.34 6.02 Debt Raised/(Repaid) (9.33) 19.34 (28.67) (5.17) 11.11 (16.35) 11.52 (11.45) (34.43) 23.73 Capital Raised/(Repaid) (28.68) (28.68) - (3.47) - - 0.06 (3.53) (22.87) -Dividend and Dividend Tax paid - - - (9.50) - - (9.50) - (24.04) (51.94)
Net change in cash 16.45 9.56 6.89 72.38 10.57 50.03 14.97 (3.19) (66.07) 8.54 Effect of Exchange Difference on translation of foreign currency
1.69 0.69 1.00 1.18 (1.25) 1.97 0.20 0.26 13.21 5.95
Opening Cash 185.79 193.68 185.79 112.23 176.47 124.47 109.30 112.23 165.09 150.60 Closing Cash 203.93 203.93 193.68 185.79 185.79 176.47 124.47 109.30 112.23 165.09

© 2015 Infinite Computer Solutions. All Rights Reserved.14
Related Documents