Earnings and RPP Participation Alex Grey* Policy Research Directorate April 26 th , 2010 *The views expressed in this paper are the author’s and do not necessarily reflect the opinions of Human Resources and Skills Development Canada or of the federal government.

Welcome message from author
This document is posted to help you gain knowledge. Please leave a comment to let me know what you think about it! Share it to your friends and learn new things together.
Transcript

Earnings and RPP ParticipationAlex Grey*
Policy Research Directorate
April 26th, 2010
*The views expressed in this paper are the author’s and do not necessarily reflect the opinions of Human Resources and Skills Development Canada or of the federalgovernment.

2
Issue:
Long-term decline of RPP coverage is important issue.Pensions viewed deferred compensation – no pension implies a loss in compensation unless offset by higher wages.Reason to examine earnings differences between workers with and without an RPP.What are the potential reasons?

3
Existing research:The main issue examined by research is the trade-off between wages and pensions.Pensions as deferred compensation provides a strong theoretical basis. Three broad groups of studies:
– datasets containing both workers with/without RPPs –simplest type of study (this study falls into this group). Generally find workers with RPPs earn 15% more than those without;
– Analyses of workers with RPPs usually incorporating information on type/benefits of RPP;
– Longitudinal studies using matched data of earnings and pensions.

4
Theory:Use model of Smith and Ehrenberg (1983).In Chart 1:
– firm modeled by isoprofit curve with unitary slope which shows combinations of wages and discounted PV of RPP that yield the same profit.
– Worker modeled by indifference curve.Aggregate individual worker and firm curves to obtain market solution.Case where there is no RPP is corner solution. Two possible explanations:
– Worker indifference curves are very flat i.e. strong preference for wages over RPPs;
– Isoprofit curve very steep e.g. large fixed costs of providing RPP for small firms.

$0
$10,000
$20,000
$30,000
$40,000
$50,000
$60,000
$70,000
$80,000
$90,000
$100,000
Chart 1The Trade-Off Between Wages and Promised Pension Benefits
Yearly Increment in Present Value of Promised Pension Benefits ($)Source: Smith and Ehrenberg (1983)
Yearly wage ($)
Employee A
A
X
X
Firm A

6
Theory (con’t):If jobs without RPPs viewed as “bad jobs” (i.e. low productivity) would this explain lack of RPP coverage?Productivity differences result in parallel shifts of the isoprofit curve so don’t explain presence/absence of an RPP.Need another factor e.g., fixed costs of RPP provision ―with lower-productivity jobs, fixed costs become relatively larger hence steeper isoprofit slope.

7
Theory (con’t):
Uses a simple wage regression:lnwit = Xitβ +εit
where the dependent variable, ln wage of individual i in year t, is a function of:
• a standard set of personal characteristics in year t (age and its powers, age cohort, gender, level of education); and
• job-related variables (job tenure, weeks worked, full-time status, union membership, private/public sector, industry, occupation and RPP membership).
Most variables 0,1 dummy variables.Focus is on the RPP variable and its interactions with
other variables.

8
Data:SLID PUMF for 1996, 2001 and 2006.Sample:
– all workers – full-year (49 weeks or more), mostly full-time workers
(main job full-time).Two measures of RPP participation, quite different:
– Self-assessed, RPP member in main job – paired with dependent variable hourly earnings in main job;
– RPP contributions during calendar year – verified against tax data – paired with annual earnings.

9
Data:
Measure of RPP Coverage1996 2001 2006
All workersPension plan in main job (self-assessed) Number 5,322,449 5,669,839 5,943,036 Percentage 47.9% 51.0% 49.4%Pension contributions in calendar year (taxation data) Number .. 3,791,425 4,272,461 Percentage .. 28.0% 29.0%
Full-year, full-time workersPension plan in main job (self-assessed) Number 4,522,793 4,822,049 5,080,140 Percentage 57.7% 59.2% 56.7%Pension contributions in calendar year (taxation data) Number .. 3,209,061 3,639,470 Percentage .. 32.1% 33.2%
Source: Statistics Canada, Survey of Labour and Income Dynamics, unpublished data.
All Persons Table 1. Measures of RPP coverage, 1996, 2001, 2006.

10
Results:
Estimate earnings equation using OLS for 2006 independently and 1996, 2001 and 2006 in pooled regression.In 2006 regression can:– compare results for the two RPP measures (RPP
contributions only available in 2001, 2006; – include industry and occupation variables (can’t be
used in pooled regression because of coding changes).
In general, results for the control variables (personal and job characteristics) are as predicted and are not discussed here.

11
Results: RPP variables in 2006In 2006, those with an RPP earned 21% more (17% more for full-year, full-time (FYFT) workers) on annual basis using RPP contributions measure.In 2006, those with an RPP earned 13% more (17% more for FYFT workers) in main job on hourly basis using the self-assessed RPP measure.Similar results for the two measures in 2006 (at least for FYFT workers) provide some confidence in the of multi-year pooled results pairing hourly earnings and RPP membership in the main job.An RPP earnings advantage is present across almost all age groups —though only cross-sectional data, this does suggest a long-term/career earnings advantage for those with an RPP.No difference in RPP earnings gap between private and public sectors. Confirmed by separate regression where sample limited to private sector.Given RPP benefits are deferred compensation, it is clear that workers in similar jobs without RPPs are not being compensated in terms of wages.

12
Results: Period model, 1996-2006Period and cohort effects are considered in separate specifications.Hourly earnings in the main job is the dependent variable, paired with RPP contributions in the main job.Results for the other independent variables were consistent withthose reported for 2006 and with other research. Earnings increased modestly — 1% (2.5% for FYFT workers) between 1996 -2001 and another 3.4% (3.0%) between 2001-2006.For all workers, individuals with an RPP had earnings that were 21% above those without (20% for FYFT workers) in 1996. A decline in the relative earnings position of jobs with an RPP over 1996-2006 of about 3% for all workers (4% for FYFT workers). Results are consistent with a modest shift in the compensation package away from RPPs as a result of changes in firm costs or worker preferences.

13
Results: Age cohort model, 1996-2006Measures across-cohort average earnings difference for workers with and without an RPP at three ages (1996, 2001 and 2006) for each synthetic five-year age cohort.Cohorts up to age 30-34 (to 25-29 years for FYFT) show an increase in earnings compared to the excluded group, those age 40-44 years in 1996, consistent with other research that indicated a reversal of previous cohort patterns post-1995.RPP earnings gap 21% for all workers (18% for FYFT workers) over1996-2006.Relatively few cohort differences in RPP earnings gap. Decline in the relative earnings of individuals with RPP among those 15-19 years in 2001 and 2006, of 7% and 15% respectively though not true for FYFT workers.The lack of cohort effects suggests that the earnings advantage has not changed over time across different cohorts.Separate regressions for each five-year synthetic cohort over 1996-2006 showed few or no period effects. Indicates that the earnings advantage of workers with RPPs persists within synthetic cohorts as each cohort ages.

14
Results: Tenure cohort model,1996-2006Measures across-cohort average earnings difference for workers with and without an RPP at three tenure levels (1996, 2001 and 2006) for each synthetic five-year tenure cohort.An important difference between tenure-based and age-based cohorts is that short-term tenure includes a much wider distribution of ages.For FYFT workers, cohorts up to tenure of 15-20 years show an increase in earnings compared to the excluded group, tenure 15-20 years.For all workers, individuals with an RPP had earnings that were 17% above those without (17% for FYFT workers) over 1996-2006. Almost no cohort effects observed in RPP earnings gap. For individuals with five or fewer years’ tenure, workers with an RPP still experienced an earnings advantage in order of 22% for all workers (20% for FYFT workers), though by 2006 this advantage had declined to 11% for all workers (13% for FYFT workers).
15
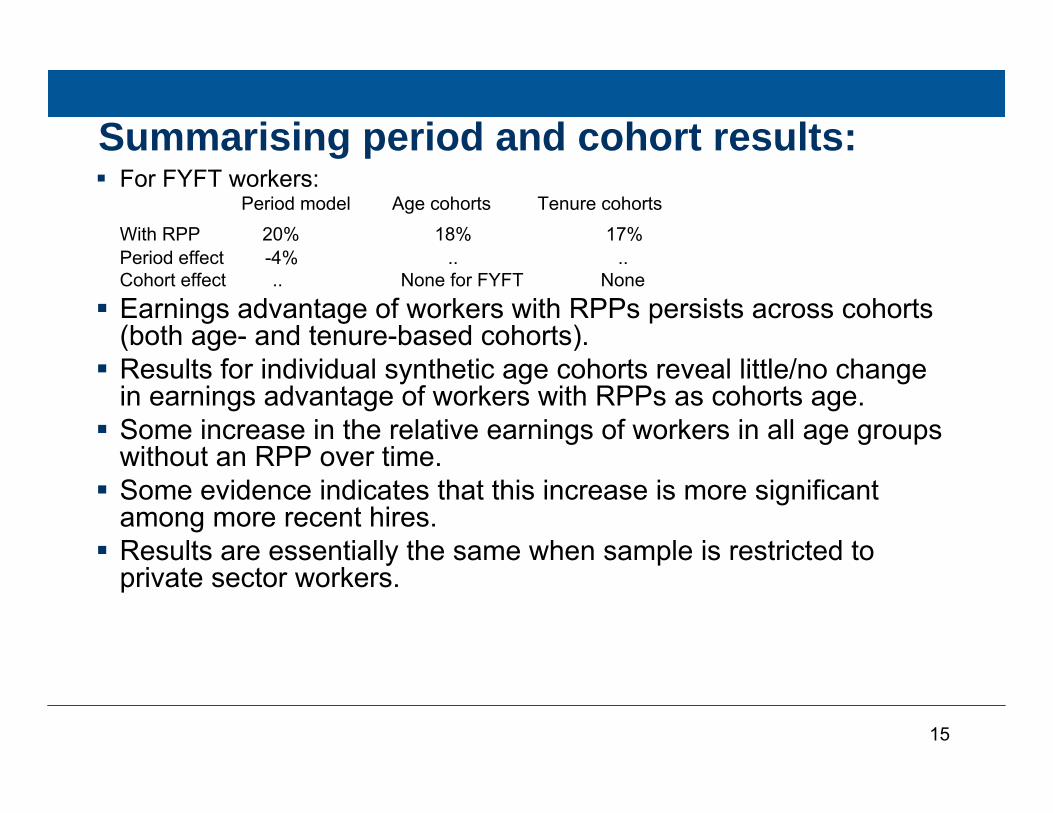
Summarising period and cohort results:For FYFT workers:
Period model Age cohorts Tenure cohortsWith RPP 20% 18% 17%Period effect -4% .. ..Cohort effect .. None for FYFT None
Earnings advantage of workers with RPPs persists across cohorts (both age- and tenure-based cohorts).Results for individual synthetic age cohorts reveal little/no change in earnings advantage of workers with RPPs as cohorts age.Some increase in the relative earnings of workers in all age groups without an RPP over time.Some evidence indicates that this increase is more significant among more recent hires.Results are essentially the same when sample is restricted to private sector workers.

16
Workers being compensatedPossible explanation of observed increase in earnings of those without in RPP is change in the RPP-earnings trade-off that is affecting more recent hires:
– Firms may be offering greater wage compensation for foregone pensions e.g., survey results indicate firms’pension costs as an issue of considerable importance (Conference Board of Canada, 2009, 2010).
– Alternatively, worker preferences may have shifted against RPPs, resulting in higher earnings as compensation for foregone RPP benefits.

17
Workers not being compensatedProductivity increases for post-1995 hires can be taken as either pensions or wages.But cannot explain a shift in the relative earnings of those with and without RPPs (in Chart 1 a productivity increase would be represented by a parallel outward shift of the firm’s isoprofit curve). If post-1995 jobs are higher productivity and RPP provision more costly for firms, the result would be a higher share of new higher productivity positions without RPPs and a rise in the relative earnings of individuals without an RPP.

18
Decline in share with an RPPWhat are the implications of the long-term fall in the share of individuals with an RPP?
– Workers without RPPs earn in the range of 17% less (2006) than those with RPPs across all age groups — consistent with similar studies in the U.S.
– As RPPs are deferred compensation, lower earnings of workers without RPPs means that their lifetime compensation is lower still.
– Over 1996-2006 average earnings were increasing and average earnings of workers without an RPP were increasing slightly faster than those with an RPP.
– Earnings advantage of those with an RPP has declined only modestly over this period and their earnings advantage is still significant among recent hires.
The long-term decline in RPP coverage means Canada experiencing a decline in “good” or higher-compensation jobs.

19
Implications:Paper reflects general approach that retirement income influenced by broader issues e.g., compensation levels and firm practices, savings behaviour, macro-economic performance. Analyses of retirement income focusing on the issue of individuals without RPPs need to take into account that these individuals have also earned less during their careers.Public components of the RIS are more effective at replacing lower income levels. This may partly explain research results showingrelatively high replacement rates of individuals without RPPs.A rise in the share of individuals without RPPs means that the retirement income of more individuals will be determined by the parameters of public RIS programs.Inadequate retirement savings of a significant share of those without RPPs may be a result of lower incomes, which make saving for retirement more difficult. If so, these results suggest it is a long-term problem.
Related Documents