Institutional Matrix and Historical Conditions as Basic Factors of Early-Stage Entrepreneurial Activity PhD Olga Obraztsova, Prof. Dr. Alexander Chepurenko, Maria Gabelko, State University – Higher School of Economics (HSE) Moscow, Russia JEL Classifications L26 - M13 - C42 - C43 – C46 - O57 - P51 Keywords: Early-Stage Entrepreneurship - Startups - Survey methods –Comparative Studies of Countries - Comparative Analysis of Economic Systems - Index Numbers and Aggregation - Specific Distributions; Specific Statistics Abstract The paper aims to argue that developing an explanatory model of the early-stage entrepreneurial activity (EEA) one should consider the ‘path dependency’ of the ‘institutional matrix’ of different societies. Otherwise one might be wondering why some theoretical models of EEA determining factors proved by a lot of studies are not statistically significant now for younger market systems and entrepreneurship in transitional economies. Comparing of GEM data with the scope of official statistics provides a deeper insight into adults’ intrinsic incentives to become entrepreneurial. Statistical analysis of national TEA levels don’t support the thesis on a significance of EEA level and structure changes under economic slowdown, so it seems logical to suggest that what is important to interpret the TEA level is not so much the actual economic situation itself but rather some fundamental specific of different types of national markets. When testing this hypothesis, the authors compared the characteristics of GEM countries with stable, high or low TEA level. A linear discriminant analysis (LDA) is used to examine whether different groups of countries can be distinguished by linear combinations of predictor variables and to determine which variables are responsible for this separation. The LDA model explains the parabolic form of relation between the level of economic development and EEA. A database of independent variables includes some different quantitative, ordinal and nominal variables determining the context of the national capital accumulation history. Using LDA, we argue, one might foresee future tendencies of EEA - not only for GEM participating countries. Contact: Prof. Olga Obraztsova, PhD (Ec.), State University – Higher School of Economics (HSE), 20, Myasnitskaya St., Moscow, 101000, Russia; email [email protected] , [email protected] Phone number: +7(495)7729590*2002, Fax number: +7(495)7790842 Prof. Alexander Chepurenko, Dr. (Ec.), State University – Higher School of Economics (HSE), 20, Myasnitskaya St., Moscow, 101000, Russia; email [email protected] Phone number: +7(895)7645129 Maria Gabelko, State University – Higher School of Economics (HSE), 20, Myasnitskaya St., Moscow, 101000, Russia; email [email protected] Phone number: +7(495)7729590*2002

Welcome message from author
This document is posted to help you gain knowledge. Please leave a comment to let me know what you think about it! Share it to your friends and learn new things together.
Transcript

Institutional Matrix and Historical Conditions as Basic Factors of Early-Stage Entrepreneurial Activity
PhD Olga Obraztsova, Prof. Dr. Alexander Chepurenko, Maria Gabelko, State University – Higher School of Economics (HSE) Moscow, Russia
JEL Classifications L26 - M13 - C42 - C43 – C46 - O57 - P51
Keywords: Early-Stage Entrepreneurship - Startups - Survey methods –Comparative Studies of Countries -
Comparative Analysis of Economic Systems - Index Numbers and Aggregation - Specific Distributions; Specific
Statistics
Abstract
The paper aims to argue that developing an explanatory model of the early-stage entrepreneurial activity (EEA) one
should consider the ‘path dependency’ of the ‘institutional matrix’ of different societies.
Otherwise one might be wondering why some theoretical models of EEA determining factors proved by a lot of
studies are not statistically significant now for younger market systems and entrepreneurship in transitional
economies.
Comparing of GEM data with the scope of official statistics provides a deeper insight into adults’ intrinsic incentives
to become entrepreneurial. Statistical analysis of national TEA levels don’t support the thesis on a significance of
EEA level and structure changes under economic slowdown, so it seems logical to suggest that what is important to
interpret the TEA level is not so much the actual economic situation itself but rather some fundamental specific of
different types of national markets.
When testing this hypothesis, the authors compared the characteristics of GEM countries with stable, high or low TEA
level. A linear discriminant analysis (LDA) is used to examine whether different groups of countries can be
distinguished by linear combinations of predictor variables and to determine which variables are responsible for this
separation.
The LDA model explains the parabolic form of relation between the level of economic development and EEA. A
database of independent variables includes some different quantitative, ordinal and nominal variables determining the
context of the national capital accumulation history. Using LDA, we argue, one might foresee future tendencies of
EEA - not only for GEM participating countries.
Contact: Prof. Olga Obraztsova, PhD (Ec.), State University – Higher School of Economics (HSE), 20, Myasnitskaya St., Moscow, 101000, Russia; email [email protected], [email protected] Phone number: +7(495)7729590*2002, Fax number: +7(495)7790842 Prof. Alexander Chepurenko, Dr. (Ec.), State University – Higher School of Economics (HSE), 20, Myasnitskaya St., Moscow, 101000, Russia; email [email protected] Phone number: +7(895)7645129 Maria Gabelko, State University – Higher School of Economics (HSE), 20, Myasnitskaya St., Moscow, 101000, Russia; email [email protected] Phone number: +7(495)7729590*2002

Institutional Matrix and Historical Conditions as B asic Factors of Early-Stage Entrepreneurial Activity
1. Introduction
It is a growing number of research papers based on GEM seeking to examine the general correlation between
entrepreneurial activity and the economic growth (Thurik, 1999; Audretsch et al., 2002; van Stel, Carree & Thurik,
2005) at present. Usually, the GDP per capita indicator is used as the general indicator of economic growth – hence,
differences in entrepreneurial activity of population should result in different levels of GDP per capita. And vice
versa, different levels of GDP per capita are to some kind ‘responsible’ for the ‘quality’ of the entrepreneurial activity
(motivation structure).
A detailed statistical analysis of data on levels of early-stage entrepreneurial activity(EEA) in GEM countries
(Obraztsova, 2009) has not found support for statistically significant changes of the average annual Total EEA (TEA)
rates under crisis when the GDP per capita decreased to a very different extent in most GEM countries. Moreover, we
could not find any support for the thesis that the changes in the TEA levels in some countries – like Russia for
instance – show significant correlation with change of socio-demographic structure of early entrepreneurs in them.
Regression analysis does not confirm the predicted associations between gender, age or the perceptual variables and
new business creation neither in the period before the crisis nor in its deepest stage in 2009 across all respondents in
Russia. The regression parameters are not significant.
Testing the influence of demographic variables and of perceptions, two models were been constructed. Model 1 was
based on variables measuring the demographic characteristics of the respondent (age, education, working status).
Model 2 includes four additional theoretically important independent variables: ‘perceives opportunities’, ’sufficient
skills’, ‘fear of failure’ and ‘knows and entrepreneur’. There are not any significant factors among them.
In the first step, we entered those variables measuring the demographic characteristics of the respondent (age,
education, working status). The predicted significance of those factors for individual employment status choice was
not supported.
These evidences brought us to a suggestion that there are some other – deeper – factors matrixes of socio-economic
nature which could be more useful to explain (1) the differences in the TEA structure and dynamics between
countries, (2) different reactions on the same macro-economic shocks.
Our approach is more following to the line of Miller and Friesen (1978) and Gartner (1985) leading to the
construction of some ‘archetypes’ which using biological perspectives to understand differences among organizational
populations.
This paper tries to examine whether an institutional matrix (as a result of historical development process of national
economy) has an effect on the national determinants of early entrepreneurial activity.
2. Literature background
The existing literature in entrepreneurship describe the actor’s decision to establish a new venture as a dependent
variable using a set of variables including gender, age, education, network, risk aversion (i.e. fear of failure) and
confidence about one's own skills and knowing other entrepreneurs, from the one side, and macroeconomic factors

determining entrepreneurial activity level (as level of socio-economic development, type of settlement et cetera), from
the other side, as important predictors of it.
Since Schumpeter, the thesis that entrepreneurship is ‘responsible’ for economic and social growth belongs to very
common axiomatic notions. As regards the measurement of the latter, for a good portion of the 20th century there was
an implicit assumption that economic growth results in growing Gross Domestic Products (GDP).
However, under transition to post-modern or ‘affluent’ society, the GDP per capita becomes insufficient to understand
real economic and social progress – other indicators become more appropriate for this purpose (for instance, the
human development index). Moreover, we assume that the GDP per capita is less appropriate for cross-countries
analysis of entrepreneurship development because it implies a measurement of different types of societies using a
criteria which is most appropriate only for one of them..
To avoid this, for instance the GEM seeks to compare / differentiate countries with different GDP per capita levels
and its impact on early entrepreneurship dynamic while dividing all participating countries in three groups with
different types of socioeconomic development:
Factor-Driven Economies (as Angola, Bolivia, Bosnia and Herzegovina*, Colombia*, Ecuador*, Egypt, India, Iran*)
Efficiency-Driven Economies (as Argentina, Brazil, Chile, Croatia**, Dominican Republic, Hungary**, Jamaica,
Latvia, Macedonia, Mexico, Peru, Romania, Russia, Serbia, South Africa, Turkey, Uruguay)
Innovation-Driven economies (as Belgium, Denmark, Finland, France, Germany, Greece, Iceland, Ireland, Israel,
Italy, Japan, Republic of Korea, Netherlands, Norway, Slovenia, Spain, United Kingdom, United States)
* Transition country: from factor-driven to efficiency-driven
** Transition country: from efficiency-driven to innovation-driven (Bosma, N., e.a., 2008).
This classification follows to the 2008 Global Competitiveness Report and is relevant to differentiate countries in
relation to the type of current economic development. However, even this clustering can hardly be sufficient to
differentiate countries: there are some examples where the distances in GDP per capita between societies belonging to
the same group are bigger than between countries belonging to a different group. Moreover, countries with
comparable GDP per capita seem to belong to different kinds of socioeconomic development.
It looks like GDP is a good indicator to compare the economic well-being of countries with more or less equal
socioeconomic models of development. But it seems to be less adequate to measure the economic state of very
different types of societies.
That is why problems occur if we try to reveal the correlation between entrepreneurship and economic development
arguing in GDP. For instance, Russia which belongs to the group of efficiency driven economies shows in 2006-2009
quite similar rates of adults engaged into entrepreneurial activity like for instance Belgium, France or Germany. And
vice versa: countries, belonging to innovation-driven economies, may have very different levels of entrepreneurial
activity of population.
It is a question which should be answered viewing the GEM data, namely: why rather different countries may look
very similar as regards the early entrepreneurial activity? In our view, to answer it, one should recur to the socio-
historical embeddedness of entrepreneurship framework conditions in the historical matrix of the respective society
what Karl Polanyi (2001) called ‘path dependency’.
It may occur when the civil society is weak, and especially under such circumstances when any society possesses on
natural resources which play an important role on international natural resource markets. A relatively high level of
GDP may have in such societies much less impact on entrepreneurship development than one might assume taking

‘perfect’ market economies with comparable level of GDP per capita, and/or may become favorable for mainly
‘unproductive’ entrepreneurship – with small portion of added and high portion of redistributed value.
Moreover, such a framework conditions may have stronger or weaker or no significant impact on the entrepreneurship
development at any level of GDP per capita. So, economies with significant share of natural resources in domestic
product but small amount of population may function under a paternalist welfare state policy at a very high level of
GDP per capita and very weak incentives to become entrepreneurial. And vice versa: countries with high export quote
of natural resources but big population may have autocratic political regimes excluding big groups of population from
rent benefiting; enabling bureaucrats to become ruling group it leads to growing administrative barriers preventing
bottom-up entrepreneurship development.
The analysis of national institutional matrix and of how the institutions have been formed, how they operate and
change, and how they influence economic behaviour in society has become a major subject of inquiry by
institutionalists in politics, sociology, and economics (Ostrom, 2005b). Our approach is based on a view that
institutions are enduring regularities of human action in situations structured by rules, norms, and shared strategies, as
well as by the physical world (Crawford, & Ostrom, 1995, p. 582).
It is not always that the institutional arrangements explaining start-up process in entrepreneurship are articulated by
individuals. Knowledge of institutional arrangements is habituated and part of the tacit knowledge of a community.
Not all individuals recognize the existence of institutional rules, norms, and strategies and explicitly use it to
formulate some institutional statements. However one looks for institutional components that are used to evaluate
individuals’ behaviour (Collett, 1977) when he/she become an economic agent.
Thus we follow in this paper to the ‘institutions-as-rules’ approach of a polycentric theory, having its roots by Hohfeld
(1913) and Commons (1968) and being developed by E. Ostrom for contemporary developments. ‘Instead of a single
best design that would have to cope with the wide variety of problems faced in different localities, a polycentric
theory generates core principles that can be used in the design of effective local institutions when used by informed
and interested citizens and public officials’ (Ostrom, 2005a, p.6).
The following hypotheses have been determined to be checked in our study on this theoretical background, covering
institutional effects in its broad sense:
H1. The actual economic situation itself is not important to interpret the TEA level;
H2. There are the same social and demographic factors influencing EEA level in a lower-mid developed
transitional economy and in a developed market system:
• gender,
• age,
• education,
• network,
• risk aversion (i.e. fear of failure),
• confidence about agent‘s own skills,
• social networks;
H3. The adult population’s TEA level may be considered as a result of the mix of fundamental factors like current
institutional matrix and historical conditions of national economies’ formation and development (‘path
dependency’).
3. DATA AND METHODOLOGY APPROACH
Adjusting the methodology of our study to reflect especial national features of early entrepreneurial activity in cross-
countries comparisons, a commitment to data integrity and rigorous attention to statistical protocol and unique
methodology should always be a concern of paramount importance. The Global Entrepreneurship Monitor (GEM)
delivers such a database to analyze the dynamics of early entrepreneurial activity level and to classify the countries by
the TEA level after crisis. It must be note that the key WB and UN statistical principles of countries’ participation,
transparency and accountability of national databases should be applied to all aspects of data collection, analysis and
dissemination in GEM (Acs et al., 2007). Our macroeconomic analysis incorporate national level and global economy
level to indicate some general tendencies in early entrepreneurship development in the world.
Quality of data
Compared with the data set, provided by other sources (the World Bank Group Entrepreneurship Survey Data etc.),
GEM data catch “the informality of entrepreneurship” as well as the additional group of potential entrepreneurs (Acs
et al., 2007). The opportunities of GEM data compared with the scope of official statistics allow to capture a deeper
field of entrepreneurs’ and their sponsors’ internal incentives. The strength of GEM stays in the opportunity to
categorize the group of early-stage entrepreneurs (including nascent entrepreneurs (the stage just after registration and
further for 3 months functioning) and baby business owners).
The quality of data available to national GEM teams varies with local capacity, the political situation in a country, its
attention to data collection and harmonization, and the accuracy and timeliness of the questions used to collect data.
Many of national reports supplement their findings with qualitative data collection and analysis, which helps to
validate findings. The GEM Consortium compiled the cross-country data to ensure that the results are comparable
across countries with different languages and cultures and that any known sources of bias are corrected. All the
indicators are harmonized and standardized for comparisons among more than 40 countries – GEM project
participants these years.
Since Russia joined the Global Entrepreneurship Monitor (GEM) project in 2006, we have used the cross-countries
comparisons for the given years 2006-2009 when the GEM included survey results from about 40 countries, with a
total sample of more than 170,600 people.
The object of our study is GEM participating countries and its subject is the relevant countries’ population early-stage
entrepreneurial activity –that has been identified and classified on the base of GEM methodology. The analysis deals
with comparing of the TEA level in GEM countries taking into consideration peculiarities of national institutions and
economic history of each country (see description of all the variables in App.1).
National TEA Level Variation and Its Dynamics Analysis
Given that the GDP was decreasing everywhere in 2009, so the dynamics of the average level of EEA in GEM
participating countries in 2008-2009 shows whether EEA changes under economic crisis and after are statistically
significant. In the case of positive response we might conclude that actual socio-economic conditions are really
important to interpret the TEA level in the country. And to the contrary negative response means that what we need
to explain the TEA level is not so much the actual economic situation.
A first step of national TEA level dynamics analysis has been statistical evaluation of changes observed during the
period of 2006 – 2009 (on the base of Spearman’s Rho) and comparing of variation (on the base of descriptive
statistics - see the Table A2.1 in App.2).
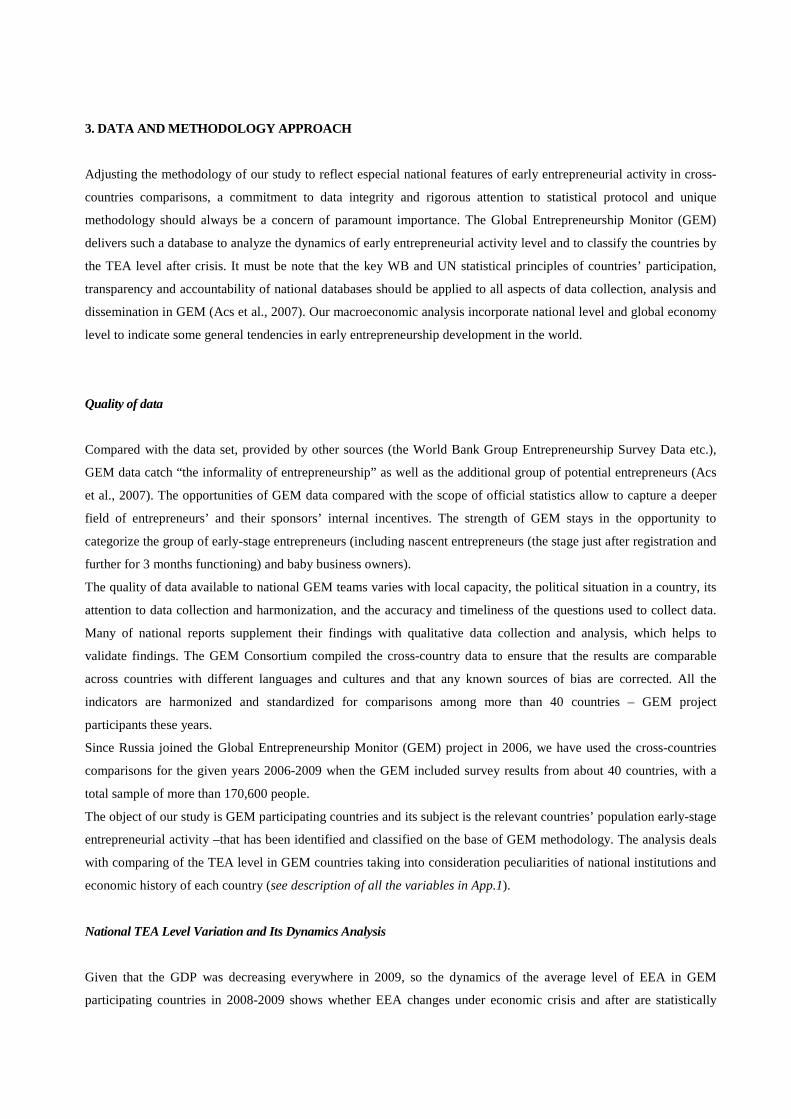
In conducting international comparisons of GEM data, the number of groups for the first phase of cluster analysis was
determined using Sturgis’s criteria. We have used k-means cluster analysis to identify various clusters on the base of
TEA index in 2006-2009 (see the table A2.2 in App.2). The composition of the resulting groups was then optimized
through an iterative process of determining that k value, which would yield a step-like increase in the maximum
among-group variation (sum of squares among groups - SSA) of the σ2SSA value, going from minimum to maximum
values (on aggregate). The result was the identification of a stable 4-cluster structure (see histograms in the fig.1
below).
Statistical instrument of variation analysis was used to study those countries’ TEA distributions. The evaluation of
TEA level dynamics’ significance between groups of countries during the period observed was estimated on the base
of χ2 for checking our first hypothesis.
As the structure of GEM countries’ distribution by TEA level has strongly changed and the mechanisms of structural
changes in this distribution are completely hidden, the correct comprehension of the dynamics characterizing the
economic system might be seriously undermined. Thus we need the Indexes’ factorization method for measuring
early-stage entrepreneurial activity dynamics. This is a way to describe and to quantify what we do or do not know
about the true intensity of the EEA dynamics in the GEM countries by eliminating the effect of redistribution among
groups of countries.
The factorization approach used throughout the system is aimed toward providing a decomposition of changes in
average TEA level into key explanatory factors. As mentioned in (Fisher, J. D., e.a.1994), this decomposition yields a
set of index numbers for distinct two effects — structure and intensity—whose multiplicative product equals the index
of early entrepreneurial activity.
A factorization method is used to develop three types of indexes that explain the change in Early-stage entrepreneurial
activity over time for GEM countries (classified into 4 groups by TEA level – see fig.1 below):
1) Activity index ITEA that shows the annual changes in the average level of early-stage entrepreneurial activity for a
GEM countries’ TEA distribution in a whole;
2) Component-based TEA intensity index I int(TEA) that represents the true effect of annual changing of TEA level in
different countries as structural units of the countries’ total distribution (with fixed sample structure);
∑
∑
∑
∑ ∗∗= ==
ii
iNi
i
ii
iNi
i
TEA n
nTEA
n
nTEA
I0
0,1
0
1
1,1
1
/
∑
∑
∑
∑
=
=
=
=∗∗
=
Nii
iNi
i
Nii
iNi
i
TEA n
nTEA
n
nTEA
I
,11
1,1
0
,11
1,1
1
int /

3) Structural index I struct(TEA) that shows the effect of annual redistribution of countries among groups of them
influenced by different tendencies of national TEA dynamics in the countries of different groups.
One can see that the component-based TEA intensity index is similar in concept to Paashe Index (as index deflator of
GDP). The Paashe Index is based upon an aggregation of annual changes of the TEA variable for different
homogeneous groups of countries, the importance of any specific TEA level depends upon the stable (fixed for the
year 1) share of those countries across all observations.
Structural index I struct(TEA) is similar in concept to Laspeyras Index. Thus Indexes’ factorization model satisfies the
circularity test exactly:
I TEA = I int TEA * I struct TEA Now we can highlight the true trend for intensity of EEA in the population of GEM countries and evaluate the
significance of those non-observed changes, from the one side. Then we have got the possibility to measure the
significance of TEA level dynamics among different GEM participating countries and groups of them. So Indexes’
factorization method is used checking our first hypothesis H1.
Factors of high or low TEA level under slowdown: Variables and Methodology Entrepreneurship in behavioural notion National EEA level may be considered as a resultant force for a lot of inhabitants’ transactions at the labor market. A
person who is thinking of starting a business has 3 choices. He may work for a wage, be self-employed, that is to start
a new business, or he may decide not to work. His decision among the 3 options depends on the relative returns he
expects to receive from each one. Thus his decision is a function of a set of variables. Some of which describe his
personal characteristics and others describe the social, economic and political circumstances in which the decisions
have been made.
Following existing literature in entrepreneurship (Walker, 2000; Renzulli et al., 2000; Arenius et DeClercq, 2005;
Wennekers et al., 2005; Levesque M., and M. Minniti, 2006; Gimeno et al., 1997) we have linked our agent’s decision
to the set including gender, age, education, social networks, risk aversion (i.e. fear of failure) and confidence about
one's own skills and knowing other entrepreneurs - from the one side and to the external factors as type of settlement,
GDP level, economic crisis effects et cetera, from the other side. The data for this step of our research has been
obtained from the Global Entrepreneurship Monitor (GEM) study as a global database of individuals who are in the
process of starting companies. We have used weighted data collected by face-to-face method during the period of
2006 - 2009 in Russia (as in a lower-mid developed transitional economy - measures description see in App. 1).
As the dependent variable is discrete, the ordinary least squares regression can be used to fit a linear probability (LP)
model. However, the linear probability model is heteroskedastic and may predict probability values beyond the (0, 1)
range, the logistic regression model has been used to estimate the factors which influence trip-taking behavior (Stynes
and Peterson, 1984; Greene, 1997). The independent variables have been entered using backward stepwise method
∑
∑
∑
∑
=
=
=
=∗∗
=
Nii
iNi
i
Nii
iNi
i
structTEA n
nTEA
n
nTEA
I
,10
0,1
0
,11
1,1
0
/
(except for the 1-st step, when we have used enter method). In backward stepwise method as a first step, the variables
are entered into the model together and are tested for removal one by one. The removal of variables from the model is
based on the significance of the change in the log-likelihood. Then we have compared our results and previous
findings in entrepreneurship literature. Our second hypothesis H2 that the same determining factors influence EEA
level in a lower-mid developed transitional economy and in a developed market system has been determined to be
checked in our study on the base of Wald statistics Wilk’s lambda estimation that is used for the multiple-group
situation as well.
What components of Institutional Matrix are Basic Factors Explaining EEA differences among countries?
To understand what special features of an economy are responsible for each country’s level of early-stage
entrepreneurial activity (the hypothesis H3) it might be first of all important to compare several characteristics of
GEM countries with very high or very low TEA level and to prove the correlation significance between them and
TEA.
A statistical technique used to examine whether two or more mutually exclusive groups of countries can be
distinguished from each other based on linear combinations of values of predictor variables and to determine which
variables contribute to the separation is linear discriminant analysis (LDA). As you know mutually exclusive means
that a case can belong to only one group. The LDA model can be used, because we obtain information about group
membership of GEM countries and about yearly economic and social indicators with short term gap for each of them.
Our sources of 39 countries have been the GEM data and the data sets of 49 comparable yearly economic and social
indicators, provided by the World Bank Group Entrepreneurship Survey Data and National Statistic Services. The
opportunities of GEM data compared with the scope of official statistics allow to capture a deeper field of
entrepreneurs’ and their sponsors’ internal incentives.
The linear discriminant function is statistically optimal only if the assumptions about the distribution of data values
are met. However, LDA works well, even when the assumptions that make it the best classification rule are violated.
Lim, Loh, and Shih (2000) compared 33 classification algorithms and concluded that the old statistical algorithm
LDA has a mean error rate close to the best.
As a result our database of independents includes some different quantitative variables (as GDP per capita in PPS,
inflation level, gender structure, total migration level, density of population, share of rural population, unemployment
level and so on), ordinal variables (country’s level of economic development, ‘Ease of Doing Business’ Rank) – both
types of variables with short-term time gap - and nominal variables (as institutional matrix of national market
economy – in the context of the national capital accumulation history - or dichotomous oil export). Let us note that
discriminant analysis is robust to violations of the assumption of multivariate normality; dichotomous predictors work
reasonably well. To prepare for our analysis we have transformed nominal predictor variables to a set of dummy
variables (see App. 1 and 4).
Three major phases are recognized in terms of economic development (as in the 2008 and 2009 GEM report): factor-
driven economies, which are primarily extractive in nature, efficiency-driven economies in which scale-intensity is a
major driver of development, and innovation-driven economies.
However, such a generalization seems to be exclude some important features – namely, the path dependency of
current socio-economic development in which some important entrepreneurship features are embedded. The
understanding of any institutional matrix of national market economy and entrepreneurship ‘quality’ implies
considering the overarching pattern of change, or the social formation of institutional matrix as a whole which
undergoes changes, but inherits and transmits some important features from one historic period to another
(Heilbroner, 2008). David Gordon has invented the term ‘social structure of accumulation’ to attract the attention to
the changing institutional and organizational matrix (framework of technical, organizational and ideological
conditions) within which the accumulation process must take place. Gordon's concept, applied to the general problem
of market system development periodization, emphasizes the manner in which the accumulation process first exploits
the possibilities of a ‘stage’ of capitalism, only to confront in time the limitations of that stage which must be
transcended by more or less radical institutional alterations (Gordon, 1980).
Traditionally these periods have been identified as early and late mercantilism; pre-industrial, and early and late
industrial capitalism; and modern (or late, or state) capitalism. These designations can be made more specific by
adumbrating the kinds of institutional change that separate one period from another. These include the size and
character of firms (trading companies, putting-out establishments, manufactories, industrial enterprises of increasing
complexity); methods of engaging and supervising labor (cottage industry through mass production); the appearance
and consolidation of labor unions within various sectors of the economy; technological progress (tools, machines,
concatenations of equipment, scientific apparatus); organizational evolution (sole proprietors, family firms,
managerial bureaucracies, state participation).
The idea of an accumulation process alternately stimulated and blocked by its institutional constraints provides an
illumining heuristic on the intraperiod dynamics of the system, but not a theory of its long-run evolutionary path. This
is because not all national market systems make the transitions either at the same historic periods or with equal ease or
speed from one social structure to another.
Taking into consideration the historical specific of the starting point of national market and enterprising system
formation and development and its embeddedness in the previous historical tracks, 5 different types of countries could
be distinguished: (1) classical capitalist countries, (2) ‘green field’ capitalist countries, (3) new capitalist countries
(overtaking development of national markets and enterprising systems in the first half of 20th century), (4) newest
capitalist countries (post-Colonial, without long socio-economic inception stage) and (5) post-Socialist countries (see
App. 4).
We have plotted pairs of independent variables to see if the relationships among them are approximately linear. As a
result variables list including 32 independents emerged. At the next step of analysis we tested them on the base of
Mahalanobis distance that measures the distance between the centroids of groups: the variable that maximizes this
criterion between the two closest groups is selected for entry. This selection criterion has been chosen because the
average TEA levels differ significantly only between ‘low’ and ‘high’ groups of countries. Thus the LDA model has
been the statistical instrument to check our hypothesis H3 that the EEA of adult population may be established taking
into consideration the institutional matrix and historical conditions of formation and development of national
economies
4. Early-Stage Entrepreneurial Activity in GEM countries: Findings and Discussion What is TEA Dynamics before and under world economic crisis? The results have shown that there are not statistically significant changes for annual TEA level scores (see fig. 1):
early-stage entrepreneurial activity for under economic crisis period has been only 8,9% as much (ITEA= 1.089). Let us

also note that Spearmen’s Rho for annual countries’ TEA ranks has not shown statistically significant changes either
before or under economic crisis conditions. International comparisons conducted during this study show that the
country-level indicators demonstrated a significant level of variation during all the period (with a coefficient of
variation near 70% - see Tables A2.1 – A2.2 in App.2), while the average TEA Index value remained stable around
10-11%.
Fig.1 TEA level in GEM countries: Main Descriptives’ Dynamics
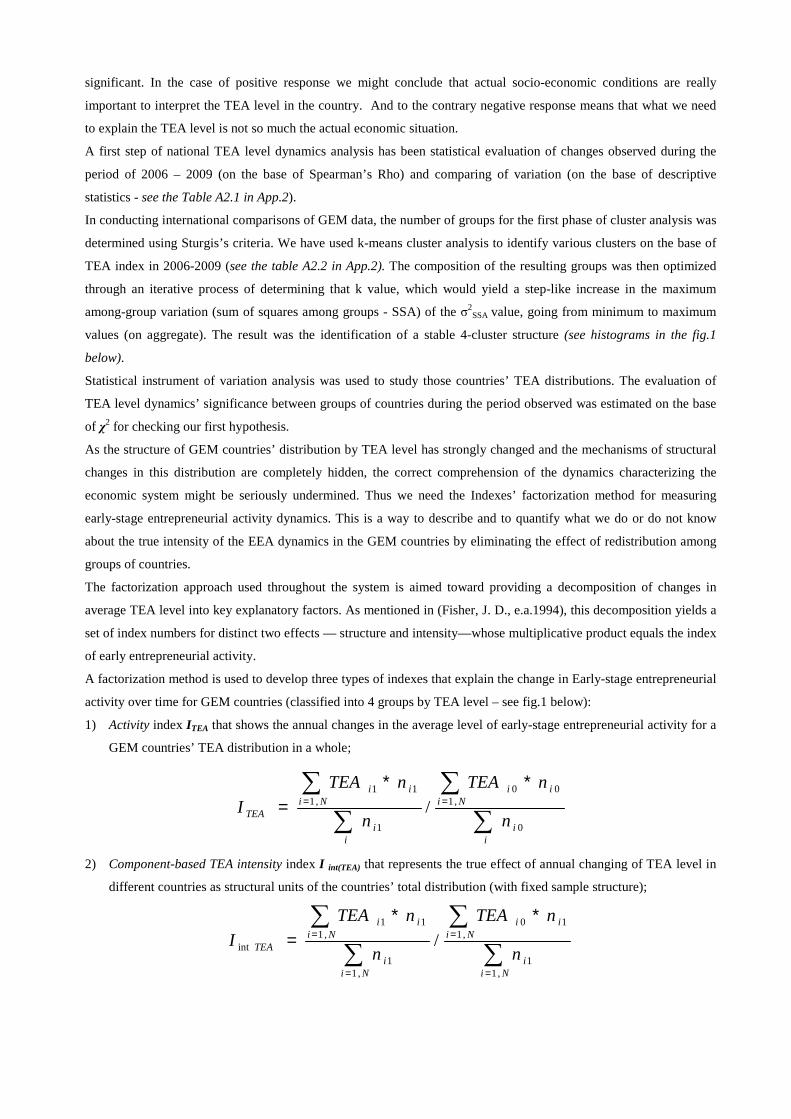
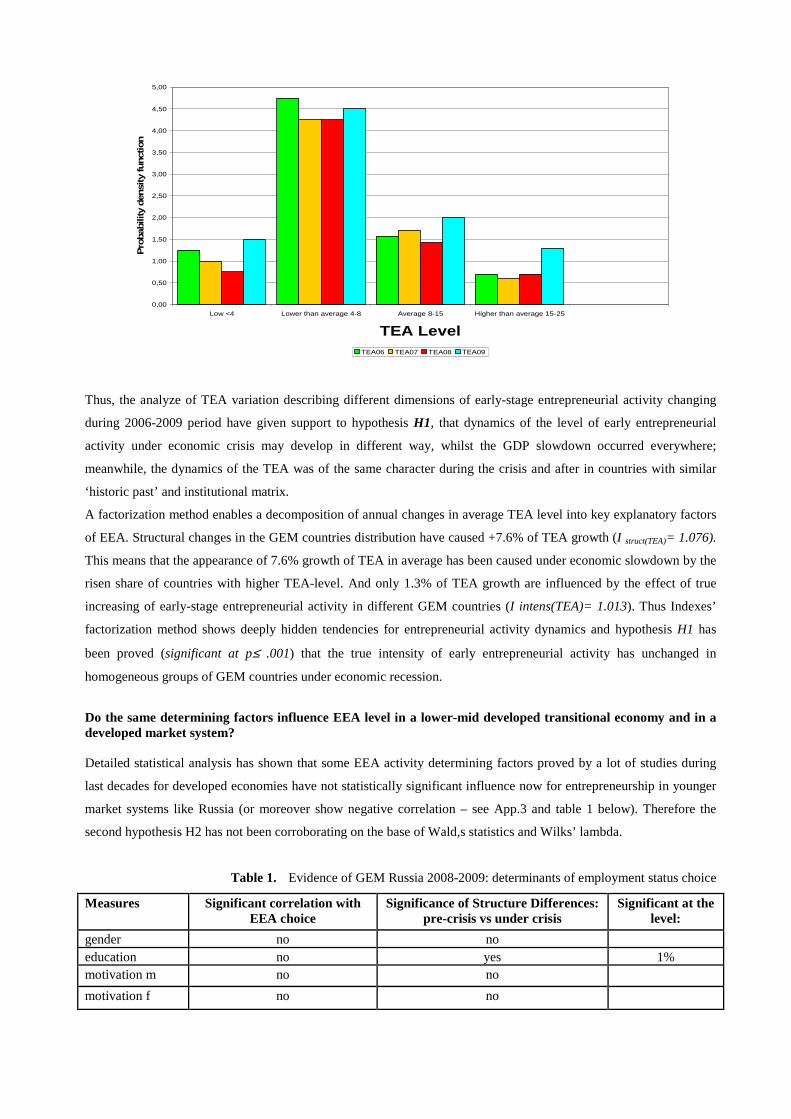
Using GEM data we have analyzed distributions of GEM countries by TEA level in 2006-2009 (see Fig. 2).
The highest TEA scores (with high growth rates) are these ones in the countries of Latin America (Peru, Columbia,
Chile etc.), but entrepreneurial activity does not yield high labour productivity or high-quality macroeconomic
dynamics because of great share of necessity-based entrepreneurship. To the contrary, early-stage entrepreneurial
activity in countries with high levels of per capita GDP (Belgium, Denmark, Japan etc.) is built on a qualitatively
different foundation: it is dominated by opportunity-based entrepreneurship, with higher levels of creativity and
making a greater contribution to economic growth. There are lowest TEA scores in those countries, as well as in
Russian Federation. So one can see now that the development of early-stage entrepreneurial activity in GEM-countries
is not synchronized, and the various national economics yielded clusters that are characterized by varying levels of
socio-economic development, cultural peculiarities, mentality of population and types of state policy vis-à-vis
entrepreneurship. Cluster Membership by TEA Index in 2006-2009 are presented in the Table A2.2 (App.2).
Fig.2 Distribution of GEM countries by TEA level in 2006 - 2009
0,00
0,50
1,00
1,50
2,00
2,50
3,00
3,50
4,00
4,50
5,00
Low <4 Lower than average 4-8 Average 8-15 Higher than average 15-25
TEA Level
Pro
bab
ility
den
sity
funct
ion
TEA06 TEA07 TEA08 ТЕА09
Thus, the analyze of TEA variation describing different dimensions of early-stage entrepreneurial activity changing
during 2006-2009 period have given support to hypothesis H1, that dynamics of the level of early entrepreneurial
activity under economic crisis may develop in different way, whilst the GDP slowdown occurred everywhere;
meanwhile, the dynamics of the TEA was of the same character during the crisis and after in countries with similar
‘historic past’ and institutional matrix.
A factorization method enables a decomposition of annual changes in average TEA level into key explanatory factors
of EEA. Structural changes in the GEM countries distribution have caused +7.6% of TEA growth (I struct(TEA)= 1.076).
This means that the appearance of 7.6% growth of TEA in average has been caused under economic slowdown by the
risen share of countries with higher TEA-level. And only 1.3% of TEA growth are influenced by the effect of true
increasing of early-stage entrepreneurial activity in different GEM countries (I intens(TEA)= 1.013). Thus Indexes’
factorization method shows deeply hidden tendencies for entrepreneurial activity dynamics and hypothesis H1 has
been proved (significant at p≤ .001) that the true intensity of early entrepreneurial activity has unchanged in
homogeneous groups of GEM countries under economic recession.
Do the same determining factors influence EEA level in a lower-mid developed transitional economy and in a developed market system? Detailed statistical analysis has shown that some EEA activity determining factors proved by a lot of studies during
last decades for developed economies have not statistically significant influence now for entrepreneurship in younger
market systems like Russia (or moreover show negative correlation – see App.3 and table 1 below). Therefore the
second hypothesis H2 has not been corroborating on the base of Wald,s statistics and Wilks’ lambda.
Table 1. Evidence of GEM Russia 2008-2009: determinants of employment status choice
Measures Significant correlation with EEA choice
Significance of Structure Differences: pre-crisis vs under crisis
Significant at the level:
gender no no education no yes 1% motivation m no no
motivation f no no
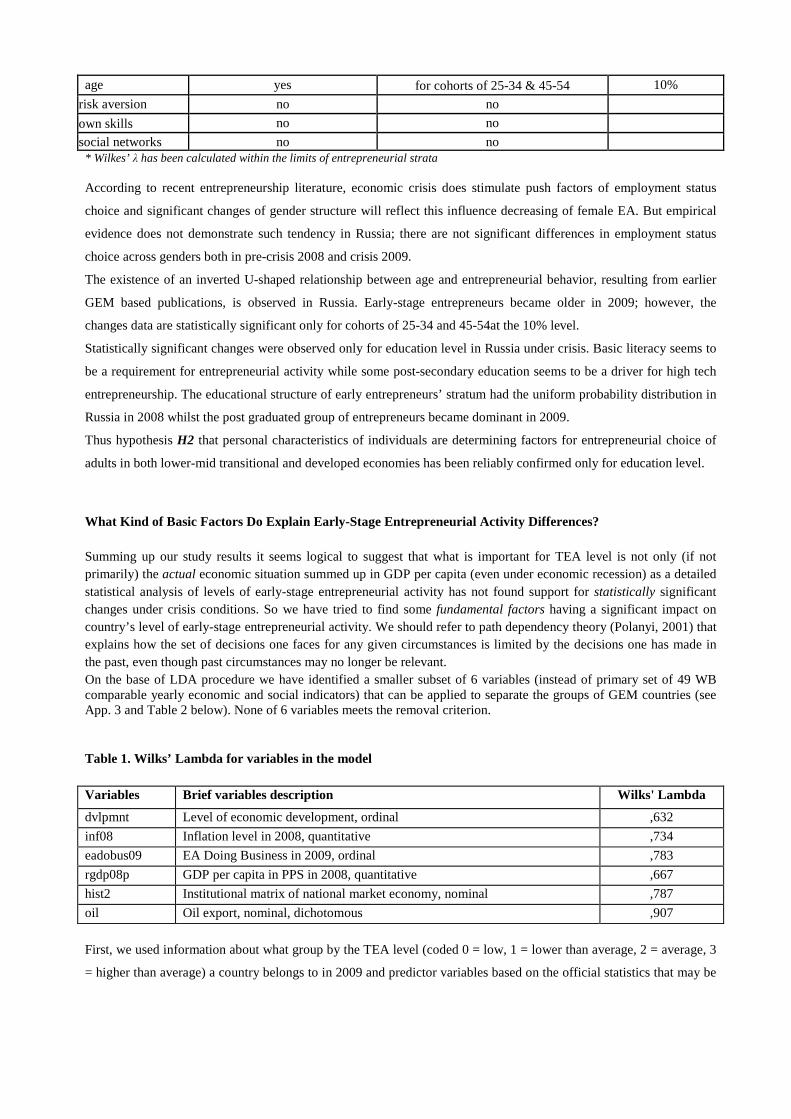
age yes for cohorts of 25-34 & 45-54 10%
risk aversion no no
own skills no no
social networks no no * Wilkes’ λ has been calculated within the limits of entrepreneurial strata According to recent entrepreneurship literature, economic crisis does stimulate push factors of employment status
choice and significant changes of gender structure will reflect this influence decreasing of female EA. But empirical
evidence does not demonstrate such tendency in Russia; there are not significant differences in employment status
choice across genders both in pre-crisis 2008 and crisis 2009.
The existence of an inverted U-shaped relationship between age and entrepreneurial behavior, resulting from earlier
GEM based publications, is observed in Russia. Early-stage entrepreneurs became older in 2009; however, the
changes data are statistically significant only for cohorts of 25-34 and 45-54at the 10% level.
Statistically significant changes were observed only for education level in Russia under crisis. Basic literacy seems to
be a requirement for entrepreneurial activity while some post-secondary education seems to be a driver for high tech
entrepreneurship. The educational structure of early entrepreneurs’ stratum had the uniform probability distribution in
Russia in 2008 whilst the post graduated group of entrepreneurs became dominant in 2009.
Thus hypothesis H2 that personal characteristics of individuals are determining factors for entrepreneurial choice of
adults in both lower-mid transitional and developed economies has been reliably confirmed only for education level.
What Kind of Basic Factors Do Explain Early-Stage Entrepreneurial Activity Differences? Summing up our study results it seems logical to suggest that what is important for TEA level is not only (if not primarily) the actual economic situation summed up in GDP per capita (even under economic recession) as a detailed statistical analysis of levels of early-stage entrepreneurial activity has not found support for statistically significant changes under crisis conditions. So we have tried to find some fundamental factors having a significant impact on country’s level of early-stage entrepreneurial activity. We should refer to path dependency theory (Polanyi, 2001) that explains how the set of decisions one faces for any given circumstances is limited by the decisions one has made in the past, even though past circumstances may no longer be relevant.
On the base of LDA procedure we have identified a smaller subset of 6 variables (instead of primary set of 49 WB comparable yearly economic and social indicators) that can be applied to separate the groups of GEM countries (see App. 3 and Table 2 below). None of 6 variables meets the removal criterion. Table 1. Wilks’ Lambda for variables in the model Variables Brief variables description Wilks' Lambda
dvlpmnt Level of economic development, ordinal ,632
inf08 Inflation level in 2008, quantitative ,734
eadobus09 EA Doing Business in 2009, ordinal ,783
rgdp08p GDP per capita in PPS in 2008, quantitative ,667
hist2 Institutional matrix of national market economy, nominal ,787
oil Oil export, nominal, dichotomous ,907
First, we used information about what group by the TEA level (coded 0 = low, 1 = lower than average, 2 = average, 3
= higher than average) a country belongs to in 2009 and predictor variables based on the official statistics that may be
useful for distinguishing the groups. We had no problems with missing values of TEA index but a lot of the predictor
variables was been missing (in total) for 11 of 51 GEM countries.
The best option for the treatment of the missing values is to use sophisticated statistical techniques to impute the
missing values for each variable, provided that they meet the particular missing-value model we have selected. But it
is impossible without available adequate information. So we could not impute missing social and economic indicators
then apply the strategy of cases elimination.
As discriminant analysis is very sensitive to outliers that affect the means of the groups, we have looked for outliers
either in TEA index or in the predictor variables and we have had to eliminate Norway out of database. As a result
population of GEM countries that we have classified by TEA level has included 39 of these ones in 2009.
It must be noted that we used k-means cluster analysis to identify creating categories on the TEA index as the groups
have been formed from actual scores on quantitative variable. The composition of the creating groups was then
optimized through an iterative process of determining that k value, which would yield a step-like increase in the
maximum among-group variation (sum of squares among groups - SSA) of the σ2SSA value, going from minimum to
maximum values (on aggregate). Descriptive statistics for each of the groups by TEA09 show that countries with low
level of TEA09 are more likely to be developed, have higher GDP per capita and lower inflation level, but they are
less homogeneous by easy doing business rank.
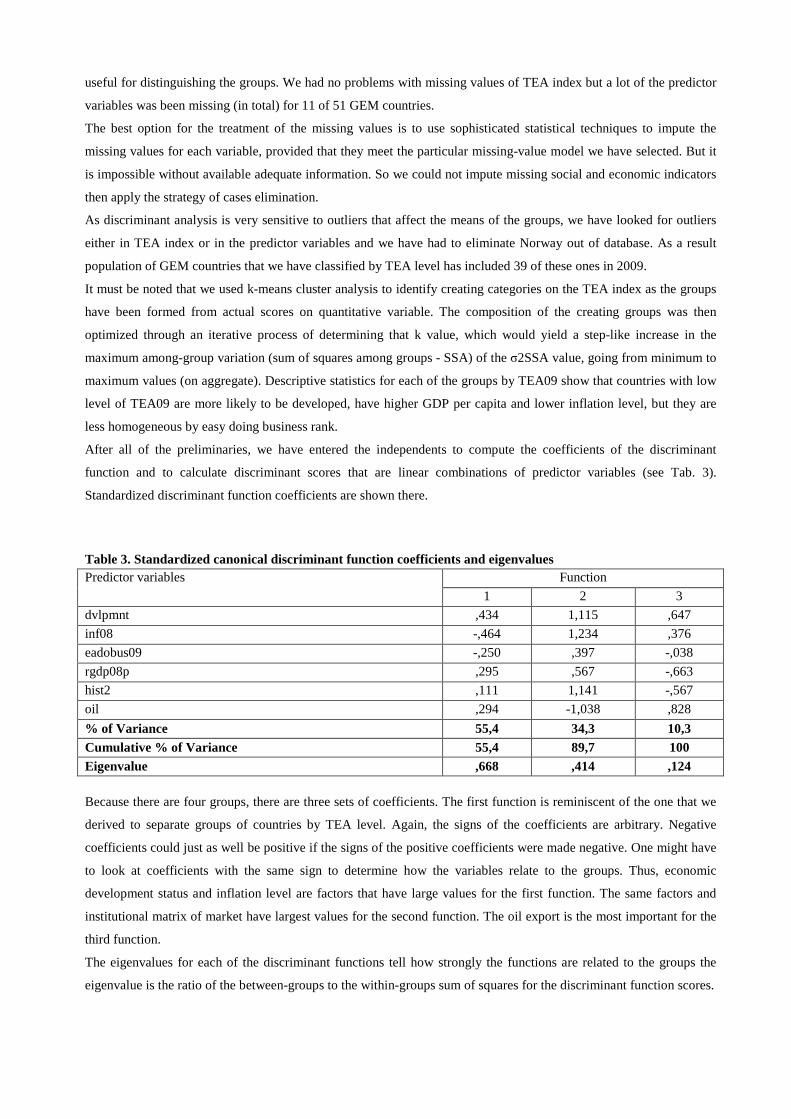
After all of the preliminaries, we have entered the independents to compute the coefficients of the discriminant
function and to calculate discriminant scores that are linear combinations of predictor variables (see Tab. 3).
Standardized discriminant function coefficients are shown there.
Table 3. Standardized canonical discriminant function coefficients and eigenvalues Predictor variables Function
1 2 3
dvlpmnt ,434 1,115 ,647
inf08 -,464 1,234 ,376
eadobus09 -,250 ,397 -,038
rgdp08p ,295 ,567 -,663
hist2 ,111 1,141 -,567
oil ,294 -1,038 ,828
% of Variance 55,4 34,3 10,3 Cumulative % of Variance 55,4 89,7 100 Eigenvalue ,668 ,414 ,124 Because there are four groups, there are three sets of coefficients. The first function is reminiscent of the one that we
derived to separate groups of countries by TEA level. Again, the signs of the coefficients are arbitrary. Negative
coefficients could just as well be positive if the signs of the positive coefficients were made negative. One might have
to look at coefficients with the same sign to determine how the variables relate to the groups. Thus, economic
development status and inflation level are factors that have large values for the first function. The same factors and
institutional matrix of market have largest values for the second function. The oil export is the most important for the
third function.
The eigenvalues for each of the discriminant functions tell how strongly the functions are related to the groups the
eigenvalue is the ratio of the between-groups to the within-groups sum of squares for the discriminant function scores.

The final goal has been to find a linear combination of values of the independent variables that best separates
countries that belongs to different groups by TEA09. The number of functions that we have calculated to separate the
groups is one fewer than the number of groups. So we have derived three functions, but that doesn't mean they all
contribute to the separation of the groups. The functions go from best to worst in terms of the ratios of the between-
groups to within-groups sums of squares. Pooled within-groups correlations between discriminating variables and
standardized canonical discriminant functions are presented in structure matrix below (Tab. 4, there are variables
ordered by absolute size of correlation within function in it).
Table 4. Structure matrix Predictor variables Function
1 2 3
dvlpmnt ,923(*) ,158 ,155
rgdp08p ,859(*) ,087 ,165
inf08 -,638(*) ,338 ,583
eadobus09 -,633(*) -,041 ,264
hist2 -,563(*) ,364 -,203
oil -,158 ,040 ,827(*)
* Largest absolute correlation between each variable and any discriminant function Tab. 4 shows that 5 of the variables are associated with the first function, only oil export is the most strongly
associated correlate with the third one. The variables are sorted so that variables that have large correlations with the
same function are together. This may help in interpreting the functions.
Function 1: The younger and more rapidly prospering (under good macroeconomic circumstances, including low
administrative barriers for stating business) is a market economy in a country, the higher becomes the early-stage
entrepreneurial activity.
Function 2: Old well established market economies have fewer incentives encouraging adults to become
entrepreneurial unless historical matrix is favourable and inflation slightly enforces to start-up (however, with low
significance).
Function 3: If the history plays a moderate negative role, rent-seeking and inflation will explain the level of early-
stage entrepreneurial activity in some of (emerging) market economies.
Ideally, we would like to assign large scores to countries in one group and small scores to countries in the other. That
way, we can use the scores to predict the group to which a country belongs. So the scores are chosen so that their
values are similar for countries in the same group and different for countries in different groups. We can evaluate the
scores using the non-standardized discriminant function coefficients that are shown in Tab. 5 below.
Table 5. Canonical discriminant function coefficients (non-standardized coefficients) Predictor variables Function
F1 F2 F3
dvlpmnt ,784 2,014 1,169
inf08 -,086 ,229 ,070
eadobus09 -,006 ,009 -,001
rgdp08p ,000 ,000 ,000
hist2 ,077 ,794 -,395
oil09 ,965 -3,403 2,713
(Constant) -,916 -8,560 ,211
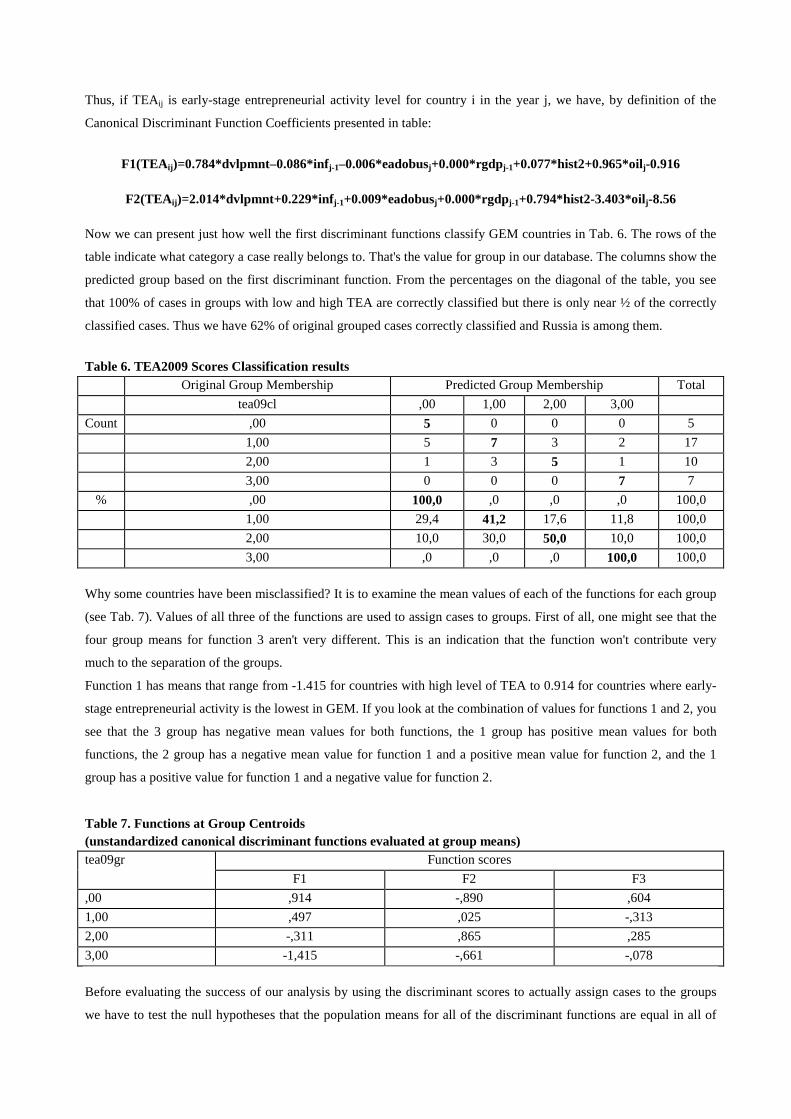
Thus, if TEAij is early-stage entrepreneurial activity level for country i in the year j, we have, by definition of the
Canonical Discriminant Function Coefficients presented in table:
F1(TEA ij )=0.784*dvlpmnt–0.086*infj-1–0.006*eadobusj+0.000*rgdpj-1+0.077*hist2+0.965*oilj-0.916
F2(TEA ij )=2.014*dvlpmnt+0.229*infj-1+0.009*eadobusj+0.000*rgdpj-1+0.794*hist2-3.403*oilj-8.56
Now we can present just how well the first discriminant functions classify GEM countries in Tab. 6. The rows of the
table indicate what category a case really belongs to. That's the value for group in our database. The columns show the
predicted group based on the first discriminant function. From the percentages on the diagonal of the table, you see
that 100% of cases in groups with low and high TEA are correctly classified but there is only near ½ of the correctly
classified cases. Thus we have 62% of original grouped cases correctly classified and Russia is among them.
Table 6. TEA2009 Scores Classification results
Original Group Membership Predicted Group Membership Total
tea09cl ,00 1,00 2,00 3,00
Count ,00 5 0 0 0 5
1,00 5 7 3 2 17
2,00 1 3 5 1 10
3,00 0 0 0 7 7
% ,00 100,0 ,0 ,0 ,0 100,0
1,00 29,4 41,2 17,6 11,8 100,0
2,00 10,0 30,0 50,0 10,0 100,0
3,00 ,0 ,0 ,0 100,0 100,0
Why some countries have been misclassified? It is to examine the mean values of each of the functions for each group
(see Tab. 7). Values of all three of the functions are used to assign cases to groups. First of all, one might see that the
four group means for function 3 aren't very different. This is an indication that the function won't contribute very
much to the separation of the groups.
Function 1 has means that range from -1.415 for countries with high level of TEA to 0.914 for countries where early-
stage entrepreneurial activity is the lowest in GEM. If you look at the combination of values for functions 1 and 2, you
see that the 3 group has negative mean values for both functions, the 1 group has positive mean values for both
functions, the 2 group has a negative mean value for function 1 and a positive mean value for function 2, and the 1
group has a positive value for function 1 and a negative value for function 2.
Table 7. Functions at Group Centroids (unstandardized canonical discriminant functions evaluated at group means) tea09gr Function scores
F1 F2 F3
,00 ,914 -,890 ,604
1,00 ,497 ,025 -,313
2,00 -,311 ,865 ,285
3,00 -1,415 -,661 -,078
Before evaluating the success of our analysis by using the discriminant scores to actually assign cases to the groups
we have to test the null hypotheses that the population means for all of the discriminant functions are equal in all of
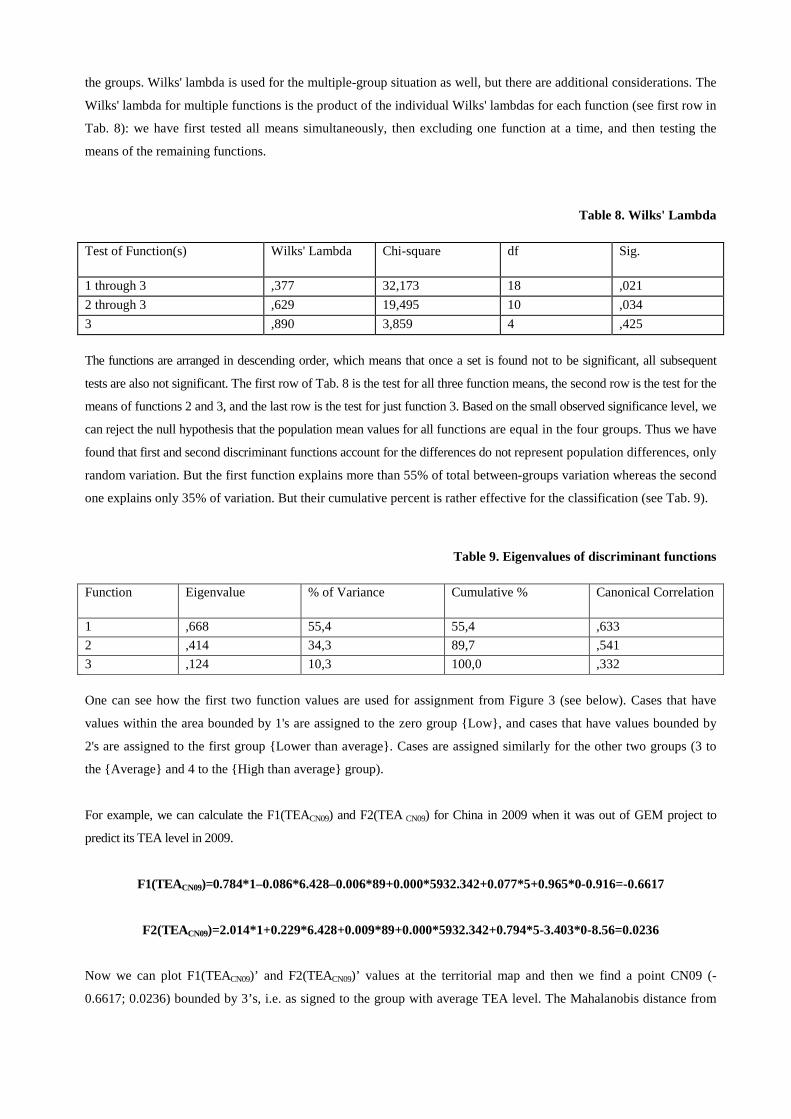
the groups. Wilks' lambda is used for the multiple-group situation as well, but there are additional considerations. The
Wilks' lambda for multiple functions is the product of the individual Wilks' lambdas for each function (see first row in
Tab. 8): we have first tested all means simultaneously, then excluding one function at a time, and then testing the
means of the remaining functions.
Table 8. Wilks' Lambda
Test of Function(s) Wilks' Lambda Chi-square df Sig.
1 through 3 ,377 32,173 18 ,021
2 through 3 ,629 19,495 10 ,034
3 ,890 3,859 4 ,425
The functions are arranged in descending order, which means that once a set is found not to be significant, all subsequent
tests are also not significant. The first row of Tab. 8 is the test for all three function means, the second row is the test for the
means of functions 2 and 3, and the last row is the test for just function 3. Based on the small observed significance level, we
can reject the null hypothesis that the population mean values for all functions are equal in the four groups. Thus we have
found that first and second discriminant functions account for the differences do not represent population differences, only
random variation. But the first function explains more than 55% of total between-groups variation whereas the second
one explains only 35% of variation. But their cumulative percent is rather effective for the classification (see Tab. 9).
Table 9. Eigenvalues of discriminant functions Function Eigenvalue % of Variance Cumulative % Canonical Correlation
1 ,668 55,4 55,4 ,633
2 ,414 34,3 89,7 ,541
3 ,124 10,3 100,0 ,332
One can see how the first two function values are used for assignment from Figure 3 (see below). Cases that have
values within the area bounded by 1's are assigned to the zero group {Low}, and cases that have values bounded by
2's are assigned to the first group {Lower than average}. Cases are assigned similarly for the other two groups (3 to
the {Average} and 4 to the {High than average} group).
For example, we can calculate the F1(TEACN09) and F2(TEA CN09) for China in 2009 when it was out of GEM project to
predict its TEA level in 2009.
F1(TEACN09)=0.784*1–0.086*6.428–0.006*89+0.000*5932.342+0.077*5+0.965*0-0.916=-0.6617
F2(TEACN09)=2.014*1+0.229*6.428+0.009*89+0.000*5932.342+0.794*5-3.403*0-8.56=0.0236
Now we can plot F1(TEACN09)’ and F2(TEACN09)’ values at the territorial map and then we find a point CN09 (-
0.6617; 0.0236) bounded by 3’s, i.e. as signed to the group with average TEA level. The Mahalanobis distance from

the point to high group mean is not much more than to third centroid (especially by F2 - TEA CN09), see in Tab.7). So
China belongs to the average group without good separation (with a tendency to the TEA level higher than average. It
is important to note that we observed higher than average TEA level (with a tendency to the average TEA level) in
2006 and in 2007 when China participated in the GEM project.
Thus the results of linear discriminant analysis basing on GEM data and the scope of official statistics allow uncover
macroeconomic factors determining the early-stage entrepreneurial activities. Using territorial map for first and
second non standardized discriminant function scores we can foresee future tendencies of early-stage entrepreneurial
activity as the most of predicting variables are rather stable under recession. We reached a prediction of TEA level
based on evidence of cross-countries similarities and differences that may be useful in distinguishing probable group
by early-stage entrepreneurial activity not only for countries participating at the GEM. And this possibility increases
the actuality and importance of GEM data.
Thus LDA Model has confirmed our third hypothesis H3 on the basic national features determining peculiarities of
institutional matrix and historical process of capital accumulation in national economies and its availability to explain
the national EEA level of adult population out of depending on actual economic conditions at a given point of time
(including slowdown impact).
Fig.3 Territorial Map assuming all functions but the first two are zero

Conclusions in brief
We have started our research to find determining factors of EEA for market systems and entrepreneurship in a lower-
mid developed transitional economy - like Russian economy. Unfortunately this question has not sufficient
highlighting in economic and entrepreneurship literature. Statistical analysis of empirical data on EEA dynamics in
GEM participating countries do corroborate the zero hypothesis H1 that what is important to interpret the TEA level is
not so much the actual economic situation itself. Then we have had to state that there is not empirical evidence of
GEM in Russia reliably confirming the hypothesis H2 on the same social, demographic or perceptual factors for both
developed and younger market systems in transition. As we need an objective procedure for predicting national TEA level on
the base of empirical data the main aim of our research has been to understand why theoretical models on EEA
determining factors presented in recent literature are not true for a lower-mid developed transitional economy.
and what are influenced the EEA process.
We have tried to adapt the concept of path dependence into analyses of EEA as economic and social phenomena for
describing some fundamental specific of different types of national markets. As a result we have reached to construct
LDA model of TEA level covering institutional effects on the base of ‘institutions-as-rules’ approach. The third
hypothesis has been proved and its main conclusion is that an explanatory model of EEA of adult population is
possible only in the context of the understanding of different types of institutional matrix and historically grown
conditions for entrepreneurship development within different clusters of national economies. It is the statement of
validity of the path dependency thesis also in explaining of entrepreneurship development determinants.
Policy Implications and Future Research
The implications of the findings are twofold: for top managers and policy makers – to take into consideration fundamental
specifics of country’s socio-economic institutional arrangement, being the result of the past development, to recognize and
estimate the conditions for ‘entry’ into entrepreneurship. The LDA Model could be a useful instrument for evidence-
based policy-making that may be defined as using state statistics and other statistical sources of information
systematically to highlight issues, inform programme of entrepreneurship support design and policy choice, forecast
and monitor policy impact to entrepreneurship.
The results of this study show the additional possibilities of combining GEM statistical data and business demography
as of the foundation for aggregate entrepreneurship development indicator constructing.
Second important result: the paper confirms that an explanatory model of the early-stage entrepreneurial activity of
adult population is possible only in the context of the understanding of different types of institutional matrix and
historically grown conditions for entrepreneurship development within different clusters of national economies. It is
the statement of validity of the path dependency thesis also in explaining of entrepreneurship development
determinants.
Otherwise, it could be hardly explained, why the most socially dynamic part of the population in different groups of
countries does react on the global economic crisis on a very different matter – even if the level of country’s GDP is
quite similar. Without taking it into consideration, one might be wondering why some theoretical models of
entrepreneurial activity determining factors proved by a lot of studies during last decades are not statistically
significant now (or moreover show negative correlation) for younger market systems and entrepreneurship in
transitional economies.
References Acs Z., Desai S., & Klapper F. (2007). A comparison of GEM and the World Bank Group entrepreneurship data, in:
Third GEM research conference: entrepreneurship, economic development and public policy. Acs, Z., Desai, S. & Klapper L., (2008). ‘What does “entrepreneurship” data really show?’, Small Business
Economics, 31(3): 265-281 Alayli, M. A. (2005). ‘Resource Rich Countries and Weak Institutions: The Resource Curse Effect’,
http://are.berkeley.edu/courses/EEP131/fall2006/NotableStudent05/Resource%20CurseM_Alayli.pdf Arenius, P. & Minniti, M. (2005). 'Perceptual Variables and Nascent Entrepreneurship', Small Business Economics,
24(3): 233-47 Arenius, P. & DeClercq, D. (2005), 'A Network-Based Approach on Opportunity Recognition', Small Business
Economics, 24 (3), pp. 249–65 Audretsch, D., Thurik, R., Verheul, I., & Wennekers, S. (2002). Entrepreneurship: Determinants and Policy in a
European - U.S. Comparison. Boston: Kluwer Academic Publishers Bosma, N. S., Acs, Z. J., Autio, E., Coduras, A., Levie, J. & Global Entrepreneurship Research Consortium (2008).
Global Entrepreneurship Monitor. Executive Report, http://www.gemconsortium.org Bresser-Pereira, L. C. (2009). ‘The global financial crisis and after: a new capitalism?’ Texto para Discussão, No. 240
da Escola de Economia de São Paulo da Fundação Getulio Vargas, 1, pp. 3 - 42 Collett, P. (1977). ‘The Rules of Conduct’, in: Collett P. (ed.). Social Rules and Social Behaviour. Totowa, NJ:
Rowman & Littlefield. Commons, J.R. (1968). ‘Legal Foundations of Capitalism’. Madison: University of Wisconsin Press Crawford, S. E. S, & Ostrom, E. (1995), ‘Grammar of Institutions’, The American Political Science Review, 89 (3),
pp. 582-600 Fisher, J. D., Geltner, D. M. & Webb, R. B. (1994). ‘Value Indices of Commercial Real Estate: A Comparison of
Index Construction Methods’, Journal of Real Estate Finance and Economics, 1994, 9 (2), pp. 137–149 Gartner, William B. (1985), ‘A Framework for Describing and Classifying the Phenomenon of New Venture
Creation.’ Academy of Management Review, 10(4), pp. 696–706. Global Competitiveness Report http://www.weforum.org/documents/gcr0809/index.html Gordon, D. (1980). Stages of accumulation and long economic cycles. In: Hopkins, T. & Wallerstein, I. (ed.),
Processes of the World System, Beverly Hills: Sage. Greenwald, B., & Stiglitz, J. E. (1986). ‘Externalities in Economies with Imperfect Information and Incomplete
Markets’, Quarterly Journal of Economics, 101(2), pp. 229–264 Doing Business 2010: Reforming Through Difficult Times http://www.doingbusiness.org/ Heilbroner, R.L., 2008, Capitalism. In: Durlauf, S.N. & Blume, L.E. (eds.), The New Palgrave Dictionary of
Economics. 2nd ed. Palgrave Macmillan, 2008 Krugman, P. (2009). ‘How Did Economists Get It So Wrong?’ The New York Times, 02.09.2009
http://www.nytimes.com/2009/09/06/magazine/06Economic-t.html Levesque M., and M. Minniti, 2006, ‘The Effect of Aging on Entrepreneurial Behavior’, Journal of Business
Venturing, 21(2): 177-194 Lim T., Loh W., & Shih, Y. (2000). ‘A comparison of prediction accuracy, complexity and training time of thirty-
three old and new classification algorithms’, Machine Learning, 40: 203 - 228 Obraztsova, O. (2009). ‘Possibilities of business statistics for Statistical Study of Early Entrepreneurship in Russian
Federation: level and quality of entrepreneurial potential’, Voprosy Statistiki [Statistical Issues], No. 7 (in Russian)
Orbell, J.M., van de Kragt, A.J. & Dawes, R.M. (1991). ‘Covenants without the Sword: The Role of Promises in Social Dilemma Circumstances.’ In: Koford K.J. & Miller, J.B. (eds.), Social Norms and Economic Institutions. Ann Arbor: University of Michigan Press.
Ostrom, E. (2005a). ‘Unlocking Public Entrepreneurship and Public Economies’ In: EGDI and UNU-WIDER Discussion-Paper, No. 2005/01
Ostrom, E. (2005b). ‘Understanding Institutional Diversity’. Princeton University Press, 2005 Polanyi K. The Great Transformation. Boston: Beacon Press, 2001 Renzulli, L., Aldrich, H. & Moody, J. (2000). ‘Family Matters: Consequences of Personal Networks for Business
Startup and Survival’, Social Forces, 79(2), pp. 523–546 Sachs, J.D. & Warner, A.M. ‘Natural resource abundance and economic growth’ In: NBER Working Paper 5398,
http://ideas.repec.org/p/nbr/nberwo/5398.html, Schumpeter, J. A. (1975). Capitalism, Socialism and Democracy. NY: Harper. Thurik, R. (1999). Entrepreneurship, Industrial Transformation and Growth. In: Gary D. Liebcap, ed. 1999. The
Sources of Entrepreneurial Activity. Stamford: JAI Press. P. 29–66. Valliere, D. (2010). ‘Reconceptualizing entrepreneurial framework conditions’, International Entrepreneurship
Management Journal, 6, pp. 97–112

Van Stel, A., Carree, M., & Thurik, R. (2005). The Effect of Entrepreneurial Activity on National Economic Growth. Small Business Economics, 24, pp. 311-321.
Walker, E. A. (2000). ‘Women in Small Business: A Current Perspective’, Proceedings 23rd ISBA National Small Firms Policy & Research Conference, Aberdeen, 15th–17th November, pp. 1225–72. Aberdeen: Institute for Small Business Affairs.
Wennekers S., van Stel A., Thurik, R. & Reynolds, P. (2005). 'Nascent Entrepreneurship and Economic Devel-opment', Small Business Economics, 24 (3), pp. 293-309.
Appendix 1: Variable information: variables’ list, descriptions and sources This Appendix describes the variables collected for the thirty-four countries included in our study. The first column gives the name of the variable. The second column describes the variable and provides the source from which it has been collected. A source of empirical data is GEM database unless otherwise is stated. Variable Description TEA Share (%) of early-stage entrepreneurs among adult population (calculated on the base of
positive responses to the questions ‘You are, alone or with others, currently trying to start a new business, including any self-employment or selling any goods or services to others’, ‘Over the past twelve months have you done anything to help start a new business, such as looking for equipment or a location, organizing a start-up team, working on a business plan, beginning to save money, or any other activity that would help launch a business?´ and ‘Will you personally own all, part, or none of this business?’)
EA Positive response of respondent to the questions ‘You are, alone or with others, currently trying to start a new business, including any self-employment or selling any goods or services to others’, ‘Over the past twelve months have you done anything to help start a new business, such as looking for equipment or a location, organizing a start-up team, working on a business plan, beginning to save money, or any other activity that would help launch a business?´ and ‘Will you personally own all, part, or none of this business?’ Yes=1, No=0
Age Age of the respondent Education The variable is categorical:
No education Some secondary education Secondary degree (used as reference category) Post secondary education Graduate degree
Work status The variable is categorical: Full or part time work (used as reference category) Part time work only Retired or disabled Homemaker Student Not working: Other
Perception of opportunities
Response to the question: ‘In the next six months there will be good opportunities for starting a business in the area where you live’ Yes=1, No=0
Perception of skills Response to the question: ‘You have the knowledge, skill and experience required to start a new business’ Yes=1, No=0
Fear of failure Response to the question: ‘Fear of failure would prevent you from starting a business’ Yes=1, No=0
Knows an entrepreneur Response to the question: ‘You know someone personally who started a business in the past 2 years’ Yes=1, No=0
GDP per capita 2007 (GDP01)
GDP per capita 2007 (PPS) (for analytical purposes divided by 1000). Number expressed in $PPS per person. Source: World Economic Database (Oct 2008). International Monetary Fund. Available at http://www.imf.org/external/pubs/ft/weo/2008/10/data/index.html
GDP per capita 2008 (GDP01)
GDP per capita 2007 (PPS) (for analytical purposes divided by 1000). Number expressed in $PPS per person. Source: World Economic Database (Oct 2009). International Monetary Fund. Available at http://www.imf.org/external/pubs/ft/weo/2008/10/data/index.html World Economic Outlook Database - www.imf.org/external/ns/cs.aspx?id=28
rgdpjp Real GDP per capita GDP per capita 2006-2008 (PPS) (for analytical purposes divided
by 1000). Number expressed in $PPS per person. Source: World Economic Database (Oct 2009). International Monetary Fund. Available at http://www.imf.org/external/pubs/ft/weo/2008/10/data/index.html
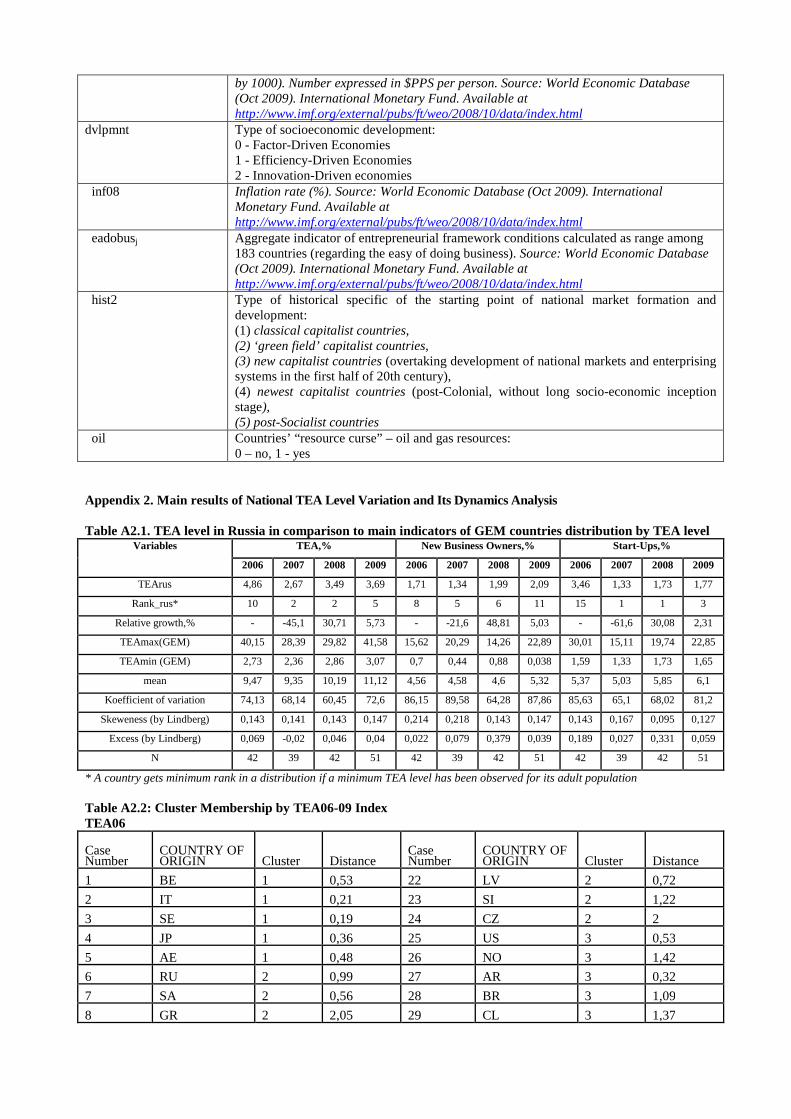
dvlpmnt Type of socioeconomic development: 0 - Factor-Driven Economies 1 - Efficiency-Driven Economies 2 - Innovation-Driven economies
inf08 Inflation rate (%). Source: World Economic Database (Oct 2009). International Monetary Fund. Available at http://www.imf.org/external/pubs/ft/weo/2008/10/data/index.html
eadobusj Aggregate indicator of entrepreneurial framework conditions calculated as range among 183 countries (regarding the easy of doing business). Source: World Economic Database (Oct 2009). International Monetary Fund. Available at http://www.imf.org/external/pubs/ft/weo/2008/10/data/index.html
hist2 Type of historical specific of the starting point of national market formation and development: (1) classical capitalist countries, (2) ‘green field’ capitalist countries, (3) new capitalist countries (overtaking development of national markets and enterprising systems in the first half of 20th century), (4) newest capitalist countries (post-Colonial, without long socio-economic inception stage), (5) post-Socialist countries
oil Countries’ “resource curse” – oil and gas resources: 0 – no, 1 - yes
Appendix 2. Main results of National TEA Level Variation and Its Dynamics Analysis Table A2.1. TEA level in Russia in comparison to main indicators of GEM countries distribution by TEA level
Variables TEA,% New Business Owners,% Start-Ups,%
2006 2007 2008 2009 2006 2007 2008 2009 2006 2007 2008 2009
TEArus 4,86 2,67 3,49 3,69 1,71 1,34 1,99 2,09 3,46 1,33 1,73 1,77
Rank_rus* 10 2 2 5 8 5 6 11 15 1 1 3
Relative growth,% - -45,1 30,71 5,73 - -21,6 48,81 5,03 - -61,6 30,08 2,31
TEAmax(GEM) 40,15 28,39 29,82 41,58 15,62 20,29 14,26 22,89 30,01 15,11 19,74 22,85
TEAmin (GEM) 2,73 2,36 2,86 3,07 0,7 0,44 0,88 0,038 1,59 1,33 1,73 1,65
mean 9,47 9,35 10,19 11,12 4,56 4,58 4,6 5,32 5,37 5,03 5,85 6,1
Koefficient of variation 74,13 68,14 60,45 72,6 86,15 89,58 64,28 87,86 85,63 65,1 68,02 81,2
Skeweness (by Lindberg) 0,143 0,141 0,143 0,147 0,214 0,218 0,143 0,147 0,143 0,167 0,095 0,127
Excess (by Lindberg) 0,069 -0,02 0,046 0,04 0,022 0,079 0,379 0,039 0,189 0,027 0,331 0,059
N 42 39 42 51 42 39 42 51 42 39 42 51
* A country gets minimum rank in a distribution if a minimum TEA level has been observed for its adult population Table A2.2: Cluster Membership by TEA06-09 Index TEA06
Case Number
COUNTRY OF ORIGIN Cluster Distance
Case Number
COUNTRY OF ORIGIN Cluster Distance
1 BE 1 0,53 22 LV 2 0,72
2 IT 1 0,21 23 SI 2 1,22
3 SE 1 0,19 24 CZ 2 2
4 JP 1 0,36 25 US 3 0,53
5 AE 1 0,48 26 NO 3 1,42
6 RU 2 0,99 27 AR 3 0,32
7 SA 2 0,56 28 BR 3 1,09
8 GR 2 2,05 29 CL 3 1,37

9 NL 2 0,43 30 MY 3 0,53
10 FR 2 1,46 31 AU 3 1,4
11 ES 2 1,42 32 IN 3 0,14
12 HU 2 0,19 33 IS 3 0,7
13 UK 2 0,08 34 HR 3 1,98
14 DK 2 0,53 35 UY 3 2
15 DE 2 1,64 36 CO 4 3,5
16 MX 2 0,59 37 ID 4 0,29
17 SG 2 1 38 PH 4 1,46
18 TR 2 0,22 39 TH 4 3,79
19 CA 2 1,27 40 CN 4 2,8
20 IE 2 1,5 41 JM 4 1,34
21 FI 2 0,86 42 PE 5 0 TEA07
Case Number
COUNTRY OF ORIGIN Cluster Distance
Case Number
COUNTRY OF ORIGIN Cluster Distance
1 RU 1 0,14 21 IL 2 0,15
2 BE 1 0,34 22 US 3 1,06
3 AT 1 0,45 23 AR 3 3,76
4 PR 1 0,25 24 BR 3 2,05
5 GR 2 0,12 25 CL 3 2,76
6 NL 2 0,41 26 IN 3 2,14
7 ES 2 2,03 27 IE 3 2,45
8 HU 2 1,27 28 IS 3 1,81
9 IT 2 0,58 29 YU 3 2,11
10 RO 2 1,57 30 UY 3 1,54
11 SW 2 0,68 31 KZ 3 1,31
12 UK 2 0,5 32 HK 3 0,72
13 DK 2 0,2 33 AE 3 2,12
14 SE 2 1,44 34 CO 4 3,71
15 JP 2 1,25 35 CN 4 2,59
16 TR 2 0,01 36 VE 4 1,15
17 FI 2 1,32 37 DO 4 2,27
18 LV 2 1,13 38 PE 5 1,25
19 HR 2 1,68 39 TH 5 1,25
20 SI 2 0,81 TEA08 Case Number
COUNTRY OF ORIGIN Cluster Distance
Case Number
COUNTRY OF ORIGIN Cluster Distance
1 RU 1 0,02 20 IL 2 0,28
2 BE 1 0,42 21 US 3 0,39
3 DE 1 0,41 22 EG 3 1,58
4 SA 2 1,35 23 GR 3 1,25
5 NL 2 1,12 24 BR 3 0,91
6 FR 2 0,68 25 KR 3 1,17

7 ES 2 0,66 26 IN 3 0,26
8 HU 2 0,29 27 IS 3 1,06
9 IT 2 1,7 28 MK 3 2,09
10 UK 2 0,41 29 BA 3 3,04
11 DK 2 2,28 30 UY 3 0,67
12 JP 2 0,9 31 AR 4 2,28
13 TR 2 0,48 32 CO 4 5,64
14 IE 2 1,27 33 EC 4 1,64
15 FI 2 1,02 34 DO 4 1,53
16 LV 2 0,21 35 JM 4 3,24
17 YU 2 1,2 36 PE 5 2,16
18 HR 2 1,27 37 BO 5 2,16
19 SI 2 0,08 TEA09
Case Number
COUNTRY OF ORIGIN Cluster Distance
Case Number
COUNTRY OF ORIGIN Cluster Distance
1 Russia 1 0,28 27 Argentina 3 3,6
2 Belgium 1 0,09 28 Chile 3 3,78
3 Italy 1 0,12 29 Iran 3 1,01
4 Denmark 1 0,04 30 Tunisia 3 1,65
5 Japan 1 0,34 31 Iceland 3 0,37
6 United States 2 2,37 32 Latvia 3 0,46
7 South Africa 2 0,32 33 Panama 3 1,12
8 Greece 2 1,5 34 Uruguay 3 1,08
9 Netherlands 2 1,59 35 Lebanon 3 3,9
10 France 2 1,25 36 Jordan 3 0,83
11 Spain 2 0,46 37 Syria 3 2,61
12 Romania 2 0,57 38 West Bank & Gaza Strip 3 2,48
13 Switzerland 2 2,12 39 United Arab Emirates 3 2,18
14 UK 2 0,14 40 Peru 4 1,62
15 Germany 2 1,5 41 Brazil 4 3,97
16 Malaysia 2 1,18 42 Colombia 4 2,78
17 Korea 2 1,41 43 Algeria 4 2,61
18 Finland 2 0,43 44 Venezuela 4 0,63
19 Serbia 2 0,7 45 Ecuador 4 3,47
20 Croatia 2 0,01 46 Tonga 4 1,9
21 Slovenia 2 0,25 47 Jamaica 4 3,44
22 Bosnia and Herzegovina 2 1,17 48 Yemen 4 4,73
23 Saudi Arabia 2 0,94 49 Morocco 5 8,13
24 Israel 2 0,51 50 Uganda 5 0,22
25 Hungary 3 1,95 51 Guatemala 5 8,36
26 Norway 3 2,55
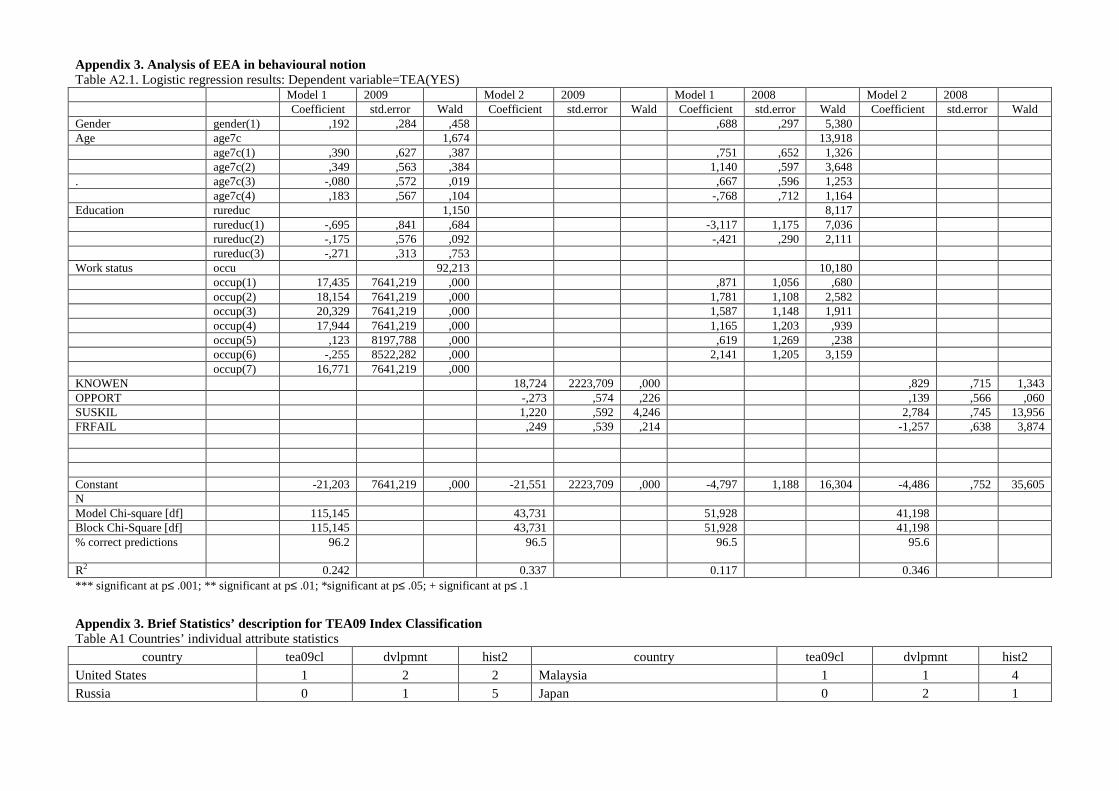
Appendix 3. Analysis of EEA in behavioural notion Table А2.1. Logistic regression results: Dependent variable=TEA(YES) Model 1 2009 Model 2 2009 Model 1 2008 Model 2 2008 Coefficient std.error Wald Coefficient std.error Wald Coefficient std.error Wald Coefficient std.error Wald Gender gender(1) ,192 ,284 ,458 ,688 ,297 5,380 Age age7c 1,674 13,918 age7c(1) ,390 ,627 ,387 ,751 ,652 1,326 age7c(2) ,349 ,563 ,384 1,140 ,597 3,648 . age7c(3) -,080 ,572 ,019 ,667 ,596 1,253 age7c(4) ,183 ,567 ,104 -,768 ,712 1,164 Education rureduc 1,150 8,117 rureduc(1) -,695 ,841 ,684 -3,117 1,175 7,036 rureduc(2) -,175 ,576 ,092 -,421 ,290 2,111 rureduc(3) -,271 ,313 ,753 Work status occu 92,213 10,180 occup(1) 17,435 7641,219 ,000 ,871 1,056 ,680 occup(2) 18,154 7641,219 ,000 1,781 1,108 2,582 occup(3) 20,329 7641,219 ,000 1,587 1,148 1,911 occup(4) 17,944 7641,219 ,000 1,165 1,203 ,939 occup(5) ,123 8197,788 ,000 ,619 1,269 ,238 occup(6) -,255 8522,282 ,000 2,141 1,205 3,159 occup(7) 16,771 7641,219 ,000 KNOWEN 18,724 2223,709 ,000 ,829 ,715 1,343 OPPORT -,273 ,574 ,226 ,139 ,566 ,060 SUSKIL 1,220 ,592 4,246 2,784 ,745 13,956 FRFAIL ,249 ,539 ,214 -1,257 ,638 3,874 Constant -21,203 7641,219 ,000 -21,551 2223,709 ,000 -4,797 1,188 16,304 -4,486 ,752 35,605 N Model Chi-square [df] 115,145 43,731 51,928 41,198 Block Chi-Square [df] 115,145 43,731 51,928 41,198 % correct predictions 96.2
96.5 96.5 95.6
R2 0.242 0.337 0.117 0.346 *** significant at p≤ .001; ** significant at p≤ .01; *significant at p≤ .05; + significant at p≤ .1
Appendix 3. Brief Statistics’ description for TEA09 Index Classification Table A1 Countries’ individual attribute statistics
country tea09cl dvlpmnt hist2 country tea09cl dvlpmnt hist2 United States 1 2 2 Malaysia 1 1 4 Russia 0 1 5 Japan 0 2 1
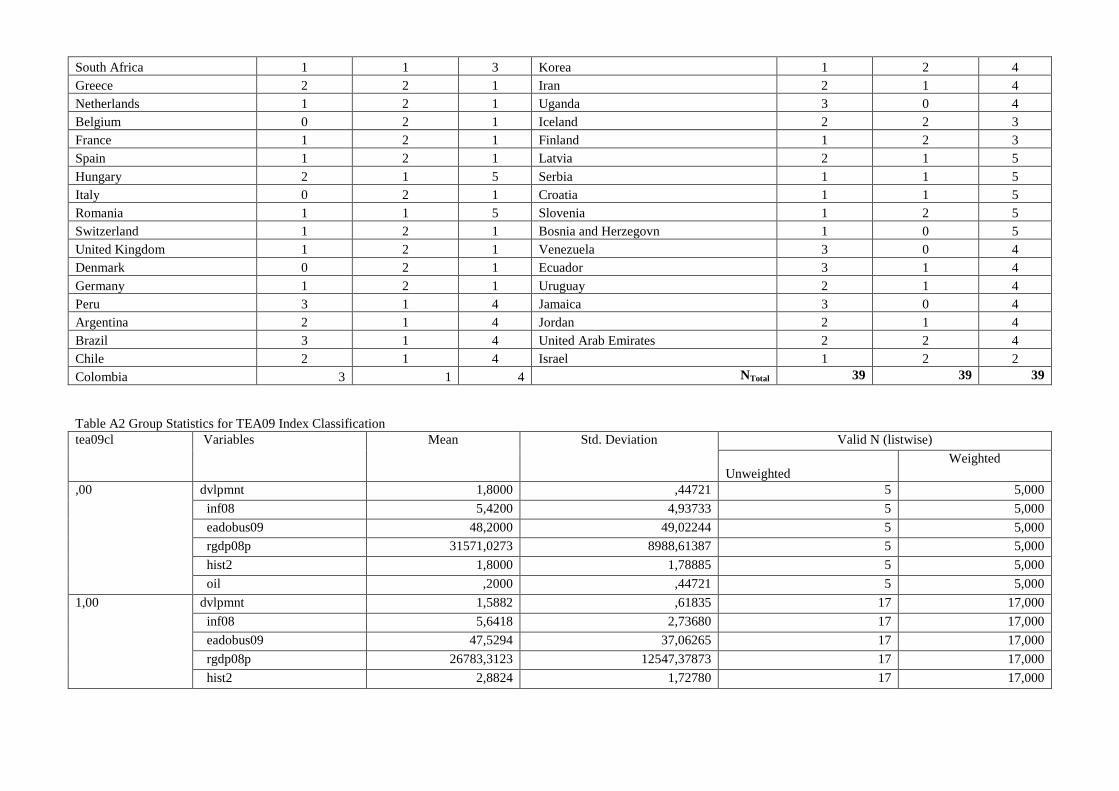
South Africa 1 1 3 Korea 1 2 4 Greece 2 2 1 Iran 2 1 4 Netherlands 1 2 1 Uganda 3 0 4 Belgium 0 2 1 Iceland 2 2 3 France 1 2 1 Finland 1 2 3 Spain 1 2 1 Latvia 2 1 5 Hungary 2 1 5 Serbia 1 1 5 Italy 0 2 1 Croatia 1 1 5 Romania 1 1 5 Slovenia 1 2 5 Switzerland 1 2 1 Bosnia and Herzegovn 1 0 5 United Kingdom 1 2 1 Venezuela 3 0 4 Denmark 0 2 1 Ecuador 3 1 4 Germany 1 2 1 Uruguay 2 1 4 Peru 3 1 4 Jamaica 3 0 4 Argentina 2 1 4 Jordan 2 1 4 Brazil 3 1 4 United Arab Emirates 2 2 4 Chile 2 1 4 Israel 1 2 2 Colombia 3 1 4 NTotal 39 39 39 Table A2 Group Statistics for TEA09 Index Classification tea09cl Variables Mean Std. Deviation Valid N (listwise)
Unweighted
Weighted
,00 dvlpmnt 1,8000 ,44721 5 5,000
inf08 5,4200 4,93733 5 5,000
eadobus09 48,2000 49,02244 5 5,000
rgdp08p 31571,0273 8988,61387 5 5,000
hist2 1,8000 1,78885 5 5,000
oil ,2000 ,44721 5 5,000
1,00 dvlpmnt 1,5882 ,61835 17 17,000
inf08 5,6418 2,73680 17 17,000
eadobus09 47,5294 37,06265 17 17,000
rgdp08p 26783,3123 12547,37873 17 17,000
hist2 2,8824 1,72780 17 17,000
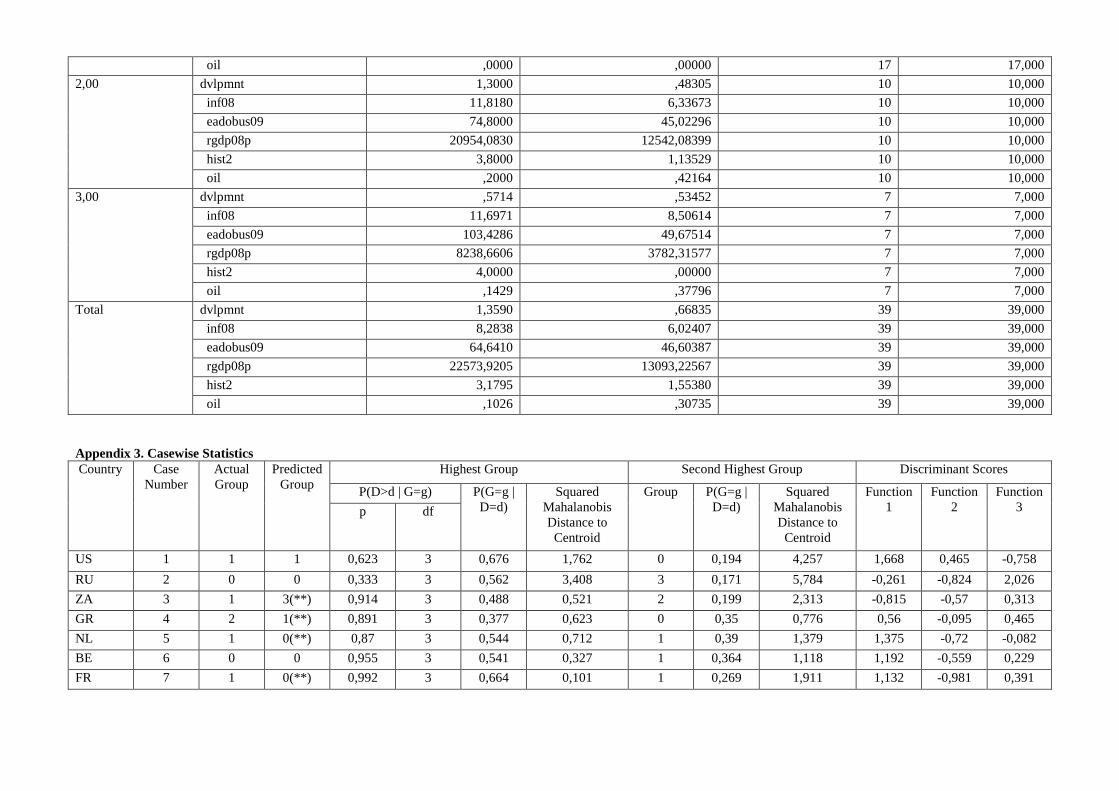
oil ,0000 ,00000 17 17,000
2,00 dvlpmnt 1,3000 ,48305 10 10,000
inf08 11,8180 6,33673 10 10,000
eadobus09 74,8000 45,02296 10 10,000
rgdp08p 20954,0830 12542,08399 10 10,000
hist2 3,8000 1,13529 10 10,000
oil ,2000 ,42164 10 10,000
3,00 dvlpmnt ,5714 ,53452 7 7,000
inf08 11,6971 8,50614 7 7,000
eadobus09 103,4286 49,67514 7 7,000
rgdp08p 8238,6606 3782,31577 7 7,000
hist2 4,0000 ,00000 7 7,000
oil ,1429 ,37796 7 7,000
Total dvlpmnt 1,3590 ,66835 39 39,000
inf08 8,2838 6,02407 39 39,000
eadobus09 64,6410 46,60387 39 39,000
rgdp08p 22573,9205 13093,22567 39 39,000
hist2 3,1795 1,55380 39 39,000
oil ,1026 ,30735 39 39,000
Appendix 3. Casewise Statistics Country Case
Number Actual Group
Predicted Group
Highest Group Second Highest Group Discriminant Scores
P(D>d | G=g) P(G=g | D=d)
Squared Mahalanobis Distance to Centroid
Group P(G=g | D=d)
Squared Mahalanobis Distance to Centroid
Function 1
Function 2
Function 3 p df
US 1 1 1 0,623 3 0,676 1,762 0 0,194 4,257 1,668 0,465 -0,758
RU 2 0 0 0,333 3 0,562 3,408 3 0,171 5,784 -0,261 -0,824 2,026
ZA 3 1 3(**) 0,914 3 0,488 0,521 2 0,199 2,313 -0,815 -0,57 0,313
GR 4 2 1(**) 0,891 3 0,377 0,623 0 0,35 0,776 0,56 -0,095 0,465
NL 5 1 0(**) 0,87 3 0,544 0,712 1 0,39 1,379 1,375 -0,72 -0,082
BE 6 0 0 0,955 3 0,541 0,327 1 0,364 1,118 1,192 -0,559 0,229
FR 7 1 0(**) 0,992 3 0,664 0,101 1 0,269 1,911 1,132 -0,981 0,391
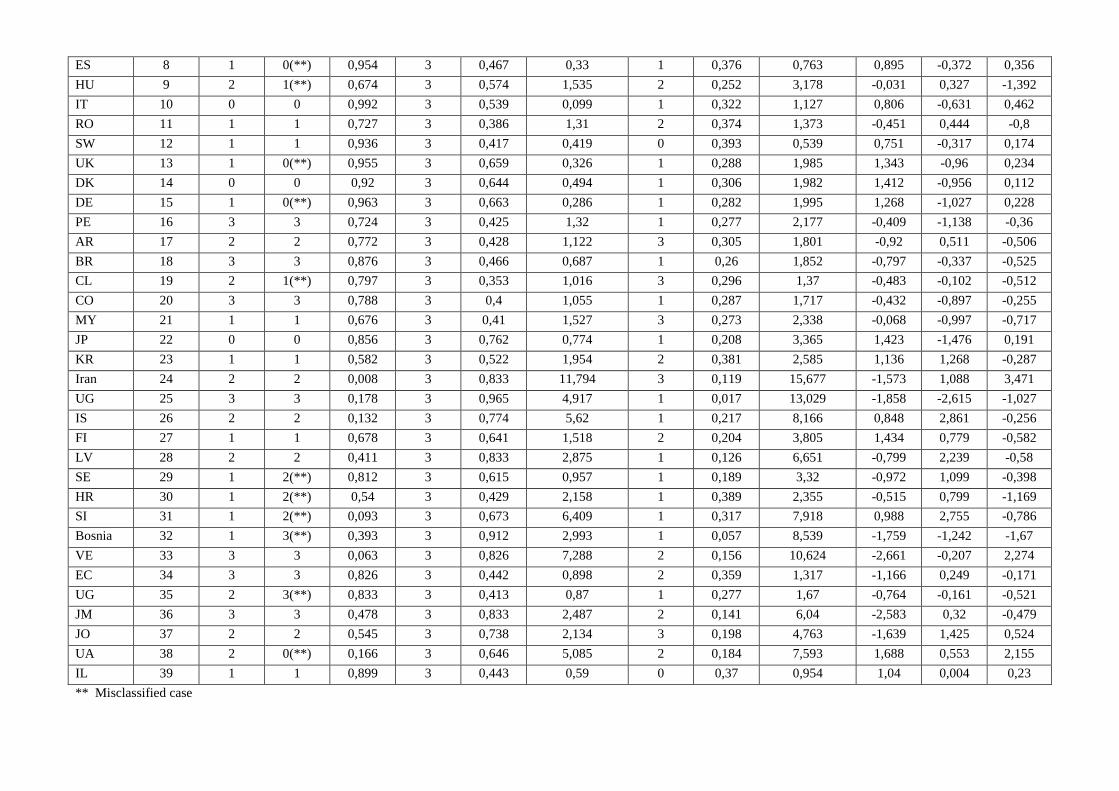
ES 8 1 0(**) 0,954 3 0,467 0,33 1 0,376 0,763 0,895 -0,372 0,356
HU 9 2 1(**) 0,674 3 0,574 1,535 2 0,252 3,178 -0,031 0,327 -1,392
IT 10 0 0 0,992 3 0,539 0,099 1 0,322 1,127 0,806 -0,631 0,462
RO 11 1 1 0,727 3 0,386 1,31 2 0,374 1,373 -0,451 0,444 -0,8
SW 12 1 1 0,936 3 0,417 0,419 0 0,393 0,539 0,751 -0,317 0,174
UK 13 1 0(**) 0,955 3 0,659 0,326 1 0,288 1,985 1,343 -0,96 0,234
DK 14 0 0 0,92 3 0,644 0,494 1 0,306 1,982 1,412 -0,956 0,112
DE 15 1 0(**) 0,963 3 0,663 0,286 1 0,282 1,995 1,268 -1,027 0,228
PE 16 3 3 0,724 3 0,425 1,32 1 0,277 2,177 -0,409 -1,138 -0,36
AR 17 2 2 0,772 3 0,428 1,122 3 0,305 1,801 -0,92 0,511 -0,506
BR 18 3 3 0,876 3 0,466 0,687 1 0,26 1,852 -0,797 -0,337 -0,525
CL 19 2 1(**) 0,797 3 0,353 1,016 3 0,296 1,37 -0,483 -0,102 -0,512
CO 20 3 3 0,788 3 0,4 1,055 1 0,287 1,717 -0,432 -0,897 -0,255
MY 21 1 1 0,676 3 0,41 1,527 3 0,273 2,338 -0,068 -0,997 -0,717
JP 22 0 0 0,856 3 0,762 0,774 1 0,208 3,365 1,423 -1,476 0,191
KR 23 1 1 0,582 3 0,522 1,954 2 0,381 2,585 1,136 1,268 -0,287
Iran 24 2 2 0,008 3 0,833 11,794 3 0,119 15,677 -1,573 1,088 3,471
UG 25 3 3 0,178 3 0,965 4,917 1 0,017 13,029 -1,858 -2,615 -1,027
IS 26 2 2 0,132 3 0,774 5,62 1 0,217 8,166 0,848 2,861 -0,256
FI 27 1 1 0,678 3 0,641 1,518 2 0,204 3,805 1,434 0,779 -0,582
LV 28 2 2 0,411 3 0,833 2,875 1 0,126 6,651 -0,799 2,239 -0,58
SE 29 1 2(**) 0,812 3 0,615 0,957 1 0,189 3,32 -0,972 1,099 -0,398
HR 30 1 2(**) 0,54 3 0,429 2,158 1 0,389 2,355 -0,515 0,799 -1,169
SI 31 1 2(**) 0,093 3 0,673 6,409 1 0,317 7,918 0,988 2,755 -0,786
Bosnia 32 1 3(**) 0,393 3 0,912 2,993 1 0,057 8,539 -1,759 -1,242 -1,67
VE 33 3 3 0,063 3 0,826 7,288 2 0,156 10,624 -2,661 -0,207 2,274
EC 34 3 3 0,826 3 0,442 0,898 2 0,359 1,317 -1,166 0,249 -0,171
UG 35 2 3(**) 0,833 3 0,413 0,87 1 0,277 1,67 -0,764 -0,161 -0,521
JM 36 3 3 0,478 3 0,833 2,487 2 0,141 6,04 -2,583 0,32 -0,479
JO 37 2 2 0,545 3 0,738 2,134 3 0,198 4,763 -1,639 1,425 0,524
UA 38 2 0(**) 0,166 3 0,646 5,085 2 0,184 7,593 1,688 0,553 2,155
IL 39 1 1 0,899 3 0,443 0,59 0 0,37 0,954 1,04 0,004 0,23
** Misclassified case
Related Documents