doi:10.1182/blood-2005-01-0206 Prepublished online May 19, 2005; Cooper and Anthony D Kelleher Ramacciotti, Dick Quan, Robert Finlayson, John Kaldor, Eric S Rosenberg, Bruce D Walker, David A John J Zaunders, Mee Ling Munier, Daniel E Kaufmann, Susanna Ip, Pat Grey, Don Smith, Tim cells during primary HIV-1 infection Early proliferation of CCR5+ CD38+++ antigen-specific CD4+ Th1 effector (5012 articles) Immunobiology (564 articles) Chemokines, Cytokines, and Interleukins Articles on similar topics can be found in the following Blood collections http://bloodjournal.hematologylibrary.org/site/misc/rights.xhtml#repub_requests Information about reproducing this article in parts or in its entirety may be found online at: http://bloodjournal.hematologylibrary.org/site/misc/rights.xhtml#reprints Information about ordering reprints may be found online at: http://bloodjournal.hematologylibrary.org/site/subscriptions/index.xhtml Information about subscriptions and ASH membership may be found online at: digital object identifier (DOIs) and date of initial publication. the indexed by PubMed from initial publication. Citations to Advance online articles must include final publication). Advance online articles are citable and establish publication priority; they are appeared in the paper journal (edited, typeset versions may be posted when available prior to Advance online articles have been peer reviewed and accepted for publication but have not yet Copyright 2011 by The American Society of Hematology; all rights reserved. 20036. the American Society of Hematology, 2021 L St, NW, Suite 900, Washington DC Blood (print ISSN 0006-4971, online ISSN 1528-0020), is published weekly by For personal use only. by guest on May 30, 2013. bloodjournal.hematologylibrary.org From

Welcome message from author
This document is posted to help you gain knowledge. Please leave a comment to let me know what you think about it! Share it to your friends and learn new things together.
Transcript

doi:10.1182/blood-2005-01-0206Prepublished online May 19, 2005;
Cooper and Anthony D KelleherRamacciotti, Dick Quan, Robert Finlayson, John Kaldor, Eric S Rosenberg, Bruce D Walker, David A John J Zaunders, Mee Ling Munier, Daniel E Kaufmann, Susanna Ip, Pat Grey, Don Smith, Tim cells during primary HIV-1 infectionEarly proliferation of CCR5+ CD38+++ antigen-specific CD4+ Th1 effector
(5012 articles)Immunobiology � (564 articles)Chemokines, Cytokines, and Interleukins �
Articles on similar topics can be found in the following Blood collections
http://bloodjournal.hematologylibrary.org/site/misc/rights.xhtml#repub_requestsInformation about reproducing this article in parts or in its entirety may be found online at:
http://bloodjournal.hematologylibrary.org/site/misc/rights.xhtml#reprintsInformation about ordering reprints may be found online at:
http://bloodjournal.hematologylibrary.org/site/subscriptions/index.xhtmlInformation about subscriptions and ASH membership may be found online at:
digital object identifier (DOIs) and date of initial publication. theindexed by PubMed from initial publication. Citations to Advance online articles must include
final publication). Advance online articles are citable and establish publication priority; they areappeared in the paper journal (edited, typeset versions may be posted when available prior to Advance online articles have been peer reviewed and accepted for publication but have not yet
Copyright 2011 by The American Society of Hematology; all rights reserved.20036.the American Society of Hematology, 2021 L St, NW, Suite 900, Washington DC Blood (print ISSN 0006-4971, online ISSN 1528-0020), is published weekly by
For personal use only. by guest on May 30, 2013. bloodjournal.hematologylibrary.orgFrom

1
TITLE: Early proliferation of CCR5+ CD38+++ antigen-specific CD4+ Th1
effector cells during primary HIV-1 infection.
AUTHORS: John J. Zaunders1, Mee Ling Munier1,3, Daniel E. Kaufmann2, Susanna
Ip1,3, Pat Grey3, Don Smith3, Tim Ramacciotti3, Dick Quan4, Robert
Finlayson5, John Kaldor3, Eric S. Rosenberg2, Bruce D. Walker2, David
A. Cooper1,3 and Anthony D. Kelleher1,3, on behalf of the PHAEDRA
Study Team 6
RUNNING TITLE: HIV-specific CD4+ T cells in acute infection
AFFILIATIONS: 1 Centre for Immunology, St. Vincent’s Hospital, Sydney, NSW, Australia2 Partners AIDS Research Center, Massachusetts General Hospital, Boston, MA, USA3 National Centre in HIV Epidemiology and Clinical Research, University of NSW, Sydney, NSW, Australia.4 Holdsworth House General Practice, Sydney, NSW Australia5 Taylor Square Private Clinic, Sydney, NSW, Australia
Email: [email protected] for correspondence: John Zaunders,
Centre for Immunology,St Vincent’s Hospital,Victoria St, Darlinghurst, NSW 2010 Australia
Phone: +61-2-8382-3700Fax: +61-2-8382-2391
Word count: Text: 4666 Abstract: 199
6 Members of the PHAEDRA Study Team are: P.Grey, J.Kaldor, D.A.Cooper, T.Ramacciotti, K.Petoumenos, D.Smith, M.Bloch, N.Medland, R.Finlayson, A.McFarlane, N.J.Roth, C.Workman, A.Carr, A.D.Kelleher, J.Zaunders and P.Cunningham.
Abbreviations: PHI (primary HIV-1 infection); ICC (intracellular cytokine assay).
Keywords: HIV-1, CD4+ T cells, CCR5, Antigen-specific, Cytotoxic T Lymphocytes
Blood First Edition Paper, prepublished online May 19, 2005; DOI 10.1182/blood-2005-01-0206
Copyright © 2005 American Society of Hematology
For personal use only. by guest on May 30, 2013. bloodjournal.hematologylibrary.orgFrom

2
Financial support: The National Centre in HIV Epidemiology and Clinical Research is supported by the Commonwealth Department of Health and Ageing through the Australian National Council on AIDS, Hepatitis C and Related Diseases. This project was funded by an AIEDRP grant through the NIH Division of AIDS, and a program grant from the Australian National Health and Medical Research Council. The authors have no conflicting financial interests.
For personal use only. by guest on May 30, 2013. bloodjournal.hematologylibrary.orgFrom

3
Abstract
We investigated whether HIV-1 antigen-specific CD4+ T cells expressed the viral
co-receptor, CCR5, during primary HIV-1 infection (PHI). In the peripheral blood of
subjects with very early PHI (<22 days post-onset of symptoms), there was a 10 to 20-
fold increase in the proportion of highly activated (CD38+++) and proliferating (Ki-67+)
CD4+ T cells which expressed CCR5+, and were mostly TIA-1+perforin+granzymeB+.
In the same patient samples, CD4+ T cells producing IFN-γ in response to HIV Gag
peptides were readily detected (median 0.58%) by intracellular cytokine assay – these
cells were again predominantly CD38+++, Ki-67+ and TIA-1+, as well as Bcl-2low. On
average, 20% of the Gag-specific CD4+ T cells also expressed IL-2 and were CD127(IL-
7R)+. Taken together, these results suggest that Gag-specific Th1 effector cells express
CCR5+ during the primary response and may include precursors of long-term self-
renewing memory cells. However, in PHI subjects with later presentation, antigen-
specific CD4+ T cells could not be readily detected (median 0.08%), coinciding with a 5-
fold lower level of the CCR5+CD38+++ CD4+ T cells. These results suggest that the
anti-viral response to HIV-1 infection includes highly activated CCR5+CD4+ cytotoxic
effector cells, which are susceptible to both apoptosis and cytopathic infection with HIV-
1, and rapidly decline.
For personal use only. by guest on May 30, 2013. bloodjournal.hematologylibrary.orgFrom

4
Introduction
Antigen-specific memory CD4+ T cells are not often found in untreated chronic
HIV-1 infection, using the standard in vitro proliferation assay 1. It remains unknown
whether the scarcity of proliferative HIV-specific CD4+ T cells is due to dysfunction 2,3,
inappropriate apoptosis 4 or is a result of cytopathic infection of these cells 5. This deficit
of antigen-specific CD4+ T cells may represent a major impediment to immune control
of HIV-1 infection. In most, but not all, animal models of adaptive immune responses to
viral infection, optimal clearance of virus depends on synergistic interactions between
antigen-specific populations of helper CD4+ T cells, antibody-producing B cells and
cytotoxic CD8+ T cells 6,7. In particular, it is believed that effective CD8+ T cell function
in HIV-1 infection is reliant on CD4+ T cell function 8.
Previous studies of primary immune responses to viral infection in mice have
shown that antigen-specific Th1 CD4 responses can be readily detected in the early
stages of the infection, but rapidly decline as antigen is cleared 9,10. Similarly, human
CD4+ T cell immune responses to primary herpesvirus infections exhibit a peak response
in the first few weeks 11,12 with markedly reduced responses at follow-up. These results
suggest that antigen-specific CD4+ T cells should be generated at a relatively high level
during primary HIV-1 infection.
IFN-γ producing antigen-specific CD4+ T cells have been demonstrated in
primary HIV-1 infection, despite high levels of viremia 13-17. Furthermore, proliferative
responses were maintained if antiretroviral therapy was instituted during acute HIV-1
For personal use only. by guest on May 30, 2013. bloodjournal.hematologylibrary.orgFrom

5
infection 13,14,18. Further evidence for the presence of antigen-specific CD4 T cells is the
production of high affinity, isotype-switched antibodies to HIV-1, which presumably
requires the provision of help for B cell responses by CXCR5+ CD4+ follicular helper T
cells 19,20.
Although CD4+ T cells which proliferate in vitro in response to HIV-1 antigens
are mostly absent in untreated chronically infected subjects, an average of approximately
0.1% of peripheral blood CD4+ T cells capable of producing IFN-γ can be detected in
most HIV-infected individuals by ELISPOT or by intracellular cytokine assay 21,22. It is
an absence of those HIV-specific CD4+ T cells which synthesise IL-2 23-27 that probably
causes the proliferative defect in viremic patients 26,28. However, IL-2-producing CD4+
memory cells typically belong to the CCR7+, CCR5-negative central memory subset 29
and therefore are not directly susceptible to infection by CCR5-tropic HIV-1 strains in
early infection. Furthermore, two recent studies of HIV-specific IFN-γ producing CD4+
T cells during PHI has shown that the vast majority were CCR7-negative cells which did
not produce IL-2 16,30. In the latter study, IL-2-producing antigen-specific CD4+ T cells
were readily detected in control subjects with EBV or HSV infections 30.
A possible explanation may come from studies of murine models, which suggest
that resting memory CD4+ T cells arise directly from effector cells 31,32. Theoretically,
then, IL-2-producing HIV-specific memory cells may be derived from Th1 effector cells,
which reportedly express CCR5 33. We have previously found that approximately 50%,
on average, of CD4+ T cells proliferating in vivo during primary HIV-1 infection
express CCR5 34. If the proliferating CD4+ T cells included antigen-specific effector
cells, then it is likely that many of these activated effector cells were CCR5+. Recently
For personal use only. by guest on May 30, 2013. bloodjournal.hematologylibrary.orgFrom

6
we confirmed the existence of CCR5+ antigen-specific CD4+ T cells, in a HIV+ long-
term non-progressor infected with an attenuated strain of HIV-1 35. These CCR5+ cells
produced IL-2 and proliferated strongly in response to HIV-1 p24. Furthermore, these
cells were also cytotoxic T lymphocytes (CTL), similar to cloned CD4+ T cells from
patients treated early in acute HIV-1 infection 36 and consistent with our previous finding
that perforin+ CD4+ T cells were elevated in HIV-1 infection 37. A similar population of
CMV-specific CCR5+ cytotoxic CD4+ T cells was also found in healthy adults, at
surprisingly high frequencies 35.
We hypothesized that there would be CCR5+ antigen-specific CD4+ T cells
produced at the earliest stages of primary HIV-1 infection. We first examined the
phenotype of activated, proliferating effector CD4+ T cells in PHI, and then used the
flow cytometric intracellular cytokine assay to determine the cell surface phenotype of
antigen-specific CD4+ T cells, which subsequently allowed us to further define these
cells in samples of fresh whole blood.
For personal use only. by guest on May 30, 2013. bloodjournal.hematologylibrary.orgFrom

7
Materials and Methods
Subjects
A total of 33 subjects, diagnosed with primary HIV-1 infection 34, and who then
enrolled in the PHAEDRA observational cohort, were included in this study. All subjects
were males whose risk group was sex with males. Symptoms associated with primary
HIV-1 infection were recorded as previously described 38.
Subjects were subdivided into two groups, early PHI (n = 19) and late PHI (n =
14), based on serology at presentation and clinical history of onset of symptoms (Table
1). A Western Blot intensity score (Ramacciotti et al, manuscript in preparation) was
calculated as the sum of each band, multiplied by its intensity on a scale of 1+ to 3+ (for
example, a subject with no bands will have a score of 0, while a subject with three bands
of 1+ intensity and one band of 2+ intensity will have a score of 5). Early PHI was
defined as having a Western Blot intensity score ≤ 5, and in our subject group, this
corresponded to presentation within 22 days following onset of symptoms. Late PHI was
defined as an intensity score > 5, and all these subjects in our cohort had a score of 12 or
higher, and presented 28 days or more since onset of symptoms. Two subjects in the late
PHI group did not record any symptoms of PHI, and therefore the midpoint between their
last negative and first positive HIV antibody tests was used as an estimate of infection
date.
One subject, #9400101, was originally diagnosed as early PHI, but was
concurrently diagnosed as primary CMV infection, exhibiting a new CMV IgM+
reactivity, together with detectable CMV viral load, one week after PHI diagnosis.
Therefore this individual has been excluded from the cohort analyses, and has been
For personal use only. by guest on May 30, 2013. bloodjournal.hematologylibrary.orgFrom

8
considered separately. CMV serology was performed by routine diagnostic assay (Vidas,
BioMerieux, Marcy-l'Etoile, France).
Healthy HIV-negative university and hospital staff members were recruited as
controls for this study. The PHAEDRA study was approved by the local institutional
ethics committee, and all subjects gave informed consent.
Cell surface phenotyping of peripheral blood CD4+ T cells
Staining of T lymphocyte subsets in fresh peripheral blood and 6-colour flow
cytometric analysis on a dual-laser LSR II flow cytometer (Becton-Dickinson), was
performed as previously described 35. Monoclonal antibodies used were CD3-PerCP-
Cy5.5, CD4-PE-Cy7, CD8-APC-Cy7, CD11a-FITC, CD27-FITC, CD28-PE, CD38-
APC, -PE and -FITC, HLA-DR-FITC, CD57-FITC, CD62L-FITC, CD95-PE,
CD154(CD40L)-PE, and IL-2Rα (CD25)-PE and –FITC (from Becton-Dickinson, San
Jose, CA); CXCR4-PE, CCR5-APC, -PE and –FITC, CCR7-PE, CD45RA-APC,
CD45RO-FITC, TNFR2 (CD120b)-PE, Ki-67-FITC, Bcl-2-PE and -FITC, IL-12Rβ1-PE,
Perforin-FITC and Granzyme A-FITC (Pharmingen); TIA-1/GMP-17-PE, IL-
2Rβ (CD122)-PE, and IL-7R (CD127)-PE (Beckman Coulter, Hialeah, FL); IL-18R-PE
(R&D Systems, Minneapolis, MN); and Granzyme B-APC (Caltag, Burlingame, CA).
For CCR5 analysis, whole blood was processed an average of 1.75 hr after
venepuncture, to minimize spontaneous loss of this marker, as previously described 35.
Intracellular staining was performed using FACSlyse and FACSPermeabilizing Reagents
(Becton-Dickinson) according to the manufacturer’s directions, and analysed as
previously described.34
For personal use only. by guest on May 30, 2013. bloodjournal.hematologylibrary.orgFrom
9
Intracellular cytokine assay
A subset of 14 consecutive subjects (7 early PHI and 7 late PHI) were studied for
the presence of HIV Gag- and Nef-specific CD4+ T cells using a whole blood
intracellular cytokine (ICC) assay 35 using 6-colour flow cytometry. Overlapping HIV-1
Gag 15-mer peptides, from the sequence of strain HXB2, were obtained from the NIH
AIDS reference reagents program. Gag peptides were used as a pool of 122 peptides, at
an individual concentration of 2µg/ml each. For analysis, 300,000 events were collected,
T lymphocytes were first gated on CD3-PerCP-Cy5.5 versus side scatter, then on CD4-
PE-Cy7-positive/CD8-APC-Cy7-negative cells, and finally IFN-γ−APC+ cells were
analysed for the various FITC and PE antibodies. This method has a validated cut-off for
positive results of 0.08% of CD4+ T cells, based on background results plus 3 times the
standard deviation, from study of sixteen HIV-negative controls (Munier et al,
manuscript in preparation).
Statistics
Lymphocyte phenotyping results were expressed as a percentage of CD4+ T
lymphocytes. Results for each cohort were expressed as medians and interquartile ranges.
The Mann-Whitney U test was performed to compare early and late subgroups of primary
HIV-1 infection subjects with each other and with the HIV-negative controls, using
Statview v5.0 for Macintosh (Abacus Concepts, Berkeley, CA, USA). A two sided p
value <0.05 was considered statistically significant. The relationship between different
phenotypes was determined by Spearman Rank Correlation (Statview). Graphs of
For personal use only. by guest on May 30, 2013. bloodjournal.hematologylibrary.orgFrom

10
longitudinal data were plotted with Lowess curve-fitting, with tension set to 66%
(Statview).
For personal use only. by guest on May 30, 2013. bloodjournal.hematologylibrary.orgFrom

11
Results
Changes in CD4+ T cell subsets during early PHI
Several subsets of CD4+ T cells were present only as very minor subsets in HIV-
negative controls, but were found to be prominent in subjects with early PHI. In
particular, CCR5+CD38+++ CD4+ T cells (Figure 1a) were highly elevated during early
PHI, compared with late PHI and healthy adult controls (medians: 5.3% vs 1.0% vs 0.3%
of CD4+ T cells, respectively; Figure 1e).
CCR5+TIA+Ki-67+ (Figure 1b) and Perforin+GranzymeB+ (Figure 1c) CD4+ T
cells were also elevated during early PHI, compared with late PHI and healthy controls
(3.6% vs 1.0% vs 0.2% and 11.6% vs 5.% vs 1.6%, respectively; Figure 1e).
Similarly, there was an elevation in CD127 (IL-7R)-negative CD57-negative
(Figure 1d) CD4+ T cells during early PHI, compared with late PHI and healthy controls
(medians: 13.7% vs 6.9% vs 5.2%, respectively; Figure 1e). These CD127-negative
CD4+ T cells were also CD45RA-negative (not shown).
All the above subset changes in early PHI were statistically significant when
compared to healthy adult controls (p<0.001), and also when compared with late PHI
(p<0.01). Differences between late PHI subjects and HIV-negative controls were also
statistically significant (p<0.01; except for CD127(IL-7R)-negative CD57-negative
CD4+ T cells, p=0.05).
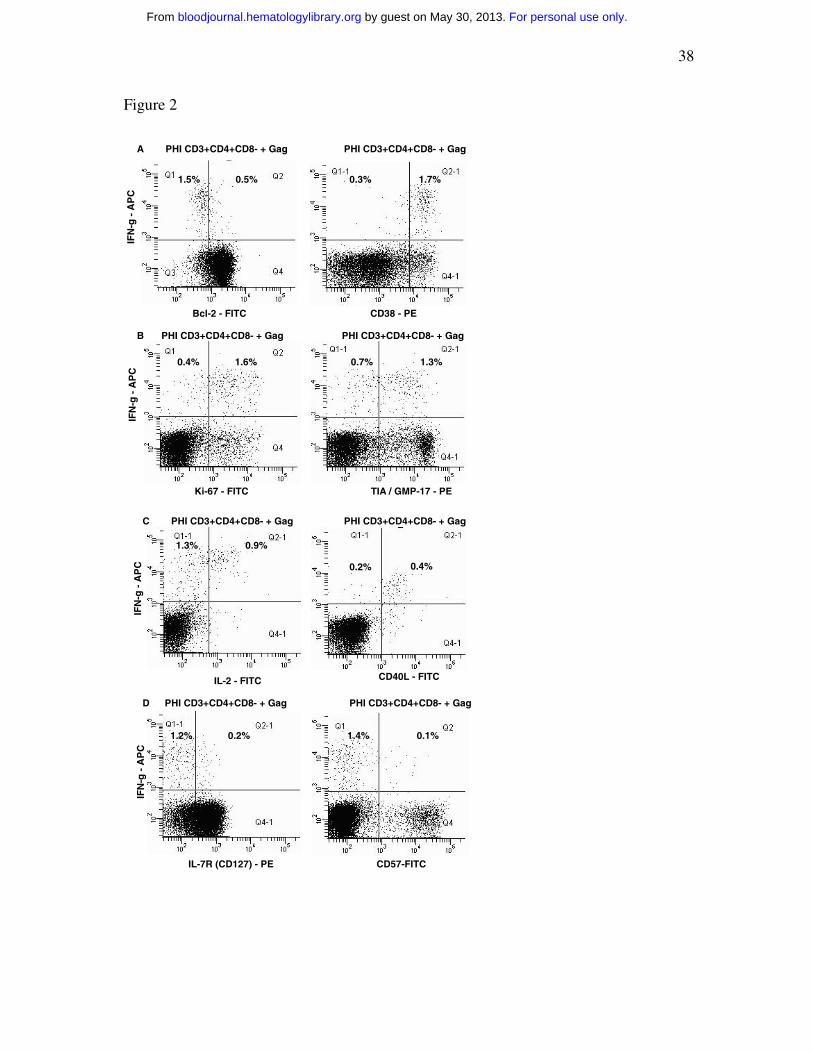
Intracellular cytokine assay of HIV-1 Gag-specific CD4+ T cells during PHI
In six out of seven subjects studied during early PHI, Gag-specific CD4+ T cells
were detected by IFN-γ production in the ICC assay, ranging from 0.3% to 1.6% of
For personal use only. by guest on May 30, 2013. bloodjournal.hematologylibrary.orgFrom

12
CD4+ T cells. Furthermore, HIV-1 Gag-specific IFN-γ+ CD4+ T cells were consistently
CD38+++ and Bcl-2 dim (Figure 2a), mostly Ki-67+ and TIA-1/GMP-17+ (Figure 2b),
CD40L+ (Figure 2c) and CD57-negative (Figure 2d). A small, but consistent, proportion
of IFN-γ+ Gag-specific CD4+ T cells also produced IL-2 (Fig. 2c) and expressed cell
surface CD127 (Fig. 2d).
Gag-specific IFN-γ+ CD4+ T cells were found in only one in subject with late
PHI and were too low to obtain reliable phenotype data (not shown).
In contrast, CMV-specific IFN-γ+ CD4+ T cells in five of the same early PHI
individuals who were also CMV IgG seropositive, at the same time points, were
predominantly CD38low and Bcl-2-high (Figure 3a), Ki-67-negative (Figure 3b) and
CD57-positive (Figure 3c). CMV-specific CD4+ T cells were similar to Gag-specific
CD4+ T cells in their expression of TIA-1/GMP-17 (Figure 3b), CD127 (Figure 3c),
CD40L and IL-2 (not shown). The phenotyping results for HIV-specific and CMV-
specific CD4+ T cells from all early PHI subjects studied are summarized in Figures 3d
and 3e, respectively.
Of interest, subject #90400101, undergoing concurrent primary HIV-1 and CMV
infections, had 4.0 % CMV-specific CD4+ T cells which were phenotypically very
similar to his HIV-specific CD4+ T cells, being CD38+++ and Bcl-2 dim, CD57-
negative, Ki-67+, TIA-1/GMP-17+ and CD40L+ (data not shown).
In subjects with late PHI and in HIV-negative adults (who were CMV-
seropositive), CMV-specific IFN-γ+ CD4+ T cells were also CD38low and Bcl-2-high,
Ki-67-negative and CD57-positive, TIA-1/GMP-17+, and CD40L+ (summarized in
Figure 3e). However, in HIV-negative adult controls, there was an increased proportion
For personal use only. by guest on May 30, 2013. bloodjournal.hematologylibrary.orgFrom

13
of CMV-specific IFN-γ+ CD4+ T cells which produced IL-2 and were CD127+ and
CD57-negative, compared with both early (p<0.01) and late PHI subjects (p<0.02; Figure
3e). It is important to note that the low expression of CD38 and Ki-67 by CMV-specific
CD4+ T cells suggests that their expression is not acutely up-regulated by the 6 hr
exposure to antigen in vitro.
Close relationship of circulating CCR5+CD38+++ and Gag-specific CD4+ T cells
When we compared the CD38+++ phenotype of Gag-specific CD4+ T cells,
obtained from the ICC assays (Fig. 2a), with the co-expression of CCR5 on CD38+++
CD4+ T cells in whole blood samples from the same subjects at the same time points
(Fig. 1a), the results infer that antigen-specific CD4+ T cells were CCR5+ immediately
ex vivo. Direct examination of CCR5 expression in the ICC assay was precluded by
down-regulation of CCR5 both spontaneously and in response to antigen 35.
Overall, Gag-specific CD4+ T cells detected by IFN-γ production, in subjects
studied during early PHI, represented a median of 0.58% of CD4+ T cells, whereas
subjects with late PHI had a significantly lower median, 0.08% (p<0.01; Figure 4a), very
close to the detection limit of the ICC. Again, this is consistent with the relative levels of
CCR5+CD38+++ CD4+ T cells in these two subject subgroups (Fig. 1e).
Moreover, we observed a very close correlation between the proportion of
CCR5+CD38+++ CD4+ T cells and the proportion of IFN-γ+ Gag-specific CD4+ T cells
(rho = 0.76; p = 0.004; Figure 4b). The results show, however, that the proportion of
Gag-specific CD4+ T cells consistently represented only one-tenth of the proportion of
CCR5+CD38+++ CD4+ T cells (Figure 4b).
For personal use only. by guest on May 30, 2013. bloodjournal.hematologylibrary.orgFrom

14
Subject #90400101, who was undergoing both primary HIV-1 and CMV
infection, had 55% of CD4+ T cells with a CCR5+CD38+++ phenotype, and had 1.1%
HIV-specific and 4.0% CMV-specific CD4+ T cells. Therefore, in this individual, the
combined proportions of HIV- and CMV-specific CD4+ T cells were also close to one-
tenth of the CCR5+CD38+++ CD4+ T cells. The much larger primary CD4+ T cell
response to CMV, compared with the response to HIV-1 Gag, has previously been
reported in four similarly co-infected subjects 16.
In this cross-sectional study of PHI subjects at presentation, the level of
CCR5+CD38+++ CD4+ T cells peaked within the first 22 days following onset of
symptoms, and appeared to decline rapidly after that time (Figure 4c). A similar peak was
also observed when plotted against WB intensity score (not shown). The level of
CCR5+CD38+++ CD4+ T cells was highly variable and not all early PHI subjects
exhibited a large population of CCR5+CD38+++ CD4+ T cells. Nearly all of the early
PHI subjects in the current study commenced treatment, so it has not been possible so far
to conclusively define the natural history of the CCR5+CD38+++ CD4+ T cells in
individual subjects.
The level of CCR5+CD38+++ CD4+ T cells appeared to have a complex
relationship with viral load, but there was an association between the two variables (rho =
0.63; p = 0.003; Figure 4d).
For personal use only. by guest on May 30, 2013. bloodjournal.hematologylibrary.orgFrom

15
Further phenotyping of CCR5+CD38+++ CD4+ T cells in fresh whole blood
We investigated the expression of trafficking markers, adhesion molecules, co-
stimulatory molecules and cytokine receptors on the CCR5+CD38+++ CD4+ T cells in
samples of fresh whole blood, from 4 subjects with early PHI. Representative results are
shown in Figure 5.
The CCR5+CD38+++ CD4+ T cells exhibited relative upregulation of the
chemokine receptor CXCR3 and the cytokine receptor IL-12Rß1 (Figure 5a), consistent
with the phenotype of IFN-γ and IL-2 producing Th1 CD4+ T cells 33.
The CCR5+CD38+++ CD4+ T cells slightly up-regulated CD122 (Figure 5b) and
CD132 (not shown) but not CD25 (not shown), representing IL-2R ß-, γ-, and α-chains,
respectively. Expression of TNFR2 (CD120b) was also increased (Figure 5b).
The cell surface expression of IL-7R (CD127) was mostly down-regulated,
although one-third of cells retained this receptor (Figure 5c). Also, there was a
consistently observed minority of CCR5+CD38+++ which co-expressed CCR7 (Figure
5c), but these cells had completely down-regulated CD45RA (not shown). These cells
also maintained expression of CD62L (not shown) and had increased expression of
CD49d, integrin ß7 and LFA-1 (not shown), relative to other CD4+ T cells.
The CCR5+CD38+++ CD4+ T cells also maintained expression of the co-
stimulation molecules, CD28 and CD27 (not shown).
For personal use only. by guest on May 30, 2013. bloodjournal.hematologylibrary.orgFrom

16
Discussion
The current study of the phenotype of HIV-specific CD4+ T cells, in fresh whole
blood samples obtained during primary HIV-1 infection, demonstrated that these cells
were highly activated CD38+++ cells. Parallel analysis of the same blood samples
showed that the CD38+++ CD4+ T cells co-expressed the HIV-1 co-receptor, CCR5.
Together, these results establish that circulating HIV-1 antigen-specific CD4+ T cells
were CCR5+ during primary HIV-1 infection. Expression of CCR5 on these highly
activated antigen-specific CD4+ T cells suggests that they are likely to be particularly
susceptible to HIV-1 infection, and possibly lost as a result of either direct cytopathic
effect by HIV-1, or lysis by CD8+ CTL.
Consistent with this possibility, our cross-sectional study of patients at
presentation found that there was an apparent rapid decline in antigen-specific CD4 T
cells over time, as defined both functionally (by ICC assay) and phenotypically
(CCR5+CD38+++). In order to establish whether loss of antigen-specific CD4+ T cells is
due to HIV-1 infection, it will be important to confirm the kinetics in more detailed
longitudinal studies of individual subjects. It will also be necessary to perform cell
sorting of CD38+++ CD4+ T cells during early primary infection and determine whether
they preferentially contain HIV-1 DNA. Previous studies of CD4+ T cells subsets
containing HIV-1 DNA have shown relatively increased infection of antigen-specific
CD4+ T cells 5 but the cell surface expression of CCR5 in that analysis was not
examined.
In the present study, HIV-1 Gag-specific CD4+ T cells were also predominantly
Ki-67+, indicating proliferative expansion. It has been shown during acute SIV infection
For personal use only. by guest on May 30, 2013. bloodjournal.hematologylibrary.orgFrom

17
that Ki-67+ CD4+ T cells in lymphoid tissue increase dramatically about 10 days
following inoculation, and are the main producers of SIV during acute infection 39
although again in that study expression of CCR5 was not reported. Our results would
suggest that proliferation of antigen-specific CD4+ T cells contributes to an increase in
target cells in lymphoid tissue. However, cell-cell transmission of SIV to adjacent Ki-67-
negative cells in lymphoid tissue was also observed during acute infection 39, suggesting
that highly productively infected Ki-67+ CD4+ T cells may act as a focus of spreading
infection.
An important question is whether all the observed CCR5+ CD38+++ CD4+ T
cells were HIV-specific. Our findings agree with earlier descriptions of CD38+, Ki-67+
CMV- and EBV-specific CD4+ T cells during primary infection with these respective
viruses 11,12. In the present study, one early PHI subject concurrently underwent primary
CMV infection and had high levels of both CMV- and HIV-specific CD4+ T cells which
were similarly CCR5+CD38+++ and Ki-67+. Conversely, in the other PHI subjects
(without evidence of primary CMV infection), our results showed that “bystander” CMV-
specific effector memory CD4+ T cells, at the same time points, were neither activated,
nor proliferating. It should be noted, however, that a large fraction of these resting CMV-
specific memory CD4+ T cells were CD57+ and did not produce IL-2, suggesting that
they were terminally differentiated effector cells, which previous in vitro studies would
predict were unlikely to proliferate 40.
There are several possible reasons why the level of HIV-specific CD4+ T cells
measured in our assay may not match the level of CD38+++ CD4+ T cells in the blood
samples, even if these cells were largely antigen-specific. We have not completely
For personal use only. by guest on May 30, 2013. bloodjournal.hematologylibrary.orgFrom
18
investigated the extent of CD4+ T cell responses to all HIV-1 proteins. Most studies do
suggest that CD4+ T cell responses to HIV-1 Gag are highly immunodominant 1,
particularly in subjects during acute infection 16 as well as subjects treated during acute
infection who underwent treatment interruption 41,42. However, gp160-specific CD4+ T
cell responses were also commonly found in very early PHI in one report 41. Additional
responses might also be detected to variant autologous sequences 43, to frame-shifted
peptides 44, or to peptides from recombinant variants 45, but these were not tested in the
present study. Moreover, there may be a sub-lineage of antigen-specific Th1 effector cells
which do not express IFN-γ, and may be precursors of memory cells 46. It has also been
reported that MHC class I tetramer+ HIV antigen-specific CD8+ T cells do not uniformly
produce IFN-γ in response to their cognate antigen during periods of high viremia
following treatment interruptions 47.
Increased activation of CD4+ T cells is prominent in PHI 48 and this activation is
dramatically reduced following initiation of anti-retroviral therapy 34,49. Increased
expression of CD38 on T cells, particularly on CD8+ T cells, is highly correlated with
disease progression during chronic HIV-1 infection 50. Elevated CD38 expression has
also been reported on HIV-specific CD8+ T cells during acute HIV-1, although at the
same time it was observed that CMV- and EBV-specific CD8+ T cells similarly
expressed relatively high levels of CD38 51,52. Therefore the question of whether elevated
activation is limited to HIV-specific T cells remains unclear, but overall the present
results indicate that CD38 up-regulation on CD4+ T cells, early in infection, is related to
antigen-specific activation. It will also be important to determine whether CCR5
expression is coupled to elevated CD38 expression throughout HIV-1 infection.
For personal use only. by guest on May 30, 2013. bloodjournal.hematologylibrary.orgFrom

19
However, HIV-1 infection of CCR5+CD38+++ CD4+ T cells is probably not the
main reason why these cells decline in the circulation as the primary infection resolves.
Studies in murine models have shown that CD4+ T cell responses to viral infection show
a peak response in the range of 0.5 – 10% of CD4+ T cells, followed by a decrease of 10-
to 20-fold 9,10. Also, a similar peak and rapid decline in CMV-specific CD4+ T cells has
been observed in primary CMV infection 11. Possible explanations for such a normal
decline in viral antigen-specific CD4+ T cells include apoptosis and trafficking. Firstly,
we have now directly shown that the antigen-specific CD38+++ CD4+ T cells also
contained decreased levels of Bcl-2. We had previously shown that CCR5+ and CD38+ T
cells during acute HIV-1 infection contained low levels of Bcl-2 and spontaneously
underwent apoptosis in vitro 53, but these cells could be rescued from apoptosis by
incubation with IL-15 or IL-2, which increased intracellular levels of Bcl-2 53. Th1
effector cells are particularly susceptible to apoptosis 54, and interestingly, the products of
these cells, including IL-2, IFN-γ and perforin, have all been shown to be involved in
feedback regulation of T cell responses in vivo 55-58. Comparison of primary HIV-
1infection with acute EBV infection, where we have also shown an elevation of CD38++
CD4+ T cells, as well as proliferating CCR5+ CD4+ T cells with low Bcl-2 and increased
spontaneous apoptosis 34,53, may allow study of a normal contraction of these CD4+
effector cells.
Another possible reason for the observed decline of CCR5+CD38+++ CD4+ T
cells may be trafficking out of the circulation to sites of inflammation, consistent with the
cell surface phenotype of CXCR3+ and CCR5+ 59, as well as high expression of LFA-1
and CD62L 60. Anti-viral CD8+ effector T cells proliferate in lymph nodes and the
For personal use only. by guest on May 30, 2013. bloodjournal.hematologylibrary.orgFrom
20
spleen, exit into the circulation, and then approximately half of these cells traffic to
organs such as the bone marrow, lung, liver and gut (reviewed in 61). In particular, it is
believed that CCR5+ CD4+ T cells in gut-associated lymphoid tissue represent a main
target of HIV-1 in acute infection 62,63. We found that the majority of CCR5+ CD38+++
CD4+ T cells expressed the gut-homing marker, integrin α4β7. Interestingly, a previous
study showed that there was a selective loss of the integrin α4β7+ subset of CCR5+
CD4+ T cells from the circulation during acute HIV-1 infection 64.
However, the apparent decline in antigen-specific T cells may alternatively
simply reflect anergy of these cells, resulting in an inability to detect them by functional
assays in vitro. Exhaustion of antigen-specific CD4+ T cells has been observed in
persistent viral infections in mice 65. Similarly, exposure to persistent antigen in vivo led
to a dramatic reduction in cytokine production by recently proliferated CD4+ T cells in a
mouse model of anergy 66. It is important to note that a histologic feature of acute HIV-
1infection is the accumulation of large numbers of virions retained by the follicular
dendritic cell network within lymphoid tissue 67. Constant exposure to HIV-1 antigens,
therefore, may prevent the transition to resting memory cells, or induce exhaustion. One
study has already demonstrated that CD4+ T cells specific for HIV-1 envelope, which
had been present at a detectable level during primary HIV-1 infection, only persisted at a
greatly reduced, functionally undetectable level following resolution of the acute phase of
infection 41 and required prolonged incubation in vitro in IL-2 containing medium for
detection.
Finally, it is possible that the antigen-specific CD4+ T cells switch to production
of alternative cytokines not measured in the current study, such as IL-10, rather than IFN-
For personal use only. by guest on May 30, 2013. bloodjournal.hematologylibrary.orgFrom

21
γ 68. A more comprehensive analysis of cytokines and effector molecules produced by the
Gag-specific CD4+ T cells in PHI is now feasible and warranted. Similarly, development
of CD25+ suppressor cells 69 may occur after resolution of the primary infection,
blocking in vitro responsiveness and studies of the effect of depletion of such CD25+
CD4+ T cells may be informative.
Approximately half of the activated, proliferating CD4+ T cells also expressed
markers of cytotoxic T lymphocytes, including TIA-1/GMP-17/NKG-7, as well as
granzyme B and perforin. The results of the current study are in agreement with previous
findings that immune responses to HIV-1 and CMV include CD4+ T cells with a CTL
phenotype and function 35-37,70. These consistent findings suggest that the normal role of
CD4+ T cells is not just to help B cells and CD8+ T cells, but also indicates a direct
antiviral effect. It had been reported that MHC Class II+ cells in vivo can present
endogenously produced viral antigenic peptides to CD4+ T cells 71 and a recent paper has
now shown that CD4+ CTL specifically clear viral peptide loaded target cells in vivo 72.
Most CCR5+CD38+++ CD4+ T cells exhibited an upregulation of the IL-2R ß
chain, but not the IL-2Rα chain, consistent with a role for IL-15 in survival of these cells
73. We also found an upregulation of the IL-12Rß1 chain on these cells, at least during the
acute phase. Previous studies have shown that incubation with IL-15 74,75 or IL-12 76
increased antigen-specific responses in vitro. The presence of these receptors is consistent
with the ability of IL-15 to induce CCR5 expression on resting T cells 77 and IL-12 to
regulate CCR5 expression following T cell activation 78. We also found an upregulation
of the TNFR2 on the CCR5+ CD38+++ CD4+ T cells, which may contribute to apoptosis
For personal use only. by guest on May 30, 2013. bloodjournal.hematologylibrary.orgFrom

22
in combination with low Bcl-2 79, but may also be involved in enhancement of HIV-1
replication 80.
Studies of effector CD4+ cells in murine models suggest that as viral antigen is
cleared, a subset of effector cells will convert to resting memory cells 31,32. In particular,
those antigen-specific CD4+T cells which retain expression of the IL-7R are precursors
of memory cells 81. In our earlier study 35, IL-7R-negative CD38++ T cells from subjects
during primary HIV-1 infection underwent spontaneous apoptosis in vitro, but we did not
study whether there was a subset of activated T cells which retained IL-7R and could be
induced to become resting memory cells by incubation in vitro with IL-7, as suggested in
the murine studies 81.
We had also previously studied the TCR V beta repertoire of Ki-67+, CD38++
and CCR5+ CD4+ T cells and found that it was surprisingly broad 53. Taken together
with the current results, it is likely that many clones are involved in the initial antigen-
specific response to HIV. Patients treated during acute infection have the broadest
responses to HIV proteins 42, which also suggests a broad base of responses during acute
infection.
Our results showing expression of CCR5 on activated CD4+ T cells may help to
explain the effects of immunosuppressive treatment with hydroxyurea 82 and cyclosporine
A 83 in acute HIV-1 infection. The presence of CCR5 on antigen-specific CD4+ T cells
predicts that blockade of this receptor will be particularly beneficial, not only during
acute infection, but possibly also during therapeutic immunisation or treatment
interruptions. It will also be important to confirm that expression of IL-7R is an early
For personal use only. by guest on May 30, 2013. bloodjournal.hematologylibrary.orgFrom

23
marker of long-term self-renewing memory cells, and may represent a useful guide to
vaccine efficacy.
For personal use only. by guest on May 30, 2013. bloodjournal.hematologylibrary.orgFrom

24
Acknowledgements
The authors would like to thank the subjects and their physicians for their
participation, Kate McGhie, Ciara McGinley and Palanee Ammaranond for help with
specimen organization and logistics, as well as the NIH Reference Reagents Program for
provision of HIV-1 overlapping Gag peptides.
For personal use only. by guest on May 30, 2013. bloodjournal.hematologylibrary.orgFrom

25
References
1. Picker LJ, Maino VC. The CD4(+) T cell response to HIV-1. Curr Opin Immunol.
2000;12:381-386.
2. Clerici M, Stocks NI, Zajac RA, et al. Detection of three distinct patterns of T
helper cell dysfunction in asymptomatic, human immunodeficiency virus-seropositive
patients. Independence of CD4+ cell numbers and clinical staging. J Clin Invest.
1989;84:1892-1899.
3. McNeil AC, Shupert WL, Iyasere CA, et al. High-level HIV-1 viremia suppresses
viral antigen-specific CD4(+) T cell proliferation. Proc Natl Acad Sci U S A.
2001;98:13878-13883.
4. Badley AD, Pilon AA, Landay A, Lynch DH. Mechanisms of HIV-associated
lymphocyte apoptosis. Blood. 2000;96:2951-2964.
5. Douek DC, Brenchley JM, Betts MR, et al. HIV preferentially infects HIV-
specific CD4+ T cells. Nature. 2002;417:95-98.
6. Doherty PC, Topham DJ, Tripp RA, Cardin RD, Brooks JW, Stevenson PG.
Effector CD4+ and CD8+ T-cell mechanisms in the control of respiratory virus
infections. Immunol Rev. 1997;159:105-117.
7. Bachmann MF, Hunziker L, Zinkernagel RM, Storni T, Kopf M. Maintenance of
memory CTL responses by T helper cells and CD40-CD40 ligand: antibodies provide the
key. Eur J Immunol. 2004;34:317-326.
8. Kalams SA, Buchbinder SP, Rosenberg ES, et al. Association between virus-
specific cytotoxic T-lymphocyte and helper responses in human immunodeficiency virus
type 1 infection. J Virol. 1999;73:6715-6720.
9. Topham DJ, Doherty PC. Longitudinal analysis of the acute Sendai virus-specific
CD4+ T cell response and memory. J Immunol. 1998;161:4530-4535.
10. Christensen JP, Doherty PC. Quantitative analysis of the acute and long-term
CD4(+) T-cell response to a persistent gammaherpesvirus. J Virol. 1999;73:4279-4283.
11. Rentenaar RJ, Gamadia LE, van DerHoek N, et al. Development of virus-specific
CD4(+) T cells during primary cytomegalovirus infection. J Clin Invest. 2000;105:541-
548.
For personal use only. by guest on May 30, 2013. bloodjournal.hematologylibrary.orgFrom

26
12. Amyes E, Hatton C, Montamat-Sicotte D, et al. Characterization of the CD4+ T
cell response to Epstein-Barr virus during primary and persistent infection. J Exp Med.
2003;198:903-911.
13. Rosenberg ES, Billingsley JM, Caliendo AM, et al. Vigorous HIV-1-specific
CD4+ T cell responses associated with control of viremia. Science. 1997;278:1447-1450.
14. Rosenberg ES, Altfeld M, Poon SH, et al. Immune control of HIV-1 after early
treatment of acute infection. Nature. 2000;407:523-526.
15. Oxenius A, Price DA, Easterbrook PJ, et al. Early highly active antiretroviral
therapy for acute HIV-1 infection preserves immune function of CD8+ and CD4+ T
lymphocytes. Proc Natl Acad Sci U S A. 2000;97:3382-3387.
16. Harari A, Rizzardi GP, Ellefsen K, et al. Analysis of HIV-1- and CMV-specific
memory CD4 T-cell responses during primary and chronic infection. Blood.
2002;100:1381-1387.
17. Lichterfeld M, Kaufmann DE, Yu XG, et al. Loss of HIV-1-specific CD8+ T cell
proliferation after acute HIV-1 infection and restoration by vaccine-induced HIV-1-
specific CD4+ T cells. J Exp Med. 2004;200:701-712.
18. Malhotra U, Berrey MM, Huang Y, et al. Effect of combination antiretroviral
therapy on T-cell immunity in acute human immunodeficiency virus type 1 infection. J
Infect Dis. 2000;181:121-131.
19. Breitfeld D, Ohl L, Kremmer E, et al. Follicular B helper T cells express CXC
chemokine receptor 5, localize to B cell follicles, and support immunoglobulin
production. J Exp Med. 2000;192:1545-1552.
20. Schaerli P, Willimann K, Lang AB, Lipp M, Loetscher P, Moser B. CXC
chemokine receptor 5 expression defines follicular homing T cells with B cell helper
function. J Exp Med. 2000;192:1553-1562.
21. Pitcher CJ, Quittner C, Peterson DM, et al. HIV-1-specific CD4+ T cells are
detectable in most individuals with active HIV-1 infection, but decline with prolonged
viral suppression. Nat Med. 1999;5:518-525.
22. Betts MR, Ambrozak DR, Douek DC, et al. Analysis of total human
immunodeficiency virus (HIV)-specific CD4(+) and CD8(+) T-cell responses:
relationship to viral load in untreated HIV infection. J Virol. 2001;75:11983-11991.
For personal use only. by guest on May 30, 2013. bloodjournal.hematologylibrary.orgFrom

27
23. Wilson JD, Imami N, Watkins A, et al. Loss of CD4+ T cell proliferative ability
but not loss of human immunodeficiency virus type 1 specificity equates with progression
to disease. J Infect Dis. 2000;182:792-798.
24. Boaz MJ, Waters A, Murad S, Easterbrook PJ, Vyakarnam A. Presence of HIV-1
Gag-specific IFN-gamma+IL-2+ and CD28+IL-2+ CD4 T cell responses is associated
with nonprogression in HIV-1 infection. J Immunol. 2002;169:6376-6385.
25. Iyasere C, Tilton JC, Johnson AJ, et al. Diminished proliferation of human
immunodeficiency virus-specific CD4+ T cells is associated with diminished interleukin-
2 (IL-2) production and is recovered by exogenous IL-2. J Virol. 2003;77:10900-10909.
26. Younes SA, Yassine-Diab B, Dumont AR, et al. HIV-1 viremia prevents the
establishment of interleukin 2-producing HIV-specific memory CD4+ T cells endowed
with proliferative capacity. J Exp Med. 2003;198:1909-1922.
27. Harari A, Petitpierre S, Vallelian F, Pantaleo G. Skewed representation of
functionally distinct populations of virus-specific CD4 T cells in HIV-1-infected subjects
with progressive disease: changes after antiretroviral therapy. Blood. 2004;103:966-972.
28. Palmer BE, Boritz E, Wilson CC. Effects of sustained HIV-1 plasma viremia on
HIV-1 Gag-specific CD4+ T cell maturation and function. J Immunol. 2004;172:3337-
3347.
29. Sallusto F, Lenig D, Forster R, Lipp M, Lanzavecchia A. Two subsets of memory
T lymphocytes with distinct homing potentials and effector functions. Nature.
1999;401:708-712.
30. Harari A, Vallelian F, Meylan P, Pantaleo G. Functional heterogeneity of memory
CD4 T cell responses in different conditions of antigen exposure and persistence. J
Immunol. 2005;174:1037-1045.
31. Hu H, Huston G, Duso D, Lepak N, Roman E, Swain SL. CD4(+) T cell effectors
can become memory cells with high efficiency and without further division. Nat
Immunol. 2001;2:705-710.
32. Harbertson J, Biederman E, Bennett KE, Kondrack RM, Bradley LM. Withdrawal
of stimulation may initiate the transition of effector to memory CD4 cells. J Immunol.
2002;168:1095-1102.
For personal use only. by guest on May 30, 2013. bloodjournal.hematologylibrary.orgFrom

28
33. Bonecchi R, Bianchi G, Bordignon PP, et al. Differential expression of
chemokine receptors and chemotactic responsiveness of type 1 T helper cells (Th1s) and
Th2s. J Exp Med. 1998;187:129-134.
34. Zaunders JJ, Kaufmann GR, Cunningham PH, et al. Increased turnover of CCR5+
and redistribution of CCR5- CD4 T lymphocytes during primary human
immunodeficiency virus type 1 infection. J Infect Dis. 2001;183:736-743.
35. Zaunders JJ, Dyer WB, Wang B, et al. Identification of circulating antigen-
specific CD4+ T lymphocytes with a CCR5+, cytotoxic phenotype in an HIV-1 long-term
nonprogressor and in CMV infection. Blood. 2004;103:2238-2247.
36. Norris PJ, Sumaroka M, Brander C, et al. Multiple effector functions mediated by
human immunodeficiency virus-specific CD4(+) T-cell clones. J Virol. 2001;75:9771-
9779.
37. Appay V, Zaunders JJ, Papagno L, et al. Characterization of CD4(+) CTLs ex
vivo. J Immunol. 2002;168:5954-5958.
38. Vanhems P, Dassa C, Lambert J, et al. Comprehensive classification of symptoms
and signs reported among 218 patients with acute HIV-1 infection. J Acquir Immune
Defic Syndr. 1999;21:99-106.
39. Zhang ZQ, Wietgrefe SW, Li Q, et al. Roles of substrate availability and infection
of resting and activated CD4+ T cells in transmission and acute simian
immunodeficiency virus infection. Proc Natl Acad Sci U S A. 2004;101:5640-5645.
40. Brenchley JM, Karandikar NJ, Betts MR, et al. Expression of CD57 defines
replicative senescence and antigen-induced apoptotic death of CD8+ T cells. Blood.
2003;101:2711-2720.
41. Malhotra U, Holte S, Zhu T, et al. Early induction and maintenance of Env-
specific T-helper cells following human immunodeficiency virus type 1 infection. J
Virol. 2003;77:2663-2674.
42. Kaufmann DE, Bailey PM, Sidney J, et al. Comprehensive analysis of human
immunodeficiency virus type 1-specific CD4 responses reveals marked
immunodominance of gag and nef and the presence of broadly recognized peptides. J
Virol. 2004;78:4463-4477.
For personal use only. by guest on May 30, 2013. bloodjournal.hematologylibrary.orgFrom

29
43. Altfeld M, Addo MM, Shankarappa R, et al. Enhanced Detection of Human
Immunodeficiency Virus Type 1-Specific T-Cell Responses to Highly Variable Regions
by Using Peptides Based on Autologous Virus Sequences. J Virol. 2003;77:7330-7340.
44. Cardinaud S, Moris A, Fevrier M, et al. Identification of Cryptic MHC I-restricted
Epitopes Encoded by HIV-1 Alternative Reading Frames. J Exp Med. 2004;199:1053-
1063.
45. Shriner D, Rodrigo AG, Nickle DC, Mullins JI. Pervasive genomic recombination
of HIV-1 in vivo. Genetics. 2004;167:1573-1583.
46. Wu CY, Kirman JR, Rotte MJ, et al. Distinct lineages of T(H)1 cells have
differential capacities for memory cell generation in vivo. Nat Immunol. 2002;3:852-858.
47. Oxenius A, Sewell AK, Dawson SJ, et al. Functional discrepancies in HIV-
specific CD8+ T-lymphocyte populations are related to plasma virus load. J Clin
Immunol. 2002;22:363-374.
48. Zaunders J, Carr A, McNally L, Penny R, Cooper D. Effects of primary HIV-1
infection on subsets of CD4+ and CD8+ T lymphocytes. AIDS. 1995;9:561-566.
49. Tilling R, Kinloch S, Goh LE, et al. Parallel decline of CD8+/CD38++ T cells and
viraemia in response to quadruple highly active antiretroviral therapy in primary HIV
infection. Aids. 2002;16:589-596.
50. Liu Z, Cumberland WG, Hultin LE, Kaplan AH, Detels R, Giorgi JV. CD8+ T-
lymphocyte activation in HIV-1 disease reflects an aspect of pathogenesis distinct from
viral burden and immunodeficiency. J Acquir Immune Defic Syndr Hum Retrovirol.
1998;18:332-340.
51. Papagno L, Spina CA, Marchant A, et al. Immune Activation and CD8(+) T-Cell
Differentiation towards Senescence in HIV-1 Infection. PLoS Biol. 2004;2:E20.
52. Doisne JM, Urrutia A, Lacabaratz-Porret C, et al. CD8+ T cells specific for EBV,
cytomegalovirus, and influenza virus are activated during primary HIV infection. J
Immunol. 2004;173:2410-2418.
53. Zaunders JJ, Moutouh-de Parseval L, Kitada S, et al. Polyclonal proliferation and
apoptosis of CCR5+ T lymphocytes during primary human immunodeficiency virus type
1 infection: regulation by interleukin (IL)-2, IL-15, and Bcl-2. J Infect Dis.
2003;187:1735-1747.
For personal use only. by guest on May 30, 2013. bloodjournal.hematologylibrary.orgFrom

30
54. Zhang X, Brunner T, Carter L, et al. Unequal death in T helper cell (Th)1 and Th2
effectors: Th1, but not Th2, effectors undergo rapid Fas/FasL-mediated apoptosis. J Exp
Med. 1997;185:1837-1849.
55. Lenardo M, Chan KM, Hornung F, et al. Mature T lymphocyte apoptosis--
immune regulation in a dynamic and unpredictable antigenic environment. Annu Rev
Immunol. 1999;17:221-253.
56. Shevach EM. CD4+ CD25+ suppressor T cells: more questions than answers. Nat
Rev Immunol. 2002;2:389-400.
57. Dalton DK, Haynes L, Chu CQ, Swain SL, Wittmer S. Interferon gamma
eliminates responding CD4 T cells during mycobacterial infection by inducing apoptosis
of activated CD4 T cells. J Exp Med. 2000;192:117-122.
58. Badovinac VP, Tvinnereim AR, Harty JT. Regulation of antigen-specific CD8+ T
cell homeostasis by perforin and interferon-gamma. Science. 2000;290:1354-1358.
59. Qin S, Rottman JB, Myers P, et al. The chemokine receptors CXCR3 and CCR5
mark subsets of T cells associated with certain inflammatory reactions. J Clin Invest.
1998;101:746-754.
60. von Andrian UH, Mempel TR. Homing and cellular traffic in lymph nodes. Nat
Rev Immunol. 2003;3:867-878.
61. Masopust D, Lefrancois L. CD8 T-cell memory: the other half of the story.
Microbes Infect. 2003;5:221-226.
62. Brenchley JM, Schacker TW, Ruff LE, et al. CD4+ T cell depletion during all
stages of HIV disease occurs predominantly in the gastrointestinal tract. J Exp Med.
2004;200:749-759.
63. Mehandru S, Poles MA, Tenner-Racz K, et al. Primary HIV-1 infection is
associated with preferential depletion of CD4+ T lymphocytes from effector sites in the
gastrointestinal tract. J Exp Med. 2004;200:761-770.
64. Krzysiek R, Rudent A, Bouchet-Delbos L, et al. Preferential and persistent
depletion of CCR5+ T-helper lymphocytes with nonlymphoid homing potential despite
early treatment of primary HIV infection. Blood. 2001;98:3169-3171.
For personal use only. by guest on May 30, 2013. bloodjournal.hematologylibrary.orgFrom

31
65. Oxenius A, Zinkernagel RM, Hengartner H. Comparison of activation versus
induction of unresponsiveness of virus-specific CD4+ and CD8+ T cells upon acute
versus persistent viral infection. Immunity. 1998;9:449-457.
66. Tanchot C, Barber DL, Chiodetti L, Schwartz RH. Adaptive tolerance of CD4+ T
cells in vivo: multiple thresholds in response to a constant level of antigen presentation. J
Immunol. 2001;167:2030-2039.
67. Schacker T, Little S, Connick E, et al. Rapid accumulation of human
immunodeficiency virus (HIV) in lymphatic tissue reservoirs during acute and early HIV
infection: implications for timing of antiretroviral therapy. J Infect Dis. 2000;181:354-
357.
68. Ostrowski MA, Gu JX, Kovacs C, Freedman J, Luscher MA, MacDonald KS.
Quantitative and qualitative assessment of human immunodeficiency virus type 1 (HIV-
1)-specific CD4+ T cell immunity to gag in HIV-1-infected individuals with differential
disease progression: reciprocal interferon-gamma and interleukin-10 responses. J Infect
Dis. 2001;184:1268-1278.
69. Aandahl EM, Michaelsson J, Moretto WJ, Hecht FM, Nixon DF. Human CD4+
CD25+ regulatory T cells control T-cell responses to human immunodeficiency virus and
cytomegalovirus antigens. J Virol. 2004;78:2454-2459.
70. Suni MA, Ghanekar SA, Houck DW, et al. CD4(+)CD8(dim) T lymphocytes
exhibit enhanced cytokine expression, proliferation and cytotoxic activity in response to
HCMV and HIV-1 antigens. Eur J Immunol. 2001;31:2512-2520.
71. Oxenius A, Bachmann MF, Mathis D, Benoist C, Zinkernagel RM, Hengartner H.
Functional in vivo MHC class II loading by endogenously synthesized glycoprotein
during viral infection. J Immunol. 1997;158:5717-5726.
72. Jellison ER, Kim SK, Welsh RM. Cutting Edge: MHC Class II-Restricted Killing
In Vivo during Viral Infection. J Immunol. 2005;174:614-618.
73. Marrack P, Kappler J. Control of T Cell Viability. Annu Rev Immunol.
2004;22:765-787.
74. Kanai T, Thomas EK, Yasutomi Y, Letvin NL. IL-15 stimulates the expansion of
AIDS virus-specific CTL. J Immunol. 1996;157:3681-3687.
For personal use only. by guest on May 30, 2013. bloodjournal.hematologylibrary.orgFrom

32
75. Patki AH, Quinones-Mateu ME, Dorazio D, et al. Activation of antigen-induced
lymphocyte proliferation by interleukin-15 without the mitogenic effect of interleukin-2
that may induce human immunodeficiency virus-1 expression. J Clin Invest.
1996;98:616-621.
76. Clerici M, Lucey DR, Berzofsky JA, et al. Restoration of HIV-specific cell-
mediated immune responses by interleukin-12 in vitro. Science. 1993;262:1721-1724.
77. Perera LP, Goldman CK, Waldmann TA. IL-15 induces the expression of
chemokines and their receptors in T lymphocytes. J Immunol. 1999;162:2606-2612.
78. Iwasaki M, Mukai T, Gao P, et al. A critical role for IL-12 in CCR5 induction on
T cell receptor- triggered mouse CD4(+) and CD8(+) T cells. Eur J Immunol.
2001;31:2411-2420.
79. de Oliveira Pinto LM, Garcia S, Lecoeur H, Rapp C, Gougeon ML. Increased
sensitivity of T lymphocytes to tumor necrosis factor receptor 1 (TNFR1)- and TNFR2-
mediated apoptosis in HIV infection: relation to expression of Bcl-2 and active caspase-8
and caspase-3. Blood. 2002;99:1666-1675.
80. Kinter AL, Ostrowski M, Goletti D, et al. HIV replication in CD4+ T cells of
HIV-infected individuals is regulated by a balance between the viral suppressive effects
of endogenous beta-chemokines and the viral inductive effects of other endogenous
cytokines. Proc Natl Acad Sci U S A. 1996;93:14076-14081.
81. Li J, Huston G, Swain SL. IL-7 promotes the transition of CD4 effectors to
persistent memory cells. J Exp Med. 2003;198:1807-1815.
82. Lori F, Jessen H, Lieberman J, et al. Treatment of human immunodeficiency virus
infection with hydroxyurea, didanosine, and a protease inhibitor before seroconversion is
associated with normalized immune parameters and limited viral reservoir. J Infect Dis.
1999;180:1827-1832.
83. Rizzardi GP, Harari A, Capiluppi B, et al. Treatment of primary HIV-1 infection
with cyclosporin A coupled with highly active antiretroviral therapy. J Clin Invest.
2002;109:681-688.
For personal use only. by guest on May 30, 2013. bloodjournal.hematologylibrary.orgFrom

33
Table 1 - Demographics of Primary HIV-1 Infection (PHI) Subjects
Early PHI
N = 19
Late PHI
N = 14
Age (years) 38 a
(33 – 43)b
35
(30 – 39)
Time since onset of
symptoms (days)
15
(11 - 16)
42
(32 - 76)
Symptom count 5
(3 – 7)
4
(1 – 7)
Western Blot intensity score 1
(0 - 3)
13
(12 - 20)
CD4 count
(cells / µl)
396
(239 - 554)
608
(566 -684)
Plasma HIV RNA
(log10 copies / ml)
5.9
(5.5 – 6.7)
4.5
(3.5 – 4.9)
Time from diagnostic visit
to study sample (days)
7
(0 – 11)
12
(8 – 25)
a Median
b Interquartile range
For personal use only. by guest on May 30, 2013. bloodjournal.hematologylibrary.orgFrom
34
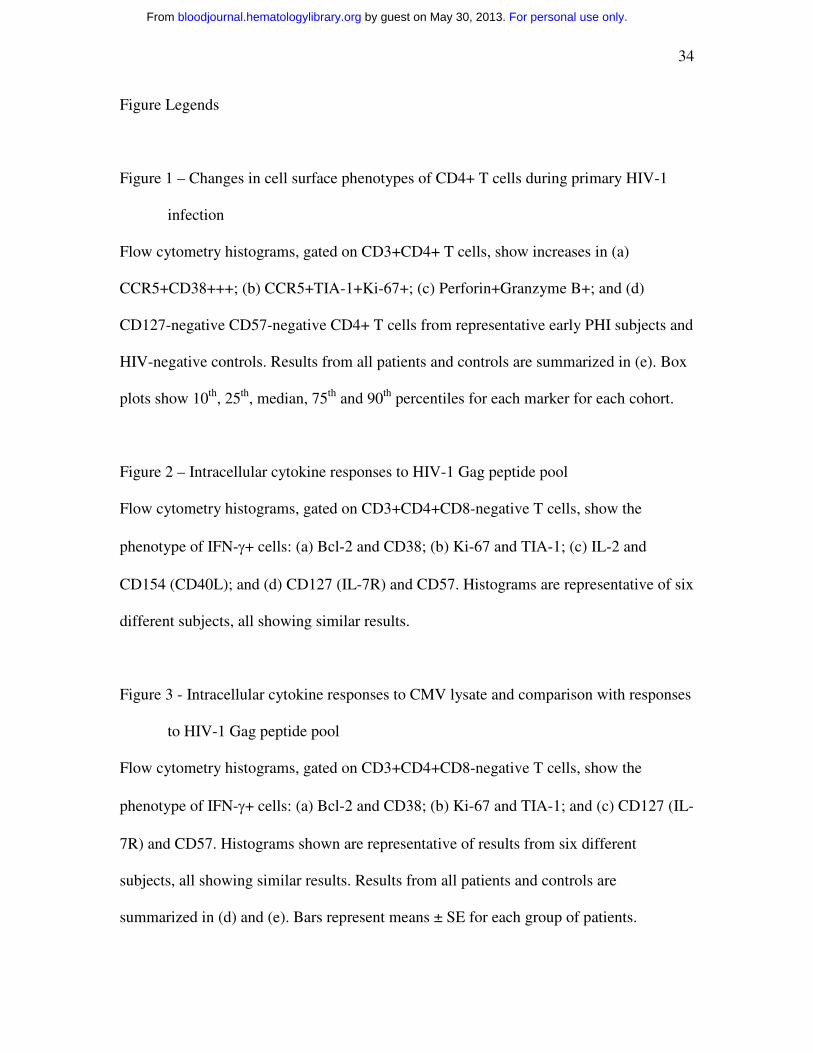
Figure Legends
Figure 1 – Changes in cell surface phenotypes of CD4+ T cells during primary HIV-1
infection
Flow cytometry histograms, gated on CD3+CD4+ T cells, show increases in (a)
CCR5+CD38+++; (b) CCR5+TIA-1+Ki-67+; (c) Perforin+Granzyme B+; and (d)
CD127-negative CD57-negative CD4+ T cells from representative early PHI subjects and
HIV-negative controls. Results from all patients and controls are summarized in (e). Box
plots show 10th, 25th, median, 75th and 90th percentiles for each marker for each cohort.
Figure 2 – Intracellular cytokine responses to HIV-1 Gag peptide pool
Flow cytometry histograms, gated on CD3+CD4+CD8-negative T cells, show the
phenotype of IFN-γ+ cells: (a) Bcl-2 and CD38; (b) Ki-67 and TIA-1; (c) IL-2 and
CD154 (CD40L); and (d) CD127 (IL-7R) and CD57. Histograms are representative of six
different subjects, all showing similar results.
Figure 3 - Intracellular cytokine responses to CMV lysate and comparison with responses
to HIV-1 Gag peptide pool
Flow cytometry histograms, gated on CD3+CD4+CD8-negative T cells, show the
phenotype of IFN-γ+ cells: (a) Bcl-2 and CD38; (b) Ki-67 and TIA-1; and (c) CD127 (IL-
7R) and CD57. Histograms shown are representative of results from six different
subjects, all showing similar results. Results from all patients and controls are
summarized in (d) and (e). Bars represent means ± SE for each group of patients.
For personal use only. by guest on May 30, 2013. bloodjournal.hematologylibrary.orgFrom

35
Figure 4 – Relationship of Gag-specific CD4+ T cells to time since infection, subset
changes and viral load
(a) Comparison of levels of Gag-specific CD4+ T cells in early versus late PHI subjects.
Box plots show 10th, 25th, median, 75th and 90th percentiles for each cohort.
(b) Plot of CCR5+CD38+++ CD4+ T cells in all PHI subjects versus time since onset of
symptoms. The regression line is a Lowess curve.
(c) Correlation of Gag-specific CD4+ T cells with proportion of CCR5+CD38+++ CD4+
T cells in all PHI subjects.
(d) Plot of CCR5+CD38+++ CD4+ T cells in all PHI subjects versus plasma HIV-1 RNA
viral load. The linear regression curve is shown.
Figure 5 – Cell surface expression of chemokine and cytokine receptors on
CCR5+CD38+++ CD4+ T cells.
(a) Expression of IL-12Rß1 and CXCR3 on CCR5+CD38+++ CD4+ T cells (upper
histograms) versus expression on all other CD4+ T cells (lower histograms).
(b) Expression of IL-2Rß (CD122) and TNFR2 (CD120b) on CCR5+CD38+++ CD4+ T
cells (upper histograms) versus expression on all other CD4+ T cells (lower
histograms).
(c) Expression of CCR7 and IL-7R (CD127) on CCR5+CD38+++ CD4+ T cells (upper
histograms) versus expression on all other CD4+ T cells (lower histograms).
For personal use only. by guest on May 30, 2013. bloodjournal.hematologylibrary.orgFrom

36
Histograms shown are representative of results from at least three different subjects, all
showing similar results.
For personal use only. by guest on May 30, 2013. bloodjournal.hematologylibrary.orgFrom

37
Figure 1C
D38
-PE
CCR5-APCCCR5-APC
CONTROL CD3+CD4+ PHI CD3+CD4+
0.45% 16.9%
A
TIA
-1-P
E
CCR5-APC
CONTROL CD3+CD4+Ki-67+
CCR5-APC
PHI CD3+CD4+Ki-67+
61%11.2%
B
Perforin-FITC
Gra
nzy
me
B -
AP
C
Perforin-FITC
3.8% 10.1%
CONTROL CD3+CD4+ PHI CD3+CD4+C
CD57-FITC
IL-7
R (
CD
127)
- P
E
CD57-FITC
93.2% 81.8%
CONTROL CD3+CD4+ PHI CD3+CD4+
0.8%
4.5%
1.5%
0.4%
16.0%
0.4%
D
% o
f C
D4+
T c
ells
HIV-negative controls N = 13
Late PHI N = 14
Early PHI N = 16
CCR5+ CD38+++
CCR5+ TIA+ Ki-67+
Granzyme B+ Perforin+
CD127- CD57-
0
5
10
15
20E
For personal use only. by guest on May 30, 2013. bloodjournal.hematologylibrary.orgFrom
38
Figure 2
IFN
-g -
AP
C
Bcl-2 - FITC CD38 - PE
PHI CD3+CD4+CD8- + Gag PHI CD3+CD4+CD8- + Gag
1.5% 0.5% 0.3% 1.7%
A
IFN
-g -
AP
C
Ki-67 - FITC TIA / GMP-17 - PE
PHI CD3+CD4+CD8- + Gag PHI CD3+CD4+CD8- + Gag
0.4% 1.6% 0.7% 1.3%
B
PHI CD3+CD4+CD8- + Gag
IL-2 - FITC
1.3% 0.9%
PHI CD3+CD4+CD8- + Gag
CD40L - FITC
0.2% 0.4%
IFN
-g -
AP
C
C
IFN
-g -
AP
C
CD57-FITCIL-7R (CD127) - PE
PHI CD3+CD4+CD8- + Gag PHI CD3+CD4+CD8- + Gag
1.2% 0.2% 1.4% 0.1%
D
For personal use only. by guest on May 30, 2013. bloodjournal.hematologylibrary.orgFrom

39
Figure 3
IFN
-g-A
PC
Bcl-2 - FITC
PHI CD3+CD4+CD8- + CMV PHI CD3+CD4+CD8- + CMV
CD38 - PE
0.1% 1.3% 1.3% 0.1%
A
IFN
-g-A
PC
Ki-67 - FITC
PHI CD3+CD4+CD8- + CMV
1.4% 0%
TIA / GMP-17 - PE
PHI CD3+CD4+CD8- + CMV
0% 1.4%
B
IFN
-g-A
PC
CD57-FITCIL-7R (CD127) - PE
PHI CD3+CD4+CD8- + CMV PHI CD3+CD4+CD8- + CMV
1.1% 0.1% 0.1% 1.1%
C
0
20
40
60
80
100
CD38 high
Ki-67+ CD127+ CD57+IL-2+TIA-1+Bcl-2 low
CD40L+
%o
fCM
VIF
N+
CD
4+
HIV-negative controls N = 5
Late PHI N = 6
Early PHI N = 6
%of
GA
GIF
N+
CD
4+
0
20
40
60
80
100
CD38 high
Ki-67+ CD127+ CD57+IL-2+TIA-1+Bcl-2 low
CD40L+
D
E
For personal use only. by guest on May 30, 2013. bloodjournal.hematologylibrary.orgFrom

40
Figure 4
0
.5
1
1.5
2
GA
G IF
N+
% o
f C
D4+
Late PHI N = 7
Early PHI N = 7
AL
og
Vir
al L
oad
CCR5+CD38+++% OF CD4
D
GA
G IF
N+
% o
f C
D4+
CCR5+CD38+++% OF CD4
1.2
1.6
0
.4
.8
2
0 5 10 15 20
rho = 0.76 p = 0.004
CC
R5+
CD
38++
+% O
F C
D4
Days since onset of symptoms
0
4
8
12
16
0 20 40 60 80 100 120 140
B C
2
3
4
5
6
7
0 4 8 12 16
rho = 0.63 p = 0.003
For personal use only. by guest on May 30, 2013. bloodjournal.hematologylibrary.orgFrom

41
Figure 5a
Figure 5b
Figure 5c
IL-12Rß1 - PE
CCR5+CD38+++ CD4+
Total CD4+
CXCR3 - PE
CCR5+CD38+++ CD4+
Total CD4+
84%
30%
85%
35%
TNFR2 (CD120b) - PE
CCR5+CD38+++ CD4+
Total CD4+
IL-2Rß (CD122) - PE
CCR5+CD38+++ CD4+
Total CD4+
CCR7- PE
CCR5+CD38+++ CD4+
Total CD4+
IL-7R (CD127) - PE
CCR5+CD38+++ CD4+
Total CD4+
34%
87%
For personal use only. by guest on May 30, 2013. bloodjournal.hematologylibrary.orgFrom

42
For personal use only. by guest on May 30, 2013. bloodjournal.hematologylibrary.orgFrom
Related Documents


![Journal of Falkenhagen et al, J Antivir Antiretrovir 213 ... · CCR5 gene via Zinc finger nucleases [4], cleavage of CCR5 mRNA by multimeric ribozymes [5], inhibition of CCR5 mRNA](https://static.cupdf.com/doc/110x72/5fd3f8f670db7b30b42beea9/journal-of-falkenhagen-et-al-j-antivir-antiretrovir-213-ccr5-gene-via-zinc.jpg)