EARLY POSTNATAL GROWTH OF THE SPOTTED DOLPHIN, STENELLA ATTENUATA, IN THE OFFSORE EASTERN TROPICAL PACIFIC ALETA A. HOHN! AND P. S. HAMMOND2 ABSTRACf Estimates of length at birth and early postnatal growth are made for the northern and southern popula· tions of the offshore spotted dolphin in the offshore eastern tropical Pacific. Length at birth is estimated to be 85.4 cm for the northern population and 83.2 em for the southern population. Analyses of series of monthly distributions of length revealed two cohorts born each year in the northern population, at least in the northern inshore part of its geographic range, but only one cohort born each year in the southern population. Growth curves fitted to the means of the monthly distributions of length gave estimates of length at 1 year of 126.2 and 132.6 cm and length at 2 years of 154.3 and 154.9 em for the two cohorts in the northern population. and length at 1 year of 127.9 cm for the southern population. A growth curve fitted to lengths and ages (in dental growth layer groups) from the northern population gave estimates of lengths at 1 and 2 years of 123.0 and 143.0 cm. respectively. The average growth rate of individual animals in a population is an important characteristic because of its correlation with other population parameters. In fisheries biology, two commonly employed techniques used to estimate growth rates are the aging of a sam- ple of fish of known length and the following of a series of length distriQutions through time These techniques allow the relationship between length and age (or relative age) to be applied to a much larger sample of fish, provided that the aged sample is a representative one. For most species of fish, length-age relationships may be appropriate for the entire life of the animals, or at least for the period of interest to a commer- cial fishery. In marine mammals, however, length changes little, if at all, after attainment of physical maturity. Growth rates may change markedly even while the animal is maturing, being high for an ini- tial period after birth and then declining quite rapid- ly. In delphinids, the growth rate has been found to be high in the first year, with animals typically in- creasing by 50-70% of their birth length (Sergeant 1962: Kasuya et al. 1974; Kasuya 1976; Miyazaki 1977; Hohn 1980; Perrin and Henderson 1984), but then declined rapidly in the second year. During this 'Southwest Fisheries Center La Jolla Laboratory, National Marine Fisheries Service, r-jOAA. P.O. Box 271. La Jolla. CA 92038. 'Inter·American 'Iropical Thna Commission. Scripps Institution of Oceanography. La Jolla. CA 92098; present address: Sea Mam· mal Research Unit. clo British Antartic Survey. Madingley Road. Cambridge CB3 OET, United Kingdom. Manuscript accepted DecembE'r 1984. FISHERY BULLETIN: VOL. 83. NO.4. 1985. period, growth rates are high relative to the varia- bility in age-at-Iength so that length distributions are distinguishable as separate age groups. Consequent- ly, length-age relationships for these animals are most useful from birth until about 2 yr. In this paper, we have used both the technique of following a series of length distributions from month to month and the technique of aging a sample of dolphins of known length to estimate the rate of growth in the spotted dolphin, Stenella attenuata, in the offshore eastern tropical Pacific (hereafter referred to as the offshore spotted dolphin). In neither of these two techniques did we have an ab- solute measure of age Consequently, we have esti- mated length at birth independently and used this to fix time at birth. Growth curves were fitted to the length data by relative age and then length at birth was substituted in order to predict length-at- age THE SAMPLE The field data and specimens used in the follow- ing analyses were collected by National Marine Fisheries Service (NMFS) and Inter-American 'fropical Thna Commission (IATTC) scientific techni- cians aboard commerc.ial tuna purse seiners from 1968 to 1982. Procedures for collecting sample data and specimens have been described by Perrin et aI. (1976). In all the following analyses, the data have been stratified into northern and southern popula- 553

Welcome message from author
This document is posted to help you gain knowledge. Please leave a comment to let me know what you think about it! Share it to your friends and learn new things together.
Transcript
EARLY POSTNATAL GROWTH OF THE SPOTTED DOLPHIN, STENELLA ATTENUATA, IN
THE OFFSORE EASTERN TROPICAL PACIFIC
ALETA A. HOHN! AND P. S. HAMMOND2
ABSTRACf
Estimates of length at birth and early postnatal growth are made for the northern and southern popula· tions of the offshore spotted dolphin in the offshore eastern tropical Pacific. Length at birth is estimated to be 85.4 cm for the northern population and 83.2 em for the southern population. Analyses of series of monthly distributions of length revealed two cohorts born each year in the northern population, at least in the northern inshore part of its geographic range, but only one cohort born each year in the southern population. Growth curves fitted to the means of the monthly distributions of length gave estimates of length at 1 year of 126.2 and 132.6 cm and length at 2 years of 154.3 and 154.9 em for the two cohorts in the northern population. and length at 1 year of 127.9 cm for the southern population. A growth curve fitted to lengths and ages (in dental growth layer groups) from the northern population gave estimates of lengths at 1 and 2 years of 123.0 and 143.0 cm. respectively.
The average growth rate of individual animals in a population is an important characteristic because of its correlation with other population parameters. In fisheries biology, two commonly employed techniques used to estimate growth rates are the aging of a sample of fish of known length and the following of a series of length distriQutions through time These techniques allow the relationship between length and age (or relative age) to be applied to a much larger sample of fish, provided that the aged sample is a representative one.
For most species of fish, length-age relationships may be appropriate for the entire life of the animals, or at least for the period of interest to a commercial fishery. In marine mammals, however, length changes little, if at all, after attainment of physical maturity. Growth rates may change markedly even while the animal is maturing, being high for an initial period after birth and then declining quite rapidly. In delphinids, the growth rate has been found to be high in the first year, with animals typically increasing by 50-70% of their birth length (Sergeant 1962: Kasuya et al. 1974; Kasuya 1976; Miyazaki 1977; Hohn 1980; Perrin and Henderson 1984), but then declined rapidly in the second year. During this
'Southwest Fisheries Center La Jolla Laboratory, National Marine Fisheries Service, r-jOAA. P.O. Box 271. La Jolla. CA 92038.
'Inter·American 'Iropical Thna Commission. Scripps Institution of Oceanography. La Jolla. CA 92098; present address: Sea Mam· mal Research Unit. clo British Antartic Survey. Madingley Road. Cambridge CB3 OET, United Kingdom.
Manuscript accepted DecembE'r 1984. FISHERY BULLETIN: VOL. 83. NO.4. 1985.
period, growth rates are high relative to the variability in age-at-Iength so that length distributions are distinguishable as separate age groups. Consequently, length-age relationships for these animals are most useful from birth until about 2 yr.
In this paper, we have used both the technique of following a series of length distributions from month to month and the technique of aging a sample of dolphins of known length to estimate the rate of growth in the spotted dolphin, Stenella attenuata, in the offshore eastern tropical Pacific (hereafter referred to as the offshore spotted dolphin). In neither of these two techniques did we have an absolute measure of age Consequently, we have estimated length at birth independently and used this to fix time at birth. Growth curves were fitted to the length data by relative age and then length at birth was substituted in order to predict length-atage
THE SAMPLE
The field data and specimens used in the following analyses were collected by National Marine Fisheries Service (NMFS) and Inter-American 'fropical Thna Commission (IATTC) scientific technicians aboard commerc.ial tuna purse seiners from 1968 to 1982. Procedures for collecting sample data and specimens have been described by Perrin et aI. (1976). In all the following analyses, the data have been stratified into northern and southern popula-
553
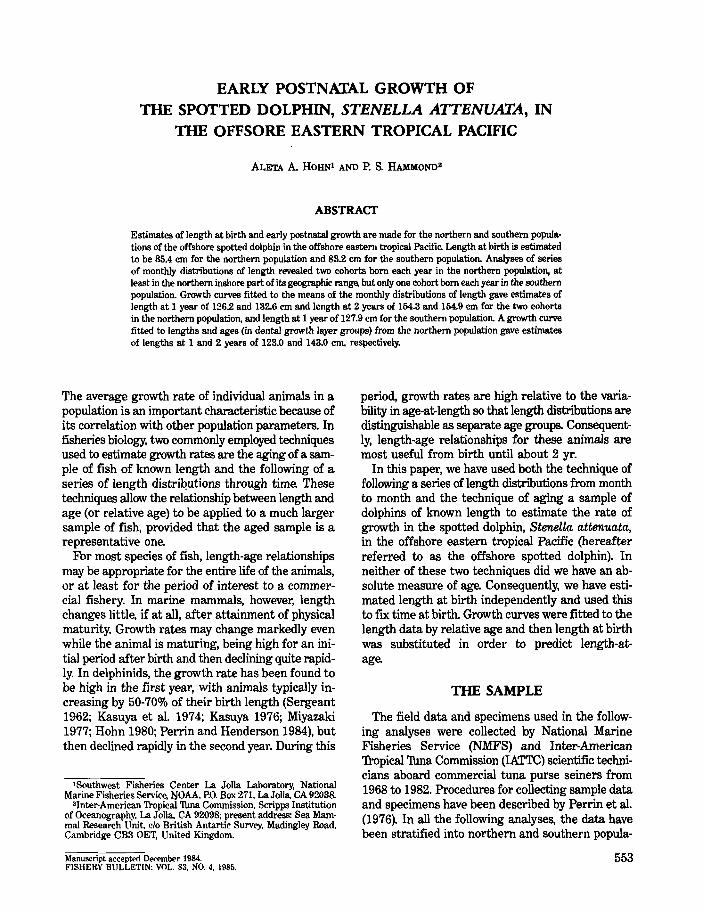
tions divided by lat. IDS, based on a division selected by Perrin et al. (1979). Areas 1 and 2 in Figure 1 correspond to the region occupied by the southern offshore spotted dolphin and areas 3-8 correspond to the region occupied by the northern offshore spotted dolphin.
ESTIMATION OF LENGTH AT BIRTH
An accurate estimate of length at birth is important because it establishes a point through which any growth curve should pass. This extra degree of freedom allows greater accuracy in fitting growth curves and estimating growth rates. Neither of our methods of relating length to age, described below, allows us to fix absolute age so it is essential here for us to calculate an independent estimate of length at birth.
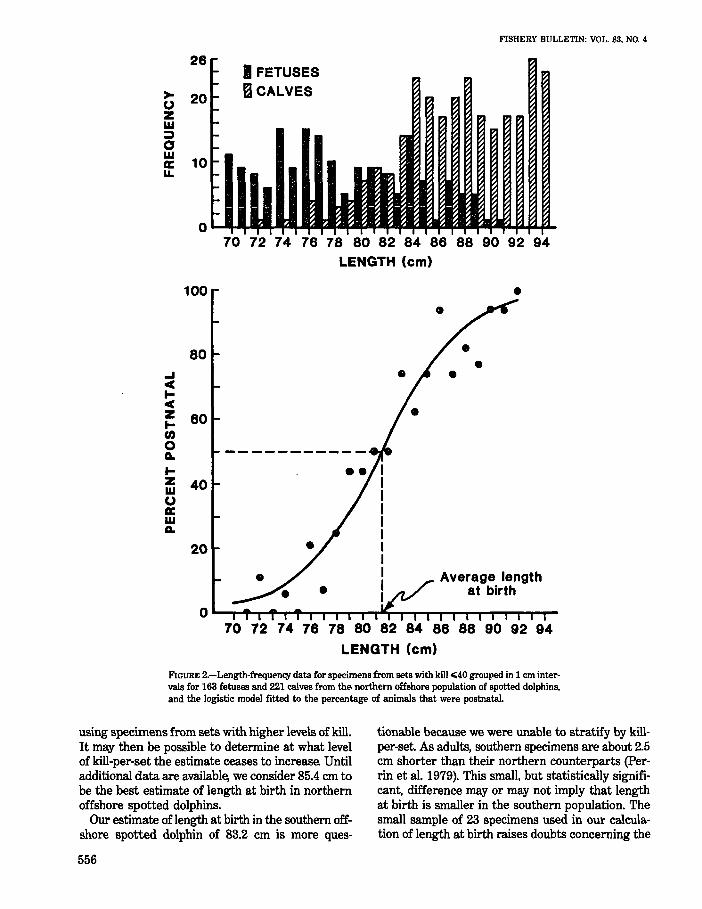
A commonly used method of estimating length at
]0
25
.... '\ 20 D
15
10
&
I. u
FISHERY BULLETIN: VOL. 83. NO.4
birth when a sufficient sample is available is to regress the percent postnatal at each length interval on length and to calculate the length at which 50% of the specimens are predicted to be postnatal. This method, using a linear model, has been employed to estimate length at birth for spotted dolphins (Perrin et al. 1976), for striped dolphins, S. coeruleoalba, (Miyazaki 1977), and for spinner dolphins, S. longirostris, (Perrin et aI. 1977), and using a nonlinear model for spinner dolphins (Perrin and Henderson 1984). Another method commonly employed when a small sample is available is to estimate the average length at birth as the mean length of known neonates or the mean length of fullterm fetuses and small calves combined. This method has been used to estimate length at birth for longfinned pilot whales (Sergeant 1962), for spotted dolphins (Kasuya et al. 1974), for bottlenose dolphins, Tursiops tru:ncatus, (Ross 1977; Hohn 1980), and for
SPOTTED DOLPHIN
].
25
2D
IS
&
ID
IS
FIGURE I.-Areas inhabited by the offshore spotted dolphin. The numbered regions refer to strata investigated in analyses of monthly distributions of length. In all analyses. the southern population is from areas 1 and 2, and the northern population is from areas 3 through 8.
554
HOHN and HAMMOND: POSTNATAL GROWTH OF SPOTTED DOLPHIN
the franciscana dolphin, Pontoporia blainvillei, (Kasuya and Brownell 1979).
Methods
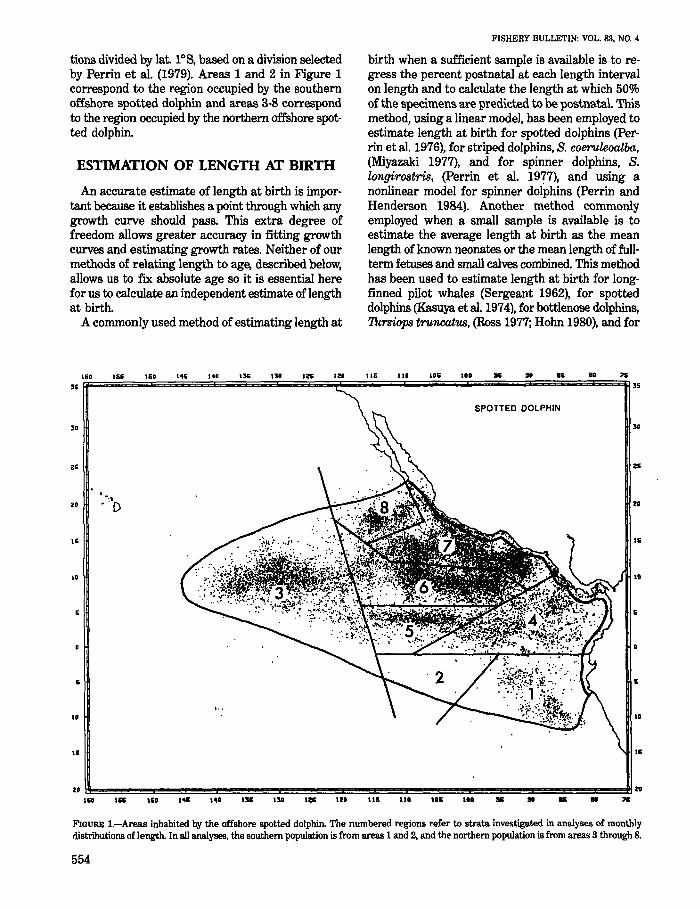
The data used in this analysis were from all fetuses and calves sampled between 1973 and 1981 except for three specimens <68 cm identified as calves and one specimen of 91 cm identified as a fetus (n = 609). These four specimens were judged to have been misidentified The data were stratified by area, north and south of lat. 10 S, and the northern sample was further stratified by the size of kill in each net set. Powers and Barlow (19793) have shown that in net sets in which the kill of spotted dolphins from the northern offshore regions was "40 (small-kill sets), about twice as many calves were killed as a proportion of the total kill as in sets where the kill was >40 (large-kill sets). This would introduce a bias in the estimate of length at birth in the regression procedure because about 900/0 of all northern specimens were from small-kill sets. The effect would be to underestimate length at birth because the ratio of calves to fetuses was too high in most of the sample. 1b investigate the extent of the bias, we calculated average length at birth for all northern specimens, for specimens from sets with kill "40 and >40, and for specimens from sets with kill "30 and >30 because the sample size for sets with kill >40 was small. The small sample available for southern specimens prevented any further stratification of the data.
Length at birth was estimated by fitting a logistic model to the percent postnatal at each length interval, weighted by the inverse of the binomial variance of each percentage, and estimated by calculating from the fitted curve the length at which 500/0 of the specimens were predicted to be postnatal. We also investigated linear and asymmetric logistic-type models.
Results
Figure 2 shows the length-frequency data for northern specimens from sets with kill "40, and the logistic model fitted to the data. Figure 3 is the equivalent for northern specimens from sets with kill >40. Table 1 gives the results for all stratifications described above using the logistic model. Using the linear or asymmetric logistic-type models did not
'Powers, J. E., and J. Barlow. 1979. Biases in the tuna·net sampling of dolphins in the eastern tropical Pacific. Doc. SOPS179/31, Status of Porpoise Stocks Workshop, La Jolla. CA, 27·31 August 1979. Unpubl. MS.
improve the fit and gave similar results. Thble 1 shows that the estimates of length at birth
for northern specimens using the unstratified data (82.0 cm) and using specimens from sets with kill "30 (81.6 cm) or "40 (81.6 cm) are lower than the estimates using specimens from sets with kill >30 (84.6 cm) or >40 (85.4 cm), demonstrating that the bias resulting from an overrepresentation of calves in small-kill sets is significant. Furthermore, the estimate for kill >40 is higher than that for kill >30, indicated that the proportion of calves in the sample may still be a function of kill-per-set at this level. Further stratification to investigate whether or not estimates of length at birth continue to rise at higher thresholds of kill-per-set was not possible because of small sample size.
The estimate of length at birth for southern specimens is 83.2 cm. No stratification was possible because of the small sample.
Estimates of standard deviations of the estimates of length at birth are not given because, in fitting the logistic model, sums of squares were minimized for differences between observed and predicted percent postnatal and it was unclear how to calculate the standard deviations.
TABLE 1.-Estimates of length at birth stratified by number of offshore spotted dolphins killed per set. The range of length classes includes the last 0% postnatal length class and the first 100% postnatal length class.
Length at birth predicted from the
Sample Range logistic model size (cm) (cm)
Northern offshore spotted dolphin Unstratified data 586 71-92 82.0 Sets with kill <;30 321 73-92 81.6 Sets with kill <;40 384 71-92 81.6 Sets with kill >30 105 71-89 84.6 Sets with kill >40 36 78-89 85.4
Southern offshore spotted dolphin Unstratified data 23 78-85 83.2
Discussion
Our estimate of length at birth of 82.0 cm from the unstratified northern data is similar to that of Perrin et al. (1976), who estimated length at birth at 82.5 cm, based on a sample of 73 northern specimens (calves and fetuses) grouped into 3 cm intervals from 74 to 92 cm.
Estimates of length at birth in large-kill sets are less biased because of the overrepresentation of calves in small-kill sets. A future larger sample from large-kill sets may allow for additional stratification by kill-per-set, enabling estimates to be calculated
555
26
>- 20 U z w =» a ~ 10 u.
0
I FETUSES B CALVES
FISHERY BULLETIN: VOL. 83. NO.4
70 72 74 76 78 80 82 84 86 88 90 92 94 LENGTH (em)
100 • •
80 • ... • c( ... c( z 60 ... (I)
0 Q. -----------... z 40 w U lie w A.
Average length at birth
0 70 72 74 76 78 80 82 84 86 88 90 92 94
LENGTH (em)
FIGURE 2.-Length-frequency data for specimens from sets with kiIl<40 grouped in 1 em intervals for 163 fetuses and 221 calves from the northern offshore population of spotted dolphins. and the logistic model fitted to the percentage of animals that were postnatal.
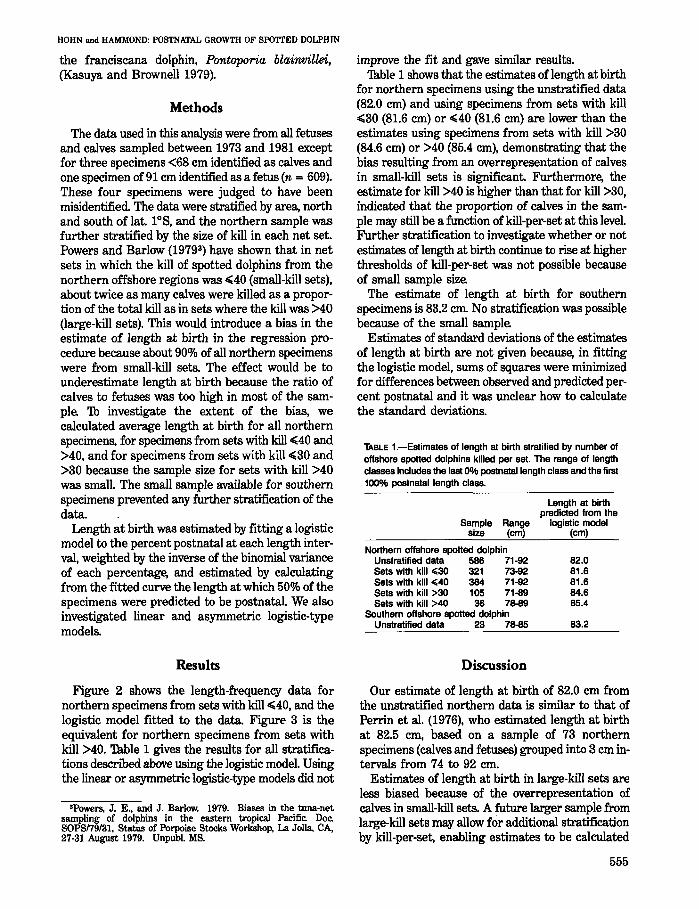
using specimens from sets with higher levels of kill. It may then be possible to determine at what level of kill-per-set the estimate ceases to increase. Until additional data are available, we consider 85.4 em to be the best estimate of length at birth in northern offshore spotted dolphins.
Our estimate of length at birth in the southern offshore spotted dolphin of 83.2 cm is more ques-
556
tionable because we were unable to stratify by killper-set As adults, southern specimens are about 2.5 em shorter than their northern counterparts (Perrin et al. 1979). This small, but statistically significant, difference mayor may not imply that length at birth is smaller in the southern population. The small sample of 23 specimens used in our calculation of length at birth raises doubts concerning the
HOHN and HAMMOND: POSTNATAL GROWTH OF SP<Yl'TED DOLPHIN
>U Z W ::)
12
8
I FETUSES f::I CALVES
a w a:: u.
4
o~~~~~~~~~~~~~~~~~~~~
70 72 74 76 78 80 82 84 86 88 90 92 94 96 LENGTH (em)
....I c( ....
100
80
~ 60 .... m
e e
o -------------e- e a..
~ 40 w (,) . a:: w a..
20
Average length at birth
70 72 74 76 78 80 82 84 86 88 90 92 94 96 LENGTH (em)
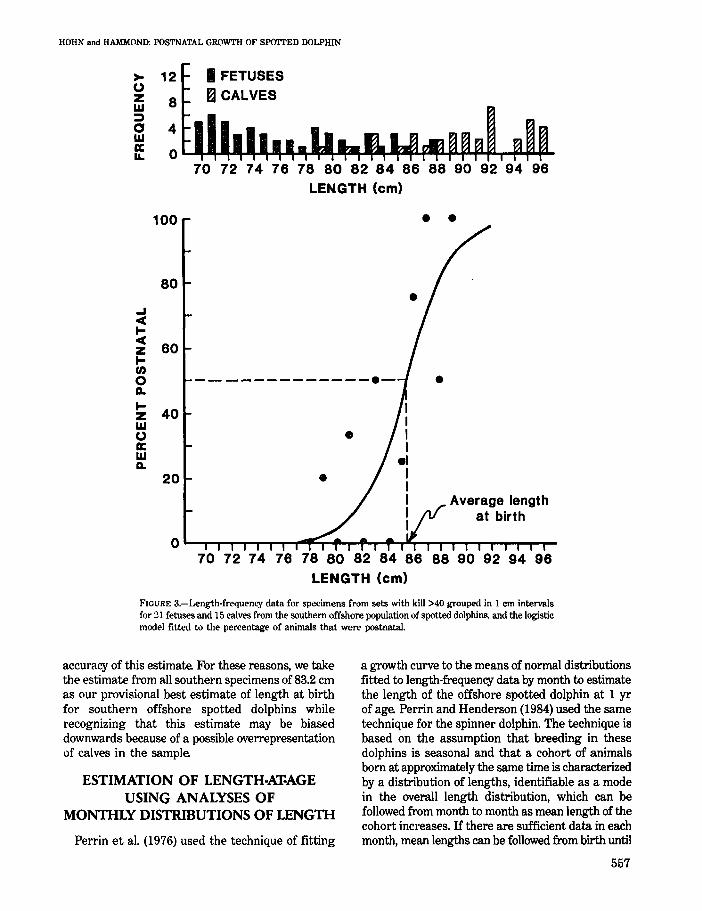
FIGURE 3.-Length·frequency data for specimens from sets with kill >40 grouped in 1 cm intervals for ~1 fetuses and 15 calves from the southern offshore population of spotted dolphins. and the logistic model fitted to the percentage of animals that were postnataL
accuracy of this estimate. For these reasons, we take the estimate from all southern specimens of 83.2 cm as our provisional best estimate of length at birth for southern offshore spotted dolphins while recognizing that this estimate may be biased downwards because of a possible overrepresentation of calves in the sample
ESTIMATION OF LENGTH·AT-AGE USING ANALYSES OF
MONTHLY DISTRIBUTIONS OF LENGTH
Perrin et al. (1976) used the technique of fitting
a growth curve to the means of normal distributions fitted to length-frequency data by month to estimate the length of the offshore spotted dolphin at 1 yr of age Perrin and Henderson (1984) used the same technique for the spinner dolphin. The technique is based on the assumption that breeding in these dolphins is seasonal and that a cohort of animals born at approximately the same time is characterized by a distribution of lengths, identifiable as a mode in the overall length distribution, which can be followed from month to month as mean length of the cohort increases. If there are sufficient data in each month, mean lengths can be followed from birth until
557
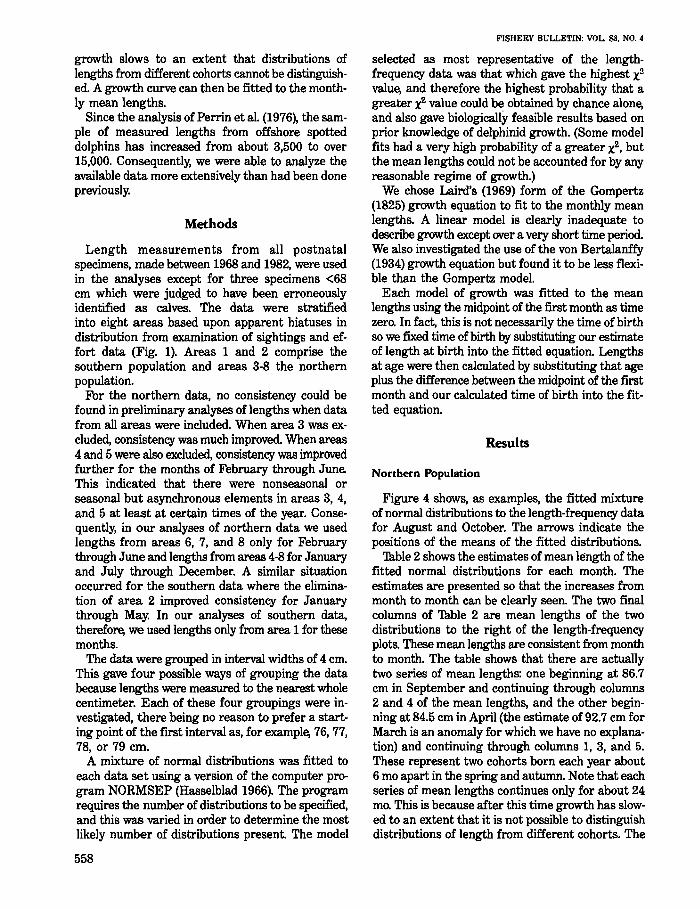
growth slows to an extent that distributions of lengths from different cohorts cannot be distinguished. A growth curve can then be fitted to the monthly mean lengths.
Since the analysis of Perrin et al. (1976), the sample of measured lengths from offshore spotted dolphins has increased from about 3,500 to over 15,000. Consequently, we were able to analyze the available data more extensively than had been done previously.
Methods
Length measurements from all postnatal specimens, made between 1968 and 1982, were used in the analyses except for three specimens <68 cm which were judged to have been erroneously identified as calves. The data were stratified into eight areas based upon apparent hiatuses in distribution from examination of sightings and effort data (Fig. 1). Areas 1 and 2 comprise the southern population and areas 3-8 the northern population.
For the northern data, no consistency could be found in preliminary analyses of lengths when data from all areas were included. When area 3 was excluded, consistency was much improved. When areas 4 and 5 were also excluded, consistency was improved further for the months of February through June. This indicated that there were nonseasonal or seasonal but asynchronous elements in areas 3, 4, and 5 at least at certain times of the year. Consequently, in our analyses of northern data we used lengths from areas 6, 7, and 8 only for February through June and lengths from areas 4-8 for January and July through December. A similar situation occurred for the southern data where the elimination of area 2 improved consistency for January through May. In our analyses of southern data, therefore, we used lengths only from area 1 for these months.
The data were grouped in interval widths of 4 cm. This gave four possible ways of grouping the data because lengths were measured to the nearest whole centimeter. Each of these four groupings were investigated, there being no reason to prefer a starting point of the first interval as, for example, 76, 77, 78, or 79 cm.
A mixture of normal distributions was fitted to each data set using a version of the computer program NORMSEP (Hasselblad 1966). The program requires the number of distributions to be specified, and this was varied in order to determine the most likely number of distributions present. The model
558
FISHERY BULLETIN: VOL. S3. NO.4
selected as most representative of the lengthfrequency data was that which gave the highest x.2
value, and therefore the highest probability that a greater x.2 value could be obtained by chance alone, and also gave biologically feasible results based on prior knowledge of delphinid growth. (Some model fits had a very high probability of a greater x.2, but the mean lengths could not be accounted for by any reasonable regime of growth.)
We chose Laird's (1969) form of the Gompertz (1825) growth equation to fit to the monthly mean lengths. A linear model is clearly inadequate to describe growth except over a very short time period. We also investigated the use of the von Bertalanffy (1934) growth equation but found it to be less flexible than the Gompertz model.
Each model of growth was fitted to the mean lengths using the midpoint of the first month as time zero. In fact, this is not necessarily the time of birth so we fixed time of birth by substituting our estimate of length at birth into the fitted equation. Lengths at age were then calculated by substituting that age plus the difference between the midpoint of the first month and our calculated time of birth into the fitted equation.
Results
Northern Population
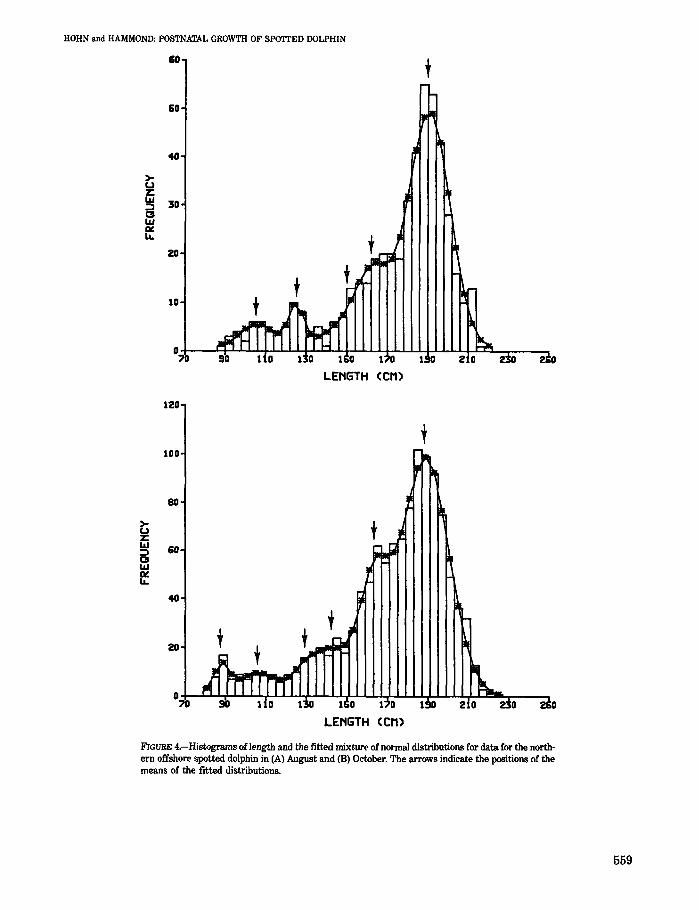
Figure 4 shows, as examples, the fitted mixture of normal distributions to the length-frequency data for August and October. The arrows indicate the positions of the means of the fitted distributions.
Thble 2 shows the estimates of mean length of the fitted normal distributions for each month. The estimates are presented so that the increases from month to month can be clearly seen. The two final columns of Thble 2 are mean lengths of the two distributions to the right of the length-frequency plots. These mean lengths are consistent from month to month. The table shows that there are actually two series of mean lengths: one beginning at 86.7 cm in September and continuing through columns 2 and 4 of the mean lengths, and the other beginning at 84.5 cm in April (the estimate of 92.7 cm for March is an anomaly for which we have no explanation) and continuing through columns 1, 3, and 5. These represent two cohorts born each year about 6 mo apart in the spring and autumn. Note that each series of mean lengths continues only for about 24 mo. This is because after this time growth has slowed to an extent that it is not possible to distinguish distributions of length from different cohorts. The
HOHN and HAMMOND: POSTNATAL GROWTH OF SI>(YITED DOLPHIN
60
60
40
20
120
100
80
~ z: ~ 60 CJ w a: L&.
40
t
t
1 0 1 0
LENGTH (eM)
t
FIGURE 4.-Histograms of length and the fitted mixture of normal distributions for data for the north· ern offshore spotted dolphin in (A) August and (8) October. The arrows indicate the positions of the means of the fitted distributions.
559
FISHERY BULLETIN: VOL. 83. NO.4
mean length of 105.9 cm for June was not included in further analyses because its inclusion more than doubled the residual sums of squares for the model fit. We consider it an outlier.
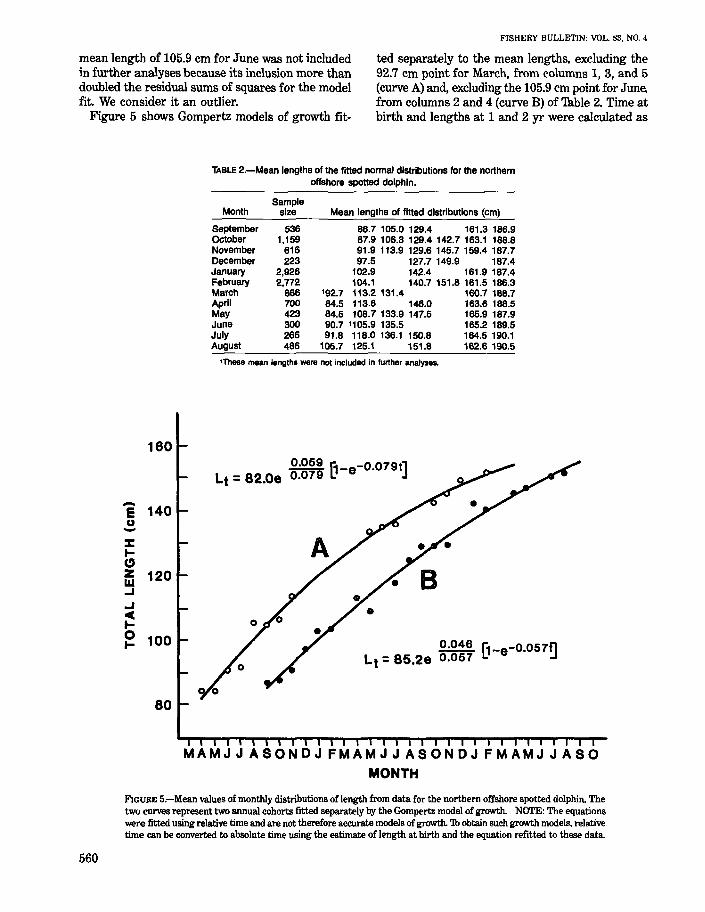
ted separately to the mean lengths. excluding the 92.7 cm point for March. from columns 1, 3, and 5 (curve A) and, excluding the 105.9 em point for June, from columns 2 and 4 (curve B) of Thble 2. Time at birth and lengths at 1 and 2 yr were calculated as Figure 5 shows Gompertz models of growth fit-
560
160
-e 140 u -::c tO z 120 w ... ... II( t-e 100
80
TABLE 2.-Mean lengths of the fitted normal distributions for the northern offshore spotted dolphin.
Month
September Oc;tober November December January February March April May June July August
Sample size
536 1.159
616 223
2,926 2.772
866 700 423 300 266 486
Mean lengths of fitted distributions (cm)
86.7 105.0 129.4 161.3 186.9 87.9 106.3 129.4 142.7 163.1 188.8 91.9 113.9 129.6 145.7 159.4 187.7 97.5 127.7 149.9 187.4
102.9 142.4 161.9 187.4 104.1 140.7 151.8 161.5 186.3
'92.7 113.2 131.4 160.7 188.7 84.5 113.6 146.0 163.6 188.5 84.5 108.7 133.9 147.5 165.9 187.9 90.7 ' 1 05.9 135.5 165.2 189.5 91.8 118.0 136.1 150.8 164.5 190.1
105.7 125.1 151.8 162.6 190.5
'These mean lengths were not included in further analyses.
~ '1-e-0.079t] Lt = 82.0e 0.079 ~
Lt = 85.2e ~:~:~ B-e-0.057~
MAMJJASONDJFMAMJJASONDJFMAMJJASO MONTH
FIGURE 5.-Mean values of monthly distributions of length from data for the northern offshore spotted dolphin. The two curves represent two annual cohorts fitted separately by the Gompertz model of growth. NCYI'E: The equations were fitted using relative time and are not therefore accurate models of growth. 1b obtain such growth models. relative time can be converted to absolute time using the estimate of length at birth and the equation refitted to these data.
HOHN and HAMMOND: POSTNATAL GROWTH OF SPOTTED DOLPHIN
described above with the following results:
Fixed length at birth (estimated in this paper)
Estimated time of birth Estimated length at 1 yr Estimated length at 2 yr
GrO'l.l..th. curve A
85.4 em May 9 132.6 em 154.9 em
Growth curve B
85.4 em September 11 126.2 em 154.3 em
Rates of growth as centimeters per month for the two fitted curves adjusted for length at birth are as follows:
Rate oj" growth
Mon.ths after bi-,·th CWl"'I)eA CUr1)e B
0 5.03 3.80 6 3.94 3.43
12 2.76 2.89 18 1.81 2.33 24 1.14 1.82
Southern Population
Table 3 shows the estimates of mean length of the fitted normal distributions for each month. For these data it is clear, apart from the mean lengths of 105,0 cm in January and 127.5 cm in May, that there is only one cohort born each year in the southern summer. As a result of this and the much smaller sample sizes, distributions of length could only be distinguished up to about 18 mo. The two final columns of Table 3 show the mean lengths of the two distributions to the right of the length-frequency plots. These are quite consistent from month to month, as with the northern data.
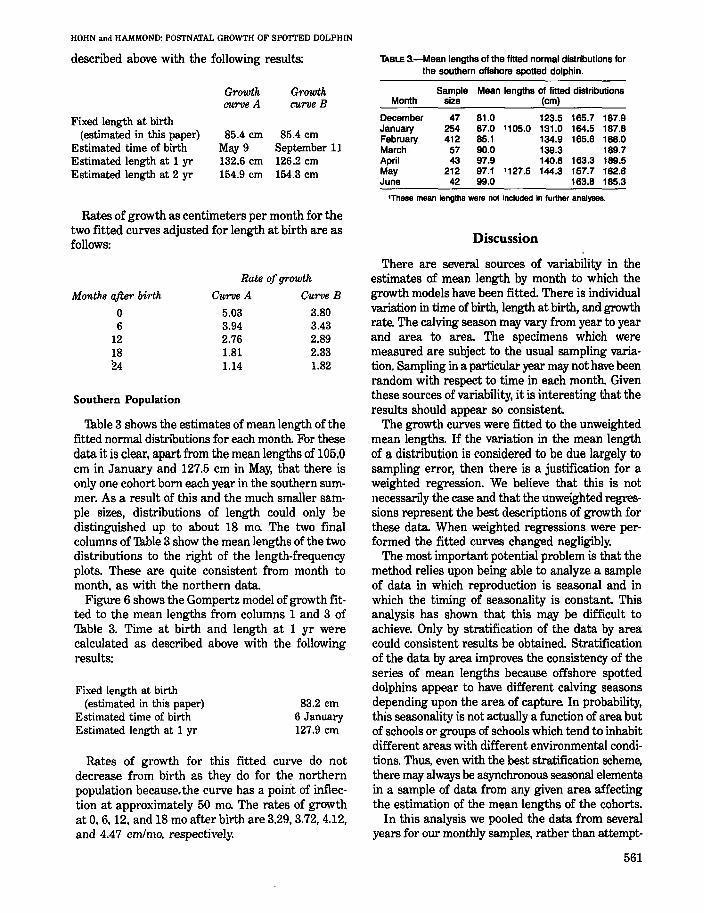
Figure 6 shows the Gompertz model of growth fitted to the mean lengths from columns 1 and 3 of Table 3. Time at birth and length at 1 yr were calculated as described above with the following results:
Fixed length at birth (estimated in this paper)
Estimated time of birth Estimated length at 1 yr
83.2 em 6 January 127.9 em
Rates of growth for this fitted curve do not decrease from birth 2.S they do for the northern population because. the curve has a point of inflection at approximately 50 mOo The rates of growth at 0,6, 12, and 18 mo after birth are 3.29,3.72,4.12, and 4.47 cm/mo, respectively.
TABLE 3.-Mean lengths of the fitted normal distributions for the southern offshore spotted dolphin.
Sample Mean lengths of fitted distributions Month size (cm)
December 47 81.0 123.5 165.7 187.9 January 254 87.0 '105.0 131.0 164.5 187.8 February 412 85.1 134.9 165.6 188.0 March 57 90.0 139.3 . 189.7 April 43 97.9 140.8 163.3 189.5 May 212 97.1 '127.5 144.3 157.7 182.6 June 42 99.0 163.8 185.3
'These mean lengths were not included in further analyses.
Discussion
There are several sources of variability in the estimates of mean length by month to which the growth models have been fitted. There is individual variation in time of birth, length at birth, and growth rate. The calving season may vary from year to year and area to area. The specimens which were measured are subject to the usual sampling variation. Sampling in a particular year mlW' not have been random with respect to time in each month. Given these sources of variability. it is interesting that the results should appear so consistent.
The growth curves were fitted to the unweighted mean lengths. If the variation in the mean length of a distribution is considered to be due largely to sampling error, then there is a justification for a weighted regression. We believe that this is not necessarily the case and that the unweighted regressions represent the best descriptions of growth for these data. When weighted regressions were performed the fitted curves changed negligibly.
The most important potential problem is that the method relies upon being able to analyze a sample of data in which reproduction is seasonal and in which the timing of seasonality is constant. This analysis has shown that this may be difficult to achieve. Only by stratification of the data by area could consistent results be obtained. Stratification of the data by area improves the consistency of the series of mean lengths because offshore spotted dolphins appear to have different calving seasons depending upon the area of capture. In probability, this seasonality is not actually a function of area but of schools or groups of schools which tend to inhabit different areas with different environmental conditions. Thus, even with the best stratification scheme, there may always be asynchronous seasonal elements in a sample of data from any given area affecting the estimation of the mean lengths of the cohorts.
In this analysis we pooled the data from several years for our monthly samples, rather than attempt-
561
FISHERY BULLETIN: VOL. 83. NO.4
160
~ f1-e-0.017t1 Lt = 81.0e 0.017 ~ J -E 140
u -:J: ... " ffi 120 -' ..... II( ... ~ 100
80
NDJFMAMJJASONDJFMAMJ MONTH
FIGURE 6.-Mean values of monthly distributions of length from data for the southern offshore spotted dolphin. The curve represents one annual cohort fitted by the Gompertz model of growth. The open circles were not included in the fitting of the curve. NOTE: The equations were fitted using relative time and are not therefore accurate models of growth. 'Th obtain such growth models, relative time can be converted to absolute time using the estimate of length at birth and the equation refitted to these data.
ing to follow actual cohorts of animals from in· dividual years as did Perrin et al. (1976) in their analyses. Combining the data from several years in· troduces additional variation in the data if the timing of the calving season varies from year to year, but it increases sample sizes and minimizes bias caused by nonrandom timing of sampling within months. In addition, we are mainly interested in an average growth rate which is best estimated from several years of data.
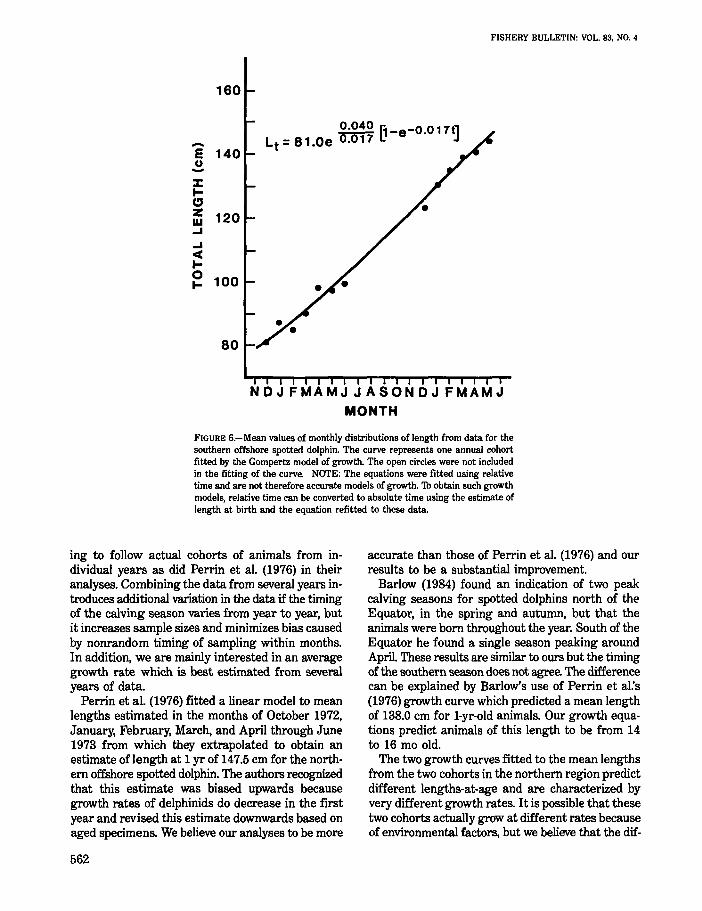
Perrin et al. (1976) fitted a linear model to mean lengths estimated in the months of October 1972, January, February, March, and April through June 1973 from which they extrapolated to obtain an estimate of length at 1 yr of 147.5 cm for the north· ern offshore spotted dolphin. The authors recognized that this estimate was biased upwards because growth rates of delphinids do decrease in the first year and revised this estimate downwards based on aged specimens. We believe our analyses to be more
562
accurate than those of Perrin et al. (1976) and our results to be a substantial improvement.
Barlow (1984) found an indication of two peak calving seasons for spotted dolphins north of the Equator, in the spring and autumn, but that the animals were born throughout the year. South of the Equator he found a single season peaking around April. These results are similar to ours but the timing of the southern season does not agree. The difference can be explained by Barlow's use of Perrin et al:s (1976) growth curve which predicted a mean length of 138.0 cm for l·yr·old animals. Our growth equa· tions predict animals of this length to be from 14 to 16 mo old.
The two growth curves fitted to the mean lengths from the two cohorts in the northern region predict different lengths·at·age and are characterized by very different growth rates. It is possible that these two cohorts actually grow at different rates because of environmental factors, but we believe that the dif-
HOHN and HAMMOND: POSTNATAL GROWTH OF SPlYI'TED DOLPHIN
ferences are more likely a result of variability in the data. We suggest, therefore, that the mean of the estimates from both growth curves be used for estimates of lengths-at-age for the northern offshore spotted dolphin.
For the southern population, the mean lengths of 105.0 and 127.5 cm for January and May, respectively, suggest that there may be two calving seasons in this area. At present, the sample size is too small to assess whether or not this is the case.
ESTIMATION OF LENGTH·AT-AGE USING
GROWTH·LAYER·GROUP (GLG) AGING
Increments of tissue are deposited in teeth as a function of time. The most important incremental pattern in odontocete teeth is comprised of growth layer groups (GLGs), defined as "a repeating or semirepeating pattern of adjacent group~ of incremental growth layers within the dentine, cementum, or bone which is defined as a countable unit" (Perrin and Myrick 1980, p. 48-49). These GLGs are used for age determination in many species of odontocetes, as well as pinnipeds and sirenians (see review by Scheffer and Myrick 1980), but in most species no calibration of GLGs with absolute time is available. However, a few known-age captive and minimum-known-age captive bottlenose dolphins (Sergeant 1959; Sergeant et al. 1973; Hui 1978) and captive .tetracycline-marked specimens of other species (Lagenorhynchus obscurus, Best 1976; Delphinus delphis, Gurevich et aI. 1980; S. longirostris, Myrick et aI. 1984) have provided evidence that the GLG as defined and calibrated by these workers represents an annual deposition pattern. In the absence of any known-age specimens of spotted dolphins, we have assumed that a GLG pattern similar to that described in the above species represents the same amount of time.
Methods
A sample of 800 males and 800 females, selected randomly from the specimens collected between 1973 and 1978, and all 312 female specimens collected in 1981 made up the sample of animals from which teeth were aged.
The teeth were decalcified in RD04, a commercial decalcifying agent, cut longitudinally into 24 ,.an thin sections using a freezing microtome, stained in
'Reference to trade names does not imply endorsement by the National Marine Fisheries Service, NOAA.
haematoxylin, and mounted in 100% glycerin. Detailed procedures for the preparation technique and interpretation of GLGs are described by Myrick et al. (1983).
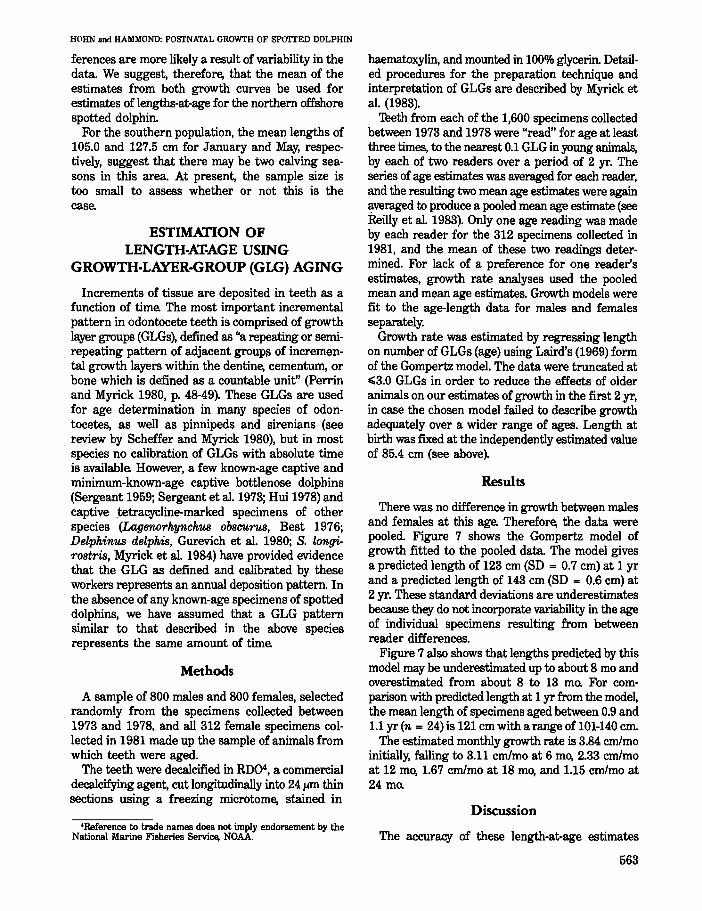
Theth from each of the 1,600 specimens collected between 1973 and 1978 were "read" for age at least three times, to the nearest 0.1 GLG in young animals, by each of two readers over a period of 2 yr. The series of age estimates was averaged for each reader, and the resulting two mean age estimates were again averaged to produce a pooled mean age estimate (see Reilly et aI. 1983). Only one age reading was made by each reader for the 312 specimens collected in 1981, and the mean of these two readings determined. For lack of a preference for one reader's estimates, growth rate analyses used the pooled mean and mean age estimates. Growth models were fit to the age-length data for males and females separately.
Growth rate was estimated by regressing length on number of GLGs (age) using Laird's (1969) form of the Gompertz model. The data were truncated at <103.0 GLGs in order to reduce the effects of older animals on our estimates of growth in the first 2 yr, in case the chosen model failed to describe growth adequately over a wider range of ages. Length at birth was fixed at the independently estimated value of 85.4 cm (see above).
Results
There was no difference in growth between males and females at this age. Therefore, the data were pooled. Figure 7 shows the Gompertz model of growth fitted to the pooled data. The model gives a predicted length of 123 cm (SD = 0.7 cm) at 1 yr and a predicted length of 143 cm (SD = 0.6 cm) at 2 yr. These standard deviations are underestimates because they do not incorporate variability in the age of individual specimens resulting from between reader differences.
Figure 7 also shows that lengths predicted by this model may be underestimated up to about 8 mo and overestimated from about 8 to 13 mOo For comparison with predicted length at 1 yr from the model, the mean length of specimens aged between 0.9 and 1.1 yr (n = 24) is 121 cm with a range of 101-140 cm.
The estimated monthly growth rate is 3.84 cm/mo initially, falling to 3.11 cm/mo at 6 mo, 2.33 cm/mo at 12 mo, 1.67 cm/mo at 18 mo, and 1.15 cm/mo at 24 mOo
Discussion
The accuracy of these length-at-age estimates
563
depends upon the representativeness of the sample, the accuracy of the readings, the assumptions that 1 GLG equals 1 yr, and the adequacy of the growth model.
The sample analyzed was a simple random sample, stratified only by sex, taken from all specimens collected between 1973 and 1978. These were themselves a sample of the animals killed incidental to fishing operations, which were a sample of the population. Although Powers and Barlow (fn. 2) have shown a bias towards a higher proportion of calves killed in purse seine nets, we have no reason to believe that the relationship between length and age is different in our sample than in the population.
Teeth were read as accurately as possible. Reilly et al. (1983) have investigated the precision of the readings but, without known-age animals, it is not possible to validate their accuracy.
Our assumption that 1 GLG equals 1 yr is based on captive, tetracycline-marked Hawaiian spinner dolphins (Myrick et al. 1984) a distantly related species. Known-age, captive or marked spotted dolphins are not available for direct GLG calibration. If differences are found between GLG in spotted and spinner dolphin teeth when data from known-age spotted dolphins are available, these estimates of growth based on GLGs will need to be revised.
It is often assumed that when one GLG is
564
FIGURE 7.-Length·age [GLGs. (growth lll¥er groUPS), pooled mean estimates] data for northern offshore spotted dolphins up to 3.0 GLGs, and the fitted Gompertz model of growth.
180
180
140
E .2 l: ... ~
ffi 120 .... .... c + ... 0 ...
100
80
FISHERY BULLETIN: VOL. 83. NO.4
deposited each year the first GLG begins with the neonatal line immediately at birth and ends precisely 1 yr later. Yet it is possible, as suggested by Perrin et al. (1977) for S. longirostris, that the first GLG is not always complete. Teeth from young, knownage dolphins from the same stock born at different times during the year are needed to address this question.
It is also possible that the neonatal line may not be deposited immediately at the time of birth. In bottlenose dolphins, stranded on the mid-Atlantic coast of the United States, variability has been found in the time of deposition of the neonatal line in 18 neonatal specimens (Hohn unpubl. data). These specimens were identified as neonates because they lacked the umbilicus (indicating that the calf was not stillborn) and their dorsal fin and flukes were folded ('Th.volga and Essapian 1957). Some of these stranded specimens showed no neonatal line while others had part of a neonatal line deposited. Similarly, in our sample of offshore spotted dolphins from northern areas there is not neonatal line in some postnatal specimens so that the amount of time since birth is unknown. This difference in timing of neonatal line deposition may be due to individual variation in tooth growth and mineralization or small difference in gestation time.
The precise timing of the deposition of the first
+ +
*
1.0 2.0 3.0 4.0
AGE (yea,s'
HOHN and HAMMOND: POSTNATAL GROWTH OF SPOO'TED DOLPHIN
GLG (beginning with the neonatal line) is important in estimates of age in young animals. For a specimen estimated to be O-yr-old based on GLGs but which is known not to be a neonate, the age must necessarily be an underestimate of the actual age of that specimen, and, consequently, the average length of "O-yr-olds" would be greater than the average length of new-born specimens. When the Gompertz model (with Lo not fixed) is fitted to. the age data, the predicted length at age 0 is 89.6 cm, 4.2 cm higher than the length-at-birth estimate. The age at which the predicted length is 89.6 cm when Lo is fixed at 85.4 cm is about 0.1 GLGs. This indicates a possible bias of about 0.1 GLGs for young animals. However, this difference between predicted length for fits of the model with fixed and floated Lo diminishes rapidly and at 0.7 GLGs predicted length is 114.0 cm for both models.
The Gompertz model appears to be generally suitable in describing the early growth of the offshore spotted dolphin based on GLG readings. However. the pattern of points around the fitted line in Figure 7 up to about 1.1 GLGs indicates that growth during this period may not be adequately described by a single curve. This pattern may be a result of either sampling variation or errors in reading, but it may be due to changes in growth rate during this period resulting from changes in food intake. Perrin et al. (1976) have estimated that weaning occurs at about 11 mo in the offshore spotted dolphin so that during the period from about 8 to 13 mo, milk intake will be decreasing and the intake of solid food will be increasing. Growth rates may well reflect these changes. If this is the case, a twocycle model may describe growth more accurately during this period. Such an approach was used by Perrin et al. (1976. 1977) in spotted and spinner dolphins, respectively, to describe a secondary surge in the growth of pre-adult animals.
CONCLUDING REMARKS
Our analyses have produced different estimates of growth rates and lengths-at-age from two different techniques. The reliability of fitting growth curves to series of means of identifiable distributions of length by month depends primarily upon being able to select a sample in which breeding is both seasonal and synchronous from year to year. The reliability of fitting growth curves to length-age data as determined by counting GLGs depends primarily upon the validity of the assumption that 1 GLG is equivalent to 1 yr. We believe that neither technique is sufficiently reliable to be labelled as the "best" method
or to try to calibrate the other. Rather, our analyses underline the need for the analysis of data collected from known-age animals of these populations. However, we do believe that the estimates of growth rates and lengths-at-age presented here are the best currently available for offshore spotted dolphins from the eastern tropical Pacific.
ACKNOWLEDGMENTS
Theth were prepared by P. Sloan, M. Kimura, and D. Stanley. Age determination readings were made by A. Myrick and the first author. J. Barlow offered advice on growth models and W. Perrin made suggestions during the course of the analyses. Most of the illustrations were prepared by R. Allen. R. Hankins and S. Chivers were particularly helpful in data editing, computer programming, and some data analysis. We would like to thank R. Brownell, Jr., D. Chapman, F. Hester, and D. Siniff and colleagues at the SWFC and IATTC, especially J. Barlow, D. DeMaster, A. Myrick, W. Perrin, M. Scott, and A. Wild for critical reviews of an earlier version of the manuscript.
LITERATURE CITED
BARLOW. J. 1984. Reproductive seasonality in pelagic dolphins. (Stenella
spp.): Implications for measuring rates. In W. F. Perrin. D. P. DeMaster. and R. L. Brownell (editors). Reproduction in cetaceans, po 191-198. Rep. Int. Whaling Comm. Spec. Issue 6.
BEST, P. R 1976. Tetracycline marking and the rate of growth layer for
mation in the teeth of a dolphin. Lageno-rhyndtUB obsl'U-1'1IS. S. Afr. J. Sci. 72:216-218.
GoMPERl'Z. B.
1825. On the nature of the function expressive of the law of human mortality. and on a new mode of determining the value of Life Contingencies. Philos. Trans. R. Soc. Lond. 115:513-585.
GUREVICH. V. S., R S. STEWARl', AND L. H. CORNELL.
1980. [1981]. The use of tetracycline in age determination of common dolphins. Drlphi-nlls delphis. In W. F. Perrin and A. C. Myrick, Jr. (editors). Age determination of toothed whales and sirenians. p. 165-170. Rep. Int. Whaling Comm. Spec. Issue 3.
HASSELBLAD. V. 1966. Estimation of parameters for a mixture of normal distri
butions. Technometrics 8:431-444. HOHN, A. A.
1980. Age dl!termination and age related factors in the teeth of western North Atlantic bottlenose dolphins. Sci. Rep. Whales Res. Inst .. Thkyo 32:39-66.
HUI, C. 1978. Reliability of using dentine I~rs for age determination
in 7ltl'siops trlt1lcatus. U.S. Dep. Commer., Nat\. Tech. Inf. Serv .• PB288444, 25 p.
565
KASUYA, T. 1976. Reconsideration of life history parameters of the spot
ted and striped dolphins based on cementallayers. Sci. Rep. Whales Res. Inst., 'Thkyo 28:73-106.
KASUYA, T., AND R. L. BROWNELL, JR. 1979. Age determination, reproduction, and growth of Fran·
ciscana dolphin PcmJoporia. blai'm'illei. Sci. Rep. Whales Res. Inst., 'lbkyo 31:45-67.
KASUYA, T., N, MIYAZAKI, AND W. H. DAWBIN. 1974. Growth and reproduction of St41nella a.Ue'lluuta in the
Pacific coast of Japan. Sci. Rep. Whales Res. Inst., 'Ibkyo 26:157·226.
LAIRD, A. K. 1969. The dynamics of growth. Res. Dev. 20(8):28·31.
MIYAZAKI, N. 1977. Growth and reproduction of Stenella eoentleoalba off
the Pacific coast of Japan. Sci. Rep. Whales Res. lnst., 'fukyo 29:21-48.
MYRICK, A. c., JR., E. W. SHALLENBERGER, I. KANG, AND D. B. MACKAy.
1984. Calibration of dental layers in seven captive HaW'diian spinner dolphins. SUnUIlia. lrmgir08ftris, based on tetracycline labeling. Fish. Bull .. U.S. 82:207-225.
MYRICK, A. C" JR., A. A. HOHN, P. A. SLOAN, M. KIMURA, AND D. STANLEY.
1983. Estimating age of spotted and spinner dolphins, (SteneUa a·ttenuaJa and Stenella longi1'ustris) from teeth. U.S. D~p. Commer .. NOAA-TM·NMFS-SWFC-30, 17 p.
PERRIN, W. F., J. M. COE, AND J. R. ZWEIFEL. 1976. Growth and reproduction of the spotted porpoise.
Stenella attell uata, in the offshore eastern tropical Pacific. Fish. BulL, U.S. 74:229-269.
PERRIN, W. F .. ANI> J. R. HENDERSON. 1984. Growth and reprodu~tive rates in two populations of
spinner dolphins, Stenella /Qngi1'08tris, with different histories of exploitation. In W. F. Perrin, D. P. DeMaster, and R. L. Brownell (editors), Reproduction in cetaceans, p. 417-430. Rep. Int. Whaling Comm. Spec. Issue 6.
PERRIN, W. F., D. B. HOLTS, AND R. B. MILLER. 1977. Growth and reproduction of the eastern spinner dolphin,
a geographical form of Stell ella longirostris in the eastern
566
FISHERY BULLETIN: VOL. 83, NO.4
tropical Pacific. Fish. BUll .. U.S. 75:725-750. Perrin, W. F., and A. C. Myrick, Jr. (editors).
1980. [1981]. Age determination of toothed whales and sirenians. Rep. Int. Whaling Comm. Spec. Issue 3, 229 p.
PERRIN, W. F., P. A. SLOAN, AND J. R. HENDERSON. 1979. Taxonomic status of the 'south-western stocks' of spin·
ner dolphin Stenella longirostris and spotted dolphins S. attelluata. In W. F. Perrin and A. C. Myrick, Jr. (editorsl, Age determination of toothed whales and sirenians. p. 175·184. Rep. Int. Whaling Comm. 29.
REILLY, S. B.. A. A. HOHN. AND A. C. MYRICK. JR. 1983. Precision of growth layer group ageing of spot.t.ed
dolphins. U.S. Dep. Commer .. NOAA-TM-NMFS-SWFC-35, 27 p.
Ross, G. J. B. 1977. The taxonomy of bottle nosed dolphins 1Itl'siopt! species
in South African waters, with notes on their biology. Ann. Cape Provo Mus. (Nat. Hist.) 11:135-194.
SCHEFFER. V. B., AND A. C. MYRICK, JR. 1980. [1981]. A review of studies ttl 1970 of growth layers in
the teeth of marine mammals. In W. F. Perrin and A. C. Myrick, Jr. (editors). Age determination of toothed whales and sirenians, p. 51-64. Rep. Int. Whaling Comm. Spec. Issue 3.
SERGEANT, D. E. 1959. Age determination of odonrocete whales from dentinal
growth l!Wers. Norsk Hvalfangst-Tid. 48:273-288. 1962. The biology of the pilot or pothead whale Glohicephala
melaena (Traill) in Newfoundland waters. Fish. Res. Board Can .• Bull. 132, 84 p.
SERGEANT, D. E., D. K. CALlIWELL, AND M. C. CALDWELL. 1973. Age, growth, and maturity of bottlenose dolphin (1Itr
siops i1'U1UXlhts) from northeast Florida. J. Fish. Res. Board Can. 30:1009-1011.
TAVOLGA, M. C., AND F. S. ESSAPIAN. 1957. The behavior of the bottle-nosed dolphin mtsiops i1'Un
C~tU8): Mating. pregnancy. parturition and mother-infant behavior. Zoologica (N.Y.) 42(1):11-31.
VON BERTALANFFY. L. 1934. Untersuchungen iiber die Gesetzlickeit des Wachstums.
Wilhelm Roux' Arch. Entwichlungsmech. Org. 131:613.
Related Documents