Early instrumental seismicity recorded in the eastern Alps D. SANDRON, G. RENNER, A. REBEZ and D. SLEJKO Istituto Nazionale di Oceanografia e di Geofisica Sperimentale, Trieste, Italy (Received: April 9, 2013; accepted: January 16, 2014) ABSTRACT Three hundred and seventy-five earthquakes recorded by the Trieste station in the eastern Alps in the early instrumental period, i.e., before the occurrence of the destructive event of May 6, 1976, have been located after painstaking gathering of seismograms and bulletins. Analysis of the statistical parameters of the locations, together with comparisons with other instrumental and macroseismic locations, have allowed us to assess the quality of the results obtained, taking into account the often limited nature of the data. Using a process of digitization and the study of seismograms, focal parameters, particularly the magnitude M W , have been recovered for three earthquakes of the 1950s and 1960s. Key words: early instrumental earthquakes, old seismograms, bulletin, digitization, magnitude, NE Italy, Trieste. © 2014 – OGS 1. Introduction As part of the Interreg IV European Project “HAREIA - Historical and Recent Earthquakes in Italy and Austria”, the Istituto Nazionale di Oceanografia e di Geofisica Sperimentale (OGS) has carried out a reappraisal of the instrumental seismicity in the eastern Alps through reassessment of hypocentral parameters of the events recorded by the OGS stations (Trieste, and those of the regional seismometric network of Friuli-Venezia Giulia, which has been operating since 1977). One of the aims of the HAREIA project was to produce a new and uniform earthquake catalogue covering both the historical and the instrumental periods for future reassessment of the seismic hazard in the eastern Alps. The final goal of the review of early instrumental data was, therefore, to establish a freely accessible platform of earthquake locations and ancillary data (station coordinates, location parameters, seismic station readings, etc.) for the seismicity of the eastern Alps themselves. The obtained locations were, then, compared with the macroseismic locations and thus the final HAREIA catalogue was obtained (Rebez, 2012). Concentrating on north-eastern Italy, the Friuli-Venezia Giulia region has a long history of instrumental seismological data collection because the station at Trieste had been part of the Austrian seismometric network since 1898. That is from shortly after the 1895 Ljubljana earthquake, when a seismograph was placed on the top floor of a building located in the centre of Trieste (Böhm, 1998). The Trieste station was in operation until 1918 when it was moved 1.5 km westwards (international code TRS) to another city building and was managed from 1931 by the Istituto di Geofisica di Trieste, from 1941 by the Istituto Talassografico di Trieste, from 1949 by the Osservatorio Geofisico, and since 1958 by the Osservatorio Geofisico Sperimentale, now OGS, Bollettino di Geofisica Teorica ed Applicata Vol. 55, n. 4, pp. 755-788; December 2014 DOI 10.4430/bgta0118 © 2014 – OGS 755

Welcome message from author
This document is posted to help you gain knowledge. Please leave a comment to let me know what you think about it! Share it to your friends and learn new things together.
Transcript
Early instrumental seismicity recorded in the eastern Alps
D. SanDron, G. renner, a. rebez and D. Slejko
Istituto Nazionale di Oceanografia e di Geofisica Sperimentale, Trieste, Italy
(received: april 9, 2013; accepted: january 16, 2014)
ABSTRACT Three hundred and seventy-five earthquakes recorded by the Trieste station in the eastern Alps in the early instrumental period, i.e., before the occurrence of the destructive event of May 6, 1976, have been located after painstaking gathering of seismograms and bulletins. Analysis of the statistical parameters of the locations, together with comparisons with other instrumental and macroseismic locations, have allowed us to assess the quality of the results obtained, taking into account the often limited nature of the data. Using a process of digitization and the study of seismograms, focal parameters, particularly the magnitude MW, have been recovered for three earthquakes of the 1950s and 1960s.
Key words: early instrumental earthquakes, old seismograms, bulletin, digitization, magnitude, NE Italy, Trieste.
© 2014 – oGS
1. Introduction
As part of the Interreg IV European Project “HAREIA - Historical and Recent Earthquakes in Italy and Austria”, the Istituto Nazionale di Oceanografia e di Geofisica Sperimentale (OGS) has carried out a reappraisal of the instrumental seismicity in the eastern Alps through reassessment of hypocentral parameters of the events recorded by the OGS stations (Trieste, and those of the regional seismometric network of Friuli-Venezia Giulia, which has been operating since 1977). One of the aims of the HAREIA project was to produce a new and uniform earthquake catalogue covering both the historical and the instrumental periods for future reassessment of the seismic hazard in the eastern Alps. The final goal of the review of early instrumental data was, therefore, to establish a freely accessible platform of earthquake locations and ancillary data (station coordinates, location parameters, seismic station readings, etc.) for the seismicity of the eastern Alps themselves. The obtained locations were, then, compared with the macroseismic locations and thus the final HAREIA catalogue was obtained (Rebez, 2012).
Concentrating on north-eastern Italy, the Friuli-Venezia Giulia region has a long history of instrumental seismological data collection because the station at Trieste had been part of the Austrian seismometric network since 1898. That is from shortly after the 1895 Ljubljana earthquake, when a seismograph was placed on the top floor of a building located in the centre of Trieste (Böhm, 1998). The Trieste station was in operation until 1918 when it was moved 1.5 km westwards (international code TRS) to another city building and was managed from 1931 by the Istituto di Geofisica di Trieste, from 1941 by the Istituto Talassografico di Trieste, from 1949 by the Osservatorio Geofisico, and since 1958 by the Osservatorio Geofisico Sperimentale, now OGS,
bg817_Sandron senza testine.indd1 1 4-12-2014 10:59:24
754
Boll. Geof. Teor. Appl., 55, 739-754 Eva et al.
Eva C., Barani S., Carenzo G., De Ferrari R., Eva E., Ferretti G., Pavan M., Scafidi D., Solarino S., Spallarossa D., Turino C. and Zunino E.; 2010: 30 years of seismicity in the south- western Alps and northern Apeninnes as recorded by the Regional Seismic Network of northwestern Italy. In: Proceedings of the 29th Convegno Nazionale GNGTS, Prato 2010, pp. 50-53, ISBN 978-88-902101-5-0.
Ferretti G., Massa M. and Solarino S.; 2005: An improved method for the Recognition of Seismic Families: application to the Garfagnana-Lunigiana Area, Italy. Bull. Seism. Soc. Am., 95, 1903-1905
Frepoli A. and Amato A.; 1997: Contemporaneous extension and compression in the Northern Apennines from earthquake fault-plane solutions. Geophys. J. Int., 129, 368-388.
Frepoli A. and Amato A.; 2000: Spatial variations in stresses in peninsular Italy and Sicily from background seismicity. Tectonophysics, 317, 109-124.
Kissling E.; 1988: Geotomography with local earthquake data. Rev. Geophys., 26, 598-659.Lahr J.C.; 1980: HYPOELLIPSE/MULTICS: a computer program for determining local earthquake hypocentral
parameters, magnitude and first-motion pattern. U.S. Geological Survey, Open-File Report 80-59, 59 pp.Lahr J.C.; 1984: HYPOELLIPSE/VAX: a computer program for determining local earthquake hypocentral
parameters, magnitude and first-motion pattern. U.S. Geological Survey, Open-File Report 84-519, 76 pp.Lahr J.C.; 1999: HYPOELLIPSE/VAX: a computer program for determining local earthquake hypocentral
parameters, magnitude and first-motion pattern (Y2K Compliant Version), Version 1.0. U.S. Geological Survey, Open-File Report 99-23, On-Line Edition.
Lavecchia G.; 1988: The Tyrrhenian-Apennines system: structural setting and seismotectogenesis. Tectonophysics, 147, 263-296.
Makris J., Egloff F., Nicolich R. and Rihm R.; 1999: Crustal structure from the Ligurian Sea to the Northern Apennines – a wide angle seismic transect. Tectonophysics, 301, 305-319.
Paige C.C. and Saunders M. A.; 1982: LSQR: an algorithm for sparse linear equations and sparse least squares. ACM Transactions on Mathematical Software TOMS, 8(1), 43-71.
Piccinini D., Chiarabba C., Augliera P. and Monghidoro Earthquake Group (M.E.G.); 2006: Compression along the Northern Apennines? Evidence from the Mw 5.3 Monghidoro earthquake. Terra Nova, 18, 89-94.
Pondrelli S., Salinbeni S., Ekström G., Morelli A., Gasperini P., and Vannucci G.; 2006: The Italian CMT dataset from 1977 to present. Phys. Earth Planet. Inter., 159, 286-303.
Raggi G.; 1985: Neotettonica ed evoluzione paleogeografica plio-pleistocenica del bacino del fiume Magra. Mem. Soc. Geol. It., 30, 35-62.
Scafidi D. and Solarino S.; 2012: Can local earthquake tomography settle the matter about subduction in the Northern Central Apennines? Response from a new high resolution P velocity and Vp/Vs ratio 3-D model. Tectonophysics, 554, 63-73, doi: 10.1016/j.tecto.2012.06.007.
Scafidi D., Solarino S. and Eva C.; 2006: Structure and properties of the Ivrea body and of the Alps-Apennines system as revealed by local earthquake tomography. Boll. Geof. Teor. Appl., 47, 497-514.
Scafidi D., Solarino S. and Eva C.; 2009: P wave seismic velocity and Vp/Vs ratio beneath the Italian peninsula from local earthquake tomography. Tectonophysics, 465, 1-23, doi:10.1016/j.tecto.2008.07.013.
Solarino S.; 2005: The role of instrumental versus macroseismic locations for earthquakes of the last century: a discussion based on the seismicity of the North-Western Apennines (Italy). Annals of Geophysics, 48, 923-936.
Solarino S., Ferretti G. and Eva C.; 2002a: Seismicity of the Garfagnana-Lunigiana (Tuscany, Italy) as recorded by a network of semi-broad band instruments. Journal of Seismology, 6, 141-152.
Solarino S., Ferretti G. and Eva E.; 2002b: Crustal structure of the Lunigiana-Garfagnana area (Tuscany, Italy): seismicity, fault plane solutions and seismic tomography. Boll. Geof. Teor. Appl., 43, 221-238.
Vai G.B.; 2001: Basement and early (pre-Alpine) history. In: Vai G.B. and Martini I.P. (eds), Anatomy of an orogen: the Apennines and adjacent Mediterranean basins, Kluwer Academic Publishers, pp. 121-150.
Waldhauser F. and Ellsworth W. L.; 2000: A double-difference earthquake location algorithm: method and application to the northern Hayward fault, California. Bull. Seismol. Soc. Am., 90, 1353-1368.
Corresponding author: Elena Eva Ist. Nazionale di Geofisica e Vulcanologia Sede di Genova, c/o DICCA Università di Genova Via All’Opera Pia15, 16145 Genova, Italy. Phone: +39 010 3536656; e-mail: [email protected]
Bollettino di Geofisica Teorica ed Applicata Vol. 55, n. 4, pp. 755-788; December 2014DOI 10.4430/bgta0118
© 2014 – OGS 755
and the archives from 1931 onwards are still being maintained. In 1963, the seismological station was moved from the centre of Trieste to a low-noise site on the Karst plateau (Borgo Grotta Gigante with the new station code TRI) and equipped with the instruments of the World Wide Standardized Seismographic Network, coordinated by the U.S. Geological Survey. Past earthquake activity in and around the Friuli-Venezia Giulia region has thus been documented in an uninterrupted series of seismological bulletins from the Trieste stations (TRS, TRI) since 1931. The bulletins relating to the Austrian period (1898 to 1918, available at INGV and ENEA) have also been consulted for events of relevance to this work.
In the early years of the 20th century there were numerous research institute and university observatories, with seismographic instruments in the general eastern Alps region: in Padua, Treviso, Venice, Graz, Innsbruck, Ljubljana (LJU), Rijeka (formerly Fiume) and Pula (formerly Pola). In the 1960s and 1970s, the Italian electric agency (ENEL) installed seismographs in the proximity of its dams in the eastern Alps (at Ambiesta, La Maina, Mis, Pieve di Cadore, Somplago, Tolmezzo, and Vajont). Further away, some other stations such those at Bologna, Salò, Klagenfurt, Cerknica, and Zagreb carried out effective recordings of the earthquakes in the eastern Alps.
Retrieving original data for earthquakes occurring in the early decades of the 20th century is quite difficult because several institutions managing the seismological stations no longer have all the old seismograms and sometimes the seismological bulletins are also lacking. It was, therefore, necessary to have recourse to phase readings reported in bulletins of international agencies [mainly the International Seismological Centre (ISC), former International Seismological Summary (ISS) International Seismological Summary (ISS)International Seismological Summary (ISS) to fill in the missing data.
This paper summarizes an analysis of the seismological data relating to all seismic events in the eastern Alps (i.e., between 45.0° and 47.5° N and 10.0° to 15.0° E) recorded by the seismic station of Trieste, while referring the early instrumental period, i.e., before May 6, 1976, when a seismic sequence started as documented in several specific studies (e.g., Finetti et al., 1979; Poli et al., 2002; Carulli and Slejko, 2005).
2. Data gathering
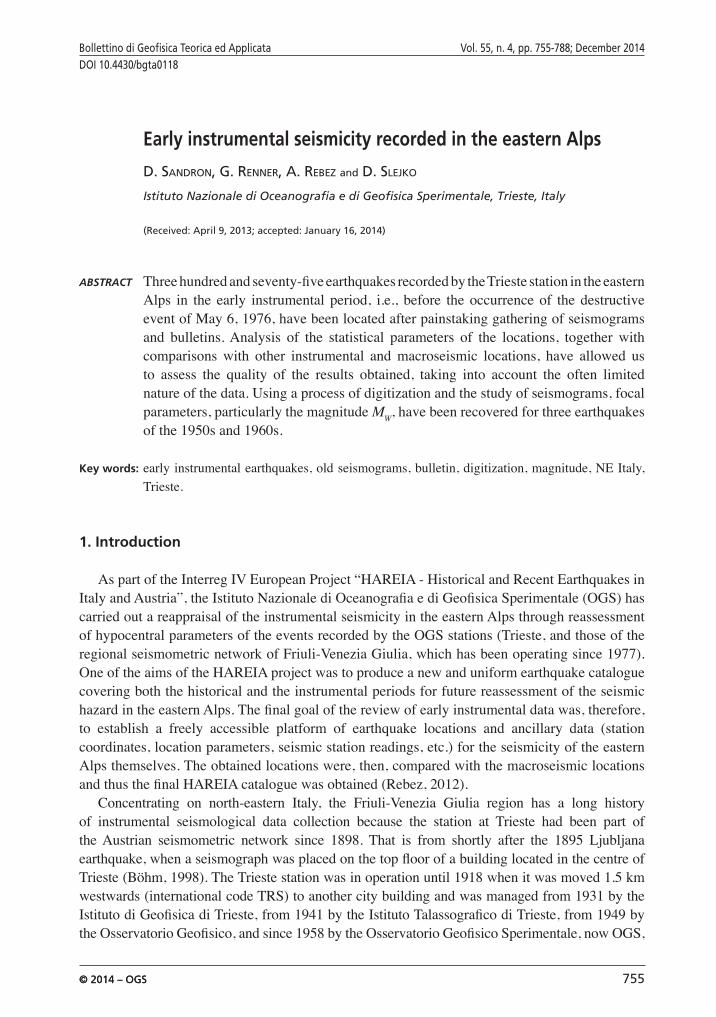
All the stations operating in Europe and recording events from October 30, 1901 to May 5, 1976, at least for some periods, are reported in Fig. 1a: the total is 222 but 12 lie outside the geographical limits of the figure. The histogram in Fig. 1b shows the number of stations operating per decade both in Europe and within the current borders of Italy, the eastern borders of Italy having been subjected to repeated changes in the 20th century, as it is well known. As already mentioned, the Trieste seismic station was the only one operating before 1977 in north-eastern Italy, being managed by a public research institution and whose data were distributed worldwide. Seismogram and bulletin collections were carried out for the main events in the study area as recorded by the Trieste station, while drawing also on the data reported in the ISS and ISC bulletins.
The complete list of events is reported in the Appendix. The phases of some Italian stations have been subject to reinterpretation (i.e., BOL, CHV, FIR, PAD, PAV, RCI, RDP, ROM, and SAL) as well as those of the previously mentioned ENEL stations. In addition the seismograms of some stations in Austria (IBK, KFA, KMR, MOA, OGA, SCE, and VIE) and in Germany (BHG,
bg817_Sandron senza testine.indd2 2 4-12-2014 10:59:25
756
Boll. Geof. Teor. Appl., 55, 755-788 Sandron et al.
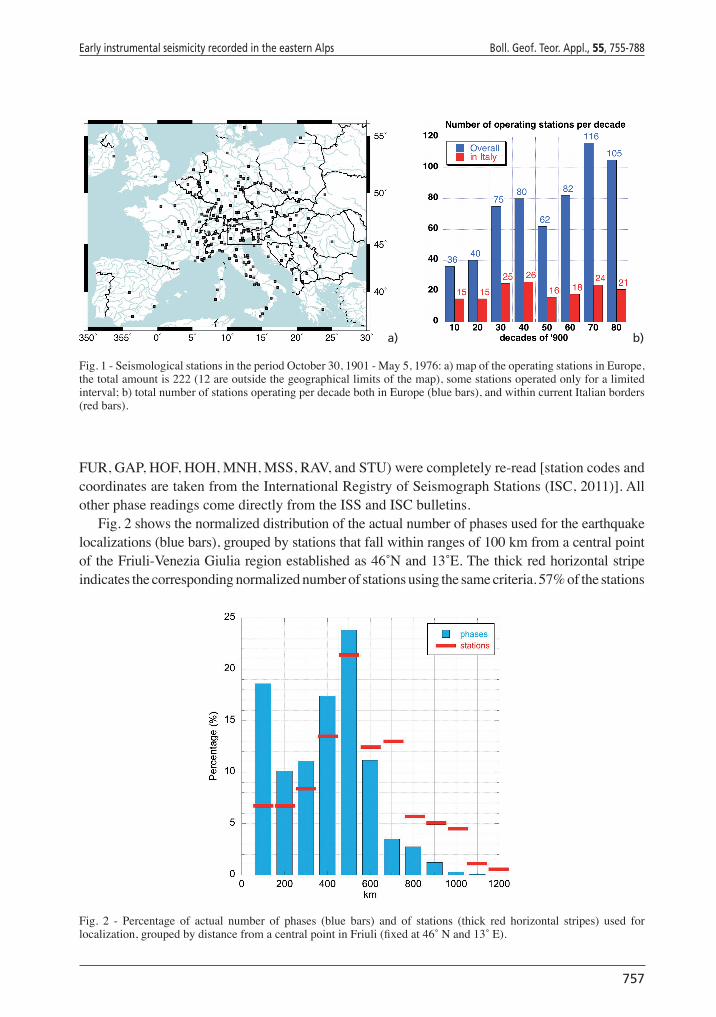
Fig. 1 - Seismological stations in the period October 30, 1901 - May 5, 1976: a) map of the operating stations in Europe, the total amount is 222 (12 are outside the geographical limits of the map), some stations operated only for a limited interval; b) total number of stations operating per decade both in Europe (blue bars), and within current Italian borders (red bars).
a) b)
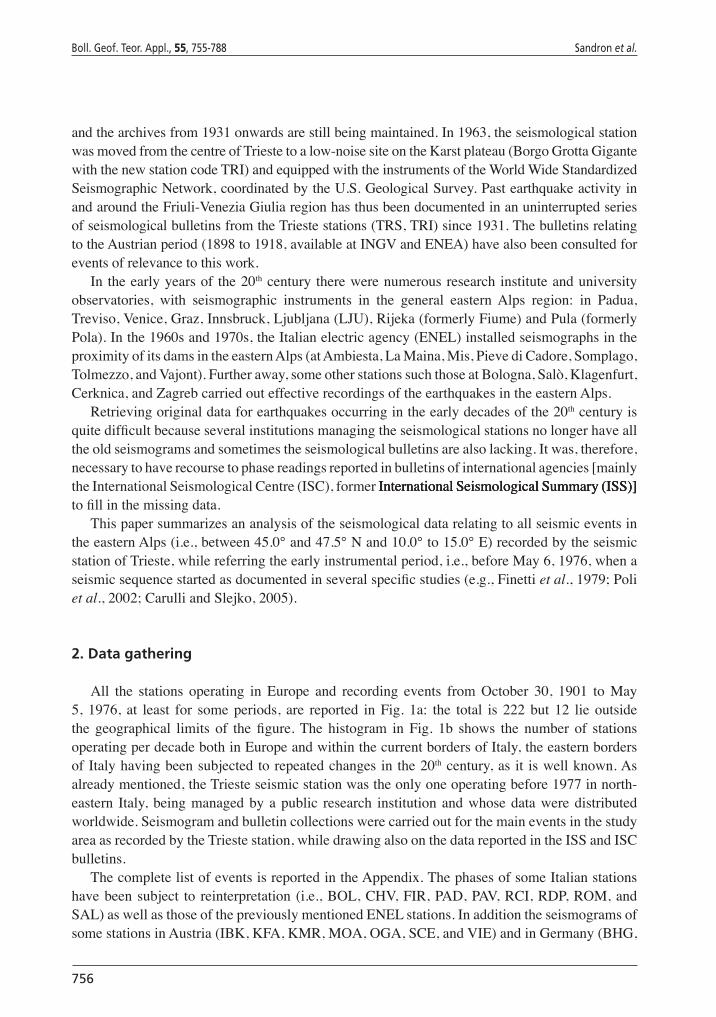
Fig. 2 - Percentage of actual number of phases (blue bars) and of stations (thick red horizontal stripes) used for localization, grouped by distance from a central point in Friuli (fixed at 46˚ N and 13˚ E).
FUR, GAP, HOF, HOH, MNH, MSS, RAV, and STU) were completely re-read [station codes and coordinates are taken from the International Registry of Seismograph Stations (ISC, 2011). All other phase readings come directly from the ISS and ISC bulletins.
Fig. 2 shows the normalized distribution of the actual number of phases used for the earthquake localizations (blue bars), grouped by stations that fall within ranges of 100 km from a central point of the Friuli-Venezia Giulia region established as 46˚N and 13˚E. The thick red horizontal stripe indicates the corresponding normalized number of stations using the same criteria. 57% of the stations
bg817_Sandron senza testine.indd3 3 4-12-2014 10:59:27
and the archives from 1931 onwards are still being maintained. In 1963, the seismological station was moved from the centre of Trieste to a low-noise site on the Karst plateau (Borgo Grotta Gigante with the new station code TRI) and equipped with the instruments of the World Wide Standardized Seismographic Network, coordinated by the U.S. Geological Survey. Past earthquake activity in and around the Friuli-Venezia Giulia region has thus been documented in an uninterrupted series of seismological bulletins from the Trieste stations (TRS, TRI) since 1931. The bulletins relating to the Austrian period (1898 to 1918, available at INGV and ENEA) have also been consulted for events of relevance to this work.
In the early years of the 20th century there were numerous research institute and university observatories, with seismographic instruments in the general eastern Alps region: in Padua, Treviso, Venice, Graz, Innsbruck, Ljubljana (LJU), Rijeka (formerly Fiume) and Pula (formerly Pola). In the 1960s and 1970s, the Italian electric agency (ENEL) installed seismographs in the proximity of its dams in the eastern Alps (at Ambiesta, La Maina, Mis, Pieve di Cadore, Somplago, Tolmezzo, and Vajont). Further away, some other stations such those at Bologna, Salò, Klagenfurt, Cerknica, and Zagreb carried out effective recordings of the earthquakes in the eastern Alps.
Retrieving original data for earthquakes occurring in the early decades of the 20th century is quite difficult because several institutions managing the seismological stations no longer have all the old seismograms and sometimes the seismological bulletins are also lacking. It was, therefore, necessary to have recourse to phase readings reported in bulletins of international agencies [mainly the International Seismological Centre (ISC), former International Seismological Summary (ISS) International Seismological Summary (ISS)International Seismological Summary (ISS) to fill in the missing data.
This paper summarizes an analysis of the seismological data relating to all seismic events in the eastern Alps (i.e., between 45.0° and 47.5° N and 10.0° to 15.0° E) recorded by the seismic station of Trieste, while referring the early instrumental period, i.e., before May 6, 1976, when a seismic sequence started as documented in several specific studies (e.g., Finetti et al., 1979; Poli et al., 2002; Carulli and Slejko, 2005).
2. Data gathering
All the stations operating in Europe and recording events from October 30, 1901 to May 5, 1976, at least for some periods, are reported in Fig. 1a: the total is 222 but 12 lie outside the geographical limits of the figure. The histogram in Fig. 1b shows the number of stations operating per decade both in Europe and within the current borders of Italy, the eastern borders of Italy having been subjected to repeated changes in the 20th century, as it is well known. As already mentioned, the Trieste seismic station was the only one operating before 1977 in north-eastern Italy, being managed by a public research institution and whose data were distributed worldwide. Seismogram and bulletin collections were carried out for the main events in the study area as recorded by the Trieste station, while drawing also on the data reported in the ISS and ISC bulletins.
The complete list of events is reported in the Appendix. The phases of some Italian stations have been subject to reinterpretation (i.e., BOL, CHV, FIR, PAD, PAV, RCI, RDP, ROM, and SAL) as well as those of the previously mentioned ENEL stations. In addition the seismograms of some stations in Austria (IBK, KFA, KMR, MOA, OGA, SCE, and VIE) and in Germany (BHG,
bg817_Sandron senza testine.indd2 2 4-12-2014 10:59:25
Early instrumental seismicity recorded in the eastern Alps Boll. Geof. Teor. Appl., 55, 755-788
757
within 500 km contribute with 84% of the effective phases used. In contrast, despite having used stations with distances greater than 500 km (43% of the total number of stations), the contribution in terms of phases used is reduced to 16% (or just 8% for distances greater than 600 km).
Most of the studied events occurred in the second half of the 20th century (Fig. 3). It is quite reasonable that at the beginning of the century the number of documented events is very small. There are, in fact, only 12 events recorded before 1920: among these, 7 before 1910 (the large circles in Fig. 4). An increasing number of earthquakes started to be recorded from the 1920s, after the First World War, but another equally reasonable lack of seismicity data is recognizable during the Second World War. The number of analyzed seismic events progressively increases after 1950 and 272 of the events of the entire data set (68%) were reported after 1960 (Fig. 3).
3. The processing of the data
3.1. Code and input parametersThe original HYPO71 code (Lee and Lahr, 1975) was used for location. HYPO71 is a computer
program for determining hypocentre, magnitude, and first motion pattern of local earthquakes and was first released in 1971. It is perhaps the first earthquake location program to have achieved worldwide application. Before it, the use of EPIC (Bolt and Turcotte, 1964) was relatively restricted. Despite its simple modelling of the Earth’s structure as plane-parallel layers in a region of geological and structural complexity such as that of the the eastern Alps, it still represents the best trade-off between accuracy and the large dimensions of the area under investigation. 3D processing has been passed over at this stage in order to have continuity with the standard processing operated by OGS with seismometric data from the regional networks. The standard structural model (Riggio and Russi, 1984) applied for the analysis of events recorded by the OGS regional network was considered suitable for the study area concerned (45.0° - 47.5° N and 10.0° - 15.0° E: box in Fig. 4). This consists of a layer from the surface down to a depth of 22 km with VP = 5.85 km/s, a layer from 22 to 39.5 km depth with VP = 6.8 km/s, and a half-space below 39.5
Fig. 3 - Time distribution (number of events per year) of the 375 analyzed earthquakes for the period October 30, 1901 - May 5, 1976.
bg817_Sandron senza testine.indd4 4 4-12-2014 10:59:28
758
Boll. Geof. Teor. Appl., 55, 755-788 Sandron et al.
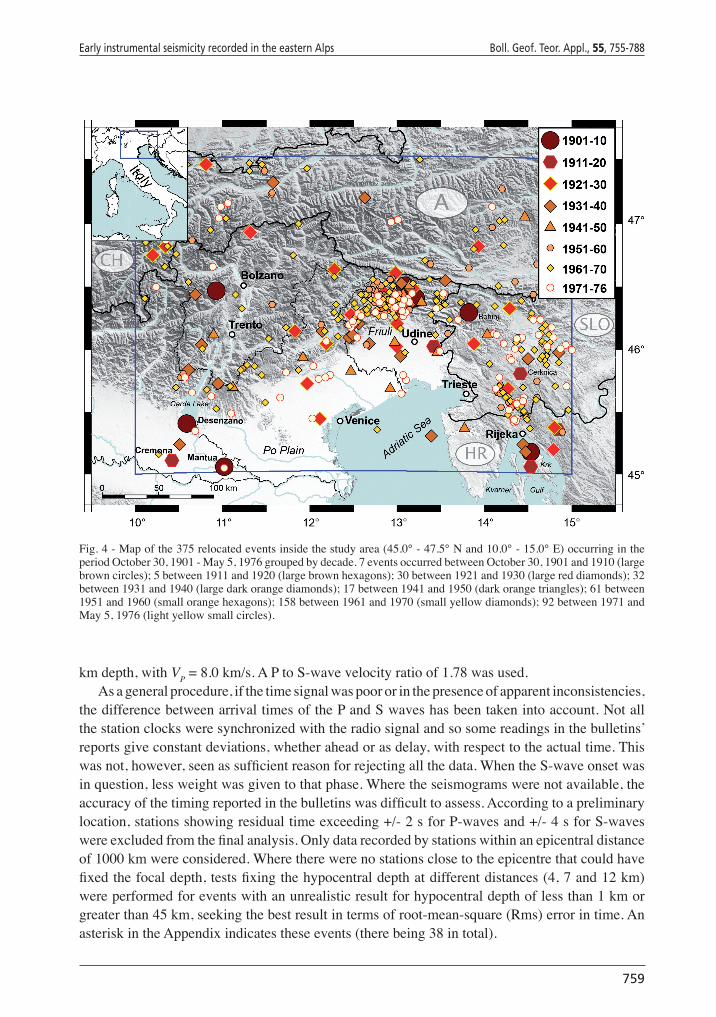
Fig. 4 - Map of the 375 relocated events inside the study area (45.0° - 47.5° N and 10.0° - 15.0° E) occurring in the period October 30, 1901 - May 5, 1976 grouped by decade. 7 events occurred between October 30, 1901 and 1910 (large brown circles); 5 between 1911 and 1920 (large brown hexagons); 30 between 1921 and 1930 (large red diamonds); 32 between 1931 and 1940 (large dark orange diamonds); 17 between 1941 and 1950 (dark orange triangles); 61 between 1951 and 1960 (small orange hexagons); 158 between 1961 and 1970 (small yellow diamonds); 92 between 1971 and May 5, 1976 (light yellow small circles).
km depth, with VP = 8.0 km/s. A P to S-wave velocity ratio of 1.78 was used.As a general procedure, if the time signal was poor or in the presence of apparent inconsistencies,
the difference between arrival times of the P and S waves has been taken into account. Not all the station clocks were synchronized with the radio signal and so some readings in the bulletins’ reports give constant deviations, whether ahead or as delay, with respect to the actual time. This was not, however, seen as sufficient reason for rejecting all the data. When the S-wave onset was in question, less weight was given to that phase. Where the seismograms were not available, the accuracy of the timing reported in the bulletins was difficult to assess. According to a preliminary location, stations showing residual time exceeding +/- 2 s for P-waves and +/- 4 s for S-waves were excluded from the final analysis. Only data recorded by stations within an epicentral distance of 1000 km were considered. Where there were no stations close to the epicentre that could have fixed the focal depth, tests fixing the hypocentral depth at different distances (4, 7 and 12 km) were performed for events with an unrealistic result for hypocentral depth of less than 1 km or greater than 45 km, seeking the best result in terms of root-mean-square (Rms) error in time. An asterisk in the Appendix indicates these events (there being 38 in total).
bg817_Sandron senza testine.indd5 5 4-12-2014 10:59:30
within 500 km contribute with 84% of the effective phases used. In contrast, despite having used stations with distances greater than 500 km (43% of the total number of stations), the contribution in terms of phases used is reduced to 16% (or just 8% for distances greater than 600 km).
Most of the studied events occurred in the second half of the 20th century (Fig. 3). It is quite reasonable that at the beginning of the century the number of documented events is very small. There are, in fact, only 12 events recorded before 1920: among these, 7 before 1910 (the large circles in Fig. 4). An increasing number of earthquakes started to be recorded from the 1920s, after the First World War, but another equally reasonable lack of seismicity data is recognizable during the Second World War. The number of analyzed seismic events progressively increases after 1950 and 272 of the events of the entire data set (68%) were reported after 1960 (Fig. 3).
3. The processing of the data
3.1. Code and input parametersThe original HYPO71 code (Lee and Lahr, 1975) was used for location. HYPO71 is a computer
program for determining hypocentre, magnitude, and first motion pattern of local earthquakes and was first released in 1971. It is perhaps the first earthquake location program to have achieved worldwide application. Before it, the use of EPIC (Bolt and Turcotte, 1964) was relatively restricted. Despite its simple modelling of the Earth’s structure as plane-parallel layers in a region of geological and structural complexity such as that of the the eastern Alps, it still represents the best trade-off between accuracy and the large dimensions of the area under investigation. 3D processing has been passed over at this stage in order to have continuity with the standard processing operated by OGS with seismometric data from the regional networks. The standard structural model (Riggio and Russi, 1984) applied for the analysis of events recorded by the OGS regional network was considered suitable for the study area concerned (45.0° - 47.5° N and 10.0° - 15.0° E: box in Fig. 4). This consists of a layer from the surface down to a depth of 22 km with VP = 5.85 km/s, a layer from 22 to 39.5 km depth with VP = 6.8 km/s, and a half-space below 39.5
Fig. 3 - Time distribution (number of events per year) of the 375 analyzed earthquakes for the period October 30, 1901 - May 5, 1976.
bg817_Sandron senza testine.indd4 4 4-12-2014 10:59:28
Early instrumental seismicity recorded in the eastern Alps Boll. Geof. Teor. Appl., 55, 755-788
759
Some of the parameters of the program have been changed in order to adapt location procedure to the characteristics of the seismicity in the study area. The values changed with respect to default figures are shown in Table 1 together with their description. TEST (01) (the cut-off value for the Jeffreys’ weighting) is designed for data sets containing large timing uncertainties. In the first run of the code the default value of 0.1 was used. The epicentral localizations with large errors were checked separately. In most cases, fixing the focal depth greatly decreased uncertainties. Then TEST (01)=100 was used. Comparisons between the two data sets obtained using the two above-mentioned values for TEST (01), respectively 0.1 and 100, showed that 69% of the locations differ by less than 2 km. 4% of reported distances were more than 10 km (15 of 374). These include the case of February 11, 1944, which, as we will see later, is one of the worst cases in our database in terms both of associated errors and distances with respect to the macroseismic epicentre, the case of January 1, 1960, for which, however, the nearest station was situated at 0.2 km, and the case of August 18, 1967 for which the nearest station was at 260 km.
3.2. Error analysisEarthquake location is a non-linear problem, as discussed in Lee and Stewart (1981), and there
is no fool proof method to solve this because input data may be insufficient to remove the problem. Precise checking of the input data is, however, essential before any earthquake location program can be run. The statistical errors in relation to the location depend on the accuracy of the velocity model used to compute earthquake location, the weightings assigned to arrival times and the procedure used to locate the earthquake. Even if there are accurate station coordinates (better than ±0.1 km if possible), a reasonable crustal structure model (e.g., from controlled explosions), and reliable P and S arrivals, no computer programs will give correct answers if the input data contain errors. It must also be borne in mind that small residuals and standard errors are insufficient to assure an accurate hypocentre result.
Quantitative analysis using statistical tools was carried out on all the error data set produced by the algorithm HYPO71 (Lee and Lahr, 1975). The results provide information on the reliability of the earthquake location. These are considered separately below.
Table 1 - Input values used for the HYPO71 (Lee and Lahr, 1975) code.
Test Input Default Definition Value
TEST (01) 100.0 0.1 The cut-off value for rms below which Jeffreys’ weighting of residuals is not used. It should be set to approximately the overall timing accuracy of P-arrival in seconds.
TEST (02) 120.0 10.0 For each iteration, if the epicentral adjustment is greater than TEST (02), this step is recalculated without focal depth adjustment. TEST (02) should be set to a value approximately equal to the station spacing in km.
TEST (10) 50.0 100.0 If the latitude or longitude adjustment (DX or DY) is greater than TEST (10) then DX is reset to DX/(J+1), and DY is reset to DY/(J+1), where J=D/TEST (10), D being the larger of DX or DY.
TEST (11) 20.0 8.0 Maximum number of iterations in the hypocentral adjustment.
bg817_Sandron senza testine.indd6 6 4-12-2014 10:59:30
760
Boll. Geof. Teor. Appl., 55, 755-788 Sandron et al.
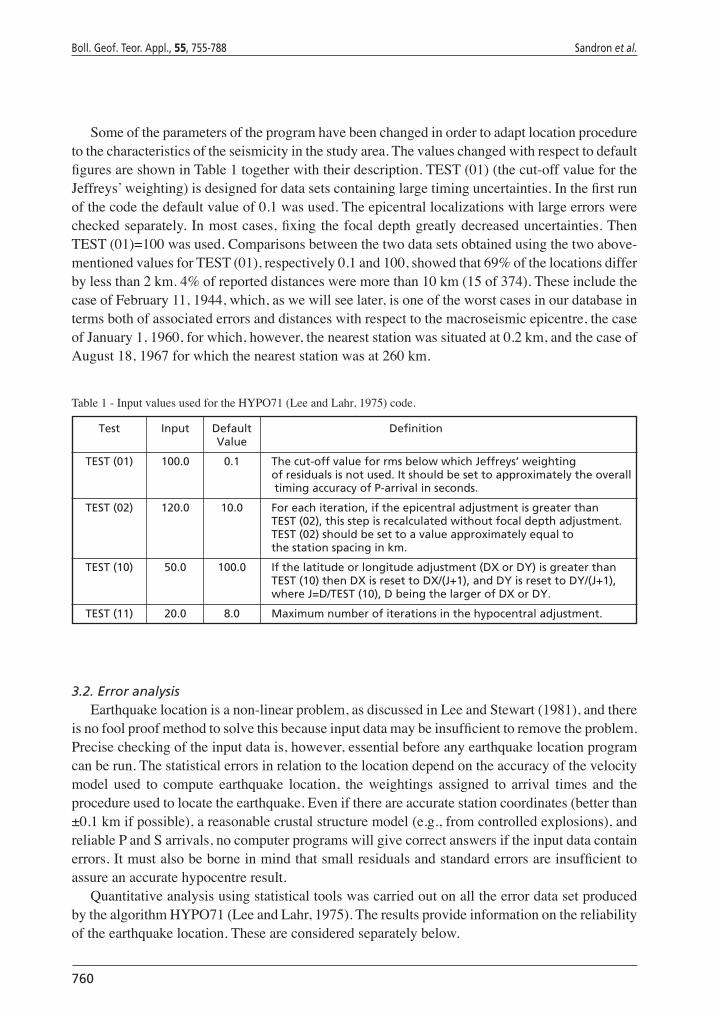
The Rms travel time residual, in seconds, provides a measure of the fit of the observed arrival times with predicted arrival times according to the computed location. Small numbers reflect a better data fit though it also depends on the number of arrival times used. For this reason, a complete analysis of location errors is given here as opposed to a simple check on rms values. The median value of Rms for the whole data set of 375 locations is 0.9 s (minimum 0.01 s and maximum 3.9 s); 57% of the entire data set has a value less than, or equal to, 1 s and 99% less than, or equal to, 1.5 s (Fig. 5a). Only three records have a time residual greater than 2 s (Fig. 5): i.e., June 22, 1968 (Rms = 3.9 s), February 19, 1932 (Rms = 2.9 s) and May 5, 1950 (Rms = 2.15 s). Even if it is not immediately visible from the picture emerging, the general trend for rms values decreases from the beginning of the 20th century to the 1970s (Fig. 5b).
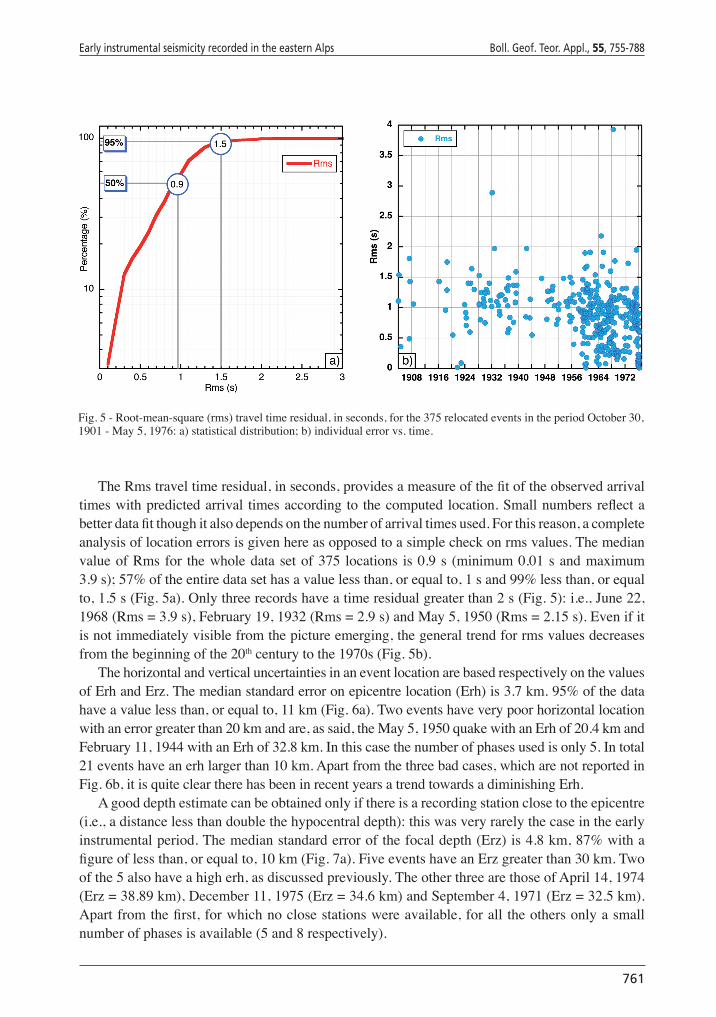
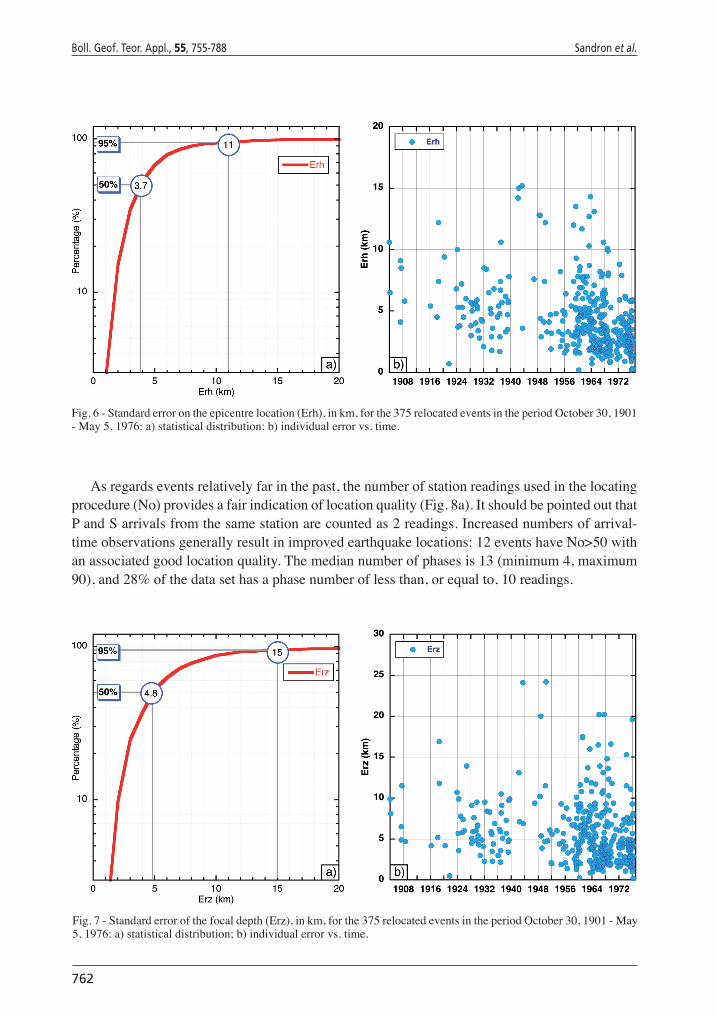
The horizontal and vertical uncertainties in an event location are based respectively on the values of Erh and Erz. The median standard error on epicentre location (Erh) is 3.7 km. 95% of the data have a value less than, or equal to, 11 km (Fig. 6a). Two events have very poor horizontal location with an error greater than 20 km and are, as said, the May 5, 1950 quake with an Erh of 20.4 km and February 11, 1944 with an Erh of 32.8 km. In this case the number of phases used is only 5. In total 21 events have an erh larger than 10 km. Apart from the three bad cases, which are not reported in Fig. 6b, it is quite clear there has been in recent years a trend towards a diminishing Erh.
A good depth estimate can be obtained only if there is a recording station close to the epicentre (i.e., a distance less than double the hypocentral depth): this was very rarely the case in the early instrumental period. The median standard error of the focal depth (Erz) is 4.8 km, 87% with a figure of less than, or equal to, 10 km (Fig. 7a). Five events have an Erz greater than 30 km. Two of the 5 also have a high erh, as discussed previously. The other three are those of April 14, 1974 (Erz = 38.89 km), December 11, 1975 (Erz = 34.6 km) and September 4, 1971 (Erz = 32.5 km). Apart from the first, for which no close stations were available, for all the others only a small number of phases is available (5 and 8 respectively).
Fig. 5 - Root-mean-square (rms) travel time residual, in seconds, for the 375 relocated events in the period October 30, 1901 - May 5, 1976: a) statistical distribution; b) individual error vs. time.
bg817_Sandron senza testine.indd7 7 4-12-2014 10:59:35
Some of the parameters of the program have been changed in order to adapt location procedure to the characteristics of the seismicity in the study area. The values changed with respect to default figures are shown in Table 1 together with their description. TEST (01) (the cut-off value for the Jeffreys’ weighting) is designed for data sets containing large timing uncertainties. In the first run of the code the default value of 0.1 was used. The epicentral localizations with large errors were checked separately. In most cases, fixing the focal depth greatly decreased uncertainties. Then TEST (01)=100 was used. Comparisons between the two data sets obtained using the two above-mentioned values for TEST (01), respectively 0.1 and 100, showed that 69% of the locations differ by less than 2 km. 4% of reported distances were more than 10 km (15 of 374). These include the case of February 11, 1944, which, as we will see later, is one of the worst cases in our database in terms both of associated errors and distances with respect to the macroseismic epicentre, the case of January 1, 1960, for which, however, the nearest station was situated at 0.2 km, and the case of August 18, 1967 for which the nearest station was at 260 km.
3.2. Error analysisEarthquake location is a non-linear problem, as discussed in Lee and Stewart (1981), and there
is no fool proof method to solve this because input data may be insufficient to remove the problem. Precise checking of the input data is, however, essential before any earthquake location program can be run. The statistical errors in relation to the location depend on the accuracy of the velocity model used to compute earthquake location, the weightings assigned to arrival times and the procedure used to locate the earthquake. Even if there are accurate station coordinates (better than ±0.1 km if possible), a reasonable crustal structure model (e.g., from controlled explosions), and reliable P and S arrivals, no computer programs will give correct answers if the input data contain errors. It must also be borne in mind that small residuals and standard errors are insufficient to assure an accurate hypocentre result.
Quantitative analysis using statistical tools was carried out on all the error data set produced by the algorithm HYPO71 (Lee and Lahr, 1975). The results provide information on the reliability of the earthquake location. These are considered separately below.
Table 1 - Input values used for the HYPO71 (Lee and Lahr, 1975) code.
Test Input Default Definition Value
TEST (01) 100.0 0.1 The cut-off value for rms below which Jeffreys’ weighting of residuals is not used. It should be set to approximately the overall timing accuracy of P-arrival in seconds.
TEST (02) 120.0 10.0 For each iteration, if the epicentral adjustment is greater than TEST (02), this step is recalculated without focal depth adjustment. TEST (02) should be set to a value approximately equal to the station spacing in km.
TEST (10) 50.0 100.0 If the latitude or longitude adjustment (DX or DY) is greater than TEST (10) then DX is reset to DX/(J+1), and DY is reset to DY/(J+1), where J=D/TEST (10), D being the larger of DX or DY.
TEST (11) 20.0 8.0 Maximum number of iterations in the hypocentral adjustment.
bg817_Sandron senza testine.indd6 6 4-12-2014 10:59:30
Early instrumental seismicity recorded in the eastern Alps Boll. Geof. Teor. Appl., 55, 755-788
761
As regards events relatively far in the past, the number of station readings used in the locating procedure (No) provides a fair indication of location quality (Fig. 8a). It should be pointed out that P and S arrivals from the same station are counted as 2 readings. Increased numbers of arrival-time observations generally result in improved earthquake locations: 12 events have No>50 with an associated good location quality. The median number of phases is 13 (minimum 4, maximum 90), and 28% of the data set has a phase number of less than, or equal to, 10 readings.
Fig. 7 - Standard error of the focal depth (Erz), in km, for the 375 relocated events in the period October 30, 1901 - May 5, 1976: a) statistical distribution; b) individual error vs. time.
Fig. 6 - Standard error on the epicentre location (Erh), in km, for the 375 relocated events in the period October 30, 1901 - May 5, 1976: a) statistical distribution; b) individual error vs. time.
bg817_Sandron senza testine.indd8 8 4-12-2014 10:59:45
762
Boll. Geof. Teor. Appl., 55, 755-788 Sandron et al.
As regards events relatively far in the past, the number of station readings used in the locating procedure (No) provides a fair indication of location quality (Fig. 8a). It should be pointed out that P and S arrivals from the same station are counted as 2 readings. Increased numbers of arrival-time observations generally result in improved earthquake locations: 12 events have No>50 with an associated good location quality. The median number of phases is 13 (minimum 4, maximum 90), and 28% of the data set has a phase number of less than, or equal to, 10 readings.
Fig. 7 - Standard error of the focal depth (Erz), in km, for the 375 relocated events in the period October 30, 1901 - May 5, 1976: a) statistical distribution; b) individual error vs. time.
Fig. 6 - Standard error on the epicentre location (Erh), in km, for the 375 relocated events in the period October 30, 1901 - May 5, 1976: a) statistical distribution; b) individual error vs. time.
bg817_Sandron senza testine.indd8 8 4-12-2014 10:59:45
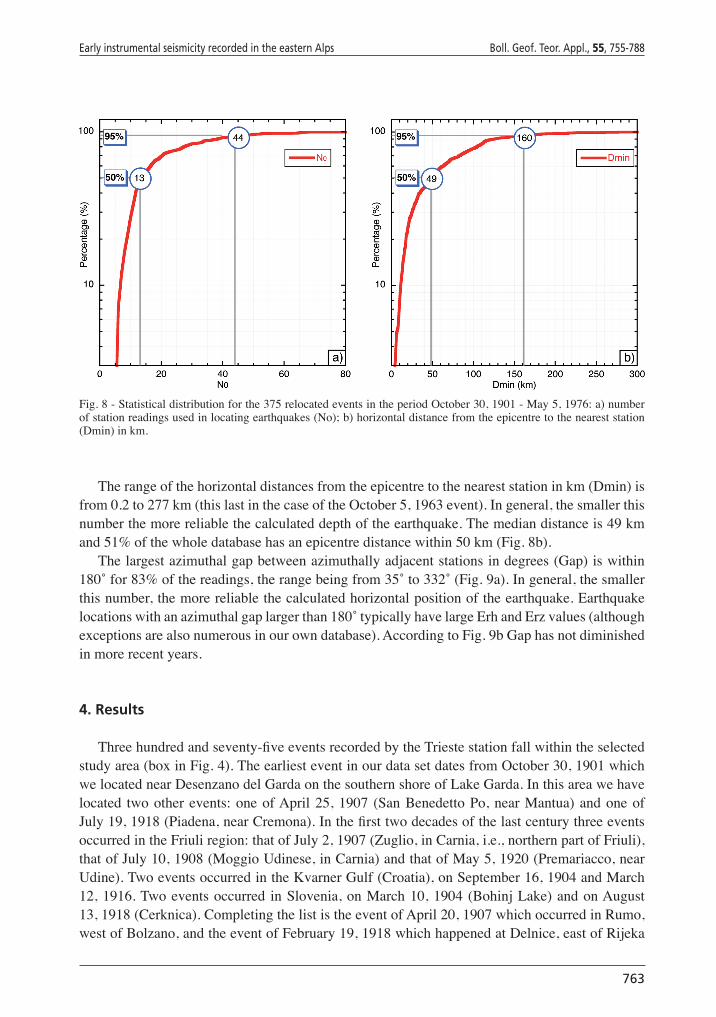
Fig. 8 - Statistical distribution for the 375 relocated events in the period October 30, 1901 - May 5, 1976: a) number of station readings used in locating earthquakes (No); b) horizontal distance from the epicentre to the nearest station (Dmin) in km.
The range of the horizontal distances from the epicentre to the nearest station in km (Dmin) is from 0.2 to 277 km (this last in the case of the October 5, 1963 event). In general, the smaller this number the more reliable the calculated depth of the earthquake. The median distance is 49 km and 51% of the whole database has an epicentre distance within 50 km (Fig. 8b).
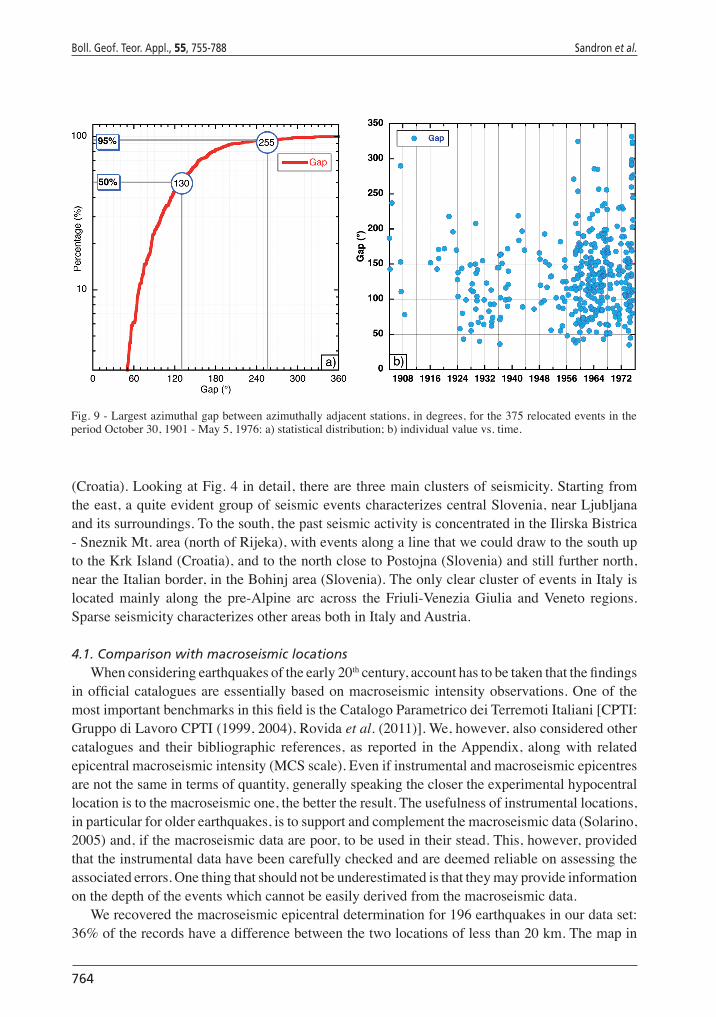
The largest azimuthal gap between azimuthally adjacent stations in degrees (Gap) is within 180˚ for 83% of the readings, the range being from 35˚ to 332˚ (Fig. 9a). In general, the smaller this number, the more reliable the calculated horizontal position of the earthquake. Earthquake locations with an azimuthal gap larger than 180˚ typically have large Erh and Erz values (although exceptions are also numerous in our own database). According to Fig. 9b Gap has not diminished in more recent years.
4. Results
Three hundred and seventy-five events recorded by the Trieste station fall within the selected study area (box in Fig. 4). The earliest event in our data set dates from October 30, 1901 which we located near Desenzano del Garda on the southern shore of Lake Garda. In this area we have located two other events: one of April 25, 1907 (San Benedetto Po, near Mantua) and one of July 19, 1918 (Piadena, near Cremona). In the first two decades of the last century three events occurred in the Friuli region: that of July 2, 1907 (Zuglio, in Carnia, i.e., northern part of Friuli), that of July 10, 1908 (Moggio Udinese, in Carnia) and that of May 5, 1920 (Premariacco, near Udine). Two events occurred in the Kvarner Gulf (Croatia), on September 16, 1904 and March 12, 1916. Two events occurred in Slovenia, on March 10, 1904 (Bohinj Lake) and on August 13, 1918 (Cerknica). Completing the list is the event of April 20, 1907 which occurred in Rumo, west of Bolzano, and the event of February 19, 1918 which happened at Delnice, east of Rijeka
bg817_Sandron senza testine.indd9 9 4-12-2014 10:59:50
Early instrumental seismicity recorded in the eastern Alps Boll. Geof. Teor. Appl., 55, 755-788
763
(Croatia). Looking at Fig. 4 in detail, there are three main clusters of seismicity. Starting from the east, a quite evident group of seismic events characterizes central Slovenia, near Ljubljana and its surroundings. To the south, the past seismic activity is concentrated in the Ilirska Bistrica - Sneznik Mt. area (north of Rijeka), with events along a line that we could draw to the south up to the Krk Island (Croatia), and to the north close to Postojna (Slovenia) and still further north, near the Italian border, in the Bohinj area (Slovenia). The only clear cluster of events in Italy is located mainly along the pre-Alpine arc across the Friuli-Venezia Giulia and Veneto regions. Sparse seismicity characterizes other areas both in Italy and Austria.
4.1. Comparison with macroseismic locations When considering earthquakes of the early 20th century, account has to be taken that the findings
in official catalogues are essentially based on macroseismic intensity observations. One of the most important benchmarks in this field is the Catalogo Parametrico dei Terremoti Italiani [CPTI: Gruppo di Lavoro CPTI (1999, 2004), Rovida et al. (2011). We, however, also considered other catalogues and their bibliographic references, as reported in the Appendix, along with related epicentral macroseismic intensity (MCS scale). Even if instrumental and macroseismic epicentres are not the same in terms of quantity, generally speaking the closer the experimental hypocentral location is to the macroseismic one, the better the result. The usefulness of instrumental locations, in particular for older earthquakes, is to support and complement the macroseismic data (Solarino, 2005) and, if the macroseismic data are poor, to be used in their stead. This, however, provided that the instrumental data have been carefully checked and are deemed reliable on assessing the associated errors. One thing that should not be underestimated is that they may provide information on the depth of the events which cannot be easily derived from the macroseismic data.
We recovered the macroseismic epicentral determination for 196 earthquakes in our data set: 36% of the records have a difference between the two locations of less than 20 km. The map in
Fig. 9 - Largest azimuthal gap between azimuthally adjacent stations, in degrees, for the 375 relocated events in the period October 30, 1901 - May 5, 1976: a) statistical distribution; b) individual value vs. time.
bg817_Sandron senza testine.indd10 10 4-12-2014 10:59:55
764
Boll. Geof. Teor. Appl., 55, 755-788 Sandron et al.
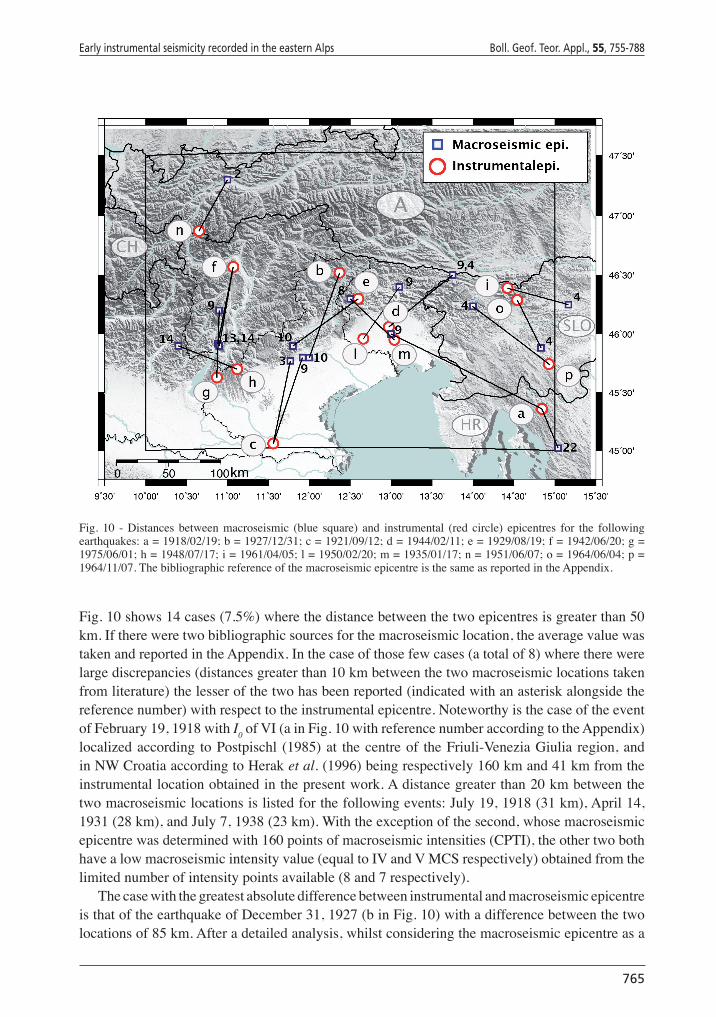
Fig. 10 shows 14 cases (7.5%) where the distance between the two epicentres is greater than 50 km. If there were two bibliographic sources for the macroseismic location, the average value was taken and reported in the Appendix. In the case of those few cases (a total of 8) where there were large discrepancies (distances greater than 10 km between the two macroseismic locations taken from literature) the lesser of the two has been reported (indicated with an asterisk alongside the reference number) with respect to the instrumental epicentre. Noteworthy is the case of the event of February 19, 1918 with I0 of VI (a in Fig. 10 with reference number according to the Appendix) localized according to Postpischl (1985) at the centre of the Friuli-Venezia Giulia region, and in NW Croatia according to Herak et al. (1996) being respectively 160 km and 41 km from the instrumental location obtained in the present work. A distance greater than 20 km between the two macroseismic locations is listed for the following events: July 19, 1918 (31 km), April 14, 1931 (28 km), and July 7, 1938 (23 km). With the exception of the second, whose macroseismic epicentre was determined with 160 points of macroseismic intensities (CPTI), the other two both have a low macroseismic intensity value (equal to IV and V MCS respectively) obtained from the limited number of intensity points available (8 and 7 respectively).
The case with the greatest absolute difference between instrumental and macroseismic epicentre is that of the earthquake of December 31, 1927 (b in Fig. 10) with a difference between the two locations of 85 km. After a detailed analysis, whilst considering the macroseismic epicentre as a
Fig. 10 - Distances between macroseismic (blue square) and instrumental (red circle) epicentres for the following earthquakes: a = 1918/02/19; b = 1927/12/31; c = 1921/09/12; d = 1944/02/11; e = 1929/08/19; f = 1942/06/20; g = 1975/06/01; h = 1948/07/17; i = 1961/04/05; l = 1950/02/20; m = 1935/01/17; n = 1951/06/07; o = 1964/06/04; p = 1964/11/07. The bibliographic reference of the macroseismic epicentre is the same as reported in the Appendix.
bg817_Sandron senza testine.indd11 11 4-12-2014 10:59:57
(Croatia). Looking at Fig. 4 in detail, there are three main clusters of seismicity. Starting from the east, a quite evident group of seismic events characterizes central Slovenia, near Ljubljana and its surroundings. To the south, the past seismic activity is concentrated in the Ilirska Bistrica - Sneznik Mt. area (north of Rijeka), with events along a line that we could draw to the south up to the Krk Island (Croatia), and to the north close to Postojna (Slovenia) and still further north, near the Italian border, in the Bohinj area (Slovenia). The only clear cluster of events in Italy is located mainly along the pre-Alpine arc across the Friuli-Venezia Giulia and Veneto regions. Sparse seismicity characterizes other areas both in Italy and Austria.
4.1. Comparison with macroseismic locations When considering earthquakes of the early 20th century, account has to be taken that the findings
in official catalogues are essentially based on macroseismic intensity observations. One of the most important benchmarks in this field is the Catalogo Parametrico dei Terremoti Italiani [CPTI: Gruppo di Lavoro CPTI (1999, 2004), Rovida et al. (2011). We, however, also considered other catalogues and their bibliographic references, as reported in the Appendix, along with related epicentral macroseismic intensity (MCS scale). Even if instrumental and macroseismic epicentres are not the same in terms of quantity, generally speaking the closer the experimental hypocentral location is to the macroseismic one, the better the result. The usefulness of instrumental locations, in particular for older earthquakes, is to support and complement the macroseismic data (Solarino, 2005) and, if the macroseismic data are poor, to be used in their stead. This, however, provided that the instrumental data have been carefully checked and are deemed reliable on assessing the associated errors. One thing that should not be underestimated is that they may provide information on the depth of the events which cannot be easily derived from the macroseismic data.
We recovered the macroseismic epicentral determination for 196 earthquakes in our data set: 36% of the records have a difference between the two locations of less than 20 km. The map in
Fig. 9 - Largest azimuthal gap between azimuthally adjacent stations, in degrees, for the 375 relocated events in the period October 30, 1901 - May 5, 1976: a) statistical distribution; b) individual value vs. time.
bg817_Sandron senza testine.indd10 10 4-12-2014 10:59:55
Early instrumental seismicity recorded in the eastern Alps Boll. Geof. Teor. Appl., 55, 755-788
765
reference point in locating the instrumental one, a better convergence between the two locations has not been achieved. The instrumental location obtained is, then, the best possible, even though unsatisfactory, with the 8 available phase readings (CHU, INN, RAV, STR, VEN, ZAG, and ZUR) with the nearest station (INN) at a distance of 111 km.
For the earthquake of September 12, 1921 (c in Fig. 10) the distance between the instrumental and macroseismic locations is 84 km. The number of phases used for the instrumental localization was very limited at just 5, and the focal depth was fixed at 7 km. This was a small event and the associated epicentral intensity is IV, with only 3 macroseismic points available. The events of April 4, 1961 (i in Fig. 10) and June 4, 1964 (o in Fig. 10) also had an intensity of IV and the distance between the two locations is 60 km and 51 km, respectively.
As regards the earthquakes of February 11, 1944, of August 19, 1929, and of June 20, 1942 with respective distances of 78 km, 76 km and 75 km from the macroseismic epicentre (d, e, and f in Fig. 10), the instrumental localization was obtained using very few phase readings (5 and 6 for the first two). The uncertainties in the results can be clearly seen on looking at the horizontal and vertical errors; both are greater than 15 km, as already reported in paragraph 3.2. The epicentre determination of the events of July 17, 1948 (h in Fig. 10) and of February 20, 1950 (l in Fig. 10) (distance of 60 km for both) also has horizontal and vertical errors greater than 10 km (with 7 and 10 phase readings used for the location). The macroseismic epicentre of the June 1, 1975 event (g in Fig. 10) is 64 km away from the instrumental one, which is however close to that reported in the ISC bulletin (8 km away).
We can say in overall terms that, as it could be expected, there is an excellent convergence of instrumental localizations with macroseismic localizations when the data from both parts are plentiful. When the number of phases or the number of stations used is very limited, or where azimuthal coverage is not optimal, the resulting instrumental localizations are penalized. On the other hand, a macroseismic localization of an event below the threshold of damage and/or where there are few points of macroseismic observation available cannot be considered optimal.
4.2. Comparison with instrumental locations Further analysis has been carried out to consider the available ISC instrumental locations for
the earthquakes investigated in the present study. We have identified 105 common events for which a comparative analysis on certain parameters, such as Rms, Gap, and Dmin, is possible.
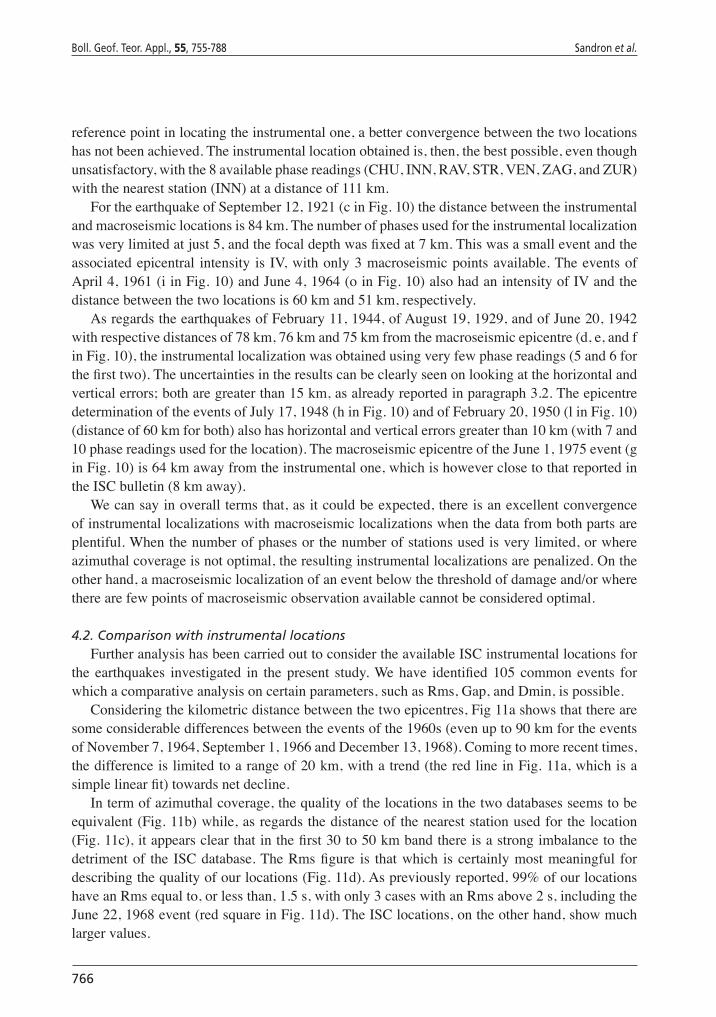
Considering the kilometric distance between the two epicentres, Fig 11a shows that there are some considerable differences between the events of the 1960s (even up to 90 km for the events of November 7, 1964, September 1, 1966 and December 13, 1968). Coming to more recent times, the difference is limited to a range of 20 km, with a trend (the red line in Fig. 11a, which is a simple linear fit) towards net decline.
In term of azimuthal coverage, the quality of the locations in the two databases seems to be equivalent (Fig. 11b) while, as regards the distance of the nearest station used for the location (Fig. 11c), it appears clear that in the first 30 to 50 km band there is a strong imbalance to the detriment of the ISC database. The Rms figure is that which is certainly most meaningful for describing the quality of our locations (Fig. 11d). As previously reported, 99% of our locations have an Rms equal to, or less than, 1.5 s, with only 3 cases with an Rms above 2 s, including the June 22, 1968 event (red square in Fig. 11d). The ISC locations, on the other hand, show much larger values.
bg817_Sandron senza testine.indd12 12 4-12-2014 10:59:57
766
Boll. Geof. Teor. Appl., 55, 755-788 Sandron et al.
5. Signal processing of the Wiechert recordings
More detailed investigation has been carried out in the case of a few events with the aim of extracting as much information as possible and also to attempt to recover waveforms, with inquiries being made at the SEISMOS databank (Michelini et al., 2005). We selected events in order to share the regions included in the HAREIA project, Friuli-Venezia Giulia, Veneto, Trentino-Alto Adige (all in Italy), and Tyrol (Austria). The initial list of earthquakes was: that of March 26, 1924 (17:08, MW = 5.07, I0 = VI-VII) Vipiteno; February 19, 1932 (12:57, MW = 5.02, I0 = VII-VIII) Monte Baldo; July 24, 1943 (01:44, MW = 5.2, I0 = VII) Valdobbiadene, February 20, 1950 (01:55, MW = 4.43, I0 = V-VI) Amaro; July 23, 1955 (03:54, MW = 4.56, I0 = VI) Maniago; January 31, 1956 (02:25, MW = 5.13, I0 = VII) Ilirska Bistrica; April 26, 1959 (14:45, MW = 5.23,
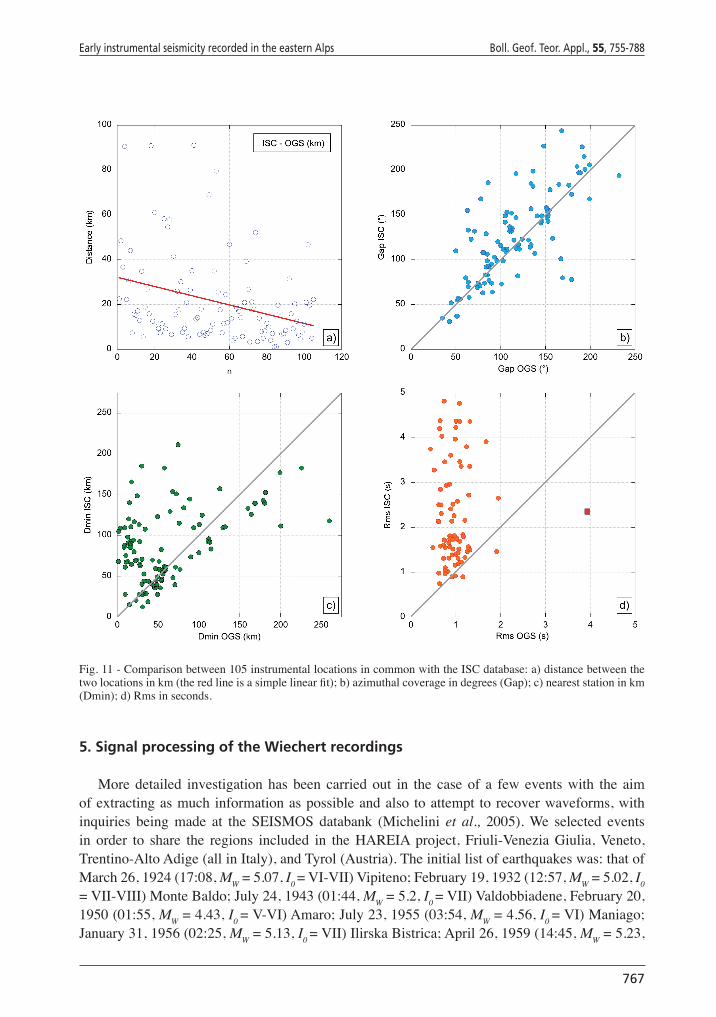
Fig. 11 - Comparison between 105 instrumental locations in common with the ISC database: a) distance between the two locations in km (the red line is a simple linear fit); b) azimuthal coverage in degrees (Gap); c) nearest station in km (Dmin); d) Rms in seconds.
bg817_Sandron senza testine.indd13 13 4-12-2014 11:00:00
reference point in locating the instrumental one, a better convergence between the two locations has not been achieved. The instrumental location obtained is, then, the best possible, even though unsatisfactory, with the 8 available phase readings (CHU, INN, RAV, STR, VEN, ZAG, and ZUR) with the nearest station (INN) at a distance of 111 km.
For the earthquake of September 12, 1921 (c in Fig. 10) the distance between the instrumental and macroseismic locations is 84 km. The number of phases used for the instrumental localization was very limited at just 5, and the focal depth was fixed at 7 km. This was a small event and the associated epicentral intensity is IV, with only 3 macroseismic points available. The events of April 4, 1961 (i in Fig. 10) and June 4, 1964 (o in Fig. 10) also had an intensity of IV and the distance between the two locations is 60 km and 51 km, respectively.
As regards the earthquakes of February 11, 1944, of August 19, 1929, and of June 20, 1942 with respective distances of 78 km, 76 km and 75 km from the macroseismic epicentre (d, e, and f in Fig. 10), the instrumental localization was obtained using very few phase readings (5 and 6 for the first two). The uncertainties in the results can be clearly seen on looking at the horizontal and vertical errors; both are greater than 15 km, as already reported in paragraph 3.2. The epicentre determination of the events of July 17, 1948 (h in Fig. 10) and of February 20, 1950 (l in Fig. 10) (distance of 60 km for both) also has horizontal and vertical errors greater than 10 km (with 7 and 10 phase readings used for the location). The macroseismic epicentre of the June 1, 1975 event (g in Fig. 10) is 64 km away from the instrumental one, which is however close to that reported in the ISC bulletin (8 km away).
We can say in overall terms that, as it could be expected, there is an excellent convergence of instrumental localizations with macroseismic localizations when the data from both parts are plentiful. When the number of phases or the number of stations used is very limited, or where azimuthal coverage is not optimal, the resulting instrumental localizations are penalized. On the other hand, a macroseismic localization of an event below the threshold of damage and/or where there are few points of macroseismic observation available cannot be considered optimal.
4.2. Comparison with instrumental locations Further analysis has been carried out to consider the available ISC instrumental locations for
the earthquakes investigated in the present study. We have identified 105 common events for which a comparative analysis on certain parameters, such as Rms, Gap, and Dmin, is possible.
Considering the kilometric distance between the two epicentres, Fig 11a shows that there are some considerable differences between the events of the 1960s (even up to 90 km for the events of November 7, 1964, September 1, 1966 and December 13, 1968). Coming to more recent times, the difference is limited to a range of 20 km, with a trend (the red line in Fig. 11a, which is a simple linear fit) towards net decline.
In term of azimuthal coverage, the quality of the locations in the two databases seems to be equivalent (Fig. 11b) while, as regards the distance of the nearest station used for the location (Fig. 11c), it appears clear that in the first 30 to 50 km band there is a strong imbalance to the detriment of the ISC database. The Rms figure is that which is certainly most meaningful for describing the quality of our locations (Fig. 11d). As previously reported, 99% of our locations have an Rms equal to, or less than, 1.5 s, with only 3 cases with an Rms above 2 s, including the June 22, 1968 event (red square in Fig. 11d). The ISC locations, on the other hand, show much larger values.
bg817_Sandron senza testine.indd12 12 4-12-2014 10:59:57
Early instrumental seismicity recorded in the eastern Alps Boll. Geof. Teor. Appl., 55, 755-788
767
I0 = VII-VIII) Carnia; March 18, 1964 (16:43, MW = 4.77, I0 = VI) Ilirska Bistrica. All magnitudes are from CPTI and intensities from the Appendix.
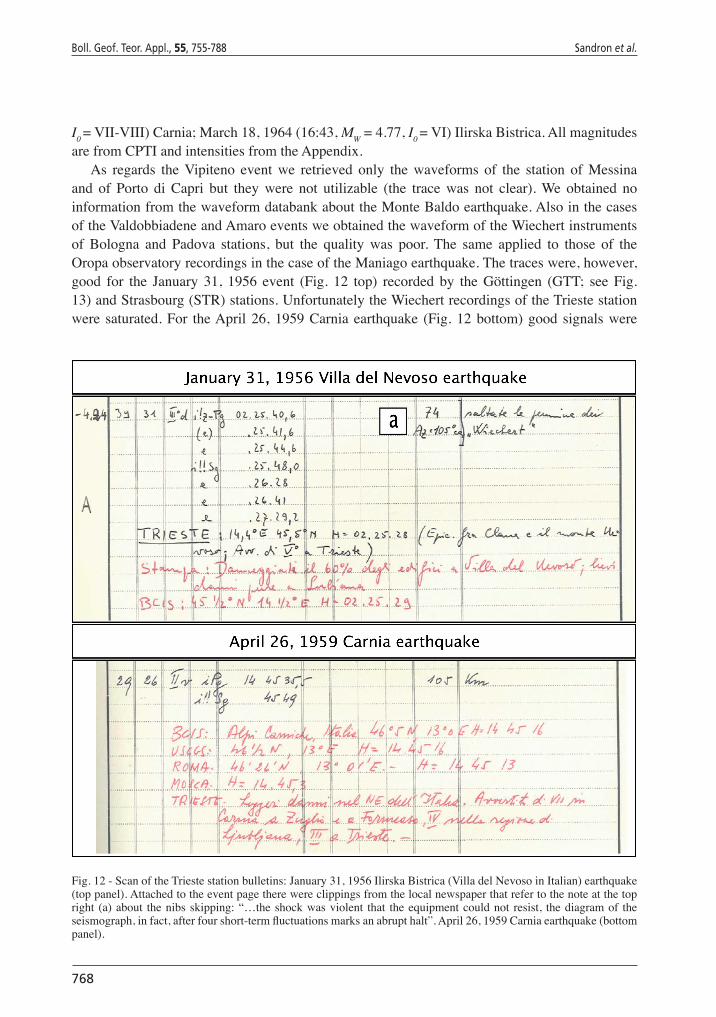
As regards the Vipiteno event we retrieved only the waveforms of the station of Messina and of Porto di Capri but they were not utilizable (the trace was not clear). We obtained no information from the waveform databank about the Monte Baldo earthquake. Also in the cases of the Valdobbiadene and Amaro events we obtained the waveform of the Wiechert instruments of Bologna and Padova stations, but the quality was poor. The same applied to those of the Oropa observatory recordings in the case of the Maniago earthquake. The traces were, however, good for the January 31, 1956 event (Fig. 12 top) recorded by the Göttingen (GTT; see Fig. 13) and Strasbourg (STR) stations. Unfortunately the Wiechert recordings of the Trieste station were saturated. For the April 26, 1959 Carnia earthquake (Fig. 12 bottom) good signals were
Fig. 12 - Scan of the Trieste station bulletins: January 31, 1956 Ilirska Bistrica (Villa del Nevoso in Italian) earthquake (top panel). Attached to the event page there were clippings from the local newspaper that refer to the note at the top right (a) about the nibs skipping: “…the shock was violent that the equipment could not resist, the diagram of the seismograph, in fact, after four short-term fluctuations marks an abrupt halt”. April 26, 1959 Carnia earthquake (bottom panel).
bg817_Sandron senza testine.indd14 14 4-12-2014 11:00:14
768
Boll. Geof. Teor. Appl., 55, 755-788 Sandron et al.
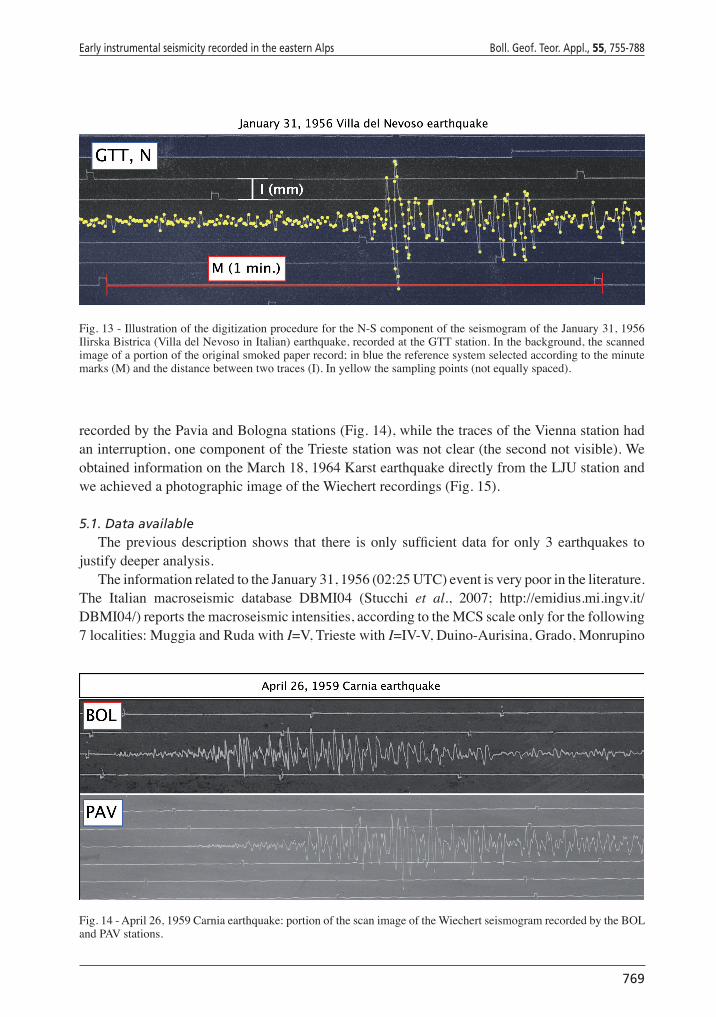
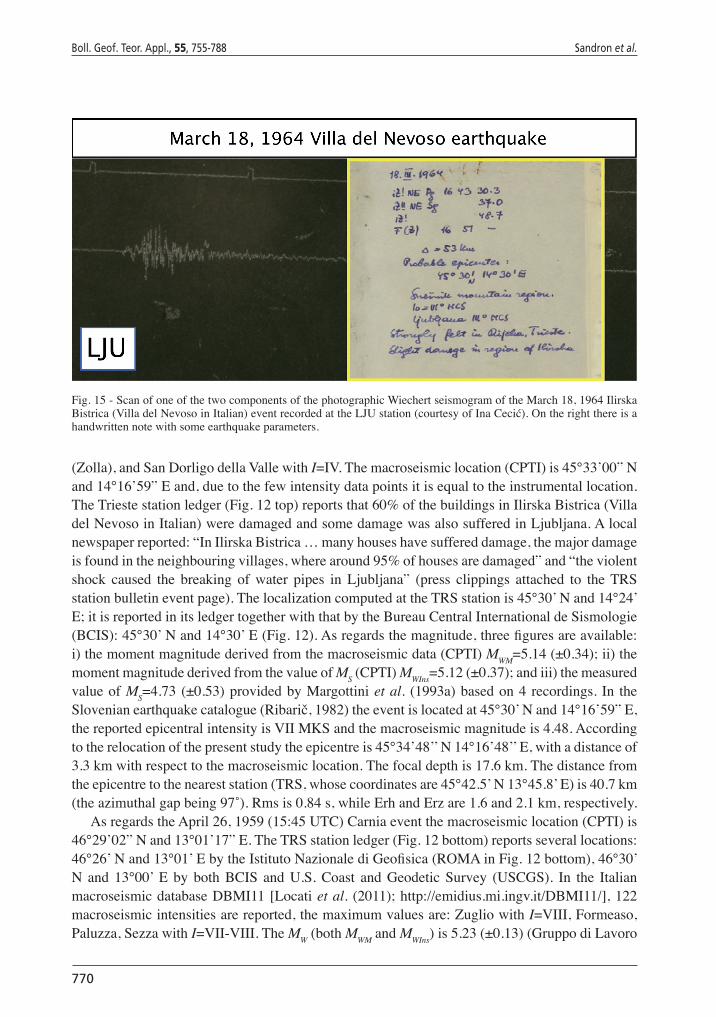
recorded by the Pavia and Bologna stations (Fig. 14), while the traces of the Vienna station had an interruption, one component of the Trieste station was not clear (the second not visible). We obtained information on the March 18, 1964 Karst earthquake directly from the LJU station and we achieved a photographic image of the Wiechert recordings (Fig. 15).
5.1. Data availableThe previous description shows that there is only sufficient data for only 3 earthquakes to
justify deeper analysis.The information related to the January 31, 1956 (02:25 UTC) event is very poor in the literature.
The Italian macroseismic database DBMI04 (Stucchi et al., 2007; http://emidius.mi.ingv.it/DBMI04/) reports the macroseismic intensities, according to the MCS scale only for the following 7 localities: Muggia and Ruda with I=V, Trieste with I=IV-V, Duino-Aurisina, Grado, Monrupino
Fig. 14 - April 26, 1959 Carnia earthquake: portion of the scan image of the Wiechert seismogram recorded by the BOL and PAV stations.
Fig. 13 - Illustration of the digitization procedure for the N-S component of the seismogram of the January 31, 1956 Ilirska Bistrica (Villa del Nevoso in Italian) earthquake, recorded at the GTT station. In the background, the scanned image of a portion of the original smoked paper record; in blue the reference system selected according to the minute marks (M) and the distance between two traces (I). In yellow the sampling points (not equally spaced).
bg817_Sandron senza testine.indd15 15 4-12-2014 11:00:31
I0 = VII-VIII) Carnia; March 18, 1964 (16:43, MW = 4.77, I0 = VI) Ilirska Bistrica. All magnitudes are from CPTI and intensities from the Appendix.
As regards the Vipiteno event we retrieved only the waveforms of the station of Messina and of Porto di Capri but they were not utilizable (the trace was not clear). We obtained no information from the waveform databank about the Monte Baldo earthquake. Also in the cases of the Valdobbiadene and Amaro events we obtained the waveform of the Wiechert instruments of Bologna and Padova stations, but the quality was poor. The same applied to those of the Oropa observatory recordings in the case of the Maniago earthquake. The traces were, however, good for the January 31, 1956 event (Fig. 12 top) recorded by the Göttingen (GTT; see Fig. 13) and Strasbourg (STR) stations. Unfortunately the Wiechert recordings of the Trieste station were saturated. For the April 26, 1959 Carnia earthquake (Fig. 12 bottom) good signals were
Fig. 12 - Scan of the Trieste station bulletins: January 31, 1956 Ilirska Bistrica (Villa del Nevoso in Italian) earthquake (top panel). Attached to the event page there were clippings from the local newspaper that refer to the note at the top right (a) about the nibs skipping: “…the shock was violent that the equipment could not resist, the diagram of the seismograph, in fact, after four short-term fluctuations marks an abrupt halt”. April 26, 1959 Carnia earthquake (bottom panel).
bg817_Sandron senza testine.indd14 14 4-12-2014 11:00:14
Early instrumental seismicity recorded in the eastern Alps Boll. Geof. Teor. Appl., 55, 755-788
769
(Zolla), and San Dorligo della Valle with I=IV. The macroseismic location (CPTI) is 45°33’00” N and 14°16’59” E and, due to the few intensity data points it is equal to the instrumental location. The Trieste station ledger (Fig. 12 top) reports that 60% of the buildings in Ilirska Bistrica (Villa del Nevoso in Italian) were damaged and some damage was also suffered in Ljubljana. A local newspaper reported: “In Ilirska Bistrica … many houses have suffered damage, the major damage is found in the neighbouring villages, where around 95% of houses are damaged” and “the violent shock caused the breaking of water pipes in Ljubljana” (press clippings attached to the TRS station bulletin event page). The localization computed at the TRS station is 45°30’ N and 14°24’ E; it is reported in its ledger together with that by the Bureau Central International de Sismologie (BCIS): 45°30’ N and 14°30’ E (Fig. 12). As regards the magnitude, three figures are available: i) the moment magnitude derived from the macroseismic data (CPTI) MWM=5.14 (±0.34); ii) the moment magnitude derived from the value of MS (CPTI) MWIns=5.12 (±0.37); and iii) the measured value of MS=4.73 (±0.53) provided by Margottini et al. (1993a) based on 4 recordings. In the Slovenian earthquake catalogue (Ribarič, 1982) the event is located at 45°30’ N and 14°16’59” E, the reported epicentral intensity is VII MKS and the macroseismic magnitude is 4.48. According to the relocation of the present study the epicentre is 45°34’48’’ N 14°16’48’’ E, with a distance of 3.3 km with respect to the macroseismic location. The focal depth is 17.6 km. The distance from the epicentre to the nearest station (TRS, whose coordinates are 45°42.5’ N 13°45.8’ E) is 40.7 km (the azimuthal gap being 97˚). Rms is 0.84 s, while Erh and Erz are 1.6 and 2.1 km, respectively.
As regards the April 26, 1959 (15:45 UTC) Carnia event the macroseismic location (CPTI) is 46°29’02” N and 13°01’17” E. The TRS station ledger (Fig. 12 bottom) reports several locations: 46°26’ N and 13°01’ E by the Istituto Nazionale di Geofisica (ROMA in Fig. 12 bottom), 46°30’ N and 13°00’ E by both BCIS and U.S. Coast and Geodetic Survey (USCGS). In the Italian macroseismic database DBMI11 [Locati et al. (2011); http://emidius.mi.ingv.it/DBMI11/, 122 macroseismic intensities are reported, the maximum values are: Zuglio with I=VIII, Formeaso, Paluzza, Sezza with I=VII-VIII. The MW (both MWM and MWIns) is 5.23 (±0.13) (Gruppo di Lavoro
Fig. 15 - Scan of one of the two components of the photographic Wiechert seismogram of the March 18, 1964 Ilirska Bistrica (Villa del Nevoso in Italian) event recorded at the LJU station (courtesy of Ina Cecić). On the right there is a handwritten note with some earthquake parameters.
bg817_Sandron senza testine.indd16 16 4-12-2014 11:00:35
770
Boll. Geof. Teor. Appl., 55, 755-788 Sandron et al.
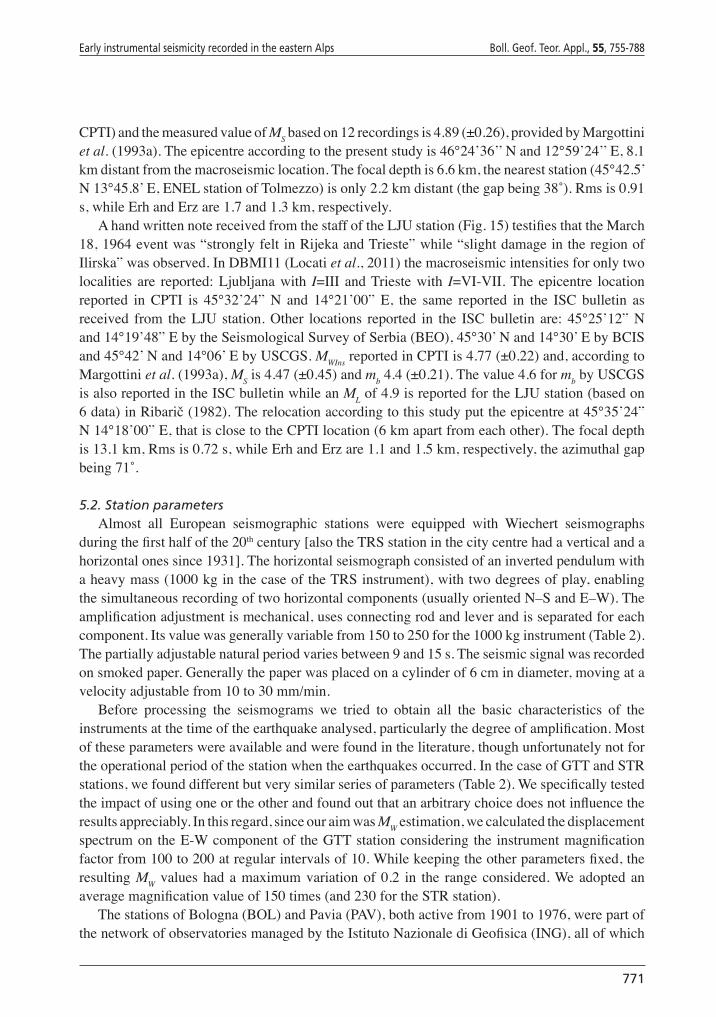
CPTI) and the measured value of MS based on 12 recordings is 4.89 (±0.26), provided by Margottini et al. (1993a). The epicentre according to the present study is 46°24’36’’ N and 12°59’24’’ E, 8.1 km distant from the macroseismic location. The focal depth is 6.6 km, the nearest station (45°42.5’ N 13°45.8’ E, ENEL station of Tolmezzo) is only 2.2 km distant (the gap being 38˚). Rms is 0.91 s, while Erh and Erz are 1.7 and 1.3 km, respectively.
A hand written note received from the staff of the LJU station (Fig. 15) testifies that the March 18, 1964 event was “strongly felt in Rijeka and Trieste” while “slight damage in the region of Ilirska” was observed. In DBMI11 (Locati et al., 2011) the macroseismic intensities for only two localities are reported: Ljubljana with I=III and Trieste with I=VI-VII. The epicentre location reported in CPTI is 45°32’24” N and 14°21’00” E, the same reported in the ISC bulletin as received from the LJU station. Other locations reported in the ISC bulletin are: 45°25’12” N and 14°19’48” E by the Seismological Survey of Serbia (BEO), 45°30’ N and 14°30’ E by BCIS and 45°42’ N and 14°06’ E by USCGS. MWIns reported in CPTI is 4.77 (±0.22) and, according to Margottini et al. (1993a), MS is 4.47 (±0.45) and mb 4.4 (±0.21). The value 4.6 for mb by USCGS is also reported in the ISC bulletin while an ML of 4.9 is reported for the LJU station (based on 6 data) in Ribarič (1982). The relocation according to this study put the epicentre at 45°35’24” N 14°18’00” E, that is close to the CPTI location (6 km apart from each other). The focal depth is 13.1 km, Rms is 0.72 s, while Erh and Erz are 1.1 and 1.5 km, respectively, the azimuthal gap being 71˚.
5.2. Station parametersAlmost all European seismographic stations were equipped with Wiechert seismographs
during the first half of the 20th century [also the TRS station in the city centre had a vertical and a horizontal ones since 1931. The horizontal seismograph consisted of an inverted pendulum with a heavy mass (1000 kg in the case of the TRS instrument), with two degrees of play, enabling the simultaneous recording of two horizontal components (usually oriented N–S and E–W). The amplification adjustment is mechanical, uses connecting rod and lever and is separated for each component. Its value was generally variable from 150 to 250 for the 1000 kg instrument (Table 2). The partially adjustable natural period varies between 9 and 15 s. The seismic signal was recorded on smoked paper. Generally the paper was placed on a cylinder of 6 cm in diameter, moving at a velocity adjustable from 10 to 30 mm/min.
Before processing the seismograms we tried to obtain all the basic characteristics of the instruments at the time of the earthquake analysed, particularly the degree of amplification. Most of these parameters were available and were found in the literature, though unfortunately not for the operational period of the station when the earthquakes occurred. In the case of GTT and STR stations, we found different but very similar series of parameters (Table 2). We specifically tested the impact of using one or the other and found out that an arbitrary choice does not influence the results appreciably. In this regard, since our aim was MW estimation, we calculated the displacement spectrum on the E-W component of the GTT station considering the instrument magnification factor from 100 to 200 at regular intervals of 10. While keeping the other parameters fixed, the resulting MW values had a maximum variation of 0.2 in the range considered. We adopted an average magnification value of 150 times (and 230 for the STR station).
The stations of Bologna (BOL) and Pavia (PAV), both active from 1901 to 1976, were part of the network of observatories managed by the Istituto Nazionale di Geofisica (ING), all of which
bg817_Sandron senza testine.indd17 17 4-12-2014 11:00:35
(Zolla), and San Dorligo della Valle with I=IV. The macroseismic location (CPTI) is 45°33’00” N and 14°16’59” E and, due to the few intensity data points it is equal to the instrumental location. The Trieste station ledger (Fig. 12 top) reports that 60% of the buildings in Ilirska Bistrica (Villa del Nevoso in Italian) were damaged and some damage was also suffered in Ljubljana. A local newspaper reported: “In Ilirska Bistrica … many houses have suffered damage, the major damage is found in the neighbouring villages, where around 95% of houses are damaged” and “the violent shock caused the breaking of water pipes in Ljubljana” (press clippings attached to the TRS station bulletin event page). The localization computed at the TRS station is 45°30’ N and 14°24’ E; it is reported in its ledger together with that by the Bureau Central International de Sismologie (BCIS): 45°30’ N and 14°30’ E (Fig. 12). As regards the magnitude, three figures are available: i) the moment magnitude derived from the macroseismic data (CPTI) MWM=5.14 (±0.34); ii) the moment magnitude derived from the value of MS (CPTI) MWIns=5.12 (±0.37); and iii) the measured value of MS=4.73 (±0.53) provided by Margottini et al. (1993a) based on 4 recordings. In the Slovenian earthquake catalogue (Ribarič, 1982) the event is located at 45°30’ N and 14°16’59” E, the reported epicentral intensity is VII MKS and the macroseismic magnitude is 4.48. According to the relocation of the present study the epicentre is 45°34’48’’ N 14°16’48’’ E, with a distance of 3.3 km with respect to the macroseismic location. The focal depth is 17.6 km. The distance from the epicentre to the nearest station (TRS, whose coordinates are 45°42.5’ N 13°45.8’ E) is 40.7 km (the azimuthal gap being 97˚). Rms is 0.84 s, while Erh and Erz are 1.6 and 2.1 km, respectively.
As regards the April 26, 1959 (15:45 UTC) Carnia event the macroseismic location (CPTI) is 46°29’02” N and 13°01’17” E. The TRS station ledger (Fig. 12 bottom) reports several locations: 46°26’ N and 13°01’ E by the Istituto Nazionale di Geofisica (ROMA in Fig. 12 bottom), 46°30’ N and 13°00’ E by both BCIS and U.S. Coast and Geodetic Survey (USCGS). In the Italian macroseismic database DBMI11 [Locati et al. (2011); http://emidius.mi.ingv.it/DBMI11/, 122 macroseismic intensities are reported, the maximum values are: Zuglio with I=VIII, Formeaso, Paluzza, Sezza with I=VII-VIII. The MW (both MWM and MWIns) is 5.23 (±0.13) (Gruppo di Lavoro
Fig. 15 - Scan of one of the two components of the photographic Wiechert seismogram of the March 18, 1964 Ilirska Bistrica (Villa del Nevoso in Italian) event recorded at the LJU station (courtesy of Ina Cecić). On the right there is a handwritten note with some earthquake parameters.
bg817_Sandron senza testine.indd16 16 4-12-2014 11:00:35
Early instrumental seismicity recorded in the eastern Alps Boll. Geof. Teor. Appl., 55, 755-788
771
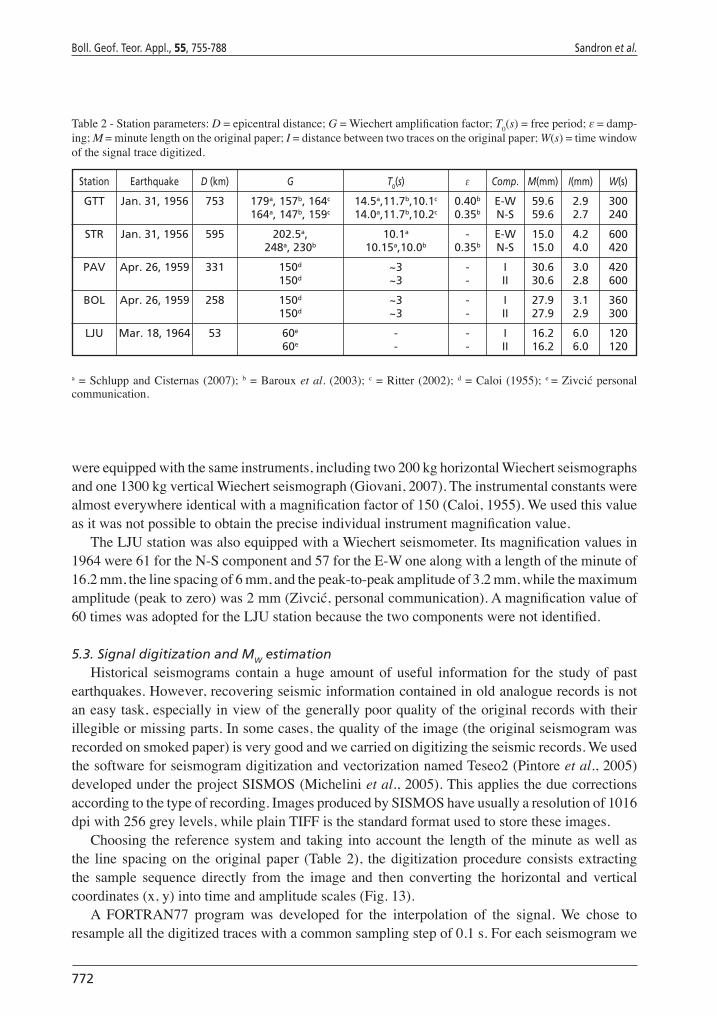
were equipped with the same instruments, including two 200 kg horizontal Wiechert seismographs and one 1300 kg vertical Wiechert seismograph (Giovani, 2007). The instrumental constants were almost everywhere identical with a magnification factor of 150 (Caloi, 1955). We used this value as it was not possible to obtain the precise individual instrument magnification value.
The LJU station was also equipped with a Wiechert seismometer. Its magnification values in 1964 were 61 for the N-S component and 57 for the E-W one along with a length of the minute of 16.2 mm, the line spacing of 6 mm, and the peak-to-peak amplitude of 3.2 mm, while the maximum amplitude (peak to zero) was 2 mm (Zivcić, personal communication). A magnification value of 60 times was adopted for the LJU station because the two components were not identified.
5.3. Signal digitization and MW estimationHistorical seismograms contain a huge amount of useful information for the study of past
earthquakes. However, recovering seismic information contained in old analogue records is not an easy task, especially in view of the generally poor quality of the original records with their illegible or missing parts. In some cases, the quality of the image (the original seismogram was recorded on smoked paper) is very good and we carried on digitizing the seismic records. We used the software for seismogram digitization and vectorization named Teseo2 (Pintore et al., 2005) developed under the project SISMOS (Michelini et al., 2005). This applies the due corrections according to the type of recording. Images produced by SISMOS have usually a resolution of 1016 dpi with 256 grey levels, while plain TIFF is the standard format used to store these images.
Choosing the reference system and taking into account the length of the minute as well as the line spacing on the original paper (Table 2), the digitization procedure consists extracting the sample sequence directly from the image and then converting the horizontal and vertical coordinates (x, y) into time and amplitude scales (Fig. 13).
A FORTRAN77 program was developed for the interpolation of the signal. We chose to resample all the digitized traces with a common sampling step of 0.1 s. For each seismogram we
Table 2 - Station parameters: D = epicentral distance; G = Wiechert amplification factor; T0(s) = free period; ε = damp-ing; M = minute length on the original paper; I = distance between two traces on the original paper; W(s) = time window of the signal trace digitized.
Station Earthquake D (km) G T0(s) ε Comp. M(mm) I(mm) W(s)
GTT Jan. 31, 1956 753 179a, 157b, 164c 14.5a,11.7b,10.1c 0.40b E-W 59.6 2.9 300 164a, 147b, 159c 14.0a,11.7b,10.2c 0.35b N-S 59.6 2.7 240
STR Jan. 31, 1956 595 202.5a, 10.1a - E-W 15.0 4.2 600 248a, 230b 10.15a,10.0b 0.35b N-S 15.0 4.0 420
PAV Apr. 26, 1959 331 150d ~3 - I 30.6 3.0 420 150d ~3 - II 30.6 2.8 600
BOL Apr. 26, 1959 258 150d ~3 - I 27.9 3.1 360 150d ~3 - II 27.9 2.9 300
LJU Mar. 18, 1964 53 60e - - I 16.2 6.0 120 60e - - II 16.2 6.0 120
a = Schlupp and Cisternas (2007); b = Baroux et al. (2003); c = Ritter (2002); d = Caloi (1955); e = Zivcić personal communication.
bg817_Sandron senza testine.indd18 18 4-12-2014 11:00:36
772
Boll. Geof. Teor. Appl., 55, 755-788 Sandron et al.
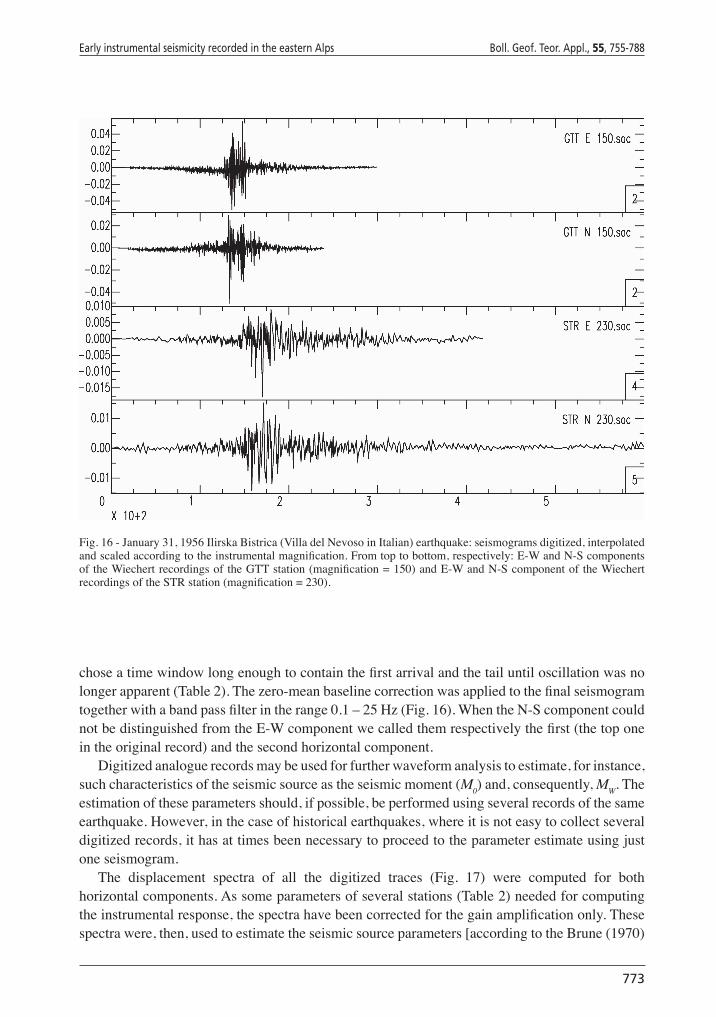
chose a time window long enough to contain the first arrival and the tail until oscillation was no longer apparent (Table 2). The zero-mean baseline correction was applied to the final seismogram together with a band pass filter in the range 0.1 – 25 Hz (Fig. 16). When the N-S component could not be distinguished from the E-W component we called them respectively the first (the top one in the original record) and the second horizontal component.
Digitized analogue records may be used for further waveform analysis to estimate, for instance, such characteristics of the seismic source as the seismic moment (M0) and, consequently, MW. The estimation of these parameters should, if possible, be performed using several records of the same earthquake. However, in the case of historical earthquakes, where it is not easy to collect several digitized records, it has at times been necessary to proceed to the parameter estimate using just one seismogram.
The displacement spectra of all the digitized traces (Fig. 17) were computed for both horizontal components. As some parameters of several stations (Table 2) needed for computing the instrumental response, the spectra have been corrected for the gain amplification only. These spectra were, then, used to estimate the seismic source parameters [according to the Brune (1970)
Fig. 16 - January 31, 1956 Ilirska Bistrica (Villa del Nevoso in Italian) earthquake: seismograms digitized, interpolated and scaled according to the instrumental magnification. From top to bottom, respectively: E-W and N-S components of the Wiechert recordings of the GTT station (magnification = 150) and E-W and N-S component of the Wiechert recordings of the STR station (magnification = 230).
bg817_Sandron senza testine.indd19 19 4-12-2014 11:00:37
were equipped with the same instruments, including two 200 kg horizontal Wiechert seismographs and one 1300 kg vertical Wiechert seismograph (Giovani, 2007). The instrumental constants were almost everywhere identical with a magnification factor of 150 (Caloi, 1955). We used this value as it was not possible to obtain the precise individual instrument magnification value.
The LJU station was also equipped with a Wiechert seismometer. Its magnification values in 1964 were 61 for the N-S component and 57 for the E-W one along with a length of the minute of 16.2 mm, the line spacing of 6 mm, and the peak-to-peak amplitude of 3.2 mm, while the maximum amplitude (peak to zero) was 2 mm (Zivcić, personal communication). A magnification value of 60 times was adopted for the LJU station because the two components were not identified.
5.3. Signal digitization and MW estimationHistorical seismograms contain a huge amount of useful information for the study of past
earthquakes. However, recovering seismic information contained in old analogue records is not an easy task, especially in view of the generally poor quality of the original records with their illegible or missing parts. In some cases, the quality of the image (the original seismogram was recorded on smoked paper) is very good and we carried on digitizing the seismic records. We used the software for seismogram digitization and vectorization named Teseo2 (Pintore et al., 2005) developed under the project SISMOS (Michelini et al., 2005). This applies the due corrections according to the type of recording. Images produced by SISMOS have usually a resolution of 1016 dpi with 256 grey levels, while plain TIFF is the standard format used to store these images.
Choosing the reference system and taking into account the length of the minute as well as the line spacing on the original paper (Table 2), the digitization procedure consists extracting the sample sequence directly from the image and then converting the horizontal and vertical coordinates (x, y) into time and amplitude scales (Fig. 13).
A FORTRAN77 program was developed for the interpolation of the signal. We chose to resample all the digitized traces with a common sampling step of 0.1 s. For each seismogram we
Table 2 - Station parameters: D = epicentral distance; G = Wiechert amplification factor; T0(s) = free period; ε = damp-ing; M = minute length on the original paper; I = distance between two traces on the original paper; W(s) = time window of the signal trace digitized.
Station Earthquake D (km) G T0(s) ε Comp. M(mm) I(mm) W(s)
GTT Jan. 31, 1956 753 179a, 157b, 164c 14.5a,11.7b,10.1c 0.40b E-W 59.6 2.9 300 164a, 147b, 159c 14.0a,11.7b,10.2c 0.35b N-S 59.6 2.7 240
STR Jan. 31, 1956 595 202.5a, 10.1a - E-W 15.0 4.2 600 248a, 230b 10.15a,10.0b 0.35b N-S 15.0 4.0 420
PAV Apr. 26, 1959 331 150d ~3 - I 30.6 3.0 420 150d ~3 - II 30.6 2.8 600
BOL Apr. 26, 1959 258 150d ~3 - I 27.9 3.1 360 150d ~3 - II 27.9 2.9 300
LJU Mar. 18, 1964 53 60e - - I 16.2 6.0 120 60e - - II 16.2 6.0 120
a = Schlupp and Cisternas (2007); b = Baroux et al. (2003); c = Ritter (2002); d = Caloi (1955); e = Zivcić personal communication.
bg817_Sandron senza testine.indd18 18 4-12-2014 11:00:36
Early instrumental seismicity recorded in the eastern Alps Boll. Geof. Teor. Appl., 55, 755-788
773
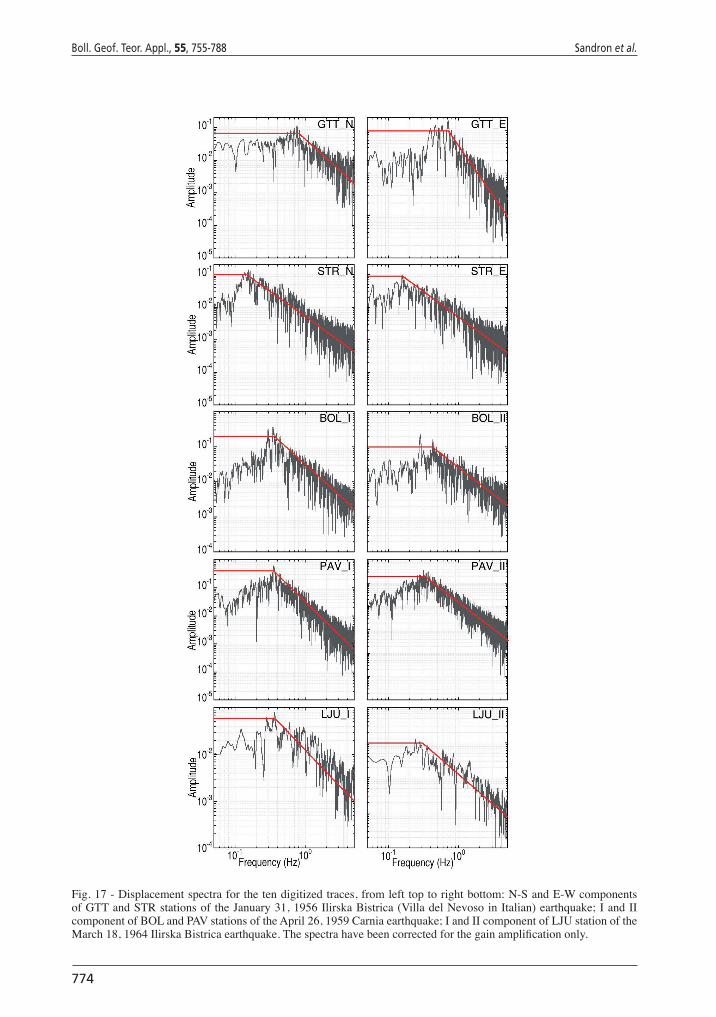
Fig. 17 - Displacement spectra for the ten digitized traces, from left top to right bottom: N-S and E-W components of GTT and STR stations of the January 31, 1956 Ilirska Bistrica (Villa del Nevoso in Italian) earthquake; I and II component of BOL and PAV stations of the April 26, 1959 Carnia earthquake; I and II component of LJU station of the March 18, 1964 Ilirska Bistrica earthquake. The spectra have been corrected for the gain amplification only.
bg817_Sandron senza testine.indd20 20 4-12-2014 11:00:38
774
Boll. Geof. Teor. Appl., 55, 755-788 Sandron et al.
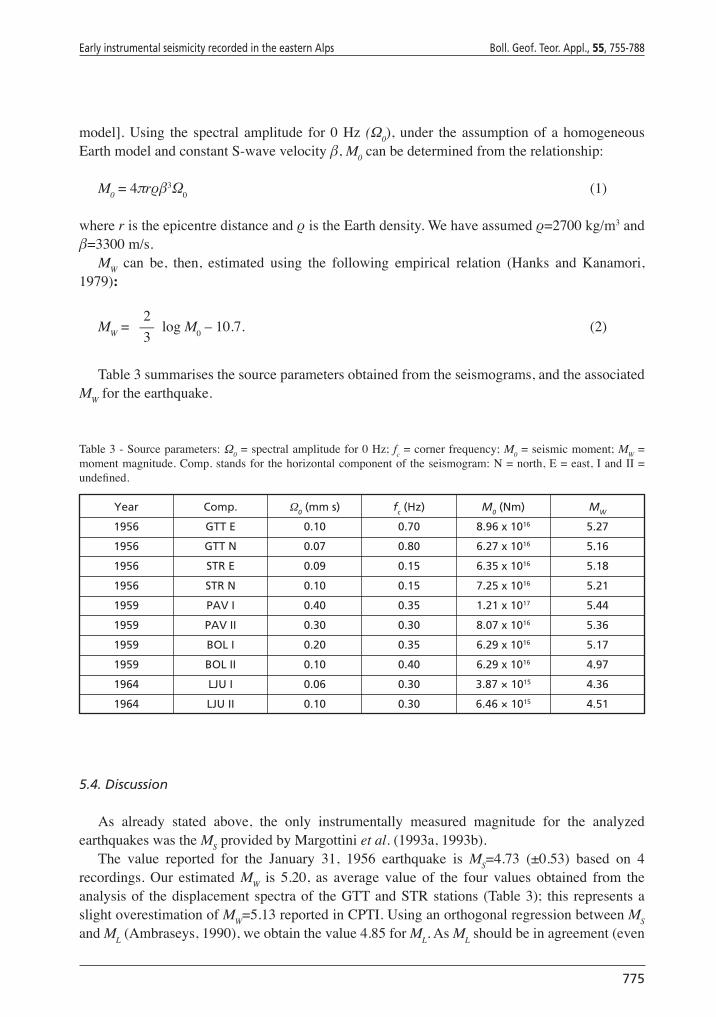
model. Using the spectral amplitude for 0 Hz (Ω0), under the assumption of a homogeneous Earth model and constant S-wave velocity β, M0 can be determined from the relationship:
M0 = 4πrρβ3Ω0 (1)
where r is the epicentre distance and ρ is the Earth density. We have assumed ρ=2700 kg/m3 and β=3300 m/s.
MW can be, then, estimated using the following empirical relation (Hanks and Kanamori, 1979):
2MW = –– log M0 – 10.7. (2) 3
Table 3 summarises the source parameters obtained from the seismograms, and the associated MW for the earthquake.
Table 3 - Source parameters: Ω0 = spectral amplitude for 0 Hz; fc = corner frequency; M0 = seismic moment; MW = moment magnitude. Comp. stands for the horizontal component of the seismogram: N = north, E = east, I and II = undefined.
Year Comp. Ω0 (mm s) fc (Hz) M0 (Nm) MW
1956 GTT E 0.10 0.70 8.96 x 10¹⁶ 5.27
1956 GTT N 0.07 0.80 6.27 x 10¹⁶ 5.16
1956 STR E 0.09 0.15 6.35 x 10¹⁶ 5.18
1956 STR N 0.10 0.15 7.25 x 10¹⁶ 5.21
1959 PAV I 0.40 0.35 1.21 x 10¹⁷ 5.44
1959 PAV II 0.30 0.30 8.07 x 10¹⁶ 5.36
1959 BOL I 0.20 0.35 6.29 x 10¹⁶ 5.17
1959 BOL II 0.10 0.40 6.29 x 10¹⁶ 4.97
1964 LJU I 0.06 0.30 3.87 × 10¹⁵ 4.36
1964 LJU II 0.10 0.30 6.46 × 10¹⁵ 4.51
5.4. Discussion
As already stated above, the only instrumentally measured magnitude for the analyzed earthquakes was the MS provided by Margottini et al. (1993a, 1993b).
The value reported for the January 31, 1956 earthquake is MS=4.73 (±0.53) based on 4 recordings. Our estimated MW is 5.20, as average value of the four values obtained from the analysis of the displacement spectra of the GTT and STR stations (Table 3); this represents a slight overestimation of MW=5.13 reported in CPTI. Using an orthogonal regression between MS and ML (Ambraseys, 1990), we obtain the value 4.85 for ML. As ML should be in agreement (even
bg817_Sandron senza testine.indd21 21 4-12-2014 11:00:39
Fig. 17 - Displacement spectra for the ten digitized traces, from left top to right bottom: N-S and E-W components of GTT and STR stations of the January 31, 1956 Ilirska Bistrica (Villa del Nevoso in Italian) earthquake; I and II component of BOL and PAV stations of the April 26, 1959 Carnia earthquake; I and II component of LJU station of the March 18, 1964 Ilirska Bistrica earthquake. The spectra have been corrected for the gain amplification only.
bg817_Sandron senza testine.indd20 20 4-12-2014 11:00:38
Early instrumental seismicity recorded in the eastern Alps Boll. Geof. Teor. Appl., 55, 755-788
775
equivalent) with MW in the magnitude range 4.0 to 6.0 (Kanamori, 1983), our estimate is, once again 0.35 higher.
The MS of the April 26, 1959 earthquake is 4.89 (±0.26), based on 12 recordings (Margottini et al., 1993a). In the same paper, for the sake of completeness, mB=5.6, based on 1 recording is also reported. The average value calculated in this study is MW=5.24 (Table 3): it is perfectly consistent with the 5.23 reported in CPTI, while, by applying the scaling law between MS and ML (Ambraseys, 1990), the lower value 4.97 for ML (equivalent to MW) is obtained. By applying a double transformation [mB to mb and then mb to ML; Ambraseys (1990), from mB=5.6 we obtain a value of ML of 5.12, slightly lower than the MW value calculated in this study.
For the March 18, 1964 earthquake, Margottini et al. (1993a) report the values MS=4.47 (±0.45) and mb=4.40 (±0.21), based on 3 and 4 recordings, respectively, and the value ML=4.65 is obtained by applying the Ambraseys (1990) formula. We recomputed the duration of the recordings of the two horizontal Benioff short-period components of the TRI station (both about 452 s). Applying the formula by Rebez et al. (1984) we obtained a value of MD of 4.53. With the Gasperini (2002) regression formula between MD and ML, calibrated for the whole of the Italian territory, we obtained ML=4.53 and 4.63, taking into account whether or not the correction station, respectively. Our MW of 4.44 (Table 3) seems to be an underestimation with respect the value MW=4.77 reported in CPTI.
6. Conclusions
A review was carried out of the data recorded by the Trieste station before the occurrence of the strong May 6, 1976 Friuli earthquake. A catalogue of 375 records is our complete and definitive database for the early instrumental seismicity in north-eastern Italy from October 30, 1901 to May 5, 1976 (the day before the strong Friuli earthquake). This result has been obtained after long and careful re-reading of old seismograms found in archives of the research and religious institutions. Data comes from 1) a second reading of the seismic phases, 2) bulletins of seismological stations, and 3) ISC bulletins. The catalogue cannot in any case be considered a complete data set for the seismicity of the eastern Alps because events not recorded by the Trieste station have not been considered in the processing that has been carried out. A complete data set should also take into account local events recorded only by Austrian and/or Slovenian stations.
The digitization of analogue historical seismograms allowed us to recover seismic information contained in old records. This is particularly important in zones with a low to moderate seismicity associated with seismogenic sources with medium to long recurrence intervals. In addition to this, digitized records can be included in a database of old seismograms so that they can be used by several researchers. They will improve the studies about the spectral characteristics and the source parameters of less active sources, permitting comparison with recent results (where they exist).
The estimation of the seismic moment for old earthquakes still presents large uncertainties, in particular for those in the first quarter of the 20th century, due to the reduced number (and often the poor quality) of available seismograms.
These kinds of studies should however be persisted with because they provide a useful contribution to the improvement of seismic hazard assessment in many regions of the world. To prove this, the estimated MW that obtained for the three earthquakes analyzed, dating the second
bg817_Sandron senza testine.indd22 22 4-12-2014 11:00:39
776
Boll. Geof. Teor. Appl., 55, 755-788 Sandron et al.
half of the 20th century, are fully comparable with the data available. This even though there is still discussion on M0 evaluation as well as between the different magnitude scales even for recent instrumental earthquakes.
Acknowledgements. Many thanks are due to Ina Cecić and Mladen Zivcić, Agencija RS za Okolje Ljubljana, who provided us with the information on the March 18, 1964 earthquake recorded in Ljubljana and on the Wiechert seismograph, as well also to Graziano Ferrari, I.N.G.V. Rome, who provided us with the SISMOS seismograms. The paper benefited by a painstaking review accomplished by Mladen Zivcić and an anonymous referee and by the careful control of the English text done by Giorgia Rivoira, OGS.
REFERENCES
Albini P., Bellettati D., Camassi R., Moroni A., Stucchi M. and Zerga A. (eds); 1994: Revisione dei terremoti di interesse per il territorio della Provincia di Trento. Rapporto tecnico per la Provincia Autonoma di Trento, Milano, IRRS - CNR, Milano, Italy, 210 pp.
Ambraseys N.N.; 1990: Uniform magnitude re-evaluation of European earthquakes associated with strong-motion records. Earthquake Eng. Struct. Dyn., 19, 1-20.
Archivio Macrosismico GNDT; 1995: Studi preliminari di terremoti attraverso i repertori sismologici. GNDT, Milano, Italy.
Barbano M.S., Riggio A.M., Catalan T., Sclippa P. and Toffoli D.; 1990: Revisione di alcuni terremoti dell’Italia nord-orientale nella prima metà del XX secolo. Rapporto interno, GNDT, Udine, Italy, 349 pp.
Baroux E., Pino N.A., Valensise G., Scotti O. and Cushing M.E.; 2003: Source parameters of the 11 June 1909, Lambesc (Provence, south eastern France) earthquake: a reappraisal based on macroseismic, seismological, and geodetic observations. J. Geophys. Res., 108, doi:10.1029/2002JB002348.
Böhm C.A.; 1998: 250 anni di astronomia a Trieste. MGS Press, Trieste, Italy, 121 pp.Bolt B.A. and Turcotte T.; 1964. Computer location of local earthquakes within the Berkeley seismographic network.
In: Parks G.A. (ed), Computers in the Mineral Industries, Stanford University, Stanford, California, U.S.A., pp. 561-576.
Brune J.N.; 1970: Tectonic stress and the spectra of shear waves from earthquakes. J. Geophys. Res., 75, 4997-5009.Caloi P.; 1955: Ci,j. Ann. Geofis., 8, 293-313. doi:10.4401/ag-5676. Carrozzo M. T., De Visintini G., Giorgetti F. and Iaccarino E.; 1973: General catalogue of Italian earthquakes. RT/
PROT(73) 12, Comitato Nazionale Energia Nucleare, Roma, Italy, 212 pp.Carulli G.B. and Slejko D.; 2005: The 1976 Friuli (NE Italy) earthquake. Giornale di Geologia Applicata, 1, 147-156,
doi:10.1474/GGA.2005-01.0-15.0015.Cavasino A.; 1935: I terremoti d’Italia nel trentacinquennio 1900-1933. IPS, Roma, Italy, 266 pp.Cvijanovic D.; 1986: Earthquake catalogue of Croatia. Computer file, Zagreb.De Panfilis M.; 1959: Attività sismica in Italia (1953-1957). Ann. Geof., 12, 117-121.ENEL; 1985: Studi e indagini per l’accertamento della idoneità tecnica delle aree suscettibili di insediamento di
impianti nucleari per le Regioni Piemonte, Lombardia e Puglia. Indagini di sismica storica presentata da ISMES-SGA. Rapporti Tecnici in 42 volumi, Roma, <http://emidius.mi.ingv.it/DOM/consultazione.html>.
Feliziani P. and Marcelli L.; 1965: Il terremoto di Tolmezzo del 16 aprile 1959. Venti secoli di storia sismica della regione carnica e dell’Italia Nord Orientale – I parte. Ann. Geof., 18(3), 165-208.
Finetti I., Russi M. and Slejko D.; 1979: The Friuli earthquake (1976-1977). Tectonophysics, 53, 261-272.Gasperini P.; 2002: Local magnitude revaluation for recent Italian earthquakes (1981-1996). J. Seismol., 6, 503-524.Giovani L.; 2007: Pratica Sismologica negli Osservatori Tradizionali - Osservatorio Sismico Centrale Monte Porzio
Catone. Rapporto Tecnico n. 39, INGV, Roma, 58 pp.Gruppo di Lavoro CPTI; 1999: Catalogo Parametrico dei Terremoti Italiani, versione 1 (CPTI99). ING-GNDT-SGA-
SSN, Bologna, Italy, 92 pp.Gruppo di Lavoro CPTI; 2004: Catalogo Parametrico dei Terremoti Italiani, versione 2004 (CPTI04). INGV, Bologna,
Italy, doi: 10.6092/INGV.IT-CPTI04.
bg817_Sandron senza testine.indd23 23 4-12-2014 11:00:39
equivalent) with MW in the magnitude range 4.0 to 6.0 (Kanamori, 1983), our estimate is, once again 0.35 higher.
The MS of the April 26, 1959 earthquake is 4.89 (±0.26), based on 12 recordings (Margottini et al., 1993a). In the same paper, for the sake of completeness, mB=5.6, based on 1 recording is also reported. The average value calculated in this study is MW=5.24 (Table 3): it is perfectly consistent with the 5.23 reported in CPTI, while, by applying the scaling law between MS and ML (Ambraseys, 1990), the lower value 4.97 for ML (equivalent to MW) is obtained. By applying a double transformation [mB to mb and then mb to ML; Ambraseys (1990), from mB=5.6 we obtain a value of ML of 5.12, slightly lower than the MW value calculated in this study.
For the March 18, 1964 earthquake, Margottini et al. (1993a) report the values MS=4.47 (±0.45) and mb=4.40 (±0.21), based on 3 and 4 recordings, respectively, and the value ML=4.65 is obtained by applying the Ambraseys (1990) formula. We recomputed the duration of the recordings of the two horizontal Benioff short-period components of the TRI station (both about 452 s). Applying the formula by Rebez et al. (1984) we obtained a value of MD of 4.53. With the Gasperini (2002) regression formula between MD and ML, calibrated for the whole of the Italian territory, we obtained ML=4.53 and 4.63, taking into account whether or not the correction station, respectively. Our MW of 4.44 (Table 3) seems to be an underestimation with respect the value MW=4.77 reported in CPTI.
6. Conclusions
A review was carried out of the data recorded by the Trieste station before the occurrence of the strong May 6, 1976 Friuli earthquake. A catalogue of 375 records is our complete and definitive database for the early instrumental seismicity in north-eastern Italy from October 30, 1901 to May 5, 1976 (the day before the strong Friuli earthquake). This result has been obtained after long and careful re-reading of old seismograms found in archives of the research and religious institutions. Data comes from 1) a second reading of the seismic phases, 2) bulletins of seismological stations, and 3) ISC bulletins. The catalogue cannot in any case be considered a complete data set for the seismicity of the eastern Alps because events not recorded by the Trieste station have not been considered in the processing that has been carried out. A complete data set should also take into account local events recorded only by Austrian and/or Slovenian stations.
The digitization of analogue historical seismograms allowed us to recover seismic information contained in old records. This is particularly important in zones with a low to moderate seismicity associated with seismogenic sources with medium to long recurrence intervals. In addition to this, digitized records can be included in a database of old seismograms so that they can be used by several researchers. They will improve the studies about the spectral characteristics and the source parameters of less active sources, permitting comparison with recent results (where they exist).
The estimation of the seismic moment for old earthquakes still presents large uncertainties, in particular for those in the first quarter of the 20th century, due to the reduced number (and often the poor quality) of available seismograms.
These kinds of studies should however be persisted with because they provide a useful contribution to the improvement of seismic hazard assessment in many regions of the world. To prove this, the estimated MW that obtained for the three earthquakes analyzed, dating the second
bg817_Sandron senza testine.indd22 22 4-12-2014 11:00:39
Early instrumental seismicity recorded in the eastern Alps Boll. Geof. Teor. Appl., 55, 755-788
777
Guidoboni E., Ferrari G., Mariotti D., Comastri A., Tarabusi G. and Valensise G.; 2007: CFTI4Med, Catalogue of strong earthquakes in Italy (461 B.C.-1997) and Mediterranean area (760 B.C.-1500). INGV-SGA Bologna, Italy, 644 pp.
Hanks T.C. and Kanamori H.; 1979: A moment magnitude scale. J. Geophys. Res., 84, 2348-2350.Herak M., Herak D. and Markusic S.; 1996: Revision of the earthquake catalogue and seismicity of Croatia, 1908-1992.
Terra Nova, 8, 86-94.Iaccarino E. and Molin D.; 1978: Raccolta di notizie macrosismiche dell’Italia Nord-orientale dall’anno 0 all’anno
1976. RT/disp (78)/7, Comitato Nazionale Energia Nucleare, Roma, Italy, 65 pp.ISC; 2011: International Seismological Centre, On-line Bulletin. Internatl. Seis. Cent., Thatcham, United Kingdom,
<http://www.isc.ac.uk>.Kanamori I.; 1983: Magnitude scale and quantification of earthquakes. Tectonophysics, 93, 185-199.Karnik V.; 1969: Seismicity of the European area /I. Reidel Publ. Co., Dordrecht, 364 pp.Karnik V.; 1971: Seismicity of the European area /II. Reidel Publ. Co., Dordrecht, 218 pp. Lee W.H.K. and Lahr J.C.; 1975: HYPO71 (revised): a computer program for determining hypocenter, magnitude
and first motion pattern of local earthquakes. Open file report 75-311, U.S. Geological Survey, Menlo Park, CA, U.S.A., 113 pp.
Lee W.H.K. and Stewart S.W.; 1981: Principles and applications of microearthquake networks. Academic Press, New York, NY, USA, 293 pp.
Locati M., Camassi R. and Stucchi M. (eds); 2011: DBMI11, the 2011 version of the Italian macroseismic database. Milano, Bologna, <http://emidius.mi.ingv.it/DBMI11>, doi: 10.6092/INGV.IT-DBMI11.
Malaroda R. and Raimondi C.; 1957: Linee di dislocazione e sismicità in Italia. Bollettino di Geodesia e Scienze Affini, 16(3), 273-323.
Margottini C., Ambraseys N.N. and Screpanti A.; 1993a: La magnitudo dei terremoti italiani del XX Secolo. ENEA, Roma, Italy, 57 pp.
Margottini C., Martini G. and Slejko D.; 1991: An instrumental earthquake catalogue for northeastern Italy since 1900. RT/AMB/90/38, ENEA, Roma, 52 pp.
Margottini C., Martini G. and Slejko D.; 1993b: Instrumental seismological data since 1900 for northeastern Italy. Eart. Eng. Struct. Dyn., 22, 1017-1030.
Michelini A., De Simoni B., Amato A. and Boschi E.; 2005: Collection, digitization and distribution of historical seismological data at INGV. EOS Trans. Am. Geophys. Union, 86, 261-266.
Pintore S., Quintiliani M. and Franceschi D.; 2005: Teseo: a vectoriser of historical seismograms. Comput. Geosci., 31, 1277-1285.
Poli M.E., Peruzza L., Rebez A., Renner G., Slejko D. and Zanferrari A.; 2002: New seismotectonic evidence from the analysis of the 1976-1977 and 1977-1999 seismicity in Friuli (NE Italy). Boll. Geof. Teor. Appl., 43, 53-78.
Postpischl D.; 1985: Catalogo dei terremoti italiani dall’anno 1000 al 1980. Quaderni della Ricerca Scientifica, 114, 2B, Bologna, 239 pp.
Rebez A.; 2012: HAREIA: Relazione conclusiva. OGS Internal report 2012/28 CRS 8, OGS, Trieste, Italy, 15 pp,2012/28 CRS 8, OGS, Trieste, Italy, 15 pp, <http://rtweb.units.it/index.php?option =com_content&view =article&id=62&Itemid=109>.
Rebez A., Renner G. and Slejko D.; 1984: Calcolo della magnitudo locale da durata per la stazione sismologica di Trieste. In: Finalità ed Esperienze della Rete Sismometrica del Friuli-Venezia Giulia, Reg. Aut. Friuli-Venezia Giulia, Trieste, Italy, pp. 29-38.
Regio Ufficio Centrale di Meteorologia e di Geofisica; 1926: Bollettino sismico 1917 - 1926. Roma, Italy, 129 pp.Ribarič V.; 1982: Seismicity of Slovenia. Catalogue of earthquakes (792 A.D. - 1981). Publications of the Seismological
Survey of the SR of Slovenia, Ljubljana, Slovenia, 649 pp.Riggio A. and Russi M.; 1984: Procedura di analisi ed elaborazione dei dati registrati da reti sismometriche locali. In:
Finalità ed Esperienze della Rete Sismometrica del Friuli-Venezia Giulia, Reg. Aut. Friuli-Venezia Giulia, Trieste, Italy, pp. 53-74.
Ritter J.R.R.; 2002: On the recording characteristics of the original Wiechert seismographs at Göttingen (Germany). J. Seismol., 6, 477-486.
Rovida A., Camassi R., Gasperini P. and Stucchi M. (a cura di); 2011: CPTI11, la versione 2011 del Catalogo Parametrico dei Terremoti Italiani. INGV, Milano - Bologna, Italy, 30 pp.
bg817_Sandron senza testine.indd24 24 4-12-2014 11:00:40
778
Boll. Geof. Teor. Appl., 55, 755-788 Sandron et al.
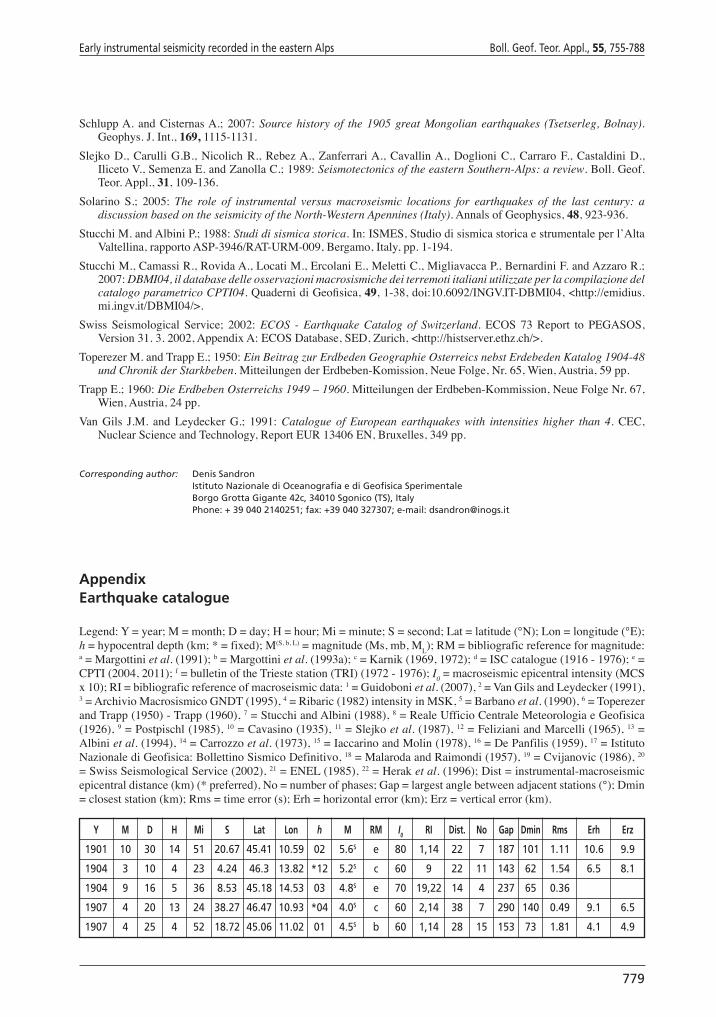
Schlupp A. and Cisternas A.; 2007: Source history of the 1905 great Mongolian earthquakes (Tsetserleg, Bolnay). Geophys. J. Int., 169, 1115-1131.
Slejko D., Carulli G.B., Nicolich R., Rebez A., Zanferrari A., Cavallin A., Doglioni C., Carraro F., Castaldini D., Iliceto V., Semenza E. and Zanolla C.; 1989: Seismotectonics of the eastern Southern-Alps: a review. Boll. Geof. Teor. Appl., 31, 109-136.
Solarino S.; 2005: The role of instrumental versus macroseismic locations for earthquakes of the last century: a discussion based on the seismicity of the North-Western Apennines (Italy). Annals of Geophysics, 48, 923-936.
Stucchi M. and Albini P.; 1988: Studi di sismica storica. In: ISMES, Studio di sismica storica e strumentale per l’Alta Valtellina, rapporto ASP-3946/RAT-URM-009, Bergamo, Italy, pp. 1-194.
Stucchi M., Camassi R., Rovida A., Locati M., Ercolani E., Meletti C., Migliavacca P., Bernardini F. and Azzaro R.; 2007: DBMI04, il database delle osservazioni macrosismiche dei terremoti italiani utilizzate per la compilazione del catalogo parametrico CPTI04. Quaderni di Geofisica, 49, 1-38, doi:10.6092/INGV.IT-DBMI04, <http://emidius.mi.ingv.it/DBMI04/>.
Swiss Seismological Service; 2002: ECOS - Earthquake Catalog of Switzerland. ECOS 73 Report to PEGASOS, Version 31. 3. 2002, Appendix A: ECOS Database, SED, Zurich, <http://histserver.ethz.ch/>.
Toperezer M. and Trapp E.; 1950: Ein Beitrag zur Erdbeden Geographie Osterreics nebst Erdebeden Katalog 1904-48 und Chronik der Starkbeben. Mitteilungen der Erdbeben-Komission, Neue Folge, Nr. 65, Wien, Austria, 59 pp.
Trapp E.; 1960: Die Erdbeben Osterreichs 1949 – 1960. Mitteilungen der Erdbeben-Kommission, Neue Folge Nr. 67, Wien, Austria, 24 pp.
Van Gils J.M. and Leydecker G.; 1991: Catalogue of European earthquakes with intensities higher than 4. CEC, Nuclear Science and Technology, Report EUR 13406 EN, Bruxelles, 349 pp.
Corresponding author: Denis Sandron Istituto Nazionale di Oceanografia e di Geofisica Sperimentale Borgo Grotta Gigante 42c, 34010 Sgonico (TS), Italy Phone: + 39 040 2140251; fax: +39 040 327307; e-mail: [email protected]
AppendixEarthquake catalogue
Legend: Y = year; M = month; D = day; H = hour; Mi = minute; S = second; Lat = latitude (°N); Lon = longitude (°E); h = hypocentral depth (km; * = fixed); M(S, b, L) = magnitude (Ms, mb, ML); RM = bibliografic reference for magnitude: a = Margottini et al. (1991); b = Margottini et al. (1993a); c = Karnik (1969, 1972); d = ISC catalogue (1916 - 1976); e = CPTI (2004, 2011); f = bulletin of the Trieste station (TRI) (1972 - 1976); I0 = macroseismic epicentral intensity (MCS x 10); RI = bibliografic reference of macroseismic data: 1 = Guidoboni et al. (2007), 2 = Van Gils and Leydecker (1991), 3 = Archivio Macrosismico GNDT (1995), 4 = Ribaric (1982) intensity in MSK, 5 = Barbano et al. (1990), 6 = Toperezer and Trapp (1950) - Trapp (1960), 7 = Stucchi and Albini (1988), 8 = Reale Ufficio Centrale Meteorologia e Geofisica (1926), 9 = Postpischl (1985), 10 = Cavasino (1935), 11 = Slejko et al. (1987), 12 = Feliziani and Marcelli (1965), 13 = Albini et al. (1994), 14 = Carrozzo et al. (1973), 15 = Iaccarino and Molin (1978), 16 = De Panfilis (1959), 17 = Istituto Nazionale di Geofisica: Bollettino Sismico Definitivo, 18 = Malaroda and Raimondi (1957), 19 = Cvijanovic (1986), 20 = Swiss Seismological Service (2002), 21 = ENEL (1985), 22 = Herak et al. (1996); Dist = instrumental-macroseismic epicentral distance (km) (* preferred), No = number of phases; Gap = largest angle between adjacent stations (°); Dmin = closest station (km); Rms = time error (s); Erh = horizontal error (km); Erz = vertical error (km).
Y M D H Mi S Lat Lon h M RM I0 RI Dist. No Gap Dmin Rms Erh Erz
1901 10 30 14 51 20.67 45.41 10.59 02 5.6S e 80 1,14 22 7 187 101 1.11 10.6 9.9
1904 3 10 4 23 4.24 46.3 13.82 *12 5.2S c 60 9 22 11 143 62 1.54 6.5 8.1
1904 9 16 5 36 8.53 45.18 14.53 03 4.8S e 70 19,22 14 4 237 65 0.36
1907 4 20 13 24 38.27 46.47 10.93 *04 4.0S c 60 2,14 38 7 290 140 0.49 9.1 6.5
1907 4 25 4 52 18.72 45.06 11.02 01 4.5S b 60 1,14 28 15 153 73 1.81 4.1 4.9
bg817_Sandron senza testine.indd25 25 4-12-2014 11:00:40
Guidoboni E., Ferrari G., Mariotti D., Comastri A., Tarabusi G. and Valensise G.; 2007: CFTI4Med, Catalogue of strong earthquakes in Italy (461 B.C.-1997) and Mediterranean area (760 B.C.-1500). INGV-SGA Bologna, Italy, 644 pp.
Hanks T.C. and Kanamori H.; 1979: A moment magnitude scale. J. Geophys. Res., 84, 2348-2350.Herak M., Herak D. and Markusic S.; 1996: Revision of the earthquake catalogue and seismicity of Croatia, 1908-1992.
Terra Nova, 8, 86-94.Iaccarino E. and Molin D.; 1978: Raccolta di notizie macrosismiche dell’Italia Nord-orientale dall’anno 0 all’anno
1976. RT/disp (78)/7, Comitato Nazionale Energia Nucleare, Roma, Italy, 65 pp.ISC; 2011: International Seismological Centre, On-line Bulletin. Internatl. Seis. Cent., Thatcham, United Kingdom,
<http://www.isc.ac.uk>.Kanamori I.; 1983: Magnitude scale and quantification of earthquakes. Tectonophysics, 93, 185-199.Karnik V.; 1969: Seismicity of the European area /I. Reidel Publ. Co., Dordrecht, 364 pp.Karnik V.; 1971: Seismicity of the European area /II. Reidel Publ. Co., Dordrecht, 218 pp. Lee W.H.K. and Lahr J.C.; 1975: HYPO71 (revised): a computer program for determining hypocenter, magnitude
and first motion pattern of local earthquakes. Open file report 75-311, U.S. Geological Survey, Menlo Park, CA, U.S.A., 113 pp.
Lee W.H.K. and Stewart S.W.; 1981: Principles and applications of microearthquake networks. Academic Press, New York, NY, USA, 293 pp.
Locati M., Camassi R. and Stucchi M. (eds); 2011: DBMI11, the 2011 version of the Italian macroseismic database. Milano, Bologna, <http://emidius.mi.ingv.it/DBMI11>, doi: 10.6092/INGV.IT-DBMI11.
Malaroda R. and Raimondi C.; 1957: Linee di dislocazione e sismicità in Italia. Bollettino di Geodesia e Scienze Affini, 16(3), 273-323.
Margottini C., Ambraseys N.N. and Screpanti A.; 1993a: La magnitudo dei terremoti italiani del XX Secolo. ENEA, Roma, Italy, 57 pp.
Margottini C., Martini G. and Slejko D.; 1991: An instrumental earthquake catalogue for northeastern Italy since 1900. RT/AMB/90/38, ENEA, Roma, 52 pp.
Margottini C., Martini G. and Slejko D.; 1993b: Instrumental seismological data since 1900 for northeastern Italy. Eart. Eng. Struct. Dyn., 22, 1017-1030.
Michelini A., De Simoni B., Amato A. and Boschi E.; 2005: Collection, digitization and distribution of historical seismological data at INGV. EOS Trans. Am. Geophys. Union, 86, 261-266.
Pintore S., Quintiliani M. and Franceschi D.; 2005: Teseo: a vectoriser of historical seismograms. Comput. Geosci., 31, 1277-1285.
Poli M.E., Peruzza L., Rebez A., Renner G., Slejko D. and Zanferrari A.; 2002: New seismotectonic evidence from the analysis of the 1976-1977 and 1977-1999 seismicity in Friuli (NE Italy). Boll. Geof. Teor. Appl., 43, 53-78.
Postpischl D.; 1985: Catalogo dei terremoti italiani dall’anno 1000 al 1980. Quaderni della Ricerca Scientifica, 114, 2B, Bologna, 239 pp.
Rebez A.; 2012: HAREIA: Relazione conclusiva. OGS Internal report 2012/28 CRS 8, OGS, Trieste, Italy, 15 pp,2012/28 CRS 8, OGS, Trieste, Italy, 15 pp, <http://rtweb.units.it/index.php?option =com_content&view =article&id=62&Itemid=109>.
Rebez A., Renner G. and Slejko D.; 1984: Calcolo della magnitudo locale da durata per la stazione sismologica di Trieste. In: Finalità ed Esperienze della Rete Sismometrica del Friuli-Venezia Giulia, Reg. Aut. Friuli-Venezia Giulia, Trieste, Italy, pp. 29-38.
Regio Ufficio Centrale di Meteorologia e di Geofisica; 1926: Bollettino sismico 1917 - 1926. Roma, Italy, 129 pp.Ribarič V.; 1982: Seismicity of Slovenia. Catalogue of earthquakes (792 A.D. - 1981). Publications of the Seismological
Survey of the SR of Slovenia, Ljubljana, Slovenia, 649 pp.Riggio A. and Russi M.; 1984: Procedura di analisi ed elaborazione dei dati registrati da reti sismometriche locali. In:
Finalità ed Esperienze della Rete Sismometrica del Friuli-Venezia Giulia, Reg. Aut. Friuli-Venezia Giulia, Trieste, Italy, pp. 53-74.
Ritter J.R.R.; 2002: On the recording characteristics of the original Wiechert seismographs at Göttingen (Germany). J. Seismol., 6, 477-486.
Rovida A., Camassi R., Gasperini P. and Stucchi M. (a cura di); 2011: CPTI11, la versione 2011 del Catalogo Parametrico dei Terremoti Italiani. INGV, Milano - Bologna, Italy, 30 pp.
bg817_Sandron senza testine.indd24 24 4-12-2014 11:00:40
Early instrumental seismicity recorded in the eastern Alps Boll. Geof. Teor. Appl., 55, 755-788
779
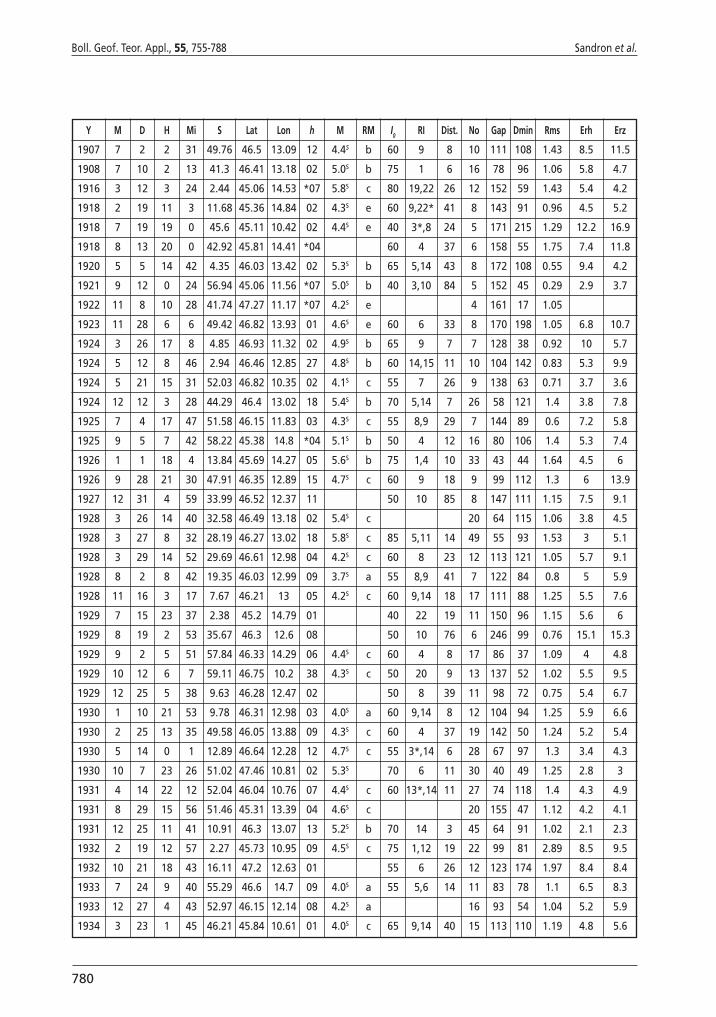
Y M D H Mi S Lat Lon h M RM I0 RI Dist. No Gap Dmin Rms Erh Erz
1907 7 2 2 31 49.76 46.5 13.09 12 4.4S b 60 9 8 10 111 108 1.43 8.5 11.5
1908 7 10 2 13 41.3 46.41 13.18 02 5.0S b 75 1 6 16 78 96 1.06 5.8 4.7
1916 3 12 3 24 2.44 45.06 14.53 *07 5.8S c 80 19,22 26 12 152 59 1.43 5.4 4.2
1918 2 19 11 3 11.68 45.36 14.84 02 4.3S e 60 9,22* 41 8 143 91 0.96 4.5 5.2
1918 7 19 19 0 45.6 45.11 10.42 02 4.4S e 40 3*,8 24 5 171 215 1.29 12.2 16.9
1918 8 13 20 0 42.92 45.81 14.41 *04 60 4 37 6 158 55 1.75 7.4 11.8
1920 5 5 14 42 4.35 46.03 13.42 02 5.3S b 65 5,14 43 8 172 108 0.55 9.4 4.2
1921 9 12 0 24 56.94 45.06 11.56 *07 5.0S b 40 3,10 84 5 152 45 0.29 2.9 3.7
1922 11 8 10 28 41.74 47.27 11.17 *07 4.2S e 4 161 17 1.05
1923 11 28 6 6 49.42 46.82 13.93 01 4.6S e 60 6 33 8 170 198 1.05 6.8 10.7
1924 3 26 17 8 4.85 46.93 11.32 02 4.9S b 65 9 7 7 128 38 0.92 10 5.7
1924 5 12 8 46 2.94 46.46 12.85 27 4.8S b 60 14,15 11 10 104 142 0.83 5.3 9.9
1924 5 21 15 31 52.03 46.82 10.35 02 4.1S c 55 7 26 9 138 63 0.71 3.7 3.6
1924 12 12 3 28 44.29 46.4 13.02 18 5.4S b 70 5,14 7 26 58 121 1.4 3.8 7.8
1925 7 4 17 47 51.58 46.15 11.83 03 4.3S c 55 8,9 29 7 144 89 0.6 7.2 5.8
1925 9 5 7 42 58.22 45.38 14.8 *04 5.1S b 50 4 12 16 80 106 1.4 5.3 7.4
1926 1 1 18 4 13.84 45.69 14.27 05 5.6S b 75 1,4 10 33 43 44 1.64 4.5 6
1926 9 28 21 30 47.91 46.35 12.89 15 4.7S c 60 9 18 9 99 112 1.3 6 13.9
1927 12 31 4 59 33.99 46.52 12.37 11 50 10 85 8 147 111 1.15 7.5 9.1
1928 3 26 14 40 32.58 46.49 13.18 02 5.4S c 20 64 115 1.06 3.8 4.5
1928 3 27 8 32 28.19 46.27 13.02 18 5.8S c 85 5,11 14 49 55 93 1.53 3 5.1
1928 3 29 14 52 29.69 46.61 12.98 04 4.2S c 60 8 23 12 113 121 1.05 5.7 9.1
1928 8 2 8 42 19.35 46.03 12.99 09 3.7S a 55 8,9 41 7 122 84 0.8 5 5.9
1928 11 16 3 17 7.67 46.21 13 05 4.2S c 60 9,14 18 17 111 88 1.25 5.5 7.6
1929 7 15 23 37 2.38 45.2 14.79 01 40 22 19 11 150 96 1.15 5.6 6
1929 8 19 2 53 35.67 46.3 12.6 08 50 10 76 6 246 99 0.76 15.1 15.3
1929 9 2 5 51 57.84 46.33 14.29 06 4.4S c 60 4 8 17 86 37 1.09 4 4.8
1929 10 12 6 7 59.11 46.75 10.2 38 4.3S c 50 20 9 13 137 52 1.02 5.5 9.5
1929 12 25 5 38 9.63 46.28 12.47 02 50 8 39 11 98 72 0.75 5.4 6.7
1930 1 10 21 53 9.78 46.31 12.98 03 4.0S a 60 9,14 8 12 104 94 1.25 5.9 6.6
1930 2 25 13 35 49.58 46.05 13.88 09 4.3S c 60 4 37 19 142 50 1.24 5.2 5.4
1930 5 14 0 1 12.89 46.64 12.28 12 4.7S c 55 3*,14 6 28 67 97 1.3 3.4 4.3
1930 10 7 23 26 51.02 47.46 10.81 02 5.3S 70 6 11 30 40 49 1.25 2.8 3
1931 4 14 22 12 52.04 46.04 10.76 07 4.4S c 60 13*,14 11 27 74 118 1.4 4.3 4.9
1931 8 29 15 56 51.46 45.31 13.39 04 4.6S c 20 155 47 1.12 4.2 4.1
1931 12 25 11 41 10.91 46.3 13.07 13 5.2S b 70 14 3 45 64 91 1.02 2.1 2.3
1932 2 19 12 57 2.27 45.73 10.95 09 4.5S c 75 1,12 19 22 99 81 2.89 8.5 9.5
1932 10 21 18 43 16.11 47.2 12.63 01 55 6 26 12 123 174 1.97 8.4 8.4
1933 7 24 9 40 55.29 46.6 14.7 09 4.0S a 55 5,6 14 11 83 78 1.1 6.5 8.3
1933 12 27 4 43 52.97 46.15 12.14 08 4.2S a 16 93 54 1.04 5.2 5.9
1934 3 23 1 45 46.21 45.84 10.61 01 4.0S c 65 9,14 40 15 113 110 1.19 4.8 5.6
bg817_Sandron senza testine.indd26 26 4-12-2014 11:00:41
780
Boll. Geof. Teor. Appl., 55, 755-788 Sandron et al.
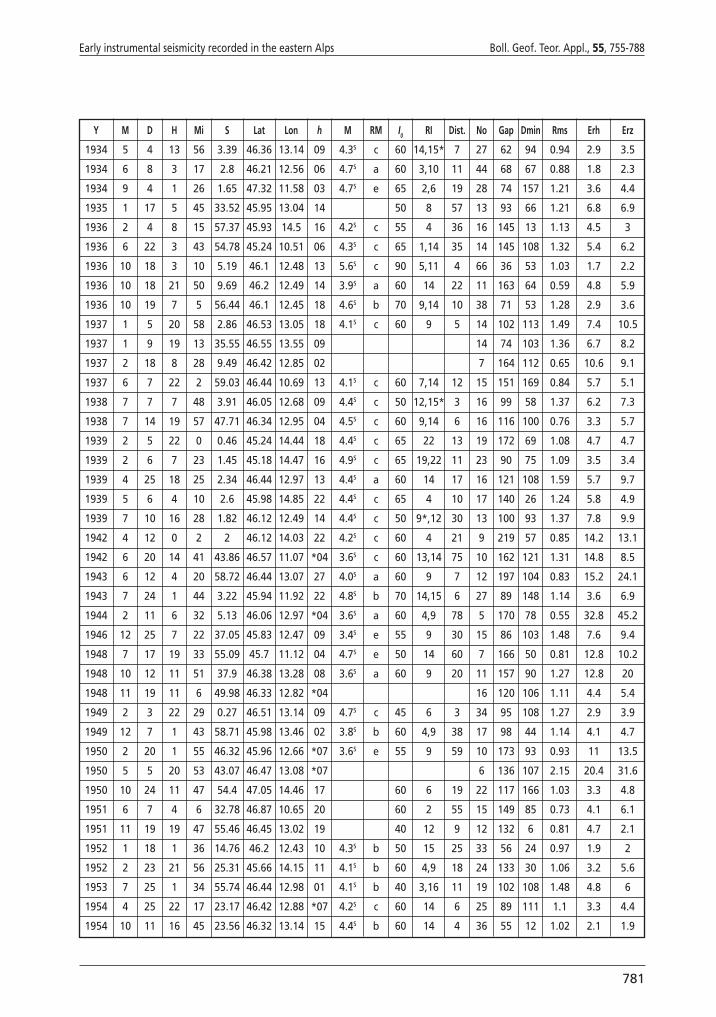
Y M D H Mi S Lat Lon h M RM I0 RI Dist. No Gap Dmin Rms Erh Erz
1934 5 4 13 56 3.39 46.36 13.14 09 4.3S c 60 14,15* 7 27 62 94 0.94 2.9 3.5
1934 6 8 3 17 2.8 46.21 12.56 06 4.7S a 60 3,10 11 44 68 67 0.88 1.8 2.3
1934 9 4 1 26 1.65 47.32 11.58 03 4.7S e 65 2,6 19 28 74 157 1.21 3.6 4.4
1935 1 17 5 45 33.52 45.95 13.04 14 50 8 57 13 93 66 1.21 6.8 6.9
1936 2 4 8 15 57.37 45.93 14.5 16 4.2S c 55 4 36 16 145 13 1.13 4.5 3
1936 6 22 3 43 54.78 45.24 10.51 06 4.3S c 65 1,14 35 14 145 108 1.32 5.4 6.2
1936 10 18 3 10 5.19 46.1 12.48 13 5.6S c 90 5,11 4 66 36 53 1.03 1.7 2.2
1936 10 18 21 50 9.69 46.2 12.49 14 3.9S a 60 14 22 11 163 64 0.59 4.8 5.9
1936 10 19 7 5 56.44 46.1 12.45 18 4.6S b 70 9,14 10 38 71 53 1.28 2.9 3.6
1937 1 5 20 58 2.86 46.53 13.05 18 4.1S c 60 9 5 14 102 113 1.49 7.4 10.5
1937 1 9 19 13 35.55 46.55 13.55 09 14 74 103 1.36 6.7 8.2
1937 2 18 8 28 9.49 46.42 12.85 02 7 164 112 0.65 10.6 9.1
1937 6 7 22 2 59.03 46.44 10.69 13 4.1S c 60 7,14 12 15 151 169 0.84 5.7 5.1
1938 7 7 7 48 3.91 46.05 12.68 09 4.4S c 50 12,15* 3 16 99 58 1.37 6.2 7.3
1938 7 14 19 57 47.71 46.34 12.95 04 4.5S c 60 9,14 6 16 116 100 0.76 3.3 5.7
1939 2 5 22 0 0.46 45.24 14.44 18 4.4S c 65 22 13 19 172 69 1.08 4.7 4.7
1939 2 6 7 23 1.45 45.18 14.47 16 4.9S c 65 19,22 11 23 90 75 1.09 3.5 3.4
1939 4 25 18 25 2.34 46.44 12.97 13 4.4S a 60 14 17 16 121 108 1.59 5.7 9.7
1939 5 6 4 10 2.6 45.98 14.85 22 4.4S c 65 4 10 17 140 26 1.24 5.8 4.9
1939 7 10 16 28 1.82 46.12 12.49 14 4.4S c 50 9*,12 30 13 100 93 1.37 7.8 9.9
1942 4 12 0 2 2 46.12 14.03 22 4.2S c 60 4 21 9 219 57 0.85 14.2 13.1
1942 6 20 14 41 43.86 46.57 11.07 *04 3.6S c 60 13,14 75 10 162 121 1.31 14.8 8.5
1943 6 12 4 20 58.72 46.44 13.07 27 4.0S a 60 9 7 12 197 104 0.83 15.2 24.1
1943 7 24 1 44 3.22 45.94 11.92 22 4.8S b 70 14,15 6 27 89 148 1.14 3.6 6.9
1944 2 11 6 32 5.13 46.06 12.97 *04 3.6S a 60 4,9 78 5 170 78 0.55 32.8 45.2
1946 12 25 7 22 37.05 45.83 12.47 09 3.4S e 55 9 30 15 86 103 1.48 7.6 9.4
1948 7 17 19 33 55.09 45.7 11.12 04 4.7S e 50 14 60 7 166 50 0.81 12.8 10.2
1948 10 12 11 51 37.9 46.38 13.28 08 3.6S a 60 9 20 11 157 90 1.27 12.8 20
1948 11 19 11 6 49.98 46.33 12.82 *04 16 120 106 1.11 4.4 5.4
1949 2 3 22 29 0.27 46.51 13.14 09 4.7S c 45 6 3 34 95 108 1.27 2.9 3.9
1949 12 7 1 43 58.71 45.98 13.46 02 3.8S b 60 4,9 38 17 98 44 1.14 4.1 4.7
1950 2 20 1 55 46.32 45.96 12.66 *07 3.6S e 55 9 59 10 173 93 0.93 11 13.5
1950 5 5 20 53 43.07 46.47 13.08 *07 6 136 107 2.15 20.4 31.6
1950 10 24 11 47 54.4 47.05 14.46 17 60 6 19 22 117 166 1.03 3.3 4.8
1951 6 7 4 6 32.78 46.87 10.65 20 60 2 55 15 149 85 0.73 4.1 6.1
1951 11 19 19 47 55.46 46.45 13.02 19 40 12 9 12 132 6 0.81 4.7 2.1
1952 1 18 1 36 14.76 46.2 12.43 10 4.3S b 50 15 25 33 56 24 0.97 1.9 2
1952 2 23 21 56 25.31 45.66 14.15 11 4.1S b 60 4,9 18 24 133 30 1.06 3.2 5.6
1953 7 25 1 34 55.74 46.44 12.98 01 4.1S b 40 3,16 11 19 102 108 1.48 4.8 6
1954 4 25 22 17 23.17 46.42 12.88 *07 4.2S c 60 14 6 25 89 111 1.1 3.3 4.4
1954 10 11 16 45 23.56 46.32 13.14 15 4.4S b 60 14 4 36 55 12 1.02 2.1 1.9
bg817_Sandron senza testine.indd27 27 4-12-2014 11:00:41
Y M D H Mi S Lat Lon h M RM I0 RI Dist. No Gap Dmin Rms Erh Erz
1907 7 2 2 31 49.76 46.5 13.09 12 4.4S b 60 9 8 10 111 108 1.43 8.5 11.5
1908 7 10 2 13 41.3 46.41 13.18 02 5.0S b 75 1 6 16 78 96 1.06 5.8 4.7
1916 3 12 3 24 2.44 45.06 14.53 *07 5.8S c 80 19,22 26 12 152 59 1.43 5.4 4.2
1918 2 19 11 3 11.68 45.36 14.84 02 4.3S e 60 9,22* 41 8 143 91 0.96 4.5 5.2
1918 7 19 19 0 45.6 45.11 10.42 02 4.4S e 40 3*,8 24 5 171 215 1.29 12.2 16.9
1918 8 13 20 0 42.92 45.81 14.41 *04 60 4 37 6 158 55 1.75 7.4 11.8
1920 5 5 14 42 4.35 46.03 13.42 02 5.3S b 65 5,14 43 8 172 108 0.55 9.4 4.2
1921 9 12 0 24 56.94 45.06 11.56 *07 5.0S b 40 3,10 84 5 152 45 0.29 2.9 3.7
1922 11 8 10 28 41.74 47.27 11.17 *07 4.2S e 4 161 17 1.05
1923 11 28 6 6 49.42 46.82 13.93 01 4.6S e 60 6 33 8 170 198 1.05 6.8 10.7
1924 3 26 17 8 4.85 46.93 11.32 02 4.9S b 65 9 7 7 128 38 0.92 10 5.7
1924 5 12 8 46 2.94 46.46 12.85 27 4.8S b 60 14,15 11 10 104 142 0.83 5.3 9.9
1924 5 21 15 31 52.03 46.82 10.35 02 4.1S c 55 7 26 9 138 63 0.71 3.7 3.6
1924 12 12 3 28 44.29 46.4 13.02 18 5.4S b 70 5,14 7 26 58 121 1.4 3.8 7.8
1925 7 4 17 47 51.58 46.15 11.83 03 4.3S c 55 8,9 29 7 144 89 0.6 7.2 5.8
1925 9 5 7 42 58.22 45.38 14.8 *04 5.1S b 50 4 12 16 80 106 1.4 5.3 7.4
1926 1 1 18 4 13.84 45.69 14.27 05 5.6S b 75 1,4 10 33 43 44 1.64 4.5 6
1926 9 28 21 30 47.91 46.35 12.89 15 4.7S c 60 9 18 9 99 112 1.3 6 13.9
1927 12 31 4 59 33.99 46.52 12.37 11 50 10 85 8 147 111 1.15 7.5 9.1
1928 3 26 14 40 32.58 46.49 13.18 02 5.4S c 20 64 115 1.06 3.8 4.5
1928 3 27 8 32 28.19 46.27 13.02 18 5.8S c 85 5,11 14 49 55 93 1.53 3 5.1
1928 3 29 14 52 29.69 46.61 12.98 04 4.2S c 60 8 23 12 113 121 1.05 5.7 9.1
1928 8 2 8 42 19.35 46.03 12.99 09 3.7S a 55 8,9 41 7 122 84 0.8 5 5.9
1928 11 16 3 17 7.67 46.21 13 05 4.2S c 60 9,14 18 17 111 88 1.25 5.5 7.6
1929 7 15 23 37 2.38 45.2 14.79 01 40 22 19 11 150 96 1.15 5.6 6
1929 8 19 2 53 35.67 46.3 12.6 08 50 10 76 6 246 99 0.76 15.1 15.3
1929 9 2 5 51 57.84 46.33 14.29 06 4.4S c 60 4 8 17 86 37 1.09 4 4.8
1929 10 12 6 7 59.11 46.75 10.2 38 4.3S c 50 20 9 13 137 52 1.02 5.5 9.5
1929 12 25 5 38 9.63 46.28 12.47 02 50 8 39 11 98 72 0.75 5.4 6.7
1930 1 10 21 53 9.78 46.31 12.98 03 4.0S a 60 9,14 8 12 104 94 1.25 5.9 6.6
1930 2 25 13 35 49.58 46.05 13.88 09 4.3S c 60 4 37 19 142 50 1.24 5.2 5.4
1930 5 14 0 1 12.89 46.64 12.28 12 4.7S c 55 3*,14 6 28 67 97 1.3 3.4 4.3
1930 10 7 23 26 51.02 47.46 10.81 02 5.3S 70 6 11 30 40 49 1.25 2.8 3
1931 4 14 22 12 52.04 46.04 10.76 07 4.4S c 60 13*,14 11 27 74 118 1.4 4.3 4.9
1931 8 29 15 56 51.46 45.31 13.39 04 4.6S c 20 155 47 1.12 4.2 4.1
1931 12 25 11 41 10.91 46.3 13.07 13 5.2S b 70 14 3 45 64 91 1.02 2.1 2.3
1932 2 19 12 57 2.27 45.73 10.95 09 4.5S c 75 1,12 19 22 99 81 2.89 8.5 9.5
1932 10 21 18 43 16.11 47.2 12.63 01 55 6 26 12 123 174 1.97 8.4 8.4
1933 7 24 9 40 55.29 46.6 14.7 09 4.0S a 55 5,6 14 11 83 78 1.1 6.5 8.3
1933 12 27 4 43 52.97 46.15 12.14 08 4.2S a 16 93 54 1.04 5.2 5.9
1934 3 23 1 45 46.21 45.84 10.61 01 4.0S c 65 9,14 40 15 113 110 1.19 4.8 5.6
bg817_Sandron senza testine.indd26 26 4-12-2014 11:00:41
Early instrumental seismicity recorded in the eastern Alps Boll. Geof. Teor. Appl., 55, 755-788
781
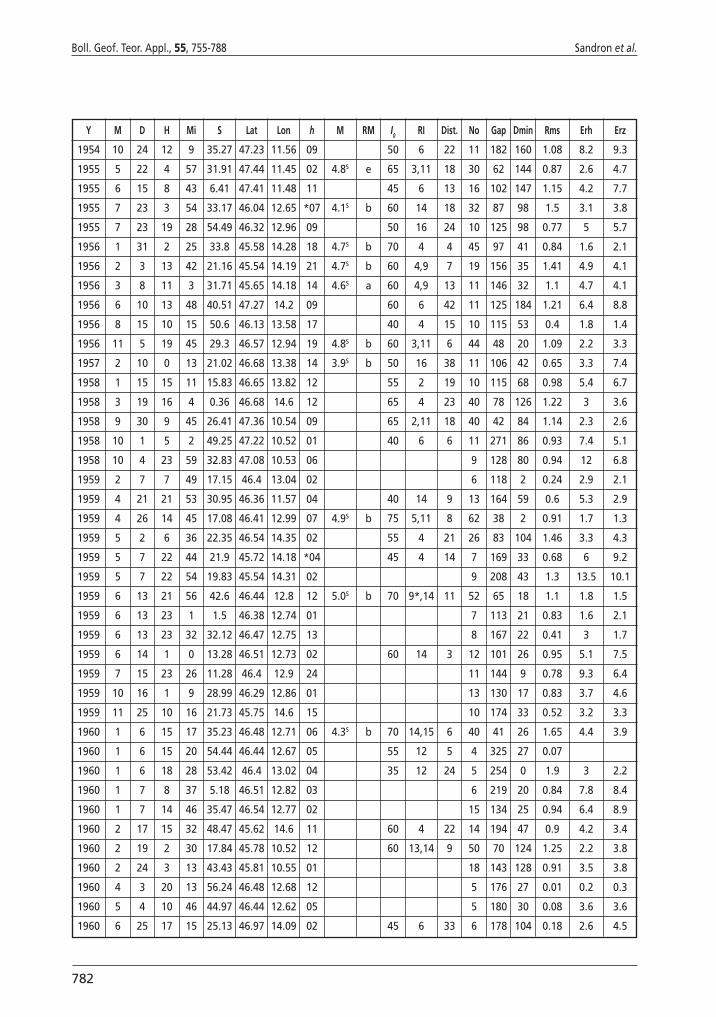
Y M D H Mi S Lat Lon h M RM I0 RI Dist. No Gap Dmin Rms Erh Erz
1954 10 24 12 9 35.27 47.23 11.56 09 50 6 22 11 182 160 1.08 8.2 9.3
1955 5 22 4 57 31.91 47.44 11.45 02 4.8S e 65 3,11 18 30 62 144 0.87 2.6 4.7
1955 6 15 8 43 6.41 47.41 11.48 11 45 6 13 16 102 147 1.15 4.2 7.7
1955 7 23 3 54 33.17 46.04 12.65 *07 4.1S b 60 14 18 32 87 98 1.5 3.1 3.8
1955 7 23 19 28 54.49 46.32 12.96 09 50 16 24 10 125 98 0.77 5 5.7
1956 1 31 2 25 33.8 45.58 14.28 18 4.7S b 70 4 4 45 97 41 0.84 1.6 2.1
1956 2 3 13 42 21.16 45.54 14.19 21 4.7S b 60 4,9 7 19 156 35 1.41 4.9 4.1
1956 3 8 11 3 31.71 45.65 14.18 14 4.6S a 60 4,9 13 11 146 32 1.1 4.7 4.1
1956 6 10 13 48 40.51 47.27 14.2 09 60 6 42 11 125 184 1.21 6.4 8.8
1956 8 15 10 15 50.6 46.13 13.58 17 40 4 15 10 115 53 0.4 1.8 1.4
1956 11 5 19 45 29.3 46.57 12.94 19 4.8S b 60 3,11 6 44 48 20 1.09 2.2 3.3
1957 2 10 0 13 21.02 46.68 13.38 14 3.9S b 50 16 38 11 106 42 0.65 3.3 7.4
1958 1 15 15 11 15.83 46.65 13.82 12 55 2 19 10 115 68 0.98 5.4 6.7
1958 3 19 16 4 0.36 46.68 14.6 12 65 4 23 40 78 126 1.22 3 3.6
1958 9 30 9 45 26.41 47.36 10.54 09 65 2,11 18 40 42 84 1.14 2.3 2.6
1958 10 1 5 2 49.25 47.22 10.52 01 40 6 6 11 271 86 0.93 7.4 5.1
1958 10 4 23 59 32.83 47.08 10.53 06 9 128 80 0.94 12 6.8
1959 2 7 7 49 17.15 46.4 13.04 02 6 118 2 0.24 2.9 2.1
1959 4 21 21 53 30.95 46.36 11.57 04 40 14 9 13 164 59 0.6 5.3 2.9
1959 4 26 14 45 17.08 46.41 12.99 07 4.9S b 75 5,11 8 62 38 2 0.91 1.7 1.3
1959 5 2 6 36 22.35 46.54 14.35 02 55 4 21 26 83 104 1.46 3.3 4.3
1959 5 7 22 44 21.9 45.72 14.18 *04 45 4 14 7 169 33 0.68 6 9.2
1959 5 7 22 54 19.83 45.54 14.31 02 9 208 43 1.3 13.5 10.1
1959 6 13 21 56 42.6 46.44 12.8 12 5.0S b 70 9*,14 11 52 65 18 1.1 1.8 1.5
1959 6 13 23 1 1.5 46.38 12.74 01 7 113 21 0.83 1.6 2.1
1959 6 13 23 32 32.12 46.47 12.75 13 8 167 22 0.41 3 1.7
1959 6 14 1 0 13.28 46.51 12.73 02 60 14 3 12 101 26 0.95 5.1 7.5
1959 7 15 23 26 11.28 46.4 12.9 24 11 144 9 0.78 9.3 6.4
1959 10 16 1 9 28.99 46.29 12.86 01 13 130 17 0.83 3.7 4.6
1959 11 25 10 16 21.73 45.75 14.6 15 10 174 33 0.52 3.2 3.3
1960 1 6 15 17 35.23 46.48 12.71 06 4.3S b 70 14,15 6 40 41 26 1.65 4.4 3.9
1960 1 6 15 20 54.44 46.44 12.67 05 55 12 5 4 325 27 0.07
1960 1 6 18 28 53.42 46.4 13.02 04 35 12 24 5 254 0 1.9 3 2.2
1960 1 7 8 37 5.18 46.51 12.82 03 6 219 20 0.84 7.8 8.4
1960 1 7 14 46 35.47 46.54 12.77 02 15 134 25 0.94 6.4 8.9
1960 2 17 15 32 48.47 45.62 14.6 11 60 4 22 14 194 47 0.9 4.2 3.4
1960 2 19 2 30 17.84 45.78 10.52 12 60 13,14 9 50 70 124 1.25 2.2 3.8
1960 2 24 3 13 43.43 45.81 10.55 01 18 143 128 0.91 3.5 3.8
1960 4 3 20 13 56.24 46.48 12.68 12 5 176 27 0.01 0.2 0.3
1960 5 4 10 46 44.97 46.44 12.62 05 5 180 30 0.08 3.6 3.6
1960 6 25 17 15 25.13 46.97 14.09 02 45 6 33 6 178 104 0.18 2.6 4.5
bg817_Sandron senza testine.indd28 28 4-12-2014 11:00:42
782
Boll. Geof. Teor. Appl., 55, 755-788 Sandron et al.
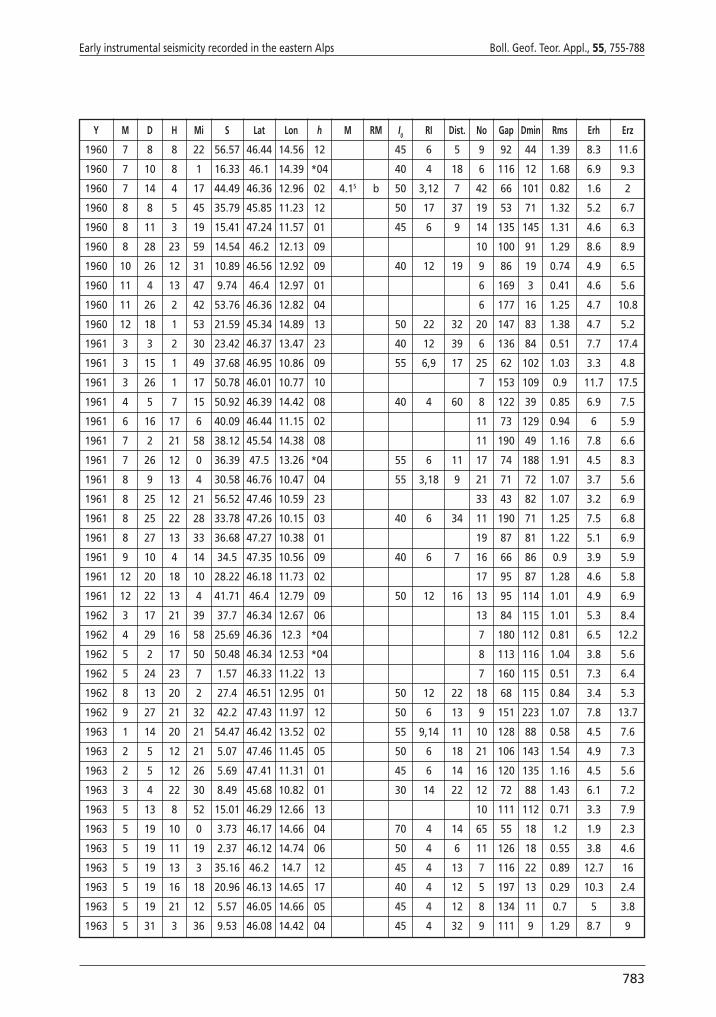
Y M D H Mi S Lat Lon h M RM I0 RI Dist. No Gap Dmin Rms Erh Erz
1960 7 8 8 22 56.57 46.44 14.56 12 45 6 5 9 92 44 1.39 8.3 11.6
1960 7 10 8 1 16.33 46.1 14.39 *04 40 4 18 6 116 12 1.68 6.9 9.3
1960 7 14 4 17 44.49 46.36 12.96 02 4.1S b 50 3,12 7 42 66 101 0.82 1.6 2
1960 8 8 5 45 35.79 45.85 11.23 12 50 17 37 19 53 71 1.32 5.2 6.7
1960 8 11 3 19 15.41 47.24 11.57 01 45 6 9 14 135 145 1.31 4.6 6.3
1960 8 28 23 59 14.54 46.2 12.13 09 10 100 91 1.29 8.6 8.9
1960 10 26 12 31 10.89 46.56 12.92 09 40 12 19 9 86 19 0.74 4.9 6.5
1960 11 4 13 47 9.74 46.4 12.97 01 6 169 3 0.41 4.6 5.6
1960 11 26 2 42 53.76 46.36 12.82 04 6 177 16 1.25 4.7 10.8
1960 12 18 1 53 21.59 45.34 14.89 13 50 22 32 20 147 83 1.38 4.7 5.2
1961 3 3 2 30 23.42 46.37 13.47 23 40 12 39 6 136 84 0.51 7.7 17.4
1961 3 15 1 49 37.68 46.95 10.86 09 55 6,9 17 25 62 102 1.03 3.3 4.8
1961 3 26 1 17 50.78 46.01 10.77 10 7 153 109 0.9 11.7 17.5
1961 4 5 7 15 50.92 46.39 14.42 08 40 4 60 8 122 39 0.85 6.9 7.5
1961 6 16 17 6 40.09 46.44 11.15 02 11 73 129 0.94 6 5.9
1961 7 2 21 58 38.12 45.54 14.38 08 11 190 49 1.16 7.8 6.6
1961 7 26 12 0 36.39 47.5 13.26 *04 55 6 11 17 74 188 1.91 4.5 8.3
1961 8 9 13 4 30.58 46.76 10.47 04 55 3,18 9 21 71 72 1.07 3.7 5.6
1961 8 25 12 21 56.52 47.46 10.59 23 33 43 82 1.07 3.2 6.9
1961 8 25 22 28 33.78 47.26 10.15 03 40 6 34 11 190 71 1.25 7.5 6.8
1961 8 27 13 33 36.68 47.27 10.38 01 19 87 81 1.22 5.1 6.9
1961 9 10 4 14 34.5 47.35 10.56 09 40 6 7 16 66 86 0.9 3.9 5.9
1961 12 20 18 10 28.22 46.18 11.73 02 17 95 87 1.28 4.6 5.8
1961 12 22 13 4 41.71 46.4 12.79 09 50 12 16 13 95 114 1.01 4.9 6.9
1962 3 17 21 39 37.7 46.34 12.67 06 13 84 115 1.01 5.3 8.4
1962 4 29 16 58 25.69 46.36 12.3 *04 7 180 112 0.81 6.5 12.2
1962 5 2 17 50 50.48 46.34 12.53 *04 8 113 116 1.04 3.8 5.6
1962 5 24 23 7 1.57 46.33 11.22 13 7 160 115 0.51 7.3 6.4
1962 8 13 20 2 27.4 46.51 12.95 01 50 12 22 18 68 115 0.84 3.4 5.3
1962 9 27 21 32 42.2 47.43 11.97 12 50 6 13 9 151 223 1.07 7.8 13.7
1963 1 14 20 21 54.47 46.42 13.52 02 55 9,14 11 10 128 88 0.58 4.5 7.6
1963 2 5 12 21 5.07 47.46 11.45 05 50 6 18 21 106 143 1.54 4.9 7.3
1963 2 5 12 26 5.69 47.41 11.31 01 45 6 14 16 120 135 1.16 4.5 5.6
1963 3 4 22 30 8.49 45.68 10.82 01 30 14 22 12 72 88 1.43 6.1 7.2
1963 5 13 8 52 15.01 46.29 12.66 13 10 111 112 0.71 3.3 7.9
1963 5 19 10 0 3.73 46.17 14.66 04 70 4 14 65 55 18 1.2 1.9 2.3
1963 5 19 11 19 2.37 46.12 14.74 06 50 4 6 11 126 18 0.55 3.8 4.6
1963 5 19 13 3 35.16 46.2 14.7 12 45 4 13 7 116 22 0.89 12.7 16
1963 5 19 16 18 20.96 46.13 14.65 17 40 4 12 5 197 13 0.29 10.3 2.4
1963 5 19 21 12 5.57 46.05 14.66 05 45 4 12 8 134 11 0.7 5 3.8
1963 5 31 3 36 9.53 46.08 14.42 04 45 4 32 9 111 9 1.29 8.7 9
bg817_Sandron senza testine.indd29 29 4-12-2014 11:00:42
Y M D H Mi S Lat Lon h M RM I0 RI Dist. No Gap Dmin Rms Erh Erz
1954 10 24 12 9 35.27 47.23 11.56 09 50 6 22 11 182 160 1.08 8.2 9.3
1955 5 22 4 57 31.91 47.44 11.45 02 4.8S e 65 3,11 18 30 62 144 0.87 2.6 4.7
1955 6 15 8 43 6.41 47.41 11.48 11 45 6 13 16 102 147 1.15 4.2 7.7
1955 7 23 3 54 33.17 46.04 12.65 *07 4.1S b 60 14 18 32 87 98 1.5 3.1 3.8
1955 7 23 19 28 54.49 46.32 12.96 09 50 16 24 10 125 98 0.77 5 5.7
1956 1 31 2 25 33.8 45.58 14.28 18 4.7S b 70 4 4 45 97 41 0.84 1.6 2.1
1956 2 3 13 42 21.16 45.54 14.19 21 4.7S b 60 4,9 7 19 156 35 1.41 4.9 4.1
1956 3 8 11 3 31.71 45.65 14.18 14 4.6S a 60 4,9 13 11 146 32 1.1 4.7 4.1
1956 6 10 13 48 40.51 47.27 14.2 09 60 6 42 11 125 184 1.21 6.4 8.8
1956 8 15 10 15 50.6 46.13 13.58 17 40 4 15 10 115 53 0.4 1.8 1.4
1956 11 5 19 45 29.3 46.57 12.94 19 4.8S b 60 3,11 6 44 48 20 1.09 2.2 3.3
1957 2 10 0 13 21.02 46.68 13.38 14 3.9S b 50 16 38 11 106 42 0.65 3.3 7.4
1958 1 15 15 11 15.83 46.65 13.82 12 55 2 19 10 115 68 0.98 5.4 6.7
1958 3 19 16 4 0.36 46.68 14.6 12 65 4 23 40 78 126 1.22 3 3.6
1958 9 30 9 45 26.41 47.36 10.54 09 65 2,11 18 40 42 84 1.14 2.3 2.6
1958 10 1 5 2 49.25 47.22 10.52 01 40 6 6 11 271 86 0.93 7.4 5.1
1958 10 4 23 59 32.83 47.08 10.53 06 9 128 80 0.94 12 6.8
1959 2 7 7 49 17.15 46.4 13.04 02 6 118 2 0.24 2.9 2.1
1959 4 21 21 53 30.95 46.36 11.57 04 40 14 9 13 164 59 0.6 5.3 2.9
1959 4 26 14 45 17.08 46.41 12.99 07 4.9S b 75 5,11 8 62 38 2 0.91 1.7 1.3
1959 5 2 6 36 22.35 46.54 14.35 02 55 4 21 26 83 104 1.46 3.3 4.3
1959 5 7 22 44 21.9 45.72 14.18 *04 45 4 14 7 169 33 0.68 6 9.2
1959 5 7 22 54 19.83 45.54 14.31 02 9 208 43 1.3 13.5 10.1
1959 6 13 21 56 42.6 46.44 12.8 12 5.0S b 70 9*,14 11 52 65 18 1.1 1.8 1.5
1959 6 13 23 1 1.5 46.38 12.74 01 7 113 21 0.83 1.6 2.1
1959 6 13 23 32 32.12 46.47 12.75 13 8 167 22 0.41 3 1.7
1959 6 14 1 0 13.28 46.51 12.73 02 60 14 3 12 101 26 0.95 5.1 7.5
1959 7 15 23 26 11.28 46.4 12.9 24 11 144 9 0.78 9.3 6.4
1959 10 16 1 9 28.99 46.29 12.86 01 13 130 17 0.83 3.7 4.6
1959 11 25 10 16 21.73 45.75 14.6 15 10 174 33 0.52 3.2 3.3
1960 1 6 15 17 35.23 46.48 12.71 06 4.3S b 70 14,15 6 40 41 26 1.65 4.4 3.9
1960 1 6 15 20 54.44 46.44 12.67 05 55 12 5 4 325 27 0.07
1960 1 6 18 28 53.42 46.4 13.02 04 35 12 24 5 254 0 1.9 3 2.2
1960 1 7 8 37 5.18 46.51 12.82 03 6 219 20 0.84 7.8 8.4
1960 1 7 14 46 35.47 46.54 12.77 02 15 134 25 0.94 6.4 8.9
1960 2 17 15 32 48.47 45.62 14.6 11 60 4 22 14 194 47 0.9 4.2 3.4
1960 2 19 2 30 17.84 45.78 10.52 12 60 13,14 9 50 70 124 1.25 2.2 3.8
1960 2 24 3 13 43.43 45.81 10.55 01 18 143 128 0.91 3.5 3.8
1960 4 3 20 13 56.24 46.48 12.68 12 5 176 27 0.01 0.2 0.3
1960 5 4 10 46 44.97 46.44 12.62 05 5 180 30 0.08 3.6 3.6
1960 6 25 17 15 25.13 46.97 14.09 02 45 6 33 6 178 104 0.18 2.6 4.5
bg817_Sandron senza testine.indd28 28 4-12-2014 11:00:42
Early instrumental seismicity recorded in the eastern Alps Boll. Geof. Teor. Appl., 55, 755-788
783
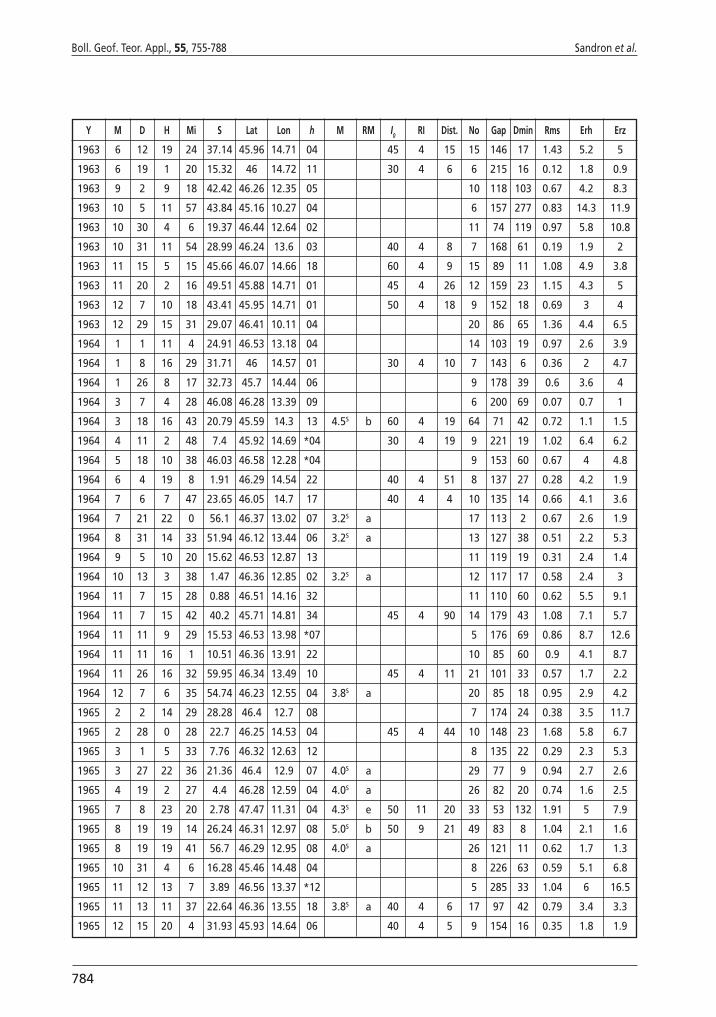
Y M D H Mi S Lat Lon h M RM I0 RI Dist. No Gap Dmin Rms Erh Erz
1963 6 12 19 24 37.14 45.96 14.71 04 45 4 15 15 146 17 1.43 5.2 5
1963 6 19 1 20 15.32 46 14.72 11 30 4 6 6 215 16 0.12 1.8 0.9
1963 9 2 9 18 42.42 46.26 12.35 05 10 118 103 0.67 4.2 8.3
1963 10 5 11 57 43.84 45.16 10.27 04 6 157 277 0.83 14.3 11.9
1963 10 30 4 6 19.37 46.44 12.64 02 11 74 119 0.97 5.8 10.8
1963 10 31 11 54 28.99 46.24 13.6 03 40 4 8 7 168 61 0.19 1.9 2
1963 11 15 5 15 45.66 46.07 14.66 18 60 4 9 15 89 11 1.08 4.9 3.8
1963 11 20 2 16 49.51 45.88 14.71 01 45 4 26 12 159 23 1.15 4.3 5
1963 12 7 10 18 43.41 45.95 14.71 01 50 4 18 9 152 18 0.69 3 4
1963 12 29 15 31 29.07 46.41 10.11 04 20 86 65 1.36 4.4 6.5
1964 1 1 11 4 24.91 46.53 13.18 04 14 103 19 0.97 2.6 3.9
1964 1 8 16 29 31.71 46 14.57 01 30 4 10 7 143 6 0.36 2 4.7
1964 1 26 8 17 32.73 45.7 14.44 06 9 178 39 0.6 3.6 4
1964 3 7 4 28 46.08 46.28 13.39 09 6 200 69 0.07 0.7 1
1964 3 18 16 43 20.79 45.59 14.3 13 4.5S b 60 4 19 64 71 42 0.72 1.1 1.5
1964 4 11 2 48 7.4 45.92 14.69 *04 30 4 19 9 221 19 1.02 6.4 6.2
1964 5 18 10 38 46.03 46.58 12.28 *04 9 153 60 0.67 4 4.8
1964 6 4 19 8 1.91 46.29 14.54 22 40 4 51 8 137 27 0.28 4.2 1.9
1964 7 6 7 47 23.65 46.05 14.7 17 40 4 4 10 135 14 0.66 4.1 3.6
1964 7 21 22 0 56.1 46.37 13.02 07 3.2S a 17 113 2 0.67 2.6 1.9
1964 8 31 14 33 51.94 46.12 13.44 06 3.2S a 13 127 38 0.51 2.2 5.3
1964 9 5 10 20 15.62 46.53 12.87 13 11 119 19 0.31 2.4 1.4
1964 10 13 3 38 1.47 46.36 12.85 02 3.2S a 12 117 17 0.58 2.4 3
1964 11 7 15 28 0.88 46.51 14.16 32 11 110 60 0.62 5.5 9.1
1964 11 7 15 42 40.2 45.71 14.81 34 45 4 90 14 179 43 1.08 7.1 5.7
1964 11 11 9 29 15.53 46.53 13.98 *07 5 176 69 0.86 8.7 12.6
1964 11 11 16 1 10.51 46.36 13.91 22 10 85 60 0.9 4.1 8.7
1964 11 26 16 32 59.95 46.34 13.49 10 45 4 11 21 101 33 0.57 1.7 2.2
1964 12 7 6 35 54.74 46.23 12.55 04 3.8S a 20 85 18 0.95 2.9 4.2
1965 2 2 14 29 28.28 46.4 12.7 08 7 174 24 0.38 3.5 11.7
1965 2 28 0 28 22.7 46.25 14.53 04 45 4 44 10 148 23 1.68 5.8 6.7
1965 3 1 5 33 7.76 46.32 12.63 12 8 135 22 0.29 2.3 5.3
1965 3 27 22 36 21.36 46.4 12.9 07 4.0S a 29 77 9 0.94 2.7 2.6
1965 4 19 2 27 4.4 46.28 12.59 04 4.0S a 26 82 20 0.74 1.6 2.5
1965 7 8 23 20 2.78 47.47 11.31 04 4.3S e 50 11 20 33 53 132 1.91 5 7.9
1965 8 19 19 14 26.24 46.31 12.97 08 5.0S b 50 9 21 49 83 8 1.04 2.1 1.6
1965 8 19 19 41 56.7 46.29 12.95 08 4.0S a 26 121 11 0.62 1.7 1.3
1965 10 31 4 6 16.28 45.46 14.48 04 8 226 63 0.59 5.1 6.8
1965 11 12 13 7 3.89 46.56 13.37 *12 5 285 33 1.04 6 16.5
1965 11 13 11 37 22.64 46.36 13.55 18 3.8S a 40 4 6 17 97 42 0.79 3.4 3.3
1965 12 15 20 4 31.93 45.93 14.64 06 40 4 5 9 154 16 0.35 1.8 1.9
bg817_Sandron senza testine.indd30 30 4-12-2014 11:00:43
784
Boll. Geof. Teor. Appl., 55, 755-788 Sandron et al.
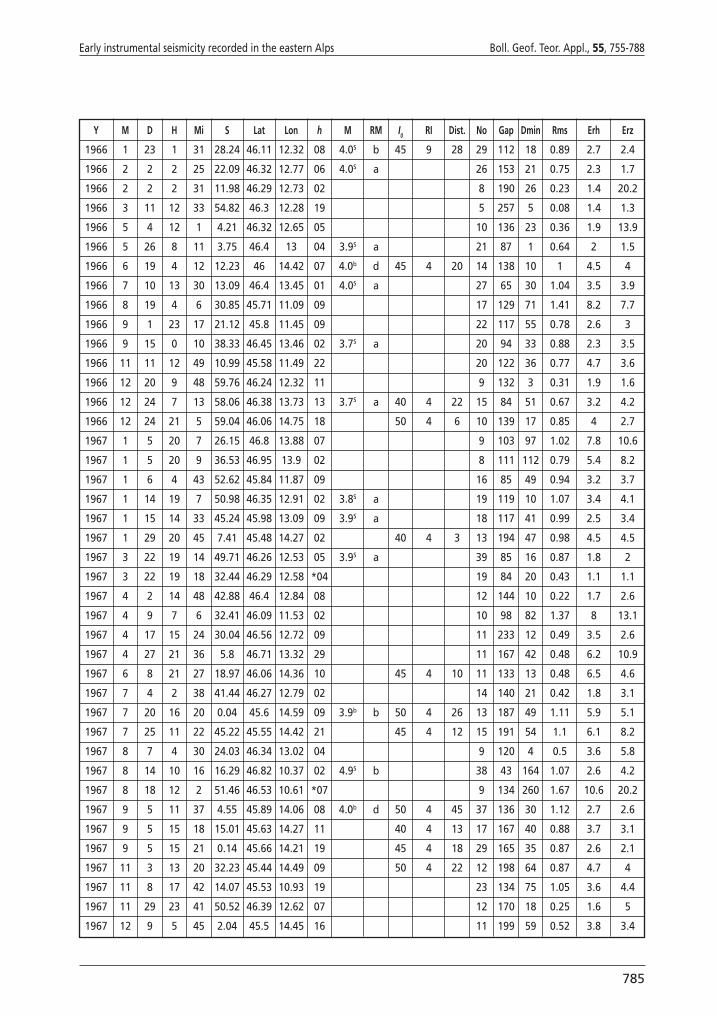
Y M D H Mi S Lat Lon h M RM I0 RI Dist. No Gap Dmin Rms Erh Erz
1966 1 23 1 31 28.24 46.11 12.32 08 4.0S b 45 9 28 29 112 18 0.89 2.7 2.4
1966 2 2 2 25 22.09 46.32 12.77 06 4.0S a 26 153 21 0.75 2.3 1.7
1966 2 2 2 31 11.98 46.29 12.73 02 8 190 26 0.23 1.4 20.2
1966 3 11 12 33 54.82 46.3 12.28 19 5 257 5 0.08 1.4 1.3
1966 5 4 12 1 4.21 46.32 12.65 05 10 136 23 0.36 1.9 13.9
1966 5 26 8 11 3.75 46.4 13 04 3.9S a 21 87 1 0.64 2 1.5
1966 6 19 4 12 12.23 46 14.42 07 4.0b d 45 4 20 14 138 10 1 4.5 4
1966 7 10 13 30 13.09 46.4 13.45 01 4.0S a 27 65 30 1.04 3.5 3.9
1966 8 19 4 6 30.85 45.71 11.09 09 17 129 71 1.41 8.2 7.7
1966 9 1 23 17 21.12 45.8 11.45 09 22 117 55 0.78 2.6 3
1966 9 15 0 10 38.33 46.45 13.46 02 3.7S a 20 94 33 0.88 2.3 3.5
1966 11 11 12 49 10.99 45.58 11.49 22 20 122 36 0.77 4.7 3.6
1966 12 20 9 48 59.76 46.24 12.32 11 9 132 3 0.31 1.9 1.6
1966 12 24 7 13 58.06 46.38 13.73 13 3.7S a 40 4 22 15 84 51 0.67 3.2 4.2
1966 12 24 21 5 59.04 46.06 14.75 18 50 4 6 10 139 17 0.85 4 2.7
1967 1 5 20 7 26.15 46.8 13.88 07 9 103 97 1.02 7.8 10.6
1967 1 5 20 9 36.53 46.95 13.9 02 8 111 112 0.79 5.4 8.2
1967 1 6 4 43 52.62 45.84 11.87 09 16 85 49 0.94 3.2 3.7
1967 1 14 19 7 50.98 46.35 12.91 02 3.8S a 19 119 10 1.07 3.4 4.1
1967 1 15 14 33 45.24 45.98 13.09 09 3.9S a 18 117 41 0.99 2.5 3.4
1967 1 29 20 45 7.41 45.48 14.27 02 40 4 3 13 194 47 0.98 4.5 4.5
1967 3 22 19 14 49.71 46.26 12.53 05 3.9S a 39 85 16 0.87 1.8 2
1967 3 22 19 18 32.44 46.29 12.58 *04 19 84 20 0.43 1.1 1.1
1967 4 2 14 48 42.88 46.4 12.84 08 12 144 10 0.22 1.7 2.6
1967 4 9 7 6 32.41 46.09 11.53 02 10 98 82 1.37 8 13.1
1967 4 17 15 24 30.04 46.56 12.72 09 11 233 12 0.49 3.5 2.6
1967 4 27 21 36 5.8 46.71 13.32 29 11 167 42 0.48 6.2 10.9
1967 6 8 21 27 18.97 46.06 14.36 10 45 4 10 11 133 13 0.48 6.5 4.6
1967 7 4 2 38 41.44 46.27 12.79 02 14 140 21 0.42 1.8 3.1
1967 7 20 16 20 0.04 45.6 14.59 09 3.9b b 50 4 26 13 187 49 1.11 5.9 5.1
1967 7 25 11 22 45.22 45.55 14.42 21 45 4 12 15 191 54 1.1 6.1 8.2
1967 8 7 4 30 24.03 46.34 13.02 04 9 120 4 0.5 3.6 5.8
1967 8 14 10 16 16.29 46.82 10.37 02 4.9S b 38 43 164 1.07 2.6 4.2
1967 8 18 12 2 51.46 46.53 10.61 *07 9 134 260 1.67 10.6 20.2
1967 9 5 11 37 4.55 45.89 14.06 08 4.0b d 50 4 45 37 136 30 1.12 2.7 2.6
1967 9 5 15 18 15.01 45.63 14.27 11 40 4 13 17 167 40 0.88 3.7 3.1
1967 9 5 15 21 0.14 45.66 14.21 19 45 4 18 29 165 35 0.87 2.6 2.1
1967 11 3 13 20 32.23 45.44 14.49 09 50 4 22 12 198 64 0.87 4.7 4
1967 11 8 17 42 14.07 45.53 10.93 19 23 134 75 1.05 3.6 4.4
1967 11 29 23 41 50.52 46.39 12.62 07 12 170 18 0.25 1.6 5
1967 12 9 5 45 2.04 45.5 14.45 16 11 199 59 0.52 3.8 3.4
bg817_Sandron senza testine.indd31 31 4-12-2014 11:00:43
Y M D H Mi S Lat Lon h M RM I0 RI Dist. No Gap Dmin Rms Erh Erz
1963 6 12 19 24 37.14 45.96 14.71 04 45 4 15 15 146 17 1.43 5.2 5
1963 6 19 1 20 15.32 46 14.72 11 30 4 6 6 215 16 0.12 1.8 0.9
1963 9 2 9 18 42.42 46.26 12.35 05 10 118 103 0.67 4.2 8.3
1963 10 5 11 57 43.84 45.16 10.27 04 6 157 277 0.83 14.3 11.9
1963 10 30 4 6 19.37 46.44 12.64 02 11 74 119 0.97 5.8 10.8
1963 10 31 11 54 28.99 46.24 13.6 03 40 4 8 7 168 61 0.19 1.9 2
1963 11 15 5 15 45.66 46.07 14.66 18 60 4 9 15 89 11 1.08 4.9 3.8
1963 11 20 2 16 49.51 45.88 14.71 01 45 4 26 12 159 23 1.15 4.3 5
1963 12 7 10 18 43.41 45.95 14.71 01 50 4 18 9 152 18 0.69 3 4
1963 12 29 15 31 29.07 46.41 10.11 04 20 86 65 1.36 4.4 6.5
1964 1 1 11 4 24.91 46.53 13.18 04 14 103 19 0.97 2.6 3.9
1964 1 8 16 29 31.71 46 14.57 01 30 4 10 7 143 6 0.36 2 4.7
1964 1 26 8 17 32.73 45.7 14.44 06 9 178 39 0.6 3.6 4
1964 3 7 4 28 46.08 46.28 13.39 09 6 200 69 0.07 0.7 1
1964 3 18 16 43 20.79 45.59 14.3 13 4.5S b 60 4 19 64 71 42 0.72 1.1 1.5
1964 4 11 2 48 7.4 45.92 14.69 *04 30 4 19 9 221 19 1.02 6.4 6.2
1964 5 18 10 38 46.03 46.58 12.28 *04 9 153 60 0.67 4 4.8
1964 6 4 19 8 1.91 46.29 14.54 22 40 4 51 8 137 27 0.28 4.2 1.9
1964 7 6 7 47 23.65 46.05 14.7 17 40 4 4 10 135 14 0.66 4.1 3.6
1964 7 21 22 0 56.1 46.37 13.02 07 3.2S a 17 113 2 0.67 2.6 1.9
1964 8 31 14 33 51.94 46.12 13.44 06 3.2S a 13 127 38 0.51 2.2 5.3
1964 9 5 10 20 15.62 46.53 12.87 13 11 119 19 0.31 2.4 1.4
1964 10 13 3 38 1.47 46.36 12.85 02 3.2S a 12 117 17 0.58 2.4 3
1964 11 7 15 28 0.88 46.51 14.16 32 11 110 60 0.62 5.5 9.1
1964 11 7 15 42 40.2 45.71 14.81 34 45 4 90 14 179 43 1.08 7.1 5.7
1964 11 11 9 29 15.53 46.53 13.98 *07 5 176 69 0.86 8.7 12.6
1964 11 11 16 1 10.51 46.36 13.91 22 10 85 60 0.9 4.1 8.7
1964 11 26 16 32 59.95 46.34 13.49 10 45 4 11 21 101 33 0.57 1.7 2.2
1964 12 7 6 35 54.74 46.23 12.55 04 3.8S a 20 85 18 0.95 2.9 4.2
1965 2 2 14 29 28.28 46.4 12.7 08 7 174 24 0.38 3.5 11.7
1965 2 28 0 28 22.7 46.25 14.53 04 45 4 44 10 148 23 1.68 5.8 6.7
1965 3 1 5 33 7.76 46.32 12.63 12 8 135 22 0.29 2.3 5.3
1965 3 27 22 36 21.36 46.4 12.9 07 4.0S a 29 77 9 0.94 2.7 2.6
1965 4 19 2 27 4.4 46.28 12.59 04 4.0S a 26 82 20 0.74 1.6 2.5
1965 7 8 23 20 2.78 47.47 11.31 04 4.3S e 50 11 20 33 53 132 1.91 5 7.9
1965 8 19 19 14 26.24 46.31 12.97 08 5.0S b 50 9 21 49 83 8 1.04 2.1 1.6
1965 8 19 19 41 56.7 46.29 12.95 08 4.0S a 26 121 11 0.62 1.7 1.3
1965 10 31 4 6 16.28 45.46 14.48 04 8 226 63 0.59 5.1 6.8
1965 11 12 13 7 3.89 46.56 13.37 *12 5 285 33 1.04 6 16.5
1965 11 13 11 37 22.64 46.36 13.55 18 3.8S a 40 4 6 17 97 42 0.79 3.4 3.3
1965 12 15 20 4 31.93 45.93 14.64 06 40 4 5 9 154 16 0.35 1.8 1.9
bg817_Sandron senza testine.indd30 30 4-12-2014 11:00:43
Early instrumental seismicity recorded in the eastern Alps Boll. Geof. Teor. Appl., 55, 755-788
785
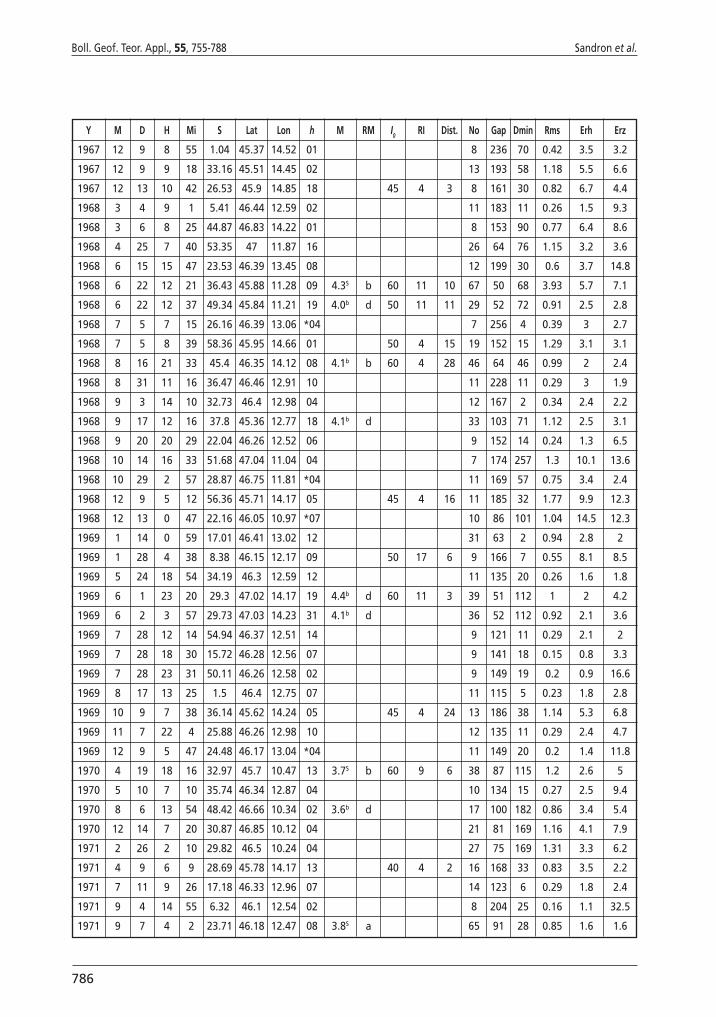
Y M D H Mi S Lat Lon h M RM I0 RI Dist. No Gap Dmin Rms Erh Erz
1967 12 9 8 55 1.04 45.37 14.52 01 8 236 70 0.42 3.5 3.2
1967 12 9 9 18 33.16 45.51 14.45 02 13 193 58 1.18 5.5 6.6
1967 12 13 10 42 26.53 45.9 14.85 18 45 4 3 8 161 30 0.82 6.7 4.4
1968 3 4 9 1 5.41 46.44 12.59 02 11 183 11 0.26 1.5 9.3
1968 3 6 8 25 44.87 46.83 14.22 01 8 153 90 0.77 6.4 8.6
1968 4 25 7 40 53.35 47 11.87 16 26 64 76 1.15 3.2 3.6
1968 6 15 15 47 23.53 46.39 13.45 08 12 199 30 0.6 3.7 14.8
1968 6 22 12 21 36.43 45.88 11.28 09 4.3S b 60 11 10 67 50 68 3.93 5.7 7.1
1968 6 22 12 37 49.34 45.84 11.21 19 4.0b d 50 11 11 29 52 72 0.91 2.5 2.8
1968 7 5 7 15 26.16 46.39 13.06 *04 7 256 4 0.39 3 2.7
1968 7 5 8 39 58.36 45.95 14.66 01 50 4 15 19 152 15 1.29 3.1 3.1
1968 8 16 21 33 45.4 46.35 14.12 08 4.1b b 60 4 28 46 64 46 0.99 2 2.4
1968 8 31 11 16 36.47 46.46 12.91 10 11 228 11 0.29 3 1.9
1968 9 3 14 10 32.73 46.4 12.98 04 12 167 2 0.34 2.4 2.2
1968 9 17 12 16 37.8 45.36 12.77 18 4.1b d 33 103 71 1.12 2.5 3.1
1968 9 20 20 29 22.04 46.26 12.52 06 9 152 14 0.24 1.3 6.5
1968 10 14 16 33 51.68 47.04 11.04 04 7 174 257 1.3 10.1 13.6
1968 10 29 2 57 28.87 46.75 11.81 *04 11 169 57 0.75 3.4 2.4
1968 12 9 5 12 56.36 45.71 14.17 05 45 4 16 11 185 32 1.77 9.9 12.3
1968 12 13 0 47 22.16 46.05 10.97 *07 10 86 101 1.04 14.5 12.3
1969 1 14 0 59 17.01 46.41 13.02 12 31 63 2 0.94 2.8 2
1969 1 28 4 38 8.38 46.15 12.17 09 50 17 6 9 166 7 0.55 8.1 8.5
1969 5 24 18 54 34.19 46.3 12.59 12 11 135 20 0.26 1.6 1.8
1969 6 1 23 20 29.3 47.02 14.17 19 4.4b d 60 11 3 39 51 112 1 2 4.2
1969 6 2 3 57 29.73 47.03 14.23 31 4.1b d 36 52 112 0.92 2.1 3.6
1969 7 28 12 14 54.94 46.37 12.51 14 9 121 11 0.29 2.1 2
1969 7 28 18 30 15.72 46.28 12.56 07 9 141 18 0.15 0.8 3.3
1969 7 28 23 31 50.11 46.26 12.58 02 9 149 19 0.2 0.9 16.6
1969 8 17 13 25 1.5 46.4 12.75 07 11 115 5 0.23 1.8 2.8
1969 10 9 7 38 36.14 45.62 14.24 05 45 4 24 13 186 38 1.14 5.3 6.8
1969 11 7 22 4 25.88 46.26 12.98 10 12 135 11 0.29 2.4 4.7
1969 12 9 5 47 24.48 46.17 13.04 *04 11 149 20 0.2 1.4 11.8
1970 4 19 18 16 32.97 45.7 10.47 13 3.7S b 60 9 6 38 87 115 1.2 2.6 5
1970 5 10 7 10 35.74 46.34 12.87 04 10 134 15 0.27 2.5 9.4
1970 8 6 13 54 48.42 46.66 10.34 02 3.6b d 17 100 182 0.86 3.4 5.4
1970 12 14 7 20 30.87 46.85 10.12 04 21 81 169 1.16 4.1 7.9
1971 2 26 2 10 29.82 46.5 10.24 04 27 75 169 1.31 3.3 6.2
1971 4 9 6 9 28.69 45.78 14.17 13 40 4 2 16 168 33 0.83 3.5 2.2
1971 7 11 9 26 17.18 46.33 12.96 07 14 123 6 0.29 1.8 2.4
1971 9 4 14 55 6.32 46.1 12.54 02 8 204 25 0.16 1.1 32.5
1971 9 7 4 2 23.71 46.18 12.47 08 3.8S a 65 91 28 0.85 1.6 1.6
bg817_Sandron senza testine.indd32 32 4-12-2014 11:00:44
786
Boll. Geof. Teor. Appl., 55, 755-788 Sandron et al.
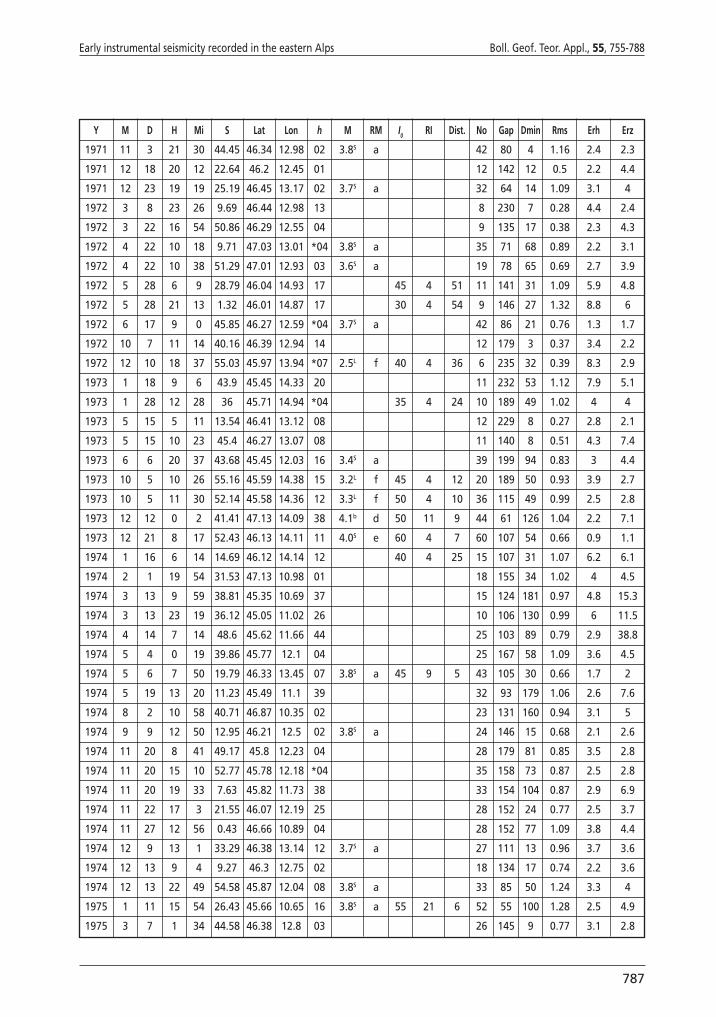
Y M D H Mi S Lat Lon h M RM I0 RI Dist. No Gap Dmin Rms Erh Erz
1971 11 3 21 30 44.45 46.34 12.98 02 3.8S a 42 80 4 1.16 2.4 2.3
1971 12 18 20 12 22.64 46.2 12.45 01 12 142 12 0.5 2.2 4.4
1971 12 23 19 19 25.19 46.45 13.17 02 3.7S a 32 64 14 1.09 3.1 4
1972 3 8 23 26 9.69 46.44 12.98 13 8 230 7 0.28 4.4 2.4
1972 3 22 16 54 50.86 46.29 12.55 04 9 135 17 0.38 2.3 4.3
1972 4 22 10 18 9.71 47.03 13.01 *04 3.8S a 35 71 68 0.89 2.2 3.1
1972 4 22 10 38 51.29 47.01 12.93 03 3.6S a 19 78 65 0.69 2.7 3.9
1972 5 28 6 9 28.79 46.04 14.93 17 45 4 51 11 141 31 1.09 5.9 4.8
1972 5 28 21 13 1.32 46.01 14.87 17 30 4 54 9 146 27 1.32 8.8 6
1972 6 17 9 0 45.85 46.27 12.59 *04 3.7S a 42 86 21 0.76 1.3 1.7
1972 10 7 11 14 40.16 46.39 12.94 14 12 179 3 0.37 3.4 2.2
1972 12 10 18 37 55.03 45.97 13.94 *07 2.5L f 40 4 36 6 235 32 0.39 8.3 2.9
1973 1 18 9 6 43.9 45.45 14.33 20 11 232 53 1.12 7.9 5.1
1973 1 28 12 28 36 45.71 14.94 *04 35 4 24 10 189 49 1.02 4 4
1973 5 15 5 11 13.54 46.41 13.12 08 12 229 8 0.27 2.8 2.1
1973 5 15 10 23 45.4 46.27 13.07 08 11 140 8 0.51 4.3 7.4
1973 6 6 20 37 43.68 45.45 12.03 16 3.4S a 39 199 94 0.83 3 4.4
1973 10 5 10 26 55.16 45.59 14.38 15 3.2L f 45 4 12 20 189 50 0.93 3.9 2.7
1973 10 5 11 30 52.14 45.58 14.36 12 3.3L f 50 4 10 36 115 49 0.99 2.5 2.8
1973 12 12 0 2 41.41 47.13 14.09 38 4.1b d 50 11 9 44 61 126 1.04 2.2 7.1
1973 12 21 8 17 52.43 46.13 14.11 11 4.0S e 60 4 7 60 107 54 0.66 0.9 1.1
1974 1 16 6 14 14.69 46.12 14.14 12 40 4 25 15 107 31 1.07 6.2 6.1
1974 2 1 19 54 31.53 47.13 10.98 01 18 155 34 1.02 4 4.5
1974 3 13 9 59 38.81 45.35 10.69 37 15 124 181 0.97 4.8 15.3
1974 3 13 23 19 36.12 45.05 11.02 26 10 106 130 0.99 6 11.5
1974 4 14 7 14 48.6 45.62 11.66 44 25 103 89 0.79 2.9 38.8
1974 5 4 0 19 39.86 45.77 12.1 04 25 167 58 1.09 3.6 4.5
1974 5 6 7 50 19.79 46.33 13.45 07 3.8S a 45 9 5 43 105 30 0.66 1.7 2
1974 5 19 13 20 11.23 45.49 11.1 39 32 93 179 1.06 2.6 7.6
1974 8 2 10 58 40.71 46.87 10.35 02 23 131 160 0.94 3.1 5
1974 9 9 12 50 12.95 46.21 12.5 02 3.8S a 24 146 15 0.68 2.1 2.6
1974 11 20 8 41 49.17 45.8 12.23 04 28 179 81 0.85 3.5 2.8
1974 11 20 15 10 52.77 45.78 12.18 *04 35 158 73 0.87 2.5 2.8
1974 11 20 19 33 7.63 45.82 11.73 38 33 154 104 0.87 2.9 6.9
1974 11 22 17 3 21.55 46.07 12.19 25 28 152 24 0.77 2.5 3.7
1974 11 27 12 56 0.43 46.66 10.89 04 28 152 77 1.09 3.8 4.4
1974 12 9 13 1 33.29 46.38 13.14 12 3.7S a 27 111 13 0.96 3.7 3.6
1974 12 13 9 4 9.27 46.3 12.75 02 18 134 17 0.74 2.2 3.6
1974 12 13 22 49 54.58 45.87 12.04 08 3.8S a 33 85 50 1.24 3.3 4
1975 1 11 15 54 26.43 45.66 10.65 16 3.8S a 55 21 6 52 55 100 1.28 2.5 4.9
1975 3 7 1 34 44.58 46.38 12.8 03 26 145 9 0.77 3.1 2.8
bg817_Sandron senza testine.indd33 33 4-12-2014 11:00:44
Y M D H Mi S Lat Lon h M RM I0 RI Dist. No Gap Dmin Rms Erh Erz
1967 12 9 8 55 1.04 45.37 14.52 01 8 236 70 0.42 3.5 3.2
1967 12 9 9 18 33.16 45.51 14.45 02 13 193 58 1.18 5.5 6.6
1967 12 13 10 42 26.53 45.9 14.85 18 45 4 3 8 161 30 0.82 6.7 4.4
1968 3 4 9 1 5.41 46.44 12.59 02 11 183 11 0.26 1.5 9.3
1968 3 6 8 25 44.87 46.83 14.22 01 8 153 90 0.77 6.4 8.6
1968 4 25 7 40 53.35 47 11.87 16 26 64 76 1.15 3.2 3.6
1968 6 15 15 47 23.53 46.39 13.45 08 12 199 30 0.6 3.7 14.8
1968 6 22 12 21 36.43 45.88 11.28 09 4.3S b 60 11 10 67 50 68 3.93 5.7 7.1
1968 6 22 12 37 49.34 45.84 11.21 19 4.0b d 50 11 11 29 52 72 0.91 2.5 2.8
1968 7 5 7 15 26.16 46.39 13.06 *04 7 256 4 0.39 3 2.7
1968 7 5 8 39 58.36 45.95 14.66 01 50 4 15 19 152 15 1.29 3.1 3.1
1968 8 16 21 33 45.4 46.35 14.12 08 4.1b b 60 4 28 46 64 46 0.99 2 2.4
1968 8 31 11 16 36.47 46.46 12.91 10 11 228 11 0.29 3 1.9
1968 9 3 14 10 32.73 46.4 12.98 04 12 167 2 0.34 2.4 2.2
1968 9 17 12 16 37.8 45.36 12.77 18 4.1b d 33 103 71 1.12 2.5 3.1
1968 9 20 20 29 22.04 46.26 12.52 06 9 152 14 0.24 1.3 6.5
1968 10 14 16 33 51.68 47.04 11.04 04 7 174 257 1.3 10.1 13.6
1968 10 29 2 57 28.87 46.75 11.81 *04 11 169 57 0.75 3.4 2.4
1968 12 9 5 12 56.36 45.71 14.17 05 45 4 16 11 185 32 1.77 9.9 12.3
1968 12 13 0 47 22.16 46.05 10.97 *07 10 86 101 1.04 14.5 12.3
1969 1 14 0 59 17.01 46.41 13.02 12 31 63 2 0.94 2.8 2
1969 1 28 4 38 8.38 46.15 12.17 09 50 17 6 9 166 7 0.55 8.1 8.5
1969 5 24 18 54 34.19 46.3 12.59 12 11 135 20 0.26 1.6 1.8
1969 6 1 23 20 29.3 47.02 14.17 19 4.4b d 60 11 3 39 51 112 1 2 4.2
1969 6 2 3 57 29.73 47.03 14.23 31 4.1b d 36 52 112 0.92 2.1 3.6
1969 7 28 12 14 54.94 46.37 12.51 14 9 121 11 0.29 2.1 2
1969 7 28 18 30 15.72 46.28 12.56 07 9 141 18 0.15 0.8 3.3
1969 7 28 23 31 50.11 46.26 12.58 02 9 149 19 0.2 0.9 16.6
1969 8 17 13 25 1.5 46.4 12.75 07 11 115 5 0.23 1.8 2.8
1969 10 9 7 38 36.14 45.62 14.24 05 45 4 24 13 186 38 1.14 5.3 6.8
1969 11 7 22 4 25.88 46.26 12.98 10 12 135 11 0.29 2.4 4.7
1969 12 9 5 47 24.48 46.17 13.04 *04 11 149 20 0.2 1.4 11.8
1970 4 19 18 16 32.97 45.7 10.47 13 3.7S b 60 9 6 38 87 115 1.2 2.6 5
1970 5 10 7 10 35.74 46.34 12.87 04 10 134 15 0.27 2.5 9.4
1970 8 6 13 54 48.42 46.66 10.34 02 3.6b d 17 100 182 0.86 3.4 5.4
1970 12 14 7 20 30.87 46.85 10.12 04 21 81 169 1.16 4.1 7.9
1971 2 26 2 10 29.82 46.5 10.24 04 27 75 169 1.31 3.3 6.2
1971 4 9 6 9 28.69 45.78 14.17 13 40 4 2 16 168 33 0.83 3.5 2.2
1971 7 11 9 26 17.18 46.33 12.96 07 14 123 6 0.29 1.8 2.4
1971 9 4 14 55 6.32 46.1 12.54 02 8 204 25 0.16 1.1 32.5
1971 9 7 4 2 23.71 46.18 12.47 08 3.8S a 65 91 28 0.85 1.6 1.6
bg817_Sandron senza testine.indd32 32 4-12-2014 11:00:44
Early instrumental seismicity recorded in the eastern Alps Boll. Geof. Teor. Appl., 55, 755-788
787
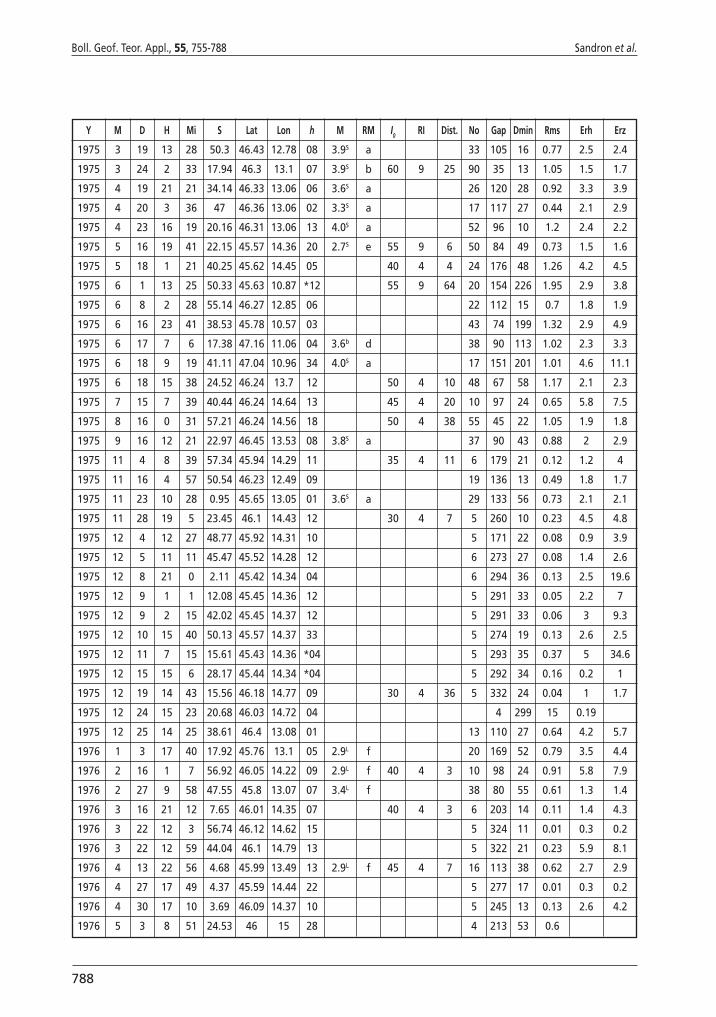
Y M D H Mi S Lat Lon h M RM I0 RI Dist. No Gap Dmin Rms Erh Erz
1975 3 19 13 28 50.3 46.43 12.78 08 3.9S a 33 105 16 0.77 2.5 2.4
1975 3 24 2 33 17.94 46.3 13.1 07 3.9S b 60 9 25 90 35 13 1.05 1.5 1.7
1975 4 19 21 21 34.14 46.33 13.06 06 3.6S a 26 120 28 0.92 3.3 3.9
1975 4 20 3 36 47 46.36 13.06 02 3.3S a 17 117 27 0.44 2.1 2.9
1975 4 23 16 19 20.16 46.31 13.06 13 4.0S a 52 96 10 1.2 2.4 2.2
1975 5 16 19 41 22.15 45.57 14.36 20 2.7S e 55 9 6 50 84 49 0.73 1.5 1.6
1975 5 18 1 21 40.25 45.62 14.45 05 40 4 4 24 176 48 1.26 4.2 4.5
1975 6 1 13 25 50.33 45.63 10.87 *12 55 9 64 20 154 226 1.95 2.9 3.8
1975 6 8 2 28 55.14 46.27 12.85 06 22 112 15 0.7 1.8 1.9
1975 6 16 23 41 38.53 45.78 10.57 03 43 74 199 1.32 2.9 4.9
1975 6 17 7 6 17.38 47.16 11.06 04 3.6b d 38 90 113 1.02 2.3 3.3
1975 6 18 9 19 41.11 47.04 10.96 34 4.0S a 17 151 201 1.01 4.6 11.1
1975 6 18 15 38 24.52 46.24 13.7 12 50 4 10 48 67 58 1.17 2.1 2.3
1975 7 15 7 39 40.44 46.24 14.64 13 45 4 20 10 97 24 0.65 5.8 7.5
1975 8 16 0 31 57.21 46.24 14.56 18 50 4 38 55 45 22 1.05 1.9 1.8
1975 9 16 12 21 22.97 46.45 13.53 08 3.8S a 37 90 43 0.88 2 2.9
1975 11 4 8 39 57.34 45.94 14.29 11 35 4 11 6 179 21 0.12 1.2 4
1975 11 16 4 57 50.54 46.23 12.49 09 19 136 13 0.49 1.8 1.7
1975 11 23 10 28 0.95 45.65 13.05 01 3.6S a 29 133 56 0.73 2.1 2.1
1975 11 28 19 5 23.45 46.1 14.43 12 30 4 7 5 260 10 0.23 4.5 4.8
1975 12 4 12 27 48.77 45.92 14.31 10 5 171 22 0.08 0.9 3.9
1975 12 5 11 11 45.47 45.52 14.28 12 6 273 27 0.08 1.4 2.6
1975 12 8 21 0 2.11 45.42 14.34 04 6 294 36 0.13 2.5 19.6
1975 12 9 1 1 12.08 45.45 14.36 12 5 291 33 0.05 2.2 7
1975 12 9 2 15 42.02 45.45 14.37 12 5 291 33 0.06 3 9.3
1975 12 10 15 40 50.13 45.57 14.37 33 5 274 19 0.13 2.6 2.5
1975 12 11 7 15 15.61 45.43 14.36 *04 5 293 35 0.37 5 34.6
1975 12 15 15 6 28.17 45.44 14.34 *04 5 292 34 0.16 0.2 1
1975 12 19 14 43 15.56 46.18 14.77 09 30 4 36 5 332 24 0.04 1 1.7
1975 12 24 15 23 20.68 46.03 14.72 04 4 299 15 0.19
1975 12 25 14 25 38.61 46.4 13.08 01 13 110 27 0.64 4.2 5.7
1976 1 3 17 40 17.92 45.76 13.1 05 2.9L f 20 169 52 0.79 3.5 4.4
1976 2 16 1 7 56.92 46.05 14.22 09 2.9L f 40 4 3 10 98 24 0.91 5.8 7.9
1976 2 27 9 58 47.55 45.8 13.07 07 3.4L f 38 80 55 0.61 1.3 1.4
1976 3 16 21 12 7.65 46.01 14.35 07 40 4 3 6 203 14 0.11 1.4 4.3
1976 3 22 12 3 56.74 46.12 14.62 15 5 324 11 0.01 0.3 0.2
1976 3 22 12 59 44.04 46.1 14.79 13 5 322 21 0.23 5.9 8.1
1976 4 13 22 56 4.68 45.99 13.49 13 2.9L f 45 4 7 16 113 38 0.62 2.7 2.9
1976 4 27 17 49 4.37 45.59 14.44 22 5 277 17 0.01 0.3 0.2
1976 4 30 17 10 3.69 46.09 14.37 10 5 245 13 0.13 2.6 4.2
1976 5 3 8 51 24.53 46 15 28 4 213 53 0.6
bg817_Sandron senza testine.indd34 34 4-12-2014 11:00:45
788
Boll. Geof. Teor. Appl., 55, 755-788 Sandron et al.
Related Documents


![Linking the northern Alps with their foreland: The latest ... · detachment underneath the basin has been suggested by Mosar [1999] based on exhumation and seismicity data and Becker](https://static.cupdf.com/doc/110x72/5b95a0f109d3f2c2678c8dff/linking-the-northern-alps-with-their-foreland-the-latest-detachment-underneath.jpg)

