AMTD 4, 2827–2881, 2011 Early in flight detection of SO 2 Vogel et al. Title Page Abstract Introduction Conclusions References Tables Figures Back Close Full Screen / Esc Printer-friendly Version Interactive Discussion Discussion Paper | Discussion Paper | Discussion Paper | Discussion Paper | Atmos. Meas. Tech. Discuss., 4, 2827–2881, 2011 www.atmos-meas-tech-discuss.net/4/2827/2011/ doi:10.5194/amtd-4-2827-2011 © Author(s) 2011. CC Attribution 3.0 License. Atmospheric Measurement Techniques Discussions This discussion paper is/has been under review for the journal Atmospheric Measure- ment Techniques (AMT). Please refer to the corresponding final paper in AMT if available. Early in-flight detection of SO 2 via Differential Optical Absorption Spectroscopy: a feasible aviation safety measure to prevent potential encounters with volcanic plumes L. Vogel 1 , B. Galle 2 , C. Kern 1,* , H. Delgado Granados 3 , V. Conde 2 , P. Norman 2 , S. Arellano 2 , O. Landgren 2 , P. L¨ ubcke 1 , J. M. Alvarez Nieves 3 , L. C ´ ardenas Gonz ´ ales 4 , and U. Platt 1 1 Institute of Environmental Physics, University Heidelberg, Heidelberg, Germany 2 Department of Earth and Space Sciences, Chalmers University of Technology, Gothenburg, Sweden 2827

Welcome message from author
This document is posted to help you gain knowledge. Please leave a comment to let me know what you think about it! Share it to your friends and learn new things together.
Transcript
AMTD4, 2827–2881, 2011
Early in flightdetection of SO2
Vogel et al.
Title Page
Abstract Introduction
Conclusions References
Tables Figures
J I
J I
Back Close
Full Screen / Esc
Printer-friendly Version
Interactive Discussion
Discussion
Paper
|D
iscussionP
aper|
Discussion
Paper
|D
iscussionP
aper|
Atmos. Meas. Tech. Discuss., 4, 2827–2881, 2011www.atmos-meas-tech-discuss.net/4/2827/2011/doi:10.5194/amtd-4-2827-2011© Author(s) 2011. CC Attribution 3.0 License.
AtmosphericMeasurement
TechniquesDiscussions
This discussion paper is/has been under review for the journal Atmospheric Measure-ment Techniques (AMT). Please refer to the corresponding final paper in AMTif available.
Early in-flight detection of SO2 viaDifferential Optical AbsorptionSpectroscopy: a feasible aviation safetymeasure to prevent potential encounterswith volcanic plumesL. Vogel1, B. Galle2, C. Kern1,*, H. Delgado Granados3, V. Conde2, P. Norman2,S. Arellano2, O. Landgren2, P. Lubcke1, J. M. Alvarez Nieves3, L. CardenasGonzales4, and U. Platt1
1Institute of Environmental Physics, University Heidelberg, Heidelberg, Germany2Department of Earth and Space Sciences, Chalmers University of Technology,Gothenburg, Sweden
2827
AMTD4, 2827–2881, 2011
Early in flightdetection of SO2
Vogel et al.
Title Page
Abstract Introduction
Conclusions References
Tables Figures
J I
J I
Back Close
Full Screen / Esc
Printer-friendly Version
Interactive Discussion
Discussion
Paper
|D
iscussionP
aper|
Discussion
Paper
|D
iscussionP
aper|
3Instituto de Geofısica, UNAM, Mexico D. F., Mexico4Centro Nacional de Prevencion de Desastres, Mexico D. F., Mexico∗now at: Cascades Volcano Observatory, US Geological Survey, Vancouver, WA, USA
Received: 5 May 2011 – Accepted: 9 May 2011 – Published: 16 May 2011
Correspondence to: L. Vogel ([email protected])
Published by Copernicus Publications on behalf of the European Geosciences Union.
2828
AMTD4, 2827–2881, 2011
Early in flightdetection of SO2
Vogel et al.
Title Page
Abstract Introduction
Conclusions References
Tables Figures
J I
J I
Back Close
Full Screen / Esc
Printer-friendly Version
Interactive Discussion
Discussion
Paper
|D
iscussionP
aper|
Discussion
Paper
|D
iscussionP
aper|
Abstract
Volcanic ash constitutes a risk to aviation, mainly due to its ability to cause jet en-gines to fail. Other risks include the possibility of abrasion of windshields and poten-tially serious damage to avionic systems. These hazards have been widely recognizedsince the early 1980s, when volcanic ash provoked several incidents of engine failure in5
commercial aircraft. In addition to volcanic ash, volcanic gases also pose a threat. Pro-longed and/or cumulative exposure to sulphur dioxide (SO2) or sulphuric acid (H2SO4)aerosols potentially affects e.g. windows, air frame and may cause permanent damageto engines. SO2 receives most attention among the gas species commonly found involcanic plumes because its presence above the lower troposphere is a clear proxy for10
a volcanic cloud and indicates that fine ash could also be present.Up to now, remote sensing of SO2 via Differential Optical Absorption Spectroscopy(DOAS) in the ultraviolet spectral region has been used to measure volcanic cloudsfrom ground based, airborne and satellite platforms. Attention has been given to vol-canic emission strength, chemistry inside volcanic clouds and measurement proce-15
dures were adapted accordingly. Here we present a set of experimental and modelresults, highlighting the feasibility of DOAS to be used as an airborne early detectionsystem of SO2 in two spatial dimensions. In order to prove our new concept, simultane-ous airborne and ground-based measurements of the plume of Popocatepetl volcano,Mexico, were conducted in April 2010. The plume extended at an altitude around20
5250 m above sea level and was approached and traversed at the same altitude withseveral forward looking DOAS systems aboard an airplane. These DOAS systemsmeasured SO2 in the flight direction and at ±40 mrad (2.3◦) angles relative to it in both,horizontal and vertical directions. The approaches started at up to 25 km distance tothe plume and SO2 was measured at all times well above the detection limit. In com-25
bination with radiative transfer studies, this study indicates that an extended volcaniccloud with a concentration of 1012 molecules cm−3 at typical flight levels of 10 km canbe detected unambiguously at distances of up to 80 km away. This range provides
2829
AMTD4, 2827–2881, 2011
Early in flightdetection of SO2
Vogel et al.
Title Page
Abstract Introduction
Conclusions References
Tables Figures
J I
J I
Back Close
Full Screen / Esc
Printer-friendly Version
Interactive Discussion
Discussion
Paper
|D
iscussionP
aper|
Discussion
Paper
|D
iscussionP
aper|
enough time (approx. 5 min) for pilots to take action to avoid entering a volcanic cloudin the flight path, suggesting that this technique can be used as an effective aid toprevent dangerous aircraft encounters with potentially ash rich volcanic clouds.
1 Introduction
Volcanic gaseous emissions are typically composed of carbon dioxide (CO2), water5
vapour, sulphur dioxide (SO2), and halogen compounds. Depending on the conditionsthe plumes/clouds can also contain large amounts of ash (i.e. small, solid particles). Aseries of life threatening encounters of aircraft with ash-loaded volcanic clouds in the1980s highlighted the risk of volcanic emissions to aviation. The main threat is posedby volcanic ash (Miller and Casadevall, 2000; ICAO, 2007; Prata and Tupper, 2009,10
and references therein), which may lead to engine failure via flame-outs if allowed toenter high temperature jet engines. Severe incidents were reported from Mt. St. He-lens 1980, where a Lockhead C-130 lost two of its four turboprop engines; in the 1982eruption of Galunggung, Indonesia, two Boing 747 lost power in one case of all four, inthe other of three out of four engines at 11 300 m and 9000 m above sea level (a.s.l.),15
respectively. The crew of both airplanes managed to restart enough engines to make asafe landing at nearby airports, but only after descending several kilometres. A similarencounter occurred in 1989, when a Boing 747 flew into the cloud from nearby Redoubtvolcano, Alaska, and lost power of all of its four engines (Casadevall, 1994). Also inthis case, the crew managed to restart the engines one or two minutes prior to impact20
on the ground. Fortunately only economic losses resulted from these encounters andno human lives were lost. The eruption of Mt. Pinatubo 1991 resulted in more than40 incidents, but none as dramatic as the above-mentioned ones. Nevertheless, dam-age to aircraft as a result of the Mt. Pinatubo eruption were estimated to exceed US$100 million (Miller and Casadevall, 2000).25
Even encounters with volcanic clouds of relatively low ash and SO2 content may havesevere consequences to aircraft. Grindle and Burcham (2003) describe an incident in
2830
AMTD4, 2827–2881, 2011
Early in flightdetection of SO2
Vogel et al.
Title Page
Abstract Introduction
Conclusions References
Tables Figures
J I
J I
Back Close
Full Screen / Esc
Printer-friendly Version
Interactive Discussion
Discussion
Paper
|D
iscussionP
aper|
Discussion
Paper
|D
iscussionP
aper|
August 2000, where a DC-8-72 research airplane of NASA flew into a volcanic cloud ofHekla volcano, Iceland. The presence of a volcanic plume was only verified afterwardsby the scientific in-situ instruments on-board the airplane. No signs of a volcanic cloudwere perceived by the crew. Although no damage was revealed by a first visual inspec-tion of the engines, a later inspection showed that significant damage to the engines5
had occurred with clogged cooling passages of turbine blades and SO2 in the engineoil. It was estimated that the remaining lifetime of certain vital parts of the engine waslikely reduced to only about 100 h.
The incidents described above resulted from the melting point of volcanic ash(≈1100 K) being below typical operational temperature (1400 K) of jet engines if thrust10
is above idle. This can lead to clogging and accumulation of molten debris in the hotterpart of the engine and its consequent loss of power. Other effects include clogging ofcooling mechanisms which greatly reduces the engines’ lifetime, and abrasion of en-gine parts. Next to its effects to the engines, the abrasive properties of volcanic ashcan damage the outer hull of aircraft, avionic systems e.g. pitot-static tubes and abrade15
windscreens to the point of becoming opaque. Besides volcanic ash, certain volcanicgases can also be hazardous to aviation, especially sulphur dioxide SO2 and sulphuricacid H2SO4. Although they do not impair the airworthiness of an aircraft in such drasticways as volcanic ash, prolonged exposure might reduce the lifetime of aircraft systemsand lead to costly repairs and ground time of the aircraft (ICAO, 2007).20
One of the latest volcanic eruptions severely impacting commercial aviation was theApril/May 2010 eruption of Eyjafjallajokull in April 2010 with a volcanic cloud beingblown over Europe. Most of European airspace was closed for up to several weeksand although no life-threatening encounters occurred, economic losses are estimatedto range up to e2.5 billion for the airline industry alone (Zehner, 2010). This eruption25
demonstrated the vulnerability of modern societies to volcanic hazards. In the courseof the Eyjafjallajokull crisis, the “no-fly-rule”, which states that aircraft are not allowed tofly through volcanic clouds of any ash concentration, was replaced by conditional flyingzones. The “No Fly Zone” encompasses areas with ash concentration higher than 2×
2831
AMTD4, 2827–2881, 2011
Early in flightdetection of SO2
Vogel et al.
Title Page
Abstract Introduction
Conclusions References
Tables Figures
J I
J I
Back Close
Full Screen / Esc
Printer-friendly Version
Interactive Discussion
Discussion
Paper
|D
iscussionP
aper|
Discussion
Paper
|D
iscussionP
aper|
10−3 g m−3 and the “Enhanced Procedures Zone”, where volcanic ash concentrationsare predicted to be between 2×10⁻⁴ and 2×10⁻³ g m−3. This more flexible approachwas meant to keep European air-traffic operational, but also has the risk of reducedlife times of aircraft parts. Also, this new approach places new and more demandingnecessities for modelling on the volcanic advisory centres (VAACs), because a much5
more detailed initiation of models, knowledge of source terms, and incorporation of allphysical processes are necessary (ADF, 2010).
Commercial carriers rely on the volcanic ash advisory centrers (VAACs) of the In-ternational Airways Volcano Watch (IAVW) for volcanic cloud warnings and predictedlocations of these clouds (Romero, 2004; ICAO, 2007). The VAACs use a wide set of10
observations and measurements, including ground based measurements from observ-ing networks, special air-reports from pilots and observations from satellites (meteo-rological and non-meteorological). Most active volcanoes are not routinely monitored.Even if they are in remote locations, they can be in close proximity to busy air routese.g. the Aleutian islands (Kasatochi volcano) and volcanoes in Kamchatka for trans-15
Pacific air routes. Furthermore, volcanic ash ejected into higher atmospheric layerscan be rapidly dispersed over great distances (Prata, 2009), and eruption strength isnot directly linked to ejection height (Tupper et al., 2009). Satellite based measure-ments of ash and SO2 are thus the most important tool to detect volcanic clouds anderuptions (Prata, 2009; Thomas and Watson, 2010).20
Ash detection from satellite platforms can be accurately performed in the infra-red(IR) spectral region. Retrievals are typically based on the “reverse absorption”, the dif-ferent absorption structures of water and ice versus ash in the 10 to 13 µm range, bytaking the difference of these absorption structures (“brightness temperature difference(BTD) method”, Prata, 1989; Wen and Rose, 1994). In recent years the addition of fur-25
ther channels in the retrievals has improved the detection limit and the ability to identifyvolcanic ash (e.g. Pavolonis et al., 2006; Pavolonis and Sieglaff, 2010; Clarisse et al.,2010; Thomas and Watson, 2010, and references therein). While pure ash clouds canbe distinguished from water/ice clouds, mixed clouds are more difficult to separate.
2832
AMTD4, 2827–2881, 2011
Early in flightdetection of SO2
Vogel et al.
Title Page
Abstract Introduction
Conclusions References
Tables Figures
J I
J I
Back Close
Full Screen / Esc
Printer-friendly Version
Interactive Discussion
Discussion
Paper
|D
iscussionP
aper|
Discussion
Paper
|D
iscussionP
aper|
Volcanic dust clouds can also be masked by “ordinary” meteorological clouds, and arte-facts associated with dust or very cold cloud tops can cause false detections. Theselimitations have been discussed extensively and are known to the community (Prata,1989; Rose et al., 1995; Simpson et al., 2000; Prata et al., 2001). With the introductionof high resolution instruments like Infrared Atmospheric Sounding Interferometer (IASI)5
and Atmospheric Infrared Sounder (AIRS), false ash detection induced by dust can bereduced significantly (Clarisse et al., 2010).
In the context of volcanic aviation hazards, SO2 detection is used as a supplementarytechnique, because volcanic ash clouds are usually associated with SO2 clouds ofapproximately equal size and location. SO2 can be identify by its molecular absorption10
structures, both in the UV and IR spectral regions, the extent of a SO2 cloud canserve as an indicator for areas affected by volcanic ash. Typically SO2-levels in thefree troposphere are very low (< 100 ppt above 2 km, Berglen et al., 2004), thereforethere is only a very small background signal. Detection in the IR is mainly based onSO2 absorptions bands around 7.3 µm (Prata et al., 2003; Prata and Bernardo, 2007),15
the 8.6 µm (Realmuto et al., 1994), and recently was combined with the 4 µm band(Karagulian et al., 2010). Remote sensing of SO2 in the ultraviolet (UV) range is moresensitive and this region has been used since 1977 (COSPEC and later TOMS, seefor instance Krueger, 1983). Today retrievals of SO2 are based on Differential OpticalAbsorption Spectroscopy Technique (DOAS) (e.g. Platt and Stutz, 2008), and satellite-20
based SO2 detection has proven very useful in detecting and tracking volcanic plumesin several cases in the past (Khokhar et al., 2005, 2008; Rix et al., 2009; Carn et al.,2009). Although reliable, the major drawback of volcanic SO2 detection in the UVrange is its limitation to daylight and limited coverage/overpass. Also, it can only bea proxy for the greater hazard, volcanic ash, which will fall out and might lead to two25
different clouds moving in different directions due to wind shear. However, for youngclouds (up to three days after emission) SO2 remains a good tracer for a volcanic cloudwith dangerous ash contents (Carn et al., 2009; Guffanti et al., 2010; Schumann et al.,2011).
2833
AMTD4, 2827–2881, 2011
Early in flightdetection of SO2
Vogel et al.
Title Page
Abstract Introduction
Conclusions References
Tables Figures
J I
J I
Back Close
Full Screen / Esc
Printer-friendly Version
Interactive Discussion
Discussion
Paper
|D
iscussionP
aper|
Discussion
Paper
|D
iscussionP
aper|
Detection of a volcanic eruption that potentially poses a danger to aviation should inthe best case lead to a warning to aircraft within minutes. However, if the eruption goesunnoticed because the volcano is in a remote location, the weather conditions areunfavourable for satellite detection, or the satellite overpass misses it, several hoursmight pass before the thread is recognized and warning can be given. Thus already5
Prata et al. (1991) proposed an instrument on board aircraft to sense volcanic ash byits IR emission signature. A portable camera applicable for this purpose was presentedin Prata and Bernardo (2009).
Although cameras for the detection of SO2 based on two-wavelength detection inthe UV range exist since 2006 (Mori and Burton, 2006; Dalton et al., 2009; Kantzas10
et al., 2010; Bluth et al., 2007; Kern et al., 2010a), reported detection limits reportedto date are of the order of 1017 molec cm−2 SO2 slant column densities (SCDs) (Moriand Burton, 2006; Lubcke, 2010). This is not sufficient to detect expected SO2 SCDsmeasured at greater distances to the volcanic cloud, as will be shown in this study.Remote sensing with the DOAS technique is more specific and offers better sensitivity15
than two-wavelength detection schemes.In the following we will explore the feasibility of the DOAS technique as central com-
ponent of an early in flight warning system of SO2 and hence volcanic plumes. Pro-totype systems were tested, during a flight of a small airplane with forward lookingDOAS instruments mounted. The volcanic plume of Popocatepetl was approached20
several times. Popocatepetl volcano is a suitable candidate for this test, because itssummit is at a height of 5426 m (a.s.l.) while the elevation of the surrounding terrainis around 2000 m a.s.l. With the planetary boundary layer extending to an altitude of2500–3000 m above ground (Doran et al., 1998), the plume disperses usually outsidethe planetary boundary layer at heights comparable to low flying commercial aircraft.25
Reported average emissions during April 2010 were of about 20 kg s−1 (1730 Gg d−1)according to the measurements of local monitoring stations from the Network for Ob-servation of Volcanic and Atmospheric Change (NOVAC).
2834
AMTD4, 2827–2881, 2011
Early in flightdetection of SO2
Vogel et al.
Title Page
Abstract Introduction
Conclusions References
Tables Figures
J I
J I
Back Close
Full Screen / Esc
Printer-friendly Version
Interactive Discussion
Discussion
Paper
|D
iscussionP
aper|
Discussion
Paper
|D
iscussionP
aper|
The paper is structured as follows: the general concept of an early in-flight detectionsystem for SO2 based on the DOAS technique is presented in Sect. 2. Section 3 de-scribes the experimental setup used to proof the concept and the performed airbornemeasurements as well as additional ground based measurements. Also, the retrievalof SO2 from gathered spectra is given. Radiative transfer studies performed with the5
conditions at hand are introduced. Subsequently, the results are discussed in Sect. 4.Experimental data is compared with radiative transfer studies to infer the maximum dis-tance for detecting SO2 in Sect. 5. The results of this study are concluded in Sect. 6. Ananalytical description of the expected decrease of SO2 signal with distance is derivedin Appendix A.10
2 Early in-flight detection of SO2 via Differential Optical AbsorptionSpectroscopy
Airborne DOAS measurements are routinely performed from various research aircraft.A recent examples from CARIBIC (Civil Aircraft for Regular Investigation of the atmo-sphere Based on an Instrument Container) of observations of volcanic plumes are15
described in Heue et al. (2011), which measured volcanic clouds originating fromKasatochi, 2008, and Eyjafjallajokull, 2010. Different trace gases could be identified(BrO, SO2). These measurements were performed with sideways looking instrumentsand interest was focused on satellite validation and plume chemistry. Here, we explic-itly study the capabilities of a forward looking DOAS instrument as an early warning20
system for SO2.Figure 1 illustrates the SO2 signal to be expected from a forward looking telescope
mounted in an airplane. In the upper part, it shows as sketch of the observationgeometry for a forward looking telescope in an aircraft approaching a volcanic plumeand in the lower part the expected SO2 slant column densities (SCDs) for an airborne25
approach traversing through the plume as well for a ground-based, upward lookinginstrument (e.g. an instrument mounted on a car) traversing beneath the plume. A
2835
AMTD4, 2827–2881, 2011
Early in flightdetection of SO2
Vogel et al.
Title Page
Abstract Introduction
Conclusions References
Tables Figures
J I
J I
Back Close
Full Screen / Esc
Printer-friendly Version
Interactive Discussion
Discussion
Paper
|D
iscussionP
aper|
Discussion
Paper
|D
iscussionP
aper|
gaussian distribution of the SO2 concentration in the plume is assumed. Also indicatedare three regimes for airborne approaches: A – the plume only partly fills the field ofview (FOV) of the instrument, B – the plume completely fills the FOV, C – the measure-ments are performed inside the plume. In regime A there is a strong increase of theSO2 SCD with decreasing distance to the plume for two reasons, (1) as the instrument5
approaches the plume it continues to fill a larger part of the FOV, thus (2) less radi-ation is scattered into the FOV between the instrument and the plume. The radiationfrom the FOV not having penetrated the plume does not carry the SO2 absorption sig-nature, thus, both effects will lead to increase of the SO2 optical density seen by theinstrument at smaller distances to the plume. Once the volcanic plume fills the FOV of10
the instrument (regime B), increase in SO2 absorption structure with decreasing dis-tance should follow an exponential increase with a subsequent drop in retrieved SO2signal inside the plume. It is interesting to note that (for an optically thin plume withlittle multiple scattering inside) the airborne measurements will see the maximum SO2SCD when the aircraft (and thus the instrument) reaches the front edge of the plume.15
Ground-based instruments will see the maximum SO2 SCD when the instrument is justbelow the plume centre. As our radiative transfer study (Sect. 3.4) and measured data(Sect. 3) show in this study, the exact gradient seen by an instrument inside the plumedepends on the aerosol load at hand. Also, the maximum SO2 SCD might be perceivednot at the edge but further inwards in the plume for airborne approaches.20
In order to take evasive measures and prevent an encounter of the aircraft with avolcanic cloud, the above described approach of an instrument looking along the directflight vector needs to be extended to resolve the plume spatially. This is easily achievedby additional instruments with viewing directions along a horizontal and vertical offsetto the flight vector. In the best case this would result in displaying a two dimensional25
distribution of SO2 SCDs in the direction of flight of the aircraft (see Sect. 3), allowingto circumvent areas of increased SO2 concentration and minimizing the chance toencounter volcanic ash by evasive action.
2836

AMTD4, 2827–2881, 2011
Early in flightdetection of SO2
Vogel et al.
Title Page
Abstract Introduction
Conclusions References
Tables Figures
J I
J I
Back Close
Full Screen / Esc
Printer-friendly Version
Interactive Discussion
Discussion
Paper
|D
iscussionP
aper|
Discussion
Paper
|D
iscussionP
aper|
An additional radiative transfer study was conducted to reproduce the measure-ments, extrapolate found dependencies to greater distances and infer the limit of de-tectability of the plume.
3 Experimental setup
In order to provide experimental proof of our concept for a DOAS-based early warning5
system, we performed measurements on board a small airplane probing the plume ofPopocatepetl volcano, Mexico, on 24 April 2010. As mentioned above, Popocatepetlis especially well suited for studies on the detection of SO2 from airplanes due to(1) its high altitude of 5426 m a.s.l. and its relatively high SO2 emission flux. More-over (2), Popocatepetl is one of the volcanoes, which are equipped with ground-based10
DOAS instrumentation for continuous monitoring of the SO2 emission flux within theNOVAC network (Galle et al., 2010), thus independent measurements of the SO2 emis-sion were available, which were – according to the ground-based network – around1900 Gg day−1 during the time of our measurements. Also, plume height and direc-tion were monitored by two additional ground based stationary scanning instruments15
and conventional car traverses of the plume were conducted with a zenith sky look-ing DOAS instrument. (3) These flights provided a largely realistic simulation of anencounter with an arbitrary volcanic plume in the troposphere outside of the plane-tary boundary layer (PBL) as e.g. encountered during the Eyjafjallajokull eruption overEurope during April and May 2010.20
The meteorological conditions were stable with clear visibility at flight altitude for allapproaches. An open cloud cover well above the plume was present as well as a slighthaze in the boundary layer below.
The airborne measurements were conducted with a Cessna 421, on which threetelescopes were installed next to the window of the copilot. One telescope was25
pointing directly forward at 0 mrad elevation angle, where as the other two were dualbeam telescopes similar to the ones described in Johansson et al., 2009. Each dual
2837
AMTD4, 2827–2881, 2011
Early in flightdetection of SO2
Vogel et al.
Title Page
Abstract Introduction
Conclusions References
Tables Figures
J I
J I
Back Close
Full Screen / Esc
Printer-friendly Version
Interactive Discussion
Discussion
Paper
|D
iscussionP
aper|
Discussion
Paper
|D
iscussionP
aper|
beam telescope has two viewing directions separated by 80 mrad (4.6◦). These tele-scopes were aligned such that they were pointing 40 mrad (2.3◦) towards port andstarboard and 40 mrad above and below the central viewing direction, respectively(Fig. 2). Each of the tree telescopes was connected to a spectrometer (or two inthe case of the dual beam telescopes) with which the incident light was spectrally5
analysed. The fibre from the centre looking telescope was connected to a highgrade spectrograph (QE65000, Ocean Optics), light from the sideways looking dual-beam telescopes was analysed with dual spectrograph of type S2000 (Ocean Optics)with (compared to the QE65000 instrument) somewhat lower resolution and highernoise (Table 1). The field of view (FOV) for all five viewing directions was 8 mrad10
(0.46◦). In this way, the setup was able not only to detect the volcanic plume butalso gather information on its spatial extent. The instrumental setup was very com-pact with telescopes of size 115 mm×40 mm (length×diameter) and spectrographdimensions (length×width×height) of 141.6 mm×104.9 mm×40.9 mm (S2000) and182 mm×110 mm×47 mm (QE65000).15
3.1 Airborne measurements
In total, six approaches towards and subsequent traverse through the volcanic plumewere made between 16:00 h and 17:15 h UTC. They are labelled I till VI in Fig. 3. Fur-ther information on average altitude a.s.l. and direction of approach [azimuth ◦N] aregiven in Table 2. The azimuth and elevation angles were calculated from the GPS data20
recorded on board the aircraft. Thus both values represent viewing direction basedon the difference between two subsequent locations of measurement and can only beapproximates for the planes orientations yaw, pitch and actual viewing direction of thetelescopes.
The purpose of approaches I and II was to gather information about the plume al-25
titude and to test the instrumental setup before going to greater distances from theplume. Like approach VI, they are not well suited for studying the detectability of SO2due to the encounter of strong inhomogeneities in the plume, or since the aircraft flew
2838
AMTD4, 2827–2881, 2011
Early in flightdetection of SO2
Vogel et al.
Title Page
Abstract Introduction
Conclusions References
Tables Figures
J I
J I
Back Close
Full Screen / Esc
Printer-friendly Version
Interactive Discussion
Discussion
Paper
|D
iscussionP
aper|
Discussion
Paper
|D
iscussionP
aper|
at the wrong altitude and/or changes in flight course had to be made. The effect ofa misaligned approach of the plane can be seen e.g. in approach II, where a changein the plane’s approach elevation angle was associated with a sudden increase in theSO2 column density measured by the central DOAS instrument (Fig. 8). While thisapproach can not be used to study DOAS as an early detection technique of SO2 it5
still allows comparison with the car traverse (Sect. 4.1). Approaches III, IV and V wereconducted starting at larger distance to the plume and will be discussed in detail in thefollowing. Due to air space restrictions the maximum distance to the plume achievedat the start of an approach was only 25 km or less. To draw conclusions about themaximum distance at which SO2 from the plume might still be detected, the measure-10
ments need to be extrapolated using theoretical considerations (Appendix A) as wellas radiative transfer model studies (Sect. 5).
3.2 Ground based measurements
Further measurements were conducted from the ground to provide plume altitude andwind direction. These parameters were communicated to the airplane via radio link.15
A zenith pointing DOAS instrument was mounted on a car and used to conduct tra-verse measurements under the plume between 8 and 14 km distance to the crater,yielding location and extent of the plume as well as wind direction (Fig. 4). Becauseof road conditions and construction along the way, traversing the plume generally tookabout one hour. Also, the plume was not blown perpendicular to the road. Calculation20
of fluxes and wind direction was performed using the MobileDOAS software package(Zhang and Johansson).
Additionally, two stationary DOAS instruments were deployed on both edges of theplume (Fig. 4), allowing to approximate wind direction as well as the plume altitude.The instrumental design is analogue to the NOVAC instrument Version I as described25
in Galle et al. (2010). They scan the volcanic plume along a 60◦ cone, which is aroutinely performed volcanic gas emission measurement technique in the NOVAC net-work. Calculation of plume height and direction was also performed with the NOVAC
2839
AMTD4, 2827–2881, 2011
Early in flightdetection of SO2
Vogel et al.
Title Page
Abstract Introduction
Conclusions References
Tables Figures
J I
J I
Back Close
Full Screen / Esc
Printer-friendly Version
Interactive Discussion
Discussion
Paper
|D
iscussionP
aper|
Discussion
Paper
|D
iscussionP
aper|
software package. The stationary instruments had the advantage of a higher timeresolution (≈10 min per scan) than the traverses.
3.3 The DOAS retrieval
All gathered spectra were evaluated using the DOASIS software package from the Insti-tute for Environmental Physics, Heidelberg, Germany (Doasis; Kraus, 2006; Lehmann,5
2011). The program applies a combination of a non-linear Levenberg-Marquardt anda standard least-squares fit to determine the optical density of trace gas absorption(Platt and Stutz, 2008). Absorption cross sections of the following species were in-cluded in the fit: SO2 at 273 K (Bogumil et al., 2003) and O3 at 280 K (Voigt et al.,2001), both chosen for their close vicinity to ambient temperature at the flight height. In10
addition to SO2 and O3, also a clear sky reference (CSR) spectrum and a Ring spec-trum (Solomon et al., 1987) were fitted. The latter was calculated from the CSR withthe software DOASIS. Broad band absorptions and Mie scattering were accounted forby using a polynomial of 3rd order and a wavelength-independent offset was includedto correct for possible stray light. All spectra collected were evaluated in the wave-15
length range between 307.4–317.8 nm. For all instruments and approaches of the air-borne measurements, CSR spectra were constructed from 10 consecutively recordedspectra, measured after the plane had passed the plume but still continued on thesame course. Thus the CSR was recorded under as similar as possible illuminationconditions as the actual measurements and in close temporal proximity. The CSR20
was wavelength calibrated by comparison to a high resolution solar spectrum (Kurucz,2005), which was convoluted with the respective instrumental slit function. The ob-tained calibrations were transferred to all other spectra of corresponding approach andinstrument. The ambient temperature at flight altitude was approximately −1 ◦C ac-cording to data from the READY NOAA model (READY) at 500 mbar or 5120 m a.s.l. at25
the time of the flight on 24 April 2010.Note that in contrast to previous radiative transfer studies (Mori et al., 2006; Kern
et al., 2010b), here we do not aim to retrieve correct SO2 SCDs but intent only to2840
AMTD4, 2827–2881, 2011
Early in flightdetection of SO2
Vogel et al.
Title Page
Abstract Introduction
Conclusions References
Tables Figures
J I
J I
Back Close
Full Screen / Esc
Printer-friendly Version
Interactive Discussion
Discussion
Paper
|D
iscussionP
aper|
Discussion
Paper
|D
iscussionP
aper|
study the gradient of the SO2 signal with distance to the plume. Thus the evaluationof gathered data in this fit range most sensitive to SO2 is justified. A correction factorof 2 was used to calculate the measurement error from the fit error according to (Plattand Stutz, 2008) based on residual structures and SO2 absorption band widths. Themean measurement error is determined from all measurements gathered at distances5
greater than 10 km for approaches III–V of the respective instrument (Table 1). Thisensures that the for the study relevant error is given.
3.4 Radiative transfer modelling
Several model scenarios were set up in the 3-D radiative transfer model McArtim(Deutschmann, 2008; Deutschmann et al., 2011), successor of the model TRACYII10
(Wagner et al., 2007), to assess the sensitivity of DOAS measurements of SO2 to thedistance between the instrument and the plume and on the wavelength of the mea-surement. Figure 1 depicts the model setup schematically and effects influencing themeasured absorption signal.
Two different types of model runs were conducted with the radiative transfer model.15
Type A model runs were set up in an attempt to match the conditions observed duringthe measurements at Popocatepetl. Afterwards, type B model runs were conductedto examine the differences that might be encountered when flying towards a volcaniccloud of much larger extent, as might be the case after a large-scale volcanic eruption.
For both types of model runs, the ambient atmosphere contained a typical O3 layer20
with a maximum concentration of 5×10¹² molec cm−3 at 22 km altitude and total col-umn of 9×10¹⁸ molec cm−2 (≈ 330 DU), as this influences the atmospheric radiativetransfer in the ultraviolet wavelength region. A 30◦ solar zenith angle was assumed forthe calculations. All aerosol particles were characterized as purely scattering with asingle scattering albedo of 1 and a Heyney-Greenstein asymmetry parameter of 0.8,25
which is typical for scattering sulphate aerosols. For all simulations, the instrument waslocated at the same altitude as the plume centre, and was aimed with a narrow fieldof view (0.3◦) in horizontal direction towards the centre of the plume. Note that both
2841
AMTD4, 2827–2881, 2011
Early in flightdetection of SO2
Vogel et al.
Title Page
Abstract Introduction
Conclusions References
Tables Figures
J I
J I
Back Close
Full Screen / Esc
Printer-friendly Version
Interactive Discussion
Discussion
Paper
|D
iscussionP
aper|
Discussion
Paper
|D
iscussionP
aper|
model run types assume a plume which has no concentration gradient from centre toits edges.
3.4.1 Model runs type A: spaciously confined plume with different aerosolcontents.
In these model runs, the measurement geometry and atmospheric conditions were ini-5
tialized using the conditions observed during the measurement at Popocatepetl. Thevolcanic plume was simulated with a centre at 5.5 km altitude, a height of 2 km, a hori-zontal width of 6.5 km and infinite length.With these boundary conditions, several model runs were performed with variations ofthe plume’s SO2 concentration and aerosol extinction coefficient (AEC), given in Ta-10
ble 3. For model runs A1 and A2, the SO2 concentration would result in a measuredSCD of 1×10¹⁸ molec cm−2 if measured from the edge of the plume without occur-rence of multiple scattering. For model run A3 the SO2 concentration was reduced inorder to reproduce column densities similar to those observed in the aircraft measure-ments.15
3.4.2 Model run B: large scale SO2 clouds.
This scenario has been chosen to model the response of the proposed technique tovolcanic clouds, as they might occur after large scale volcanic eruptions. Once the vol-canic plume has travelled a large distance from the volcano, its horizontal dimensionsare typically such that they considerably exceed the mean free photon path length in20
the atmosphere (several 10 km). In such cases, light entering a UV-spectroscopic in-strument will not have passed through the entire volcanic cloud. To test the sensitivityof such instruments to large scale volcanic SO2 clouds, model run B was set up us-ing a SO2 cloud with infinite extent in one horizontal direction. A SO2 concentrationof 1×10¹² molec cm−3 was assumed for the simulation, and the cloud exhibited an25
aerosol optical density of 0.1 km−1. Aerosols were considered to be purely scattering,
2842
AMTD4, 2827–2881, 2011
Early in flightdetection of SO2
Vogel et al.
Title Page
Abstract Introduction
Conclusions References
Tables Figures
J I
J I
Back Close
Full Screen / Esc
Printer-friendly Version
Interactive Discussion
Discussion
Paper
|D
iscussionP
aper|
Discussion
Paper
|D
iscussionP
aper|
as is typical for sulphate aerosol. The cloud was modelled at 10 km. The results of thismodel run will be discussed in Sect. 5 to give an outlook on the base of the conductedmeasurements.
4 Results
4.1 Measurement results from airborne observations5
All approaches successfully detected SO2 from the first measurement of the ap-proaches onwards, but restrictions in airspace prevented measurements at distancesfurther than 25 km from the plume. Figure 6 depicts the SO2 column densities as afunction of distance from the plume centre for approaches III through V for the differentviewing directions. The mean error σ for a measurement is specified in Table 1 (see10
Sect. 3.3). The result of the retrieval for the spectrum gathered at greatest distance tothe plume (first spectrum of approach IV) is shown in Fig. 7.
4.1.1 Measurement regimes and extent of plume
First, the SO2 column time series are discussed. At 25 km distance to the plume, theFOV of each telescope corresponds to a circle of 200 m diameter at the plume, their15
centre being 2 km apart for the horizontal and vertical off-centred viewing directions,respectively. Thus it can be assumed that the centre, port and starboard looking tele-scopes started measuring in regime B (plume fills FOV), and the upwards and down-wards looking telescopes started at regime B or in the transition from measurementregime A (plume partly fills FOV) to B. Due to the lower signal to noise ratio of the20
S2000 spectrograph (up, down, port, starboard telescope), a clear transition point cannot be distinguished. In order to discuss the transition between regime B and C, theairborne approaches are best compared to ground based car traverses.Approach II was performed approximately between 16:06 h–16:10 h UTC and com-pared with car traverse 2, which was measured from 15:34 h–16:05 h UTC. It can not25
2843
AMTD4, 2827–2881, 2011
Early in flightdetection of SO2
Vogel et al.
Title Page
Abstract Introduction
Conclusions References
Tables Figures
J I
J I
Back Close
Full Screen / Esc
Printer-friendly Version
Interactive Discussion
Discussion
Paper
|D
iscussionP
aper|
Discussion
Paper
|D
iscussionP
aper|
be used in the study on SO2 detectability due to changes in flight altitude in the firstminute. However, the plane did not change direction during the rest of approach II andwhile travelling through the plume. Due to its close proximity to the car traverses inspace and time, it can be used to compare both measurements. For that purpose, theground based measurements were interpolated onto the path of the airplane approach5
assuming a linear expansion from the source to each measurement point. The resultis depicted in Fig. 8. The plume can be well approximated by a gaussian fitted to thecar traverses, which sets the plume center at 0 km at the maximum of the gaussian.Comparing airborne approach II and car traverse 2, the expected characteristics asargued in Sect. 2, Fig. 1, are clearly visible. The SO2 SCD of the airborne measure-10
ments is increasing approximately until entering the plume, which horizontal distributionis captured by the car traverses. But it is also apparent, that the maximum SO2 SCDof the airplane approach does occur almost, but not exactly at the edge of the plumerather is measured several hundred meters inside the plume. The model results dis-cussed in Sect. 4.3 show that the retrieved SO2 SCDs might change significantly with15
the transition from outside to inside the plume, with a shift of the maximum SO2 SCDto the centre of the plume with increasing AEC. Thus the comparison between car tra-verse and airborne approach indicates that multiple scattering inside the plume causesthe maximum column density to be measured within the plume, not at its front edge.Airborne approaches III–V crossed the plume further downwind. Thus plume position20
and size can not be simply extrapolated from the ground based measurements to thelocation of the airborne measurements. Also, the exact plume position can only beapproximated from airborne measurements applying only forward looking DOAS tele-scopes.
The exponential relationship (Eq. 2) between retrieved SCD and distance to source25
as derived in Appendix A, is only valid in regime B. Also, approximations made mightnot hold for higher SO2 SCDs and in close proximity of the plume, in which light scat-tered into the viewing direction of the telescope might still be affected by absorptionstructures from the plume’s gases. Thus regime C is approximated by fitting function
2844
AMTD4, 2827–2881, 2011
Early in flightdetection of SO2
Vogel et al.
Title Page
Abstract Introduction
Conclusions References
Tables Figures
J I
J I
Back Close
Full Screen / Esc
Printer-friendly Version
Interactive Discussion
Discussion
Paper
|D
iscussionP
aper|
Discussion
Paper
|D
iscussionP
aper|
2 to the signal of the centre looking telescope for the far field of approaches III, IVand V. The start of regime C was set to the start of a steadily increasing difference(> 2.5×10¹⁶ molec cm−2) between fitted curve and retrieved values. The end of theplume is reached when the SO2 values are below the detection limit of the instrument.The so determined regime C is marked by the dashed vertical lines in Fig. 6.5
4.1.2 Spatial separability of the different viewing directions
The airplane was flying at the same altitude as the volcanic plume and approached itfrom the side. Although SO2 was detected by all instruments from the first measure-ment onwards, significant differences between the retrieved SCDs of the telescopescan not be distinguished for measurements at greater distance to the plume. The10
signal-to-noise ratio of the Ocean Optics S2000 spectrometers used for the measure-ments with non-centre-looking telescopes was inferior to that of the QE65000 (centre-looking telescope). Thus the precision of the measurements done with the S2000 wasnot sufficient to detect differences in SO2 column at large distances from the plume.
Theoretically, SO2 SCDs measured in starboard, centre and port direction during15
the approach should not differ greatly for a homogeneous plume along its path of prop-agation. For the vertical viewing directions (down, centre, up), differences in signalshould depend on the distance to the plume and its vertical extent. At some point closeto the edge or inside the plume, the gradients of all instruments should coincide untilthe plume is passed (and afterwards showing no SO2 signal), because the different20
telescopes are observing increasingly similar parts of the plume.While the plane approaches, the upward and downward looking instruments start
observing the plume and their gradients should increase and start converging to thegradient of the centre looking instrument, because the different telescopes are observ-ing are increasingly similar parts of the plume. At some point at the edge or inside the25
plume, the gradients of all instruments should coincide until the plume is passed (andafterwards showing no SO2 signal).
2845
AMTD4, 2827–2881, 2011
Early in flightdetection of SO2
Vogel et al.
Title Page
Abstract Introduction
Conclusions References
Tables Figures
J I
J I
Back Close
Full Screen / Esc
Printer-friendly Version
Interactive Discussion
Discussion
Paper
|D
iscussionP
aper|
Discussion
Paper
|D
iscussionP
aper|
Comparing the horizontally sideways pointing telescopes, similar SO2 gradients areobserved at most times except for approach III, where a change in flight direction whileinside the plume lead to a strong increase in the port signal (see also Fig. 3).
For the different vertical viewing directions, differences in the results obtained be-come more pronounced when the measurements are performed in and close to regime5
C. The telescope looking downwards always detects a significantly higher SO2 SCDthan the upwards looking telescope. Furthermore, it shows a comparable (Approach IIIand IV) or greater (Approach V) SO2 SCD than the centre looking telescope. Possibleissues discussed are (1) the plume was traversed above its centre altitude although re-sults from the ground based measurements indicate that the plume’s height was slightly10
above the plane’s approach altitude (see Sect. 4.2). Changes in plume height due toe.q. Lee-waves cannot be ruled out, but as described above, the differences in opticalpath lengths inside the plume should become negligible closer to the plume. (2) Asevere misalignment of telescopes; this can be ruled out, because even at greatestdistances all telescopes observed the plume. (3) Strong small scale inhomogeneities15
of SO2 concentrations inside the volcanic plume should be negligible due turbulencesbetween source and measured plume section. (4) light detected by the downwardlooking telescope is subject to an increased path length inside the plume; this effectis certainly present but should only be of second order, because the telescopes areobserving very similar plume cross sections as discussed above. (5) Errors in calibra-20
tion and instrumental function for the different spectrograph should lead to additionalstructures in the residuum of the DOAS fit algorithm. This was not observed. A finalconclusion is not possible because additional calibration quartz glass cells filled withSO2 were not available to perform calibration and comparison of the different viewingdirections.25
Although early detection capabilities of DOAS for SO2 could be proven, future studiesare necessary with higher grade spectrometers for all viewing directions combinedwith additional calibration and instrument intercomparison. This includes additionalmodelling to assess radiative transfer effects for the different viewing directions.
2846
AMTD4, 2827–2881, 2011
Early in flightdetection of SO2
Vogel et al.
Title Page
Abstract Introduction
Conclusions References
Tables Figures
J I
J I
Back Close
Full Screen / Esc
Printer-friendly Version
Interactive Discussion
Discussion
Paper
|D
iscussionP
aper|
Discussion
Paper
|D
iscussionP
aper|
4.2 The ground based measurements
The wind direction derived from automobile based measurements (the direction be-tween the volcano’s summit and the maximum encountered column densities) aredepicted in Fig. 9. Both car traverses and the stationary ground-based instrumentsyield comparable wind directions with an average of 232◦ N. The small systematic dif-5
ferences between the results of the two methods might be explained by the differentcross sections of the plume seen by each measurement technique. Also, the algorithmfor the stationary instruments assumes that both instruments are measuring the samecross section of the plume. Regardless of these small systematic errors, the resultsclearly show the stability of meteorological conditions during the time of the airborne10
approaches. The altitude of the centre of the plume was calculated to be between 5250and 5750 m a.s.l., the spread of plume heights can be explained by varying emissionstrengths and wind speeds. Stronger winds tend to press the plume slightly downwardsin the proximity of the volcano. Given the summit height of 5426 m a.s.l., the retrievedplume heights correspond well to the visual observations of a plume at approximately15
the same or slightly lower altitude as Popocatepetl’s summit.Comparing the altitude of plume centre derived by the two stationary instruments
with the altitude of airplane approaches, the plume’s centre is generally measuredabout 200 m higher than the mean altitude of airplane approaches (5250 m a.s.l.).These measurements confirm that the airplane approaches were performed at the20
approximate plume height and during stable meteorological conditions.
4.3 Results from radiative transfer study
Here, model runs A will be discussed because they allow conclusions over the mea-surements. The reader is referred to Sect. 5 for the results of model run type B as anoutlook on bases of the conducted experiment. As exemplary result of the model runs25
A, model run A2 is shown in Fig. 10. Its AEC was chosen, so that the gradients of mea-surements and model run A2 match qualitatively (see also Fig. 6). With an assumed
2847
AMTD4, 2827–2881, 2011
Early in flightdetection of SO2
Vogel et al.
Title Page
Abstract Introduction
Conclusions References
Tables Figures
J I
J I
Back Close
Full Screen / Esc
Printer-friendly Version
Interactive Discussion
Discussion
Paper
|D
iscussionP
aper|
Discussion
Paper
|D
iscussionP
aper|
FOV of 5.2 mrad (0.3◦), at the maximum distance modelled (100 km) a circle of diame-ter of ≈520 m is observed at the plume. Thus the all modelled approaches correspondto measurements in regime B and C.
In Fig. 10, the dependency of the measured SO2 SCD on distance can be seen. Thegradient of the retrieved SO2 SCD follows the expected line with a clear separation of5
wavelengths. Longer wavelengths are less affected by Rayleigh scattering than smallerones and thus less dependent on distance to the cloud. This leads to a difference inrelative decrease of about a factor 10 at 100 km distance to the plume.
Studying the transition between simulated measurements in regime B and regime C(the plume is indicated as a grey shaded area), some interesting features are imme-10
diately visible: intuitively, one would suspect the maximum SO2 signal just when theplane enters the plume, because light can no longer be scattered into the instrument’sfield of view without having passed the plume. This is reproduced by the model run A1when low AEC is assumed. With increasing AEC in model runs A2 and A3 however, ashift to the centre of the plume becomes apparent of maximum SCDs. Also, a sharp15
edge can be seen in the SCD distribution at the position where the aircraft enters theplume (+3.25 km). This could be the explanation for the distribution observed in themeasurement and the differences shown between car traverse and plane approach II(Fig. 8). Measurements taken at the front edge of the plume are not detecting radiationthat has penetrated the entire plume, but rather measure light scattered by aerosols20
in the front portion of the plume. On the other hand, measurements taken inside theplume can be affected by significant enhancement of the light path inside the plumedue to multiple scattering. Although the modelled cases are greatly simplified, e.g. areal plume is not evenly distributed over a discrete interval, they show that the max-imum SO2 column is not necessarily detected at the front edge of the plume. Thus,25
care must be taken when judging which spectra have been taken in and outside of theplume (regime B and C, respectively).
2848
AMTD4, 2827–2881, 2011
Early in flightdetection of SO2
Vogel et al.
Title Page
Abstract Introduction
Conclusions References
Tables Figures
J I
J I
Back Close
Full Screen / Esc
Printer-friendly Version
Interactive Discussion
Discussion
Paper
|D
iscussionP
aper|
Discussion
Paper
|D
iscussionP
aper|
5 Comparing measurements to model results: inferring maximum distance atwhich SO2 can be detected
To compare model results and measurements, an exponential function was fit to the dif-ferent approaches. It is based upon a simplified determination of visibility and contrastthat can be found in textbooks about radiation transport in the atmosphere (e.g. Platt5
and Stutz, 2008, p.110) and an analogue has been applied for radiative transfer cor-rections of UV-camera measurements in Bluth et al. (2007).
S(L2)
S(L1)≈ e−ε× (L2−L1) (1)
The above function describes the relative change of retrieved SCD S(L1) and S(L2)between distance L1 and L2 to the plume. For a detailed derivation see Appendix A.10
ε is the total extinction coefficient depending on Rayleigh and Mie scattering, retrievalwavelength range and the distribution of absorption structure of the trace gas of interestin the respective retrieval wavelength range. Because the retrieved SCDs all possessa certain error, it is advantageous to use
S(L) = A×e−ε×L (2)15
where A is a hypothetical SCD at zero distance or in our case the plume’s centre.Function (2) is only valid for measurements taken in the regime B (see Fig. 1). Also,the “narrow beam” approximation must hold, thus light scattered into the viewing direc-tions should not have passed the plume at an earlier point. In order to ensure theseboundary conditions, only measurements taken more than 8 km from the assumed20
plume centre were used to retrieve the parameters of function (2) for the respectiveapproaches.
The results for all fits are depicted in Fig. 11. They are extrapolated to 50 km distanceto the plume. The individual obtained parameters are also shown in Table 4. The meanextinction coefficient ε returned by the fit was 7.33×10⁻⁵, and the mean coefficient of25
determination r2 was 0.94. Thus with the experimental setup, which was not specially2849

AMTD4, 2827–2881, 2011
Early in flightdetection of SO2
Vogel et al.
Title Page
Abstract Introduction
Conclusions References
Tables Figures
J I
J I
Back Close
Full Screen / Esc
Printer-friendly Version
Interactive Discussion
Discussion
Paper
|D
iscussionP
aper|
Discussion
Paper
|D
iscussionP
aper|
tuned for this kind of measurements, and a detection limit of 1.6×10¹⁶ molec cm−2 forthe centre looking telescope (Table 1), the plume of Popocatepetl could have beendetected from a distance greater than 35 km.
In order to compare the measurements to the modelled results, function 2 was fittedalso to all model runs type A. The fit was performed between 10 and 100 km. The5
model runs are reproduced well by the analytical approach. All fits achieve a coefficientof determination (r2) of more than 99.8 %. Table 5 summarizes the fitted extinctioncoefficients ε for 306.6 nm and 310.8 nm of model runs A1, A2 and A3. For modelrun A1 the fitted extinction coefficient is slightly increased in comparison to the othertwo. The reason is that model run A1 displays stronger absorptions at 10 km distance10
then the other two model runs. The approximation made in deriving function 2 are onlyvalid for small absorptions and thus for model run A1 an additional systematic error isinduced.
The extinction coefficients from the airborne approaches can be compared to themean extinction coefficients obtained from the model runs. The relative decreases in15
SCDs calculated from the extinction coefficients of the approaches are encompassedbetween the mean results obtained for model runs A for 306.6 nm and 310.8 nm. Thefitted ε of all approaches and their 95 % confidence bands are depicted together withthe mean ε derived from the model runs A in Fig. 12. The differences between modeland measurements can be explained by the wavelength interval used in the DOAS20
evaluation. The first and strongest absorption line in the DOAS retrieval interval 307.4–317.8 nm is the absorption maximum at 308.7 nm, influencing the DOAS retrieval heav-ily. Thus, it is consistent that the value of the extinction coefficient ε of the DOAS re-trieval lies about halfway between the extinction coefficients of 306.6 nm and 310.8 nmof the modelled scenarios. These results validate the model runs and allow to extent25
the experimental “proof of concept” measurement with model run B.
2850
AMTD4, 2827–2881, 2011
Early in flightdetection of SO2
Vogel et al.
Title Page
Abstract Introduction
Conclusions References
Tables Figures
J I
J I
Back Close
Full Screen / Esc
Printer-friendly Version
Interactive Discussion
Discussion
Paper
|D
iscussionP
aper|
Discussion
Paper
|D
iscussionP
aper|
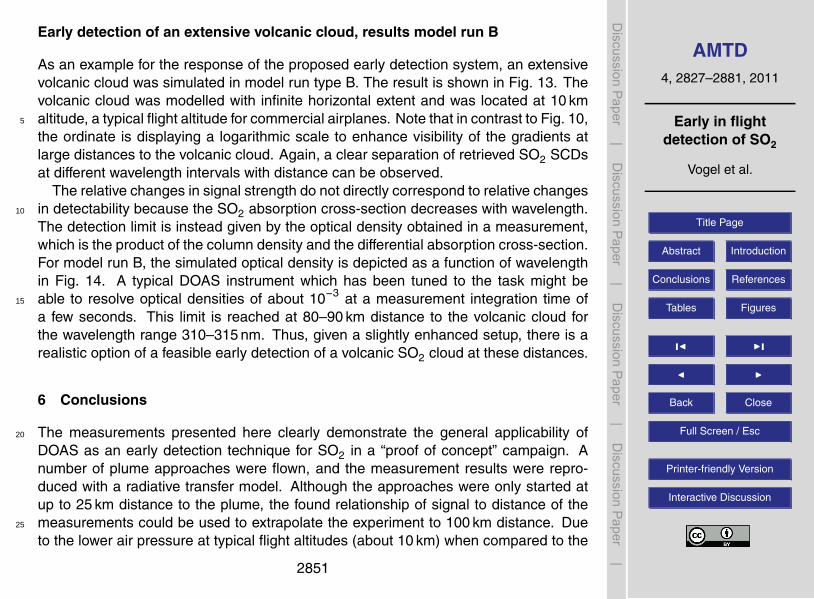
Early detection of an extensive volcanic cloud, results model run B
As an example for the response of the proposed early detection system, an extensivevolcanic cloud was simulated in model run type B. The result is shown in Fig. 13. Thevolcanic cloud was modelled with infinite horizontal extent and was located at 10 kmaltitude, a typical flight altitude for commercial airplanes. Note that in contrast to Fig. 10,5
the ordinate is displaying a logarithmic scale to enhance visibility of the gradients atlarge distances to the volcanic cloud. Again, a clear separation of retrieved SO2 SCDsat different wavelength intervals with distance can be observed.
The relative changes in signal strength do not directly correspond to relative changesin detectability because the SO2 absorption cross-section decreases with wavelength.10
The detection limit is instead given by the optical density obtained in a measurement,which is the product of the column density and the differential absorption cross-section.For model run B, the simulated optical density is depicted as a function of wavelengthin Fig. 14. A typical DOAS instrument which has been tuned to the task might beable to resolve optical densities of about 10−3 at a measurement integration time of15
a few seconds. This limit is reached at 80–90 km distance to the volcanic cloud forthe wavelength range 310–315 nm. Thus, given a slightly enhanced setup, there is arealistic option of a feasible early detection of a volcanic SO2 cloud at these distances.
6 Conclusions
The measurements presented here clearly demonstrate the general applicability of20
DOAS as an early detection technique for SO2 in a “proof of concept” campaign. Anumber of plume approaches were flown, and the measurement results were repro-duced with a radiative transfer model. Although the approaches were only started atup to 25 km distance to the plume, the found relationship of signal to distance of themeasurements could be used to extrapolate the experiment to 100 km distance. Due25
to the lower air pressure at typical flight altitudes (about 10 km) when compared to the
2851
AMTD4, 2827–2881, 2011
Early in flightdetection of SO2
Vogel et al.
Title Page
Abstract Introduction
Conclusions References
Tables Figures
J I
J I
Back Close
Full Screen / Esc
Printer-friendly Version
Interactive Discussion
Discussion
Paper
|D
iscussionP
aper|
Discussion
Paper
|D
iscussionP
aper|
altitude of the Popocatepetl plume, additional radiative transfer studies conclude that avolcanic plume with a SO2 slant column density of 1018 molecules cm−2 as viewed fromthe outside can be detected at distances up to 80 km away. This range provides enoughtime for pilots to take actions to avoid plume fly-through under typical flight conditions,suggesting that this technique can be used as an effective aid to prevent dangerous5
aircraft encounters with potentially ash-laden volcanic plumes. But further efforts areneeded in experiment and modelling to fully explore the capabilities of the technique.This includes the ability to spatially resolve volcanic plumes at greater distances in or-der to allow avoidance measures to be initiated, as well as a thorough investigationsof the limitations e.g. in case of high altitude clouds between plume and instrument.10
Furthermore, the sensitivity to a volcanic cloud with ash particles covered in ice needto be addressed, because this is one of the cases were IR techniques based on thereverse absorption method are not suitable. Early detection possibility via DOAS wouldbe reduced most likely, as this case is similar to type A model runs with an increasedscattering aerosol content.15
Large volcanic clouds are much more easily evaded by flying over or under themthan by trying to go around them. Therefore, the vertical direction is arguably moreimportant than the horizontal one. E.g. one could imagine a DOAS instrument applyingan imaging spectrometer, which could be positioned so that its spatial axis is in thevertical, its dispersive axis is horizontal (IDOAS, Louban et al., 2009).20
DOAS based SO2 detection is a complementary technique to the detection of ashin the infra-red regime and in combination can greatly mitigate the risk from volcanicclouds to aviation.
2852
AMTD4, 2827–2881, 2011
Early in flightdetection of SO2
Vogel et al.
Title Page
Abstract Introduction
Conclusions References
Tables Figures
J I
J I
Back Close
Full Screen / Esc
Printer-friendly Version
Interactive Discussion
Discussion
Paper
|D
iscussionP
aper|
Discussion
Paper
|D
iscussionP
aper|
Appendix A
Analytical approach to the radiation dilution effect
In general, the propagation of radiation in the atmosphere is a complex process. Mul-tiple scattering inside and light dilution outside the plume both affect the measured5
signal. For a valid assessment of volcanic emissions both effects need to be taken intoaccount. For this study, the gradient of measured SO2 SCDs with distance betweeninstrument and plume needs to be determined to assess the feasibility of DOAS as anearly detection system for SO2. The true concentrations inside the plume are only ofsecondary concern, and we focus only the radiation dilution.10
An analytical solution can be derived to estimate the dependency of measured SCDto distance to the volcanic plume. The approach is analogous to the simplified de-termination of visibility and contrast that can be found in text books about radiationtransport in the atmosphere (e.g. Platt and Stutz, 2008, , p.110). A similar strat-egy has been applied for radiative transfer corrections of UV-camera measurements15
in Bluth et al. (2007).There, a black object of zero intensity is viewed from distance L with a background
intensity I0 next to the object. Radiation scattered into the field of view of the ob-server will lead to an increase of the perceived intensity IR with increasing distance tothe object until background intensity I0 is reached. Certain approximations are made.20
(1) The probability is negligible that a photon is scattered into the viewing direction ofthe telescope after having been scattered out of it (Narrow Beam approximation). Con-sequently, extinction, which is comprised as the sum of Rayleigh and Mie scattering,can be treated like absorption as described by Lambert-Beer’s Law. In our case it isthe radiation scattered into the viewing direction. (2) The atmosphere is considered ho-25
mogeneous. With these approximations, the scattered radiation intensity IR receivedby the observer when looking at a black object at distance L is given by
IR (λ) = I0 (λ)×(
1−e−ε(λ)×L)
(A1)
2853
AMTD4, 2827–2881, 2011
Early in flightdetection of SO2
Vogel et al.
Title Page
Abstract Introduction
Conclusions References
Tables Figures
J I
J I
Back Close
Full Screen / Esc
Printer-friendly Version
Interactive Discussion
Discussion
Paper
|D
iscussionP
aper|
Discussion
Paper
|D
iscussionP
aper|
where the extinction coefficient ε(λ)=εR (λ)+εM (λ) is the sum of the Rayleigh and Mieextinction coefficients.
The wavelength dependency of Rayleigh and Mie scattering can be disregarded fora 1st order approximation of the dependency of DOAS retrieval on radiation dilution.Rayleigh scattering is approximately proportional to λ−4, whereas Mie scattering has5
a wavelength dependency proportional to λ−1.3. This results in a relative difference ofscattered intensity of ≈ 18 % between 10 nm (wavelength range of DOAS retrievals) inthe range of 300 nm and 330 nm. The evaluation of SO2 is strongly dependent on thestronger differential optical absorption features at lower wavelengths (see Fig. 5). Thedifference between minima of the differential optical absorption cross sections of SO210
is (≈ 2 nm). On this scale, the relative difference due to Rayleigh and Mie scatteringis only ≈ 3 %. Thus the error introduced by neglecting the wavelength dependency ofRayleigh and Mie scattering will be at the lower end of the interval 3 %–18 %.
Measured SO2 SCDs (S) are proportional to the amplitude of its differential opticalabsorption structures:15
S ∝ ln(I0I
)(A2)
Taking the intensity of absorption minima as background intensity I0 and absorptionmaxima as intensity I , a retrieved SO2 SCD S(L′) will decrease with distance to thesource. I1 and I2 are denoting the intensity at absorption maxima at L1 and L2 distance.Applying Eq. (A1), the intensity I2 can be described in terms of I1:20
I2 = I0 · (1−e−ε·L2)
= I1+ (I0− I1) (1−e−ε×∆L) (A3)
where ∆L is the difference between L1 and L2. Thus S(L2) can be written as
ln(I0I2
)= ln
(I0
I1+ (I0− I1) (1−e−ε×∆L)
)2854
AMTD4, 2827–2881, 2011
Early in flightdetection of SO2
Vogel et al.
Title Page
Abstract Introduction
Conclusions References
Tables Figures
J I
J I
Back Close
Full Screen / Esc
Printer-friendly Version
Interactive Discussion
Discussion
Paper
|D
iscussionP
aper|
Discussion
Paper
|D
iscussionP
aper|
= ln(
I0I0+ (I1− I0)×e−ε×∆L)
)= −ln
(I0+ (I1− I0)×e−ε×∆L)
I0
)
= −ln(
1+I1− I0I0
×e−ε×∆L)
(A4)
The logarithm ln(x) can be expressed as a Taylor series if −1<x < 1 with
ln(x+1) =∞∑k=1
(−1)k−1× xk
k(A5)5
If x is close to 0, the logarithm can be approximated by using only the first term(ln (x+1)=x). This means that Eq. (A4) can estimated by
S(L1) ∝ −I1− I0I0
(A6)
S(L2) ∝ −I1− I0I0
×e−ε×∆L (A7)
as long as I0 ≈ I1, which is the case for a weak absorber. The relative change of SCD10
S(L1) to S(L2) with distance ∆L is given by
S(L2)
S(L1)=
ln(I0I2
)ln(I0I1
)≈
I1−I0I0
×e−ε×∆L
I1−I0I0
≈ e−ε×∆L (A8)2855
AMTD4, 2827–2881, 2011
Early in flightdetection of SO2
Vogel et al.
Title Page
Abstract Introduction
Conclusions References
Tables Figures
J I
J I
Back Close
Full Screen / Esc
Printer-friendly Version
Interactive Discussion
Discussion
Paper
|D
iscussionP
aper|
Discussion
Paper
|D
iscussionP
aper|
Thus Eq. (A8) can be used to estimate the dependence of DOAS measurements ofa confined trace gas on distance between instrument and absorber. ε is an extinctioncoefficient, which depends on retrieval wavelength range and the absorption structureof the trace gas of interest in the respective retrieval wavelength range. E.g. dependingon how the dominant absorption bands of the trace gas of interest are distributed within5
the retrieval wavelength range. Also, it must be stressed that above approximation isonly valid for weak absorbers, because all but the the first term of Eq. (A5) are omitted.
Acknowledgements. The authors would like to thank the Mexican students who honoraryhelped with the ground based instruments. The measurements were performed in the frameof the FIEL-Volcan project, funded by the “Fondo de Cooperacion Internacional de Ciencia y10
Tecnologıa Union Europea Mexico” (FONCICyT, CONACYT-EU) grant 93645.
References
Ash Dispersal Forecast and Civil Aviation Workshop, Consensual Document, Geneva, Switzer-land, 2010. 2832
Berglen, T. F., Berntsen, T. K., Isaksen, I. S. A., and Sundet, J. K.: A global model of the15
coupled sulfur/oxidant chemistry in the troposphere: The sulfur cycle, J. Geophys. Res.,109, D19310, doi:10.1029/2003JD003948, 2004. 2833
Bluth, G. J. S., Shannon, J. M., Watson, I. M., Prata, A. J., and Realmuto, V. J.: Development ofan ultra-violet digital camera for volcanic SO2 imaging, J. Volcanol. Geoth. Res., 161, 47–56,doi:10.1016/j.jvolgeores.2006.11.004, 2007. 2834, 2849, 285320
Bogumil, K., Orphal, J., Homann, T., Voigt, S., Spietz, P., Fleischmann, O., Vogel, A., Hartmann,M., Kromminga, H., Bovensmann, H., Frerick, J., and Burrows, J.: Measurements of molec-ular absorption spectra with the SCIAMACHY pre-flight model: instrument characterizationand reference data for atmospheric remote-sensing in the 230–2380 nm region, J. Photoch.Photobi. A, 157, 167–184, doi:10.1016/S1010-6030(03)00062-5, 2003. 284025
Carn, S. A., Krueger, A. J., Krotkov, N. A., Yang, K., and Evans, K.: Tracking volcanic sulfur diox-ide clouds for aviation hazard mitigation, Nat. Hazards, 51, 325–343, doi:10.1007/s11069-008-9228-4, 2009. 2833
2856
AMTD4, 2827–2881, 2011
Early in flightdetection of SO2
Vogel et al.
Title Page
Abstract Introduction
Conclusions References
Tables Figures
J I
J I
Back Close
Full Screen / Esc
Printer-friendly Version
Interactive Discussion
Discussion
Paper
|D
iscussionP
aper|
Discussion
Paper
|D
iscussionP
aper|
Casadevall, T.: The 1989–1990 eruption of Redoubt volcano, Alaska – Impact on aircraft oper-ations, J. Volcanol. Geoth. Res., 62, 301–316, 1994. 2830
Clarisse, L., Prata, F., Lacour, J.-L., Hurtmans, D., Clerbaux, C., and Coheur, P.-F.: A correlationmethod for volcanic ash detection using hyperspectral infrared measurements, Geophys.Res. Lett., 37, L19806, doi:10.1029/2010GL044828, 2010. 2832, 28335
Dalton, M. P., Watson, I. M., Nadeau, P. A., Werner, C., Morrow, W., and Shannon, J. M.:Assessment of the UV camera sulfur dioxide retrieval for point source plumes, J. Volcanol.Geoth. Res., 188, 358–366, doi:10.1016/j.jvolgeores.2009.09.013, 2009. 2834
Deutschmann, T.: Atmospheric radiative transfer modelling using Monte Carlo methods, Mas-ter’s thesis, University Heidelberg, 2008. 284110
Deutschmann, T., Beirle, S., Friess, U., Grzegorski, M., Kern, C., Kritten, L., Platt, U., Prados-Roman, C., Pukite, J., Wagner, T., Werner, B., and Pfeilsticker, K.: The Monte Carlo atmo-spheric radiative transfer model McArtim: Introduction and validation of Jacobians and 3Dfeatures, J. Quant. Spectrosc. Ra., 112, 1119–1137, doi:10.1016/j.jqsrt.2010.12.009, 2011.284115
Doasis: DOAS Intelligent System, Institute of Environmental Physics, University Heidelberg,Germany, Version 3.2.3799.23257, https://doasis.iup.uni-heidelberg.de/bugtracker/projects/doasis/, 2010. 2840
Doran, J., Abbott, S., Archuleta, J., Bian, X., Chow, J., Coulter, R., de Wekker, S., Edgerton, S.,Elliott, S., Fernandez, A., Fast, J., Hubbe, J., King, C., Langley, D., Leach, J., Lee, J., Martin,20
T., Martinez, D., Martinez, J., Mercado, G., Mora, V., Mulhearn, M., Pena, J., Petty, R.,Porch, W., Russell, C., Salas, R., Shannon, J., Shaw, W., Sosa, G., Tellier, L., Templeman,B., Watson, J., White, R., Whiteman, C., and Wolfe, D.: The IMADA-AVER boundary layerexperiment in the Mexico City area, B. Am. Meteorol. Soc., 79, 2497–2508, 1998. 2834
Galle, B., Johansson, M., Rivera, C., Zhang, Y., Kihlman, M., Kern, C., Lehmann, T., Platt, U.,25
Arellano, S., and Hidalgo, S.: Network for Observation of Volcanic and Atmospheric Change(NOVAC) – A global network for volcanic gas monitoring: Network layout and instrument de-scription, J. Geophys. Res.-Atmos., 115, D05304, doi:10.1029/2009JD011823, 2010. 2837,2839, 2876
Grindle, T. and Burcham, F.: Engine Damage to a NASA DC-8-72 Airplane From a30
High-Altitude Encounter With a Diffuse Volcanic Ash Cloud, Tech. rep., NASA, DrydenFlight Research Center, http://ntrs.nasa.gov/archive/nasa/casi.ntrs.nasa.gov/200300683442003079762.pdf, 2003. 2830
2857
AMTD4, 2827–2881, 2011
Early in flightdetection of SO2
Vogel et al.
Title Page
Abstract Introduction
Conclusions References
Tables Figures
J I
J I
Back Close
Full Screen / Esc
Printer-friendly Version
Interactive Discussion
Discussion
Paper
|D
iscussionP
aper|
Discussion
Paper
|D
iscussionP
aper|
Guffanti, M., Schneider, D. J., Wallace, K. L., Hall, T., Bensimon, D. R., and Salinas,L. S.: Aviation response to a widely dispersed volcanic ash and gas cloud from theAugust 2008 eruption of Kasatochi, Alaska, USA, J. Geophys. Res., 115, D00L19,doi:10.1029/2010JD013868, 2010. 2833
Heue, K.-P., Brenninkmeijer, C. A. M., Baker, A. K., Rauthe-Schoch, A., Walter, D., Wagner,5
T., Hormann, C., Sihler, H., Dix, B., Frie, U., Platt, U., Martinsson, B. G., van Velthoven, P.F. J., Zahn, A., and Ebinghaus, R.: SO2 and BrO observation in the plume of the Eyjafjal-lajokull volcano 2010: CARIBIC and GOME-2 retrievals, Atmos. Chem. Phys., 11, 2973–2989, doi:10.5194/acp-11-2973-2011, 2011. 2835
ICAO: Manual on Volcanic Ash, Radioactive Material, and Toxic Chemical Clouds, 2nd Edition,10
International Civil Aviation Organization, 2 Edn., http://www.paris.icao.int/news/pdf/9691.pdf,doc 9691-AN/954, 2007. 2830, 2831, 2832
Johansson, M., Galle, B., Zhang, Y., Rivera, C., Chen, D., and Wyser, K.: The dual-beam mini-DOAS technique-measurements of volcanic gas emission, plume height and plume speedwith a single instrument, B. Volcanol., 71, 747–751, doi:10.1007/s00445-008-0260-8, 2009.15
2837Kantzas, E. P., McGonigle, A. J. S., Tamburello, G., Aiuppa, A., and Bryant, R. G.: Proto-
cols for UV camera volcanic SO2 measurements, J. VOLCANOL. Geoth. Res., 194, 55–60,doi:10.1016/j.jvolgeores.2010.05.003, 2010. 2834
Karagulian, F., Clarisse, L., Clerbaux, C., Prata, A. J., Hurtmans, D., and Coheur, P. F.: De-20
tection of volcanic SO2, ash, and H2SO4 using the Infrared Atmospheric Sounding Interfer-ometer (IASI), J. Geophys. Res.-Atmos., 115, D00L02, doi:10.1029/2009JD012786, 2010.2833
Kern, C., Kick, F., Lubcke, P., Vogel, L., Wohrbach, M., and Platt, U.: Theoretical description offunctionality, applications, and limitations of SO2 cameras for the remote sensing of volcanic25
plumes, Atmos. Meas. Tech., 3, 733–749, doi:10.5194/amt-3-733-2010, 2010a. 2834Kern, C., Deutschmann, T., Vogel, L., Woehrbach, M., Wagner, T., and Platt, U.: Radiative
transfer corrections for accurate spectroscopic measurements of volcanic gas emissions, B.Volcanol., 72, 233–247, doi:10.1007/s00445-009-0313-7, 2010b. 2840
Khokhar, M., Frankenberg, C., Van Roozendael, M., Beirle, S., Kuhl, S., Richter, A., Platt, U.,30
and Wagner, T.: Satellite observations of atmospheric SO2 from volcanic eruptions duringthe time-period of 1996–2002, in: atmospheric remote sensing: earth’s surface, troposphere,stratosphere and mesosphere – I, edited by: Burrows, J. P. and Eichmann, K. U., vol. 36
2858
AMTD4, 2827–2881, 2011
Early in flightdetection of SO2
Vogel et al.
Title Page
Abstract Introduction
Conclusions References
Tables Figures
J I
J I
Back Close
Full Screen / Esc
Printer-friendly Version
Interactive Discussion
Discussion
Paper
|D
iscussionP
aper|
Discussion
Paper
|D
iscussionP
aper|
of Advances in space research, 879–887, Elsevier Science LTD, The Boulevard, LangfordLane, Kidlington, Oxford 0X5 1GB, Oxon, UK, doi:10.1016/j.asr.2005.04.114, 2005. 2833
Khokhar, M. F., Platt, U., and Wagner, T.: Temporal trends of anthropogenic SO2 emitted bynon-ferrous metal smelters in Peru and Russia estimated from Satellite observations, Atmos.Chem. Phys. Discuss., 8, 17393–17422, doi:10.5194/acpd-8-17393-2008, 2008. 28335
Kraus, S. G.: DOASIS, A Framework Design for DOAS, Ph.D. thesis, University of Mannheim,2006. 2840
Krueger, A.: Sighting of El Chichon sulfur dioxide clouds with the Nimbus 7 total ozone mappingspectrometer, Science, 220, 1377–1379, 1983. 2833
Kurucz, R. L.: High resolution irradiance spectrum from 300 to 1000 nm, AFRL Transmission10
Meeting, Lexington, Mass, http://kurucz.harvard.edu/sun.html, 2005. 2840Lehmann, T.: Improving the sensitivity of spectroscopic measurements of atmospheric trace
gases by modern signal processing algorithms, Ph.D. thesis, IUP, University Heidelberg, inpreparation, 2011. 2840
Louban, I., Bobrowski, N., Rouwet, D., Inguaggiato, S., and Platt, U.: Imaging DOAS for vol-15
canological applications, B. Volcanol., 71, 753–765, doi:10.1007/s00445-008-0262-6, 2009.2852
Lubcke, P.: Development of a new SO2 camera for volcanic gas flux measurements, Master’sthesis, Insitute of Environmental Science, University Heidelberg, 2010. 2834
Miller, T. and Casadevall, T.: Encyclopedia of volcanoes, chap. Volcanic ash hazards to aviation,20
Academic Press, San Diego, USA, 2000. 2830Mori, T. and Burton, M.: The SO2 camera: A simple, fast and cheap method for
ground-based imaging of SO2 in volcanic plumes, Geophys. Res. Lett., 33, L24804,doi:10.1029/2006GL027916, 2006. 2834
Mori, T., Mori, T., Kazahaya, K., Ohwada, M., Hirabayashi, J., and Yoshikawa, S.: Effect25
of UV scattering on SO2 emission rate measurements, Geophys. Res. Lett., 33, L17315,doi:10.1029/2006GL026285, 2006. 2840
Pavolonis, M. and Sieglaff, J.: GOES-R Advanced Baseline Imager (ABI) Algorithm TheoreticalBasis Document For Volcanic Ash (Detection and Height), Tech. rep., STAR, NESDIS, NOAA,Camp Springs, Maryland, USA, http://www.goes-r.gov/products/ATBDs/volcanic ash.pdf,30
2010. 2832Pavolonis, M. J., Feltz, W. F., Heidinger, A. K., and Gallina, G. M.: A daytime complement to the
reverse absorption technique for improved automated detection of volcanic ash, J. Atmos.
2859
AMTD4, 2827–2881, 2011
Early in flightdetection of SO2
Vogel et al.
Title Page
Abstract Introduction
Conclusions References
Tables Figures
J I
J I
Back Close
Full Screen / Esc
Printer-friendly Version
Interactive Discussion
Discussion
Paper
|D
iscussionP
aper|
Discussion
Paper
|D
iscussionP
aper|
Ocean. Tech., 23, 1422–1444, 2006. 2832Platt, U. and Stutz, J.: Differential Optical Absorption Spectroscopy: Principles and Application,
Springer, doi:10.1007/978-3-540-75776-4, 2008. 2833, 2840, 2841, 2849, 2853Prata, A.: Infrared radiative-transfer calculations for volcanic ash clouds, Geophys. Res. Lett.,
16, 1293–1296, 1989. 2832, 28335
Prata, A. J.: Satellite detection of hazardous volcanic clouds and the risk to global air traffic,Nat. Hazards, 51, 303–324, doi:10.1007/s11069-008-9273-z, 2009. 2832
Prata, A. J. and Bernardo, C.: Retrieval of volcanic SO2 column abundance from atmosphericinfrared sounder data, J. Geophys. Res.-Atmos., 112, D20204, doi:10.1029/2006JD007955,2007. 283310
Prata, A. J. and Bernardo, C.: Retrieval of volcanic ash particle size, mass and optical depthfrom a ground-based thermal infrared camera, J. Volcanol. Geoth. Res., 186, 91–107,doi:10.1016/j.jvolgeores.2009.02.007, 2009. 2834
Prata, A. J. and Tupper, A.: Aviation hazards from volcanoes: the state of the science, Nat.Hazards, 51, 239–244, doi:10.1007/s11069-009-9415-y, 2009. 283015
Prata, A., Barton, I., Johnson, R., Kamo, K., and Kingwell, J.: Hazard from volcanic ash, Nature,354, p. 25, 1991. 2834
Prata, F., Bluth, G., Rose, B., Schneider, D., and Tupper, A.: Failures in detecting volcanic ashfrom a satellite-based technique – Comments, Remote Sens. Environ., 78, 341–346, 2001.283320
Prata, A., Rose, W., Self, S., and OBrien, D.: Global, long-term sulphur dioxide measurementsfrom the TOVS data: a new tool for studying explosive volcanism and climate, Geophys.Monogr., 139, 75–92, 2003. 2833
READY: Real-time Environmental Applications and Display sYstem, , Air Resources Laboratory,NOAA, http://ready.arl.noaa.gov/READY.php, last access: January 2011. 284025
Realmuto, V., Abrams, M., Buongiorno, M., and Pieri, D.: The use of multispectral thermalinfrared image data to estimate the sulfur-dioxide flux from volcanos – A case-study fromMount Etna, Sicily, July 29, 1986, J. Geophys. Res.-Sol. Ea., 99, 481–488, 1994. 2833
Rix, M., Valks, P., Hao, N., van Geffen, J., Clerbaux, C., Clarisse, L., Coheur, P.-F., Loyola R,D. G., Erbertseder, T., Zimmer, W., and Emmadi, S.: Satellite Monitoring of Volcanic Sulfur30
Dioxide Emissions for Early Warning of Volcanic Hazards, IEEE J. Sel. Top. Appl., 2, 196–206, doi:10.1109/JSTARS.2009.2031120, 2009. 2833
Romero, R. (Ed.): The International Airways Volcano Watch (IAVW). Proceedings of 2nd Inter-
2860
AMTD4, 2827–2881, 2011
Early in flightdetection of SO2
Vogel et al.
Title Page
Abstract Introduction
Conclusions References
Tables Figures
J I
J I
Back Close
Full Screen / Esc
Printer-friendly Version
Interactive Discussion
Discussion
Paper
|D
iscussionP
aper|
Discussion
Paper
|D
iscussionP
aper|
national Conference on Volcanic Ash and Aviation Safety, Virginia,USA, 2004. 2832Rose, W., Delene, D., Schnelder, D., Bluth, G., Krueger, A., Sprod, I., Mckee, C., Davies, H.,
and Ernst, G.: Ice in the 1994 Rabaul eruption cloud – implications for volcanic hazard andatmospheric effects, Nature, 375, 477–479, 1995. 2833
Schumann, U., Weinzierl, B., Reitebuch, O., Schlager, H., Minikin, A., Forster, C., Baumann, R.,5
Sailer, T., Graf, K., Mannstein, H., Voigt, C., Rahm, S., Simmet, R., Scheibe, M., Lichtenstern,M., Stock, P., Ruba, H., Schauble, D., Tafferner, A., Rautenhaus, M., Gerz, T., Ziereis, H.,Krautstrunk, M., Mallaun, C., Gayet, J.-F., Lieke, K., Kandler, K., Ebert, M., Weinbruch, S.,Stohl, A., Gasteiger, J., Gro, S., Freudenthaler, V., Wiegner, M., Ansmann, A., Tesche, M.,Olafsson, H., and Sturm, K.: Airborne observations of the Eyjafjalla volcano ash cloud over10
Europe during air space closure in April and May 2010, Atmos. Chem. Phys., 11, 2245–2279,doi:10.5194/acp-11-2245-2011, 2011. 2833
Simpson, J., Hufford, G., Pieri, D., and Berg, J.: Failures in detecting volcanic ash from satellite-based technique, Remote Sens. Environ., 72, 191–217, 2000. 2833
Solomon, S., Schmeltekopf, A. L., and Sanders, R. W.: On the interpretation of zenith sky15
absorption measurements, J. Geophys. Res., 92, 8311–8319, 1987. 2840Thomas, H. E. and Watson, I. M.: Observations of volcanic emissions from space: current
and future perspectives, Nat. Hazards, 54, 323–354, doi:10.1007/s11069-009-9471-3, 2010.2832
Tupper, A., Textor, C., Herzog, M., Graf, H.-F., and Richards, M. S.: Tall clouds from small20
eruptions: the sensitivity of eruption height and fine ash content to tropospheric instability,Nat. Hazards, 51, 375–401, doi:10.1007/s11069-009-9433-9, 2009. 2832
Voigt, S., Orphal, J., Bogumil, K., and Burrows, J.: The temperature dependence (203–293K) of the absorption cross sections of O-3 in the 230-850 nm region measured by Fourier-transform spectroscopy, J. Photoch. Photobio. A, 143, 1–9, 2001. 284025
Wagner, T., Burrows, J. P., Deutschmann, T., Dix, B., von Friedeburg, C., Frie, U., Hendrick,F., Heue, K.-P., Irie, H., Iwabuchi, H., Kanaya, Y., Keller, J., McLinden, C. A., Oetjen, H.,Palazzi, E., Petritoli, A., Platt, U., Postylyakov, O., Pukite, J., Richter, A., van Roozendael, M.,Rozanov, A., Rozanov, V., Sinreich, R., Sanghavi, S., and Wittrock, F.: Comparison of box-air-mass-factors and radiances for Multiple-Axis Differential Optical Absorption Spectroscopy30
(MAX-DOAS) geometries calculated from different UV/visible radiative transfer models, At-mos. Chem. Phys., 7, 1809–1833, doi:10.5194/acp-7-1809-2007, 2007. 2841
Wen, S. and Rose, W.: Retrieval of sizes and total masses of particles in volcanic clouds using
2861
AMTD4, 2827–2881, 2011
Early in flightdetection of SO2
Vogel et al.
Title Page
Abstract Introduction
Conclusions References
Tables Figures
J I
J I
Back Close
Full Screen / Esc
Printer-friendly Version
Interactive Discussion
Discussion
Paper
|D
iscussionP
aper|
Discussion
Paper
|D
iscussionP
aper|
AVHRR bands 4 and 5, J. Geophys. Res., 99, 5421–5431, 1994. 2832Zehner, C. (Ed.): Monitoring Volcanic Ash from Space. Proceedings of the ESA-EUMETSAT
workshop on the 14 April to 23 May 2010 eruption at the Eyjafjoll volcano, South Iceland, vol.ESA Publikation STM-280, ESA, ESA, Frascati, Italy, doi:10.5270/atmch-10-01, 2010. 2831
Zhang, Y. and Johansson, M.: MobileDOAS, Department of Earth and Space Sciences,5
Chalmers University of Technology, Gothenburg, Sweden, 2007. 2839
2862
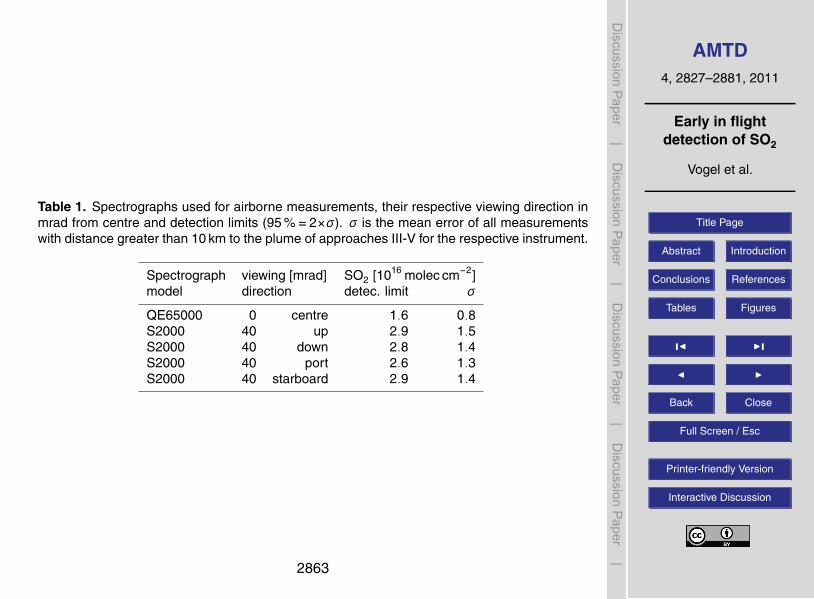
AMTD4, 2827–2881, 2011
Early in flightdetection of SO2
Vogel et al.
Title Page
Abstract Introduction
Conclusions References
Tables Figures
J I
J I
Back Close
Full Screen / Esc
Printer-friendly Version
Interactive Discussion
Discussion
Paper
|D
iscussionP
aper|
Discussion
Paper
|D
iscussionP
aper|
Table 1. Spectrographs used for airborne measurements, their respective viewing direction inmrad from centre and detection limits (95 %=2×σ). σ is the mean error of all measurementswith distance greater than 10 km to the plume of approaches III-V for the respective instrument.
Spectrograph viewing [mrad] SO2 [1016 molec cm−2]model direction detec. limit σ
QE65000 0 centre 1.6 0.8S2000 40 up 2.9 1.5S2000 40 down 2.8 1.4S2000 40 port 2.6 1.3S2000 40 starboard 2.9 1.4
2863
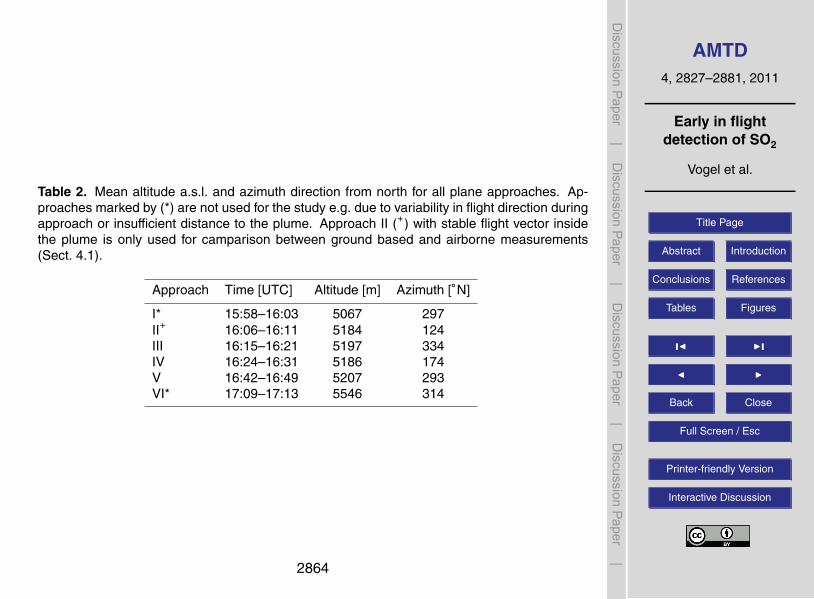
AMTD4, 2827–2881, 2011
Early in flightdetection of SO2
Vogel et al.
Title Page
Abstract Introduction
Conclusions References
Tables Figures
J I
J I
Back Close
Full Screen / Esc
Printer-friendly Version
Interactive Discussion
Discussion
Paper
|D
iscussionP
aper|
Discussion
Paper
|D
iscussionP
aper|
Table 2. Mean altitude a.s.l. and azimuth direction from north for all plane approaches. Ap-proaches marked by (*) are not used for the study e.g. due to variability in flight direction duringapproach or insufficient distance to the plume. Approach II (+) with stable flight vector insidethe plume is only used for camparison between ground based and airborne measurements(Sect. 4.1).
Approach Time [UTC] Altitude [m] Azimuth [◦N]
I* 15:58–16:03 5067 297II+ 16:06–16:11 5184 124III 16:15–16:21 5197 334IV 16:24–16:31 5186 174V 16:42–16:49 5207 293VI* 17:09–17:13 5546 314
2864
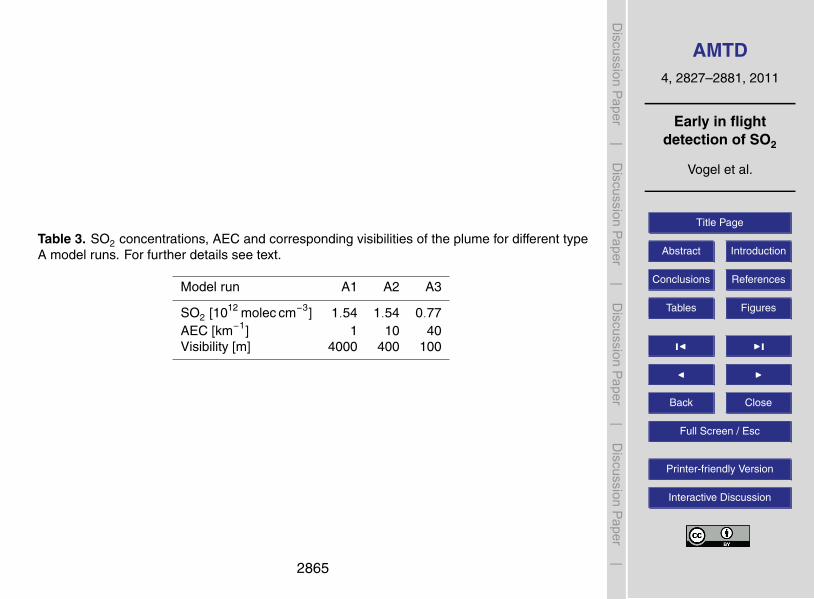
AMTD4, 2827–2881, 2011
Early in flightdetection of SO2
Vogel et al.
Title Page
Abstract Introduction
Conclusions References
Tables Figures
J I
J I
Back Close
Full Screen / Esc
Printer-friendly Version
Interactive Discussion
Discussion
Paper
|D
iscussionP
aper|
Discussion
Paper
|D
iscussionP
aper|
Table 3. SO2 concentrations, AEC and corresponding visibilities of the plume for different typeA model runs. For further details see text.
Model run A1 A2 A3
SO2 [1012 molec cm−3] 1.54 1.54 0.77AEC [km−1] 1 10 40Visibility [m] 4000 400 100
2865
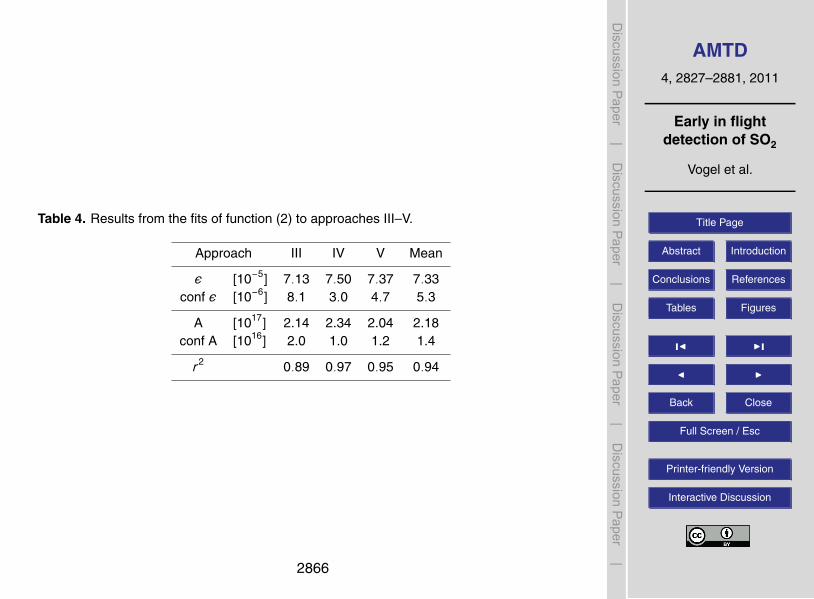
AMTD4, 2827–2881, 2011
Early in flightdetection of SO2
Vogel et al.
Title Page
Abstract Introduction
Conclusions References
Tables Figures
J I
J I
Back Close
Full Screen / Esc
Printer-friendly Version
Interactive Discussion
Discussion
Paper
|D
iscussionP
aper|
Discussion
Paper
|D
iscussionP
aper|
Table 4. Results from the fits of function (2) to approaches III–V.
Approach III IV V Mean
ε [10−5] 7.13 7.50 7.37 7.33conf ε [10−6] 8.1 3.0 4.7 5.3
A [1017] 2.14 2.34 2.04 2.18conf A [1016] 2.0 1.0 1.2 1.4
r2 0.89 0.97 0.95 0.94
2866
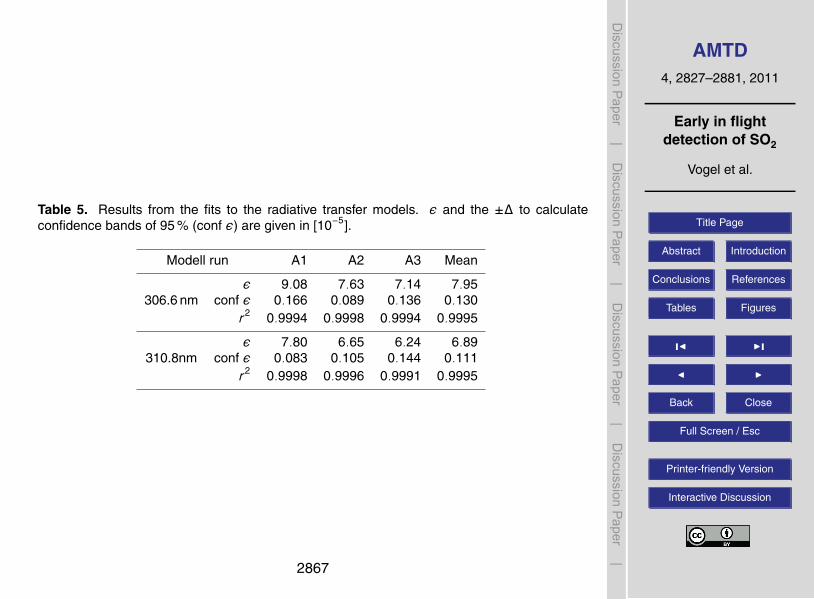
AMTD4, 2827–2881, 2011
Early in flightdetection of SO2
Vogel et al.
Title Page
Abstract Introduction
Conclusions References
Tables Figures
J I
J I
Back Close
Full Screen / Esc
Printer-friendly Version
Interactive Discussion
Discussion
Paper
|D
iscussionP
aper|
Discussion
Paper
|D
iscussionP
aper|
Table 5. Results from the fits to the radiative transfer models. ε and the ±∆ to calculateconfidence bands of 95 % (conf ε) are given in [10−5].
Modell run A1 A2 A3 Mean
ε 9.08 7.63 7.14 7.95306.6 nm conf ε 0.166 0.089 0.136 0.130
r2 0.9994 0.9998 0.9994 0.9995
ε 7.80 6.65 6.24 6.89310.8nm conf ε 0.083 0.105 0.144 0.111
r2 0.9998 0.9996 0.9991 0.9995
2867
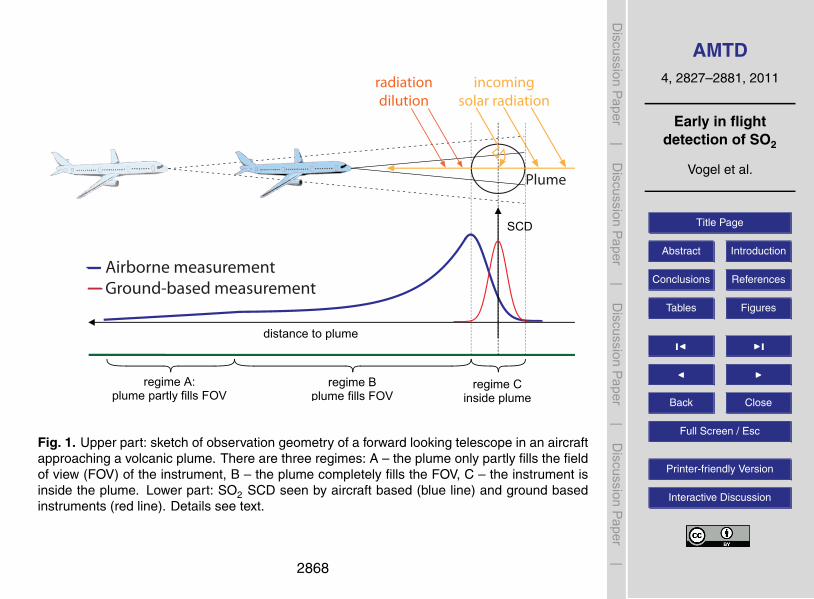
AMTD4, 2827–2881, 2011
Early in flightdetection of SO2
Vogel et al.
Title Page
Abstract Introduction
Conclusions References
Tables Figures
J I
J I
Back Close
Full Screen / Esc
Printer-friendly Version
Interactive Discussion
Discussion
Paper
|D
iscussionP
aper|
Discussion
Paper
|D
iscussionP
aper|
distance to plume
regime A: plume partly fills FOV
regime B plume fills FOV
regime C inside plume
SCD
Airborne measurement
Ground-based measurement
radiation
dilution
incoming
solar radiation
Plume
Fig. 1. Upper part: sketch of observation geometry of a forward looking telescope in an aircraft approaching a
volcanic plume. There are three regimes: A the plume only partly fills the fieldof view (FOV) of the instrument,
B - the plume completely fills the FOV, C the instrument is inside the plume. Lowerpart: SO2 SCD seen by
aircraft based (blue line) and ground based instruments (red line). Details see text.
CenterStarbord Port
Up
Down
Fig. 2. A schematic of the different airborne viewing directions. All telescopes were mounted at the airplane
close to co-pilots window. The viewing directions (up, down, starboard, port) were looking at angles of 40mrad
with respect to centre and a horizontal plane (up, down) or a vertical plane (starboard, port).
24
Fig. 1. Upper part: sketch of observation geometry of a forward looking telescope in an aircraftapproaching a volcanic plume. There are three regimes: A – the plume only partly fills the fieldof view (FOV) of the instrument, B – the plume completely fills the FOV, C – the instrument isinside the plume. Lower part: SO2 SCD seen by aircraft based (blue line) and ground basedinstruments (red line). Details see text.
2868
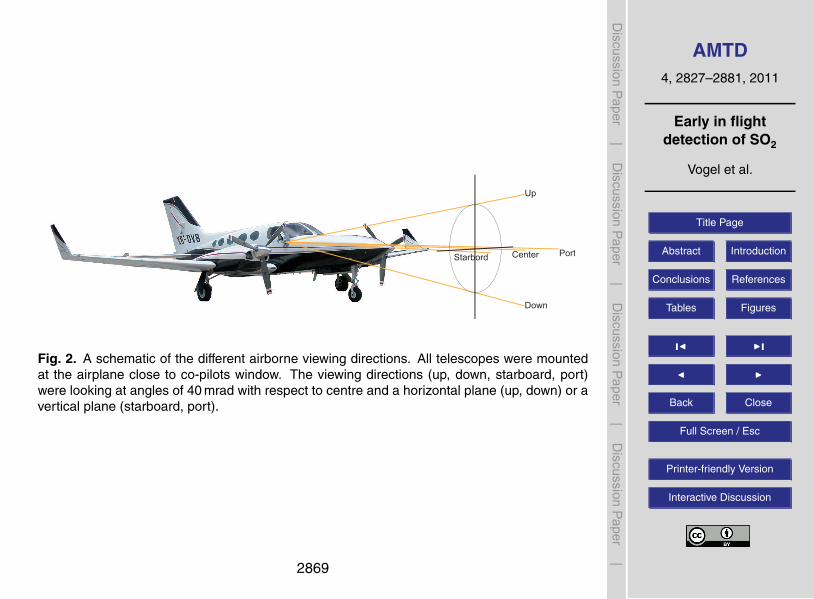
AMTD4, 2827–2881, 2011
Early in flightdetection of SO2
Vogel et al.
Title Page
Abstract Introduction
Conclusions References
Tables Figures
J I
J I
Back Close
Full Screen / Esc
Printer-friendly Version
Interactive Discussion
Discussion
Paper
|D
iscussionP
aper|
Discussion
Paper
|D
iscussionP
aper|
distance to plume
regime A: plume partly fills FOV
regime B plume fills FOV
regime C inside plume
SCD
Airborne measurement
Ground-based measurement
radiation
dilution
incoming
solar radiation
Plume
Fig. 1. Upper part: sketch of observation geometry of a forward looking telescope in an aircraft approaching a
volcanic plume. There are three regimes: A the plume only partly fills the fieldof view (FOV) of the instrument,
B - the plume completely fills the FOV, C the instrument is inside the plume. Lowerpart: SO2 SCD seen by
aircraft based (blue line) and ground based instruments (red line). Details see text.
CenterStarbord Port
Up
Down
Fig. 2. A schematic of the different airborne viewing directions. All telescopes were mounted at the airplane
close to co-pilots window. The viewing directions (up, down, starboard, port) were looking at angles of 40mrad
with respect to centre and a horizontal plane (up, down) or a vertical plane (starboard, port).
24
Fig. 2. A schematic of the different airborne viewing directions. All telescopes were mountedat the airplane close to co-pilots window. The viewing directions (up, down, starboard, port)were looking at angles of 40 mrad with respect to centre and a horizontal plane (up, down) or avertical plane (starboard, port).
2869
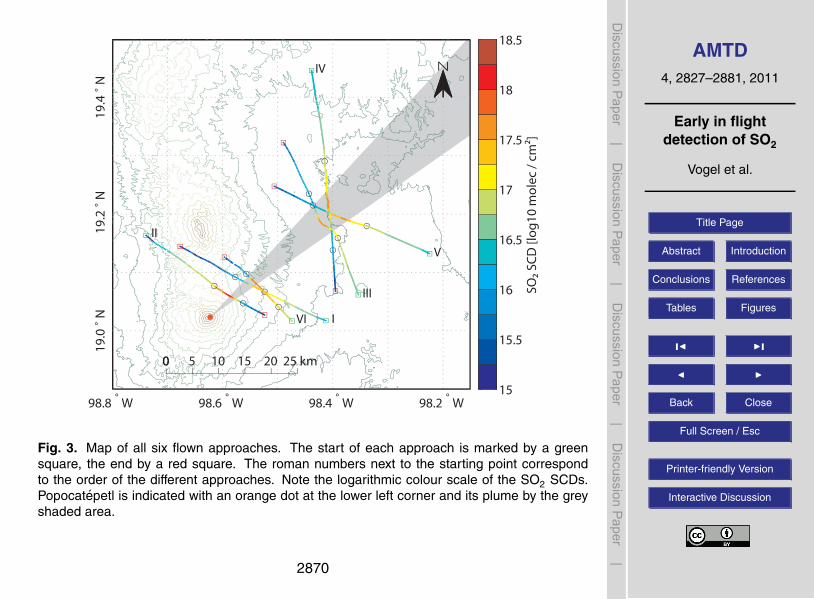
AMTD4, 2827–2881, 2011
Early in flightdetection of SO2
Vogel et al.
Title Page
Abstract Introduction
Conclusions References
Tables Figures
J I
J I
Back Close
Full Screen / Esc
Printer-friendly Version
Interactive Discussion
Discussion
Paper
|D
iscussionP
aper|
Discussion
Paper
|D
iscussionP
aper|
25 km00 5 10 15 20
98.8 ° W 98.6 ° W 98.4 ° W 98.2 ° W
19.
0° N
1
9.2° N
1
9.4° N
15
15.5
16
16.5
17
17.5
18
18.5
SO2 S
CD
[lo
g10
mo
lec
/ cm
2]
I
II
III
VI
V
IV
Fig. 3. Map of all six flown approaches. The start of each approach is marked by a green square, the end by a
red square. The roman numbers next to the starting point correspondto the order of the different approaches.
Note the logarithmic colour scale of theSO2 SCDs. Popocatepetl is indicated with an orange dot at the lower
left corner and its plume by the grey shaded area.
25
Fig. 3. Map of all six flown approaches. The start of each approach is marked by a greensquare, the end by a red square. The roman numbers next to the starting point correspondto the order of the different approaches. Note the logarithmic colour scale of the SO2 SCDs.Popocatepetl is indicated with an orange dot at the lower left corner and its plume by the greyshaded area.
2870
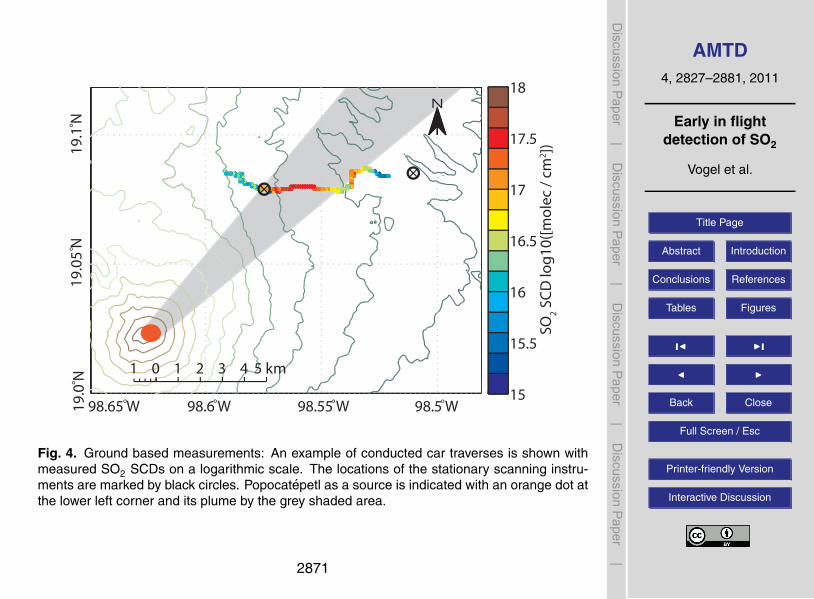
AMTD4, 2827–2881, 2011
Early in flightdetection of SO2
Vogel et al.
Title Page
Abstract Introduction
Conclusions References
Tables Figures
J I
J I
Back Close
Full Screen / Esc
Printer-friendly Version
Interactive Discussion
Discussion
Paper
|D
iscussionP
aper|
Discussion
Paper
|D
iscussionP
aper|
0 1 2 3 4 5 km1
98.65 W° 98.6 W° 98.55 W° 98.5 W° 19.
0 N°
19.
05 N°
19.
1 N°
15
15.5
16
16.5
17
17.5
18
SO
2 SC
D lo
g10
([m
ole
c /
cm2 ])
Fig. 4. Ground based measurements: An example of conducted car traverses is shown with measuredSO2
SCDs on a logarithmic scale. The locations of the stationary scanning instruments are marked by black circles.
Popocatepetl as a source is indicated with an orange dot at the lower left corner and its plume by the grey shaded
area.
300 310 320 330 340 350
−2
−1
0
1
2
wave length [nm]
SO2 d
i"er
enti
al s
catt
erin
g c
ross
sec
tio
n
−1
0
1x 10
−21
[10-1
9 m
ole
c/cm
2 ]
Fig. 5. A high pass filteredSO2 cross section at the same optical resolution as the QE65000 spectrograph used
with the centre looking telescope. The inserted graph displays the respective part of theSO2 cross section
magnified by a factor of 100.
26
Fig. 4. Ground based measurements: An example of conducted car traverses is shown withmeasured SO2 SCDs on a logarithmic scale. The locations of the stationary scanning instru-ments are marked by black circles. Popocatepetl as a source is indicated with an orange dot atthe lower left corner and its plume by the grey shaded area.
2871
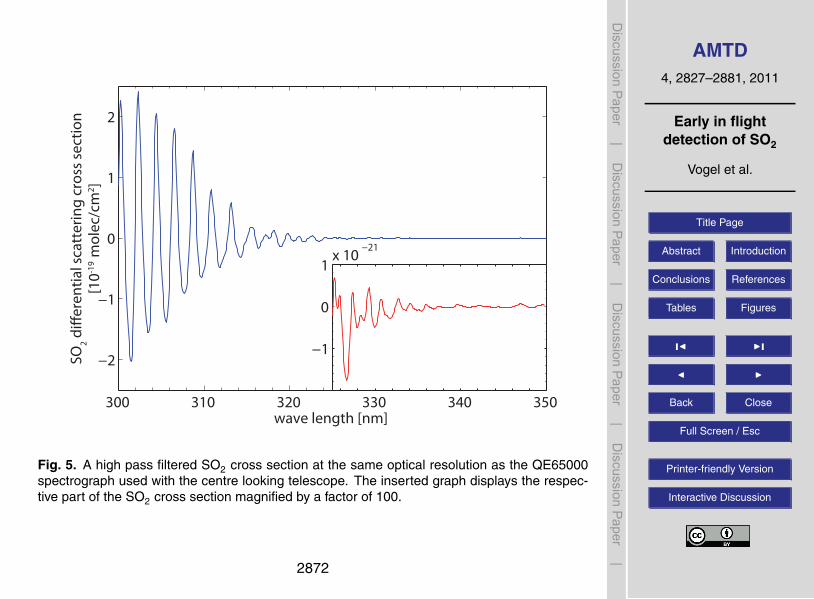
AMTD4, 2827–2881, 2011
Early in flightdetection of SO2
Vogel et al.
Title Page
Abstract Introduction
Conclusions References
Tables Figures
J I
J I
Back Close
Full Screen / Esc
Printer-friendly Version
Interactive Discussion
Discussion
Paper
|D
iscussionP
aper|
Discussion
Paper
|D
iscussionP
aper|
0 1 2 3 4 5 km1
98.65 W° 98.6 W° 98.55 W° 98.5 W° 19.
0 N°
19.
05 N°
19.
1 N°
15
15.5
16
16.5
17
17.5
18
SO
2 SC
D lo
g10
([m
ole
c /
cm2 ])
Fig. 4. Ground based measurements: An example of conducted car traverses is shown with measuredSO2
SCDs on a logarithmic scale. The locations of the stationary scanning instruments are marked by black circles.
Popocatepetl as a source is indicated with an orange dot at the lower left corner and its plume by the grey shaded
area.
300 310 320 330 340 350
−2
−1
0
1
2
wave length [nm]
SO2 d
i"er
enti
al s
catt
erin
g c
ross
sec
tio
n
−1
0
1x 10
−21
[10-1
9 m
ole
c/cm
2 ]
Fig. 5. A high pass filteredSO2 cross section at the same optical resolution as the QE65000 spectrograph used
with the centre looking telescope. The inserted graph displays the respective part of theSO2 cross section
magnified by a factor of 100.
26
Fig. 5. A high pass filtered SO2 cross section at the same optical resolution as the QE65000spectrograph used with the centre looking telescope. The inserted graph displays the respec-tive part of the SO2 cross section magnified by a factor of 100.
2872
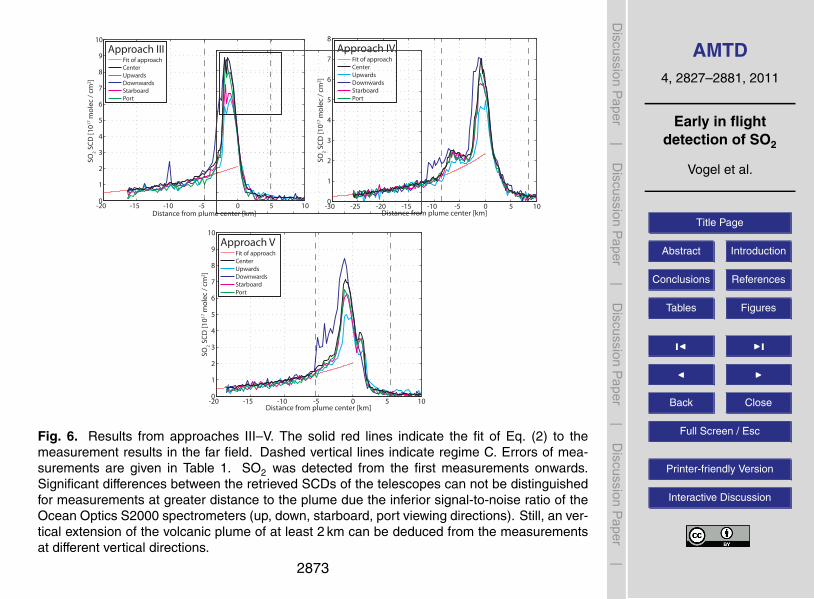
AMTD4, 2827–2881, 2011
Early in flightdetection of SO2
Vogel et al.
Title Page
Abstract Introduction
Conclusions References
Tables Figures
J I
J I
Back Close
Full Screen / Esc
Printer-friendly Version
Interactive Discussion
Discussion
Paper
|D
iscussionP
aper|
Discussion
Paper
|D
iscussionP
aper|
-20 -15 -10 -5 0 5 100
1
2
3
4
5
6
7
8
9
10
SO2 S
CD
[1017
mo
lec
/ cm
2 ]
Distance from plume center [km]
Fit of approachCenterUpwardsDownwardsStarboardPort
Approach V
-30 -25 -20 -15 -10 -5 0 5 100
1
2
3
4
5
6
7
8
SO2 S
CD
[1017
mo
lec
/ cm
2 ]
Distance from plume center [km]
Fit of approachCenterUpwardsDownwardsStarboardPort
Approach IV
-20 -15 -10 -5 0 5 100
1
2
3
4
5
6
7
8
9
10
SO2 S
CD
[1017
mo
lec
/ cm
2 ]
Distance from plume center [km]
Fit of approachCenterUpwardsDownwardsStarboardPort
Approach III
Fig. 6. Results from approaches III - V. The solid red lines indicate the fit of eq.(2) to the measurement results
in the far field. Dashed lines indicate regime C. Errors of measurements are given in tab. 1.SO2 was detected
from the first measurements onwards. Significant differences between the retrieved SCDs of the telescopes
can not be distinguished for measurements at greater distance to the plume due the inferior signal-to-noise
ratio of the Ocean Optics S2000 spectrometers (up, down, starboard, port viewing directions). Still, an vertical
extension of the volcanic plume of at least 2km can be deduced from the measurements at different vertical
directions.
27
-20 -15 -10 -5 0 5 100
1
2
3
4
5
6
7
8
9
10
SO2 S
CD
[1017
mo
lec
/ cm
2 ]
Distance from plume center [km]
Fit of approachCenterUpwardsDownwardsStarboardPort
Approach V
-30 -25 -20 -15 -10 -5 0 5 100
1
2
3
4
5
6
7
8
SO2 S
CD
[1017
mo
lec
/ cm
2 ]
Distance from plume center [km]
Fit of approachCenterUpwardsDownwardsStarboardPort
Approach IV
-20 -15 -10 -5 0 5 100
1
2
3
4
5
6
7
8
9
10
SO2 S
CD
[1017
mo
lec
/ cm
2 ]
Distance from plume center [km]
Fit of approachCenterUpwardsDownwardsStarboardPort
Approach III
Fig. 6. Results from approaches III - V. The solid red lines indicate the fit of eq.(2) to the measurement results
in the far field. Dashed lines indicate regime C. Errors of measurements are given in tab. 1.SO2 was detected
from the first measurements onwards. Significant differences between the retrieved SCDs of the telescopes
can not be distinguished for measurements at greater distance to the plume due the inferior signal-to-noise
ratio of the Ocean Optics S2000 spectrometers (up, down, starboard, port viewing directions). Still, an vertical
extension of the volcanic plume of at least 2km can be deduced from the measurements at different vertical
directions.
27
Fig. 6. Results from approaches III–V. The solid red lines indicate the fit of Eq. (2) to themeasurement results in the far field. Dashed vertical lines indicate regime C. Errors of mea-surements are given in Table 1. SO2 was detected from the first measurements onwards.Significant differences between the retrieved SCDs of the telescopes can not be distinguishedfor measurements at greater distance to the plume due the inferior signal-to-noise ratio of theOcean Optics S2000 spectrometers (up, down, starboard, port viewing directions). Still, an ver-tical extension of the volcanic plume of at least 2 km can be deduced from the measurementsat different vertical directions.
2873
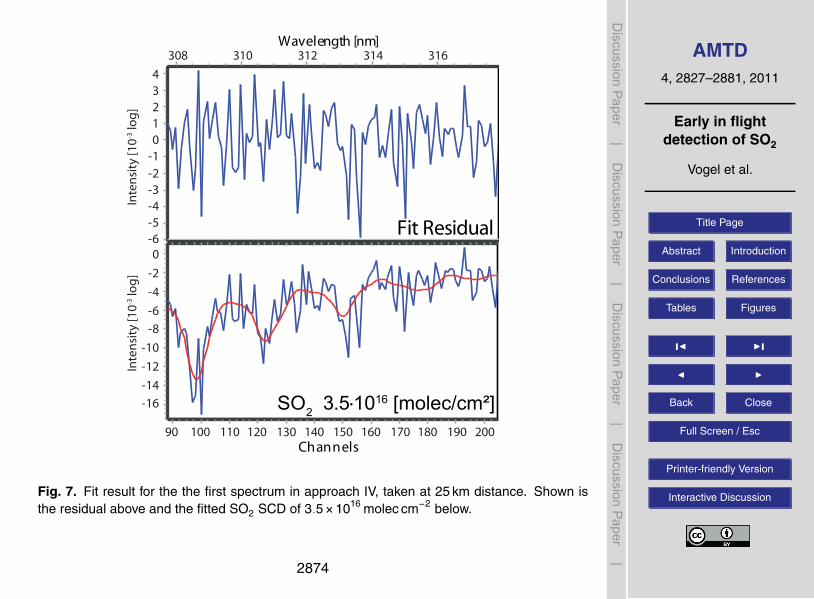
AMTD4, 2827–2881, 2011
Early in flightdetection of SO2
Vogel et al.
Title Page
Abstract Introduction
Conclusions References
Tables Figures
J I
J I
Back Close
Full Screen / Esc
Printer-friendly Version
Interactive Discussion
Discussion
Paper
|D
iscussionP
aper|
Discussion
Paper
|D
iscussionP
aper|
0
-2
-4
-6
-8
-10
-12
-14
-16
Channels20019018017016015014013012011010090
4
3
2
1
0
-1
-2
-3
-4
-5
-6
Wavelength [nm]316314312310308
Inte
nsi
ty [
10
-3 lo
g]
Inte
nsi
ty [
10
-3 lo
g]
SO2 3.5·1016 [molec/cm²]
Fit Residual
Fig. 7. Fit result for the the first spectrum in approach IV, taken at 25km distance. Shown is the residual above
and the fittedSO2 SCD of3.5 ·1016molec/cm2 below.
0
5
10
15
20
25
SO2 S
CD
[1017
mo
lec/
cm2]
-5 -4 -3 -2 -1 0 51 2 3 4-1
0
2
4
6
8
10
Distance to plume center [km]
Approach II
SO2 S
CD
[1017
mo
lec/
cm2]
Traverse 2Gauss Fit
Fig. 8. Comparison of results from car traverses and airborne measurements, with scale of measuredSO2
SCDs on the right and left ordinate, respectively. Values below 3x measurement error are drawn in grey. Strong
variations in the car traverse (e.g. at 1km from plume centre) are artefacts due to vegetation blocking the view.
The gradients shown agree with expected characteristics of transition between regime B to regime C (see fig. 1),
although the starting point of the plume of the car traverse does not correlate with the maximum of the values
retrieved from the airborne measurement.
28
Fig. 7. Fit result for the the first spectrum in approach IV, taken at 25 km distance. Shown isthe residual above and the fitted SO2 SCD of 3.5×10¹⁶ molec cm−2 below.
2874
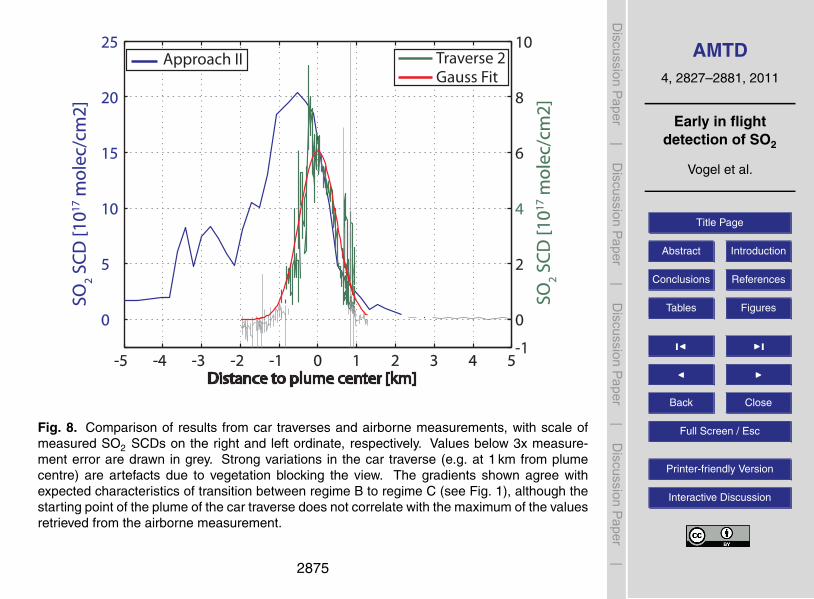
AMTD4, 2827–2881, 2011
Early in flightdetection of SO2
Vogel et al.
Title Page
Abstract Introduction
Conclusions References
Tables Figures
J I
J I
Back Close
Full Screen / Esc
Printer-friendly Version
Interactive Discussion
Discussion
Paper
|D
iscussionP
aper|
Discussion
Paper
|D
iscussionP
aper|
0
-2
-4
-6
-8
-10
-12
-14
-16
Channels20019018017016015014013012011010090
4
3
2
1
0
-1
-2
-3
-4
-5
-6
Wavelength [nm]316314312310308
Inte
nsi
ty [
10
-3 lo
g]
Inte
nsi
ty [
10
-3 lo
g]
SO2 3.5·1016 [molec/cm²]
Fit Residual
Fig. 7. Fit result for the the first spectrum in approach IV, taken at 25km distance. Shown is the residual above
and the fittedSO2 SCD of3.5 ·1016molec/cm2 below.
0
5
10
15
20
25
SO2 S
CD
[1017
mo
lec/
cm2]
-5 -4 -3 -2 -1 0 51 2 3 4-1
0
2
4
6
8
10
Distance to plume center [km]
Approach II
SO2 S
CD
[1017
mo
lec/
cm2]
Traverse 2Gauss Fit
Fig. 8. Comparison of results from car traverses and airborne measurements, with scale of measuredSO2
SCDs on the right and left ordinate, respectively. Values below 3x measurement error are drawn in grey. Strong
variations in the car traverse (e.g. at 1km from plume centre) are artefacts due to vegetation blocking the view.
The gradients shown agree with expected characteristics of transition between regime B to regime C (see fig. 1),
although the starting point of the plume of the car traverse does not correlate with the maximum of the values
retrieved from the airborne measurement.
28
Fig. 8. Comparison of results from car traverses and airborne measurements, with scale ofmeasured SO2 SCDs on the right and left ordinate, respectively. Values below 3x measure-ment error are drawn in grey. Strong variations in the car traverse (e.g. at 1 km from plumecentre) are artefacts due to vegetation blocking the view. The gradients shown agree withexpected characteristics of transition between regime B to regime C (see Fig. 1), although thestarting point of the plume of the car traverse does not correlate with the maximum of the valuesretrieved from the airborne measurement.
2875
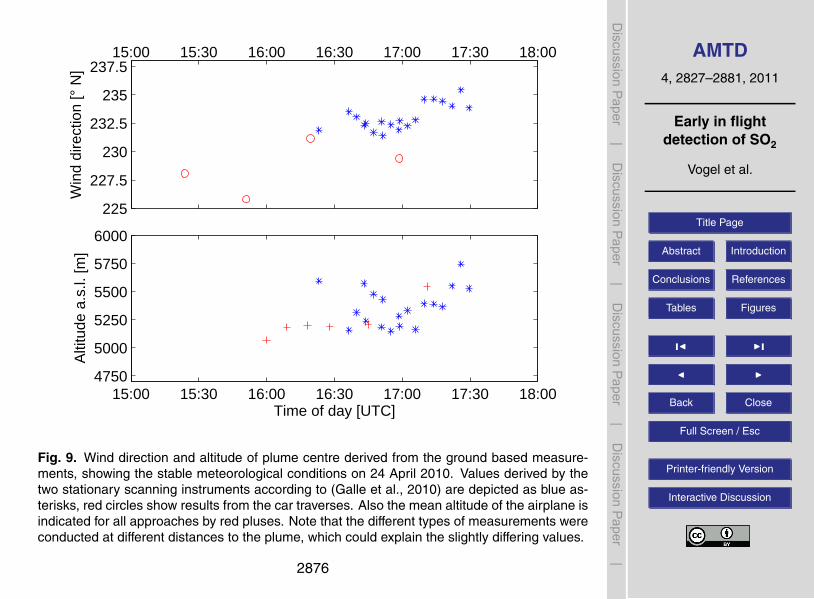
AMTD4, 2827–2881, 2011
Early in flightdetection of SO2
Vogel et al.
Title Page
Abstract Introduction
Conclusions References
Tables Figures
J I
J I
Back Close
Full Screen / Esc
Printer-friendly Version
Interactive Discussion
Discussion
Paper
|D
iscussionP
aper|
Discussion
Paper
|D
iscussionP
aper|
15:00 15:30 16:00 16:30 17:00 17:30 18:00
225
230
235
227.5
237.5
232.5
Win
d di
rect
ion
[° N
]
15:00 15:30 16:00 16:30 17:00 17:30 18:004750
5000
5250
5500
5750
6000
Time of day [UTC]
Alti
tude
a.s
.l. [m
]
Fig. 9. Wind direction and altitude of plume centre derived from the ground basedmeasurements, showing the
stable meteorological conditions on April 24th, 2010. Values derived by the two stationary scanning instruments
according to (Galle et al., 2010) are depicted as blue asterisks, red circles show results from the car traverses.
Also the mean altitude of the airplane is indicated for all approaches by red pluses. Note that the different types
of measurements were conducted at different distances to the plume, which could explain the slightly differing
values.
0
1
2
3
4
5
6
7
8
9
10
−100 −80 −60 −40 −20 0Distance to Plume Centre [km]
SO
2 S
CD
[1
01
7m
ole
c/cm
2]
Plume306.6nm310.8nm315.4nm319.7nm324.8nm
Fig. 10. The figure shows the results of model run A2. The AEC was set to 10km−1 corresponding to a
visibility of 400m inside the plume, which is marked as shaded area. The graph depicts simulatedSO2 column
density as a function of the distance of the instrument from the plume.
29
Fig. 9. Wind direction and altitude of plume centre derived from the ground based measure-ments, showing the stable meteorological conditions on 24 April 2010. Values derived by thetwo stationary scanning instruments according to (Galle et al., 2010) are depicted as blue as-terisks, red circles show results from the car traverses. Also the mean altitude of the airplane isindicated for all approaches by red pluses. Note that the different types of measurements wereconducted at different distances to the plume, which could explain the slightly differing values.
2876
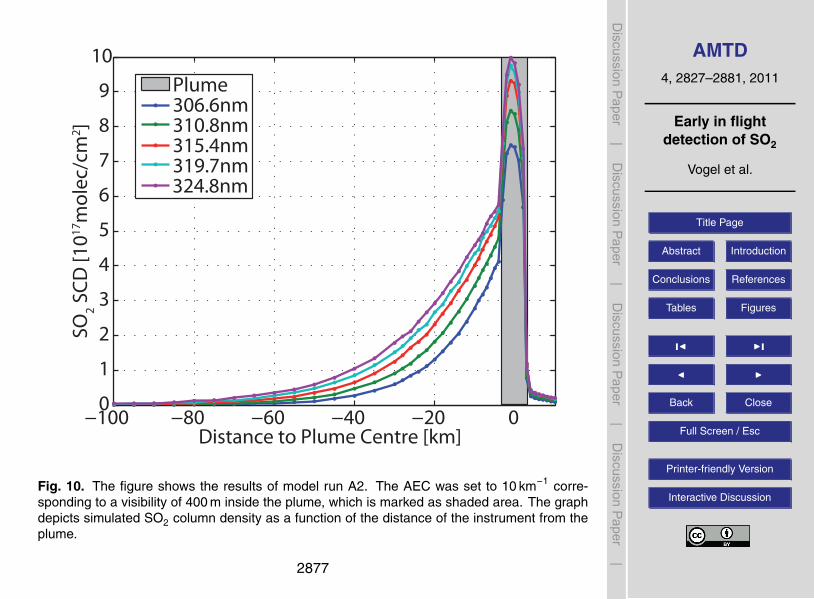
AMTD4, 2827–2881, 2011
Early in flightdetection of SO2
Vogel et al.
Title Page
Abstract Introduction
Conclusions References
Tables Figures
J I
J I
Back Close
Full Screen / Esc
Printer-friendly Version
Interactive Discussion
Discussion
Paper
|D
iscussionP
aper|
Discussion
Paper
|D
iscussionP
aper|
15:00 15:30 16:00 16:30 17:00 17:30 18:00
225
230
235
227.5
237.5
232.5
Win
d di
rect
ion
[° N
]
15:00 15:30 16:00 16:30 17:00 17:30 18:004750
5000
5250
5500
5750
6000
Time of day [UTC]
Alti
tude
a.s
.l. [m
]
Fig. 9. Wind direction and altitude of plume centre derived from the ground basedmeasurements, showing the
stable meteorological conditions on April 24th, 2010. Values derived by the two stationary scanning instruments
according to (Galle et al., 2010) are depicted as blue asterisks, red circles show results from the car traverses.
Also the mean altitude of the airplane is indicated for all approaches by red pluses. Note that the different types
of measurements were conducted at different distances to the plume, which could explain the slightly differing
values.
0
1
2
3
4
5
6
7
8
9
10
−100 −80 −60 −40 −20 0Distance to Plume Centre [km]
SO
2 S
CD
[1
01
7m
ole
c/cm
2]
Plume306.6nm310.8nm315.4nm319.7nm324.8nm
Fig. 10. The figure shows the results of model run A2. The AEC was set to 10km−1 corresponding to a
visibility of 400m inside the plume, which is marked as shaded area. The graph depicts simulatedSO2 column
density as a function of the distance of the instrument from the plume.
29
Fig. 10. The figure shows the results of model run A2. The AEC was set to 10 km−1 corre-sponding to a visibility of 400 m inside the plume, which is marked as shaded area. The graphdepicts simulated SO2 column density as a function of the distance of the instrument from theplume.
2877
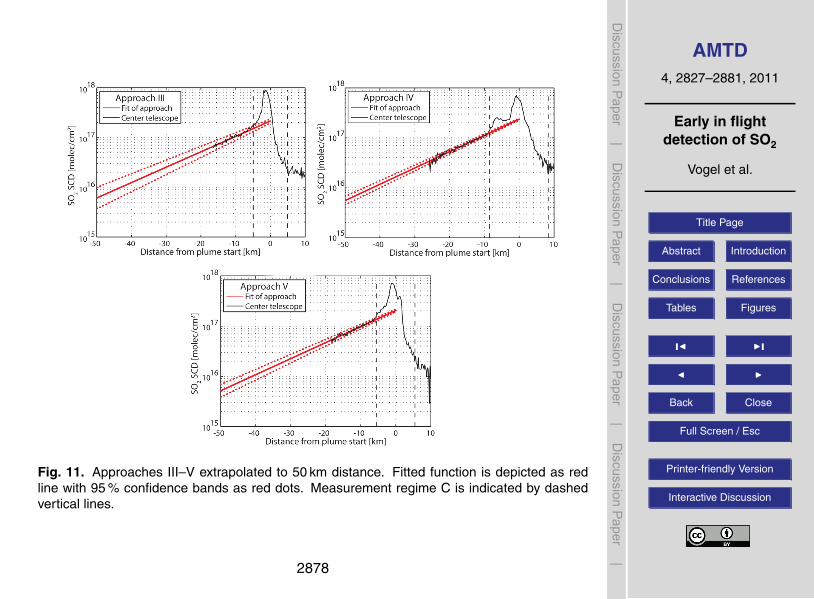
AMTD4, 2827–2881, 2011
Early in flightdetection of SO2
Vogel et al.
Title Page
Abstract Introduction
Conclusions References
Tables Figures
J I
J I
Back Close
Full Screen / Esc
Printer-friendly Version
Interactive Discussion
Discussion
Paper
|D
iscussionP
aper|
Discussion
Paper
|D
iscussionP
aper|
Fig. 11. Approaches III–V extrapolated to 50 km distance. Fitted function is depicted as redline with 95 % confidence bands as red dots. Measurement regime C is indicated by dashedvertical lines.
2878
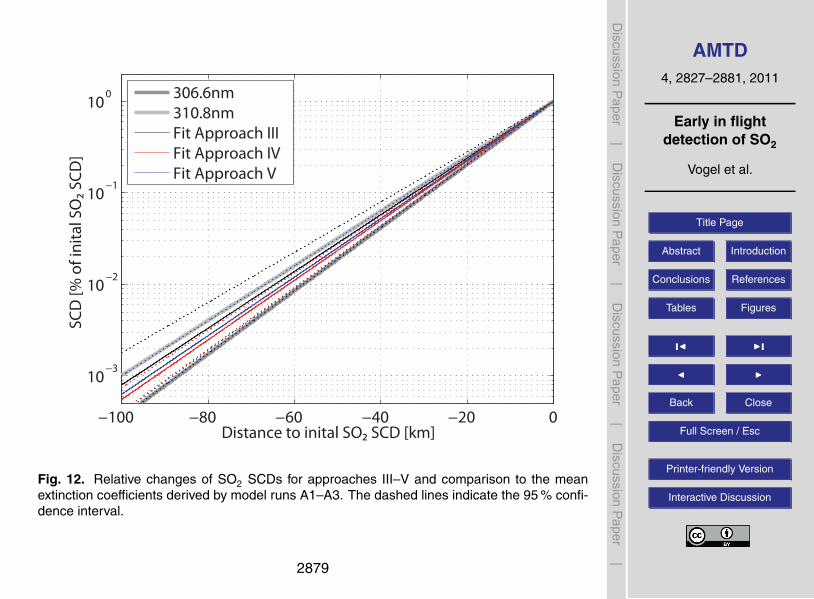
AMTD4, 2827–2881, 2011
Early in flightdetection of SO2
Vogel et al.
Title Page
Abstract Introduction
Conclusions References
Tables Figures
J I
J I
Back Close
Full Screen / Esc
Printer-friendly Version
Interactive Discussion
Discussion
Paper
|D
iscussionP
aper|
Discussion
Paper
|D
iscussionP
aper|
−100 −80 −60 −40 −20 0
10−3
10−2
10−1
100
Distance to inital SO2 SCD [km]
SC
D [
% o
f in
ita
l SO
2 S
CD
]
306.6nm
310.8nm
Fit Approach III
Fit Approach IV
Fit Approach V
Fig. 12.Relative changes ofSO2 SCDs for approaches III-V and comparison to the mean extinction coefficients
derived by model runs A1 - A3. The dashed lines indicate the 95% confidence interval.
1014
1015
1016
1017
1018
SO
2 S
CD
[m
ole
c/cm
2]
−100 −80 −60 −40 −20 0 20Distance to Plume Centre [km]
Plume306.6nm310.8nm315.4nm319.7nm324.8nm
Fig. 13.SimulatedSO2 SCD from model scenario B3. Here, a volcanic cloud with infinite extent in propagation
direction and from the edge onwards was assumed to be at 10km altitude. An SO2 concentration of1 ·1012
molec/cm2 is assumed for the simulation, and the cloud exhibited an aerosol optical depth of 0.1km−1.
31
Fig. 12. Relative changes of SO2 SCDs for approaches III–V and comparison to the meanextinction coefficients derived by model runs A1–A3. The dashed lines indicate the 95 % confi-dence interval.
2879
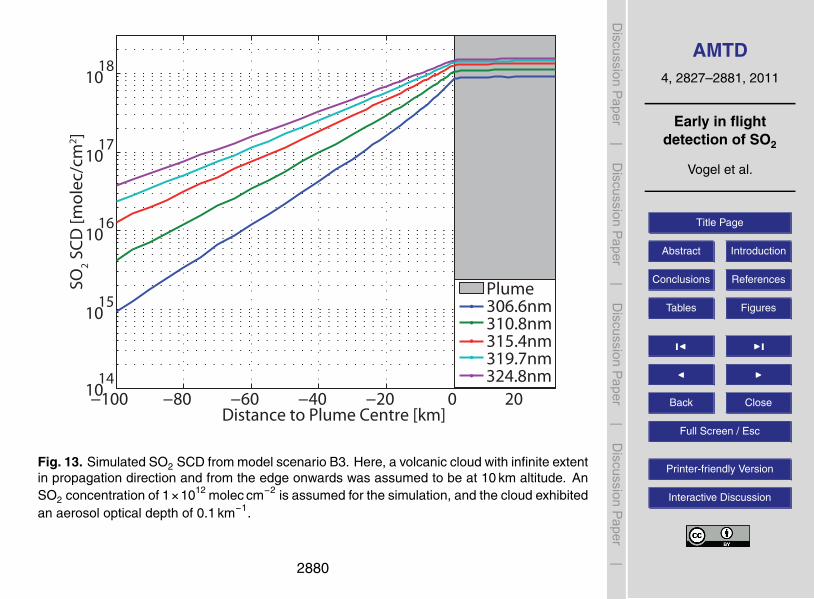
AMTD4, 2827–2881, 2011
Early in flightdetection of SO2
Vogel et al.
Title Page
Abstract Introduction
Conclusions References
Tables Figures
J I
J I
Back Close
Full Screen / Esc
Printer-friendly Version
Interactive Discussion
Discussion
Paper
|D
iscussionP
aper|
Discussion
Paper
|D
iscussionP
aper|
−100 −80 −60 −40 −20 0
10−3
10−2
10−1
100
Distance to inital SO2 SCD [km]
SC
D [
% o
f in
ita
l SO
2 S
CD
]
306.6nm
310.8nm
Fit Approach III
Fit Approach IV
Fit Approach V
Fig. 12.Relative changes ofSO2 SCDs for approaches III-V and comparison to the mean extinction coefficients
derived by model runs A1 - A3. The dashed lines indicate the 95% confidence interval.
1014
1015
1016
1017
1018
SO
2 S
CD
[m
ole
c/cm
2]
−100 −80 −60 −40 −20 0 20Distance to Plume Centre [km]
Plume306.6nm310.8nm315.4nm319.7nm324.8nm
Fig. 13.SimulatedSO2 SCD from model scenario B3. Here, a volcanic cloud with infinite extent in propagation
direction and from the edge onwards was assumed to be at 10km altitude. An SO2 concentration of1 ·1012
molec/cm2 is assumed for the simulation, and the cloud exhibited an aerosol optical depth of 0.1km−1.
31
Fig. 13. Simulated SO2 SCD from model scenario B3. Here, a volcanic cloud with infinite extentin propagation direction and from the edge onwards was assumed to be at 10 km altitude. AnSO2 concentration of 1×10¹² molec cm−2 is assumed for the simulation, and the cloud exhibitedan aerosol optical depth of 0.1 km−1.
2880
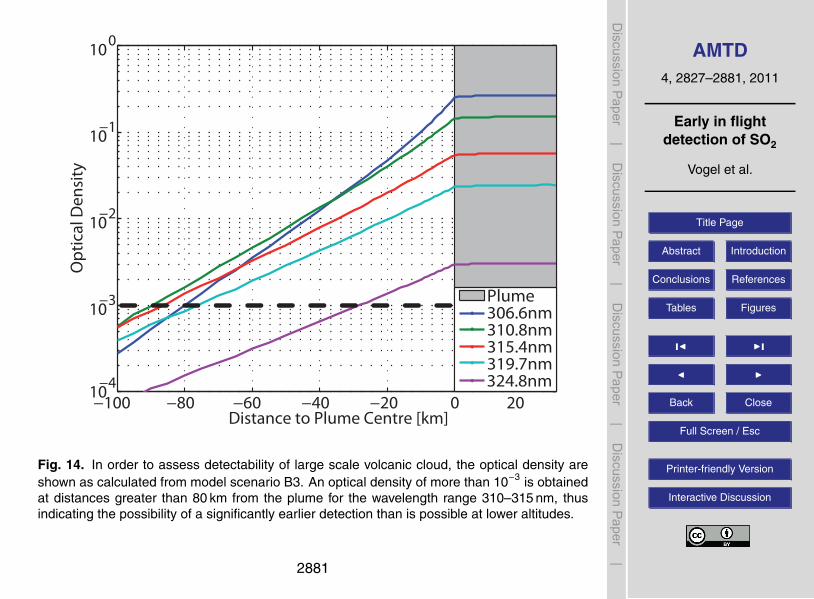
AMTD4, 2827–2881, 2011
Early in flightdetection of SO2
Vogel et al.
Title Page
Abstract Introduction
Conclusions References
Tables Figures
J I
J I
Back Close
Full Screen / Esc
Printer-friendly Version
Interactive Discussion
Discussion
Paper
|D
iscussionP
aper|
Discussion
Paper
|D
iscussionP
aper|
−100 −80 −60 −40 −20 0 20Distance to Plume Centre [km]
10−4
10−3
10−2
10−1
100
Op
tica
l De
nsi
ty
Plume306.6nm310.8nm315.4nm319.7nm324.8nm
Fig. 14. In order to assess detectability of large scale volcanic cloud, the optical density are shown as calculated
from model scenario B3. An optical density of more than10−3 is obtained at distances greater than 80km
from the plume for the wavelength range 310-315nm, thus indicating the possibility of a significantly earlier
detection than is possible at lower altitudes.
32
Fig. 14. In order to assess detectability of large scale volcanic cloud, the optical density areshown as calculated from model scenario B3. An optical density of more than 10−3 is obtainedat distances greater than 80 km from the plume for the wavelength range 310–315 nm, thusindicating the possibility of a significantly earlier detection than is possible at lower altitudes.
2881
Related Documents