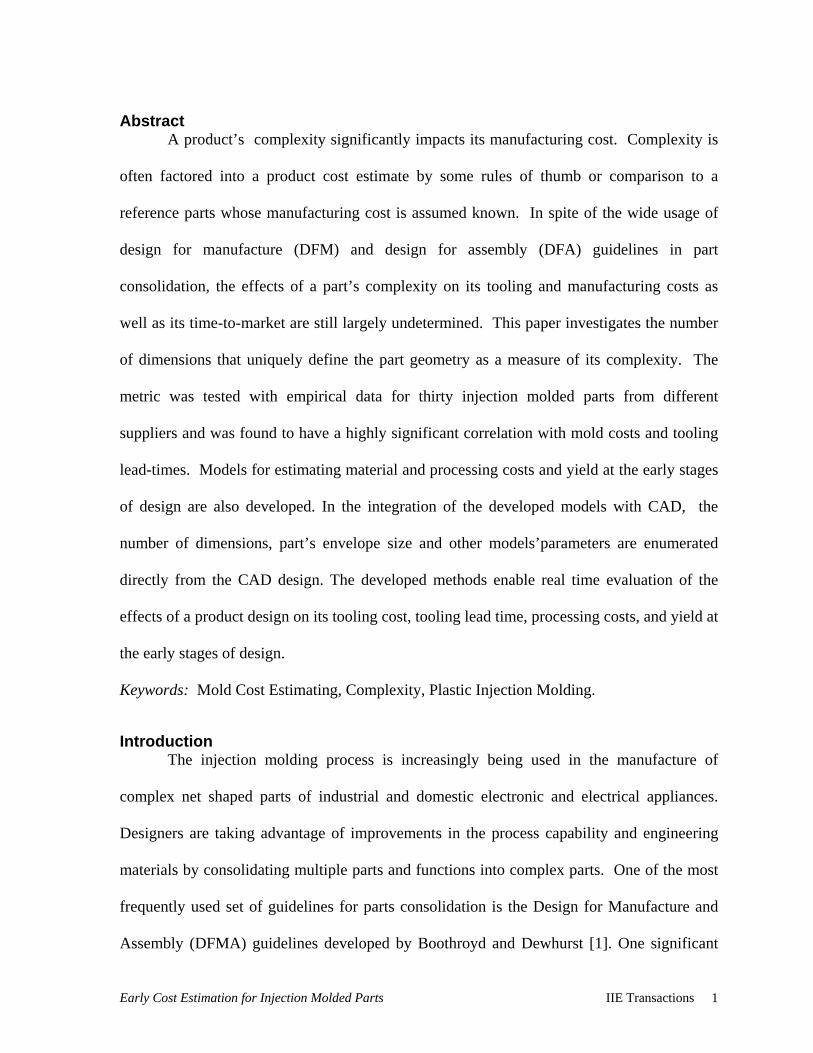
EARLY COST ESTIMATION FOR INJECTION MOLDED PARTS Adekunle A. Fagade and David O. Kazmer Mechanical and Industrial Engineering Department University of Massachusetts Amherst Engineering Laboratory Building Amherst, MA 01003 Abstract ..................................................................................................................................... 1 Introduction ............................................................................................................................... 1 Research Objectives .................................................................................................................. 2 Part Cost Estimation ................................................................................................................. 3 Mold Cost Estimation ............................................................................................................ 4 Related Research ................................................................................................................ 4 Proposed Approach ............................................................................................................ 7 Collection of Empirical Data.............................................................................................. 9 Mold Cost Drivers ............................................................................................................ 10 Regression Results ........................................................................................................... 13 Model Comparison ........................................................................................................... 15 Material Cost Estimation ..................................................................................................... 16 Processing Cost Estimation ................................................................................................. 17 Processing Yield Estimation ............................................................................................ 18 Implementation of Models in CAD and Internet .................................................................... 20 Conclusion .............................................................................................................................. 21 References ............................................................................................................................... 22 5800 words

Welcome message from author
This document is posted to help you gain knowledge. Please leave a comment to let me know what you think about it! Share it to your friends and learn new things together.
Transcript
EARLY COST ESTIMATION FOR INJECTION MOLDED PARTS
Adekunle A. Fagade and David O. Kazmer
Mechanical and Industrial Engineering Department
University of Massachusetts Amherst
Engineering Laboratory Building
Amherst, MA 01003
Abstract ..................................................................................................................................... 1 Introduction............................................................................................................................... 1 Research Objectives.................................................................................................................. 2 Part Cost Estimation ................................................................................................................. 3
Mold Cost Estimation............................................................................................................ 4 Related Research ................................................................................................................ 4 Proposed Approach ............................................................................................................ 7 Collection of Empirical Data.............................................................................................. 9 Mold Cost Drivers............................................................................................................ 10 Regression Results ........................................................................................................... 13 Model Comparison........................................................................................................... 15
Material Cost Estimation ..................................................................................................... 16 Processing Cost Estimation ................................................................................................. 17
Processing Yield Estimation ............................................................................................ 18 Implementation of Models in CAD and Internet .................................................................... 20 Conclusion .............................................................................................................................. 21 References............................................................................................................................... 22
5800 words
Abstract A product’s complexity significantly impacts its manufacturing cost. Complexity is
often factored into a product cost estimate by some rules of thumb or comparison to a
reference parts whose manufacturing cost is assumed known. In spite of the wide usage of
design for manufacture (DFM) and design for assembly (DFA) guidelines in part
consolidation, the effects of a part’s complexity on its tooling and manufacturing costs as
well as its time-to-market are still largely undetermined. This paper investigates the number
of dimensions that uniquely define the part geometry as a measure of its complexity. The
metric was tested with empirical data for thirty injection molded parts from different
suppliers and was found to have a highly significant correlation with mold costs and tooling
lead-times. Models for estimating material and processing costs and yield at the early stages
of design are also developed. In the integration of the developed models with CAD, the
number of dimensions, part’s envelope size and other models’parameters are enumerated
directly from the CAD design. The developed methods enable real time evaluation of the
effects of a product design on its tooling cost, tooling lead time, processing costs, and yield at
the early stages of design.
Keywords: Mold Cost Estimating, Complexity, Plastic Injection Molding.
Introduction The injection molding process is increasingly being used in the manufacture of
complex net shaped parts of industrial and domestic electronic and electrical appliances.
Designers are taking advantage of improvements in the process capability and engineering
materials by consolidating multiple parts and functions into complex parts. One of the most
frequently used set of guidelines for parts consolidation is the Design for Manufacture and
Assembly (DFMA) guidelines developed by Boothroyd and Dewhurst [1]. One significant
Early Cost Estimation for Injection Molded Parts IIE Transactions 1
benefit of DFMA is the considerable savings in assembly cost from fewer parts that need to
be assembled. Other inherent benefits of DFMA are the encouragement of teamwork
between design and manufacturing, and the improved product reliability from the reduced
probability of system failure because of component failure.
In spite of expected savings in assembly costs, the complex parts have longer tooling
lead-times and higher tooling costs. Hence, the net benefits of parts consolidation may be
uncertain. However, the effects of parts consolidation on mold tooling cost and lead-time
have not previously been quantified. The amortized tooling costs of injection molded parts
constitute a very significant portion of their manufacturing costs, especially for technical
applications. Tooling lead-times are also very important factors in today's very competitive
market environments.
The early stages of product design provide a good opportunity for the optimization of
these factors. However, in industry cost estimations are usually done when the design is well
detailed, and by departments that are external to design. At this late stage of design, there is
considerable inertia against any drastic changes. Tools for evaluating alternative design
configurations for costs and tooling lead-times, from the computer-aided product data, will
greatly facilitate optimization of component consolidation.
Research Objectives The research vision is to develop real time design evaluation techniques that are
available at very early stages of design. Advanced analysis techniques have been developed
to provide many estimates of design performance. Typical types of analyses used in molded
part design include structural (stiffness, impact, creep, fatigue), manufacturability (pressure
distribution, cooling, shrinkage, fiber orientation), and economic (amortized tooling cost,
material costs, machine costs). However, these numerical simulations may require complex
Early Cost Estimation for Injection Molded Parts IIE Transactions 2
meshes and boundary conditions to be built on top of detailed geometry. As such, advanced
analyses tend to be performed at the end of the design cycle, after the majority of critical
design decisions have been completed.
Similarly, manufacturing cost estimates are made after design detailing. The detailed
cost estimate is normally evaluated by an experienced cost estimator and results in a binding
quote. The early cost estimate, however, is essential for the economic evaluations of design
alternatives. If the early cost estimate includes cost factors that can be controlled by the
designer in the early development phases, then the designer would receive valuable early
feedback towards an optimum design. Thus, the cost models developed in this research are to
be used for real time cost analysis at the early stages of design. Another objective of this
research is the development of guidelines for optimum consolidation of multiple components
of a product into fewer but more complex components. The component consolidation can be
subject to different desired objective functions such as minimization of tooling costs or time-
to-market, or maximization of profit. The injection molding of plastics has been chosen as
the domain for this research because of the its usage in the manufacture of complex net
shaped parts. The procedure developed here are however applicable to other net-shaped and
near net-shaped parts producing processes such as metal die casting, forging, and stamping.
Part Cost Estimation The cost drivers of manufacturing an injection molded plastic part are expressed in
Equation 1. The material cost contribution, Cmat, is very significant, typically 50 to 80% of
the total part cost. Tooling and processing costs are also significant cost drivers. The
processing cost, Cproc, is dependent on the hourly rate charged for the usage of the injection
molding machine as well as the processing yield, yproc, which is the ratio of good parts to the
Early Cost Estimation for Injection Molded Parts IIE Transactions 3
total number of parts produced. The tooling cost, Ctool, is amortized over the estimated
production quantity N for the life of the tool.
NC
yC
CC tool
proc
procmatpart ++=
(1)
Equation (2) is an expression for the assembled product cost. The m parts that
constitute the product include both injection molded and standard purchased parts. The cost
of assembly is the product of the assembly shop hourly rate, Rassy, and the total time required
to assemble the m parts constituting the product. Thus the assembly cost decreases as part-
count m decreases. The overhead cost per product COH includes both the shop and the
administrative overheads.
(2) OH
m
i
ipartassy
m
i
ipartproduct CtRCC ++= ∑∑
−
==
1
11
Mold Cost Estimation Related Research
Two methods published in injection molding plastic design literature that address the
problem of estimating mold tooling cost at the design stage are the Dixon and Poli [2] and
the Boothroyd and Dewhurst [1] methods. The two methods agree that a part's geometric
complexity is a significant contributor to its tooling cost. However, they evaluate part
complexity differently.
The Dixon and Poli method estimates the relative tooling, material, and processing
costs of an injection molded part from look-up tables. These costs are estimated relative to
the cost of tooling for a simple reference part. The reference part used is a flat disc with
outside diameter of 72 mm and inside diameter of 60 mm. The approximate tooling cost for
this reference part, based on 1991-92 costs, is $7000 and includes about $1,000 in die
material costs. Seven attributes that can be determined from the part at the design
Early Cost Estimation for Injection Molded Parts IIE Transactions 4
configuration stage are used in evaluating a part's basic complexity, Cb, from a look up table.
These attributes classify the part by its size, shape, number of walls with undercuts etc. Two
multipliers of Cb, are also evaluated from look-up tables. They are the subsidiary complexity
factor Cs and the tooling and tolerance factor Ct. Cs is a function of the number of form
features in the part's cavity and number of undercuts. Once the design has been assessed, the
relative mold construction cost, Cdc, and the total mold cost, Cmold, is evaluated as:
MBdcmold
tsbdc
CCCCCCC
2.08.0 +==
, (3)
where CMB is the mold base cost. These estimates are relative to the earlier mentioned
reference part. It should be noted that the relative weighting between construction and
material costs may not be universally correct. Moreover, the determination of subsidiary
complexity, Cs, requires the judgement of the estimator in the classification of some cavity
detail features as regular or irregular, and evaluation of undercut complexity as extensive or
not extensive.
The Boothroyd and Dewhurst (B-D) method uses empirically derived formulas and
estimated manufacturing parameters to estimate the times, ti, for the different tasks that are
carried out in transforming a purchased mold base to a finished mold. The sum of these
times are then multiplied by an average shop rate, Rtool, to estimate the tool construction cost.
The mold base cost, CMB, is a function of the area of mold base cavity plate and the combined
thickness of the cavity and core plates. Mold tooling cost is then the sum of mold-base cost
and mold construction cost:
, (4) MB
n
i
iassymold CtRC += ∑
=1
The B-D method calculates part complexity as a sum of inner and outer surfaces
complexities. The surface complexities are estimated with an empirically derived formula
Early Cost Estimation for Injection Molded Parts IIE Transactions 5
that sums the number of holes, depressions and surface patches. The generalization of all
possible design features into the three categories limits the sensitivity of the B-D complexity
index. In addition, the enumeration of surface patches is difficult and uncertain for
moderately complex designs that may have blending surfaces and many protruding rib
features.
Complex systems are known to consist of finite variety of interacting elements.
According to Scurcini [3] the number, variety, types, and the organization of elementary
components drive the complexity of a technological system. Since form and shape features
constitute the basic components of a plastic part, an enumeration of the features in a designed
part could be functionally related to its complexity.
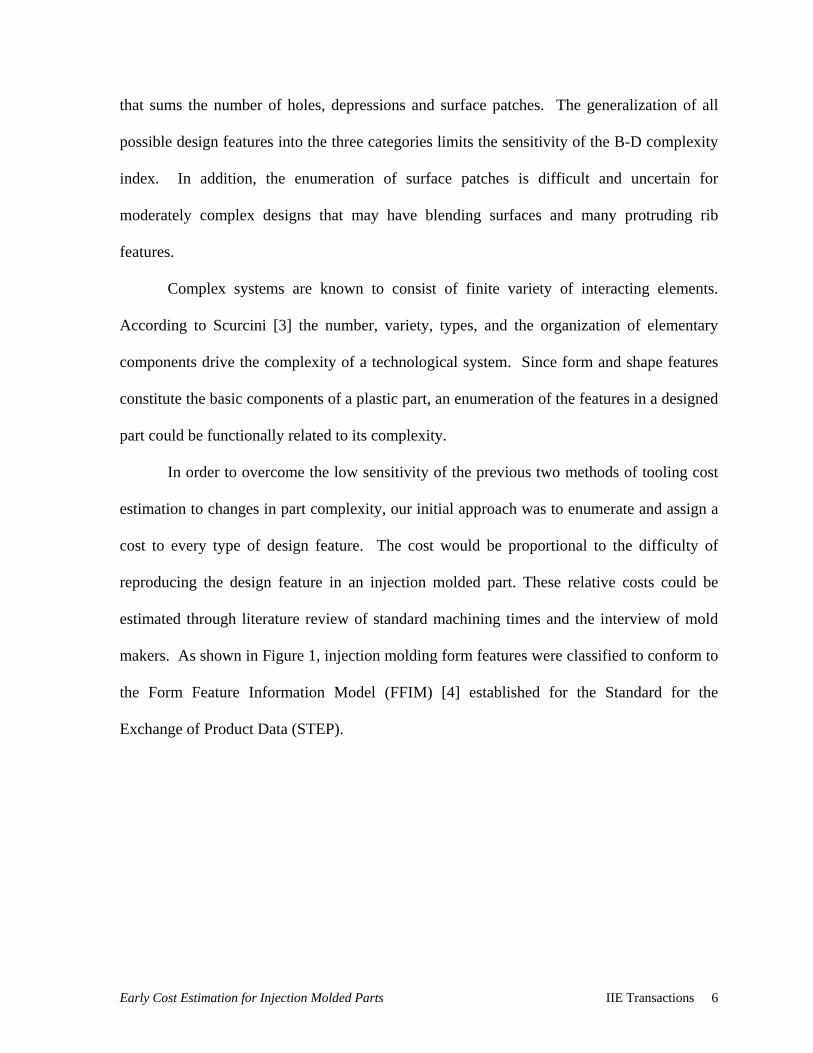
In order to overcome the low sensitivity of the previous two methods of tooling cost
estimation to changes in part complexity, our initial approach was to enumerate and assign a
cost to every type of design feature. The cost would be proportional to the difficulty of
reproducing the design feature in an injection molded part. These relative costs could be
estimated through literature review of standard machining times and the interview of mold
makers. As shown in Figure 1, injection molding form features were classified to conform to
the Form Feature Information Model (FFIM) [4] established for the Standard for the
Exchange of Product Data (STEP).
Early Cost Estimation for Injection Molded Parts IIE Transactions 6
P R O T R U S I O ND E P R E S S I O N A R E AF E A T U R E
D E F O R M A T I O N T R A N S I T I O N F E A T U R E
EXPLICIT FEATURESIMPLICIT FEATURES
P A S S A G E
FORM FEATURES
List of two-dimensional shape elements
TYPE:* Not Applicable
TYPE:* Boss* Disk* Flange* Gusset* Projection* Riba* Snapfit* Tab* others
TYPE:* Hole* Slot* Window* others
TYPE:* Groove* Hinge* Pocket* Step* others
TYPE:* Thread* Marking* Gear teeth* Surface Finish* Texturing* others
TYPE:* Edge blend* Corner blend
Figure 1: A Classification of Injection Molding Features
However, since the designer has the freedom to define application type features, as
long as they fall within the FFIM classification, cost estimation models built on a fixed
number of features are soon rendered obsolete. The impraticable alternative would be to
constantly update the cost data for custom design features. Problems of feature recognition
or extraction from either blueprints or CAD data also arise. Identifying and classifying all
the geometrical features of a part correctly from its blueprints or even from a physical sample
is not a trivial task. Problems such as whether to classify a set of parallel protruding features
as ribs or grooves existed. Automatic feature recognition have only been reliably
implemented for a restricting set of feature profiles. Thus an alternative approach to costing
was sought.
Proposed Approach For the purpose of cost estimating, we surmised that the number of dimensions that
are used to define a feature is a measure of its complexity. Difficulty in manufacturing the
Early Cost Estimation for Injection Molded Parts IIE Transactions 7
product will tend to increase as more dimensions that are required to define uniquely define
its features. Every dimension represents an additional point to check or a setup to make in
the manufacturing of the mold or the electrode that that will be used to electric discharge
machine the mold. This reasoning is then logically extended to the total number of
dimensions required to completely define the parts' model. This information is readily
available within constrained-based type modelers, which include most 3-D modelers.
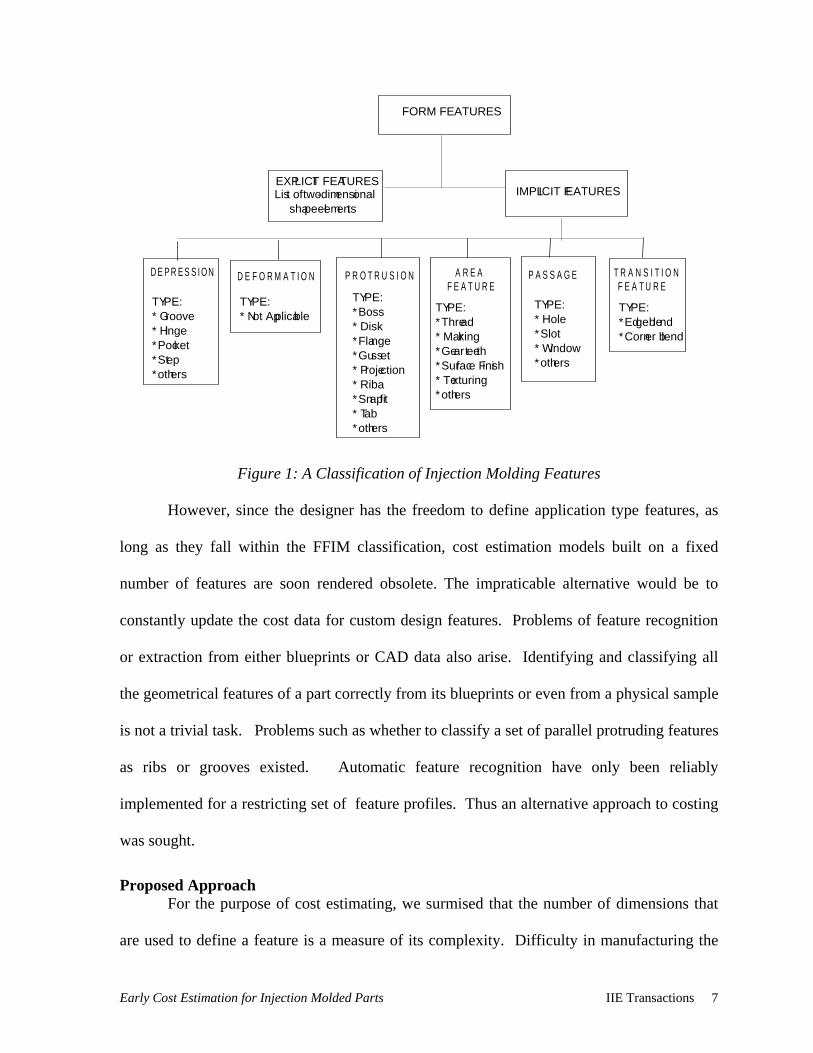
The total number of dimensions, D, is the number of parameters required to
unambiguously define the part. In the current work, these were enumerated by counting all
the dimensions on all blueprints that accompanied the request for quotes (RFQ). All
dimensions in all views; elevations, sectional, and detail, were counted. When a view
represents a repeated feature the number of dimensions is multiplied by the number of times
the feature is repeated. Usually, such views if labelled in accordance with ANSI Y14.5M
dimensioning and tolerancing standard [5], show how many times the feature is repeated by
a number and an X as in Figure 2. Table 1 shows the procedure used in enumerating the
dimensions of the part shown in Figure 2.
Figure 2: Sketch of a low complexity part
Early Cost Estimation for Injection Molded Parts IIE Transactions 8
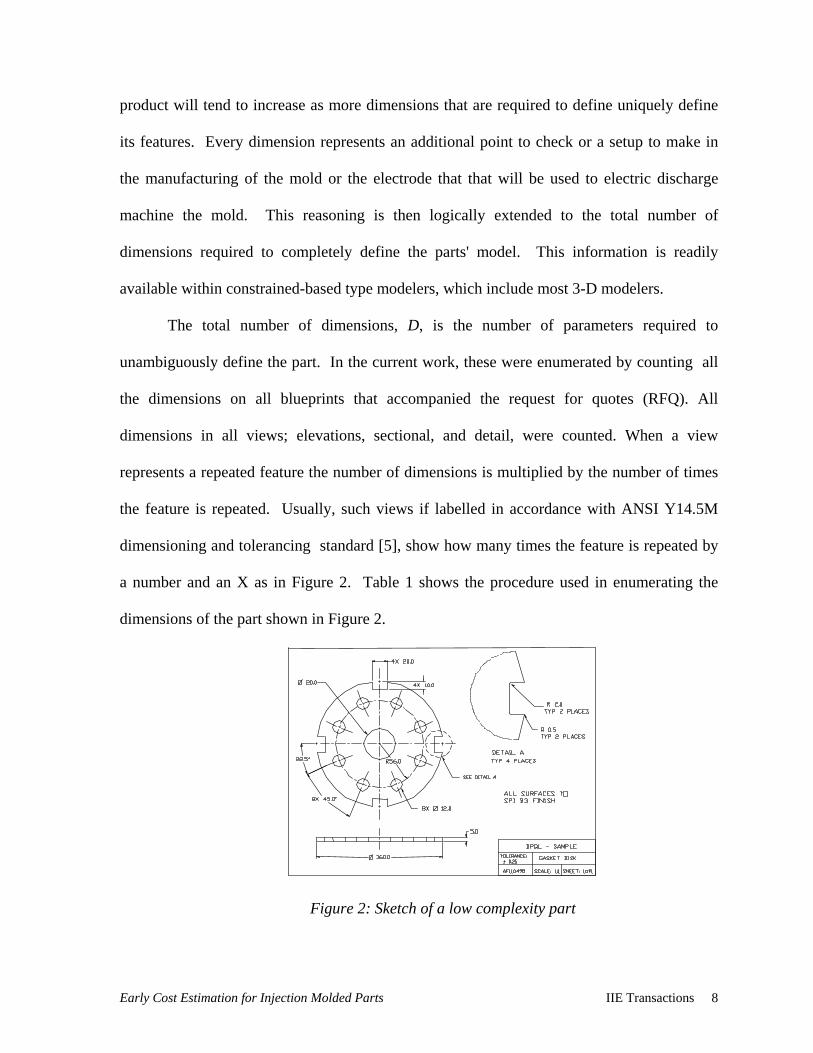
Table 1: Counting Dimensions of Gasket Disk
Envelope Size: 160x160x5 mm3 = 128 cc
Type and number of dimensions Circular hole features = 8 (1 x 8) Angular spacing of holes = 8 Dimensions of slots = 8 (2 x 4) Diameter of center hole = 1 Radial distance of holes = 1 Ref. angle from center line = 1 Envelope dimensions = 2 Chamfer radii = 16 (4 x 4) Total number of dimensions = 45
Collection of Empirical Data A custom injection molder in Western Massachusetts assisted in this research.
Original equipment manufacturers (OEM) submit requests for quotes (RFQ) to this company.
The company in turn sends out requests for tooling quotes to moldmakers locally and
overseas. Seventy-five mold tooling quotes of single cavity molds for thirty of the parts that
the company has quoted for in the past three years were selected for analysis from its records.
The thirty parts vary in size from a small reset-button with basic envelope size of 22 cc and
17 basic dimensions to a large sewage pump enclosure with size 136,282 cc and 153
dimensions.
The origin of the seventy-five tooling quotes for the thirty parts were also
geographically diverse. Mold makers in various parts of the US, Canada, Spain, and Taiwan
supplied the mold quotes. It was the normal practice of the custom injection molder to obtain
quotes from three or more different mold makers in its cost estimation process. The job was
awarded to the mold maker based on cost, lead-time, and past performance. The size of the
part, qualitative complexity, number of slides, gate type, surface finish, and ejection system
are some of the factors that are considered in the estimation of a part's tooling cost.
Early Cost Estimation for Injection Molded Parts IIE Transactions 9
When the quote from a toolmaker falls outside a reasonable range estimated by the
tooling engineer, it could be due to one of three reasons. If the mold quote is too low, the
toolmaker may have failed to consider the need for slides or other factors not apparent from
the blueprint or CAD model. In this case, the molder's tool engineer tries to confirm that the
toolmaker considered all design specifications. If the quote is too high, the moldmaker may
be at capacity and would only accept the job at a premium. Finally, the tooling engineer at
the molder could have misunderstood some design specifications.
There is often the post-design stage cross communication among the three parties: the
design engineers of the product developer, the tooling engineer of the molder, and the
toolmakers. Engineering changes, usually minor, that may reduce tooling cost and/or
facilitate molding, are suggested to the product designers and are either accepted or rejected.
However, the recent trend is towards simultaneous engineering among these three parties.
This trend is facilitated by improved communications and CAD data protocols. Prototypes or
preliminary designs are being sent via the internet to injection molders and moldmakers for
their immediate feedback. This practice significantly reduces product development time and
product cost.
Mold Cost Drivers The thirty parts, their mean mold quotes (MMQ), mean estimated tooling lead times
(MLT), and their geometrical attributes are as shown in Table 2. Only RFQs accompanied
by blueprints that have adequate detailing for tooling were selected. Only three quotes that
were much higher or much lower than the average quotes for the same part were discarded
due to the probability of over or under estimation, as mentioned previously.
Early Cost Estimation for Injection Molded Parts IIE Transactions 10
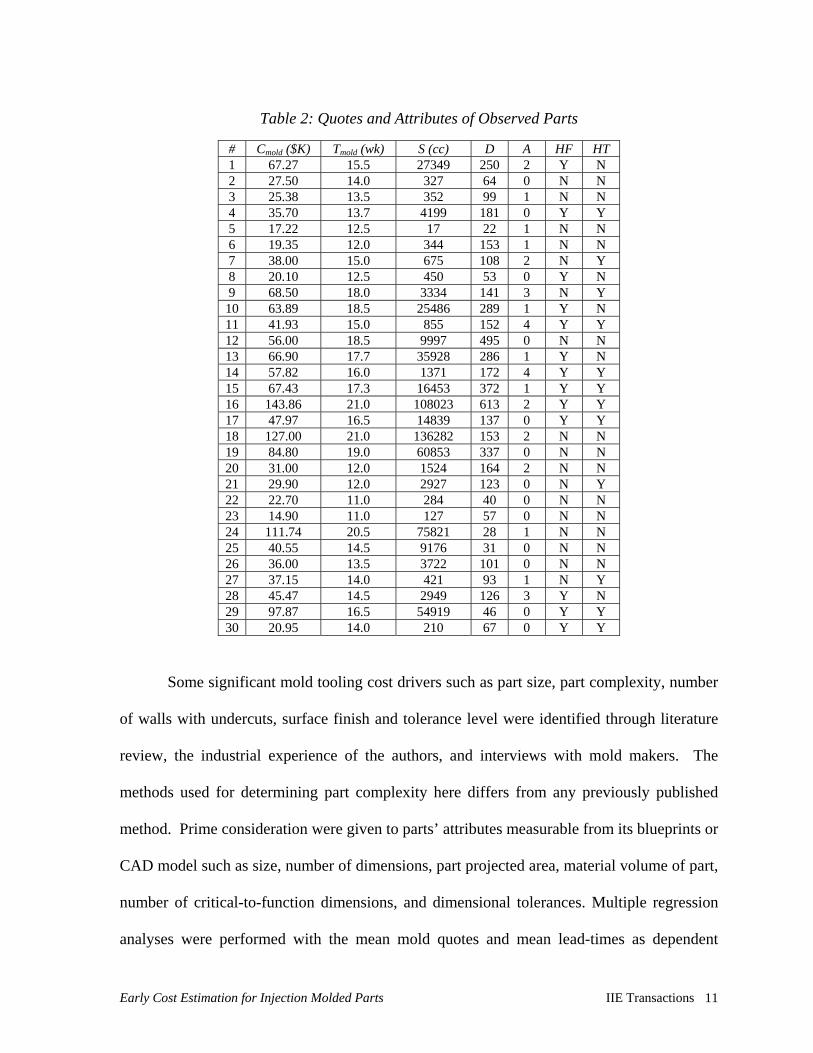
Table 2: Quotes and Attributes of Observed Parts
# Cmold ($K) Tmold (wk) S (cc) D A HF HT 1 67.27 15.5 27349 250 2 Y N 2 27.50 14.0 327 64 0 N N 3 25.38 13.5 352 99 1 N N 4 35.70 13.7 4199 181 0 Y Y 5 17.22 12.5 17 22 1 N N 6 19.35 12.0 344 153 1 N N 7 38.00 15.0 675 108 2 N Y 8 20.10 12.5 450 53 0 Y N 9 68.50 18.0 3334 141 3 N Y 10 63.89 18.5 25486 289 1 Y N 11 41.93 15.0 855 152 4 Y Y 12 56.00 18.5 9997 495 0 N N 13 66.90 17.7 35928 286 1 Y N 14 57.82 16.0 1371 172 4 Y Y 15 67.43 17.3 16453 372 1 Y Y 16 143.86 21.0 108023 613 2 Y Y 17 47.97 16.5 14839 137 0 Y Y 18 127.00 21.0 136282 153 2 N N 19 84.80 19.0 60853 337 0 N N 20 31.00 12.0 1524 164 2 N N 21 29.90 12.0 2927 123 0 N Y 22 22.70 11.0 284 40 0 N N 23 14.90 11.0 127 57 0 N N 24 111.74 20.5 75821 28 1 N N 25 40.55 14.5 9176 31 0 N N 26 36.00 13.5 3722 101 0 N N 27 37.15 14.0 421 93 1 N Y 28 45.47 14.5 2949 126 3 Y N 29 97.87 16.5 54919 46 0 Y Y 30 20.95 14.0 210 67 0 Y Y
Some significant mold tooling cost drivers such as part size, part complexity, number
of walls with undercuts, surface finish and tolerance level were identified through literature
review, the industrial experience of the authors, and interviews with mold makers. The
methods used for determining part complexity here differs from any previously published
method. Prime consideration were given to parts’ attributes measurable from its blueprints or
CAD model such as size, number of dimensions, part projected area, material volume of part,
number of critical-to-function dimensions, and dimensional tolerances. Multiple regression
analyses were performed with the mean mold quotes and mean lead-times as dependent
Early Cost Estimation for Injection Molded Parts IIE Transactions 11
variables and a systematic combination of the other attributes as independent variables. Low
correlations were found between the dependent variables and some independent variables
such as part material volume and part projected area which were thus omitted from Table 2.
In Table 2, the envelope volume, S, measures the size of the part in cubic centimeters.
This is the volume of a rectangular box that completely encloses the part Figure 2. Even
where a long projection is isolated, the envelope volume still determines the size of the mold
base and to some extent the manufacturing work required to make the mold. The number of
actuators, A, is the total number of separate mechanisms that have to be constructed into the
mold to permit molding of internal and external undercuts, and screw features on the part.
Undercut features that lie on the same wall of the part and that are within 75mm distance of
each other are are assumed to require one slide mechanism. Every screw feature is assumed
to each require a separate unscrewing mechanism. The parts with Y (Yes) under the columns
labelled HF and HT require high polish finishes and tight plastic tolerances, respectively.
Parts with surface finish specifications of SPI A1, A2, and A3 or that are textured on more
than 25% of their entire surface areas are classified as having high polish finishes. Parts with
surface finish of SPI B1 or less on more than 75% of their surface areas, are classified as
having normal finishes. Plastic tolerances are specified as percentages of overall lengths.
Due to shrinkage characteristics of polymers, longer parts are normally specified with larger
tolerances. A cut-off value of 0.07% of absolute percentage tolerance per unit length was
used to classify the observed parts as having tight or normal plastic tolerances. Parts with
absolute percentage tolerance per unit length less or equal to 0.07% were classified as having
tight tolerances, while those with greater values have normal tolerances. The decision was
guided by a table of dimensional tolerances allowed to mold makers [6].
Early Cost Estimation for Injection Molded Parts IIE Transactions 12
Regression Results In the summary outputs of the regressions, the sample coefficient of multiple
determination, R2, is the proportion of the total variation in the dependent variable that is
explained by or accounted for by the regression model that is formed by the independent
variables. R2 can take on values between 0 and 1, where a better fit is obtained as R2
approaches 1. The regressions were done at the 95% confidence level. The R2 values
obtained with the mean mold quotes as the dependent variable was greater than the value
obtained with the individual seventy-five mold quotes. This is because the mean mold
quotes provided a degree of central tendency towards the “actual” mold costs. The resulting
cost model derived using just size, S, and number of dimensions, D, as the independent
variables is:
869.0
6.4581.0283002 =
++=
R
DSCmold . (5)
Equation (5) shows that size and number of dimensions explain 87% of the variation in mold
cost of the sampled parts. The intercept, 28,300, represents on the average the lower bound
on the mold costs. Three other part attributes (number of actuators, A, high surface finish,
HF, and high tolerance, HT) can be included in the regression analysis, with the latter two
having only 0, 1 states. The model now explains 91.1% of the variation in the mold costs:
911.0
5470763029403082.0225002 =
+++++=
R
HTHFADSCmold . (6)
The mean tooling lead-time has a lower but still very significant R2 value when
regressed against size and total number of dimensions (complexity), as shown in Equation 7.
The imperfect correlation may be due to other molder specific factors, such as maching
availablity or willingness to expedite a job to gain a customer. The minimum of 13 weeks
can be considered the minimum lead time that molders would normally take to tool a simple
Early Cost Estimation for Injection Molded Parts IIE Transactions 13
part. Historical data of these internal production parameters were not (and are not typically)
available to molders, and thus could not be used in developing the following predictive
model:
( )
7.0
007.0000055.0132 =
++=
R
DSweeksTmold . (7)
These results are surprising and useful. Increases in complexity, as measured by the
number of dimensions, have a greater impact on tooling cost and tooling lead-time than
similar size increases. Equation (7), shows that every 100-count increase in number of
dimensions, which is a normal phenomenon when parts are consolidated into complex parts,
increases tooling cost by $4560, and tooling lead-time by 5 days. A comparable increase in
mold cost due to size increase is only possible if the size of the part is increased by 5,600 cc,
a six-fold increase if starting with a 1000 cc part.
The results show that consolidation of parts is preferable when the parts to be
combined have low complexity. Consolidating two already complex components into a more
complex piece may increase tooling cost and tooling lead-time drastically. The cost incurred
in higher tooling cost and lost sales due to late market introduction may surpass the benefits
expected from the parts consolidation. When timely market introduction of a product is
critical to its life cycle profit, it is preferable to develop and parallel-tool simple components
for automatic or manual assembly than to combine components into a complex piece. The
single complex tool may take longer to tool and may cost more than the individual tools put
together. Consolidation may later be done when demand is stable and new sets of tools are
being ordered for large production runs.
The models described can be easily developed by any organization that has historical
data on mold costs. The regression coefficients will differ with different data set but their
Early Cost Estimation for Injection Molded Parts IIE Transactions 14
proportion will be approximately the same. The accuracies of the models are higher than the
accuracies of estimates from human cost estimators, that may vary within 50% of actual
costs based on Malstrom [7] as well as the empirical data from this study.
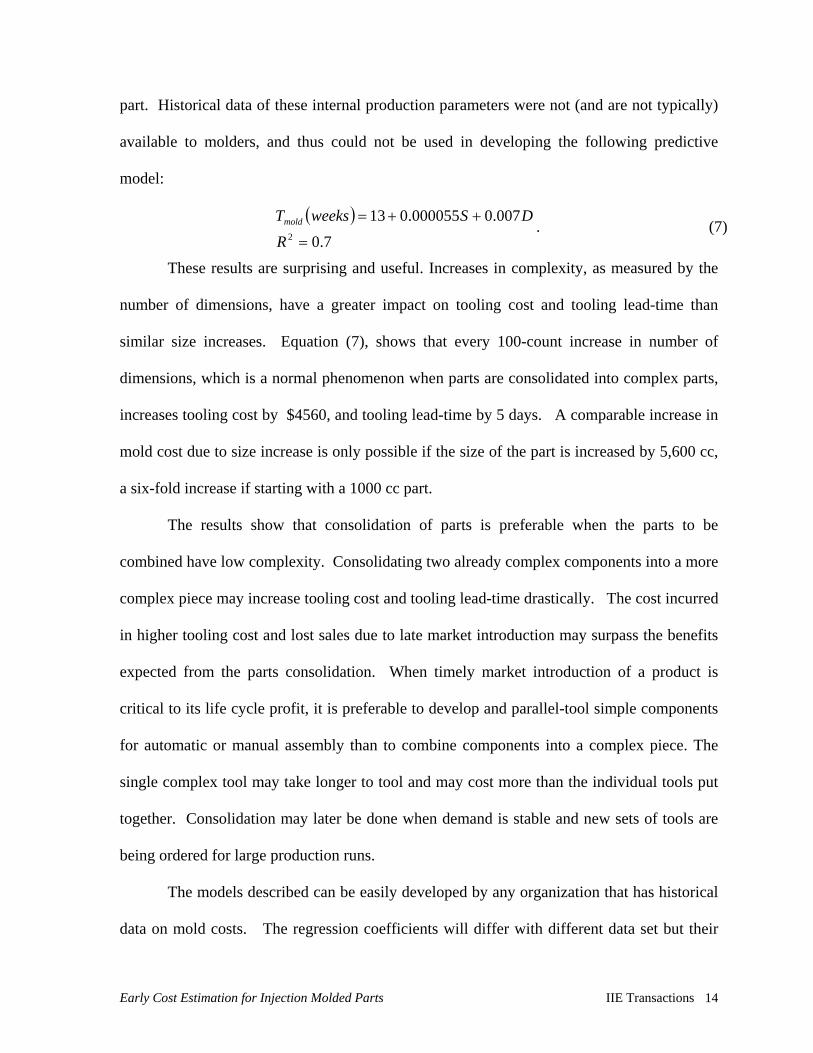
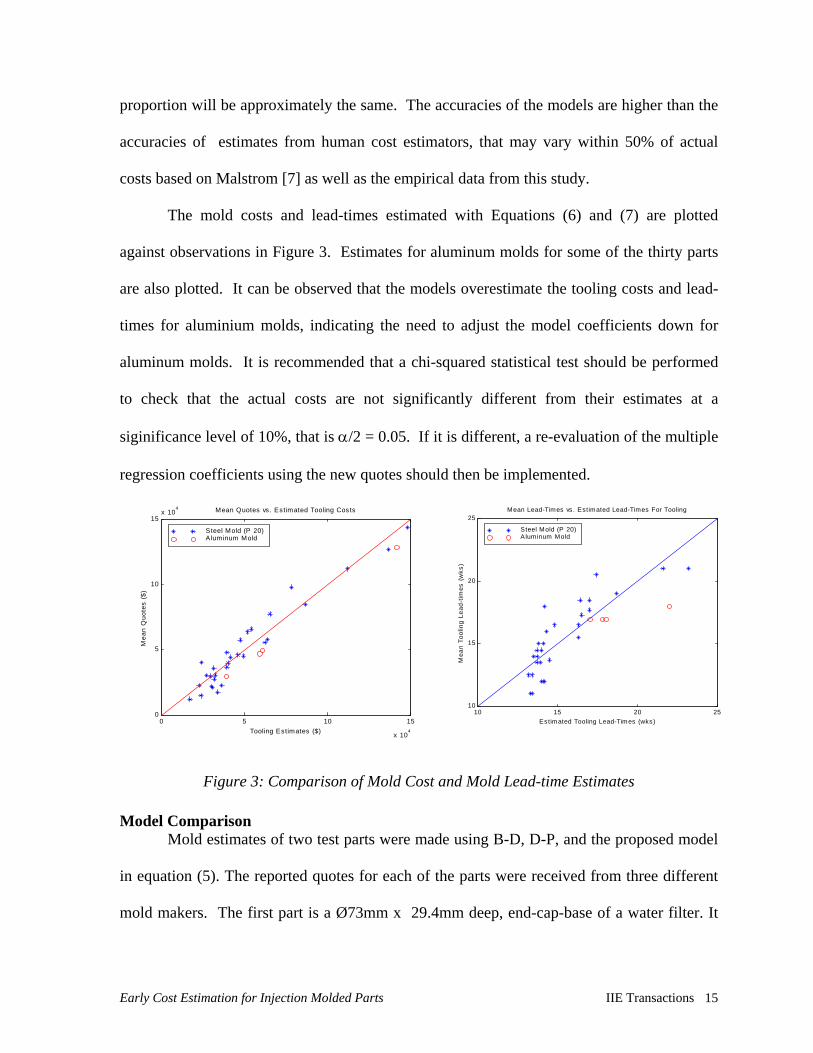
The mold costs and lead-times estimated with Equations (6) and (7) are plotted
against observations in Figure 3. Estimates for aluminum molds for some of the thirty parts
are also plotted. It can be observed that the models overestimate the tooling costs and lead-
times for aluminium molds, indicating the need to adjust the model coefficients down for
aluminum molds. It is recommended that a chi-squared statistical test should be performed
to check that the actual costs are not significantly different from their estimates at a
siginificance level of 10%, that is α/2 = 0.05. If it is different, a re-evaluation of the multiple
regression coefficients using the new quotes should then be implemented.
0 5 10 15
x 104
0
5
10
15x 10
4
Tooling Estimates ($)
Mea
n Q
uote
s ($
)
Mean Quotes vs. Estimated Tooling Costs
Steel Mold (P 20)Aluminum Mold
10 15 20 2510
15
20
25
Mea
n To
olin
g Le
ad-t
imes
(w
ks)
Es timated Tooling Lead-Times (wks)
Mean Lead-Times vs. Estimated Lead-Times For Tooling
Steel Mold (P 20)Aluminum Mold
Figure 3: Comparison of Mold Cost and Mold Lead-time Estimates
Model Comparison Mold estimates of two test parts were made using B-D, D-P, and the proposed model
in equation (5). The reported quotes for each of the parts were received from three different
mold makers. The first part is a Ø73mm x 29.4mm deep, end-cap-base of a water filter. It
Early Cost Estimation for Injection Molded Parts IIE Transactions 15
has an outside circumferential thread split diametrically in two halves. The mold dividing
surface is aligned with the thread for easy ejection. The required surface finish is SPI A3.
This part has an envelope size of 154 cc and is defined with a total of 73 blueprint
dimensions. The second part is the top housing of a medical laboratory analyzer. The
envelope dimensions are 375mm x 200mm x 56mm. The part is defined by 181 dimensions.
The features include three big and two small square windows for assembly and accessing
internal components, as well as structural ribbing. The exterior surface is textured while the
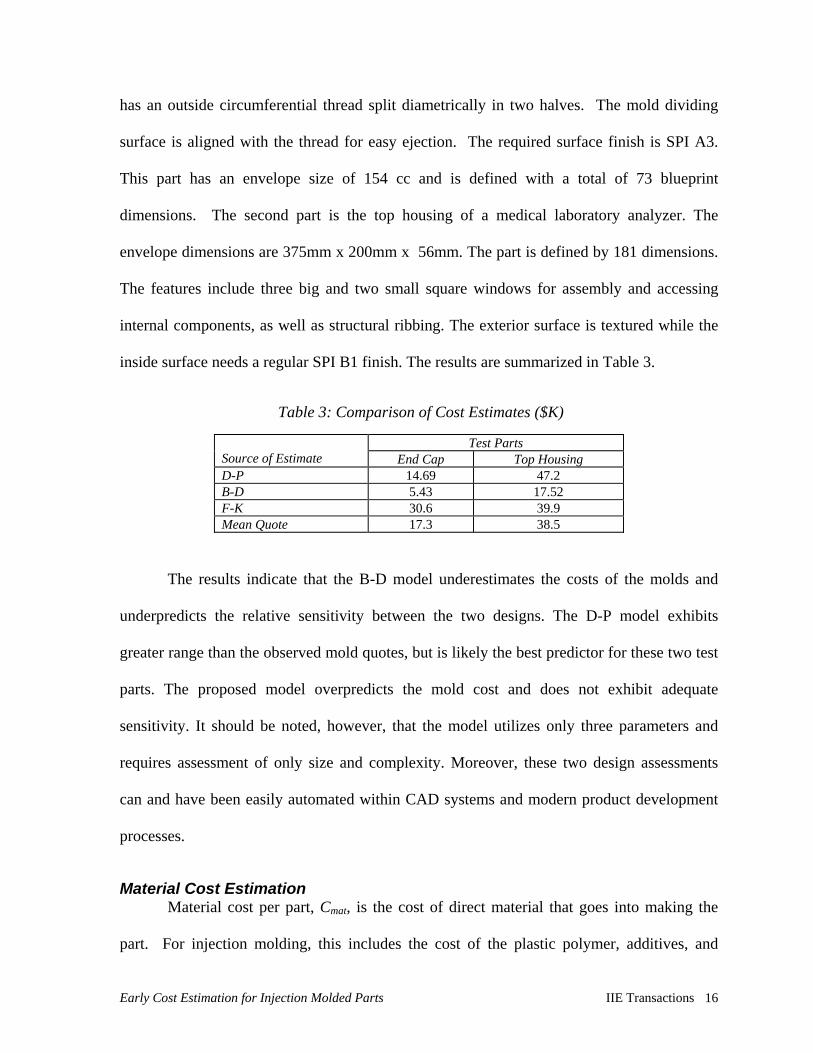
inside surface needs a regular SPI B1 finish. The results are summarized in Table 3.
Table 3: Comparison of Cost Estimates ($K)
Test Parts Source of Estimate End Cap Top Housing D-P 14.69 47.2 B-D 5.43 17.52 F-K 30.6 39.9 Mean Quote 17.3 38.5
The results indicate that the B-D model underestimates the costs of the molds and
underpredicts the relative sensitivity between the two designs. The D-P model exhibits
greater range than the observed mold quotes, but is likely the best predictor for these two test
parts. The proposed model overpredicts the mold cost and does not exhibit adequate
sensitivity. It should be noted, however, that the model utilizes only three parameters and
requires assessment of only size and complexity. Moreover, these two design assessments
can and have been easily automated within CAD systems and modern product development
processes.
Material Cost Estimation Material cost per part, Cmat, is the cost of direct material that goes into making the
part. For injection molding, this includes the cost of the plastic polymer, additives, and
Early Cost Estimation for Injection Molded Parts IIE Transactions 16
fillers consumed per part. The following equation expresses Cmat as a function of material
volume, V, density, ρ, and polymer price per unit mass, P:
f
PVCmat −=
1ρ . (8)
The part volume, V, is easily computed from a 3D model of the part at the design
stage. Polymer density, ρ, is obtainable from polymer handbooks such as the Modern Plastic
Encyclopedia [8] or from resin vendors. The runner and sprue weight contribution to total
material consumption is significant for small parts but negligible for large parts. For most
thermoplastic materials, moreover, runners and sprues can often be recycled without
significant loss in final part quality. In practice, after four cycles of repeated recycling the
thermoplastic is significantly degraded that it is completely different from the virgin material.
Hence, in practice up to 15% recycled material from reground runners, sprues, and second
class quality parts are blended with virgin material. (One notable exception is the prohibition
of recycled resin in medical, and food related applications by the Food and Drug
Administration). Since at the early stage of design, the optimum number of cavities in the
mold and hence the runner volume are unknown a conservative estimate for f is 10%. This
agrees with a promotional literature from Du Pont [9].
Processing Cost Estimation The processing cost per part, Cpart, constitutes 40 to 80% of the part cost for both
commodity and engineering plastic parts. Efforts to reduce the processing cost at the design
stage easily translate to significant savings per part and to very large. Cproc is a function of
the machine hourly rate, Rma, production yield, P, and the cycle time, tc, required to mold the
part:
Early Cost Estimation for Injection Molded Parts IIE Transactions 17
P
tRC cma
proc 3600= . (9)
The cycle time has been estimated by performing a transient thermal analysis to model the
structural rigidity of the part required for ejection [10]. The machine rate, Rma, is the amount
charged per hour for the usage of the injection molding press. It is a convenient way of
summarizing the direct processing cost that is traceable to the part as well as the indirect
processing costs that is allocated to it. The direct labor content of Rma is the operator
wage(s), while the indirect costs include the costs for the consumption of utilities and
consumables by the press as well as a depreciation charge. The machine rate ($/h) charged in
the custom injection molding shop in Western Massachusetts, has a linear correlation with
the machine clamp force, Fcl, measure in tons. Equation 10 show the linear function that
closely fits this data with a regression squared value of 0.986. This function is comparable to
a similar relationship used by Boothroyd and Dewhurst when adjusted using 4% inflation as
shown in Equation 11.
150020725.033.31 ≤≤+= clclma FFR (10)
100020631.000.32 ≤≤+= clclma FFR (11)
Processing Yield Estimation Part quality attributes may exhibit some inconsistency due to manufacturing process,
material, and operator variation. The probability of producing an acceptable product, P, is a
function of the probability density function, pdf, and the product specification limits, LSL and
USL, for each i-th quality attribute, yi:
( )dyypdfPi
i
USL
LSLi∫= (12)
It is infeasible to assess the multi-dimensional probability density function across the
process domain, even if the variance and relationships between processing variables and
Early Cost Estimation for Injection Molded Parts IIE Transactions 18
quality attributes are deterministic. As such, one approach is to assume Gaussian
distributions corresponding to measured process capabilities. Hunkar Laboratories Inc. in
Ohio [11] has developed a classification of injection molding machines from its survey of
hundreds of machines over many years. Deviations from the set of optimal process
parameters required to obtain the quality characteristics of a part are due to complex
interacting variations of noise variables, represented by a vector n = {nj }, where j = 1,2,
…,m. Frey and Otto [12] argued that though functional relationship between noise variables
and quality characteristics are in general non-linear, a linear relationship can be assumed in
the neighborhood of a target vector, t. Equation 13 shows that the normalized deviation of
quality characteristic, δyi, is directly proportional to the deviation of the noise variables from
their target value, given the assumption of linearity in the neighborhood of the target noise
variable. However, the values of constants kij are not known.
(∑=
−⋅−
=m
jjjij
iii tnk
LSLUSLy
1
1δ ) . (13)
The matrix of constants, kij, relating changes in each noise variable to changes in the quality
characteristics can be determined by experimentation, by analyzing historical data, by
complex deterministic computations, or by simulating the process. This last approach, using
random event simulation and relative machine capabilities was used to predict process yield
for each class of machine.
The results are shown in Figure 4. The results indicate the trade-off between machine
capability, number of critical to function specifications, the passband of the specifications,
and defect rates. Figure 4 clearly identifies that machines with low class factors (highly
capable) will produce consistent moldings independent of the number of critical dimensions
specified. However, average and poor machines may present significant quality problems,
Early Cost Estimation for Injection Molded Parts IIE Transactions 19
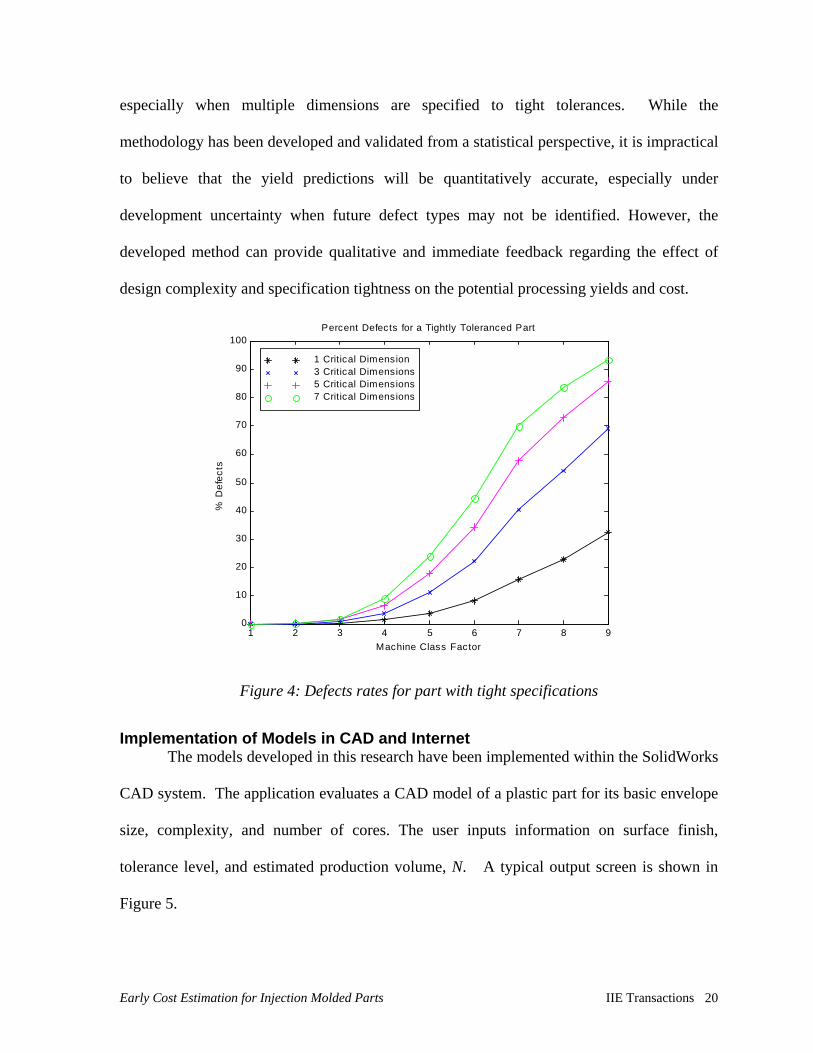
especially when multiple dimensions are specified to tight tolerances. While the
methodology has been developed and validated from a statistical perspective, it is impractical
to believe that the yield predictions will be quantitatively accurate, especially under
development uncertainty when future defect types may not be identified. However, the
developed method can provide qualitative and immediate feedback regarding the effect of
design complexity and specification tightness on the potential processing yields and cost.
1 2 3 4 5 6 7 8 90
10
20
30
40
50
60
70
80
90
100
Machine Class Factor
% D
efec
ts
Percent Defects for a Tightly Toleranced Part
1 Critical Dimension 3 Critical Dimensions5 Critical Dimensions7 Critical Dimensions
Figure 4: Defects rates for part with tight specifications
Implementation of Models in CAD and Internet The models developed in this research have been implemented within the SolidWorks
CAD system. The application evaluates a CAD model of a plastic part for its basic envelope
size, complexity, and number of cores. The user inputs information on surface finish,
tolerance level, and estimated production volume, N. A typical output screen is shown in
Figure 5.
Early Cost Estimation for Injection Molded Parts IIE Transactions 20
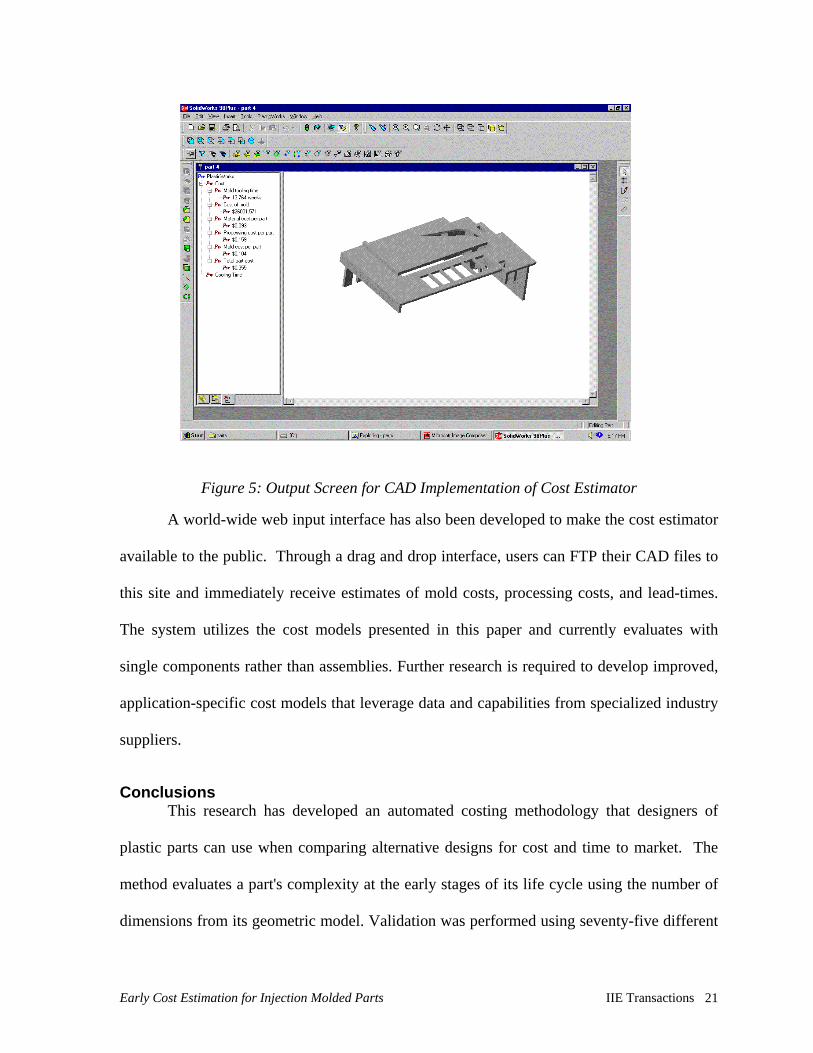
Figure 5: Output Screen for CAD Implementation of Cost Estimator
A world-wide web input interface has also been developed to make the cost estimator
available to the public. Through a drag and drop interface, users can FTP their CAD files to
this site and immediately receive estimates of mold costs, processing costs, and lead-times.
The system utilizes the cost models presented in this paper and currently evaluates with
single components rather than assemblies. Further research is required to develop improved,
application-specific cost models that leverage data and capabilities from specialized industry
suppliers.
Conclusions This research has developed an automated costing methodology that designers of
plastic parts can use when comparing alternative designs for cost and time to market. The
method evaluates a part's complexity at the early stages of its life cycle using the number of
dimensions from its geometric model. Validation was performed using seventy-five different
Early Cost Estimation for Injection Molded Parts IIE Transactions 21
mold quotes across thirty different molding applications, indicating a high correlation of part
complexity with the mold tooling cost and lead-time. All the independent variables in the
models developed can be easily evaluated from feature-based CAD data. This enumeration
of number of dimensions is a pratical alternative to the use of complex algorithms for
extraction and enumeration of constantly changing design form features. The results of the
research are unique in their simplicity when compared to related work.
References [1] G. Boothroyd, P. Dewhurst, and W. Knight, Product design for manufacture and
assembly. New York, NY: Marcel Dekker, Inc, 1994.
[2] J. R. Dixon and C. Poli, Engineering design and design for manufacturing, a structured approach. Conway, MA: Field Stone Publishers, 1995.
[3] G. B. Scurcini, “Complexity in Large Technological Systems,” presented at Measures of Complexity, Rome, 1987.
[4] J. J. Shah and M. Mantyla, Parametric and Feature-based CAD/CAM: Concepts, Techniques, and Applications: John Wiley & Sons, Inc., 1995.
[5] ASME, ANSI Y14.5M, American National Standard Engineering Drawings and Related Documentation Practices: Dimensioning and Tolerancing. New York: American Society of Mechanical Engineers, 1982.
[6] D. V. Rosato and D. V. Rosato, Injection molding handbook : the complete molding operation technology, performance, economics, 2nd ed. New York: Chapman & Hall, 1995.
[7] M. Malstrom, Manufacturing Cost Engineering Handbook. New York, NY: Marcel Dekker Inc., 1984.
[8] MPE, Modern Plastics Encyclopedia 96, vol. 72, 1996.
[9] DuPont, “Concepts in Engineering Plastics,” in Promotional Literature of E.I. DuPont de Nemours & Co. Wilmington, DE, 1978.
[10] H. Xu and D. O. Kazmer, “A Stiffness Criterion for Cooling Time Estimation,” International Polymer Processing, vol. 13, pp. 249-255, 1999.
[11] Hunkar, “The Injection Molding Machines Class Factor,” : Hunkar Laboratories Inc., 7007 Valley Avenue, Cincinnati Ohio 45244 USA, 1998.
[12] D. D. Frey, K. N. Otto, and J. A. Wysocki, “Evaluating Process Capability given multiple Acceptance Criteria,” MIT Design Research Report, 1997.
Early Cost Estimation for Injection Molded Parts IIE Transactions 22
Related Documents