Neurobiology of Disease Early Alterations in Functional Connectivity and White Matter Structure in a Transgenic Mouse Model of Cerebral Amyloidosis Joanes Grandjean, 1,2 Aileen Schroeter, 1 Pan He, 3 Matteo Tanadini, 4 Ruth Keist, 5 Dimitrije Krstic, 5 Uwe Konietzko, 2,6 Jan Klohs, 1,2 Roger M. Nitsch, 2,6 and Markus Rudin 1,2,5 1 Institute for Biomedical Engineering, and 2 Center for Neuroscience Research, University and ETH Zurich, 8093 Zurich, Switzerland, 3 Department of Information Technology and Electrical Engineering, and 4 Seminar for Statistics, ETH Zurich, 8092 Zurich, Switzerland, and 5 Institute of Pharmacology and Toxicology and 6 Division of Psychiatry Research, University of Zurich, 8008 Zurich, Switzerland Impairment of brain functional connectivity (FC) is thought to be an early event occurring in diseases with cerebral amyloidosis, such as Alzheimer’s disease. Regions sustaining altered functional networks have been shown to colocalize with regions marked with amyloid plaques burden suggesting a strong link between FC and amyloidosis. Whether the decline in FC precedes amyloid plaque deposition or is a consequence thereof is currently unknown. The sequence of events during early stages of the disease is difficult to capture in humans due to the difficulties in providing an early diagnosis and also in view of the heterogeneity among patients. Transgenic mouse lines overexpressing amyloid precursor proteins develop cerebral amyloidosis and constitute an attractive model system for studying the relationship between plaque and functional changes. In this study, ArcA transgenic and wild-type mice were imaged using resting-state fMRI methods across their life-span in a cross-sectional design to analyze changes in FC in relation to the pathology. Transgenic mice show compromised development of FC during the first months of postnatal life compared with wild-type animals, resulting in functional impairments that affect in particular the sensory-motor cortex already in preplaque stage. These functional alterations were accompa- nied by structural changes as reflected by reduced fractional anisotropy values, as derived from diffusion tensor imaging. Our results suggest cerebral amyloidosis in mice is preceded by impairment of neuronal networks and white matter structures. FC analysis in mice is an attractive tool for studying the implications of impaired neuronal networks in models of cerebral amyloid pathology. Key words: ArcA; diffusion tensor imaging; fMRI; functional connectivity; mouse; resting state Introduction The occurrence of amyloid plaques in brain parenchyma and around the cerebral vessels constitutes a hallmark of Alzheimer’s disease (AD; Iwatsubo et al., 1994). Cerebral amyloidosis involves the aggregation of A peptides, a cleavage product of the amyloid precursor protein (APP). In AD, plaque deposits, fibrils, and oli- gomers of A are considered essential mediators in the patho- physiological cascade leading to cognitive decline (Mucke and Selkoe, 2012). A peptides in various forms have been linked to alterations in cerebral calcium homeostasis (Kuchibhotla et al., 2008), axonal guidance (Cao et al., 2012), axonal transport, and/or synaptic signaling (Knobloch et al., 2007a), processes that ultimately might translate into impaired neural function. Marked functional impairments have been observed in pa- tients with AD using fMRI (Greicius et al., 2004; Johnson et al., 2012). In particular, resting-state fMRI (rs-fMRI) has been exten- sively used to investigate functional connectivity (FC) as derived from the apparent synchronicity of the fMRI signal of distinct brain regions. Human brain appears organized into 10 –15 net- works (Damoiseaux et al., 2006), among which, the default mode network (DMN) has gained attention in AD due to its colocaliza- tion with amyloid plaques (Greicius et al., 2003; Buckner et al., 2005). Additionally, DMN connectivity was reported affected in subjects at risk of developing AD including patients with mild cognitive impairment (Rombouts et al., 2005; Sorg et al., 2007), in cognitively healthy elders with amyloid deposits (Hedden et al., 2009; Sperling et al., 2009; Sheline et al., 2010b), and in mid- life carriers of APO 4 risk allele (Sheline et al., 2010a; Canuet et al., 2012). Elucidating the relationship between plaque deposi- tion and functional network change in a temporal and spatially resolved manner is essential for understanding the pathophysio- logical cascade and may provide an early diagnostic tool. How- ever, the heterogeneity among AD patients combined with poor method reproducibility at the individual level, the latency of dis- ease onset and difficulties to accurately perform early diagnostics in patients have rendered such studies in humans difficult. Received Nov. 8, 2013; revised Aug. 13, 2014; accepted Aug. 16, 2014. Author contributions: J.G. and M.R. designed research; J.G. and A.S. performed research; R.K., D.K., U.K., J.K., and R.M.N. contributed unpublished reagents/analytic tools; J.G., P.H., and M.T. analyzed data; J.G. and M.R. wrote the paper. This study was supported by the Swiss National Science Foundation (SNF 310030-141202, SNF 310030-126029). The authors declare no competing financial interests. Correspondence should be addressed to Markus Rudin, Institute for Biomedical Engineering, Wolfgang-Pauli- Street 27, 8093 Zurich, Switzerland. E-mail: [email protected]. DOI:10.1523/JNEUROSCI.4762-13.2014 Copyright © 2014 the authors 0270-6474/14/3413780-10$15.00/0 13780 • The Journal of Neuroscience, October 8, 2014 • 34(41):13780 –13789

Welcome message from author
This document is posted to help you gain knowledge. Please leave a comment to let me know what you think about it! Share it to your friends and learn new things together.
Transcript
Neurobiology of Disease
Early Alterations in Functional Connectivity and WhiteMatter Structure in a Transgenic Mouse Model of CerebralAmyloidosis
Joanes Grandjean,1,2 Aileen Schroeter,1 Pan He,3 Matteo Tanadini,4 Ruth Keist,5 Dimitrije Krstic,5 Uwe Konietzko,2,6
Jan Klohs,1,2 Roger M. Nitsch,2,6 and Markus Rudin1,2,5
1Institute for Biomedical Engineering, and 2Center for Neuroscience Research, University and ETH Zurich, 8093 Zurich, Switzerland, 3Department ofInformation Technology and Electrical Engineering, and 4Seminar for Statistics, ETH Zurich, 8092 Zurich, Switzerland, and 5Institute of Pharmacology andToxicology and 6Division of Psychiatry Research, University of Zurich, 8008 Zurich, Switzerland
Impairment of brain functional connectivity (FC) is thought to be an early event occurring in diseases with cerebral amyloidosis, such asAlzheimer’s disease. Regions sustaining altered functional networks have been shown to colocalize with regions marked with amyloidplaques burden suggesting a strong link between FC and amyloidosis. Whether the decline in FC precedes amyloid plaque deposition oris a consequence thereof is currently unknown. The sequence of events during early stages of the disease is difficult to capture in humansdue to the difficulties in providing an early diagnosis and also in view of the heterogeneity among patients. Transgenic mouse linesoverexpressing amyloid precursor proteins develop cerebral amyloidosis and constitute an attractive model system for studying therelationship between plaque and functional changes. In this study, ArcA� transgenic and wild-type mice were imaged using resting-statefMRI methods across their life-span in a cross-sectional design to analyze changes in FC in relation to the pathology. Transgenic miceshow compromised development of FC during the first months of postnatal life compared with wild-type animals, resulting in functionalimpairments that affect in particular the sensory-motor cortex already in preplaque stage. These functional alterations were accompa-nied by structural changes as reflected by reduced fractional anisotropy values, as derived from diffusion tensor imaging. Our resultssuggest cerebral amyloidosis in mice is preceded by impairment of neuronal networks and white matter structures. FC analysis in mice isan attractive tool for studying the implications of impaired neuronal networks in models of cerebral amyloid pathology.
Key words: ArcA�; diffusion tensor imaging; fMRI; functional connectivity; mouse; resting state
IntroductionThe occurrence of amyloid plaques in brain parenchyma andaround the cerebral vessels constitutes a hallmark of Alzheimer’sdisease (AD; Iwatsubo et al., 1994). Cerebral amyloidosis involvesthe aggregation of A� peptides, a cleavage product of the amyloidprecursor protein (APP). In AD, plaque deposits, fibrils, and oli-gomers of A� are considered essential mediators in the patho-physiological cascade leading to cognitive decline (Mucke andSelkoe, 2012). A� peptides in various forms have been linked toalterations in cerebral calcium homeostasis (Kuchibhotla et al.,2008), axonal guidance (Cao et al., 2012), axonal transport,and/or synaptic signaling (Knobloch et al., 2007a), processes thatultimately might translate into impaired neural function.
Marked functional impairments have been observed in pa-tients with AD using fMRI (Greicius et al., 2004; Johnson et al.,2012). In particular, resting-state fMRI (rs-fMRI) has been exten-sively used to investigate functional connectivity (FC) as derivedfrom the apparent synchronicity of the fMRI signal of distinctbrain regions. Human brain appears organized into 10 –15 net-works (Damoiseaux et al., 2006), among which, the default modenetwork (DMN) has gained attention in AD due to its colocaliza-tion with amyloid plaques (Greicius et al., 2003; Buckner et al.,2005). Additionally, DMN connectivity was reported affected insubjects at risk of developing AD including patients with mildcognitive impairment (Rombouts et al., 2005; Sorg et al., 2007),in cognitively healthy elders with amyloid deposits (Hedden etal., 2009; Sperling et al., 2009; Sheline et al., 2010b), and in mid-life carriers of APO �4 risk allele (Sheline et al., 2010a; Canuet etal., 2012). Elucidating the relationship between plaque deposi-tion and functional network change in a temporal and spatiallyresolved manner is essential for understanding the pathophysio-logical cascade and may provide an early diagnostic tool. How-ever, the heterogeneity among AD patients combined with poormethod reproducibility at the individual level, the latency of dis-ease onset and difficulties to accurately perform early diagnosticsin patients have rendered such studies in humans difficult.
Received Nov. 8, 2013; revised Aug. 13, 2014; accepted Aug. 16, 2014.Author contributions: J.G. and M.R. designed research; J.G. and A.S. performed research; R.K., D.K., U.K., J.K., and
R.M.N. contributed unpublished reagents/analytic tools; J.G., P.H., and M.T. analyzed data; J.G. and M.R. wrote thepaper.
This study was supported by the Swiss National Science Foundation (SNF 310030-141202, SNF 310030-126029).The authors declare no competing financial interests.Correspondence should be addressed to Markus Rudin, Institute for Biomedical Engineering, Wolfgang-Pauli-
Street 27, 8093 Zurich, Switzerland. E-mail: [email protected]:10.1523/JNEUROSCI.4762-13.2014
Copyright © 2014 the authors 0270-6474/14/3413780-10$15.00/0
13780 • The Journal of Neuroscience, October 8, 2014 • 34(41):13780 –13789
Animal models of amyloid pathology offer an experimentalplatform to studying AD (Gordon et al., 2002). Although themolecular processes underlying amyloid pathology in animalshave been examined extensively, studies addressing its implica-tion on brain FC are lacking as fMRI in mice is challenging. Wehave assessed the FC in mice across their lifespan, from 1 to 21months, in a cross-sectional design using rs-fMRI. The ArcA�transgenic mouse model of cerebral amyloidosis has been used,which overexpresses the human APP protein with the Swedishand Arctic mutations. The mice show reduced synaptic plasticity(Knobloch et al., 2007a), and amyloid pathology affecting boththe brain parenchyma and vasculature by 6 months of age (Kno-bloch et al., 2007b; Merlini et al., 2011). To obtain a structuralcorrelate for FC changes, we have complemented fMRI measure-ments with diffusion tensor imaging. Combining structural andfunctional connectivity data in a temporally resolved mannerprovides valuable insight into the mechanisms underlying thealterations observed in mouse models of amyloidosis.
Materials and MethodsAnimal preparation. All animal experiments in this study have been per-formed in adherence to the Swiss law of Animal Protection and wereapprove by the Zurich cantonal veterinary office. A total of 38 (17 male,21 female) transgenic ArcA� mice and 36 (12 male and 24 female) wild-type littermates aged between 1 and 21 months were used in this study infour different age groups (A–D), imaged at 1 and 2 months (Group A), at5 months (Group B), at 8 and 11 months (Group C), and at 19 and 21months (Group D). The groups and corresponding group sizes are sum-marized in Table 1. Animals were housed in standard mouse caging, with12 h light/dark cycles with food and water provided ad libitum. Mice wereanesthetized with isoflurane (Abbott) in 1:4 oxygen to air mix at 3% forinduction and 1.4% during measurements administered via a facemask.Animals were placed on a mouse support with ear bars placed to reduceanimal motion during the experiments. The body temperature was mon-itored with a rectal thermometer and kept at 36.5°C � 0.5°C with anadjustable warm water bath contained in the support. Measurement in-cluding mouse preparation typically lasted for 45 min. Animals weremeasured a second time in a week interval to evaluate reproducibility.Animals at 11 and 21 months were killed for histology.
MRI. A BioSpec 94/30 animal MRI system (Bruker BioSpin GmbH)equipped with a 9.4 T magnet with a horizontal bore of 30 cm diameter,a BGA12S gradient system capable of a maximum gradient strength of400 mT/m with a 80 �s rise time, a 2 � 2 cryogenic phased-array receivecoil, and a linear volume resonator coil for excitation have been used.Anatomical images have been recorded using a multislice rapid acquisi-tion with relaxation enhancement sequence with repetition time (TR) �2500 ms, echo time (TE) � 11 ms, effective echo time (TEeff) � 33 ms,pulse angle (PA) � 90°, number of averages (NA) � 1, matrix dimension
(MD) � 180 � 180, pixel dimensions (V) � 111 � 97 �m 2, slice thick-ness (STH) � 500 �m, interslice distance (ISD) � 200 �m, and numberof slices (NSl) � 12. For fMRI studies gradient-echo echo-planar imag-ing (EPI) was with TR � 1500 ms, TE � 9.3 ms, PA � 50°, number ofrepetition (NR) � 500, NA � 1, MD � 90 � 70, V � 250 � 220 �m 2,STH � 500 �m, ISD � 200 �m, NSl � 12. Diffusion tensor imaging wasperformed using a multisegment DTI-EPI sequence, with TR � 3000 ms,TE � 25 ms, PA � 90°, number of segments � 4, NA � 1, MD � 128 �128, V � 160 � 130 �m 2, STH � 500 �m, ISD � 200 �m, NSl � 12, bvalue of 690 s/mm 2, and 36 diffusion encoding directions. Shimming wasperformed using MAPSHIM protocol.
Images processing. Images were preprocessed in SPM05 (FIL Group)for MATLAB (MathWorks). Functional MR images were realigned, cor-rected for slice timing and a nonlinear transformation was applied tomatch to an in-house EPI template (Fig. 1a,b). The template has beenobtained as the mean of 10 coregistered EPI datasets that have beenrecorded in a separate experiment. To obtain enforce bilateral symmetry,the original and mirrored EPI data have been averaged. Motion correc-tion was performed using the tools provided by SPM. Temporal variancewas computed voxelwise and averaged between all scans to obtain mapsrevealing clusters of high variances in regions associated with large ves-sels. The signal traces in these clusters were used a regressors in thevoxelwise analysis to account for contributions arising from the vascula-ture (Fig. 1c). Initially, we also evaluated for a potential influence fromrespiration using RETROICOR (Glover et al., 2000), yet observed that ithad negligible effect on the results. Hence, this contribution was notfurthermore considered. The resulting time series for each voxel werethen bandpass filtered using a range between 0.01 and 0.15 Hz (Resttoolbox, State Key Laboratory of Cognitive Neuroscience and Learning)for MATLAB. Mean time series were extracted from the regressed imagesusing an in-house atlas template based on the functional organization ofthe mouse brain with 24 different ROIs (Fig. 1d). Functional connectivitywas measured as the Pearson correlation coefficient between mean timeseries from each brain region pairs, corrected with Fisher z-transformationfor bounded values.
Fractional anisotropy (FA) was computed from diffusion tensor im-ages using Paravision 5 (Bruker BioSpin GmbH). Images were convertedto Analyze7.5 format and normalized to a reference space using b0 imageswith SPM05. Fractional anisotropy values were extracted for selectedregions-of-interest (ROIs).
All unprocessed anatomical, diffusion tensor, and functional imageswere made freely available at central.XNAT.org in Analyze7.5 format(Project ID: fMRI_AD_mouse).
Histology. Animals were deeply anesthetized with ketamine/xylazine,and transcardially perfused with cold PBS followed by 4% paraformal-dehyde. Brains were extracted and put in paraformaldehyde overnight.Brains were transferred in succession in 10, 20, and 30% sucrose solution,before being frozen at �80°C. Randomly sampled serial sections (cut at40 �m) were collected and stored at �20°C in cryoprotectant solution
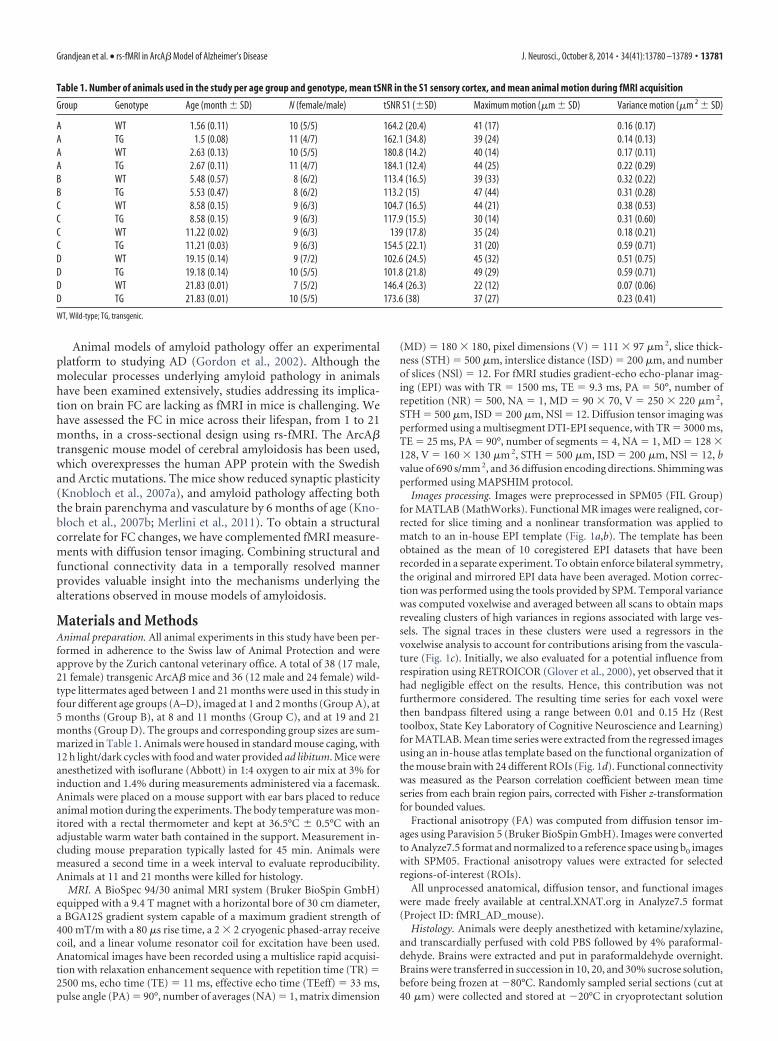
Table 1. Number of animals used in the study per age group and genotype, mean tSNR in the S1 sensory cortex, and mean animal motion during fMRI acquisition
Group Genotype Age (month � SD) N (female/male) tSNR S1 (�SD) Maximum motion (�m � SD) Variance motion (�m 2 � SD)
A WT 1.56 (0.11) 10 (5/5) 164.2 (20.4) 41 (17) 0.16 (0.17)A TG 1.5 (0.08) 11 (4/7) 162.1 (34.8) 39 (24) 0.14 (0.13)A WT 2.63 (0.13) 10 (5/5) 180.8 (14.2) 40 (14) 0.17 (0.11)A TG 2.67 (0.11) 11 (4/7) 184.1 (12.4) 44 (25) 0.22 (0.29)B WT 5.48 (0.57) 8 (6/2) 113.4 (16.5) 39 (33) 0.32 (0.22)B TG 5.53 (0.47) 8 (6/2) 113.2 (15) 47 (44) 0.31 (0.28)C WT 8.58 (0.15) 9 (6/3) 104.7 (16.5) 44 (21) 0.38 (0.53)C TG 8.58 (0.15) 9 (6/3) 117.9 (15.5) 30 (14) 0.31 (0.60)C WT 11.22 (0.02) 9 (6/3) 139 (17.8) 35 (24) 0.18 (0.21)C TG 11.21 (0.03) 9 (6/3) 154.5 (22.1) 31 (20) 0.59 (0.71)D WT 19.15 (0.14) 9 (7/2) 102.6 (24.5) 45 (32) 0.51 (0.75)D TG 19.18 (0.14) 10 (5/5) 101.8 (21.8) 49 (29) 0.59 (0.71)D WT 21.83 (0.01) 7 (5/2) 146.4 (26.3) 22 (12) 0.07 (0.06)D TG 21.83 (0.01) 10 (5/5) 173.6 (38) 37 (27) 0.23 (0.41)
WT, Wild-type; TG, transgenic.
Grandjean et al. • rs-fMRI in ArcA� Model of Alzheimer’s Disease J. Neurosci., October 8, 2014 • 34(41):13780 –13789 • 13781

(50 mmol/L sodium phosphate buffer, pH 7.4, containing 15% glucoseand 30% ethylene glycol; Sigma-Aldrich). The free-floating sections weretreated for 10 min with pepsin (Dako) 0.15 mg/ml in 0.2 N HCl at 37°C.After three washes in PBS, the pepsin-treated brain sections were thenincubated overnight at 4°C in the primary antibody solution (mousemonoclonal amyloid-�1–16, clone 6E10, diluted 1:1000, Covance) di-luted in PBS containing 2% normal goat serum and 0.2% Triton X-100.After three washes in PBS, tissue sections were incubated for 30 min atRT in biotinylated secondary antibody (diluted 1:500; Jackson Immu-noResearch Laboratories). A commercial kit (Vectastain Kit; Vector Lab-oratories) was then used with 3,3-diaminobenzidine (Sigma-Aldrich),and sections were stained for 5–10 min. After three washes in PBS, sec-tions were mounted onto gelatinized glass slides and air-dried overnight.The sections were then dehydrated through ethanol, cleared in xylene,mounted with resinous mounting medium (EukittTM, Sigma-Aldrich),and coverslipped. ROI analysis was performed in ImageJ (NIH) to esti-mate the fractional surface occupied by amyloid plaques by delineatingthe cortical regions according to the atlas used for the FC analysis.
Statistics. Statistical analysis was performed using the statistical soft-ware R 2.13.0 (The R Foundation for Statistical Computing). A linearmixed model analysis was performed with gender, age, genotype, andtheir twofold interactions as fixed effects using lme4 package. We appliedthe Fisher’s z-transformation to the response variable. The effects of eachinteraction and factor were tested with Likelihood Ratio Tests. Residualanalysis of the mixed models was performed on randomly selected sam-ples (n � 30) with QQ-plots to inspect normal distribution, Tukey–Anscombe plots for the homogeneity of the variance and skewness, andscale location plots for homoscedasticity (i.e., the homogeneity of resid-ual variance). The assumption of normally distributed residuals was con-sidered plausible in all tested fractional anisotropy samples and in all ofthe randomly tested functional connectivity pairs describing cortical in-teractions. In a post hoc analysis, the changes of correlation per time wereextracted for the following intervals: 1–5 and 5–19 months, and contrastswere used in the mixed-model analysis to test differences in the responsevariable between in wild-type and transgenic mice at these intervals.Multiple comparison was corrected with false discovery rate (FDR) (Ben-jamini and Hochberg, 1995), with q � 0.05 for network comparison, andq � 0.15 for voxelwise analysis. Voxelwise maps were further filtered forstatistically significant clusters of 15 voxels or more. The null hypothesis,
i.e., the absence of effect for a given factor or interaction, was rejectedaccording to the FDR threshold, and is denoted in the text as factor effectfor simplicity (e.g., genotype effect, genotype � age interaction effect,etc.). Values in plots and images are shown as mean value per group anderror bars represent �1 SD, p values are shown as log10( p value) toaccount for the large range of values.
ResultsGroup descriptionDuring the study, a small portion of animals developed comorbidi-ties or abnormal structures observed with T2 anatomical images: twoanimals with abnormal ventricles (1-month-old transgenic, 19-month-old transgenic), one animal with focal hypointensity in thethalamus (1-month-old transgenic). In addition, two wild-type an-imals had to be killed between measurements at 19 and 21 monthsdue to age-related events. All animals measured were included in theanalysis.
PreprocessingEPI image deformation induced by the magnetic field inhomo-geneity was minimal in most scans and was accounted for by thenonlinear transformation during the coregistration. There wasno apparent difference related to coregistration in the mean im-ages in the individual groups as illustrated with 1- and 11-month-old animals (Fig. 1a,b). Temporal variance maps revealed clustersof high variance in areas colocalizing with major blood vessels(shown with white arrows) and at the brain boundaries (Fig. 1c).The signal traces were then extracted from these regions andregressed from the time series for every voxel (to account forvascular contributions) along with the motion parameters, whichled to an effective reduction in variance in region as indicated bythe variance analysis (Fig. 1c).
Development of FC during early months of lifeIn wild-type mice, the correlation coefficient between rs-fMRItime series for ROIs located within the parietal and motor corti-
Figure 1. EPI images were normalized to an in-house template using nonlinear coregistration. The mean of the coregistered images are shown for 1-month-old (a) and 11-months-old (b) forboth wild-type and transgenic mice, and illustrate the performance of the coregistration procedure. No visible difference appears between the groups suggesting the validity of the linear andnonlinear transformation applied. Temporal variance maps revealed clusters with high variance in the brain boundaries and in areas colocalizing with major blood vessels (c, white arrows).Voxelwise regression was performed with the signal extracted from these regions, leading to reduced variance in these regions. A color-coded atlas template was used for network analysis showing24 ROIs based on the functional organization of the mouse brain (d). The distance of the respective section from bregma in millimeters is indicated.
13782 • J. Neurosci., October 8, 2014 • 34(41):13780 –13789 Grandjean et al. • rs-fMRI in ArcA� Model of Alzheimer’s Disease
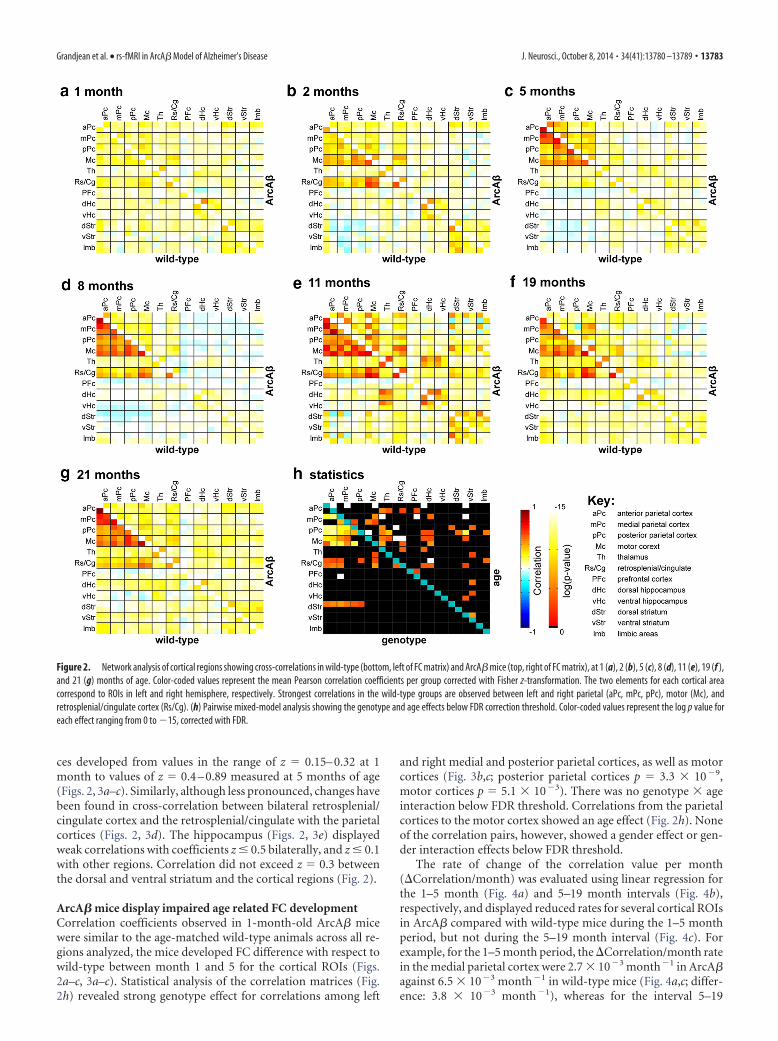
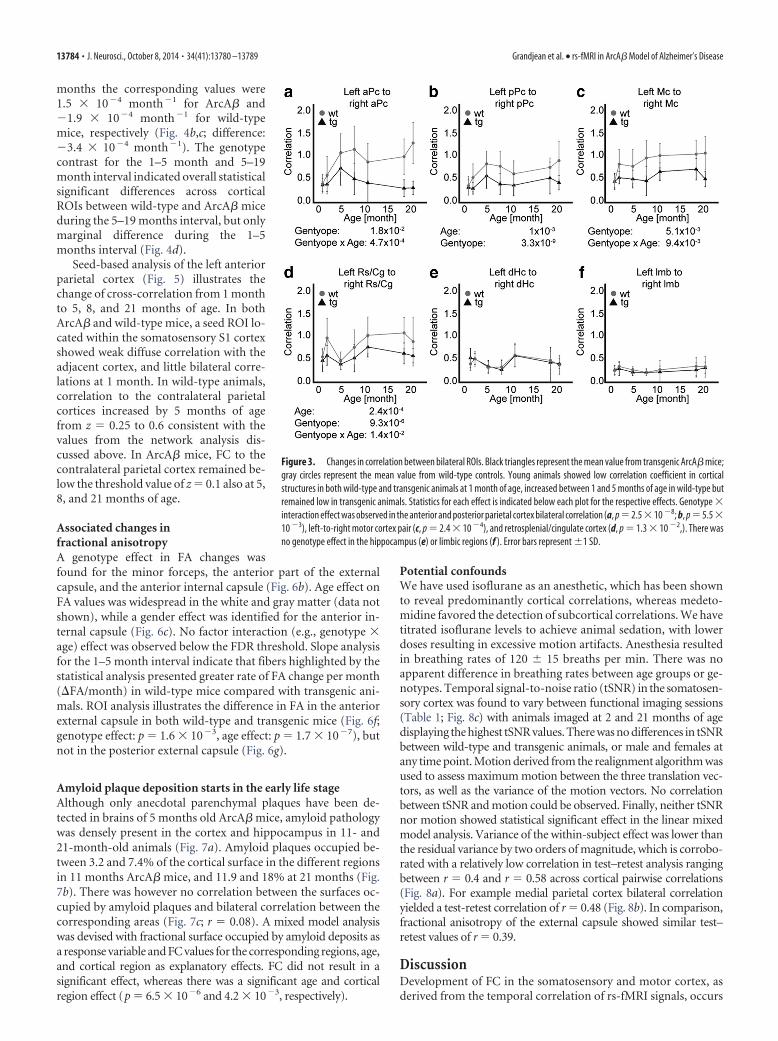
ces developed from values in the range of z � 0.15– 0.32 at 1month to values of z � 0.4 – 0.89 measured at 5 months of age(Figs. 2, 3a–c). Similarly, although less pronounced, changes havebeen found in cross-correlation between bilateral retrosplenial/cingulate cortex and the retrosplenial/cingulate with the parietalcortices (Figs. 2, 3d). The hippocampus (Figs. 2, 3e) displayedweak correlations with coefficients z � 0.5 bilaterally, and z � 0.1with other regions. Correlation did not exceed z � 0.3 betweenthe dorsal and ventral striatum and the cortical regions (Fig. 2).
ArcA� mice display impaired age related FC developmentCorrelation coefficients observed in 1-month-old ArcA� micewere similar to the age-matched wild-type animals across all re-gions analyzed, the mice developed FC difference with respect towild-type between month 1 and 5 for the cortical ROIs (Figs.2a–c, 3a–c). Statistical analysis of the correlation matrices (Fig.2h) revealed strong genotype effect for correlations among left
and right medial and posterior parietal cortices, as well as motorcortices (Fig. 3b,c; posterior parietal cortices p � 3.3 � 10�9,motor cortices p � 5.1 � 10�3). There was no genotype � ageinteraction below FDR threshold. Correlations from the parietalcortices to the motor cortex showed an age effect (Fig. 2h). Noneof the correlation pairs, however, showed a gender effect or gen-der interaction effects below FDR threshold.
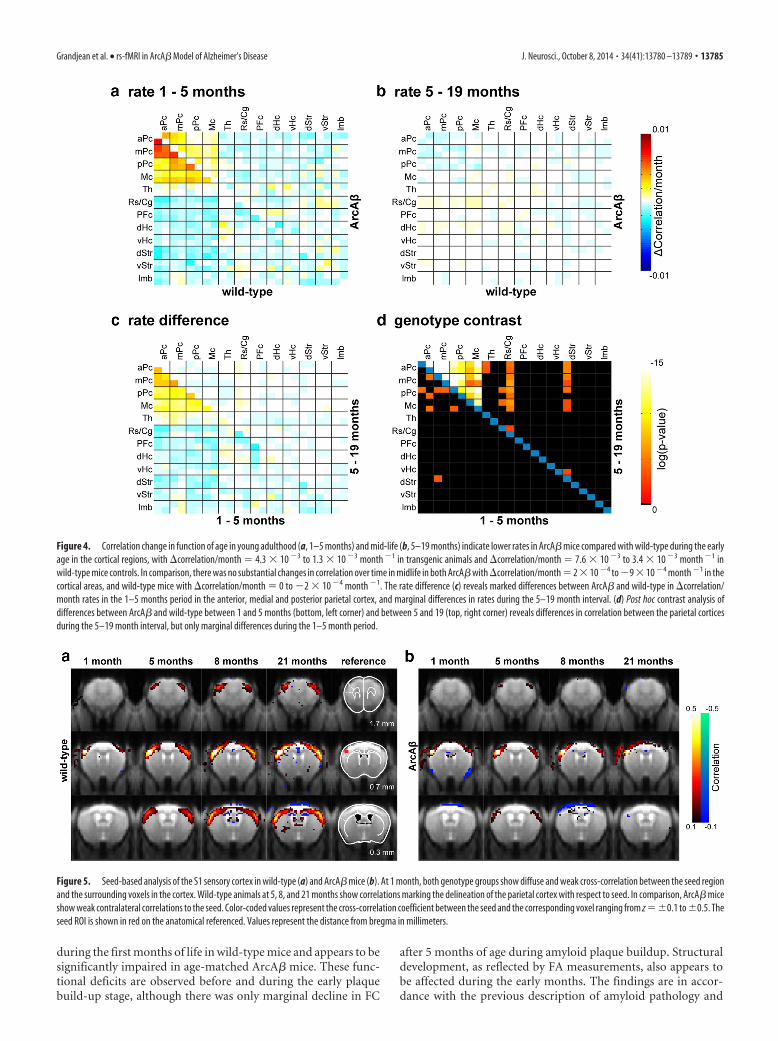
The rate of change of the correlation value per month(�Correlation/month) was evaluated using linear regression forthe 1–5 month (Fig. 4a) and 5–19 month intervals (Fig. 4b),respectively, and displayed reduced rates for several cortical ROIsin ArcA� compared with wild-type mice during the 1–5 monthperiod, but not during the 5–19 month interval (Fig. 4c). Forexample, for the 1–5 month period, the �Correlation/month ratein the medial parietal cortex were 2.7 � 10�3 month�1 in ArcA�against 6.5 � 10�3 month�1 in wild-type mice (Fig. 4a,c; differ-ence: 3.8 � 10�3 month�1), whereas for the interval 5–19
Figure 2. Network analysis of cortical regions showing cross-correlations in wild-type (bottom, left of FC matrix) and ArcA� mice (top, right of FC matrix), at 1 (a), 2 (b), 5 (c), 8 (d), 11 (e), 19 (f ),and 21 (g) months of age. Color-coded values represent the mean Pearson correlation coefficients per group corrected with Fisher z-transformation. The two elements for each cortical areacorrespond to ROIs in left and right hemisphere, respectively. Strongest correlations in the wild-type groups are observed between left and right parietal (aPc, mPc, pPc), motor (Mc), andretrosplenial/cingulate cortex (Rs/Cg). (h) Pairwise mixed-model analysis showing the genotype and age effects below FDR correction threshold. Color-coded values represent the log p value foreach effect ranging from 0 to �15, corrected with FDR.
Grandjean et al. • rs-fMRI in ArcA� Model of Alzheimer’s Disease J. Neurosci., October 8, 2014 • 34(41):13780 –13789 • 13783
months the corresponding values were1.5 � 10�4 month�1 for ArcA� and�1.9 � 10�4 month�1 for wild-typemice, respectively (Fig. 4b,c; difference:�3.4 � 10�4 month�1). The genotypecontrast for the 1–5 month and 5–19month interval indicated overall statisticalsignificant differences across corticalROIs between wild-type and ArcA� miceduring the 5–19 months interval, but onlymarginal difference during the 1–5months interval (Fig. 4d).
Seed-based analysis of the left anteriorparietal cortex (Fig. 5) illustrates thechange of cross-correlation from 1 monthto 5, 8, and 21 months of age. In bothArcA� and wild-type mice, a seed ROI lo-cated within the somatosensory S1 cortexshowed weak diffuse correlation with theadjacent cortex, and little bilateral corre-lations at 1 month. In wild-type animals,correlation to the contralateral parietalcortices increased by 5 months of agefrom z � 0.25 to 0.6 consistent with thevalues from the network analysis dis-cussed above. In ArcA� mice, FC to thecontralateral parietal cortex remained be-low the threshold value of z � 0.1 also at 5,8, and 21 months of age.
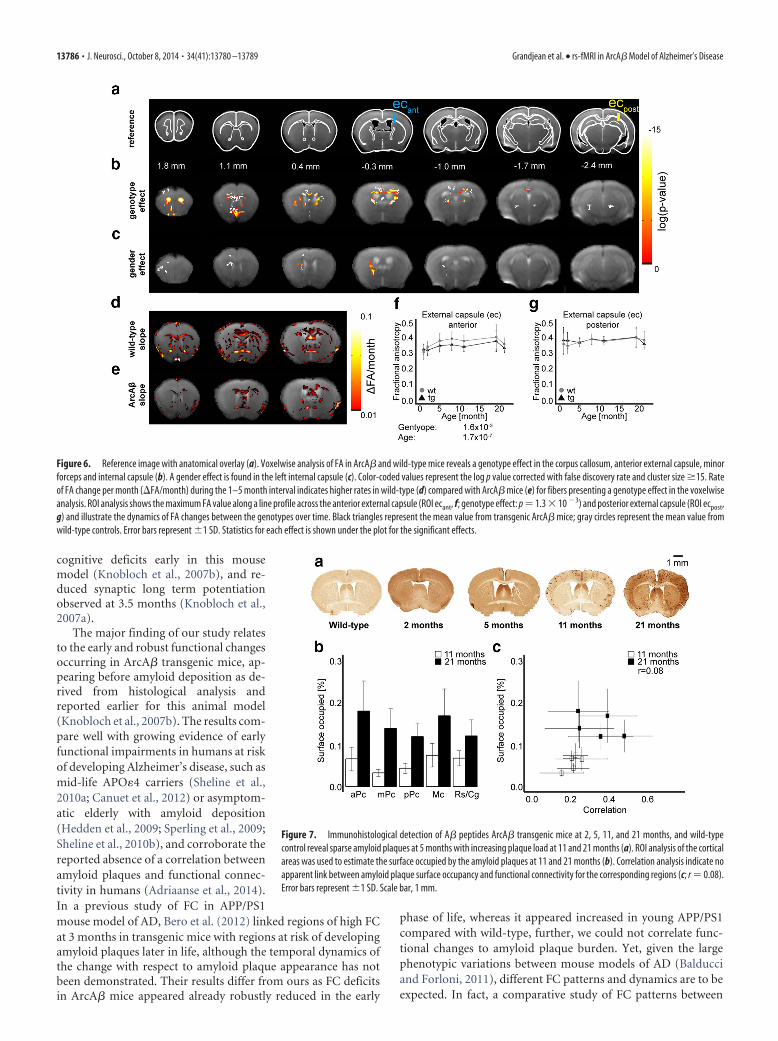
Associated changes infractional anisotropyA genotype effect in FA changes wasfound for the minor forceps, the anterior part of the externalcapsule, and the anterior internal capsule (Fig. 6b). Age effect onFA values was widespread in the white and gray matter (data notshown), while a gender effect was identified for the anterior in-ternal capsule (Fig. 6c). No factor interaction (e.g., genotype �age) effect was observed below the FDR threshold. Slope analysisfor the 1–5 month interval indicate that fibers highlighted by thestatistical analysis presented greater rate of FA change per month(�FA/month) in wild-type mice compared with transgenic ani-mals. ROI analysis illustrates the difference in FA in the anteriorexternal capsule in both wild-type and transgenic mice (Fig. 6f;genotype effect: p � 1.6 � 10�3, age effect: p � 1.7 � 10�7), butnot in the posterior external capsule (Fig. 6g).
Amyloid plaque deposition starts in the early life stageAlthough only anecdotal parenchymal plaques have been de-tected in brains of 5 months old ArcA� mice, amyloid pathologywas densely present in the cortex and hippocampus in 11- and21-month-old animals (Fig. 7a). Amyloid plaques occupied be-tween 3.2 and 7.4% of the cortical surface in the different regionsin 11 months ArcA� mice, and 11.9 and 18% at 21 months (Fig.7b). There was however no correlation between the surfaces oc-cupied by amyloid plaques and bilateral correlation between thecorresponding areas (Fig. 7c; r � 0.08). A mixed model analysiswas devised with fractional surface occupied by amyloid deposits asa response variable and FC values for the corresponding regions, age,and cortical region as explanatory effects. FC did not result in asignificant effect, whereas there was a significant age and corticalregion effect (p � 6.5 � 10�6 and 4.2 � 10�3, respectively).
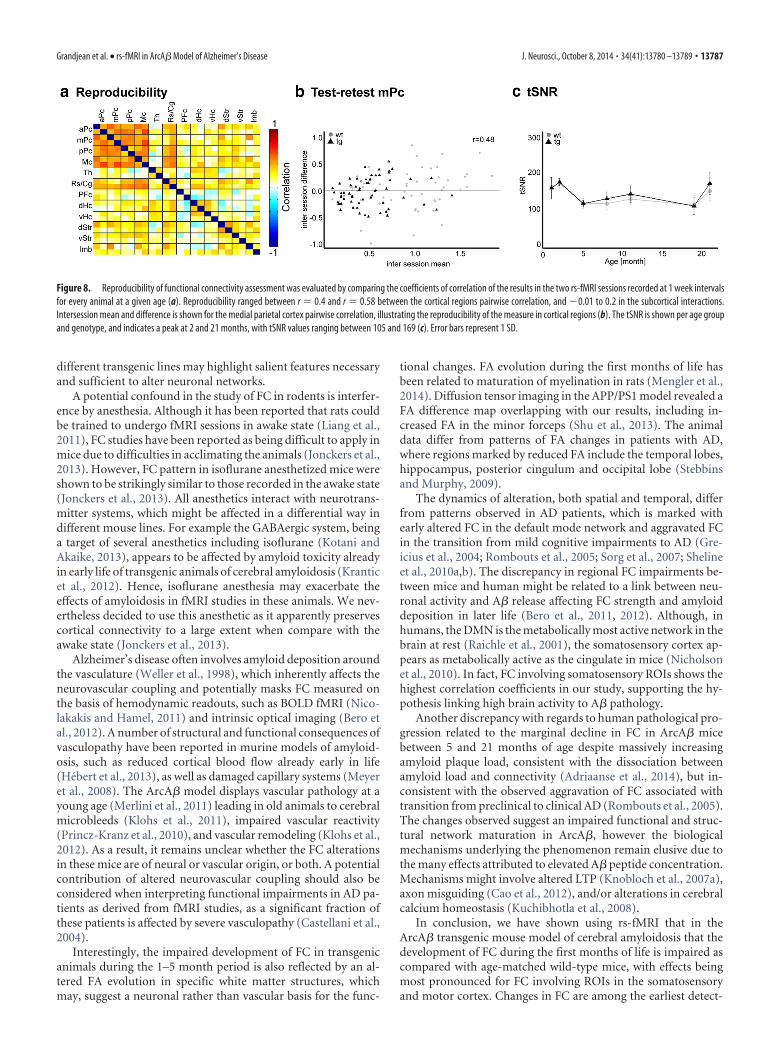
Potential confoundsWe have used isoflurane as an anesthetic, which has been shownto reveal predominantly cortical correlations, whereas medeto-midine favored the detection of subcortical correlations. We havetitrated isoflurane levels to achieve animal sedation, with lowerdoses resulting in excessive motion artifacts. Anesthesia resultedin breathing rates of 120 � 15 breaths per min. There was noapparent difference in breathing rates between age groups or ge-notypes. Temporal signal-to-noise ratio (tSNR) in the somatosen-sory cortex was found to vary between functional imaging sessions(Table 1; Fig. 8c) with animals imaged at 2 and 21 months of agedisplaying the highest tSNR values. There was no differences in tSNRbetween wild-type and transgenic animals, or male and females atany time point. Motion derived from the realignment algorithm wasused to assess maximum motion between the three translation vec-tors, as well as the variance of the motion vectors. No correlationbetween tSNR and motion could be observed. Finally, neither tSNRnor motion showed statistical significant effect in the linear mixedmodel analysis. Variance of the within-subject effect was lower thanthe residual variance by two orders of magnitude, which is corrobo-rated with a relatively low correlation in test–retest analysis rangingbetween r � 0.4 and r � 0.58 across cortical pairwise correlations(Fig. 8a). For example medial parietal cortex bilateral correlationyielded a test-retest correlation of r � 0.48 (Fig. 8b). In comparison,fractional anisotropy of the external capsule showed similar test–retest values of r � 0.39.
DiscussionDevelopment of FC in the somatosensory and motor cortex, asderived from the temporal correlation of rs-fMRI signals, occurs
Figure 3. Changes in correlation between bilateral ROIs. Black triangles represent the mean value from transgenic ArcA� mice;gray circles represent the mean value from wild-type controls. Young animals showed low correlation coefficient in corticalstructures in both wild-type and transgenic animals at 1 month of age, increased between 1 and 5 months of age in wild-type butremained low in transgenic animals. Statistics for each effect is indicated below each plot for the respective effects. Genotype �interaction effect was observed in the anterior and posterior parietal cortex bilateral correlation (a, p�2.5�10 �8; b, p�5.5�10 �3), left-to-right motor cortex pair (c, p � 2.4 � 10 �4), and retrosplenial/cingulate cortex (d, p � 1.3 � 10 �2,). There wasno genotype effect in the hippocampus (e) or limbic regions (f ). Error bars represent �1 SD.
13784 • J. Neurosci., October 8, 2014 • 34(41):13780 –13789 Grandjean et al. • rs-fMRI in ArcA� Model of Alzheimer’s Disease
during the first months of life in wild-type mice and appears to besignificantly impaired in age-matched ArcA� mice. These func-tional deficits are observed before and during the early plaquebuild-up stage, although there was only marginal decline in FC
after 5 months of age during amyloid plaque buildup. Structuraldevelopment, as reflected by FA measurements, also appears tobe affected during the early months. The findings are in accor-dance with the previous description of amyloid pathology and
Figure 4. Correlation change in function of age in young adulthood (a, 1–5 months) and mid-life (b, 5–19 months) indicate lower rates in ArcA� mice compared with wild-type during the earlyage in the cortical regions, with �correlation/month � 4.3 � 10 �3 to 1.3 � 10 �3 month �1 in transgenic animals and �correlation/month � 7.6 � 10 �3 to 3.4 � 10 �3 month �1 inwild-type mice controls. In comparison, there was no substantial changes in correlation over time in midlife in both ArcA� with �correlation/month � 2 � 10 �4 to �9 � 10 �4 month �1 in thecortical areas, and wild-type mice with �correlation/month � 0 to �2 � 10 �4 month �1. The rate difference (c) reveals marked differences between ArcA� and wild-type in �correlation/month rates in the 1–5 months period in the anterior, medial and posterior parietal cortex, and marginal differences in rates during the 5–19 month interval. (d) Post hoc contrast analysis ofdifferences between ArcA� and wild-type between 1 and 5 months (bottom, left corner) and between 5 and 19 (top, right corner) reveals differences in correlation between the parietal corticesduring the 5–19 month interval, but only marginal differences during the 1–5 month period.
Figure 5. Seed-based analysis of the S1 sensory cortex in wild-type (a) and ArcA� mice (b). At 1 month, both genotype groups show diffuse and weak cross-correlation between the seed regionand the surrounding voxels in the cortex. Wild-type animals at 5, 8, and 21 months show correlations marking the delineation of the parietal cortex with respect to seed. In comparison, ArcA� miceshow weak contralateral correlations to the seed. Color-coded values represent the cross-correlation coefficient between the seed and the corresponding voxel ranging from z ��0.1 to �0.5. Theseed ROI is shown in red on the anatomical referenced. Values represent the distance from bregma in millimeters.
Grandjean et al. • rs-fMRI in ArcA� Model of Alzheimer’s Disease J. Neurosci., October 8, 2014 • 34(41):13780 –13789 • 13785
cognitive deficits early in this mousemodel (Knobloch et al., 2007b), and re-duced synaptic long term potentiationobserved at 3.5 months (Knobloch et al.,2007a).
The major finding of our study relatesto the early and robust functional changesoccurring in ArcA� transgenic mice, ap-pearing before amyloid deposition as de-rived from histological analysis andreported earlier for this animal model(Knobloch et al., 2007b). The results com-pare well with growing evidence of earlyfunctional impairments in humans at riskof developing Alzheimer’s disease, such asmid-life APO�4 carriers (Sheline et al.,2010a; Canuet et al., 2012) or asymptom-atic elderly with amyloid deposition(Hedden et al., 2009; Sperling et al., 2009;Sheline et al., 2010b), and corroborate thereported absence of a correlation betweenamyloid plaques and functional connec-tivity in humans (Adriaanse et al., 2014).In a previous study of FC in APP/PS1mouse model of AD, Bero et al. (2012) linked regions of high FCat 3 months in transgenic mice with regions at risk of developingamyloid plaques later in life, although the temporal dynamics ofthe change with respect to amyloid plaque appearance has notbeen demonstrated. Their results differ from ours as FC deficitsin ArcA� mice appeared already robustly reduced in the early
phase of life, whereas it appeared increased in young APP/PS1compared with wild-type, further, we could not correlate func-tional changes to amyloid plaque burden. Yet, given the largephenotypic variations between mouse models of AD (Balducciand Forloni, 2011), different FC patterns and dynamics are to beexpected. In fact, a comparative study of FC patterns between
Figure 6. Reference image with anatomical overlay (a). Voxelwise analysis of FA in ArcA� and wild-type mice reveals a genotype effect in the corpus callosum, anterior external capsule, minorforceps and internal capsule (b). A gender effect is found in the left internal capsule (c). Color-coded values represent the log p value corrected with false discovery rate and cluster size �15. Rateof FA change per month (�FA/month) during the 1–5 month interval indicates higher rates in wild-type (d) compared with ArcA� mice (e) for fibers presenting a genotype effect in the voxelwiseanalysis. ROI analysis shows the maximum FA value along a line profile across the anterior external capsule (ROI ecant, f; genotype effect: p � 1.3 � 10 �3) and posterior external capsule (ROI ecpost,g) and illustrate the dynamics of FA changes between the genotypes over time. Black triangles represent the mean value from transgenic ArcA� mice; gray circles represent the mean value fromwild-type controls. Error bars represent �1 SD. Statistics for each effect is shown under the plot for the significant effects.
Figure 7. Immunohistological detection of A� peptides ArcA� transgenic mice at 2, 5, 11, and 21 months, and wild-typecontrol reveal sparse amyloid plaques at 5 months with increasing plaque load at 11 and 21 months (a). ROI analysis of the corticalareas was used to estimate the surface occupied by the amyloid plaques at 11 and 21 months (b). Correlation analysis indicate noapparent link between amyloid plaque surface occupancy and functional connectivity for the corresponding regions (c; r � 0.08).Error bars represent �1 SD. Scale bar, 1 mm.
13786 • J. Neurosci., October 8, 2014 • 34(41):13780 –13789 Grandjean et al. • rs-fMRI in ArcA� Model of Alzheimer’s Disease
different transgenic lines may highlight salient features necessaryand sufficient to alter neuronal networks.
A potential confound in the study of FC in rodents is interfer-ence by anesthesia. Although it has been reported that rats couldbe trained to undergo fMRI sessions in awake state (Liang et al.,2011), FC studies have been reported as being difficult to apply inmice due to difficulties in acclimating the animals (Jonckers et al.,2013). However, FC pattern in isoflurane anesthetized mice wereshown to be strikingly similar to those recorded in the awake state(Jonckers et al., 2013). All anesthetics interact with neurotrans-mitter systems, which might be affected in a differential way indifferent mouse lines. For example the GABAergic system, beinga target of several anesthetics including isoflurane (Kotani andAkaike, 2013), appears to be affected by amyloid toxicity alreadyin early life of transgenic animals of cerebral amyloidosis (Kranticet al., 2012). Hence, isoflurane anesthesia may exacerbate theeffects of amyloidosis in fMRI studies in these animals. We nev-ertheless decided to use this anesthetic as it apparently preservescortical connectivity to a large extent when compare with theawake state (Jonckers et al., 2013).
Alzheimer’s disease often involves amyloid deposition aroundthe vasculature (Weller et al., 1998), which inherently affects theneurovascular coupling and potentially masks FC measured onthe basis of hemodynamic readouts, such as BOLD fMRI (Nico-lakakis and Hamel, 2011) and intrinsic optical imaging (Bero etal., 2012). A number of structural and functional consequences ofvasculopathy have been reported in murine models of amyloid-osis, such as reduced cortical blood flow already early in life(Hebert et al., 2013), as well as damaged capillary systems (Meyeret al., 2008). The ArcA� model displays vascular pathology at ayoung age (Merlini et al., 2011) leading in old animals to cerebralmicrobleeds (Klohs et al., 2011), impaired vascular reactivity(Princz-Kranz et al., 2010), and vascular remodeling (Klohs et al.,2012). As a result, it remains unclear whether the FC alterationsin these mice are of neural or vascular origin, or both. A potentialcontribution of altered neurovascular coupling should also beconsidered when interpreting functional impairments in AD pa-tients as derived from fMRI studies, as a significant fraction ofthese patients is affected by severe vasculopathy (Castellani et al.,2004).
Interestingly, the impaired development of FC in transgenicanimals during the 1–5 month period is also reflected by an al-tered FA evolution in specific white matter structures, whichmay, suggest a neuronal rather than vascular basis for the func-
tional changes. FA evolution during the first months of life hasbeen related to maturation of myelination in rats (Mengler et al.,2014). Diffusion tensor imaging in the APP/PS1 model revealed aFA difference map overlapping with our results, including in-creased FA in the minor forceps (Shu et al., 2013). The animaldata differ from patterns of FA changes in patients with AD,where regions marked by reduced FA include the temporal lobes,hippocampus, posterior cingulum and occipital lobe (Stebbinsand Murphy, 2009).
The dynamics of alteration, both spatial and temporal, differfrom patterns observed in AD patients, which is marked withearly altered FC in the default mode network and aggravated FCin the transition from mild cognitive impairments to AD (Gre-icius et al., 2004; Rombouts et al., 2005; Sorg et al., 2007; Shelineet al., 2010a,b). The discrepancy in regional FC impairments be-tween mice and human might be related to a link between neu-ronal activity and A� release affecting FC strength and amyloiddeposition in later life (Bero et al., 2011, 2012). Although, inhumans, the DMN is the metabolically most active network in thebrain at rest (Raichle et al., 2001), the somatosensory cortex ap-pears as metabolically active as the cingulate in mice (Nicholsonet al., 2010). In fact, FC involving somatosensory ROIs shows thehighest correlation coefficients in our study, supporting the hy-pothesis linking high brain activity to A� pathology.
Another discrepancy with regards to human pathological pro-gression related to the marginal decline in FC in ArcA� micebetween 5 and 21 months of age despite massively increasingamyloid plaque load, consistent with the dissociation betweenamyloid load and connectivity (Adriaanse et al., 2014), but in-consistent with the observed aggravation of FC associated withtransition from preclinical to clinical AD (Rombouts et al., 2005).The changes observed suggest an impaired functional and struc-tural network maturation in ArcA�, however the biologicalmechanisms underlying the phenomenon remain elusive due tothe many effects attributed to elevated A� peptide concentration.Mechanisms might involve altered LTP (Knobloch et al., 2007a),axon misguiding (Cao et al., 2012), and/or alterations in cerebralcalcium homeostasis (Kuchibhotla et al., 2008).
In conclusion, we have shown using rs-fMRI that in theArcA� transgenic mouse model of cerebral amyloidosis that thedevelopment of FC during the first months of life is impaired ascompared with age-matched wild-type mice, with effects beingmost pronounced for FC involving ROIs in the somatosensoryand motor cortex. Changes in FC are among the earliest detect-
Figure 8. Reproducibility of functional connectivity assessment was evaluated by comparing the coefficients of correlation of the results in the two rs-fMRI sessions recorded at 1 week intervalsfor every animal at a given age (a). Reproducibility ranged between r � 0.4 and r � 0.58 between the cortical regions pairwise correlation, and �0.01 to 0.2 in the subcortical interactions.Intersession mean and difference is shown for the medial parietal cortex pairwise correlation, illustrating the reproducibility of the measure in cortical regions (b). The tSNR is shown per age groupand genotype, and indicates a peak at 2 and 21 months, with tSNR values ranging between 105 and 169 (c). Error bars represent 1 SD.
Grandjean et al. • rs-fMRI in ArcA� Model of Alzheimer’s Disease J. Neurosci., October 8, 2014 • 34(41):13780 –13789 • 13787
able feature in cerebral amyloidosis, both in human and animalmodels; however, the diagnostic value of this readout is ham-pered by poor reproducibility at the individual level. This re-mains a caveat of the method, which requires large groups ofanimals/patients or large effects to properly power future studies.Effects on FC are paralleled by structural changes as derived fromanalysis of the FA of water diffusion, and occur in the early amy-loid plaque buildup stage. Several factors may explain the ob-served alteration, including defective maturation of both FC andFA, reduced synaptic activity, or impaired cerebrovascular sys-tem. The variety of transgenic models of cerebral amyloidosisoffers an experimental platform to elucidate features necessaryand sufficient to alter neuronal networks, to study the effects ofdisease modifying agents, and to bridge mechanistic informationat a molecular and cellular level to functional/physiological read-outs obtained at the system level, that can be ultimately translatedto neuroimaging studies in humans.
ReferencesAdriaanse SM, Sanz-Arigita EJ, Binnewijzend MA, Ossenkoppele R, Tolboom
N, van Assema DM, Wink AM, Boellaard R, Yaqub M, Windhorst AD,van der Flier WM, Scheltens P, Lammertsma AA, Rombouts SA, BarkhofF, van Berckel BN (2014) Amyloid and its association with default net-work integrity in Alzheimer’s disease. Hum Brain Mapp 35:779 –791.CrossRef Medline
Balducci C, Forloni G (2011) APP transgenic mice: their use and limita-tions. Neuromolecular Med 13:117–137. CrossRef Medline
Benjamini Y, Hochberg Y (1995) Controlling the false discovery rate: apractical and powerful approach to multiple testing. J R Stat Soc Ser B57:289 –300.
Bero AW, Yan P, Roh JH, Cirrito JR, Stewart FR, Raichle ME, Lee JM, Holtz-man DM (2011) Neuronal activity regulates the regional vulnerability toamyloid-beta deposition. Nat Neurosci 14:750 –756. CrossRef Medline
Bero AW, Bauer AQ, Stewart FR, White BR, Cirrito JR, Raichle ME, Culver JP,Holtzman DM (2012) Bidirectional relationship between functionalconnectivity and amyloid-beta deposition in mouse brain. J Neurosci32:4334 – 4340. CrossRef Medline
Buckner RL, Snyder AZ, Shannon BJ, LaRossa G, Sachs R, Fotenos AF, ShelineYI, Klunk WE, Mathis CA, Morris JC, Mintun MA (2005) Molecular,structural, and functional characterization of Alzheimer’s disease: evi-dence for a relationship between default activity, amyloid, and memory.J Neurosci 25:7709 –7717. CrossRef Medline
Canuet L, Tellado I, Couceiro V, Fraile C, Fernandez-Novoa L, Ishii R, TakedaM, Cacabelos R (2012) Resting-state network disruption and APOE ge-notype in Alzheimer’s disease: a lagged functional connectivity study.PLoS One 7:e46289. CrossRef Medline
Cao L, Schrank BR, Rodriguez S, Benz EG, Moulia TW, Rickenbacher GT,Gomez AC, Levites Y, Edwards SR, Golde TE, Hyman BT, Barnea G,Albers MW (2012) A� alters the connectivity of olfactory neurons in theabsence of amyloid plaques in vivo. Nat Commun 3:1009. CrossRefMedline
Castellani RJ, Smith MA, Perry G, Friedland RP (2004) Cerebral amyloidangiopathy: major contributor or decorative response to Alzheimer’s dis-ease pathogenesis. Neurobiol Aging 25:599 – 602; discussion 603– 604.CrossRef Medline
Damoiseaux JS, Rombouts SA, Barkhof F, Scheltens P, Stam CJ, Smith SM,Beckmann CF (2006) Consistent resting-state networks across healthysubjects. Proc Natl Acad Sci U S A 103:13848 –13853. CrossRef Medline
Glover GH, Li TQ, Ress D (2000) Image-based method for retrospectivecorrection of physiological motion effects in fMRI: RETROICOR. MagnReson Med 44:162–167. CrossRef Medline
Gordon MN, Holcomb LA, Jantzen PT, DiCarlo G, Wilcock D, Boyett KW,Connor K, Melachrino J, O’Callaghan JP, Morgan D (2002) Timecourse of the development of Alzheimer-like pathology in the doublytransgenic PS1�APP mouse. Exp Neurol 173:183–195. CrossRef Medline
Greicius MD, Krasnow B, Reiss AL, Menon V (2003) Functional connectiv-ity in the resting brain: a network analysis of the default mode hypothesis.Proc Natl Acad Sci U S A 100:253–258. CrossRef Medline
Greicius MD, Srivastava G, Reiss AL, Menon V (2004) Default-mode net-work activity distinguishes Alzheimer’s disease from healthy aging: evi-
dence from functional MRI. Proc Natl Acad Sci U S A 101:4637– 4642.CrossRef Medline
Hebert F, Grand’maison M, Ho MK, Lerch JP, Hamel E, Bedell BJ (2013)Cortical atrophy and hypoperfusion in a transgenic mouse model of Alz-heimer’s disease. Neurobiol Aging 34:1644 –1652. CrossRef Medline
Hedden T, Van Dijk KR, Becker JA, Mehta A, Sperling RA, Johnson KA,Buckner RL (2009) Disruption of functional connectivity in clinicallynormal older adults harboring amyloid burden. J Neurosci 29:12686 –12694. CrossRef Medline
Iwatsubo T, Odaka A, Suzuki N, Mizusawa H, Nukina N, Ihara Y (1994)Visualization of A beta 42(43) and A beta 40 in senile plaques with end-specific A beta monoclonals: evidence that an initially deposited species isA beta 42(43). Neuron 13:45–53. CrossRef Medline
Johnson KA, Fox NC, Sperling RA, Klunk WE (2012) Brain imaging in Alz-heimer disease. Cold Spring Harb Perspect Med 2:a006213. CrossRefMedline
Jonckers E, Delgado YPR, Shah D, Guglielmetti C, Verhoye M, Van der Lin-den A (2013) Different anesthesia regimes modulate the functionalconnectivity outcome in mice. Magn Reson Med. Advance online publi-cation. Retrieved April 9, 2014. doi:10.1002/mrm.24990. CrossRefMedline
Klohs J, Deistung A, Schweser F, Grandjean J, Dominietto M, Waschkies C,Nitsch RM, Knuesel I, Reichenbach JR, Rudin M (2011) Detection ofcerebral microbleeds with quantitative susceptibility mapping in theArcA� mouse model of cerebral amyloidosis. J Cereb Blood Flow Metab31:2282–2292. CrossRef Medline
Klohs J, Baltes C, Princz-Kranz F, Ratering D, Nitsch RM, Knuesel I, Rudin M(2012) Contrast-enhanced magnetic resonance microangiography re-veals remodeling of the cerebral microvasculature in transgenic ArcA�mice. J Neurosci 32:1705–1713. CrossRef Medline
Knobloch M, Farinelli M, Konietzko U, Nitsch RM, Mansuy IM (2007a)A� oligomer-mediated long-term potentiation impairment involves pro-tein phosphatase 1-dependent mechanisms. J Neurosci 27:7648 –7653.CrossRef Medline
Knobloch M, Konietzko U, Krebs DC, Nitsch RM (2007b) Intracellular A�and cognitive deficits precede beta-amyloid deposition in transgenicarcA� mice. Neurobiol Aging 28:1297–1306. CrossRef Medline
Kotani N, Akaike N (2013) The effects of volatile anesthetics on synapticand extrasynaptic GABA-induced neurotransmission. Brain Res Bull 93:69 –79. CrossRef Medline
Krantic S, Isorce N, Mechawar N, Davoli MA, Vignault E, Albuquerque M,Chabot JG, Moyse E, Chauvin JP, Aubert I, McLaurin J, Quirion R (2012)Hippocampal GABAergic neurons are susceptible to amyloid-� toxicityin vitro and are decreased in number in the Alzheimer’s diseaseTgCRND8 mouse model. J Alzheimers Dis 29:293–308. CrossRef Medline
Kuchibhotla KV, Goldman ST, Lattarulo CR, Wu HY, Hyman BT, Bacskai BJ(2008) A� plaques lead to aberrant regulation of calcium homeostasis invivo resulting in structural and functional disruption of neuronal net-works. Neuron 59:214 –225. CrossRef Medline
Liang Z, King J, Zhang N (2011) Uncovering intrinsic connectional archi-tecture of functional networks in awake rat brain. J Neurosci 31:3776 –3783. CrossRef Medline
Mengler L, Khmelinskii A, Diedenhofen M, Po C, Staring M, Lelieveldt BP,Hoehn M (2014) Brain maturation of the adolescent rat cortex andstriatum: changes in volume and myelination. Neuroimage 84:35– 44.CrossRef Medline
Merlini M, Meyer EP, Ulmann-Schuler A, Nitsch RM (2011) Vascular beta-amyloid and early astrocyte alterations impair cerebrovascular functionand cerebral metabolism in transgenic arcA� mice. Acta Neuropathol122:293–311. CrossRef Medline
Meyer EP, Ulmann-Schuler A, Staufenbiel M, Krucker T (2008) Alteredmorphology and 3D architecture of brain vasculature in a mouse modelfor Alzheimer’s disease. Proc Natl Acad Sci U S A 105:3587–3592.CrossRef Medline
Mucke L, Selkoe DJ (2012) Neurotoxicity of amyloid �-protein: synapticand network dysfunction. Cold Spring Harb Perspect Med 2:a006338.CrossRef Medline
Nicholson RM, Kusne Y, Nowak LA, LaFerla FM, Reiman EM, Valla J (2010)Regional cerebral glucose uptake in the 3xTG model of Alzheimer’s dis-ease highlights common regional vulnerability across AD mouse models.Brain Res 1347:179 –185. CrossRef Medline
13788 • J. Neurosci., October 8, 2014 • 34(41):13780 –13789 Grandjean et al. • rs-fMRI in ArcA� Model of Alzheimer’s Disease
Nicolakakis N, Hamel E (2011) Neurovascular function in Alzheimer’s dis-ease patients and experimental models. J Cereb Blood Flow Metab 31:1354 –1370. CrossRef Medline
Princz-Kranz FL, Mueggler T, Knobloch M, Nitsch RM, Rudin M (2010)Vascular response to acetazolamide decreases as a function of age in thearcA� mouse model of cerebral amyloidosis. Neurobiol Dis 40:284 –292.CrossRef Medline
Raichle ME, MacLeod AM, Snyder AZ, Powers WJ, Gusnard DA, ShulmanGL (2001) A default mode of brain function. Proc Natl Acad Sci U S A98:676 – 682. CrossRef Medline
Rombouts SA, Barkhof F, Goekoop R, Stam CJ, Scheltens P (2005) Alteredresting state networks in mild cognitive impairment and mild Alzhei-mer’s disease: an fMRI study. Hum Brain Mapp 26:231–239. CrossRefMedline
Sheline YI, Morris JC, Snyder AZ, Price JL, Yan Z, D’Angelo G, Liu C, Dixit S,Benzinger T, Fagan A, Goate A, Mintun MA (2010a) APOE4 allele dis-rupts resting state fMRI connectivity in the absence of amyloid plaques ordecreased CSF A�42. J Neurosci 30:17035–17040. CrossRef Medline
Sheline YI, Raichle ME, Snyder AZ, Morris JC, Head D, Wang S, Mintun MA(2010b) Amyloid plaques disrupt resting state default mode network
connectivity in cognitively normal elderly. Biol Psychiatry 67:584 –587.CrossRef Medline
Shu X, Qin YY, Zhang S, Jiang JJ, Zhang Y, Zhao LY, Shan D, Zhu WZ (2013)Voxel-based diffusion tensor imaging of an APP/PS1 mouse model ofAlzheimer’s disease. Mol Neurobiol 48:78 – 83. CrossRef Medline
Sorg C, Riedl V, Muhlau M, Calhoun VD, Eichele T, Laer L, Drzezga A, ForstlH, Kurz A, Zimmer C, Wohlschlager AM (2007) Selective changes ofresting-state networks in individuals at risk for Alzheimer’s disease. ProcNatl Acad Sci U S A 104:18760 –18765. CrossRef Medline
Sperling RA, Laviolette PS, O’Keefe K, O’Brien J, Rentz DM, Pihlajamaki M,Marshall G, Hyman BT, Selkoe DJ, Hedden T, Buckner RL, Becker JA,Johnson KA (2009) Amyloid deposition is associated with impaired de-fault network function in older persons without dementia. Neuron 63:178 –188. CrossRef Medline
Stebbins GT, Murphy CM (2009) Diffusion tensor imaging in Alzheimer’s dis-ease and mild cognitive impairment. Behav Neurol 21:39–49. CrossRef Medline
Weller RO, Massey A, Newman TA, Hutchings M, Kuo YM, Roher AE(1998) Cerebral amyloid angiopathy: amyloid beta accumulates in puta-tive interstitial fluid drainage pathways in Alzheimer’s disease. Am JPathol 153:725–733. CrossRef Medline
Grandjean et al. • rs-fMRI in ArcA� Model of Alzheimer’s Disease J. Neurosci., October 8, 2014 • 34(41):13780 –13789 • 13789
Related Documents