1 CEEDS: A Cost Effective Event Detection System for Energy Efficient Railway Bridge Monitoring with Wireless Sensor Network Soumendu Kumar Ghosh 1, *, Suman Maroju 1 , Raja Datta 1 and Prabir Kumar Biswas 1 1 Department of Electronics and Electrical Communication Engineering, Indian Institute of Technology Kharagpur, India Abstract Railway Bridge Health Monitoring (RHM) is of prime importance as damages in bridges can lead to huge casualties. Wireless sensor network (WSN) has come up as a promising technology for health monitoring. WSN has severe energy and hardware constraints. In this paper, we propose an event detection system for WSN deployed for RHM. Our proposed system takes different constraints of sensor networks into consideration and efficiently uses the limited resources of sensors. The system keeps the sensors awake only during the time a train passes over the bridge and in sleep mode otherwise. The real time exponential moving average of the vibration signal of a sensor placed on the railway track is computed by our algorithm and the arrival of the train is detected if consecutive series of samples lie within two threshold bounds. Theoretical and experimental results indicate that our proposed system can considerably increase the service lifetime of sensor networks and aid in automating the RHM. Keywords: event detection, wireless sensor network, railway bridge health monitoring, threshold, simple moving average, exponential moving average. Received on -XQH , accepted on 1RYHPEHU , published on 0D\ Copyright © 201 Soumendu Kumar Ghosh et al., licensed to ($,. This is an open access article distributed under the terms of the Creative Commons Attribution licence (http://creativecommons.org/licenses/by/3.0/), which permits unlimited use, distribution and reproduction in any medium so long as the original work is properly cited. doi: 10.4108/HDL 1. Introduction Due to the thriving development of mobile communications and wireless networking in recent years, applications of wireless sensor network (WSN) for sensing and monitoring parameters in different fields have increased enormously [1]. Akylidiz et al. [2] have stated that WSN consists of a large number of nodes that are deployed to sense various phenomena. Essentially, small nodes with sensing ability, limited computation and communication capability constitutes a WSN. It is mostly an autonomous system with severe energy constraints [3] [4] [5]. The performance of WSN is governed by the hardware, wireless radio communication characteristics, the battery of the sensor nodes, time synchronization, etc. [2], [3]. Applications of WSN extend from military movement tracking, environment monitoring, vehicle tracking, habitat monitoring, etc. In * Corresponding author. Email: [email protected] recent years, WSN has turned out to be a promising technology for structural health monitoring (SHM) [6] [7]. Monitoring basically involves sensor data acquisition, data transfer and data management, data analysis and interpretation. Some recent works in this field are reported in [8] [9] [10]. Bridge health monitoring (BHM) falls under the larger domain of SHM. Bridge Health Monitoring (BHM) is a practice capable of producing a detailed assessment of the progression of the bridge’s health condition during all its life. Such a detailed knowledge database can produce savings through an optimization of the maintenance intervention and through the possibility of extending the life of the infrastructure while at the same time keeping an optimal safety level. An effective BHM system can detect various defects and monitor strain, stress, temperature and other structural parameters in real time. BHM may be classified based on a time frame of monitoring into the following subcategories: short term and long term. EAI European Alliance for Innovation on Future Internet - 201 | Volume | Issue | e3 EAI Endorsed Transactions on )XWXUH ,QWHUQHW Research Article

Welcome message from author
This document is posted to help you gain knowledge. Please leave a comment to let me know what you think about it! Share it to your friends and learn new things together.
Transcript
1
CEEDS: A Cost Effective Event Detection System for Energy Efficient Railway Bridge Monitoring with Wireless Sensor Network Soumendu Kumar Ghosh1,*, Suman Maroju1, Raja Datta1 and Prabir Kumar Biswas1
1Department of Electronics and Electrical Communication Engineering, Indian Institute of Technology Kharagpur, India
Abstract
Railway Bridge Health Monitoring (RHM) is of prime importance as damages in bridges can lead to huge casualties. Wireless sensor network (WSN) has come up as a promising technology for health monitoring. WSN has severe energy and hardware constraints. In this paper, we propose an event detection system for WSN deployed for RHM. Our proposed system takes different constraints of sensor networks into consideration and efficiently uses the limited resources of sensors. The system keeps the sensors awake only during the time a train passes over the bridge and in sleep mode otherwise. The real time exponential moving average of the vibration signal of a sensor placed on the railway track is computed by our algorithm and the arrival of the train is detected if consecutive series of samples lie within two threshold bounds. Theoretical and experimental results indicate that our proposed system can considerably increase the service lifetime of sensor networks and aid in automating the RHM.
Keywords: event detection, wireless sensor network, railway bridge health monitoring, threshold, simple moving average, exponential moving average.
Received on , accepted on , published on
Copyright © 201 Soumendu Kumar Ghosh et al., licensed to . This is an open access article distributed under the terms of the Creative Commons Attribution licence (http://creativecommons.org/licenses/by/3.0/), which permits unlimited use, distribution and reproduction in any medium so long as the original work is properly cited.
doi: 10.4108/
1. Introduction
Due to the thriving development of mobile communications and wireless networking in recent years, applications of wireless sensor network (WSN) for sensing and monitoring parameters in different fields have increased enormously [1]. Akylidiz et al. [2] have stated that WSN consists of a large number of nodes that are deployed to sense various phenomena. Essentially, small nodes with sensing ability, limited computation and communication capability constitutes a WSN. It is mostly an autonomous system with severe energy constraints [3] [4] [5]. The performance of WSN is governed by the hardware, wireless radio communication characteristics, the battery of the sensor nodes, time synchronization, etc. [2], [3]. Applications of WSN extend from military movement tracking, environment monitoring, vehicle tracking, habitat monitoring, etc. In
*Corresponding author. Email: [email protected]
recent years, WSN has turned out to be a promising technology for structural health monitoring (SHM) [6] [7]. Monitoring basically involves sensor data acquisition, data transfer and data management, data analysis and interpretation. Some recent works in this field are reported in [8] [9] [10]. Bridge health monitoring (BHM) falls under the larger domain of SHM. Bridge Health Monitoring (BHM) is a practice capable of producing a detailed assessment of the progression of the bridge’s health condition during all its life. Such a detailed knowledge database can produce savings through an optimization of the maintenance intervention and through the possibility of extending the life of the infrastructure while at the same time keeping an optimal safety level. An effective BHM system can detect various defects and monitor strain, stress, temperature and other structural parameters in real time. BHM may be classified based on a time frame of monitoring into the following subcategories: short term and long term.
EAIEuropean Alliancefor Innovation
on
Future Internet - 201 | Volume | Issue | e3
EAI Endorsed Transactions on Research Article
S. K. Ghosh, S. Maroju, R. Datta and P. K. Biswas
2
There are two operational paradigms of data collection [11] [12] in BHM using WSN, viz. continuous data-gathering and event-driven data collection. The former method periodically reports sensor data to a remote base station while the latter one sends data upon the occurrence of an intended event.
An event is defined as any change in the state of the system from its normal undisturbed state. In a wireless sensor network, we need to effectively and accurately determine the occurrence of an intended event with a distinguishable characteristic in a specific time interval. We will refer to this process as event detection.
Our intended field of application is long term railway bridge health monitoring using WSN [13]. In our application, accelerometer sensors will be installed on the railway bridge and train induced vibration data will be collected by the sensors every time a train passes over the bridge. The data will be sent to a remote server for further processing and analysis. This analysis will lead to damage detection, damage localization and estimation of damage severity. In this way, the health of the bridge can be monitored for an extended period of time. Since we are focusing on long term monitoring, issues of long term operation of WSN need to be looked upon.
In most countries with large railway network (e.g., Indian Railways, Russian Railways (RZD), etc.), the bridges are situated in remote locations where there is no source of electricity. Hence, the wireless sensors if installed on these bridges will have no power other than their own battery. It may be noted that for long term monitoring of bridges, these wireless sensors may need to operate for an extended period of time without human intervention. So, an energy efficient solution is very essential to increase the battery life of the sensors, which in turn will increase the service lifetime of the WSN as a whole. Usually, the longevity of the sensor nodes depends on the type of battery and the battery’s ampere-hour rating. Sensors available commercially can operate approximately for a duration of 1 day to 2 months before their internal batteries need replacement or recharging. The longevity of the batteries depends upon the frequency of usage and some other factors like sampling rate and number of active channels [14]. So, we need to optimize between various parameters like accuracy, resolution, sampling rate, operation period, reliability, etc.
Power consumption of the network can be drastically reduced in event driven application scenario by keeping the network in operation only during an intended event, while the rest of the time, it will remain in sleep mode. In sleep mode, power consumption of the nodes is in the range of milliwatts /micro watts [14]. In our application, keeping the sensors on the bridge in data collection mode only during the time interval when the train is on the bridge (i.e. once an event is detected) can save a lot of power and improve the longevity of the network.
A cost effective event detection system should be simple in terms of its hardware and software requirements yet able to detect the event with accuracy and minimal time delay by utilizing the available resources efficiently. The event needs to be detected with minimum time lag, so the algorithm
should have minimum time complexity. Event detection designed should not give false positives or false negatives.
In this paper, we are proposing a cost effective automated event detection system for railway bridge monitoring which can extend the service lifetime of the wireless sensor network adhering to all the points mentioned above. In this system, two sets of sensors will be used for monitoring. One set of sensors called master sensors will be assigned the task of event detection, i.e. detection of a train approaching a bridge and another set of sensors called child sensors that are placed on the bridge will be activated by the master sensors only when the desired event is detected. The underlying algorithm for detecting the train arrival event is based on the concept of moving average and corresponding threshold bounds.
2. Related Work
Prior work has been done in the field of event detection for WSN. Researchers have either used data from a single sensor for event detection or they have designed distributed event detection schemes using data from multiple sensors. R. Bischoff et al. [15] have used a single MEMS accelerometer sensor to measure the acceleration of a bridge continuously. In their bridge monitoring system, data recording is initiated once the accelerometer data crosses a fixed threshold value. Similar works based only on few sensor data points for calculation of threshold and subsequent event detection can be found in [16]. The underlying algorithm of these types of event detection system is based on magnitude difference. This is the simplest form of an algorithm, where the difference between amplitude of two time slots can be used to check if a threshold is crossed to trigger an event. The major drawback of these systems and algorithms is that the presence of noise in the signal at a particular time slot can raise the signal value above the threshold giving false positives. Hence systems relying on only one threshold values are not reliable.
Short term energy method [17] is another method where the energy of the signal is used instead of the magnitude to detect an event. The ratio between the energy of two nearby windows forms the basis of its algorithm. However, this method is also prone to noise as in some cases, energy of background noise may subdue the energy of the actual event. This will lead to the generation of false positives. Slope of the signal envelope is used as the event indicator in SURF method proposed by Pauws [18]. The slope is calculated using a quadratic polynomial. The estimation of the coefficients of a polynomial expression is quite time consuming, hence, this method is not suitable for time critical applications. Event detection can also be done by analysing the signal in the frequency domain. High-frequency content (HFC) method proposed by Maris and Bateman in [19] is one such detection method which is also prone to failure if affected by background noise.
Distributed event detection schemes employ multiple sensors for the detection [20]. In one such scheme proposed by Norman Dziengel et al. [21], different fusion techniques viz. feature fusion, classification fusion, cooperative fusion are used. However, their system is unable to differentiate
EAIEuropean Alliancefor Innovation
on
Future Internet - 201 | Volume | Issue | e3
CEEDS: A Cost Effective Event Detection System for Energy Efficient Railway Bridge Monitoring with Wireless Sensor Network
3
between trained and non-trained patterns. In the case of event detection of train arrival, it is essential to differentiate between train signals used to train the system and noise signals.
Some researchers have proposed region matching [22] and envelope matching technique [23] for detecting an event. Dimensionality reduction techniques like principal component analysis (PCA) have been used by Jayant Gupchup et al. to reduce the model for event detection. [24]. K. Kapitanova et al. have used fuzzy logic to evaluate the threshold for event detection [25]. However, rule-base in fuzzy logic starts increasing in size exponentially and storing fuzzy rule-bases in WSN which has limited power and memory resource is a challenge [26].
Artificial neural networks and ARIMA based statistical methods have been used successfully in many event detection scenarios [27]. Both of them require the system to be trained before its actual operation and the training require huge amount of data. These methods are also time consuming and difficult to implement on low configuration hardware of the WSN. Some other popular techniques use classification algorithms like Naïve Bayes classifiers [28]. These techniques are computationally complex and have high communication overhead which in turn affects the service lifetime of the WSN as a whole.
3. System Model
3.1. Wireless Sensor Network
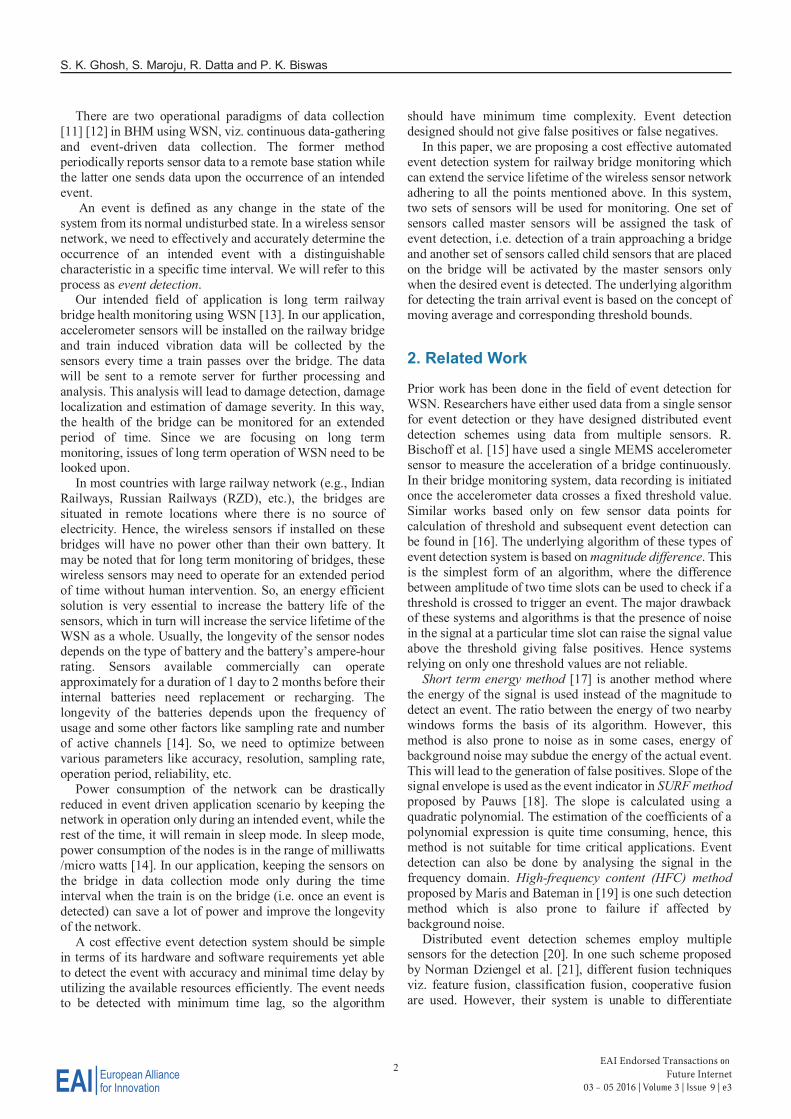
Wireless sensor network may either be centralized or distributed. The centralized system uses star type of connectivity, whereas distributed system uses mesh connectivity. Figure 1 shows the network architecture of a star type of wireless sensor network [29]. The WSN consists of wireless sensor nodes which form an ad hoc network within themselves or communicate with a centralized base station or data aggregator. The base station controls all the node connectivity and configures them to sense environmental parameters. The communication between the
sensor nodes and the base station is achieved by using a wireless ZigBee protocol [30] [31], or IEEE 802.15.4-open communication architecture. Real time monitoring system [32] uses the communication between the base station and remote server using Code Division Multiple Access (CDMA) [30] or Global System for Mobile Communications (GSM) /General Packet Radio Service (GPRS) /3rd Generation (3G) or Ethernet technologies. The network architecture shown in Figure 1 shows that the sensors N1 to NP and M1 to MP communicate with different base stations or data aggregators. The base stations using Internet Protocol (IP) network transmit the sensor data to the centralized server where further processing is done. The processed data is used to generate warnings or messages [33] [34].
The sensor nodes can send the data to base station either using low duty cycle operation or using synchronized sampling [5]. However, in low duty cycle, reception of packets is not guaranteed. The important parameter that determines the accuracy of the received sensor signal is sampling frequency. More the sampling frequency, the more is the power consumption.
Another parameter that determines the battery life of the sensor is the power level at which sensor transmit [3]. This power level is determined by the node and base station firmware depending upon the distance between them or it can also be manually set up by the user. Since, the packet losses [12] are directly proportional to the distance between the base station and the sensor, one can easily understand that more power is required to transmit packets reliably to greater distances.
As stated earlier, sensors send data to a data logger or base station. Figure 2 shows the basic workflow of WSN system.
Figure 1. Network Architecture of Wireless Sensor Network
Figure 2. Workflow of Wireless Sensor Network
EAIEuropean Alliancefor Innovation
on
Future Internet - 201 | Volume | Issue | e3
S. K. Ghosh, S. Maroju, R. Datta and P. K. Biswas
4
The base station is used to first configure the sensors and the network before actual data collection begins. The configurable options present in any data logger of a WSN are modes of sampling like synchronized sampling and low duty cycle, control options like stop nodes, sleep node and wake node, sampling frequency, power level for the different radio ranges, etc. Event driven Triggering option is also present in some advanced sensors, but with they have limited functionality. Once the network is configured, the system waits for the event and starts streaming data when an event occurs. The end of the event is followed by data transfer to the remote storage centre.
3.2. Event Detection System
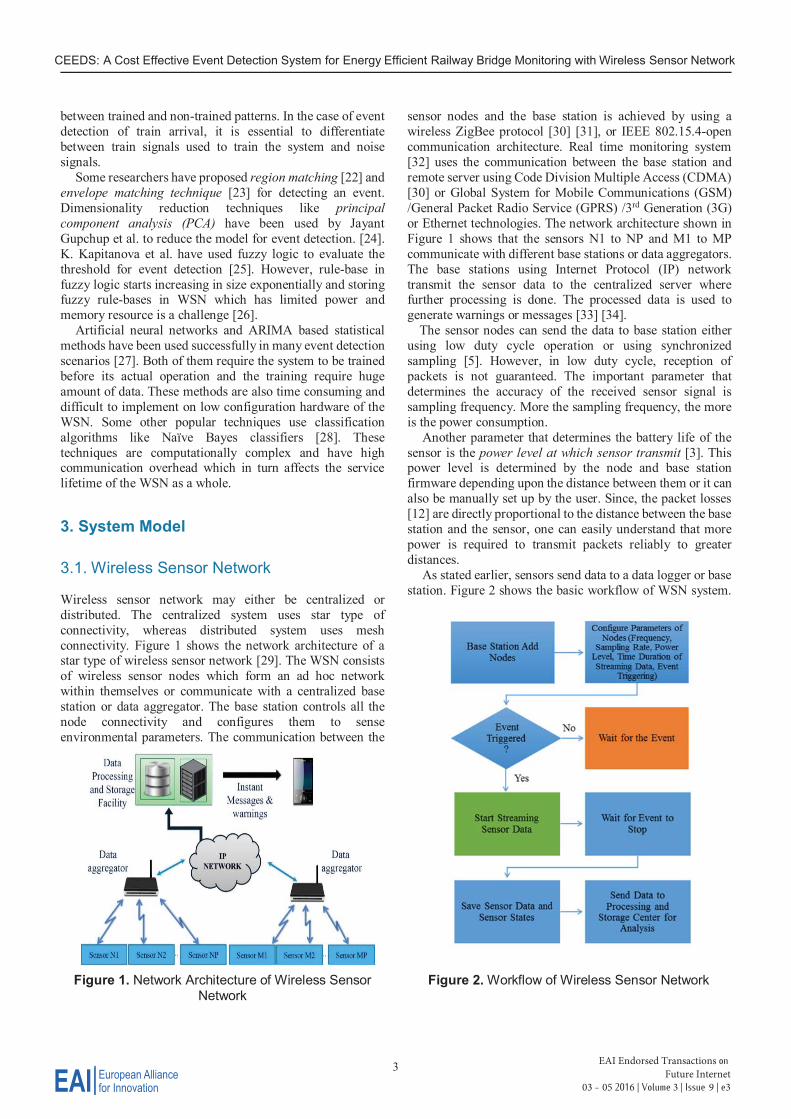
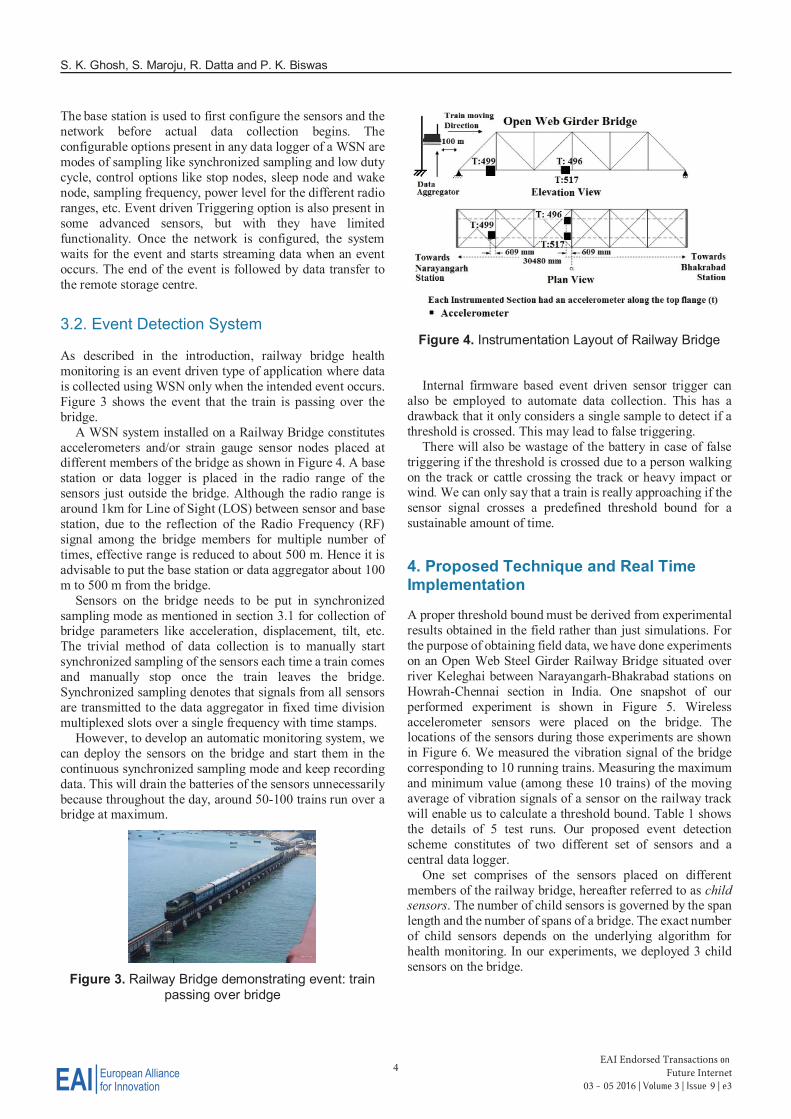
As described in the introduction, railway bridge health monitoring is an event driven type of application where data is collected using WSN only when the intended event occurs. Figure 3 shows the event that the train is passing over the bridge.
A WSN system installed on a Railway Bridge constitutes accelerometers and/or strain gauge sensor nodes placed at different members of the bridge as shown in Figure 4. A base station or data logger is placed in the radio range of the sensors just outside the bridge. Although the radio range is around 1km for Line of Sight (LOS) between sensor and base station, due to the reflection of the Radio Frequency (RF) signal among the bridge members for multiple number of times, effective range is reduced to about 500 m. Hence it is advisable to put the base station or data aggregator about 100 m to 500 m from the bridge.
Sensors on the bridge needs to be put in synchronized sampling mode as mentioned in section 3.1 for collection of bridge parameters like acceleration, displacement, tilt, etc. The trivial method of data collection is to manually start synchronized sampling of the sensors each time a train comes and manually stop once the train leaves the bridge. Synchronized sampling denotes that signals from all sensors are transmitted to the data aggregator in fixed time division multiplexed slots over a single frequency with time stamps.
However, to develop an automatic monitoring system, we can deploy the sensors on the bridge and start them in the continuous synchronized sampling mode and keep recording data. This will drain the batteries of the sensors unnecessarily because throughout the day, around 50-100 trains run over a bridge at maximum.
Figure 3. Railway Bridge demonstrating event: train passing over bridge
Figure 4. Instrumentation Layout of Railway Bridge
Internal firmware based event driven sensor trigger can also be employed to automate data collection. This has a drawback that it only considers a single sample to detect if a threshold is crossed. This may lead to false triggering.
There will also be wastage of the battery in case of false triggering if the threshold is crossed due to a person walking on the track or cattle crossing the track or heavy impact or wind. We can only say that a train is really approaching if the sensor signal crosses a predefined threshold bound for a sustainable amount of time.
4. Proposed Technique and Real TimeImplementation
A proper threshold bound must be derived from experimental results obtained in the field rather than just simulations. For the purpose of obtaining field data, we have done experiments on an Open Web Steel Girder Railway Bridge situated over river Keleghai between Narayangarh-Bhakrabad stations on Howrah-Chennai section in India. One snapshot of our performed experiment is shown in Figure 5. Wireless accelerometer sensors were placed on the bridge. The locations of the sensors during those experiments are shown in Figure 6. We measured the vibration signal of the bridge corresponding to 10 running trains. Measuring the maximum and minimum value (among these 10 trains) of the moving average of vibration signals of a sensor on the railway track will enable us to calculate a threshold bound. Table 1 shows the details of 5 test runs. Our proposed event detection scheme constitutes of two different set of sensors and a central data logger.
One set comprises of the sensors placed on different members of the railway bridge, hereafter referred to as child sensors. The number of child sensors is governed by the span length and the number of spans of a bridge. The exact number of child sensors depends on the underlying algorithm for health monitoring. In our experiments, we deployed 3 child sensors on the bridge.
EAIEuropean Alliancefor Innovation
on
Future Internet - 201 | Volume | Issue | e3

5
Figure 6. Snapshots of sensors located on the bridge members
Table 1. Details of experimental setup for collection of sensor data at sample rate 256 Hz
Train Time Speed Weight ofTrain
Sensor Locations
Express 11.45am 110
22 Coaches (23 tons each) + Engine (123 tons)
2nd Span, Open web girder: 1 on Left Stringer at Mid Span, 1 on Right Stringer at Mid Span, 1 on Right Stringer near 2nd Cross Girder
Goods (empty)
12.10 pm 75
58+1 Match truck (1500 ton total) + Engine (120 tons)
Goods (empty)
12.20 pm 75
42+1 (1060 ton total) + Engine (110 tons)
Express 12.50pm 110
15 Coaches (23 tons each) + Engine (120 tons)
2nd Span, Open web girder: 1 on 4th Cross Girder (left) 1 on 4th Cross Girder (right) 1 on Right Stringer near 2nd Cross Girder
Express 1.25pm 110
15 Coaches (23 tons each) + Engine (120 tons)
Figure 7. Network topology of proposed scheme showing star type connectivity between data logger,
master sensors and child sensors
The other set of sensors comprises of two low power accelerometer sensors placed at a distance of 300 m and 400 m away from the bridge on the railway track, hereafter referred to as master sensors. Both these sets of sensors connect to data logger acting as a central hub in a star type topology as shown in Figure 7. The reason for the selection of distance of 300 m and 400 m as the location of placement of master sensors will be explained later.
The two master nodes work in event driven sensor trigger mode. They turn on and start synchronized sampling once a predefined threshold (firmware based threshold - set in the master node firmware) is crossed at the respective sensors. The master sensors send data to the data logger in real time. The microcomputer or microcontroller directly accesses the real time samples and computes the average of samples over a fixed window size to determine the threshold at each time instant (tick). Exponential window averaging technique is applied from the start and continues finding the average of the samples by shifting the window periodically. Our algorithm will simultaneously check if 90% samples of a window of size 128 fall within the upper and lower bound of the threshold. If this criteria is satisfied at both the master sensors within a predefined interval depending on the speed of the train, then we can infer that train has approached. The algorithm will indicate the base station to send a wake-up signal to all the sleeping child sensors on the bridge. Subsequently, the base station will command the sensors to start synchronized sampling and thus data will be stored in base station/data aggregator.
The base station continuously monitors the value of vibration (acceleration) of some of the child sensors present at the leaving end of the bridge. Once the train has left the bridge, damped vibration will be detected. The acceleration value will subsequently reduce to zero after some time. At the instant the base station detects zero acceleration, it will put all the child sensors in sleep mode.
Many practical issues cropped up while implementing this technique. The speed of trains in Indian Railways is about 59 km/h to 93 km/h [35]. However, the train speed may extend up to 140 km/h when it is driven by the newer high speed locomotives WAP-7 [36]. Hence the detection mechanism must be able to detect trains with speeds varying throughout
Figure 5. Passage of train over Narayangarh Bridge (Bridge No. 168) during experimentation
EAIEuropean Alliancefor Innovation
on
Future Internet - 201 | Volume | Issue | e3
CEEDS: A Cost Effective Event Detection System for Energy Efficient Railway Bridge Monitoring with Wireless Sensor Network
S. K. Ghosh, S. Maroju, R. Datta and P. K. Biswas
6
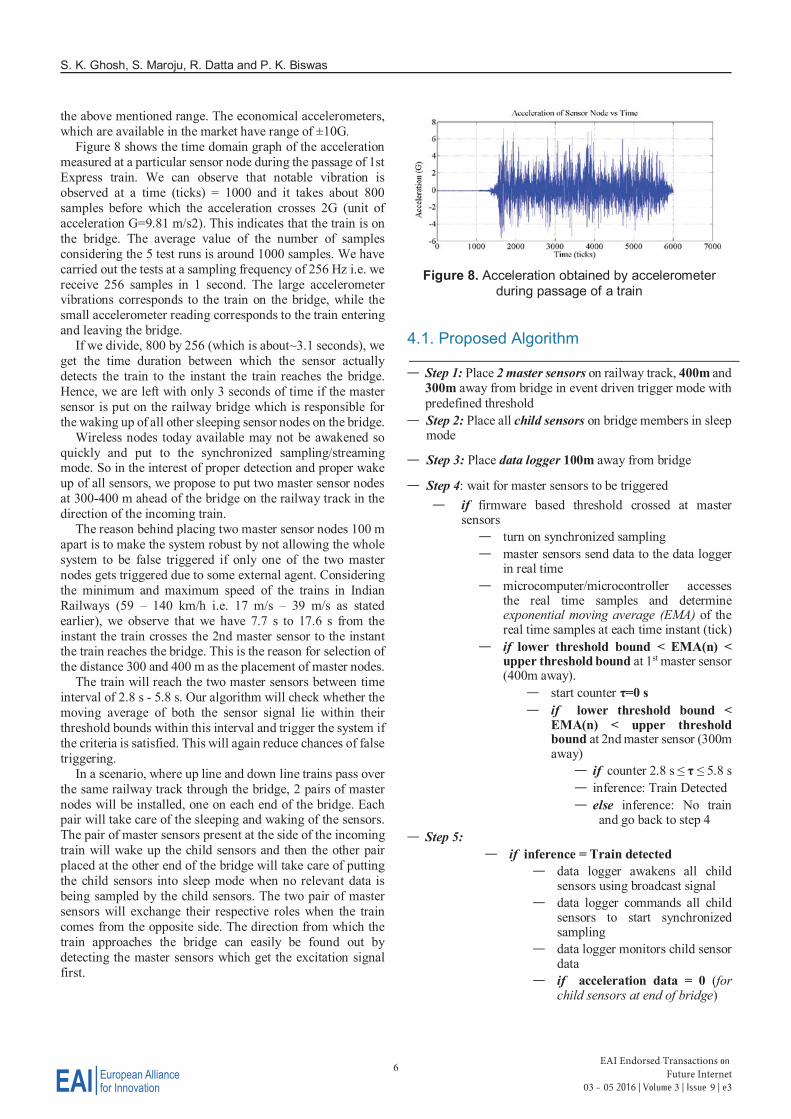
the above mentioned range. The economical accelerometers, which are available in the market have range of ±10G.
Figure 8 shows the time domain graph of the acceleration measured at a particular sensor node during the passage of 1st Express train. We can observe that notable vibration is observed at a time (ticks) = 1000 and it takes about 800 samples before which the acceleration crosses 2G (unit of acceleration G=9.81 m/s2). This indicates that the train is on the bridge. The average value of the number of samples considering the 5 test runs is around 1000 samples. We have carried out the tests at a sampling frequency of 256 Hz i.e. we receive 256 samples in 1 second. The large accelerometer vibrations corresponds to the train on the bridge, while the small accelerometer reading corresponds to the train entering and leaving the bridge.
If we divide, 800 by 256 (which is about~3.1 seconds), we get the time duration between which the sensor actually detects the train to the instant the train reaches the bridge. Hence, we are left with only 3 seconds of time if the master sensor is put on the railway bridge which is responsible for the waking up of all other sleeping sensor nodes on the bridge.
Wireless nodes today available may not be awakened so quickly and put to the synchronized sampling/streaming mode. So in the interest of proper detection and proper wake up of all sensors, we propose to put two master sensor nodes at 300-400 m ahead of the bridge on the railway track in the direction of the incoming train.
The reason behind placing two master sensor nodes 100 m apart is to make the system robust by not allowing the whole system to be false triggered if only one of the two master nodes gets triggered due to some external agent. Considering the minimum and maximum speed of the trains in Indian Railways (59 – 140 km/h i.e. 17 m/s – 39 m/s as stated earlier), we observe that we have 7.7 s to 17.6 s from the instant the train crosses the 2nd master sensor to the instant the train reaches the bridge. This is the reason for selection of the distance 300 and 400 m as the placement of master nodes.
The train will reach the two master sensors between time interval of 2.8 s - 5.8 s. Our algorithm will check whether the moving average of both the sensor signal lie within their threshold bounds within this interval and trigger the system if the criteria is satisfied. This will again reduce chances of false triggering.
In a scenario, where up line and down line trains pass over the same railway track through the bridge, 2 pairs of master nodes will be installed, one on each end of the bridge. Each pair will take care of the sleeping and waking of the sensors. The pair of master sensors present at the side of the incoming train will wake up the child sensors and then the other pair placed at the other end of the bridge will take care of putting the child sensors into sleep mode when no relevant data is being sampled by the child sensors. The two pair of master sensors will exchange their respective roles when the train comes from the opposite side. The direction from which the train approaches the bridge can easily be found out by detecting the master sensors which get the excitation signal first.
Figure 8. Acceleration obtained by accelerometer during passage of a train
4.1. Proposed Algorithm
— Step 1: Place 2 master sensors on railway track, 400m and 300m away from bridge in event driven trigger mode with predefined threshold
— Step 2: Place all child sensors on bridge members in sleep mode
— Step 3: Place data logger 100m away from bridge
— Step 4: wait for master sensors to be triggered — if firmware based threshold crossed at master
sensors — turn on synchronized sampling — master sensors send data to the data logger
in real time — microcomputer/microcontroller accesses
the real time samples and determine exponential moving average (EMA) of the real time samples at each time instant (tick)
— if lower threshold bound < EMA(n) < upper threshold bound at 1st master sensor (400m away).
— start counter τ=0 s — if lower threshold bound <
EMA(n) < upper threshold bound at 2nd master sensor (300m away)
— if counter 2.8 s ≤ τ ≤ 5.8 s — inference: Train Detected — else inference: No train
and go back to step 4 — Step 5:
— if inference = Train detected — data logger awakens all child
sensors using broadcast signal — data logger commands all child
sensors to start synchronized sampling
— data logger monitors child sensor data
— if acceleration data = 0 (for child sensors at end of bridge)
EAIEuropean Alliancefor Innovation
on
Future Internet - 201 | Volume | Issue | e3
7
— data logger broadcast stop signal to all child sensors
— data logger puts all child sensors in sleep mode
— else continue monitoring sensor data
— System restored: master sensors in trigger mode, child sensors in sleep mode
The proposed algorithm uses exponential moving average for smoothing the data and getting the unique trend of train induced vibrations. The amplitude of the EMA will rise significantly only when sustained vibrations occur.
All noise signals have different trends and they do not follow the trend of train signal. In our proposed scheme, upper and lower bounds of the threshold are fixed by taking 10% margin of safety above and below the max and min EMA signals of the trains respectively.
However, in a scenario of a bridge where up line and down line trains pass over the same railway track, then 2 pairs of master nodes are installed, one on each end of the bridge. Each pair will take care of the sleeping and waking of the sensors. The pair of master sensors present at the side of the incoming train will wake up the child sensors and then the other pair placed at the other end of the bridge will take care of putting the child sensors into sleep mode when no relevant data is being sampled by the child sensors. The two pair of master sensors will exchange their respective roles when the train comes from the opposite side.
The direction from which the train approaches the bridge can easily be found out by detecting the master sensors which get the excitation signal first.
5. Selection Criteria for ExponentialSmoothing Average
Moving average is popularly used in smoothing and forecasting the trend in a time series. Moving average has found its common application in the stock markets where a trend can be obtained from the fluctuating prices. Moving average also smoothens the data and reduce the effect of noise data in the signal. Some of the most commonly used time series forecasting methods are simple moving average (SMA), exponential moving average (EMA) and double exponential moving averages (DEMA). When any moving average is applied to the absolute value of train signals, it shows a particular trend unique to them as shown in the simulation results. But certain variations can be observed due to different loading characteristics as well as different speed of the trains.
5.1. Simple Moving Average (SMA)
The simple moving average (or arithmetic mean) is the un-weighted mean of the previous n data. The equation for simple moving average is as follows:
( ) = ∑ ( ) (1)
where SMA (n) is the simple moving average of window size n and k is a variable which varies from 1 to n.
However, there are two problems associated with SMA [37].
(i) SMA only considers the data included in the selected window (e.g. SMA with a window size of 10 computed on a data takes into account only the last 10 samples and it simply ignores all other samples prior to that particular window.)
(ii) SMA also allocates equal weights to all the data in the selected window. However, it is generally argued that recently sampled data should carry more weight than older data (e.g. the most recent observation should get a little more weight than 2nd most recent, and the 2nd most recent should get a little more weight than the 3rd most recent, and so on.) This in turn will reduce the average's lag behind the actual signal.
5.2. Exponentially Moving Average (EMA)
The simplest form of exponential moving average is given by the formula: = ∙ + (1 − ) ∙ (2)
where α is the smoothing factor, and 0 < α < 1. Thus, the current smoothed value st is an interpolation between the previous smoothed value st-1 and the current observation. Here, α is a measure of the closeness of the interpolated value to the most recent observation. Also, we can say that 1/α denotes the window size.
EMA solves both problems associated with SMA. Firstly, more weight is allocated to the recent data samples, thereby reducing the lag. The weights decrease exponentially towards the past samples. Secondly, it also reflects all the past data for any particular observation. This reduces any chance of a sudden increase in the average due to noise.
For these reasons, EMA performs better than SMA.
6. Simulation Results
6.1. Simulation Results
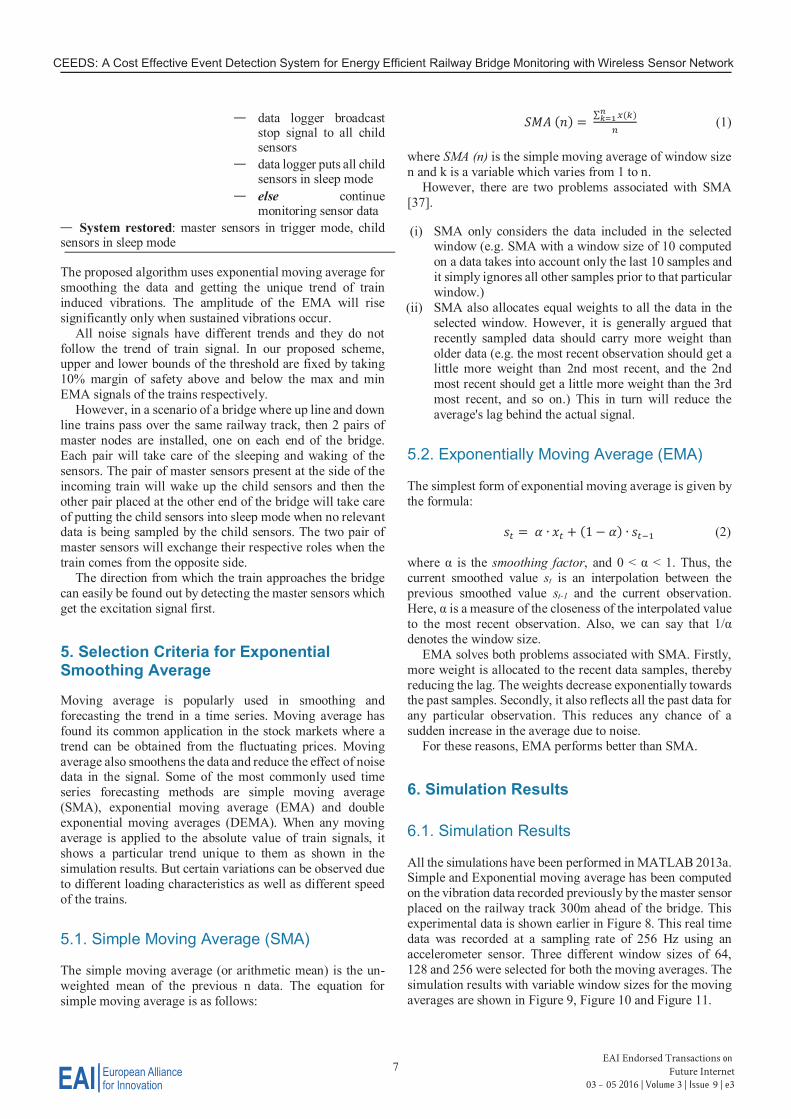
All the simulations have been performed in MATLAB 2013a. Simple and Exponential moving average has been computed on the vibration data recorded previously by the master sensor placed on the railway track 300m ahead of the bridge. This experimental data is shown earlier in Figure 8. This real time data was recorded at a sampling rate of 256 Hz using an accelerometer sensor. Three different window sizes of 64, 128 and 256 were selected for both the moving averages. The simulation results with variable window sizes for the moving averages are shown in Figure 9, Figure 10 and Figure 11.
EAIEuropean Alliancefor Innovation
on
Future Internet - 201 | Volume | Issue | e3
CEEDS: A Cost Effective Event Detection System for Energy Efficient Railway Bridge Monitoring with Wireless Sensor Network
S. K. Ghosh, S. Maroju, R. Datta and P. K. Biswas
8
Figure 9. Moving averages for window size = 64
Figure 10. Moving averages for window size = 128
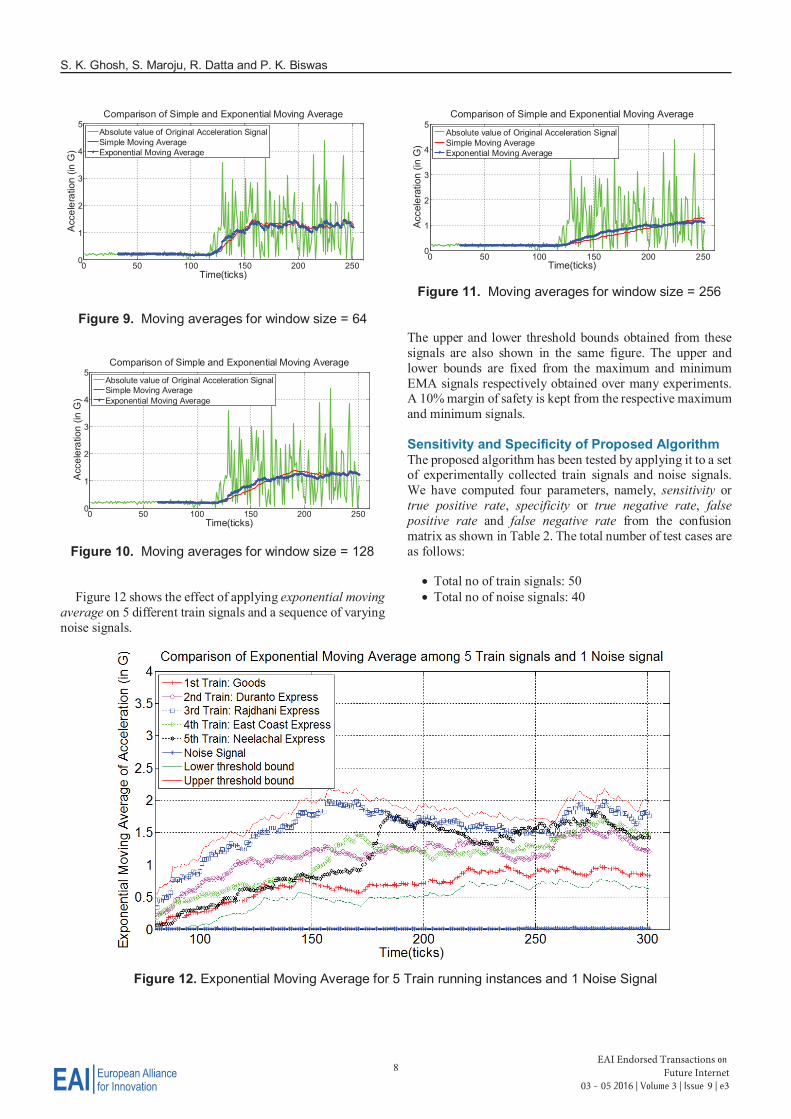
Figure 12 shows the effect of applying exponential moving average on 5 different train signals and a sequence of varying noise signals.
Figure 11. Moving averages for window size = 256
The upper and lower threshold bounds obtained from these signals are also shown in the same figure. The upper and lower bounds are fixed from the maximum and minimum EMA signals respectively obtained over many experiments. A 10% margin of safety is kept from the respective maximum and minimum signals.
Sensitivity and Specificity of Proposed Algorithm The proposed algorithm has been tested by applying it to a set of experimentally collected train signals and noise signals. We have computed four parameters, namely, sensitivity or true positive rate, specificity or true negative rate, false positive rate and false negative rate from the confusion matrix as shown in Table 2. The total number of test cases are as follows:
Total no of train signals: 50 Total no of noise signals: 40
0 50 100 150 200 2500
1
2
3
4
5
Time(ticks)
Acc
eler
atio
n (in
G)
Comparison of Simple and Exponential Moving Average
Absolute value of Original Acceleration SignalSimple Moving AverageExponential Moving Average
0 50 100 150 200 2500
1
2
3
4
5
Time(ticks)
Acc
eler
atio
n (in
G)
Comparison of Simple and Exponential Moving Average
Absolute value of Original Acceleration SignalSimple Moving AverageExponential Moving Average
0 50 100 150 200 2500
1
2
3
4
5
Time(ticks)
Acc
eler
atio
n (in
G)
Comparison of Simple and Exponential Moving Average
Absolute value of Original Acceleration SignalSimple Moving AverageExponential Moving Average
Figure 12. Exponential Moving Average for 5 Train running instances and 1 Noise Signal
EAIEuropean Alliancefor Innovation
on
Future Internet - 201 | Volume | Issue | e3

9
The elements of the confusion matrix are as follows:
True positive: Total no of train signals correctlypredicted: 49
False positive: Total no of noise signal incorrectlypredicted as train: 1
True negative: Total no of noise signal correctlypredicted: 39
False negative: Total no of train signal incorrectlypredicted as noise: 1
Table 2. Confusion Matrix for Event Detection
True Event
Total Population Event: Train Event:
Noise/No Train
Predicted Event
Predicted Event: Train TP = 49 FP = 1
Predicted Event: Noise/No Train FN = 1 TN = 39
The parameters computed from the confusion matrix are:
Sensitivity/True positive rate (TPR) = = 98%
Specificity/True negative rate (TNR) = = 97.5%
False positive rate (FPR) = = 2.5%
False negative rate (FNR) = = 2%
6.2. Comparison with Existing Schemes
We have perfomed simulation of existing detection algorithms on our experimentally collected dataset and compared their true positive rate, false positive rate and total computation time with our proposed algorithm. Table 3 depicts the comparison results.
Table 3. Comparison of Proposed Method with Existing Schemes
Method True positive rate
False positive rate
Total computation
time (s) Difference of magnitude 92% 18% 0.012
Short-term energy 75% 30% 0.011
HFC method 94% 8% 0.052 Proposed method 98 % 2.5% 0.006
The higher true positive rate and lower false positive rate for our proposed scheme as mentioned in Table 3 is due to the fact that our algorithm does not consider a single threshold unlike other methods. Moreover, the consideration of upper and lower threshold bounds also increase the accuracy of detection.
Techniques like region matching and envelope detection are inefficient to track the arrival of a train. It is seen that the envelopes of the train signals are hardly similar as these depend on variable factors like weight of the train, speed of the train, etc. Methods like fuzzy logic based event detection schemes are accurate, but real time implementation of these schemes are not viable. Methods like ARIMA and artificial neural networks are again difficult to implement low cost hardware platforms. Hence, we have not provided any quantitative assessment of these methods.
7. Experimental Results and Observations
A series of field trials were conducted at Bridge No. 168 of Narayangarh-Bhakrabad section, West Bengal, India. Master sensors were placed on the railway track 300m and 400m away from the bridge in the incoming train direction. 10 child sensors were placed on different members of the bridge for the collection of vibration signal. Figure 13 shows the placement of one master sensor on the railway track. Figure 14 shows the signal of a child sensor collected using our event detection system. Three observations can be made from the figure.
t = − 500 to t = 0: there is no signal recorded by thesensor, i.e. the sensor is in sleep mode.
t = 0: sensor starts recording data. This shows that ourevent detection system had detected an incoming trainand put the sensor in synchronized sampling mode fordata collection.
t = 2250: sensor has stopped recording data and has goneinto sleep mode as train has left the bridge.
The above experimental results and observations validates our event detection system.
Figure 15 shows a series of varying noise signals collected by the master sensor when a person was walking on the track for the duration from t = 0 to t = 600 and hitting the tracks with hammer, stones, etc. for the duration from t = 601 to t = 1000.
Figure 13. Master Sensor placed on the railway track
Accelerometer Sensor
EAIEuropean Alliancefor Innovation
on
Future Internet - 201 | Volume | Issue | e3
CEEDS: A Cost Effective Event Detection System for Energy Efficient Railway Bridge Monitoring with Wireless Sensor Network

S. K. Ghosh, S. Maroju, R. Datta and P. K. Biswas
10
Figure 14. Train signal observed after event detection
Figure 15. Noise and Exponential Moving Average
The exponential moving average computed on the noise signal is also shown in the figure. It is observed that the EMA of the noise signal lies between 0 to 0.05 G whereas the lower threshold bound shown in Figure 12 is around 0.5 G†. So, it is clear that the lower threshold bound is never crossed by the EMA of the noise. During this experiment, the child sensors were not awakened during the entire period, thus proving that the algorithm was foolproof to noise signals.
8. Discussion
8.1. Selection of EMA and Window Size (Effect on time delay)
After observing the graphs in Figures 9, 10 and 11, we can infer that SMA lags behind EMA as described in section 5.1. The graph thus validates use of EMA in our proposed algorithm. We can also infer that 128 is the ideal window size when the sampling rate is 256 Hz. We observe that curve is steepest in case of window size of 64 and the slope gradually decreases with increasing window size. So, the time lag is the least as the threshold is reached at the earliest. However, a window size of 64 indicates that we compute average of samples over one-fourth of a second (64/256 = 1/4). In case of a window size of 256, the time lag is maximum (1 second)
† G is the unit of acceleration. G = 9.81m/s2 in SI units.
which results in delaying the decision. However, the average is computed for duration of one second, which will eliminate the possibility of false triggers.
In consideration of the above factors, we finalized 128 as the optimum window size, which takes care of the accuracy of the event detection as well as ensures less time lag. Thus the window size should be half of the sampling rate.
8.2. Selection of Upper and Lower Threshold Bounds
All train signals have similar trend and they generate similar vibration signals as described in the Section 4.1. But some subtle variations among the signals are present due to different loading conditions and varying velocity of different kind of trains. To fix the threshold, a series of train vibration signals were collected and the minimum and maximum values of the exponential moving average of the signals were taken as lower and upper threshold bound respectively. A 10% safety margin above and below the maximum and minimum signals respectively were taken so that any other trains other than the observed trains can also be detected. Both the lower and upper bound threshold is compared with the EMA of the incoming signal. The system algorithm checks if 90% samples of EMA of any window of size 128 lie within these two bounds. The system will be triggered when this criteria is met. Even if EMA of any noise signal lies within these bounds, it is unlikely that about 100 or more EMA values within a window of size 128 continues to lie there.
8.3. Protection against False Trigger
The case of false triggering is also eliminated by our proposed approach in two ways. On one hand, calculating exponential moving average will ensure that in cases like men walking on the track, cattle crossing track, sudden impact, etc. will not result in the average crossing the lower threshold bound. On the other hand, the base station will wake up the sensors on the bridge only when a window of moving average for both the master sensors lies within the upper and lower threshold bound in the predefined time interval. It is highly unlikely that a person or cattle will stand or cause impact simultaneously on two master nodes which are kept 100 m apart. Thus, our event detection scheme is highly accurate and is resistant to false triggering.
8.4. Prolongation of Sensor Battery Lifetime
The proposed event detection scheme increases the service lifetime of the sensor nodes. We consider a specific scenario to evaluate the performance of our scheme.
The battery (material: lithium polymer) capacity of the 3-axis (3-channel) accelerometer sensor node used in the experimentation is 250 mAh. The average current
-500 -250 0 250 500 750 1000 1250 1500 1750 2000 2250 2500-6
-4
-2
0
2
4
6
8
Time(ticks)
Acc
eler
atio
n (in
G)
Acceleration of Sensor Node vs Time
Train Signal
0 100 200 300 400 500 600 700 800 900 10000
0.05
0.1
0.15
0.2
0.25
0.3
0.35
Time(ticks)Exp
onen
tial M
ovin
g A
vera
ge o
f Acc
eler
atio
n (in
G) Noise signal and Exponential Moving Average of Noise Signal
Noise SignalExponential Moving Average
EAIEuropean Alliancefor Innovation
on
Future Internet - 201 | Volume | Issue | e3
11
consumption and corresponding life of battery is explained here.
Sampling Mode (Mode 1): Sensor Node sampling at 256Hz with 3 active channels consumes: 12.719 mA
Life of fully charged battery if continuously operated inMode 1: 250mAh/12.719mA = 19.65 h
Sleep Mode (Mode 2): Sensor node in sleep modeconsumes: 0.135 mA
Life of fully charged battery if continuously operated inMode 2: 250mAh/0.135mA = 1851.85 h ~77 days
In general, on average, 10 to 20 trains pass over a bridge in a day. The sensor wakes up, samples and transmits bridge vibration data for a duration of 1 minute and it again goes into sleep. The total current consumption by the sensor node using our proposed scheme is shown as follows:
Usage of the sensor in 1 day:
Total time for the sensor in Mode 1 (sampling) for 20trains: 20 min = 0.33 h
Total time for the sensor in Mode 2 (sleep): 23 h 40 min= 23.66 h
Total current consumption in 1 day: 12.719 x 0.33 +0.135 x 23.66 = 7.3914 mA
The life of the fully charged sensor node using our proposed scheme: 250/7.3914 = 33.82 days = 811.78 h
Increase in the lifetime of sensor node: 811.78/19.65 = 41 times
8.5. Cost Effectiveness of Proposed Algorithm
Our proposed system is cost effective in two different aspects. Firstly, apart from the data logger and the sensors, our system consists only of a low cost (typically $10-$40) microcomputer/microcontroller. This microcontroller performs local processing of sensor data and transmits them to a remote server for further analysis. It also accesses the real time samples of the master sensors and runs the event detection algorithm.
Secondly, our proposed algorithm is cost effective in terms of its time complexity. The total computation time is 0.006 s as mentioned in Table 3. It can also be noted that the proposed algorithm consisting of exponential moving average and a comparison with a series of threshold bounds can be implemented in low cost, constrained hardware platforms (with limited RAM and ROM).
9. Conclusion
The contribution of our work is important with respect to the application of wireless sensor networks in railway bridge health monitoring. A cost effective event detection system is
proposed which maintains both accuracy as well as low delay and also ensures less battery consumption by keeping the nodes in operation only when a train is on the bridge. Thus the monitoring system using our system becomes highly energy efficient. In future work, there is a scope to train and update the threshold bounds depending on the trains which run throughout the day.
This system can be used in other fields of application with some modifications. The concepts used in our proposed scheme may be well used for event detection using WSN in other applications. The novel idea of differentiating the sensors into master and child may be employed in other scenarios where the master sensor may be used for data recording and transmission to a data logger and child sensors may be awakened on the basis of this data. The concept of using a simple technique like exponential moving average and dual threshold bounds can be easily used in algorithms for event detection in different application scenarios.
Acknowledgements. This work is funded by the Ministry of Railways, Indian Railways. It has been executed under project entitled “Development of Railway Bridge Health Monitoring System with Wireless Sensor Networks” in collaboration with Research Designs and Standards Organization (RDSO), Lucknow, India. We would like to thank Mr. V. Sathvik Dev, Mr. Debraj Dutta, Mr. Bidhan Chandra Mohanty and Mr. Kundan Kumar for their sincere help. We would also like to thank the engineers from Indian Railways who have helped us in experimentation on the Railway Bridge.
References
[1] Puccinelli, D. and Haenggi, M. (2005) Wireless sensor networks: applications and challenges of ubiquitous sensing. Circuits and Systems Magazine, IEEE 5(3): 19-31.
[2] Akylidiz, I., Weilian, S., Sankarasubramaniam, Y. and Cayrici, E. (2002) A survey on sensor networks. Communications Magazine, IEEE 40(8): 102-114.
[3] Gowrishankar, S., Basavaraju, T.G., Manjaiah, D. H. and Sarkar, S. K. (2008) Issues in wireless sensor networks. In Proceedings of the World Congress on Engineering, London, UK, 2-4 July, 176-187.
[4] Mahasukhon, P., Sharif, H., Hempel, M., Zhou, T., Ma, T. and Shrestha, P. L. (2011) A study on energy efficient multi-tier multi-hop wireless sensor networks for freight-train monitoring. In Proceedings of the 7th International Wireless Communications and Mobile Computing Conference (IWCMC), Istanbul, Turkey, 4-8 July (IEEE), 297-301.
[5] Charbiwala, Z., Kim, Y., Zahedi, S., Friedman, J. and Srivastava, M. B. (2009) Energy Efficient Sampling for Event Detection in Wireless Sensor Networks. In Proceedings of the 2009 ACM/IEEE international symposium on Low power electronics and design (ISLPED '09), New York, NY, USA, 19-21 Aug (ACM), 419-424.
[6] Sundaram, B. A., Ravisankar, K., Senthil, R. and Parivallal, S. (2013) Wireless sensors for structural health monitoring and damage detection techniques. Current Science 104(11): 1496-1505.
[7] Hackmann, G., Guo, W., Yan, G., Sun, Z., Lu, C. and Dyke, S. (2014) Cyber-Physical Codesign of Distributed Structural Health Monitoring with Wireless Sensor Networks. IEEE
EAIEuropean Alliancefor Innovation
on
Future Internet - 201 | Volume | Issue | e3
CEEDS: A Cost Effective Event Detection System for Energy Efficient Railway Bridge Monitoring with Wireless Sensor Network
S. K. Ghosh, S. Maroju, R. Datta and P. K. Biswas
12
Transactions on Parallel and Distributed Systems 25(1): 63-72.
[8] Kim, S. et al. (2007) Health monitoring of civil infrastructures using wireless sensor networks. In Proceedings of the 6th International Symposium on Information Processing in Sensor Networks, Cambridge, London, UK, 25-27 Apr (IEEE), 254-263.
[9] Meyer, J., Bischoff, R., Feltrin, G. and Motavalli, M. (2010) Wireless sensor networks for long term structural health monitoring. Smart Structures and Systems 6(3): 263-275.
[10] Reyer, M., Hurlebaus, S., Mander, J. and Ozbulut, O. E. (2013) Design of a wireless sensor network for structural health monitoring of bridges. Wireless Sensor Networks and Ecological Monitoring 3: 195-216.
[11] Liu, C., Wu, K. and Pei, J. (2007) An Energy-Efficient Data Collection Framework for Wireless Sensor Networks by Exploiting Spatiotemporal Correlation. IEEE Transactions on Parallel and Distributed Systems 18(7): 1010-1023.
[12] Liu, R., Fan, K. and Sinha, P. (2009) Locally scheduled packet bursting for data collection in wireless sensor networks. Ad Hoc Networks 7(5): 904-917.
[13] Chae, M. J., Yoo, H. S., Kim, J. Y. and Cho, M. Y. (2012) Development of a wireless sensor network system for suspension bridge health monitoring. Automation in Construction 21: 237-252.
[14] MicroStrain, a LORD company, Williston, VT, USA, G-Link®-LXRS™ Power Profile. [Online]. Available: http://files.microstrain.com/G-Link-LXRS-Power-Profile.pdf. Accessed on: Aug. 5, 2014.
[15] Bischoff, R., Meyer, J., Enochsson, O., Feltrin, G. and Elfgren, L. (2009) Event-based strain monitoring on a railway bridge with a wireless sensor network. In Proceedings of the 4th International Conference on Structural Health Monitoring of Intelligent Infrastructure (SHMII-4), Zurich, Switzerland, 22-24 July, 74-82.
[16] Pan, M. S., Liu, P. L. and Lin, Y. P. (2014) Event data collection in ZigBee tree-based wireless sensor networks. Computer Networks 73: 142-153
[17] Vaezi, Y. and van der Baan, M. (2013) A new method for microseismic event detection and automatic time picking. GeoConvention 2013: Integration, University of Alberta, Canada, 1-5.
[18] Pauws, S. (2002) CubyHum: A fully operational query by humming system. In Proceedings of ISMIR, Paris, France, 13-17 Oct., 187-196.
[19] Masri, P. and Bateman, A. (1996) Improved modelling of attack transients in music analysis-resynthesis. In Proceedings of the International Computer Music Conference, Hong-Kong, Aug. (International Computer Music Conference), 100-103.
[20] Phani Kumar, A. V. U., Reddy V, A. M. and Janakiram, D. (2005) Distributed collaboration for event detection in wireless sensor networks. In Proceedings of the 3rd international workshop on Middleware for pervasive and ad-hoc computing (MPAC '05), Grenoble, France, 2005 (ACM), 1-8.
[21] Dziengel, N., Wittenburg, G. and Schiller, J. (2008) Towards distributed event detection in wireless sensor networks. In Adjunct Proceedings of 4th IEEE/ACM Intl. Conf. on Distributed Computing in Sensor Systems (DCOSS’08), Santorini Island, Greece, June 2008 (IEEE).
[22] Xue, W., Luo, O., Chen, L. and Liu, Y. (2006) Contour map matching for event detection in sensor networks. In Proceedings of the 2006 ACM SIGMOD international conference on Management of data (SIGMOD '06), Chicago, Illinois, USA, 26-29 June (ACM), 145-156.
[23] Wong, J. W., Au, O. C., and Wong, P. H. (1998) Fast time scale modification using envelope-matching technique (EM- TSM). In Proceedings of the 1998 IEEE International Symposium on Circuits and Systems (ISCAS’98), Monterey, CA, 31 May-3 June (IEEE), 550-553.
[24] Gupchup, J., Terzis, A., Burns, R., and Szalay, A. (2009) Model-based event detection in wireless sensor networks. In Proceedings of Workshop for Data Sharing and Interoperability on the World Wide Web (DSI 2007), April 2009, arXiv preprint arXiv: 0901.3923. [cs.NI]
[25] Kapitanova, K., Son, S. H., & Kang, K. D. (2010) Event Detection in Wireless Sensor Networks–Can Fuzzy Values Be Accurate? Ad Hoc Networks, Springer Berlin Heidelberg, 49: 168-184.
[26] Kapitanova, K., Son, S. H. and Kang, K. D. (2012) Using fuzzy logic for robust event detection in wireless sensor networks. Ad Hoc Networks 10(4): 709-722.
[27] Lacoste, A. and Eck, D. (2005) Onset detection with artificial neural networks for MIREX 2005. Extended abstract of the 1st Annual Music Information Retrieval Evaluation eXchange (MIREX 2005), held in conjunction with ISMIR, London, UK
[28] Krishnamachari, B. and Iyengar, S. (2004) Distributed Bayesian Algorithm for Fault-Tolerant Event Region Detection in Wireless Sensor Networks. IEEE TRANSACTIONS ON COMPUTERS 53(3): 241-250.
[29] Patil, S. H. and Shinde, S. M. (2013) Reliable Data Collection Using Mobile Data Collector in Wireless Sensor Network. International Journal of Engineering and Advanced Technology (IJEAT) 2(5): 282-285.
[30] Chae, M. J., Yoo, H. S., Kim, J. R. and Cho, M. Y. (2006) Bridge Condition monitoring system using wireless network (Cdma and Zigbee). In Proceedings of 23rd International Symposium on Automation and Robotic in Construction ISARC, Tokyo, Japan, 3-5 Oct., 332-334.
[31] Vinodini, R., Nalini, S. and Muthumurugesan, D. (2013) Detection Of Structural Damage In Bridges Based On ZigBee Networks Using Sensors. International Journal of Computer Science Issues (IJCSI) 10(3):1694-0784.
[32] Hodge, V. J., O'Keefe, S., Weeks, M. and Moulds, A. (2015) Wireless Sensor Networks for Condition Monitoring in the Railway Industry: A Survey. IEEE Transactions on Intelligent Transportation Systems 16(3): 1088-1106.
[33] Flammini, F., Gaglione, A., Ottello, F., Pappalardo, A., Pragliola, C. and Tedesco, A. (2010) Towards Wireless Sensor Networks for Railway Infrastructure Monitoring. In Proceedings of the Electrical Systems for Aircraft, Railway and Ship Propulsion (ESARS), Monte Bologna, Italy, 19-21 Oct. (IEEE), 1-6.
[34] Zhou, G. D. and Yi, T. H. (2013) Recent Developments on Wireless Sensor Networks Technology for Bridge Health Monitoring. Mathematical Problems in Engineering 2013, Article ID 947867, 33 pages.
[35] Express trains in India. (n.d.). In Wikipedia. Available: http://en.wikipedia.org/wiki/Express_trains_in_India. Accessed on: Aug. 7, 2014.
[36] Indian locomotive class WAP-7. (n.d.). In Wikipedia. Available: http://en.wikipedia.org/wiki/Indian_locomotive_class_WAP-7. Accessed on: Aug. 7, 2014.
[37] Moving Averages. (n.d.). In Finviz (Financial Visualizations). http://finviz.com/help/technical-analysis/moving-averages.ashx. Accessed on: April 10, 2015
EAIEuropean Alliancefor Innovation
on
Future Internet - 201 | Volume | Issue | e3
Related Documents


