ADA094 169 CHAMPLAIN TECHNOLOGY INOUSTRIES PALO ALTO CALIF F/6 17/7 EVALUATION OF THE PERFORMANCE OF THE REMOTE AREA PRECISION POSI -ETC(U) M **V j,^ASa OCT 80 E H BOLZ, T E SCALISE OT-FA 75-120 3662 EAA.pIEEEEEEEEI/ iIND //I/I///I/

Welcome message from author
This document is posted to help you gain knowledge. Please leave a comment to let me know what you think about it! Share it to your friends and learn new things together.
Transcript
ADA094 169 CHAMPLAIN TECHNOLOGY INOUSTRIES PALO ALTO CALIF F/6 17/7
EVALUATION OF THE PERFORMANCE OF THE REMOTE AREA PRECISION POSI -ETC(U)
M **V j,^ASa OCT 80 E H BOLZ, T E SCALISE OT-FA 75-120 3662EAA.pIEEEEEEEEI/
iIND
//I/I///I/
1111 11. 1112.5
~36
1iIi.8
MICROCOPY RESOLUTION TEST CHART
NA1IONAL kURLAU Of ITAN[)APDf fH> A

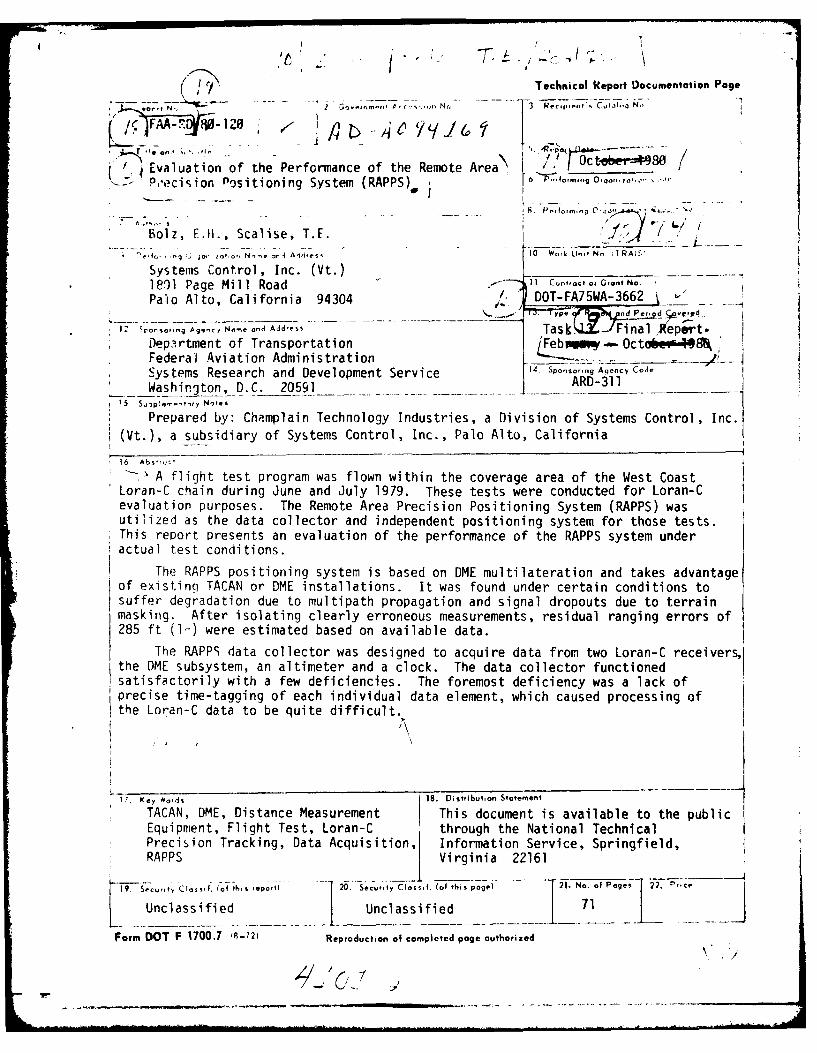
Report No. FAA-RO-80-120 L LL
EVALUATION OF THE PERFORMANCE
OF THE REMOTE AREA
PRECISION POSITIONING SYSTEM (RAPPS)
oE. H.BolzT.E. Scalise
o - "JAN 2 6 1981
October 1980
Final Report
Document is available to the U.S. public throughthe National Technical Information Service,
Springfield, Virginia 22161.
Prepared for
U.S. DEPARTMENT OF TRANSPORTATIONFEDERAL AVIATION ADMINISTRATION
Systems Research & Development ServiceWashington, D.C. 20590
81 2
NOTICE
This document is disseminated under the sponsorship of theDepartment of Transportation in the interest of informationexchange. The United States Government assumes no liabilityfor its contents or use thereof.4
Ii
Technical keport Oocumentation Page
2 S." ,- --- , -1's, rNecsi' en ...... .No
/T0 so-/ i Evaluation of the Performance of the Remote Area> /I _____
7- P,ecision Positioning System (RAPPS) 6 _P- f.., . 3o-.',
J
Iolz, E.H., Scalise, T.F.
I efo-, -q jjo, 0 0 Nm-ne ir IA'te.ss 0 Wo ntN A
Systems Control, Inc. (Vt.) ... .......1.91 Page Mill Road - n C .tt G,ant No.
Palo Alto, California 94304 - DOT-FA75WA-3662
*~I, 4__- -Task-p FialeP,-oponsoring Agency No-Ie and Addess N
Department of Transportation
Federal Aviation Administration ---....... .. _Systems Research and Development Service A-311Washington, D.C. 20591-- -- - -- -- - ---............ ARD-311
15 Su, plI. t ty Notes
Prepared by: Champlain Technology Industries, a Division of Systems Control, Inc.
(Vt.), a subsidiary of Systems Control, Inc., Palo Alto, California
16 Abs , '
>-- A flight test program was flown within the coverage area of the West CoastLoran-C chain during June and July 1979. These tests were conducted for Loran-Cevaluation purposes. The Remote Area Precision Positioning System (RAPPS) wasutilized as the data collector and independent positioning system for those tests.This report presents an evaluation of the performance of the RAPPS system underactual test conditions.
The RAPPS positioning system is based on DME multilateration and takes advantageof existinq TACAN or DME installations. It was found under certain conditions tosuffer degradation due to multipath propagation and signal dropouts due to terrainmasking. After isolating clearly erroneous measurements, residual ranging errors of285 ft (l.,) were estimated based on available data.
The RAPPS data collector was designed to acquire data from two Loran-C receivers,the DME subsystem, an altimeter and a clock. The data collector functionedsatisfactorily with a few deficiencies. The foremost deficiency was a lack ofprecise time-tagging of each individual data element, which caused processing ofthe Loran-C data to be quite difficult.
1'7. Key *oad% 18. Distribution Statement
TACAN, DME, Distance Measurement This document is available to the publicEquipment, Flight Test, Loran-C through the National TechnicalPrecision Tracking, Data Acquisition, Information Service, Springfield,RAPPS Virginia 22161
19 $ ty Cla s-'. (of 'h. report, 20. Secu ty C'ossif. (ofhspogel 21. No of Pages 22. ....
Unclassified Uncl assi fi ed 71
Form DOT F 1700.7 19-72) Reproduction of completed page authorized

c;'I 14 - 4; -Chi U
GOP it
C 00
EEac
099III 161 !It1LTIS II cI9 111 ot
I .I.
mu -° = •
i . i -, "c 'I-' 0E
. 60 0 Ci
Ma:I
MIF
z -6 r, !VI-~
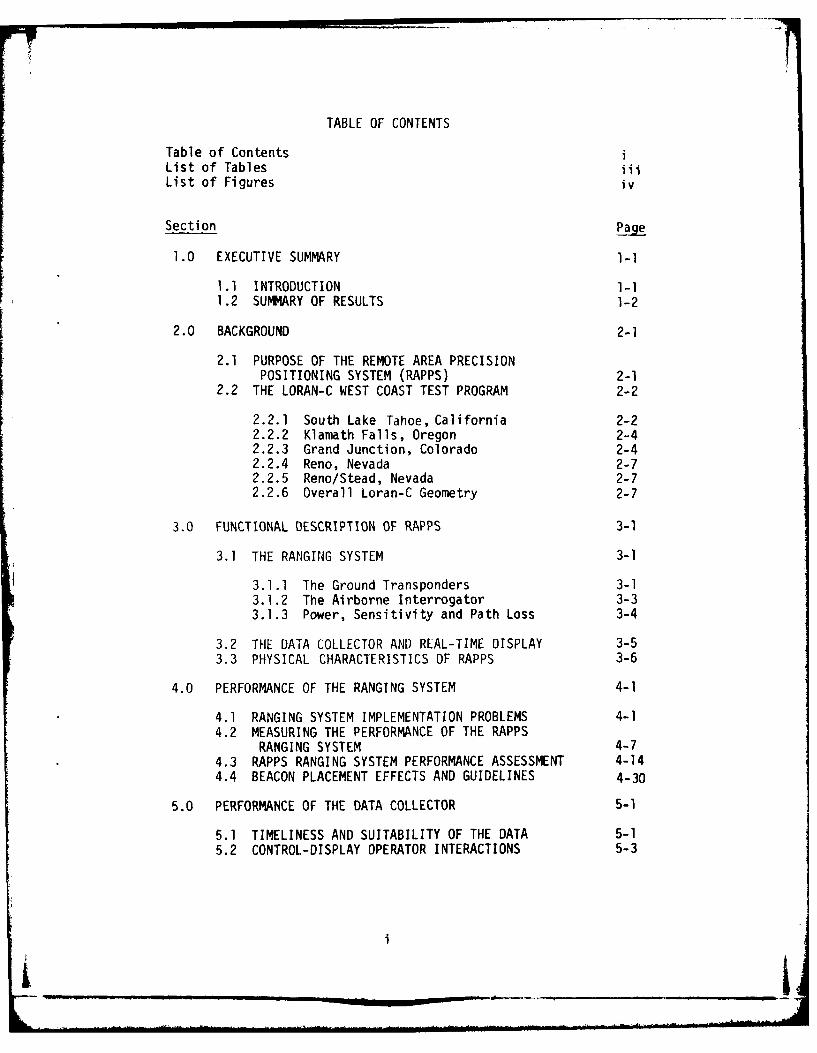
TABLE OF CONTENTS
Table of ContentsList of Tables iiiList of Figures iv
Section Page
1.0 EXECUTIVE SUMMARY 1-1
1.1 INTRODUCTION 1-11.2 SUMMARY OF RESULTS 1-2
2.0 BACKGROUND 2-1
2.1 PURPOSE OF THE REMOTE AREA PRECISIONPOSITIONING SYSTEM (RAPPS) 2-1
2.2 THE LORAN-C WEST COAST TEST PROGRAM 2-2
2.2.1 South Lake Tahoe, California 2-22.2.2 Klamath Falls, Oregon 2-42.2.3 Grand Junction, Colorado 2-42.2.4 Reno, Nevada 2-72.2.5 Reno/Stead, Nevada 2-72.2.6 Overall Loran-C Geometry 2-7
3.0 FUNCTIONAL DESCRIPTION OF RAPPS 3-1
3.1 THE RANGING SYSTEM 3-1
3.1.1 The Ground Transponders 3-13.1.2 The Airborne Interrogator 3-33.1.3 Power, Sensitivity and Path Loss 3-4
3.2 THE DATA COLLECTOR AND REAL-TIME DISPLAY 3-53.3 PHYSICAL CHARACTERISTICS OF RAPPS 3-6
4.0 PERFORMANCE OF THE RANGING SYSTEM 4-1
4.1 RANGING SYSTEM IMPLEMENTATION PROBLEMS 4-14.2 MEASURING THE PERFORMANCE OF THE RAPPS
RANGING SYSTEM 4-74.3 RAPPS RANGING SYSTEM PERFORMANCE ASSESSMENT 4-144.4 BEACON PLACEMENT EFFECTS AND GUIDELINES 4-30
5.0 PERFORMANCE OF THE DATA COLLECTOR 5-1
5.1 TIMELINESS AND SUITABILITY OF THE DATA 5-15.2 CONTROL-DISPLAY OPERATOR INTERACTIONS 5-3
ii

TABLE OF CONTENTS - Continued
Section P82e
6.0 CONCLUSIONS 6-1
6.1 DATA ACQUISITION SYSTEM PERFORMANCE 6-16.2 RAPPS RANGE MEASUREMENT SYSTEM PERFORMANCE 6-2
REFERENCES R-1
APPENDIX A A-i
Accession For
NTIS GRA&IrTIC~ TAA f-
DIIC. .-R
.
ii
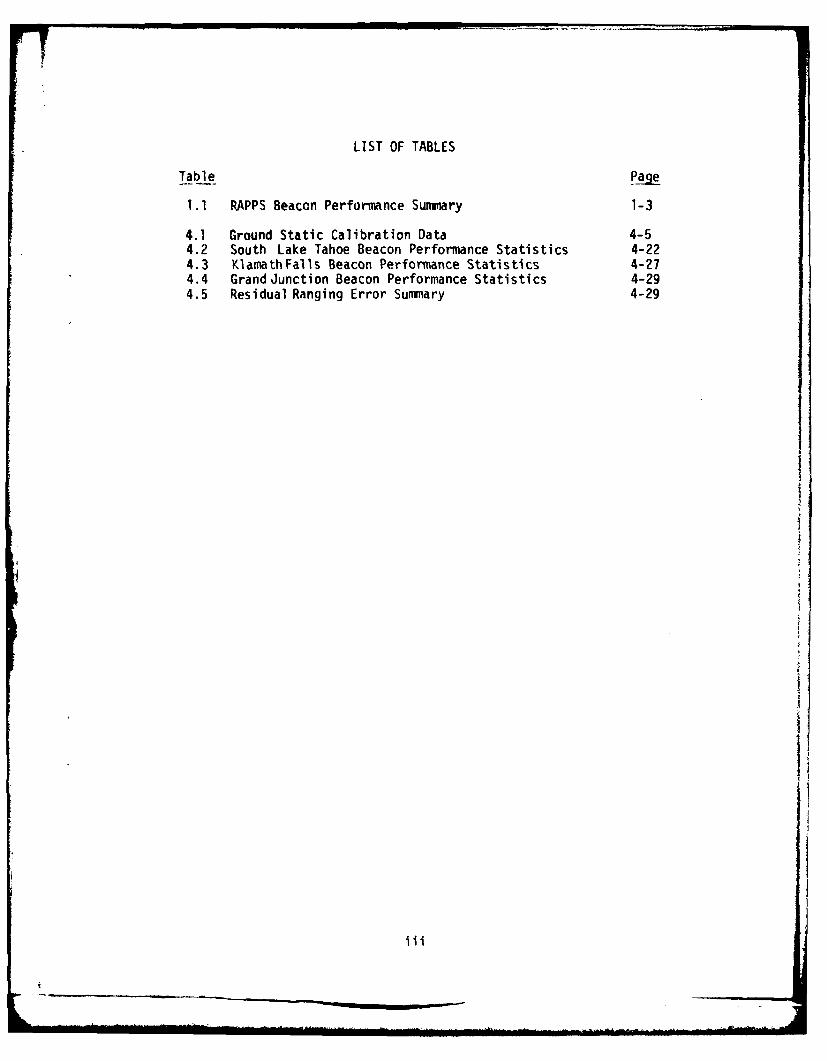
LIST OF TABLES
Table
1.1 RAPPS Beacon Performance Summary 1-3
4.1 Ground Static Calibration Data 4-54.2 South Lake Tahoe Beacon Performance Statistics 4-224.3 KlamathFalls Beacon Performance Statistics 4-274.4 Grand Junction Beacon Performance Statistics 4-294.5 Residual Ranging Error Summary 4-29
iii

LIST OF FIGURES
FigurePage
2.1 Test Approach and Beacon Configuration at Lake Tahoe 2-32.2 Test Approach and Beacon Configuration at Klamath Falls 2-52.3 Test Approach and Beacon Configuration at Grand Junction 2-62.4 Test Approach and Beacon Configuration at Reno 2-82.5 The West Coast Loran-C Chain Coverage 2-9
3.1 RAPPS Data Acquisition Rack Configuration 3-7
4.1 Model Beacon Geometry 4-24.2 Beacon Performance at Klamath Falls (Plate A) 4-94.3 South Lake Tahoe Beacon Performance (Plate A) 4-164.4 South Lake Tahoe Beacon Performance (Plate B) 4-174.5 South Lake Tahoe Beacon Performance (Plate C) 4-184.6 South Lake Tahoe Beacon Performance (Plate D) 4-194.7 South Lake Tahoe Beacon Performance (Plate E) 4-204.8 South Lake Tahoe Beacon Performance (Plate F) 4-214.9 Klamath Falls Beacon Performance (Plate A) 4-234.10 Klamath Falls Beacon Performance (Plate B) 4-244.11 Klamath Falls Beacon Performance (Plate C) 4-254.12 Klamath Falls Beacon Performance (Plate D) 4-264.13 Grand Junction Beacon Performance 4-284.14 Hypothetical Lake Multipath Example 4-314.15 Suggested Beacon Layout 4-34
5.1 RAPPS Data Format With Data Collector Errors 5-2
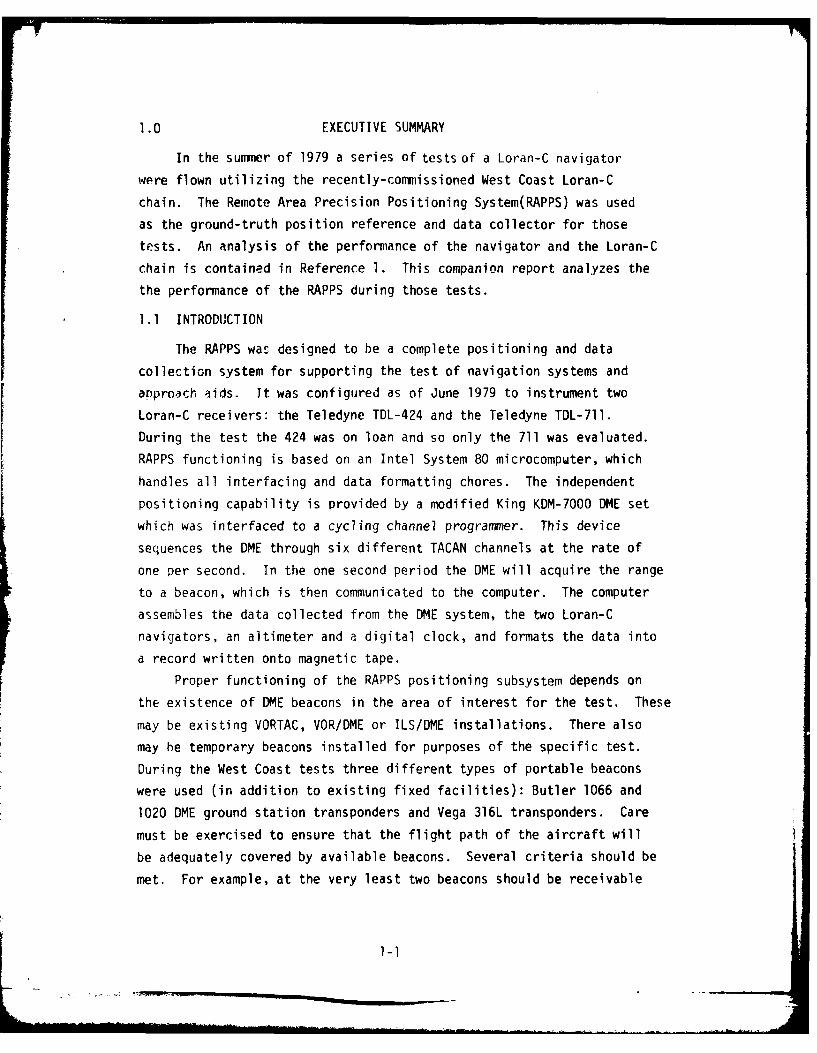
1.0 EXECUTIVE SUMMARY
In the summer of 1979 a series of tests of a Loran-C navigator
were flown utilizing the recently-commissioned West Coast Loran-C
chain. The Remote Area Precision Positioning System(RAPPS) was used
as the ground-truth position reference and data collector for those
tests. An analysis of the performance of the navigator and the Loran-C
chain is contained in Reference 1. This companion report analyzes the
the performance of the RAPPS during those tests.
1.1 INTRODUCTION
The RAPPS was designed to be a complete positioning and data
collection system for supporting the test of navigation systems and
approach aids. It was configured as of June 1979 to instrument two
Loran-C receivers: the Teledyne TDL-424 and the Teledyne TDL-711.
During the test the 424 was on loan and so only the 711 was evaluated.
RAPPS functioning is based on an Intel System 80 microcomputer, which
handles all interfacing and data formatting chores. The independent
positioning capability is provided by a modified King KDM-7000 DME set
which was interfaced to a cycling channel programmer. This device
sequences the DME through six different TACAN channels at the rate of
one per second. In the one second period the DME will acquire the range
to a beacon, which is then communicated to the computer. The computer
assembles the data collected from the DME system, the two Loran-C
navigators, an altimeter and a digital clock, and formats the data into
a record written onto magnetic tape.
Proper functioning of the RAPPS positioning subsystem depends on
the existence of DME beacons in the area of interest for the test. These
may be existing VORTAC, VOR/DME or ILS/DME installations. There also
may he temporary beacons installed for purposes of the specific test.
During the West Coast tests three different types of portable beacons
were used (in addition to existing fixed facilities): Butler 1066 and
1020 DME ground station transponders and Vega 316L transponders. Care
must be exercised to ensure that the flight path of the aircraft will
be adequately covered by available beacons. Several criteria should be
met. For example, at the very least two beacons should be receivable
1-1
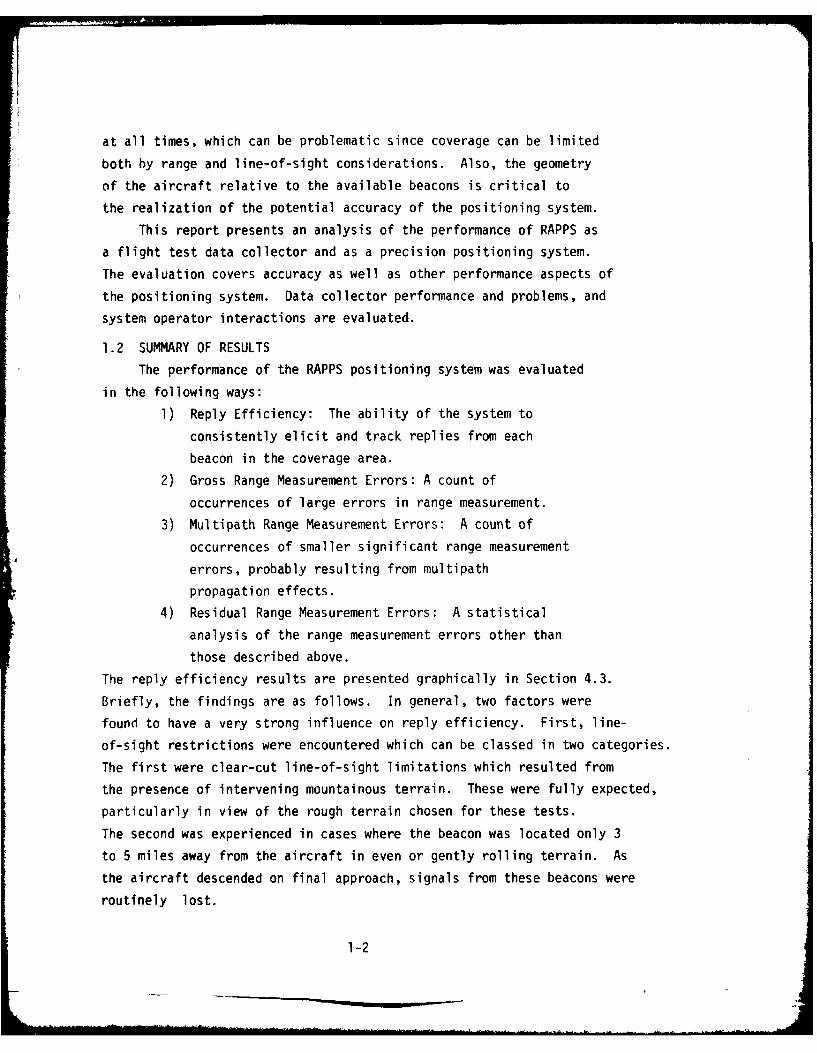
at all times, which can be problematic since coverage can be limited
both by range and line-of-sight considerations. Also, the geometry
of the aircraft relative to the available beacons is critical to
the realization of the potential accuracy of the positioning system.
This report presents an analysis of the performance of RAPPS as
a flight test data collector and as a precision positioning system.
The evaluation covers accuracy as well as other performance aspects of
the positioning system. Data collector performance and problems, and
system operator interactions are evaluated.
1.2 SUMMARY OF RESULTS
The performance of the RAPPS positioning system was evaluated
in the following ways:
1) Reply Efficiency: The ability of the system to
consistently elicit and track replies from each
beacon in the coverage area.
2) Gross Range Measurement Errors: A count of
occurrences of large errors in range measurement.
3) Multipath Range Measurement Errors: A count of
occurrences of smaller significant range measurement
errors, probably resulting from multipath
propagation effects.
4) Residual Range Measurement Errors: A statistical
analysis of the range measurement errors other than
those described above.
The reply efficiency results are presented graphically in Section 4.3.
Briefly, the findings are as follows. In general, two factors were
found to have a very strong influence on reply efficiency. First, line-
of-sight restrictions were encountered which can be classed in two categories.
The first were clear-cut line-of-sight limitations which resulted from
the presence of intervening mountainous terrain. These were fully expected,
particularly in view of the rough terrain chosen for these tests.
The second was experienced in cases where the beacon was located only 3
to 5 miles away from the aircraft in even or gently rolling terrain. As
the aircraft descended on final approach, signals from these beacons were
routinely lost.
1-2

In Table 1.1 the results of the ranging system error analysis are
presented. Results for individual beacons are presented graphically
and in tabular form in Section 4.3. Gross ranging errors were identified
in 16 out of the 6085 data points recovered, or at a rate of 0.25%.
Gross errors are relatively easy to spot and eliminate from the data
reduction process when the RAPPS is utilized as the position standard
for a flight test. Smaller significant ranging errors (probably due to
multipath propagation) were -identified in one hundred of the remaining
6069 data points. These errors, by definition greater than 1000 feet
and typically on the order of 1500-2500 feet, are much more difficult
to identify and expunge when utilizing the RAPPS data as a position
standard. Therefore, they tend to contaminate the results. Analyses
of the remaining 5969 data points resulted in a mean computed rangingerror of -23 feet with a standard deviation of 285 feet. These values
represent raw ranging accuracies and are not directly translatable
into positioning accuracy. Positioning errors could be larger or
smaller in any given instance depending on beacon geometry and the number
of available beacons. Since this ranging error analysis was performedWithout benefit of an independent absolute position standard, the resulting
standard deviation value is probably conservative (greater than actual
performance).
Table 1.1 RAPPS Beacon Performance Summnary
LOCATION RECOVERED GROSS RANGE MULTIPATH RESIDUAL ERRORSDATA POINTS ERRORS (POINTS) ERRORS (POINTS) .{EET)
MEAN SD
South Lake Tahoe 2893 11 75 35' 299'
Grand Junction 549 0 3 32' 207'
Klamath Falls 2b43 5 22 -96' 268'
TOTAL 6085 16 100 -23' 285'
The above results apply in general to all the tests flown as a part
of this program. Events experienced during flights at South Lake Tahoe
deserve special mention. In those flights the reply efficiency from
one of the beacons (located at the airport) was very poor, and the multipath
1-3
error rate detected was very high. These errors occurred even though
that beacon was operating properly and was in clear line-of-sight of
the aircraft at all times. The probable cause identified stemmed from
the fact that this beacon was located near the lake and virtually at
lake elevation, and that the lake was quite smooth during the tests.
It is believed that multipath propagation with the lake as reflector
occurred resulting in significant periods of signal cancellation. False
lock-on to erroneous ranges occurred often as signals reflected from
the nearly mountains.
The beacon placement procedures employed during the test were
evaluated critically. While virtually every beacon placement performed
could be viewed as a significant learning opportunity, two major conclusions
result from that study. First, knowledge of the absolute location of a
beacon is extremely important. This is difficult to achieve in the field.
Second, during all parts of the flight path (of interest), a bare minimum
of two and preferrably three should be in clear line-of-sight view of
the aircraft. In practice the second principle is often sacrificed for
the first; i.e., locations are chosen which are easy to get to and are
accurately known. Only after the test has been completed is it realized
that the beacon cannot be reliably received. Beacons located at high
elevations provide best overall performance.
In Section 5 the performance of RAPPS as a flight test data collector
is evaluated in detail. In general the system performed well and provided
usable data. Some performance quirks were noted which apparently resulted
from programming errors or improper program design; however, these flights
constituted the first airborne testing of RAPPS, and so software problems
are not to be unexpected. The major deficiency of the data collector
was the lack of precise time annotation of all data fields. Due to the
unexpected performance characteristics of the Loran-C navigator, it was
difficult to ascertain the age of the Loran-C data recorded, which renders
error analysis rather difficult.
The system required a trained technician for its operation. While
operation of RAPPS is not laborious, proper operation required detailed
knowledge of the systems which comprise RAPPS. Control of the data
collector was exercised through a graphic terminal. That terminal was
also progranmmed to serve as a real time position display system. That
capability was not evaluated during these tests.
2.0 BACKGROUND
The evaluation contained in this report evolved from data and
experience gained through the use of the Remote Area Precision Positioning
System (RAPPS) during the Loran-C West Coast Test Program. What follows
in this section is a discussion of the purpose of RAPPS and a brief
description of the West Coast Loran-C tests for which it was used.
2.1 PURPOSE OF THE REMOTE AREA PRECISION POSITIONING SYSTEM (RAPPS)
In any test of the accuracy of an air navigation system, whether
enroute or terminal, an essential element of that test is a means to
fix the test aircraft position independently from the system being
tested. It was for just such a purpose that RAPPS was used during
flight tests of Loran-C as a non-precision approach aid, using the
West Coast Loran-C Chain.
The RAPPS itself is a positioning system that can record range
from up to six DME beacons by cyclically polling those beacons in
flight. The ranging information from these beacons is then fed into
a microprocessor, combined with baro-uncorrected altitude, and then
time-tagged to produce the data necessary to arrive at an aircraft
position using multilateration techniques.
During the West Coast Loran-C test the RAPPS was used to fix
aircraft position using a mixture of fixed DME beacons (ILS/DME, VOR/DME,
VORTAC) and uniquely positioned portable DMF beacons. The position
information it provided was then compared with Loran-C positioning
data during post-test analysis, and served as a criterion against
which the Loran-C system accuracy could be measured.
The West Coast test applications of the RAPPS emphasize its major
advantage over other ground truth systems - that of range portability.
As long as beacons can be placed appropriately, no matter the remoteness
of the site, a precision range can be set up. It was just such flexibility
that allowed ground truth data to be collected in areas where no other
accurate system was available and in the kind of rugged terrain required
by the West Coast Loran-C test objectives.
2-1

2.2 THE LORAN-C WEST COAST TEST PROGRAM
The Loran-C Flight Test Program [I] flown using the West Coast Loran-C
Chain was designed to analyze the performance of both the Loran-C Chain
itself and the airborne Loran-C micro-navigator system in a series of
varied scenarios. The test profiles and locations were selected
to provide an extensive mix of terrain, geometry, and positioning
conditions within the context of an actual operational environment.
In the midst of this demanding program the suitability of Loran-C
as a non-precision approach aid was also tested. The non-precision
approaches flown at five locations (South Lake Tahoe, California;
Klamath Falls, Oregon; Grand Junction, Colorado; Reno, Nevada, and
Reno/Stead, Nevada) became the framework within which data were
collected for an analysis of both Loran-C reliability and accuracy,
and an operational assessment of the Loran-C ground and airborne systems.
An important part of that analysis was a computation of Loran-C
position accuracy and the effects on that accuracy of Loran-C bias,
signal propagation characteristics, and positioning geometry. The Remote
Area Precision Positioning System developed by the Sierra Nevada
Corporation was used as a ground truth system to provide an independent
method of fixing aircraft position against which the Loran-C system
could be compared.
Of the five locations at which flight tests were flown, three were
formal test approach locations: Lake Tahoe, Klamath Falls, and Grand
Junction. The flights at the Reno International and Reno/Stead airports
were system checkout missions, although data were recorded during these
missions also and they contributed to the overall assessment of the
Loran-C system. The next sections contain a description of the methods
by which the RAPPS was employed in its ground truth role.
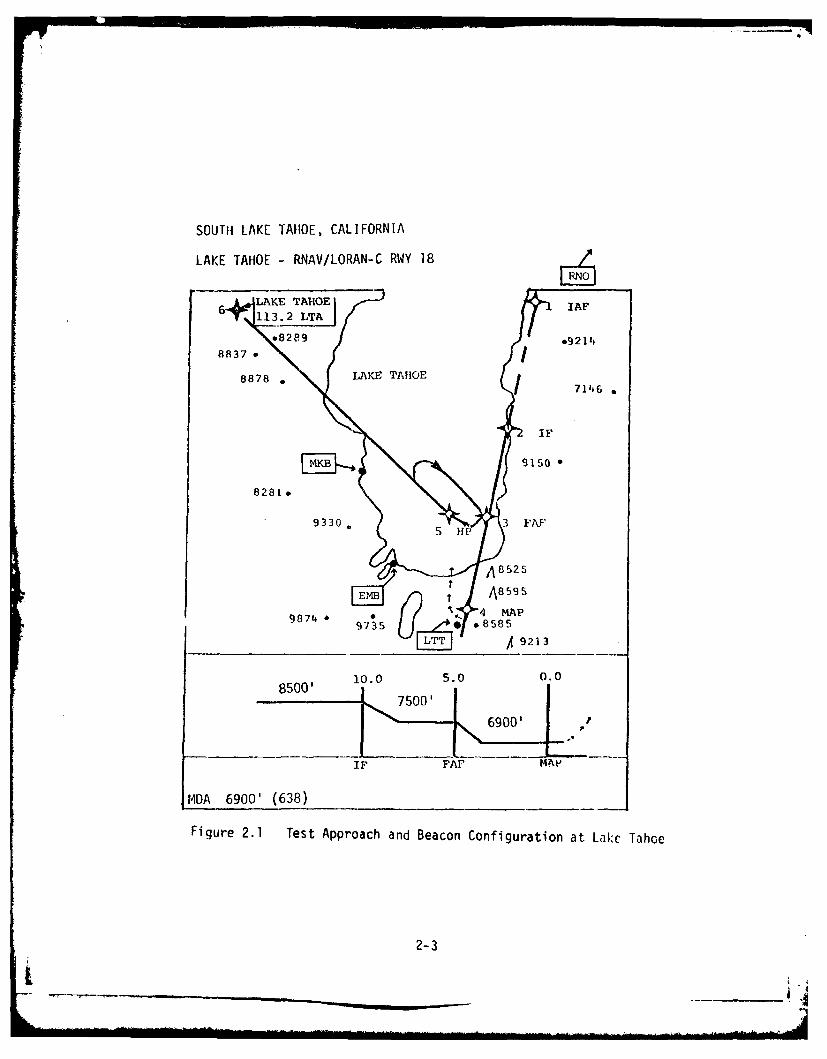
2.2.1 South Lake Tahoe, California
Lake Tahoe Airport is located on the south shore of Lake Tahoe. The
lake itself, and the airport, are ringed with high terrain in all
quadrants. The test approach was designed to be flown straight-in to
Runway 18. Figure 2.1 shows the Lake Tahoe test location and approach
2-2
SOUTH LAKE TAHOE, CALIFORNIA
LAKE TAHOE - RNAV/LORAN-C RWY 18
... AAAKE ATIOIAF
*8289*921'4
8878 *LAKE TAHOE716
IF
9150
933 5A NZU'
FigureEM 2. TetAprahad8ecnCofgrtina95k ao
2-31
10.0__5.0__0.0
as well as the location of the beacons (both fixed and portable). LTA is
the fixed TACAN station co-located with the Lake Tahoe VOR. RNO is the
DME beacon of the Reno VORTAC. LTT is a portable Butler 1066 DME
beacon placed near the Lake Tahoe tower. MKB is the portable Butler 1066 DME
beacon located at a roadside location on a cliff overlooking Meeks Bay
on the central western shore of the Lake. EMB is a Vega 316L beacon (L-Band)
located near Emerald Bay on the southwestern shore of Lake Tahoe.
For the first five test approaches, all the above beacons but EMB were
used. The EMB beacon was available only for the last five approaches,
since it was installed after the flights were initiated.
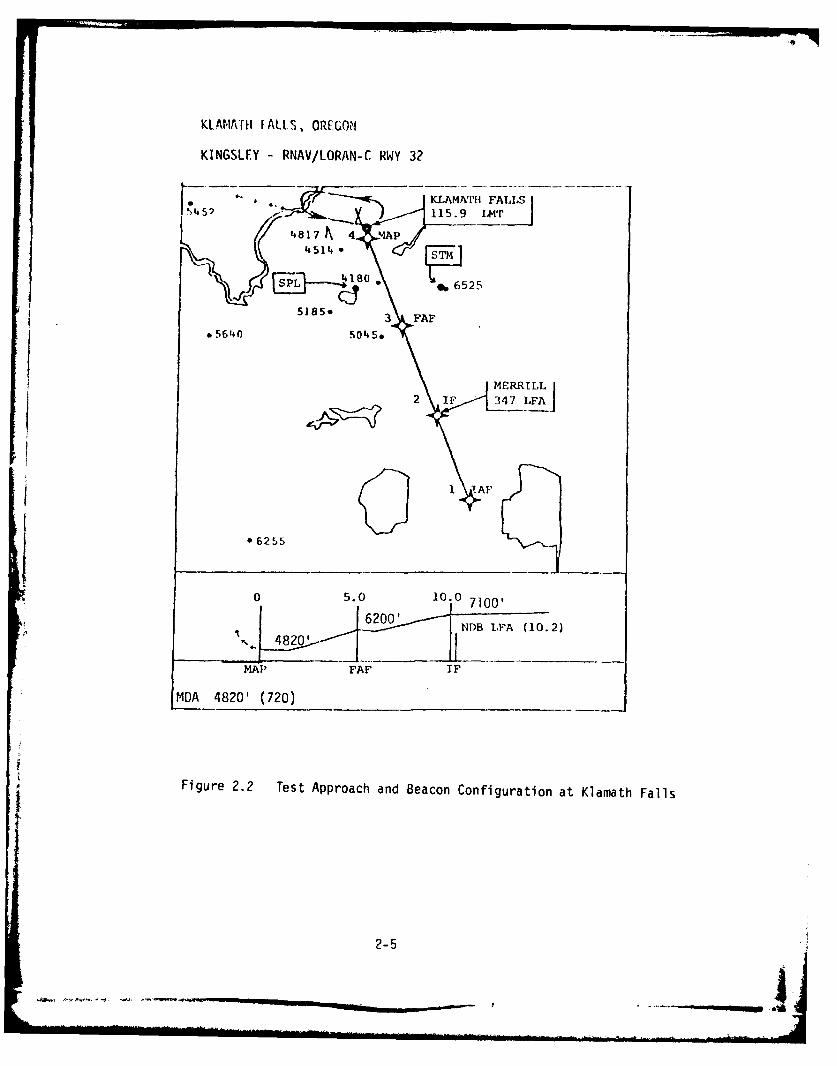
2.2.2 Klamath Falls, Oregon
The test approach to Kingsley Field was to Runway 32. Three beacons
(shown in Figure 2.2) were used for ground truth multilateration at
Klamath: STM, a Butler 1066 beacon placed near an antenna farm on
top of Stukel Mountain; another Butler 1066, designated SPL,
located on a private farm near Spring Lake; and, LMT, the TACAN
co-located with the VOR on the field at Kingsley. Terrain was such
that good reception of all the beacons was possible throughout the six
test approaches flown there.
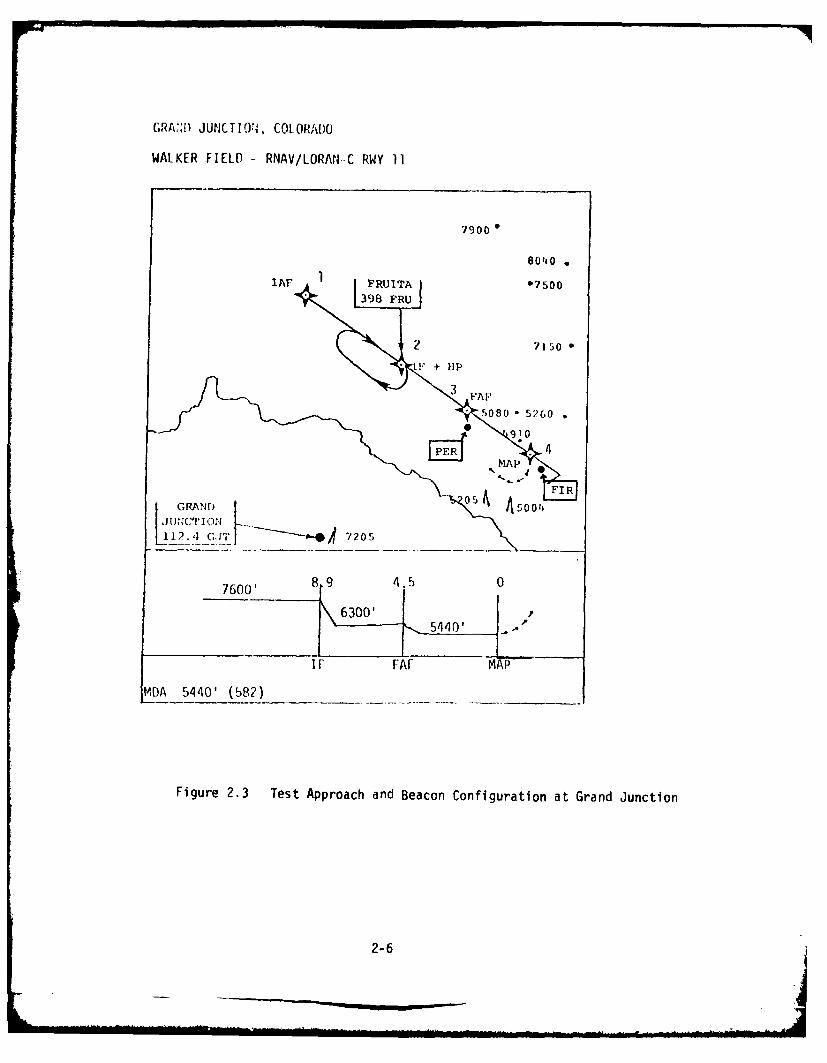
2.2.3 Grand Junction, Colorado
Walker Field lies in the River Valley at the junction of the Colorado
and Gunnison Rivers. Within a few miles of the field the terrain rises
abruptly to 7000' (southwest) and 8000' (northeast). Three DME beacons
were used by the RAPPS for the Grand Junction approaches (see Figure 2.3).
GJT is the TACAN co-located with the Grand Junction VOR on the
7000' mesa west of the field. A Butler 1066 beacon, designated FIR,
was installed near the fire station on the airport. A Vega 316L beacon,
called PER, was located on the roof of a private dwelling situated
southwest of the final approach course to Runway 11.
2-4
KLAMATH IALLS, OREGON
KINGSLEY - RNAV/LORAN-C RWY 32
, / KLAMATH FALLS4 5 115.9 LM'r
4.8171h 4 'uP4514. e]T
4180 .*E-
S 5185. FAF
5 4 ME RRILLI
2 IF 347 LFAj
1 TAF
*6255
0 5.0 10.0 7100'
6200' NDB IFA (10.2)
MAP FAF IF
MDA 4820' (720)
Figure 2.2 Test Approach and Beacon Configuration at Klamath Falls
2-5
A,"- .........__ _ _ _ _ _ _ _ _ A ..l
GRAP!) JUNCTION, COLORADO
WALKER FIELD - RNAV/LORAN--C RWY 11
7900
80140
IA' 0I750039, FRU
- 7150
IF + lip
9i10
_5440'
[:: ' P84 .26
FMAPGRAND 0' A sow.F2.I2.4 GUT V1, ~ 70
7600' 9 .
5140' l
IFFAF MARD
MDA 5440' (58?) _____
Figure 2.3 Test Approach and Beacon Configuration at Grand Junction
2-6
2.2.4 Reno Nevada
The Reno International Airport lies in a valley surrounded by foothills.
Instrument approaches are conducted to runway 16, as illustrated in
Figure 2.4. The beacons utilized were the Reno VORTAC (RNO), the Reno ILS DME
(IPN), a Butler beacon located at Stead airport (SNC) and a Butler beacon
located on Peavine mountain (PVN).
2.2.5 Reno/Stead, Nevada
The Stead airport (former Air Force base) is located northwest of
Reno International. There are no instrument approaches commissioned for
Stead airport. The test approaches were conducted to runway 26. The
Reno VORTAC (RNO) was used, as was a Butler beacon located just south of therunway (SNC). The beacon location on Peavine mountain (PVN) was utilized,
as well as a Vega beacon installed on a rooftop southwest of the airport
(DRI).
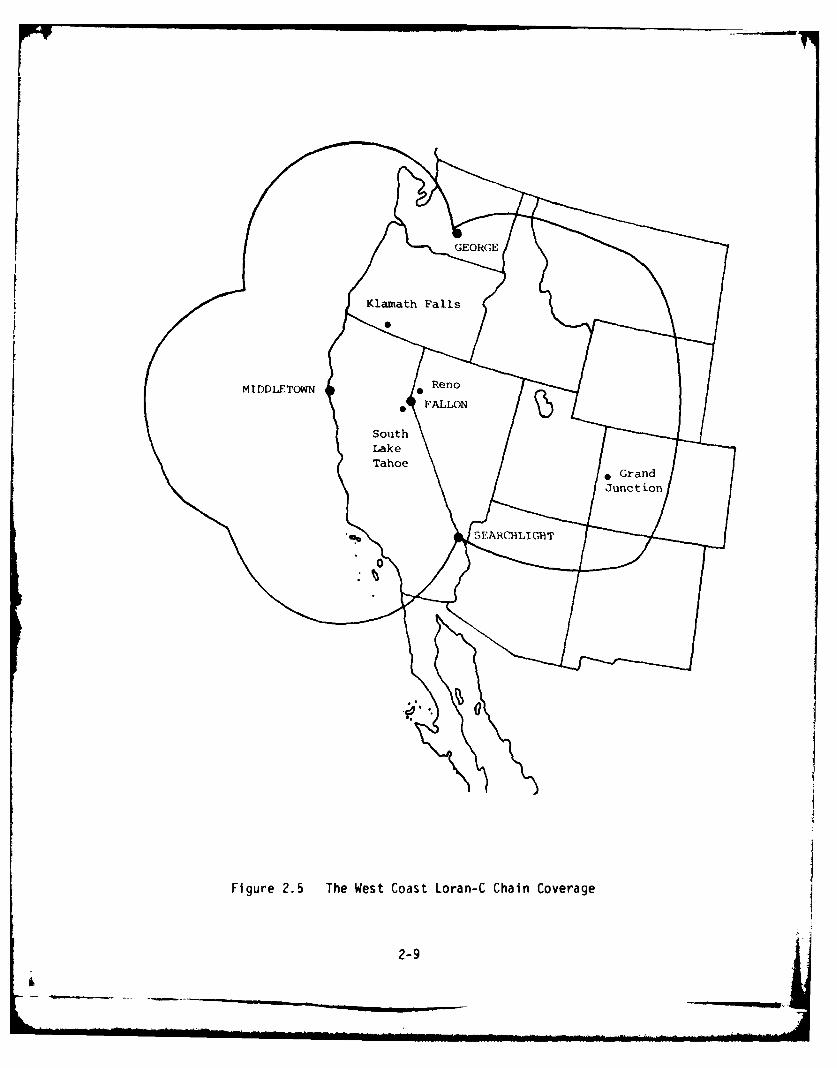
2.2.6 Overall Loran-C Geometry
Each of the five above locations are noted on a chart of the entire
West Coast Loran-C chain. This chart, Figure 2.5, also shows the nominal
coverage areas of that chain.
2-7

RENO, NEVADA
RENO INTERNATIONAL - RNAV/LORAN-C RWY 16
7950 7192.
08000 8979 0
SPARKS2 24 SPK
RPI:NO 8100
*8760 5640 117.9 RNO -/SI730 A *698
1t 55 2 600 0p
58 1 1 7 8 5
S 6
0 8200'
5400' 6700'
MAP FAF IF
MDA 5400' (988)
Figure 2.4 Test Approach and Beacon Configuration at Reno
2-8
GEORGEIKlamath Falls i
MIDDLETOWN DReno
0 FALLON
Lake
S•Grand
Junc tion
'% A RCHL I GlT
Figure 2.5 The West Coast Loran-C Chain Coverage
~2-9
I
3.0 FUNCTIONAL D[SCRIPTION OF RAPPS
The discussion in this section will focus on the three major
subsystems of RAPPS. They are the ranging system, the data collector,
and the real-time display. The section will conclude with a description
of the physical characteristics of the RAPPS.
3.1 THE RANGING SYSTEM
There are two, mutually interactive components in the RAPPS ranging
system [2]. First is the airborne component, consisting of an Intel 80/20-4
microprocessor which controls the tuning of a King KDM-7000 DME transponder-
interrogator and cycles the KDM-7000 among as many as six DME beacons,
whose frequencies are entered using a bank of thumbwheel selectors.
Second is the ground component, consisting of existing FAA DME beacons
(e.g. VORTACs, ILS/DMEs) and a variable number of portable transponders
placed at known locations.
When the real time position display feature is used, the exact
latitude and longitude of each beacon must be entered in the memory
of the Tektronix 4051 intelligent terminal. Multilateration
techniques are then used to fix the position of the aircraft.
As the system cycles through the ground transponders in use, it
pauses for one second at each to record range data, for a total of six
seconds per full cycle. The perceived range to a ground transponder is
a function of the time required for a transmission from the interrogator
to reach the ground beacon and return from that beacon to the aircraft
interrogator. That round trip time is compared to the known round trip
time of radio signals over a measured distance (e.g. a radio signal will
traverse a one mile distance round trip in 12.36 microseconds). The
following sections will explore the ground and airborne elements of
the ranging system in greater detail.
3.1.1 The Ground Transponders
As soon as a typical DME ground transponder is powered up, it
begins to produce a constant level of pulsed transmissions at its
3-1

unique transmission frequency. If no interrogator pulse pairs are
being received, the beacon reacts to the general noise level in the
radio environment at its unique reception frequency, adjusting its
receiver gain until its transmitter is triggered 2700 times per second.
This random return of noise-triggered pulse pairs is called "squitter".
If the noise level should fall or rise enough for the pulse rate to
change from 2700 pulse pairs per second (PPPS), the gain is increased
or decreased accordingly to maintain that rate. When an interrogator
pulse pair is received, a timer is started to effect a delay of 50 Psec.
The pulse pair is then transmitted on the transmission frequency.
Typically, ground transponders can service at least 50 different
interrogators simultaneously and often service 100 at any given time.
When the number of interrogators increases to 100, a point is reached
where the number of reply pulses transmitted produce a 2700 PPPS rate.
At that point "squitter" is non-existent. Any additional interrogators
would produce a rate higher than 2700, and as this begins to occur the
ground station receiver gain would be reduced until the 2700 PPPS rate
was regained. In effect, those interrogators farthest away from the
ground station or with the lowest transmission power would be ignored
until the total number of interrogators dropped below 100, at which time
the reply pulse rate would fall below 2700 PPPS. The receiver gain
would then be increased until some of the ignored beacons would again
be included ard the reply pulse rate stabilized at 2700 PPPS. Under
normal conditons, however, complete saturation by interrogators is
unlikely and some "squitter" would be present to keep the reply rate
at 2700 PPPS.
There are three kinds of ground beacons used by the RAPPS. First
is the FAA DME beacon co-located with a radio navigation aid (e.g.
VORTAC, ILS-DME). Second is a portable beacon, in this case either
a Butler 1066 or a Butler 1020. Third is the Vega 316L. The FAA
beacons operate as already described, except that for 3 seconds of
every 30 seconds, a station identification is broadcast. This, coupled
with TACAN reference pulses (if part of a VORTAC) and replies to other
3-2
aircraft, creates a reply efficiency of 70% to 80%.. In other words,
a given interrogator can expect replies to 70% or 80% of its transmitted
pulse pairs. The Butler beacons have lower "squitter" rates (1000 PPPS)
and no identity transmission. The Vega beacons broadcast no squitter
and no identity transmissions.
3.1.2 The Airborne Interrogator
The airborne interrogator transmits pulse pairs on a frequency
corresponding to the reception frequency of the selected ground
transponder. The pulses are received by the ground station, delayed
exactly 50 wsec, and returned to the interrogator at its reception
frequency (63 MHZ above or below its transmit frequency).
When operating, the interrogator is in one of two modes: search
or track. In the search mode it scans through the pulses it has
received until it recognizes the replies to its own transmitted pulses.
It then ignores the other pulses. The interrogator can recognize its
"own" pulses because during each transmission it introduces a randomly
changing delay between pulses. It then waits 50 wsec, and, starting
at a time corresponding to zero miles range, begins to look for pulses
with that same random separation. If no replies appear in this range"gate", it moves the gate outward in one mile increments until a pulse
pair with the current random separation appears in the gate. It then
waits until it has found 10 successive pulse pairs in that range gate,
assuring that the signals are valid. During this search operation, the
interrogator will be transmitting roughly 150 pulse pairs per second
(PPPS). When a valid signal is acquired, the track mode is entered.
Typically, in the track mode the interrogator reduces its
transmission rate to between 5 and 25 PPPS. This significant reduction
in pulse pair frequency, coupled with the likelihood that most of the
interrogators tuned to a given ground transponder are in this reduced
transmission (track) mode, is what makes it possible for a ground
station to service up to 100 interrogators simultaneously.
To prevent periodic return to search mode during ground station
identification periods and during transient loss of valid signals in
3-3
the range gate, the gate can use data stored in memory to continue at
its last movement rate or remain static (depending on manufacturer and
model). This coasting capability lasts for about 10 seconds, typically,
before the range gate is returned to zero miles and the search begins
again for a valid signal.
The time necessary to acquire a valid signal is a function of"lsquitter" generation rates and maximum range. The KDM-7000 looks at
its first received signal and determines if it is valid by noting
whether a valid signal has been acquired, that is ten replies have
appeared in the range gate before four consecutive "squitter" pulse
pairs have been received. If the signal is not valid, the range gate
is moved successively outward. The farther away the ground station is,
the longer the scan until valid pulse-pair replies appear.
With VORTAC beacons, due to high "squitter" rates and 70% to 80%
reply efficiency, the time for acquisition can range from .25 sec to
1.0 sec depending on range. Acquisition of the Butler 1066 beacon,
with a lower "squitter" rate (1000 PPPS) and no station identification
pulses is somewhat shorter. The shortest potential acquisition time is
that for the Vega Beacon (0.07 sec) since the Vega broadcasts no
squitter" and no identification pulses.
The station dwell time of 1.0 second used by the RAPPS system
was more closely tied to internal requirements than station acquisition
time. The Tektronix 4051 intelligent terminal needed 4 to 5 seconds
to compute its real-time graphic representation of aircraft progress,
and so a dwell time of 1.0 second per channel for the 6 channels gave
the Tektronix 4051 the time it needed for its computational cycle.
3.1.3 Power, Sensitivity and Path Loss
The KDM-7000 airborne interrogator power is constant at 1000 watts.
The minimum detectable signal (MDS), considering a receiver band width
of 1.2 MHZ and noise associated losses, is -103dBM. The KDM-7000
triggering level is -93 dBM, about 10 dB above the MDS.
3-4
This 10 dB figure is also typical of the VORTAC and Butler beacons.
The Vega beacon, since it need not broadcast "squitter" formed from
received noise, is less sensitive, exhibiting an MDS of -89dB. The
norminal triggering level is 16dB above that figure.
Air to ground, the KDM-7000 maximum range to a VORTAC or to
Butler 1066 and 1020 beacons is 400 statute miles. Range to a Vega
beacon is, however, 40 statute miles because the Vega receiver is
less sensitive. Beyond 40 statute miles at the above frequency and
attenuation, the Vega would not "hear" the interrogator.
Ground to air, a VORTAC with a 4 KW power output has a maximum
range to a KDM-7000 airborne interrogator of 800 statute miles. A
Butler 1020 at 1 KW has a 400 statute mile reply range. A Butler 1066
with a power output of 100 watts has a 128 statute mile reply range.
A Vega with 400 watts power has a 200 statute mile maximum reply range,
but maximum operating range is limited to the 40 mile interrogation
range limit.
3.2 THE DATA COLLECTOR AND REAL-TIME DISPLAY
The data collection microcomputer used as the heart of the data
collector is an Intel Model 80/20-4. It interfaces with the DME
ranging interrogator (KDM 7000) through the use of a wire-wrap circuit
board mounted in the microcomputer chassis. This board controls the
selection and sequencing of TACAN channels tuned through use of the
panel of six thumbwheel frequency selectors. It accepts data regarding
range measured from the DME interrogator and feeds the data, along
with the channel identifier, to the microcomputer bus. The board also
drives six LED indicators which indicate in real time the channel
selected and the DME mode (acquisition versus tracking).
A standard RS-232C serial telecommunications interface is provided
for each of the following: Tektronix 4051 graphic terminal, Tektronix
3-5
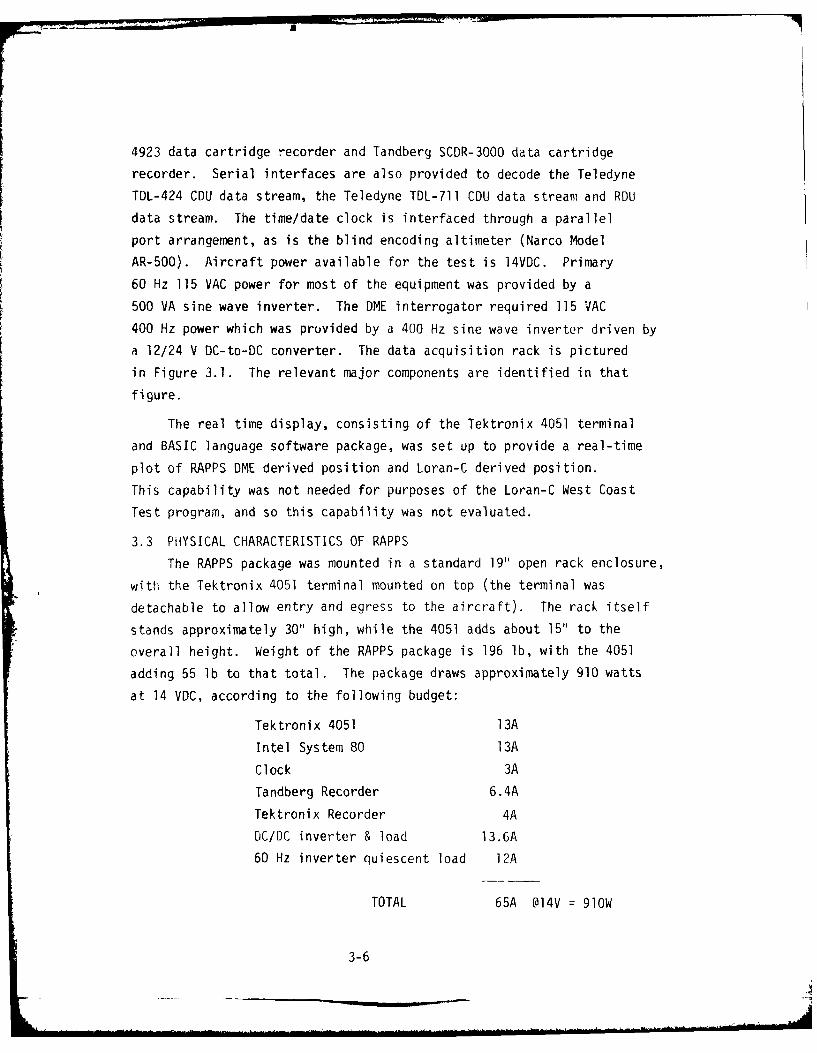
4923 data cartridge recorder and Tandberg SCDR-3000 data cartridge
recorder. Serial interfaces are also provided to decode the Teledyne
TDL-424 CDU data stream, the Teledyne TDL-711 CDU data stream and RDU
data stream. The time/date clock is interfaced through a parallel
port arrangement, as is the blind encoding altimeter (Narco Model
AR-500). Aircraft power available for the test is 14VDC. Primary
60 Hz 115 VAC power for most of the equipment was provided by a
500 VA sine wave inverter. The DME interrogator required 115 VAC
400 Hz power which was pruvided by a 400 Hz sine wave inverter driven by
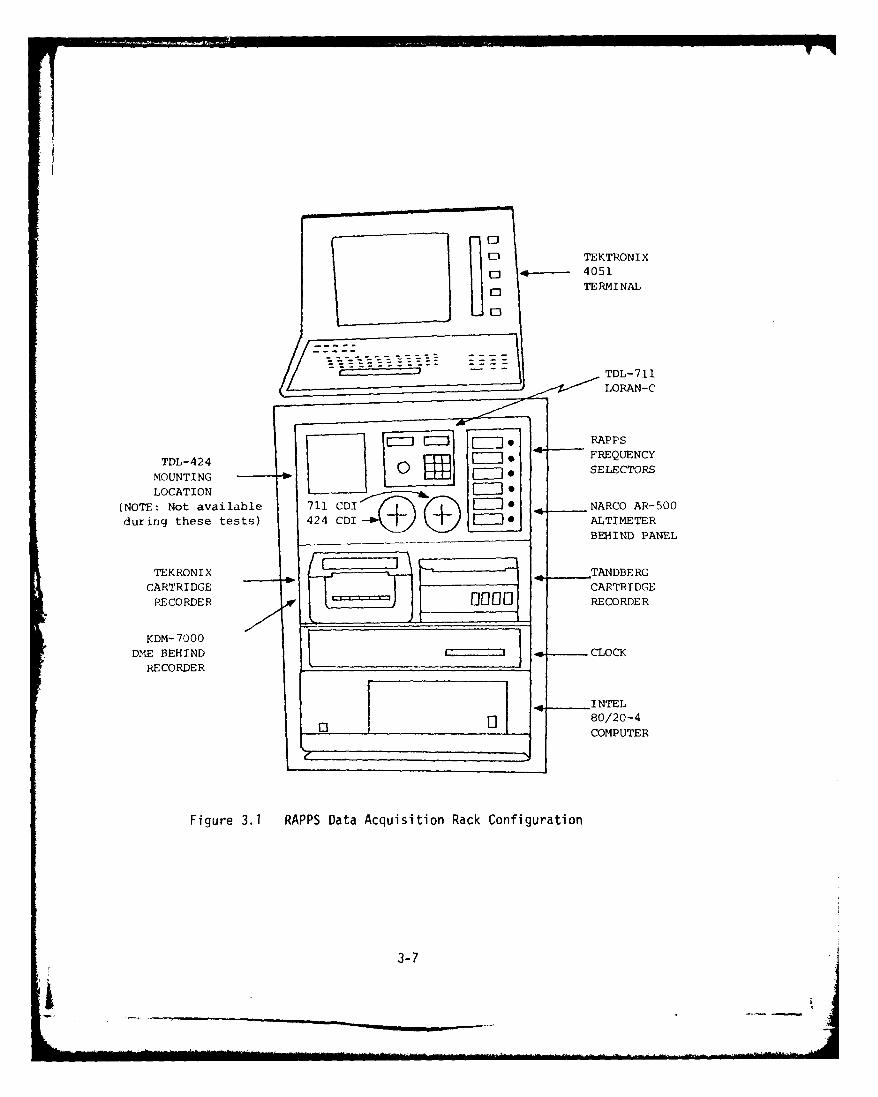
a 12/24 V DC-to-DC converter. The data acquisition rack is pictured
in Figure 3.1. The relevant major components are identified in that
figure.
The real time display, consisting of the Tektronix 4051 terminal
and BASIC language software package, was set up to provide a real-time
plot of RAPPS DME derived position and Loran-C derived position.
This capability was not needed for purposes of the Loran-C West Coast
Test program, and so this capability was not evaluated.
3.3 PHYSICAL CHARACTERISTICS OF RAPPS
The RAPPS package was mounted in a standard 19" open rack enclosure,
with the Tektronix 4051 terminal mounted on top (the terminal was
detachable to allow entry and egress to the aircraft). The rack itself
stands approximately 30" high, while the 4051 adds about 15" to the
overall height. Weight of the RAPPS package is 196 lb, with the 4051
adding 55 lb to that total. The package draws approximately 910 watts
at 14 VDC, according to the following budget:
Tektronix 4051 13A
Intel System 80 13A
Clock 3A
Tandberg Recorder 6.4A
Tektronix Recorder 4A
DC/DC inverter & load 13.6A
60 Hz inverter quiescent load 12A
TOTAL 65A @14V = 910W
3-6
0 TEKTRONI
0- 4051
0 TERMINAL
-0 zTDL- 711
LORAN-C
TDL-424FRQEC
MOUNTIN NOECOR
LOCATION
(NOTE: Not available 711 CDI NARCO AR-500
during these tests) 424 CDI LIEEBEHIND PANEL
TEKRONIX _ _TAN'DBERG
CARTRI DGE CARTRI DOE
RECORDER [0 0RCRE
KOM- 7000
DME BEHIND CLOCK
RECORDER--
0 80/20-4COMPUTER
Figure 3.1 RAPPS Data Acquisition Rack Configuration
3-7

4.0 PERFORMANCE OF THE RANGING SYSTEM
4.1 RANGING SYSTEM IMPLEMENTATION PROBLEMS
There are several systematic problems which can arise in anyimplementation of a multilateration system:
1) Geometric dilution of precision (GDOP)
2) Limited availability of beacon transponders
3) Inability to acquire a valid range measurement due to
range or line of sight restrictions, aircraft/antenna
null points or multipath propagation.
4) Large, random ranging errors due to multipath propagationor other problems
5) Residual noise-induced ranging error
6) Beacon bias error
7) Beacon survey accuracy
Geometric dilution of precision (item 1) occurs with a moving test
vehicle since, as the vehicle moves through the instrumented range, the
crossing angles of the lines of position (range circles) from any two
beacons may vary from very acute angles through a right angle (optimum)
up to very obtuse angles. The measurement errors will be amplified in
proportion to the inverse of the sine of the crossing angle. This is
particularly important where only two ground beacons are being used to
cover a given approach path. Thus, good positioning data is received
only in a confined region of the entire coverage area. The usual means
of combatting this problem is first, careful planning of beacon locations,
and, second, provision of more than two beacons to cover a given flight
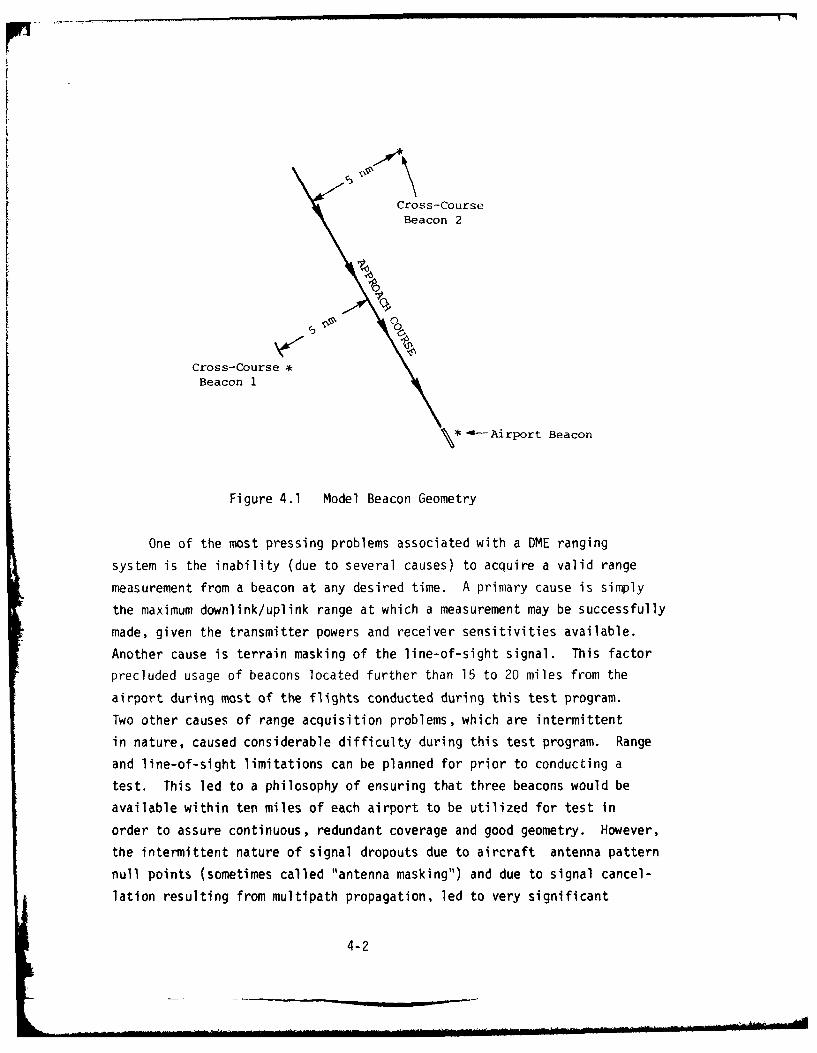
path. For purposes of this test program, a generic beacon configurationshown in Figure 4.1 was used as the model for siting beacons at each of
the five test sites. This configuration accurately covers the ten-mile
length of the approach course while minimizing the number of beacons
required. Item 2, the limitation on available beacons, stems
primarily from the difficulty of siting and manning the beacons
themselves, not from a simple lack of beacon hardware. Also, wherever
possible, existing VORTAC stations were used to avoid siting
unnecessary beacons.
4-1
Cross-CourseBeacon 2
\ ~ Airport Beacon
One f te mst ressng robemsassociated with a DME ranging
system is the inability (due to several causes) to acquire a valid rangemeasremnt roma baco atanydesredtime. A primary cause is simply
the maximum downlink/uplink range at which a measurement may be successfully
made, given the transmitter powers and receiver sensitivities available.
Another cause is terrain masking of the line-of-sight signal. This factor
precluded usage of beacons located further than 15 to 20 miles from the
airport during most of the flights conducted during this test program.
Two other causes of range acquisition problems, which are intermittent
in nature, caused considerable difficulty during this test program. Range
and line-of-sight limitations can be planned for prior to conducting a
test. This led to a philosophy of ensuring that three beacons would be
available within ten miles of each airport to be utilized for test in
order to assure continuous, redundant coverage and good geometry. However,
the intermittent nature of signal dropouts due to aircraft antenna pattern
null points (sometimes called "antenna masking") and due to signal cancel-
lation resulting from multipath propagation, led to very significant
4-2
problems in the post-flight calculation of position information. The
antenna null problem was foreseen, but not judged to be of importance
since the aircraft was expected to he stabilized on the approach course
during thp critical data collection periods. This proved to be somewhat
optimistic since it rendered analysis of the initial approach transition,
final approach and missed approach segments difficult. The magnitude of
the multipath signal cancellation problem was essentially unexpected.
This oroblem occurred primarily at South Lake Tahoe airport, and affected
interrogations of the beacon located dt the airport. The cause of the
signal reflection was apparently the lake itself, which was rather calm
and smooth during these tests. The phenomenon was manifested as a low
probability of acquisition of the primary (line-of-sight) signal path,
and a relatively high probability of lock-on to a false range indication
due to multipath from other sources. These sources are plentiful at
Lake Tahoe, which is ringed by steep mountains. The net result was that
the airport beacon was rendered worse than useless. This was further
compounded by the unfortunate fact that, contrary to original plan, the
coverage geometry from the other two primary beacons available during
part of the test was poor in the immediate vicinity of the airport (this
beacon placement problem is discussed further in Section 4.4). The
multipath problem is considered in detail later in this section.
The fourth item in the list at the front of this section concerns
the effects of either interrogator problems, RAPPS data acquisition
problems or multipath interference as they create occasional large,
seemingly random ranging errors. These erroneous measurements generally
occur in three forms: measurements somewhat larger than the true range,
measurements of near-zero range, and a measurement of 111.11 miles on
channel 1. The first problem is probably the result of multipath
propagation. The second problem seems to be either a characteristic of
the DME interrogator used with the RAPPS package, or some problem with
the interface hardware whereby a false or non-existent range measurement
is erroneously flagged as being valid. The third problem is a charact-
eristic of the data acquisition package whereby (for some unknown reason)
the ddta buffer reserved for DME data does not become completely filled
with new data during a scan. Since the system initializes all buffer
4-3_
positions to the character "1", the seemingly valid 111.11 mile
measurement can appear.
The fifth item listed refers to the residual range measurement
error which is characteristic of DME systems. It is the result of noise,
pulse shape errors, range attenuation, nonlinearities, beacon jitter,
etc. It is generally far smaller than any of the other error sources
or types identified. The sixth item refers to the constant (slowly
varying) bias which is characteristic of all beacon transponders. For
purposes of this test, the portable beacons were preset in the laboratory
to yield a net bias of zero when interrogated by the DME used with the
RAPPS system. Thus the biases of thesE beacons may be assumed to be zero.
When operational VORTAC stations are involved, however, the biases are
unknown. Where possible, such stations were interrogated from a known
location in order to ascertain the magnitude of the bias. This could not
be done for mest of the VORTACs involved due to line-of-sight limitations.
Also, in at least one case, it was not possible to accurately determine
the exact position of the aircraft when the reference interrogations were
made. In another case, over-the-horizon measurements to a beacon which
was only a few miles away could be successfully made, but the readings
so made fluctuated by several hundred feet in a short time span (probably
due to multipath effects), thus negating the effort to determine the bias.
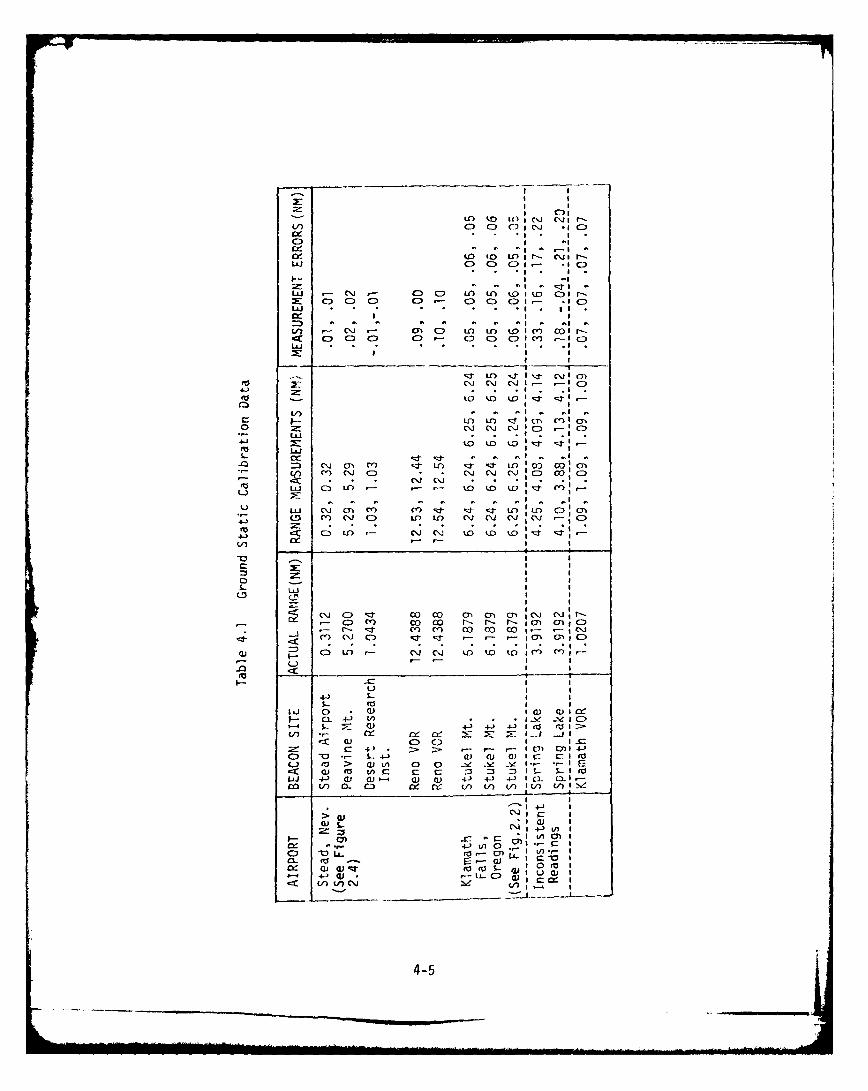
The beacon involved and measurements made are listed in Table 4.1. VORTAC
station biases which could not be measured directly were estimated through
a trial and error process during the Loran-C data reduction process [ ] ]Bias values were selected which minimized DME multilateration residual
errors over a flight path in the coverage region.
The last cause of potential DME measurement errors is the inaccuracy
inherent in determining the locations of the beacons. There are several
methods available for finding beacon locations. These include:
* Location of the beacon at or near a known survey benchmark
I Usage of a satellite-based electronic survey system
I Professional land survey
4-4
C-)ifO ko L() i C\J t
C')ci C) QeD ' *CD
czeC)J0001-*C
WL C\- C) C) LOl Lo UIotoC r1-X: C; 0 0 C) CD C) C) CD, CIQ
SL I
C/) .'-. CC. r C) LA) L I) Uc') coo f-cc Ci C)l C), (D .- C) )I' .-
'T Lo r$ 3 CNJi m
C) I
or Lo
r-- c-c \z c e ' ci .~ Ch CM CM.o
W) I C C
U wi C\7 i (~ C' ) tzr LA1
If" C-,O',Z C D tcnC C) UO LA) C~ C\J1 C\J rCD
to 2-
*\J C 41 - 00 CCIY -1 U \ CI.- C) Mr- 1.4- co r- j OJIC a C )
-~j d -' zr 0)-I (V ) m 1 -O 400 00 2 O.I
GO :) Lo C) C\ c) to) UD IL UCI)
4-)-
S.-~0L 0L. WD.-(J)IL 1.r.
CL-I) _J 4-.. 1 (0 fUI>
a 4) . It.l:;-fa aj vVI iD I
w - j a ) 43 4 0 )
Cl. I
_L (a'T C o 1
4-5

* Usage of existing survey blueprints and estimation of
beacon location by reference to known landmarks
A Ucage of U.S. Geological Survey (U.S.G.S.) Quadranglecharts and estimation of beacon locationi by reference
to known landmarks
I Usage of a local coordinate system
The last technique involves manually laying out beacons with measuring
tape and surveyor's transit. It is useful where positioning data relative
to lat/lon coordinates is not needed, and where the instrumented range
is quite small. In the mountainous terrain characteristic of these tests
this technique was unusable. The most reliable techniques are the first
three. The first (location near a known survey monument) was used
wherever possible. Data describing the exact coordinates of these
monuments is readily available. There were not always such monuments
available in the general area where beacon installations would be
desirable; hence, other methods were used.
The second technique, usage of a satellite-based electronic survey
system, would have been ideal for a test such as this. However, such
equipment was not readily available and is quite costly to purchase. It
has one disadvantage for tests such as these: the receiver must be left
in place for one day or more in order to get an accurate fix. This
would require sending a crew to a location in advance of the actual test.
The great advantage is that an accurate fix may be obtained regardless
of disadvantageous terrain or remoteness of location.
The third technique, a professional land survey, would also have
required considerable advance work in order to set up to survey the
beacon locations. In lieu of that, existing survey blueprints and
U.S.G.S. Quadrangle charts were used extensively. The quadrangle charts,
many of which are based on photogrammetry, were found in most instances
to be far superior to available local survey data. A particularly
illustrative case in point involved a survey blueprint of Reno Stead
Airport obtained from local city records. That survey was quite old,
apparently having been performed by the Air Force while Stead was anAir Force base. After puzzling over some inconsistent data taken based on
4-6
that survey, the survey was compared to the appropriate quadrangle
chart and found to be in error by several tenths of a mile. Subsequent
usage of quadrangle~ chart data produced consistent results at Stead.
Usage of quadrangle charts was not without problems. To be easily
located accurately, beacons should be placed near permanent physical
features, such as buildings, roads and streams. Since they are usually
quite out of date, modern buildings often do not appear. Furthermore,
some features are illustrated by symbols rather than exact representations.
This created a significant post-flight data analysis problem at Klamath
Falls, Ore. One of the beacons was located atop Stukel mountain. It
was positioned a measured distance from one of a group of four antenna
towers at that location. The towers appeared on the quadrangle chart.
However, they are depicted symbolically and so are not accurately
postioned on that chart. This problem was eventually resolved during
the Loran-C data analysis phase by adjusting the estimated beacon position
until all three beacon range measurements were in good agreement throughout
an approach procedure. In retrospect, while the quadrangle charts are
very useful for determining beacon locations, great care must be excercised
when placing beacons in order to insure that associated landmarks appearing
on the charts are properly identified.
4.2 MEASURING THE PERFORMANCE OF THE RAPPS RANGING SYSTEM
An analytical and graphical procedure for assessing the performance
of the DME-based RAPPS ranging system has been developed. Two performance
measures have been developed. The first, called "reply efficiency" is
a direct measure of the frequency with which a given beacon is successfully
acquired during a test flight. As will be illustrated below, the ability
to successfully interrogate a beacon is strongly dependent on the line-of-
site restriction. This problem comes up very frequently during the tests,
particularly due to the uneven terrain and the fact that the aircraft
descends to within a few hundred feet above ground level. The second
performance measure is called "error frequency". This is a measure of
the frequency with which the individual range measurements are in
error by a significant extent. Note that such errors may stem from the
4-7
operation of the interrogator aboard the aircraft (and all attendant signal
propagation problems) or from the operation of the data acquisition system
and interfaces to the interrogator.
The measurement of reply efficiency is quite straightforward since it
only involves an examination of the data in order to count replies received
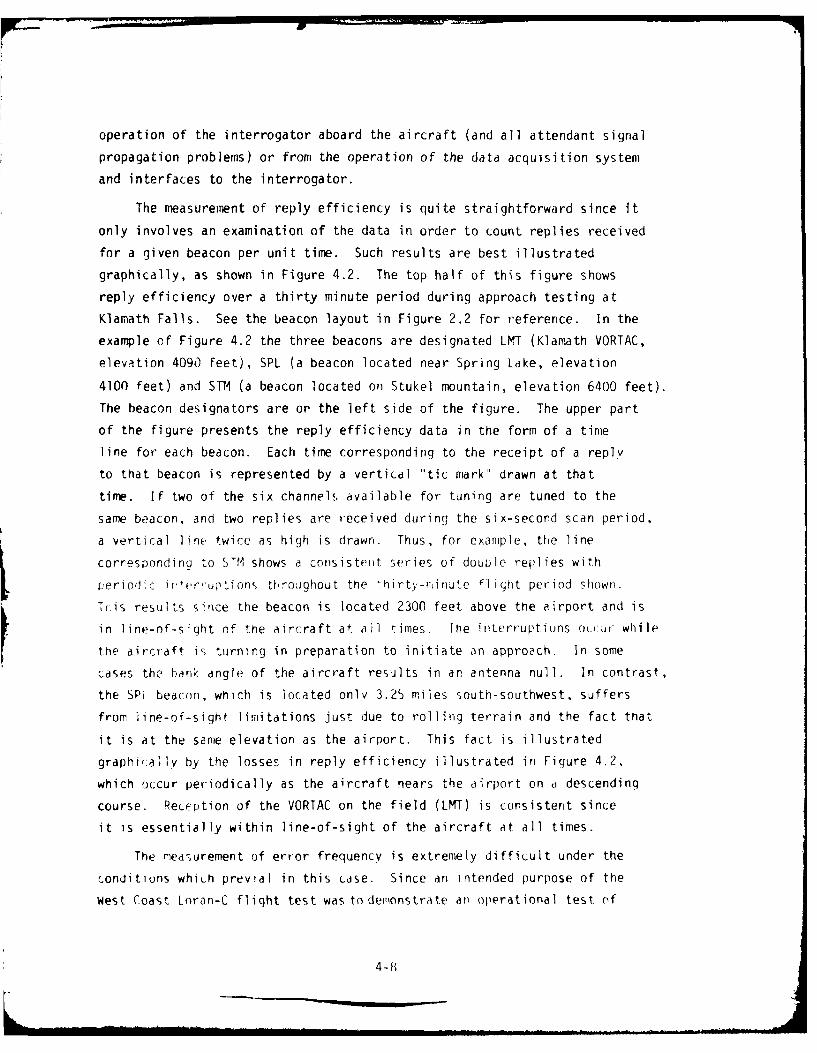
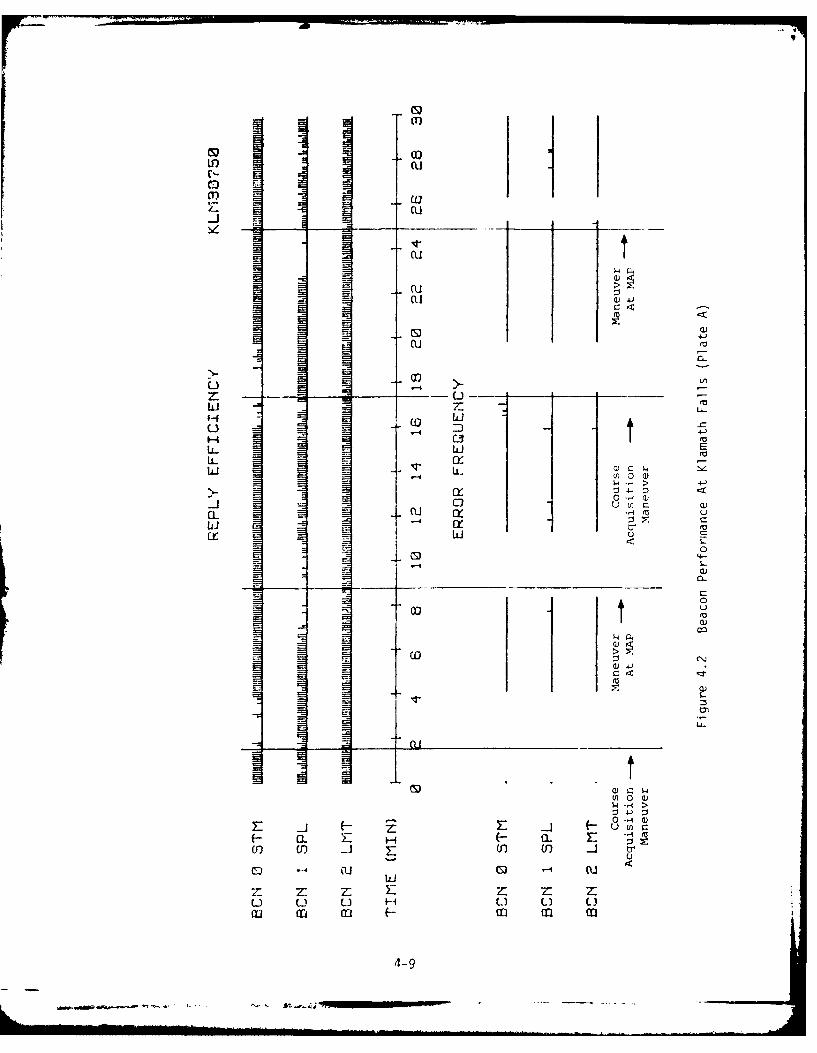
for a given beacon per unit time. Such results are best illustrated
graphically, as shown in Figure 4.2. The top half of this figure shows
reply efficiency over a thirty minute period during approach testing at
Klamath Falls. See the beacon layout in Figure 2.2 for reference. In the
example of Figure 4.2 the three beacons are designated LMT (Klamath VORTAC,
elevation 4090 feet), SPL (a beacon located near Spring Lake, elevation
4100 feet) and STM (a beacon located on Stukel mountain, elevation 6400 feet).
The beacon designators are or the left side of the figure. The upper part
of the figure presents the reply efficiency data in the form of a time
line for each beacon. Each time corresponding to the receipt of a reply
to that beacon is represented by a vertical "tic mark" drawn at that
time. If two of the six channel!, available for tuning are tuned to the
same beacon, and two replies are received during the six-second scan period,
a vertical line twice as high is drawn. Thus, for example, the line
correspondinQ to STM shows a consistent series of douule replies with
peniodic ,er,'up tions tLroaghout the thirty-minute i iqgt period shown.
Iris results since the beacon is located 2300 feet above the airport and is
in line-of-sfqht of the aircraft at ail times. The interruptions ou(:ukr while
the aircraft is turning in preparation to initiate an approach. In some
cases the bank angle of the aircraft results in an antenna null. In contrast,
the SPI beacon, which is located only 3.2b miles south-southwest, suffers
from line-of-sight limitations just due to rolling terrain and the fact that
it is at the same elevation as the airport. This fact is illustrated
graphically by the losses in reply efficiency illustrated in Figure 4.2,
which occur periodically as the aircraft nears the airport on a descending
course. Reception of the VORTAC on the field (LMT) is consistent since
it is essentially within line-of-sight of the aircraft at all times.
The measurement of error frequency is extremely difficult under the
conditions whiLh previal in this case. Since an intended purpose of the
West Coast Loran-C flight test was to demonstrate an operational test of
4-8
01)
(U
cu
(Uo
4-)
cu
- CT 3
C.) 0
, >i
CL 0i
(0u.u
0-4W-
Li -4
CL C-)
u 0co m o
4-94
AT, -4;

a subject navigation receiver utilizing the RAPPS system as the ground
truth reference data source, there was no independent precision tracking
range data available. While the RAPPS data was very useful for evaluating
the performance of the Loran-C navigator, there is in this case no
independent data source available for definitively evaluating the
performance of the RAPPS tracking data. This fdct was, of course,
understood from the outset of this RAPPS evaluation study. The intended
approach was to utilize whatever data was available from the test to
obtain the best practical assessment of the performance of the ranging
system. The approach taken here was to take advantage of the expected
consistency in the Loran-C data. (Even though bias errors of a significant
magnitude exist, they are expected to be relatively constant within the
small region in which a given test flight is conducted.)
Because the DME data is known to contain occasional, randomly-
occurring large errors, it was felt that the smoother Loran-C data
could be used to advantage in isolating the deviant range measurements.
In the course of the earlier Loran-C data reduction task a digital
tracke,- scheme was developed which was utilized to identify range
meastiremer; t which were grossly in error, and eliminate those from the
minimL i-sqiared-error multilateration scheme which was utilized to
determine ground-truth position during the Loran-C error analysis. It
was anticipated for purposes of this range measurement error analysis
that a mixture of Loran-C and DME data could be used to obtain more
consistent estimaLes of aircraft position over the entire flight. In
regard to performing an overall assessment of significant DME errors,
the original tracker scheme had two deficiencies: First, since gains
were set high in order to accurately track the data during the stabilized
part of the approach, the tracker would go unstable during any significant
turning maneuver. Secondly, an improvement in the ability to resolve
smaller range measurement errors was sought. There was also another
problem, which occurred at only one location (South Lake Tahoe). The
beacon geometry was such that the range-range solution becomes ambiguous
as the aircraft arrived over the airport. The DME data tracker would
often corverqe on the ambiguous (false) range-ronge solution and -o would
provide completely erroneous position information after that point.
4-10
By adding Loran-C data to the tracker algorithm, it was anticipated that
these problems could be overcome.
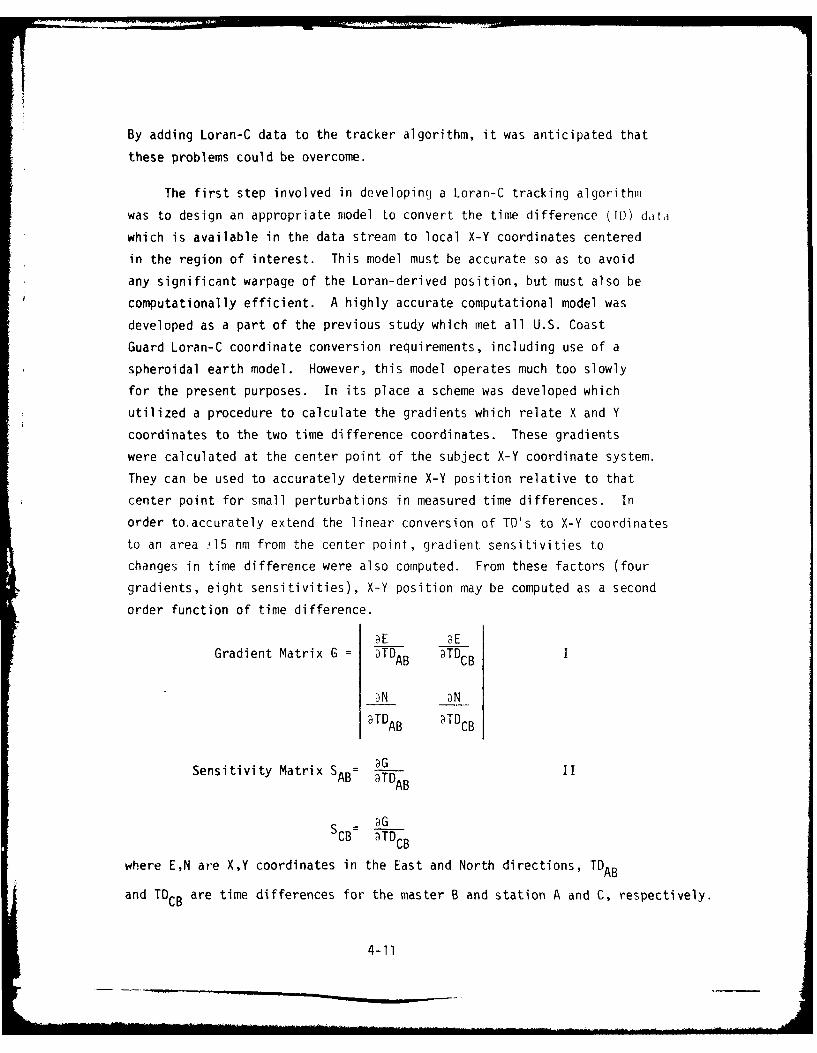
The first step involved in developing a Loran-C tracking algorithm
was to design an appropriate model Lo convert the time difference (TI)) dat,]
which is available in the data stream to local X-Y coordinates centered
in the region of interest. This model must be accurate so as to avoid
any significant warpage of the Loran-derived position, but must also be
computationally efficient. A highly accurate computational model was
developed as a part of the previous study which met all U.S. Coast
Guard Loran-C coordinate conversion requirements, including use of a
spheroidal earth model. However, this model operates much too slowly
for the present purposes. In its place a scheme was developed which
utilized a procedure to calculate the gradients which relate X and Y
coordinates to the two time difference coordinates. These gradients
were calculated at the center point of the subject X-Y coordinate system.
They can be used to accurately determine X-Y position relative to that
center point for small perturbations in measured time differences. In
order to.accurately extend the linear conversion of TD's to X-Y coordinates
to an area 15 nm from the center point, gradient sensitivities to
changes in time difference were also computed. From these factors (four
gradients, eight sensitivities), X-Y position may be computed as a second
order function of time difference.
Gradient Matrix G = DTDAB TDCB I
DN 3N
9TDAB aTDCB
Sensitivity Matrix SAB- TDATDMAB I
S G
SCB TDCB
where E,N are X,Y coordinates in the East and North directions, TDAB
and TDCB are time differences for the master B and station A and C, respectively.
4-11
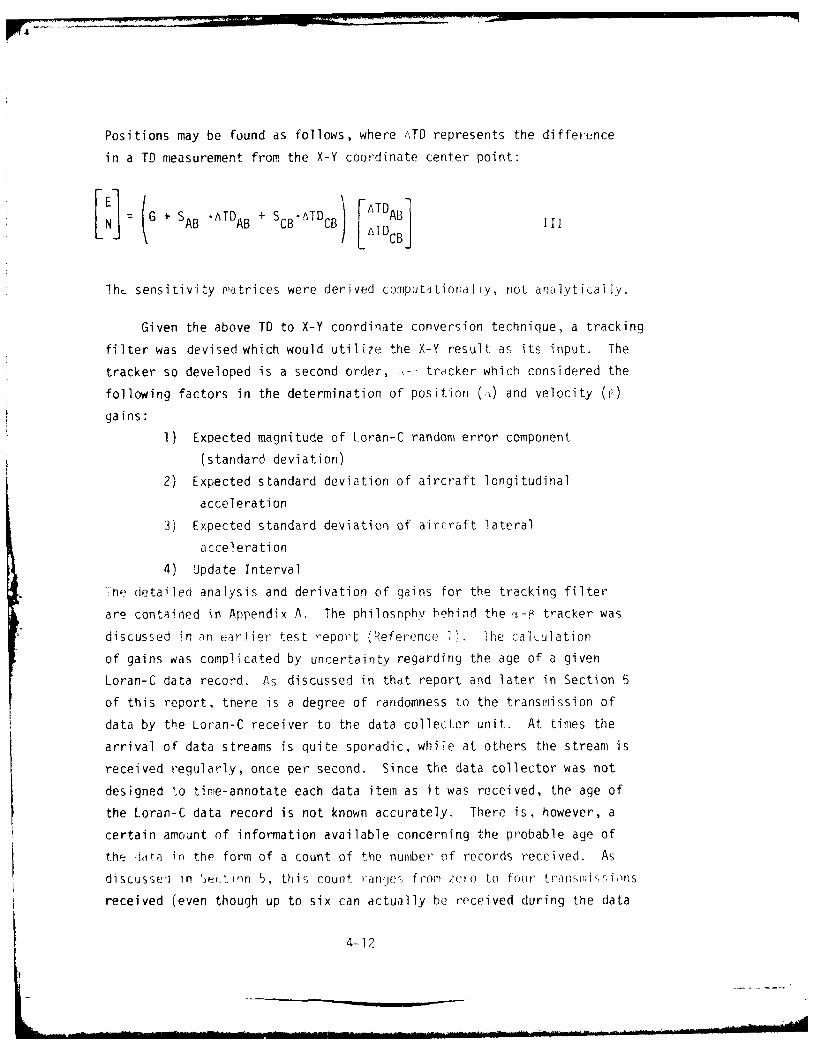
Positions may be found as follows, where ATD represents the difference
in a TD measurement from the X-Y coordinate center point:
FE G ATD + S * tT F1TAB1LNJ AB AB CB C)L ci
ThL sensitivity matrices were derived computationally, not analytically.
Given the above TD to X-Y coordinate conversion technique, a tracking
filter was devised which would utilize the X-Y result as its input. The
tracker so developed is a second order, ,-:-trdcker which considered the
following factors in the determination of position (,,) and velocity (r)
gains:
1) Expected magnitude of Loran-C random error component
(standard deviation)
2) Expected standard deviation of aircraft longitudinal
acceleration
3) Expected standard deviation of aircraft lateral
acceleration
4) Update Interval
ne detailed analysis and derivation of gains for the tracking filter
are contained in Appendix A. The philosophy behind the Y-P tracker was
discussed in an earlier test report (Reference 1). The calculation
of gains was complicated by uncertainty regarding the age of a given
Loran-C data record. As discussed in thdt report and later in Section 5
of this report, there is a degree of randomness to the transmission of
data by the Loran-C receiver to the data collector unit. At times the
arrival of data streams is quite sporadic, while at others the stream is
received regularly, once per second. Since the data collector was not
designed to time-annotate each data item as it was received, the age of
the Loran-C data record is not known accurately. There is, however, a
certain amount of information available concerning the probable age of
the ii~a in the form of a count of the number of records received. As
di scusse1 in i t n 5, th is count ranges from zero to four tIrsIIIi s'; ions
received (even though up to six can actually be received during the data
4-12
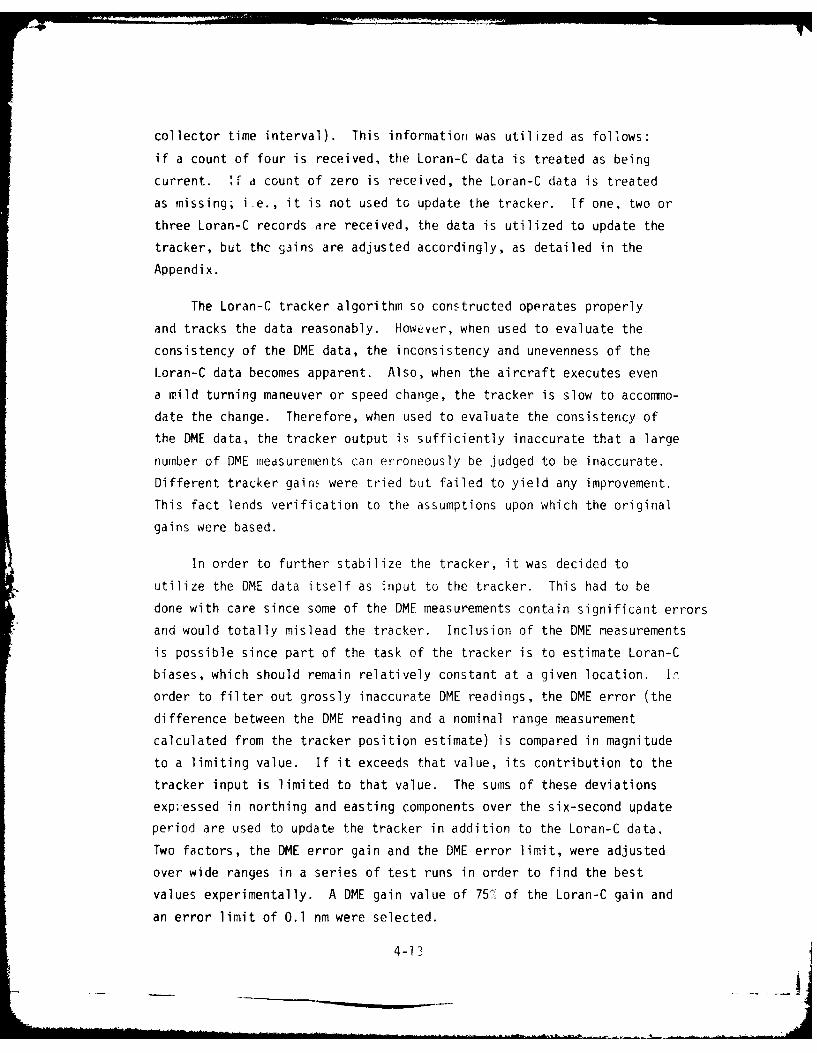
collector time interval). This information was utilized as follows:
if a count of four is received, the Loran-C data is treated as being
current. if a count of zero is received, the Loran-C data is treated
as missing; i.e., it is not used to update the tracker. If one, two or
three Loran-C records are received, the data is utilized to update the
tracker, but the gains are adjusted accordingly, as detailed in the
Appendix.
The Loran-C tracker algorithm so constructed operates properly
and tracks the data reasonably. However, when used to evaluate the
consistency of the DME data, the inconsistency and unevenness of the
Loran-C data becomes apparent. Also, when the aircraft executes even
a mild turning maneuver or speed change, the tracker is slow to accommo-
date the change. Therefore, when used to evaluate the consistency of
the DME data, the tracker output is sufficiently inaccurate that a large
number of DME measurements can erroneously be judged to be inaccurate.
Different tracker gains were tried but failed to yield any improvement.
This fact lends verification to the assumptions upon which the original
gains were based.
In order to further stabilize the tracker, it was decided to
utilize the DME data itself as input to the tracker. This had tu be
done with care since some of the DME measurements contain significant errors
and would totally mislead the tracker. Inclusion of the DME measurements
is possible since part of the task of the tracker is to estimate Loran-C
biases, which should remain relatively constant at a given location. In
order to filter out grossly inaccurate DME readings, the DME error (the
difference between the DME reading and a nominal range measurement
calculated from the tracker position estimate) is compared in magnitude
to a limiting value. If it exceeds that value, its contribution to the
tracker input is limited to that value. The sums of these deviations
exp;essed in northing and easting components over the six-second update
period are used to update the tracker in addition to the Loran-C data.
Two factors, the DME error gain and the DME error limit, were adjusted
over wide ranges in a series of test runs in order to find the best
values experimentally. A DME gain value of 75% of the Loran-C gain and
an error limit of 0.1 nm were selected.
4-13

The RAPPS evaluation program produces two forms of output. The
first, depicted in Figure 4.2, is a plot of beacon reply efficiency
and error frequency versus time. Each plot shows thirty continuous
minutes of flight data (due to plotter size and resolution limitations).
Thus most of the test flights require three or four individual plots to
depict the entire flight. The second output of the RAPPS evaluation
program is a printout of beacon error statistics. A line is printed
corresponding to each identified range measurement error. This is for
purposes of manual analysis. For purposes of this analysis, the
threshold used to differentiate a "large" error from a routine condition
was set at 1000 feet. Thus a line is printed (and a line segment is
plotted on the error frequency axis) for every DME measurement which
deviates more than 1000 feet from the tracker-derived standard range.
tn additional printout is produced at the end of the run which prints
out statistics for all those DME measurements which were within the
1000 feet limit. Mean and standard deviation for each beacon is calculated.
Note that all OME measurements are corrected for slant range error
effects before processing.
A final step in the processing is again related to the basic -inability
of a tracking algorithm to accurately track the data during turning
maneuvers and speed changes. Also, there are periods when so much Loran-C
data is missing that the data which does exist is difficult to track.
In these cases, the program is unable to perform an accurate assessment
of OME ranging errors. Therefore, a facility was introduced into the
program which allows specification of analysis start and stop times for
purposes of inclusion on the error frequency plots and in the range
measurement statistics. The deleted time periods appear as breaks in the
axis in the error frequency plots (see Figure 4.2).
4.3 RAPPS RANGING SYSTEM PERFORMANCE ASSESSMENT
For this section, the tools discussed in the previous section have
been utilized in order to analyze the data taken at South Lake Tahoe,
Klamnath Falls, Grand Junction, Reno and Stead. The data taken at Stead
was of somewhat limited value for purposes of evaluating the RAPPS
ranging system. This was the result of a very tight Flight pattern.
The results were not analyzed since very little of the flight was
aictuajlly flown in a steady Ltate condition. [Data taken at South Lake
4-14
Tahoe on July 7 (which was terminated due to an aircraft system failure)
and on July 26 have both been analyzed. Some of the data taken at Grand
J:jrction was near the triad baseline extension area, and so the data
is quite noisy. This creates some difficulty in analyzing the data.
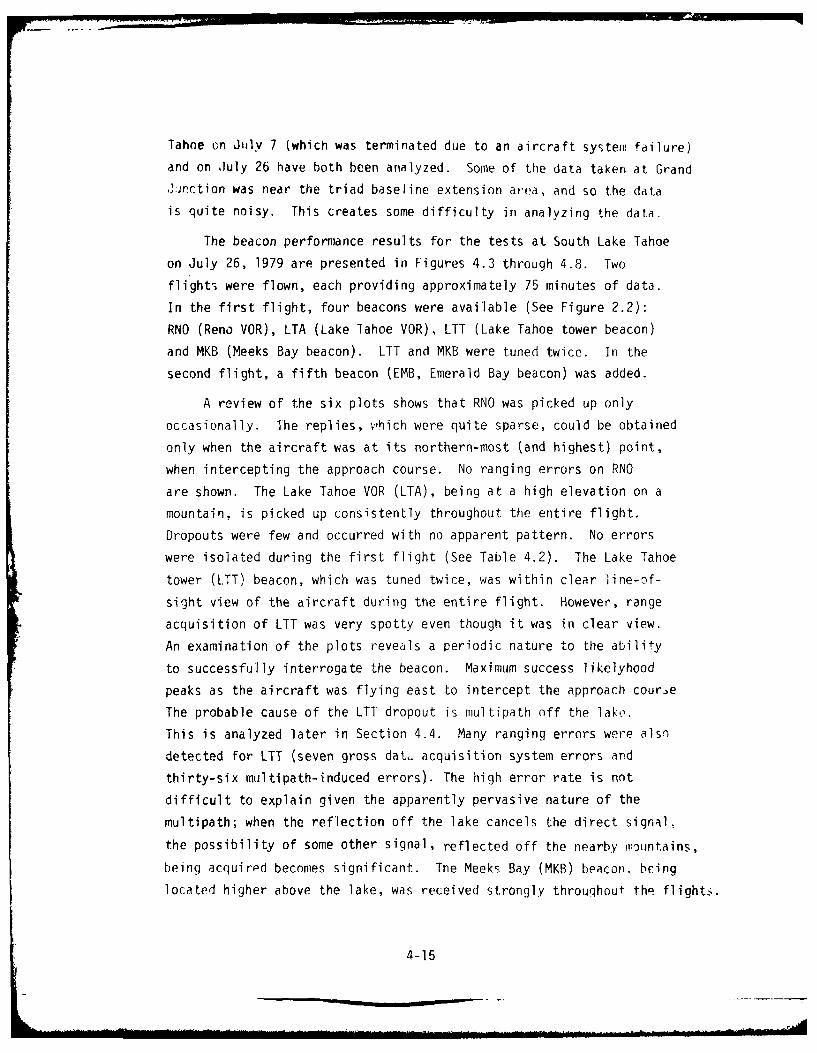
The beacon performance results for the tests at South Lake Tahoe
on July 26, 1979 are presented in Figures 4.3 through 4.8. Two
flights were flown, each providing approximately 75 minutes of data.
In the first flight, four beacons were available (See Figure 2.2):
RNO (Reno VOR), LTA (Lake lahoe VOR), LTT (Lake Tahoe tower beacon)
and MKB (Meeks Bay beacon). LTT and MKB were tuned twice. In the
second flight, a fifth beacon (EMB, Emerald Bay beacon) was added.
A review of the six plots shows that RNO was picked up only
occasionally. The replies, vhich were quite sparse, could be obtained
only when the aircraft was at its northern-most (and highest) point,
when intercepting the approach course. No ranging errors on RNO
are shown. The Lake Tahoe VOR (LTA), being at a high elevation on a
mountain, is picked up consistently throughout the entire flight.
Dropouts were few and occurred with no apparent pattern. No errors
were isolated during the first flight (See Table 4.2). The Lake Tahoe
tower (LTT) beacon, which was tuned twice, was within clear line-of-
sight view of the aircraft during the entire flight. However, range
acquisition of LTT was very spotty even though it was in clear view.
An examination of the plots reveals a periodic nature to the ability
to successfully interrogate the beacon. Maximum success likelyhood
peaks as the aircraft was flying east to intercept the approach couroe
The probable cause of the LTT dropout is multipath off the lake.
This is analyzed later in Section 4.4. Many ranging errors were also
detected for LTT (seven gross dat. acquisition system errors and
thirty-six multipath-induced errors). The high error rate is not
difficult to explain given the apparently pervasive nature of the
multipath; when the reflection off the lake cancels the direct signal,
the possibility of some other signal, reflected off the nearby mountains,
being acquired becomes significant. Tne Meeks Bay (MKB) beacon, being
located higher above the lake, was received strongly throughout the flights.
4-15

LOmuco
QTCr cucnU
in
(U
0)0
4~) (U
'a
Q)
Z3(.
H IID
LLL'I ~ 110 a3 Z
0Z
4-1
Inn
cotF cu
cu
u >u
1414
E -4
4oL LUi
IL
0
a)
0
-j
0C', co
0 a: 0 C E o a:
- (U mT m 4 (U MT
z z z z z z zm m
4-17

m
cocr)i W
(U
OU
cu uU Li Z
C H Li
I- H 0
U--
C
cz- Li0Eu
I-u
-JM
L- c
U- z -zU
4-181

m (U
cu
cu
2ccu
U (Da) 0
U- w
EL cx
c co j 0
CL cU Ixw (
a) Ii.0
C9
(U
-ED
CU
0
CU (r) F m cu a: LFz z z z z H: : F x- z(a .. u m- en ca cx .. u r
4-19

0)*
1LJ C5)
-LJ
LiJ
a)
~ U U
L H z
o4 2
- CU
au
1~ ODz UU
H C 3
w L.
ww
C9U
C Li
a ~ LiJ E r-cr j iij
IL (U mw)IJ() 4 ( T
zd z - zILZ: Zu
(a Io m Iom m d
4-2

Table 4.2 South Lake Tahoe Beacon Performance Statistics(Flights on 7/26/79)
Beacon Replies Gross Multipath Residual ErrorsC r ro rs r ro rs ....... ...Code Analyzed (Replies) (Replies) Mean SD
RNO 62 0 0 67' 252'
LTA 844 0 12 162' 276'
LTT 659 11 56 35' 353'
MKB 790 0 6 -36' 233'
EMB 538 0 1 -63' 290'
Total 2893 11 75 35' 299'
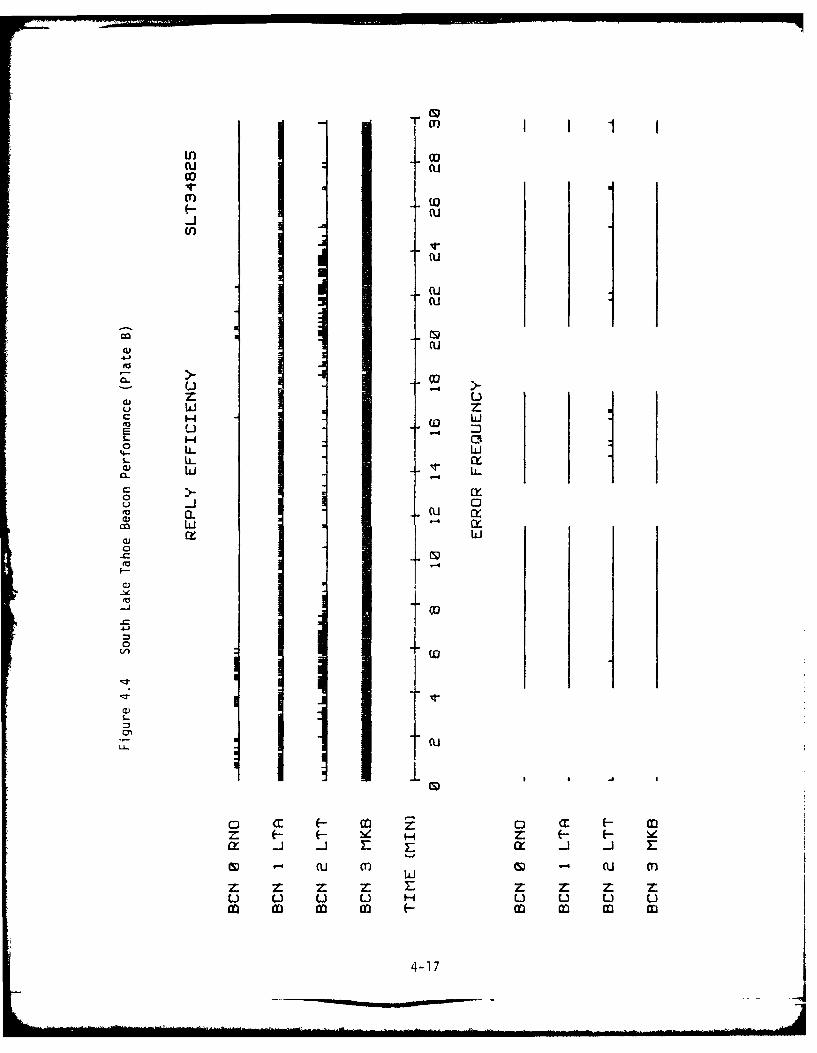
The second flight of the day was conducted with the benefit of
an additional beacon at Emerald Bay (EMB). That beacon was received
consistently through the entire flight. The other beacon (MKB) had
been turned off at the end of the first fliqht. Through a communications
mishap, it was not turned on again until very late in the second flight.
At the tai I end of the flight (Figure 4.8), a series of errors are
pointed out for LTA and MKB. These appear to be the result of the
inability of the tracking algorithm to follow the data, rather than being
range measurement errors.
The residual error statistics at South Lake Tahoe are quite
reasonable, as shown in Table 4.2, 299 feet overall. The LTT statistic
stands out as being higher than the rest, which is not surprising given
the multipath problem which has been identified.
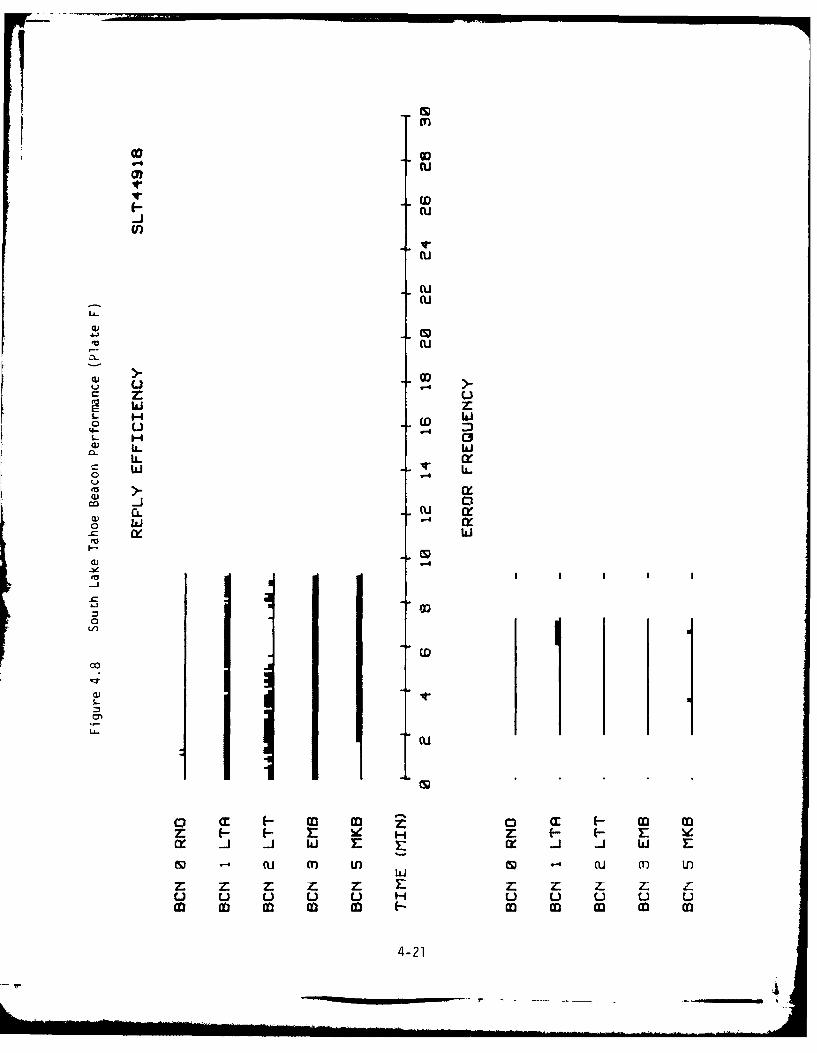
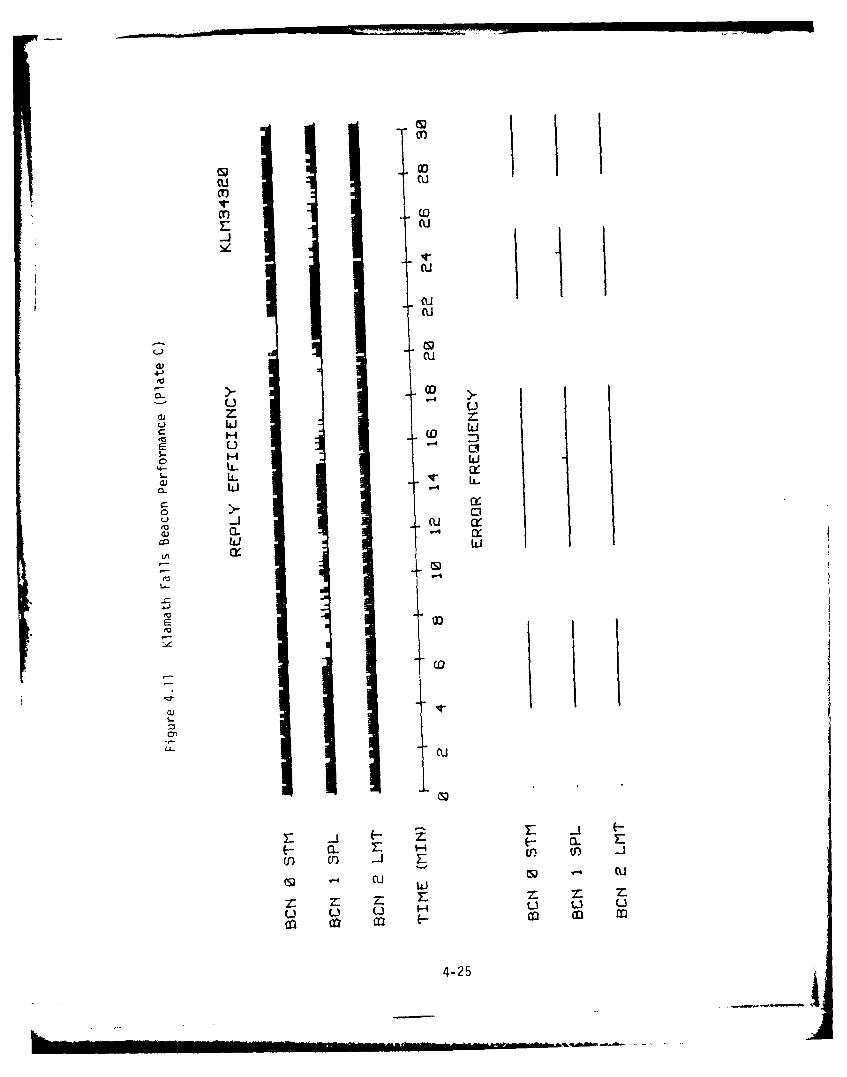
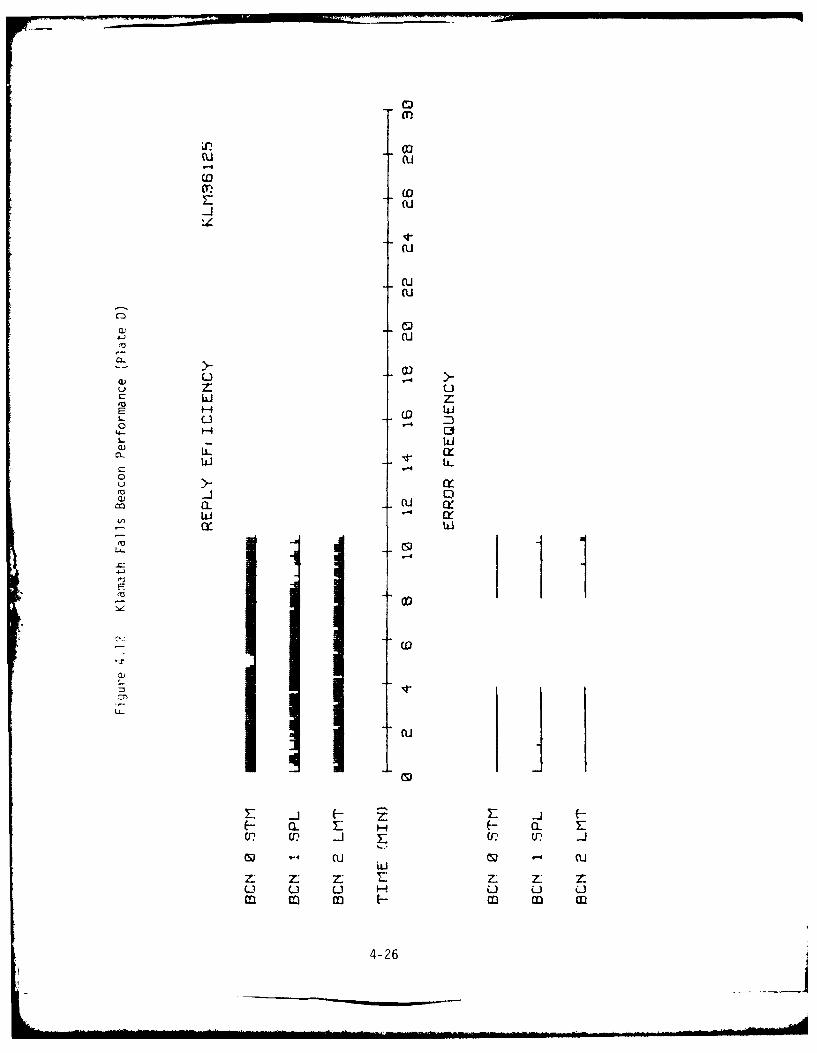
The beacon performance results for the tests at Klamath Falls on
July 24, 1979 are presented in Figures 4.9 through 4.12. Two separate
flights were flown. Approximately 43 minutes of data were taken on each.
Three beacons were used (see Figure 2.3) and two channels were tuned to
each beacon. Throughout the flight, consistent replies were received
from the airport VOR (LMT). The reply efficiency line is virtually
constant throughout, although a few ranging errors were detected. As
is shown in Table 4.3, all six of these were of the multipath type, as
4-22
(S)
(U
cu
uCz uu
W~ zILi
4- '-3
U- Lii
03CL(U M~
Li~
m co I~
U-U
cu LLI0 -4 c
4-2
m
Ln C
cu
-JL
cu
cu
a)
uC
Z C3-4 n
Cl Lii
cc
0a- fu cz
a: Lii
(S)
1-
II,
UD m U) V) J
-4 J -4 Cu
Ui Li u u U uCD C fLE 0 C M CD cD
(rT)
Cu (U
CTS)
cu4-J
u Uua) Z
L) ucH (0
ED
a) .
a) CL
(S4
U-
CoJ
a)S
~.- a.a.
-44 (U
Z: z : E:U U U HU C.) u
4-25 4
coMl0
c-u
(U
(U
Cu
L)
H 0d
LLLL
(r I
E44-21
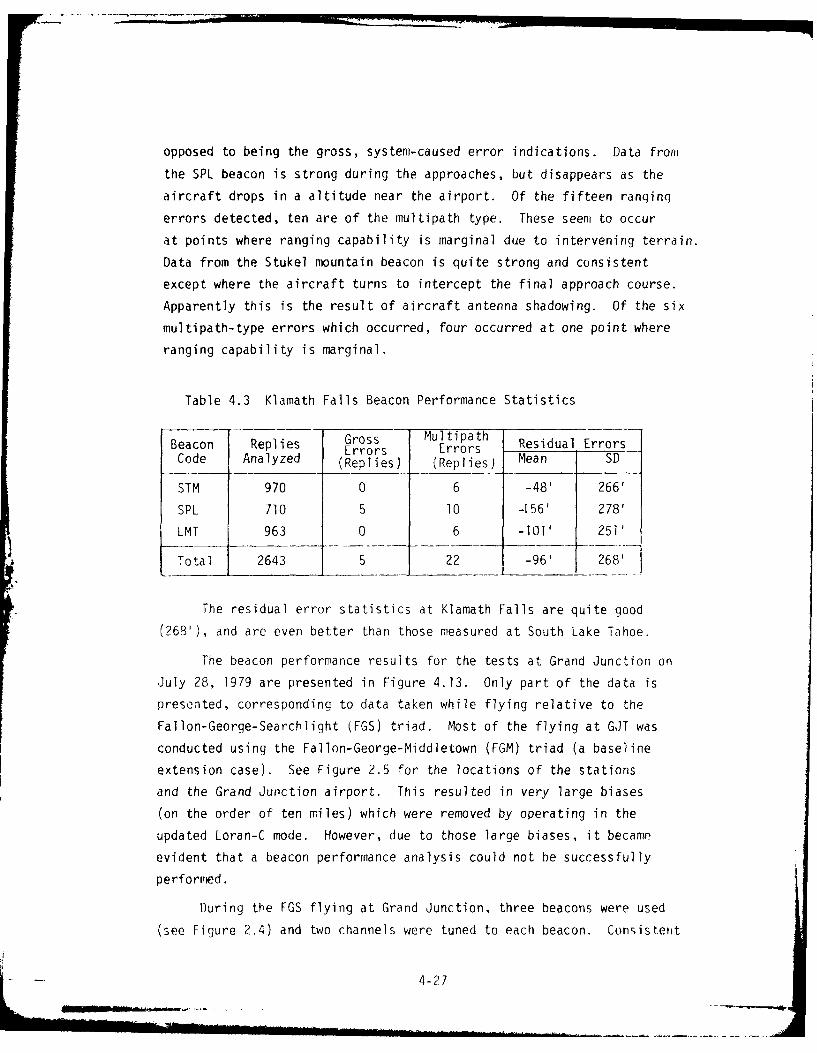
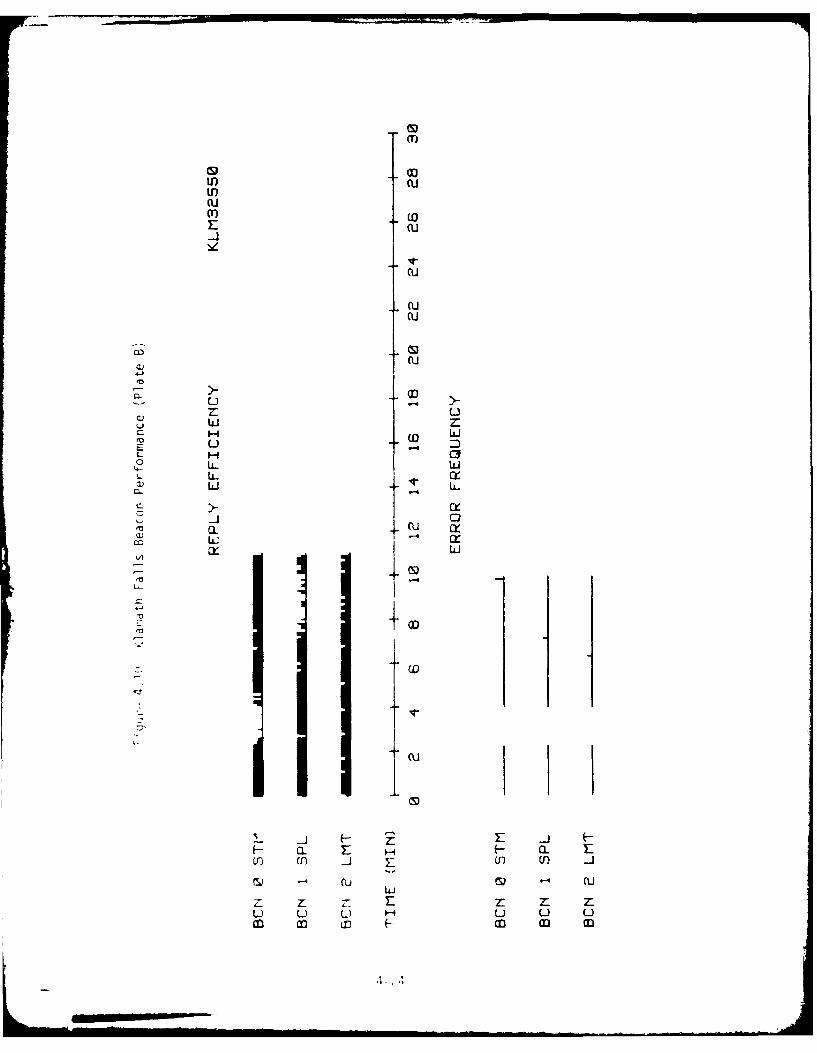
opposed to being the gross, system-caused error indications. Data from
the SPL beacon is strong during the approaches, but disappears as the
aircraft drops in a altitude near the airport. Of the fifteen ranging
errors detected, ten are of the multipath type. These seem to occur
at points where ranging capability is marginal due to intervening terrain.
Data from the Stukel mountain beacon is quite strong and consistent
except where the aircraft turns to intercept the final approach course.
Apparently this is the result of aircraft antenna shadowing. Of the six
multipath-type errors which occurred, four occurred at one point where
ranging capability is marginal.
Table 4.3 Klamath Falls Beacon Performance Statistics
Beacon Replies Gross MultipathErrors Errors Residual Errors
Code Analyzed (Replies) (Replies) Mean SD
STM 970 0 6 -48' 266'
SPL 710 5 10 -156' 278'
LMT 963 0 6 -101' 251'
Total 2643 5 22 -96' 268'
The residual error statistics at Klamath Falls are quite good
(268'), and are even better than those measured at South Lake Tahoe.
The beacon performance results for the tests at Grand Junction on
July 28, 1979 are presented in Figure 4.13. Only part of the data is
presented, corresponding to data taken while flying relative to the
Fallon-George-Searchlight (FGS) triad. Most of the flying at GJT was
conducted using the Fallon-George-Middletown (FGM) triad (a baseline
extension case). See Figure 2.5 for the locations of the stations
and the Grand Junction airport. This resulted in very large biases
(on the order of ten miles) which were removed by operating in the
updated Loran-C mode. However, due to those large biases, it became
evident that a beacon performance analysis could not be successfully
performed.
During the FGS flying at Grand Junction, three beacons were used
(see Figure 2.4) and two channels were tuned to each beacon. Consistent
4-27

(00
-4 (U
1-u1*U
a)(U
04-uC
E uUS-U
E L uj
coc 0d
0 L (U
u axL) " IL
-4
a. ceZ:m x
S.-C H4 I -
'4-
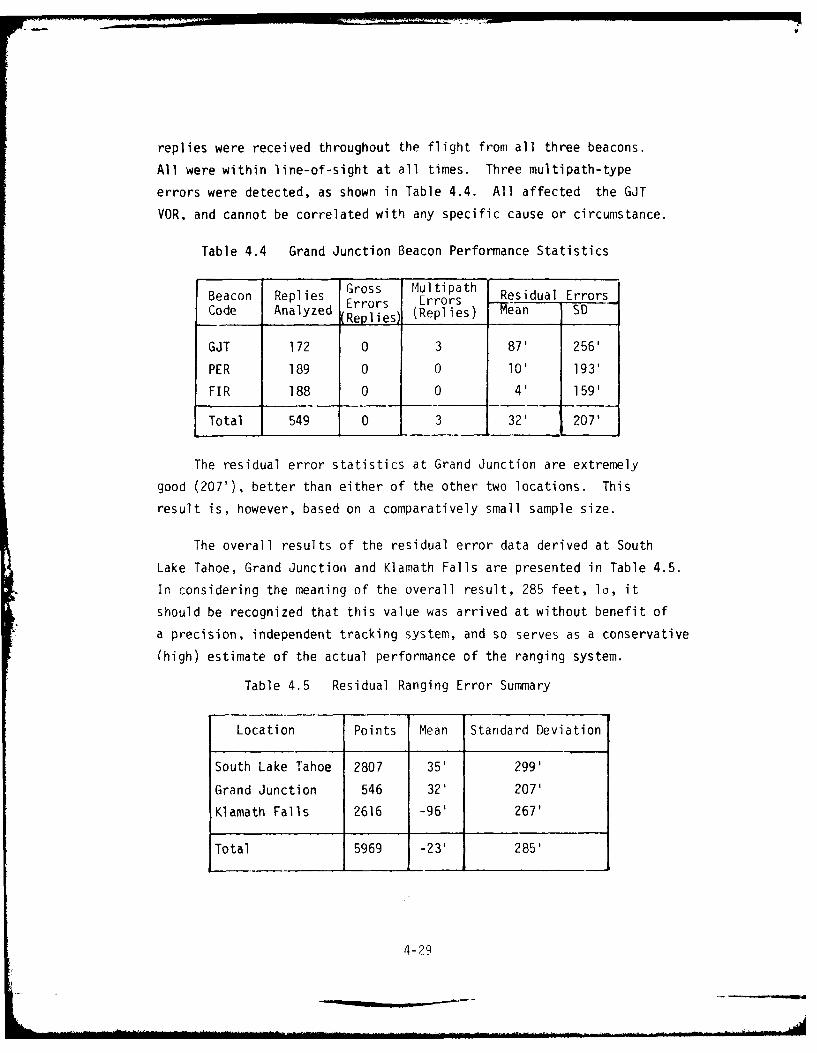
replies were received throughout the flight from all three beacons.
All were within line-of-sight at all times. Three multipath-type
errors were detected, as shown in Table 4.4. All affected the GJT
VOR, and cannot be correlated with any specific cause or circumstance.
Table 4.4 Grand Junction Beacon Performance Statistics
Beacon Replies Gross Multipath Rco Analyed Errors Errors Residual Errors
Code Analyzed (Replies) (Replies) '-Nean __SD -
GJT 172 0 3 87' 256'
PER 189 0 0 10' 193'
FIR 188 0 0 4' 159'
Total 549 0 3 32' 207'
The residual error statistics at Grand Junction are extremely
good (207'), better than either of the other two locations. This
result is, however, based on a comparatively small sample size.
The overall results of the residual error data derived at South
Lake Tahoe, Grand Junction and Klamath Falls are presented in Table 4.5.
In considering the meaning of the overall result, 285 feet, l, it
should be recognized that this value was arrived at without benefit of
a precision, independent tracking system, and so serves as a conservative
(high) estimate of the actual performance of the ranging system.
Table 4.5 Residual Ranging Error Summary
Location Points Mean Standard Deviation
South Lake Tahoe 2807 35' 299'
Grand Junction 546 32' 207'
Klamath Falls 2616 -96' 267'
Total 5969 -23' 285'
4-29
4.4 BEACON PLACEMENT EFFECTS AND GUIDELINES
In the process of conducting this test program and processing and
analyzing the results, much was learned regarding the layout of beaconsfor a successful test program. These factors fall into two basic groups:
beacon planning, and actual layout of the beacons. In Section 4.1,
several techniques for locating beacons were discussed. Specific problems
along these lines will be discussed later.
A basic philosophy towards beacon placement was adopted during the
planning phase of the West Coast Loran-C test program. This philosophy
included the following tenets:
1) Utilize existing VORTACS whenever possible
2) Minimize the number of temporary beacon installations
3) Maximize the potential for accurately positioning the
temporary beacons4) Plan for ease of installation and power access
The basic approach was to position one beacon at or near the airport
(Reno and Klamath Falls have existing commissioned DMEs on the airport
already). This would provide coverage throughout the approach procedure.
A second beacon was to be located to the side of the approach course
(from 5 to 10 miles off course), approximately half way down the approach
path (5 miles from the touchdown zone). At Reno and Grand Junction
existing VORTACs fulfilled this role. The philosophy also included the
use of a third beacon located in such a manner that some redundant coverage
is provided, for the following purposes:
1) as a cross check for the other range measurements
2) as a substitute during times when a loss of signal (due tO
terrain masking, antenna null pattern or multipath effects)
is experienced.
3) to improve overall positioning accuracy
As illustrated in Figure 2.1, the beacons utilized at South Lake Tahoeincluded a beacon on the airport (called LTT) and a beacon located to
the side of the approach course (called MKB). In addition, two VORTACs
were tuned: Lake Tahoe VOR (LTA) and Reno VOR (RNO). As was shown in
Section 4.3, RNO, being behind mountains, was received only sporadically.
4-30
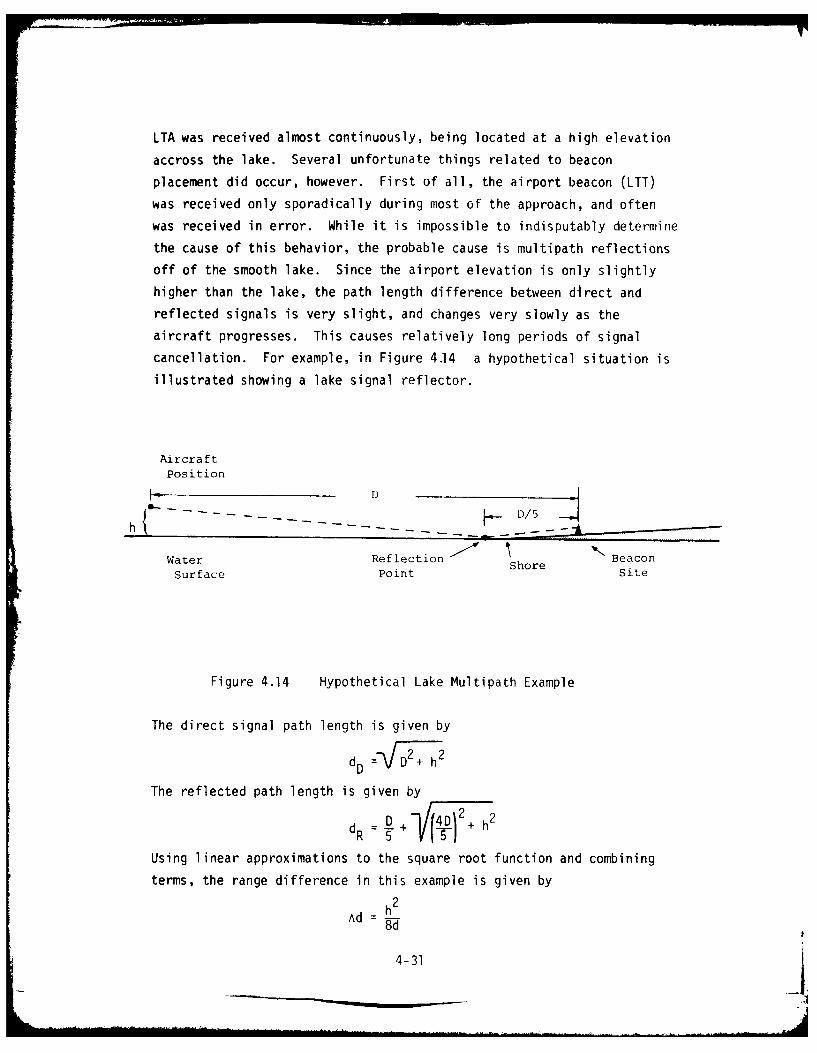
LTA was received almost continuously, being located at a high elevation
accross the lake. Several unfortunate things related to beacon
placement did occur, however. First of all, the airport beacon (LTT)
was received only sporadically during most of the approach, and oftenwas received in error. While it is impossible to indisputably determine
the cause of this behavior, the probable cause is multipath reflections
off of the smooth lake. Since the airport elevation is only slightlyhigher than the lake, the path length difference between direct and
reflected signals is very slight, and changes very slowly as the
aircraft progresses. This causes relatively long periods of signal
cancellation. For example, in Figure 4.14 a hypothetical situation is
illustrated showing a lake signal reflector.
Aircra ftPosition
Water Reflection SoeBeaconSurface Point Site
Figure 4.14 Hypothetical Lake Multipath Example
The direct signal path length is given by
d= D2+ h2
The reflected path length is given by
dR 5 + T2 h
Using linear approximations to the square root function and combining
terms, the range difference in this example is given by
Ad h
4-31

If D = 10 nm and h = 3200 feet, then AD = .0035 nm, (21 feet). At
0 - 8 nm and h - 2560 feet, AD = .0028 nm (17 feet). Thus in two miles
the path difference changes by 4 feet. At 150 kt this amounts to 0.08
feet per second. Since the TACAN wavelength t 35 mm (0.115 feet), the
period of a reinforcement/cancellation cycle is on the order of 1.4 seconds.
The situation at South Lake Tahoe is believed to be similar to this.
When the signal phases are in cancellation, then multipath reflections
from other objects such as the surrounding mountains can cause lock-on
giving a false range indication. As demonstrated in Section 4.3, this
happened quite frequently. This could have been cured had the beacon
been placed at some location with a much higher elevation.
The second beacon placement problem resulted from one of the beacons
being placed in an unplanned location (the Meeks Bay location, MKB).
Original plans called for a single beacon to be located further south
(at Rubicon Point). When the time for beacon installation came, one
was installed at Meeks Bay, and a second was installed further south
at Emerald Bay (EMB), later in the day. The problem with the MKB location
is that it is virtually colinear with two other beacons, LTA and LTT,
and also the runway threshold. Because of this, when the aircraft nears
the runway, if LTT is not being received, the other two beacons (LTA, MKB)
cannot be counted on to give an accurate position measurement since the
multilateration GDOP grows large. This created a considerable data
reduction problem during the Loran-C accuracy analysis study. Later in
the day when the EMB beacon was installed, this problem was relieved
considerably.
In Figure 2.2 the beacon layout for Klamath Falls is illustrated.
The same philosophy (airport beacon-Klamath VOR (LMT), off-course beacon
(SPL) and third beacon (STM)) was followed. In this case two types of
beacon placement problems arose. Due to the low elevation of SPL and
the rolling terrain, that beacon was unusable during the final part of
the approach (as was demonstrated in Section 4.3). The other problem
was discussed in Section 4.1. There was some uncertainty in the knowledge
of the exact location of the STM beacon.
4-32

In Figure 2.3 the beacon layout at Grand Junction is illustrated.
At this site an airport beacon (designated FIR), an off course beacon
(Grand Junction VOR (GJT)) and a third beacon (PER) were used. Good
coverage was available from all three beacons, and few problems were
encountered at data reduction time.
Figure 2.4 illustrates the beacon layout used for the Reno Airport
shakedown flights. No attempt to optimize beacon layout here was made.
Existing DME beacons at Reno VOR (RNO) and the Reno ILS DME (IRN) were
tuned. The beacon at the Sierra-Nevada Corp. facility at Stead airport
was used (called SNC). A beacon was located on the top of Peavine
mountain (PVN). All locations were accurately known. Coverage from all
beacons was relatively good. Shakedown flights were also performed at
Reno Stead airport. For this test the Reno VOR(RNO), PVN and SNC locations
were used. Also, a beacon (DRI) was located southwest of the airport on
the roof of the University of Nevada Desert Research Institute. As before
no attempts were made to optimize beacon layout. Reasonably good
coverage was available from PVN and SNC and, to a lesser extent, DRI.
Coverage from RNO was spotty due to the 10-15 mile range and intervening
terrain.
After a review of the success rate of the beacon layout philosophy
adopted, it may be concluded that it worked reasonably well. Even better
results would have obtained if the philosophy had been adhered to rigidly
(the most notable exception being the unplanned beacon location at South
Lake Tahoe). The multipath interference problem with the airport beacon
at South Lake Tahoe was unanticipated. It is apparent that the philosophy
applied has at least one flaw, however. As the aircraft proceeds to the
missed approach point, the GDOP relative to the airport beacon and off-
course beacon deteriorates. If redundant coverage is not available, it
beromes impossible to determine position accurately. This problem is
very sensitive to the actual flight path of the aircraft. If the aircraft
drifts off towards the off-course beacon side of the course line, the
aircraft will actually fly through the baseline between the beacons,
resulting in infinite GDOP. In order to overcome this problem, an
alternative beacon geometry is suggested, as pictured in Figure 4.15.
4-33
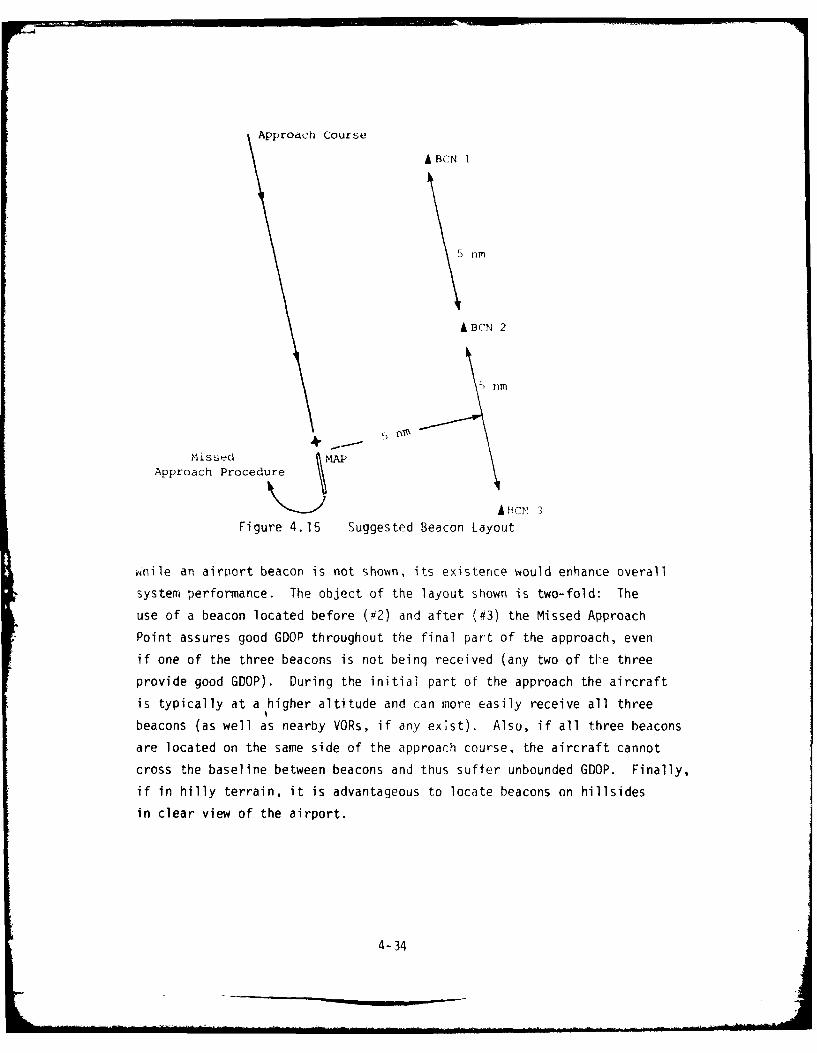
Approach Course
A BCN I
nm
BCN 2
Im
MissedApproach Procedure VI
AB3CN 3
Figure 4.15 Suggested Beacon Layout
,d ile an airport beacon is not shown, its existence would enhance overall
system performance. The object of the layout shown is two-fold: The
use of a beacon located before (#2) and after (#3) the Missed Approach
Point assures good GDOP throughout the final part of the approach, even
if one of the three beacons is not being received (any two of tIhe three
provide good GDOP). During the initial part of the approach the aircraft
is typically at a higher altitude and can more easily receive all three
beacons (as well as nearby VORs, if any exist). Also, if all three beacons
are located on the same side of the approach course, the aircraft cannot
cross the baseline between beacons and thus suffer unbounded GDOP. Finally,
if in hilly terrain, it is advantageous to locate beacons on hillsides
in clear view of the airport.
4-34

5.0 PERFORMANCE OF THE DATA COLLECTOR
This section covers the basic features and capabilities of the data
collector unit of the RAPPS system. The data collector consisted of an
Intel System 80 chassis and power supply, SBC-80 processor card,
associated memory RAM and PROM card, interface port card and special
wire-wrap card configured to interface to the DME/Channel scanner unit.
Also included is a Tektronix 4051 intelligent graphic terminal, a
Tektronix 4923 tape cartridge recorder, and a Tandberg SCDR-3000 tape
cartridge recorder. The system was controlled by a PROM-resident software
package. Communications with the operator is accomplished through the
4051 terminal.
3.1 TIMELINESS AND SUITABILITY OF THE DATA
The data stream collected and formatted for output by the SBC-80
system is documented in detail in the flight test report L l . Included
in the output data format are fields for each of the six DME measurements
(one per channel tuned), one field for TDL-424 Lordn-C receiver CDU
(control-display unit) data (the TDL-424 was not installed during this
test), four fields for TDL-711 CDU data, one field each for altitude and
time (one second intervals), and one field for the TDL-711 RDU (remote-
display unit) data stream (157 bytes of core-image data). All but the
TDL-711 RDU data stream are illustrated in Figurp 5.1. The entire buffer
is initialized to character "1" after a record is output to the tape
recorders (the RDU buffer is not so initialized). Data received replaces
current buffer contents such that the buffer always contains the last
data received before a data record is recorded. In the case of the DME
data, positions are reserved for six successive channel scans. In the
case of the Loran-C (TDL-711) data up to four of the possible maximum of
six data records receivable in the 6-second cycle time are stored. In
none of these cases are unique time identifiers associated with the
individual data items. This does not create a serious problem in regard
to the DME data since it is known that the most recent data is in the
left-most DME position, and that it corresponds to the time-of-day
recorded in the time position. The case of the Loran-C data is more
5-1
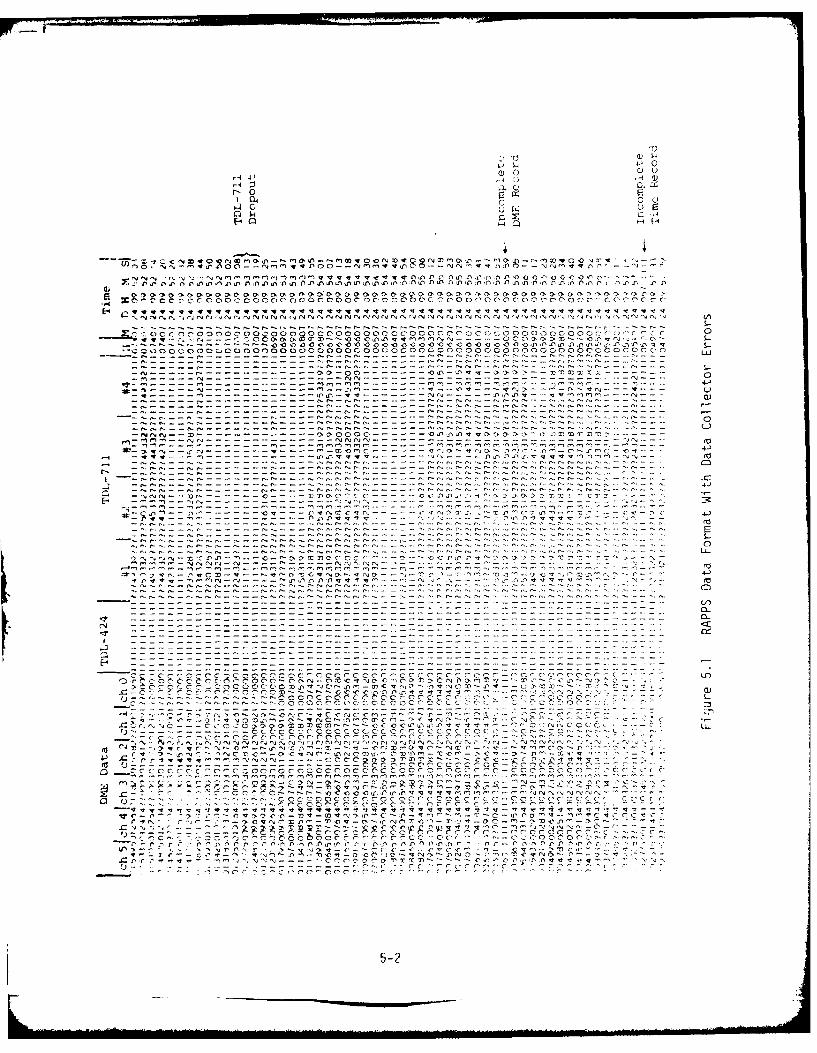
&J 4) 4 U
A4-4 4
-0 f04 0 000
cc -- NN0l)VV n fn 4) 4 V V f. '
N N -4- N- UN 1 v 4~'0 0 - ) )VV VV V V 4)4 4 4 )4) ).4 4 4)4 4 ( ) ) )C 4))4)
- -- --- -- -- -- - -~- - - -0. -C-0 -. O- -- ..
- - - - - - --- - - - - - - - - - - -
- -. . C~ -- - - - -O.O-.)-'In 2N N- -
-- -) - - -- 44-- -- -- -N In--
-~ -w w - -C.V V -( - - - - - - - - 0)f, )')!N-
C
N N~~--- -)-- X T r C --4C -~o
-4 M.-- N- .o 0 r44)j I ,rl I In I Inm 11, , E-- - - - - - rrv .. r-r..---r.... D Lv. o n
0.t.r.... - Orr ., 0.N00.C.f.---...-4In
z - -- -C . 0 0~ - - N - . . . . .0 0 0 0 4 --.... r -..- -.. - -- -O
:: 0...4_00....00. :0- .: __ _ - _ : -. 0..:
.7z i
zzz--- --
- _ - - - : z - - - - - -- -
0.0. QN. . r . C O 4 C 0 C C C C C C C' C ~ C C'c' 7 C.r
-c CC C C C C.(C C c cC2c cCCC-rC 0c c cCz
Nn ' 0 'C0 m c In -...- ;4: -
-. 0 -. -. 0 -C -- - - -) - -; - - cO C. C C ). C C) C C c c, C C C C7 c C c0 . C C O C" r C C C, c rCCCCC2 CCCC'
>~~~~~) N N D1-0v ' c N, n4., ln~ I S.. r..c 0 c -1 CCC.c IzCCC4C.Cm CCCCCI cCCCCC.C
-Cr,)C44r ci- c c c 4).rr)4C 4
4f) t0) 0 InoV 4 V-(1
700Co CcC C' C C C, CCO. ; C (7 C c C . 0
5-2_vz
problematic. Four, rather than six, positions were provided since the
initial design cycle time of the DMF channel selector was four seconds.,
not six, and since the CDU update interval was specified by the manu-
facturer to be one second. However, since the scan rate was later
slowed to six seconds, and since the navigator is rather unpredictable
regarding data transmission interval, anywhere from zero to four CDU
data positions may actually be filled in a given data record. Therefore,
it is impossible to affix definitive times to each of the data records
received. The best information that can be derived is obtained by
counting the number of records received. If, for example, two were
received, it may be assumed that the second is no more than four seconds
old. The RDU data field is replaced with each succeeding record received
from the navigator. Thus its age is also unknown. Use was made of the
known fact that CDU and RDU transmissions proceed in tandem, and so the
count of received COU updates can be used to estimate the probable age
of the RDU data stream.
The data collection software exhibited a rather interesting "quirk"
which resulted in data recovery and analysis problems. There is apparently
an urresolved timing problem regarding loading of the data buffer with
received data, and then outputing the resulting data to the recorder.
This problem results in partially-filled fields in the data buffer. The
most seriously affected fields were the DME measurements and time. Quite
often the time field would be partially filled with "I" characters, or
would contain the correct data in the wrong position. Likewise a DME
position would contain the apparently-correct reading of 111.11 miles on
channel 1, or a field partially filled with "I" characters and partially
filled with correct data. No particular pattern which might indicate a
cause and effect relationship has been observed. Figure 5.1 shows part
of a printer dump of the data stream. Illustrated are occurrences of
time field errors and DME field errors.
5.2 CONTROL-DISPLAY OPERATOR INTERACTIONS
Primary operator interface with the RAPPS package consists of the
Tektronix 4051 graphic terminal, the System 80 reset switch, the DME
channel selectors (thumbwheel switches) and the DME range acquisition
5-3
indicator I iqhts (one I iht p, r ndriri Tb, ' .te is op rat ,e, usiIIq
the' 2'"C-80 PROM monito,- caabiI it ; r, rt t 1 ,v ter as s- .h wa',
used. Proqrams were stnrpd in P'.M, irid wete exef utel with monitor
instructi ons. Proqrains provi dd iri(ludt-o , Fet 1 , e t utit i ties wnri.h
allowed dumps to be made to the terminai of cr itn(al inputs (DME rnq(es,
TDL-424 CDLI data, TDL-711 CDU data, altimeter data, clock). Programs
to play back a tape post-flight, and to manipulate the tape drive in
flight, were provided in addition to the main data acquisition program.
The data acquisition program displayed part of the acquired data stream
as it was being acquired, but provided no verification that recording of
the data was proceeding. Programs were termninated usinq thp reset
switch. Verification of range acquisition of each of- the six tuned DME
channels was available to the operator through examination of range
aLquisition indicator lights (which extinguished when lock-on was
achieved), and examination of the data displayed on the terminal.
For the most part there was little for the operator to do once the
data acquisition program was running. The set up process. which was
accomplished while airborne, involved turning on all equipment, setting
the DME channel selectors to the desired stations, determining that range
aciuisitions were successful to all beacons, communicatlnq by rc'dio to
toe beacon operators to cleat up acquisition problems, setting up the
tape recorder, and initiainq data acquisition. Even though little
further activity was required, the set up process was totally manual
and required intimate knowledge of the operation of all equipment in the
package.
5-4

6.0 C ON CLUS IONiS
6.1 DATA ACQUISITION SYSTEM P[RFORMANL[
The data acquisition system feature of the FRAPPS packaqe tun.tiorned
essentially as planned (with the exception of deficiencies noted below)
and provided very useful data during the West Coast Loran-C flight test
program. Data was recorded continuously throughout the tests, and all
data was recoverable. There was no problem regarding scale or resolution
of the data, since all source data was already in a digital format.
A data record was recorded every six seconds, and fields within the
records were not time tagged. This caused considerable problems in the
data reduction process. A clock with millisecond resolution rather than
one second resolution should have been util ized. Either data records
should have been recorded much more often, or each data field should
have been time tagged in some manner.
The data reduction techniques utilized here and in an earlier
analysis [1] relied on a data tracking loop technique to estimate
aircraft position. It would have been far more beneficial if some
independent source of velocity data were available to feed the tracking
filter. Sources of data could have included aircraft airspeed and
heading, or the output of an inertial sensor system. These capabilities
were not a part of the original design objectives of the system.
The data acquisition system contained some errors which caused
periodic mishandling of data, such that incorrect data was recorded on
the tape (there was no indication on the tape that the data was
incorrect). The primary cause of this effect was probably due to a
software timing problem whereby some fields would be incompletely filled
at the time that the data buffer was dumped to the tape. These instances
were quite evident to a human observer reviewing a data dump, but
required elaborate software traps in the analysis programs to prevent
their propagation into the results. A secondary problem was identified.
On occasion a DME range very near zero would be recorded in an otherwise
valid data channel. The cause was not determined.
6-1

6.2 RAPPS RANGE MEASUREMENT SYSTEM PIRFORMAU'(L
Due to the above-mentioned data acquisitinn 2,vsttmrt problem (-ern
range measurements), large DME errors were detected in lb out of tlt,
5969 DME readings evaluated (I.27 of ,easuremrients).
As a result of multipath effects and other ranging problems, a
total of 100 moderate (greater than 1000 ft.) PM errors out of 969
readings evaluated were isolated (l.68'r of measurements). These
were particularly prevalent in circumstances conducive to multipath
problems; e.g. when ranging over the horizon or in the presence of a
large, smooth body of water.
After filtering out the larger errors noted above, a residual
ranging error of 285 ft. (l) for all beacons and locations was
calculated as a result of the data evaluation performed in this study.
It is believed that this number is very conservative (high relative to
the actual performance of the system) due to the techniques which had
to be used to estimate ranging error in the absence of a precision
tracking range for evaluating DM[ performance. The t-; tracker
algorithm can be thought of as a precise position standard with a
relatively large additive, low-frequency noise source (which is
essentially uncorrelated with the OKE errors). If the uncorrelative
assuription is valid, then the "tracker noise". which is of unknown
i,.a-nitude, would be expressed as an increase in thu DME error statistic
Thi; the statistic is conservative.
The 285 foot error figure stated above is raw ranging system
error, not positioning (X, Y) system error. The error experienced
upon converting the ranges to positions through nultilateration is
totally dependent on two factors: aircraft/beacon geometry and the
number of beacons supplying range data. Given good geometry and
several beacons, the resulting position errors may be consicerablv
better than the raw ranging error statistic.
6-2
Due to the frequency band of the ranging system, it exhibited a
characteristic (which was fully expected) which requires careful test
planning to avoid: range acquisition can be severely limited by terrain
masking, multipath effects and aircraft altitude. These factors, as
well as erroneous measurements which result from niultipath during
marginal range acquisition conditions cannot be overcome simply by
locating more beacons in the test area, since they cause data
reduction problems irregardless. All beacon site locations deserve
serious planning and scrutiny.
In planning beacon layouts for a test environment, the coverage
geometry of the beacon layout is of paramount importance. Beacon range
is not a limitation (up to 40 miles for the Vega beacons). Coverage
geometry should be evaluated relative to all parts of the intended
flight path for which data is desired. Planning should also consider
in each case an exact strategy for accurately determining the position
of each beacon. Wherever possible, a plan should be defined to
determine the ranging bias of all permanent TACAN or DME installations to
be utilized. A successful flight test is highly dependent on the
amount and quality of planning that precedes the test itself.
6-3
REFERENCES
1. Scalise, T.E., Bolz, E.H., McConkey, E.D., "West Coast Loran-C
Flight Test", Systems Control, Inc.(Vt.), March 1980, FAA-RD-80-28.
2. "Final Technical Report, Remote Area Precision Positioning System,Phase V", Sierra Nevada Corp., Amex Systems, Inc., December 1979.
R-1
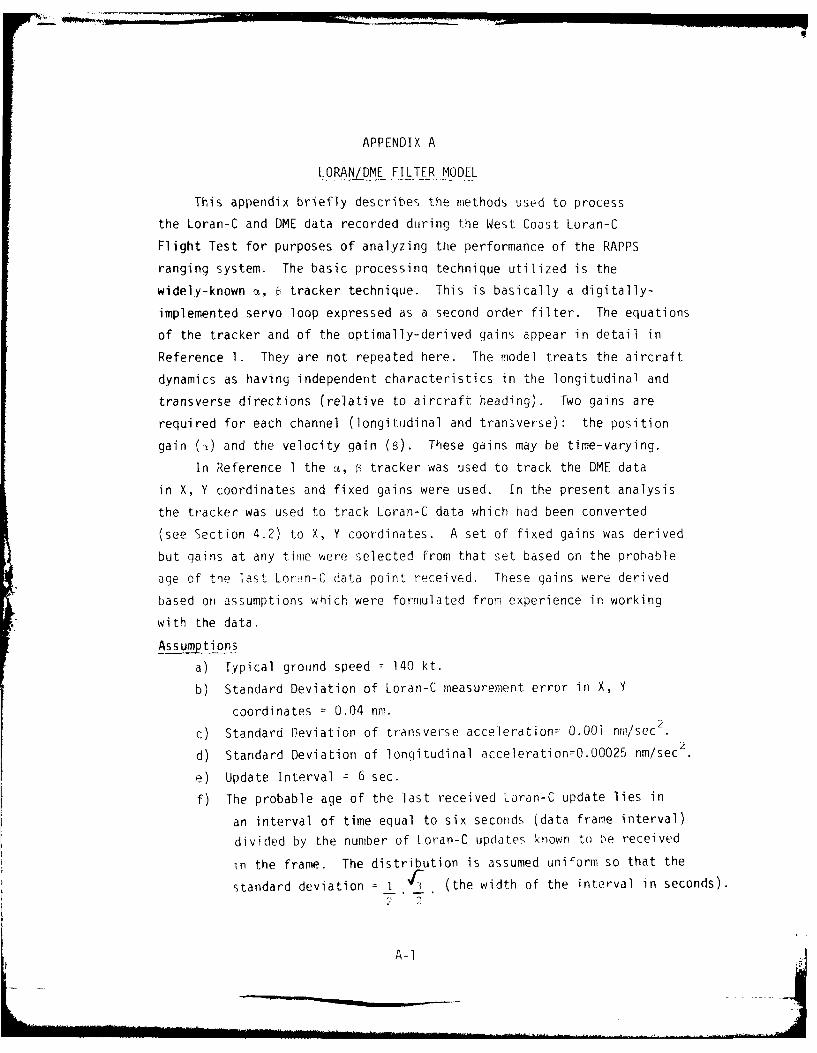
APPENDIX A
LORAN!DME FILTER MODEL
This appendix briefly describes the methods used to process
the Loran-C and DME data recorded during the West Coast Loran-C
Flight Test for purposes of analyzing the performance of the RAPPS
ranging system. The basic processinq technique utilized is the
widely-known a, e; tracker technique. This is basically a digitally-
implemented servo loop expressed as a second order filter. The equations
of the tracker and of the optimally-derived gains appear in detail in
Reference 1. They are not repeated here. The model treats the aircraft
dynamics as having independent characteristics in the longitudinal and
transverse directions (relative to aircraft heading). Two gains are
required for each channel (longitudinal and transverse): the position
gain (,) and the velocity gain (3). These gains may be time-varying.
In Reference 1 the a, f tracker was used to track the DME data
in X, Y coordinates and fixed gains were used. In the present analysis
the tracker was used to track Loran-C data which had been converted
(see Section 4.2) to X, Y coordinates. A set of fixed gains was derived
but gains at any time were selected from that set based on the probable
age of the last Lor,;n-C data point received. These gains were derived
based on assumptions which were formulated from experience in working
with the data.
Assumptions
a) Typical ground speed = 140 kt.
b) Standard Deviation of Loran-C measurement error in X, Y
coordinates z 0.04 nm.
c) Standard Deviation of transverse acceleration= 0.001 nm/sec 2
d) Standard Deviation of longitudinal acceleration=O.O0025 nm/sec 2
e) Update Interval = 6 sec.
f) The probable age of the last received Loran-C update lies in
an interval of time equal to six seconds (data frame interval)
divided by the number of Loran-C updates known to be received
in the frame. The distribution is assumed uniform so that the
standard deviation I i (the width of the interval in seconds).2 1
A-1 !
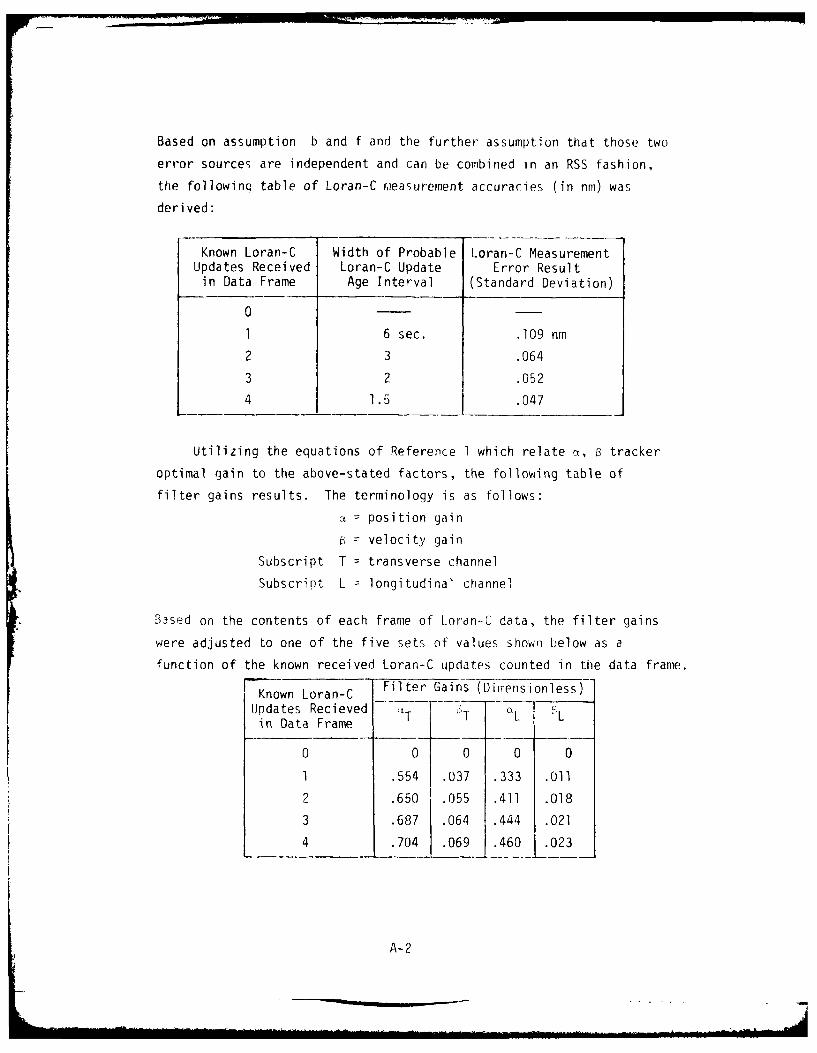
Based on assumption b and f and the further assumption that those two
error sources are independent and can be combined in an RSS fashion,
the following table of Loran-C measurement accuracies (in nm) was
derived:
Known Loran-C Width of Probable Loran-C MeasurementUpdates Received Loran-C Update Error Resultin Data Frame Age Interval (Standard Deviation)
0
1 6 sec. .109 nn
2 3 .064
3 2 .052
4 1.5 .047
Utilizing the equations of Reference 1 which relate a, 6 tracker
optimal gain to the above-stated factors, the following table of
filter gains results. The terminology is as follows:
position gain
- velocity gain
Subscript T = transverse channel
Subscript L - longitudinal channel
Based on the contents of each frame of Loran-C data, the filter gains
were adjusted to one of the five sets of values shown below as a
function of the known received Loran-C updates counted in the data frame.
Known Loran-C Filter Gains (Dimensionless)
Updates Recieved TLin Data Frame T
0 0 0 0 0
1 .554 .037 .333 .011
2 .650 .055 .411 .018
3 .687 .064 .444 .021
4 .704 .069 .460 .023
A-2
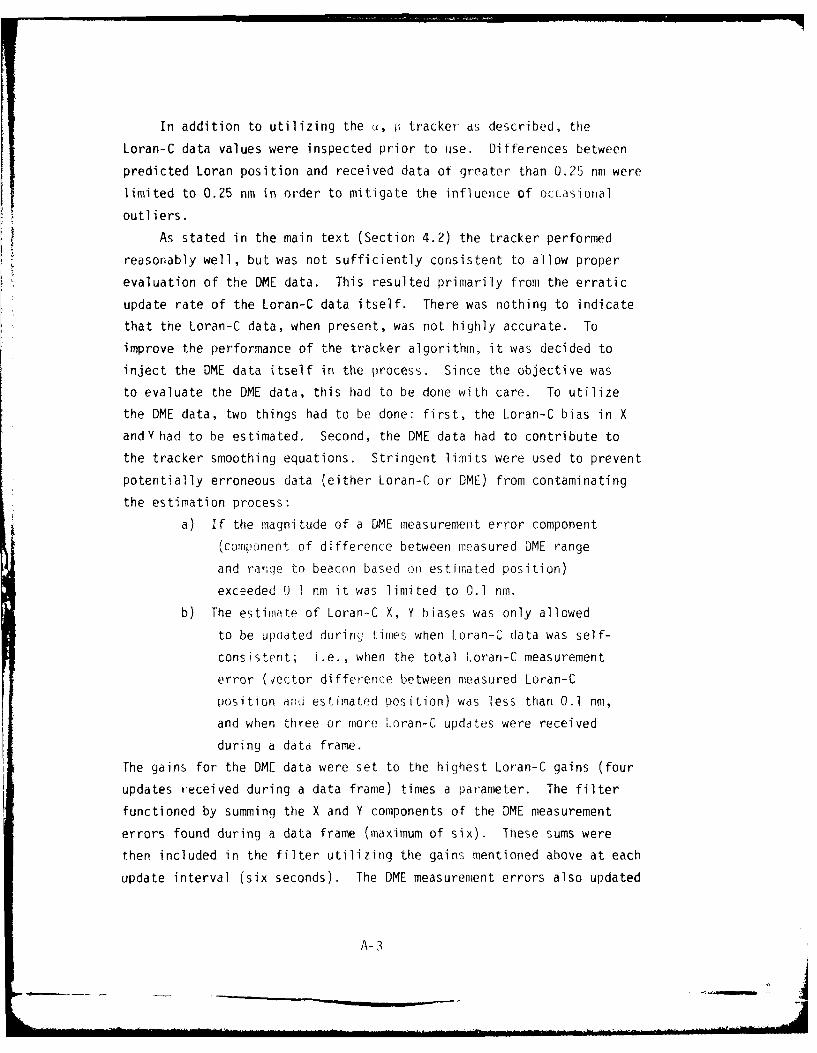
In addition to utilizing the , tracker as described, the
Loran-C data values were inspected prior to use. Differences between
predicted Loran position and received data of greater than 0.25 nm were
limited to 0.25 nm in order to mitigate the influence of occasional
outliers.
As stated in the main text (Section 4.2) the tracker performed
reasonably well, but was not sufficiently consistent to allow proper
evaluation of the DME data. This resulted primarily from the erratic
update rate of the Loran-C data itself. There was nothing to indicate
that the Loran-C data, when present, was not highly accurate. To
improve the performance of the tracker algorithm, it was decided to
inject the DME data itself in the process. Since the objective was
to evaluate the DME data, this had to be done with care. To utilize
the DME data, two things had to be done: first, the Loran-C bias in X
andY had to be estimated. Second, the DME data had to contribute to
the tracker smoothing equations. Stringent limits were used to prevent
potentially erroneous data (either Loran-C or DME) from contaminating
the estimation process:
a) If the magnitude of a DME measurement error component
(component of difference between measured DME range
and range to beacon based on estimated position)
exceeded 0.1 nm it was limited to 0.1 nm.
b) The estimate of Loran-C X, Y biases was only allowed
to be upoated durinj times when Loran-C data was self-
consistent; i.e., when the total Loran-C measurement
error (vector difference between measured Loran-C
position and estimated position) was less than 0.1 nm,
and when three or more Loran-C updates were received
during a data frame.
The gains for the DME data were set to the highest Loran-C gains (four
updates received during a data frame) times a parameter. The filter
functioned by summing the X and Y components of the DME measurement
errors found during a data frame (maximum of six). These sums were
then included in the filter utilizing the gains mentioned above at each
update interval (six seconds). The DME measurement errors also updated
A-3
the Loran-C bias estimate (under the restrictions of item (b)
above) using a first order filter whose gain was also a parameter.
These two parameters (tracker DME gain and Loran-C bias DME gain)
were varied in a series of trial runs over several of the Loran-C
approaches flown during the test. The behavior of the resulting
system was judged based on the following subjective criteria:
a) Stability of the Loran-C biases
b) Response to aircraft dynamics, including
rapid convergence on new heading/airspeed
without overshoot
c) Ability to minimize the number of falsely-
identified significant DME ranging errors.
After many trials the following values were selected:
Tracker DME gain parameter = 75%
Loran-C bias DME gain parameter = 0.025
With this configuration the entire system performed very well, although
it was still necessary to manually identify times of high dynamics
(turns) to prevent false identification of significant DME ranging
errors. Data during turns was eliminated from the ranging error
analysis.
A-4
Related Documents