E0286 – V Background material on Test: Test requirements. Test handoffs. Te Where DUT and DFT fit into design Basic philosophy: Test, ATPG, DFT, Test cost metrics and test economic VLSI Test esters. / manufacturing framework. , BIST, COF, TTR. cs.

Welcome message from author
This document is posted to help you gain knowledge. Please leave a comment to let me know what you think about it! Share it to your friends and learn new things together.
Transcript

E0286 – VLSI Test
Background material on Test:
Test requirements. Test handoffs. Testers.
Where DUT and DFT fit into design / manufacturing framework.
Basic philosophy: Test, ATPG, DFT, BIST, COF, TTR.
Test cost metrics and test economics.
VLSI Test
Test requirements. Test handoffs. Testers.
Where DUT and DFT fit into design / manufacturing framework.
Basic philosophy: Test, ATPG, DFT, BIST, COF, TTR.
Test cost metrics and test economics.

Design and Test Cost Projections
Test cost projections have been possibly clamped due to better test methods, higher
Design and Test Cost Projections
Test cost projections have been possibly clamped due to better test methods, higher
multi-site, on-die concurrency, etc.But the percentage cost of test is still
increasing.

1960 1970 1980 19901950
Testcost(% oftotalcost)
100%
50%
LogicVolumeFault models
Infrastructure
Recurring cost of test for 5 (50) seconds of test time is $ 0.05 ($ 0.5)to $ 0.5 ($ 5.0) @ $ 0.01 to $ 0.1 per second of tester use.
Cost of Test
1990 2000 2010
Designcost(% oftotalcost)
Fault modelsInfrastructure
Uncertainty
30%
50%
Recurring cost of test for 5 (50) seconds of test time is $ 0.05 ($ 0.5)to $ 0.5 ($ 5.0) @ $ 0.01 to $ 0.1 per second of tester use.
1960 1970 19801950
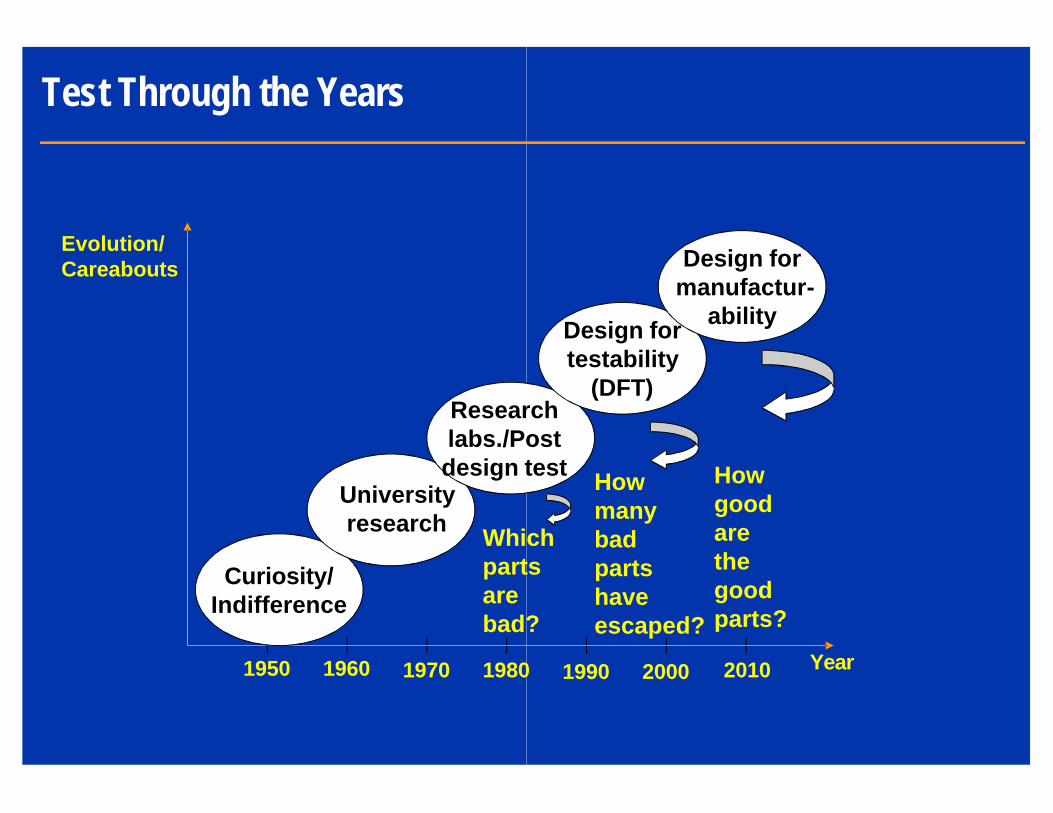
Evolution/Careabouts
Curiosity/Indifference
Universityresearch
Researchlabs./Postdesign test
Whichpartsarebad?
Test Through the Years
1980 1990 2000 2010 Year
Design fortestability
(DFT)
Design formanufactur-
ability
Researchlabs./Postdesign test
Whichparts
bad?
Howmanybadpartshaveescaped?
Howgoodarethegoodparts?

Technology scaling / shrinking
Board/Externalfaults
Stuck-at/Iddq faults
Hookuptests
Manufacturingtests / Testautomation
Tests forbetter DPPMscreening
Layout/Couplingfaults
Testcomp-lexity
Technology and Failure Modes
Technology scaling / shrinking
Parametric/Delay faults
Transientfaults
Tests forbetter DPPMscreening
Periodictesting
Coupling

Terminology
- Yield: The entitlement, from the process of
- Coverage: Number of faults detected out of the (expressed in %).
- DPPM: Defective Parts (test escapes) Per Computed for time zero.
- FIT rate: Failures In Time, measured in terms hours of operation.
- Reliability: Quantitatively, it can be described
: The entitlement, from the process of good chips, (expressed in %).
: Number of faults detected out of the total number of faults that exist,
: Defective Parts (test escapes) Per Million certified good devices.
rate: Failures In Time, measured in terms of number of failures in 10^9
: Quantitatively, it can be described using the actual FIT rate.

Terminology (2)
- Defect: This is the actual cause of a fault or oxide short, etc.
- Fault / Failure: This is the effect, e.g. high
- Errors: This is the manifestation of the fault at
- Outlier: Devices for which parametric measurements do acceptable deviation around the mean.
Defect: This is the actual cause of a fault or failure, e.g. leaky transistor, gate
Fault / Failure: This is the effect, e.g. high Iddq, gate output stuck-at 0, etc.
Errors: This is the manifestation of the fault at an observable output.
measurements do not conform to an mean.

q 1950s - Gedankan experiments.
q 1960s - D-algebra.
q 1970s - LSSD and scan design.
q 1980s - DFT. Early automation.
q 1990s - Automation for DFT insertion and pattern generation.
q 2000s - DFM. DFY. Cost / Quality tradeoffs.
q 2010s - ... .
Few Decades of Test
Automation for DFT insertion and pattern generation.
DFM. DFY. Cost / Quality tradeoffs.
University
Design Groups
CAD Groups

Reliability / DPPM control:- 0% fault coverage -> 100% yield.- > 99% stuck-at fault coverage at 75% yield - But likely DPPM > 200. Confidence in yield low.- DPPM requirements for several products in - 0.5% yield -> DPPM of 5000.
Test cost:- Cost of test vs design. Crossover in a few years.- Cost of logic inside device vs outside.- Rule of 10s: $1 in device -> $1000+ on field.- Cost impact: Few seconds to tens of seconds.- Cost per second: 2 to 10 cents. Infrastructure extra.
Interesting Test Data
at fault coverage at 75% yield for DPPM < 200.But likely DPPM > 200. Confidence in yield low.DPPM requirements for several products in the100s, 10s and 1s range.
design. Crossover in a few years.outside.
> $1000+ on field.Cost impact: Few seconds to tens of seconds.Cost per second: 2 to 10 cents. Infrastructure extra.
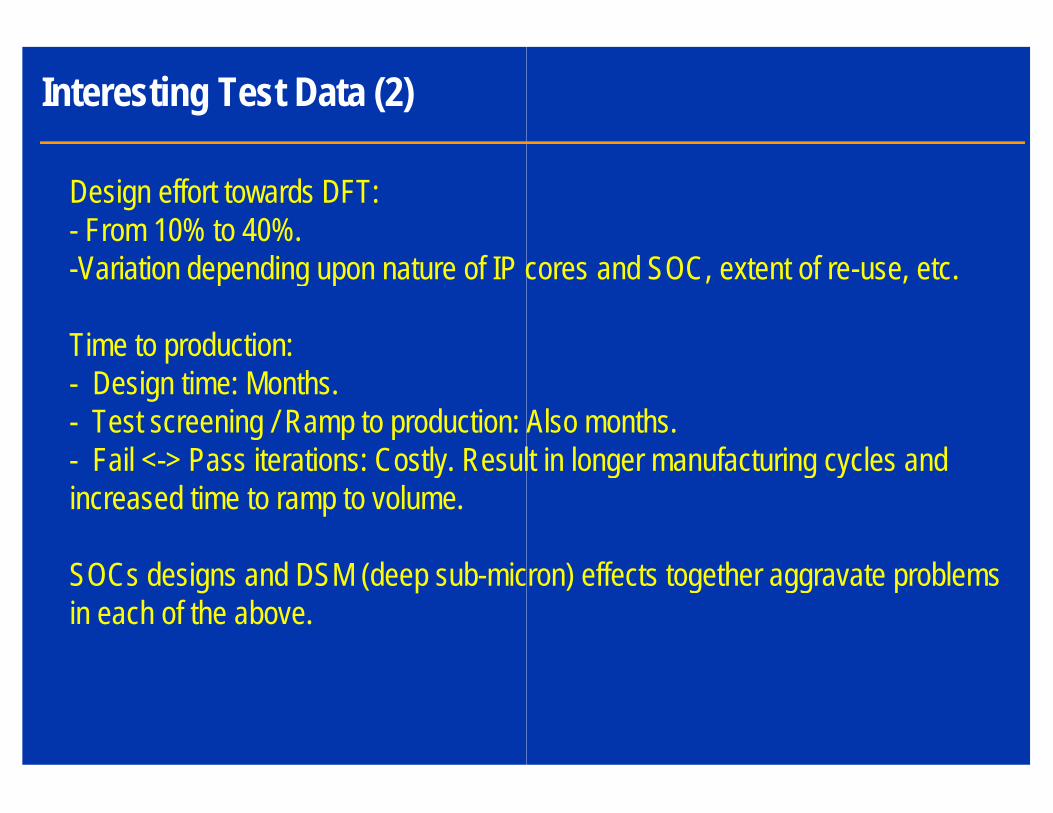
Design effort towards DFT: - From 10% to 40%.-Variation depending upon nature of IP cores
Time to production:- Design time: Months.- Test screening / Ramp to production: Also months.- Fail <-> Pass iterations: Costly. Result in longer manufacturing cycles and increased time to ramp to volume.
SOCs designs and DSM (deep sub-micron) effects together aggravate problems in each of the above.
Interesting Test Data (2)
depending upon nature of IP cores and SOC, extent of re-use, etc.
Test screening / Ramp to production: Also months.> Pass iterations: Costly. Result in longer manufacturing cycles and
micron) effects together aggravate problems
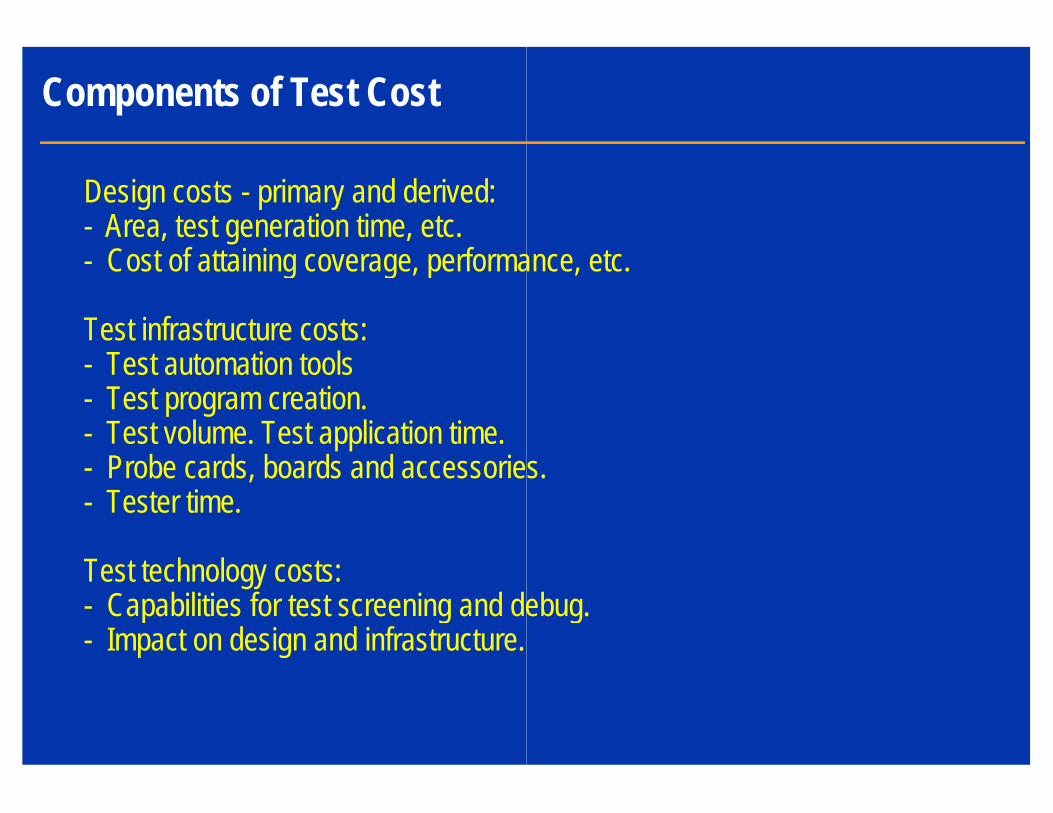
Design costs - primary and derived:- Area, test generation time, etc.- Cost of attaining coverage, performance, etc.
Test infrastructure costs:- Test automation tools- Test program creation.- Test volume. Test application time.- Probe cards, boards and accessories.- Tester time.
Test technology costs:- Capabilities for test screening and debug.- Impact on design and infrastructure.
Components of Test Cost
Cost of attaining coverage, performance, etc.
Probe cards, boards and accessories.
Capabilities for test screening and debug.Impact on design and infrastructure.

Cost of Testing
CPUD = ( CTGD + CTBD ) / (TNOD * Y)
CPUD = Cost per unit die.
CTGD = Cost of testing good dies.
CTBD = Cost of testing bad dies. (May be = CTGD in multi
TNOD = Total number of dies.
Y = Yield.
CPUD = ( CTGD + CTBD ) / (TNOD * Y)
. (May be = CTGD in multi-site context).

Cost of Testing (2)
Cw = Wafer cost.D = Dies per wafer.Y = Test yield.Tg = Test time taken to test a good part.Tb = Average time it takes for a bad part to fail.Ctu = Tester time cost per unit time.Test time per wafer (Tt) = [D * Y * Tg] + [D * (1Test cost per wafer (Ct) = Ctu * TtTest cost per good die (Ctg) = Ct / (D * Y)
= Ctu {TgFabrication cost per good die (Cwg) = CwTest cost -> Add costs across different tests / testers.
= Test time taken to test a good part.Tb = Average time it takes for a bad part to fail.
] + [D * (1-Y) * Tb]
) = Ct / (D * Y)Tg + Tb * [1/Y –1]}
Cw / (D * Y)> Add costs across different tests / testers.

Trade off coverage with effectiveness.
Select tests based on their effectiveness.
- Test A, Efficiency = 80%, Coverage = 90%.
- Test B, Efficiency = 90%, Coverage = 95%.
- Test C, Efficiency = 70%, Coverage = 100%.
Selection of A + B is more effective than B + C.
0.9*0.95 + 0.8*0.9 > 0.9*0.95 + 0.7+1.0
Cost Tradeoffs – Example 1
Select tests based on their effectiveness.
Test A, Efficiency = 80%, Coverage = 90%.
Test B, Efficiency = 90%, Coverage = 95%.
Test C, Efficiency = 70%, Coverage = 100%.
Selection of A + B is more effective than B + C.
0.9*0.95 + 0.8*0.9 > 0.9*0.95 + 0.7+1.0

Reduce the time taken for the bad parts to fail. Order the tests based on their efficiency.
- Test A, Yield = 80% (less coverage), Time = 7ms.- Test B, Yield = 60% (more coverage), Time = 8ms.
Test A followed by Test B:Total test time = 7 ms + 8x0.8 ms = 13.4
Test B followed by Test A:Total test time = 8 ms + 7x0.6 ms = 12.2 ms
Cost Tradeoffs – Example 2
Reduce the time taken for the bad parts to fail. Order the tests based on their
Test A, Yield = 80% (less coverage), Time = 7ms.Test B, Yield = 60% (more coverage), Time = 8ms.
Total test time = 7 ms + 8x0.8 ms = 13.4 ms.
Total test time = 8 ms + 7x0.6 ms = 12.2 ms

- Target tests on cheaper testers:- Application costs: $0.01/sec to 0.1/sec and above.- Actual costs: $ 0.2 M to $ 2 M and above.
- Multi-site testing. Concurrent testing.- Reduce dependency on tester infrastructure.- Increase / Reduce the test application speed.- Improve quality of tests for a given cost. Trade off coverage with quality.- Test sequence: Bad parts to fail early.- Incur DFT overhead. (Parallel scan, faster scan, test points, BIST, test modes,
isolation, etc.).
Reducing Cost of Testing
Application costs: $0.01/sec to 0.1/sec and above.Actual costs: $ 0.2 M to $ 2 M and above.
Reduce dependency on tester infrastructure.Increase / Reduce the test application speed.Improve quality of tests for a given cost. Trade off coverage with quality.Test sequence: Bad parts to fail early.Incur DFT overhead. (Parallel scan, faster scan, test points, BIST, test modes,
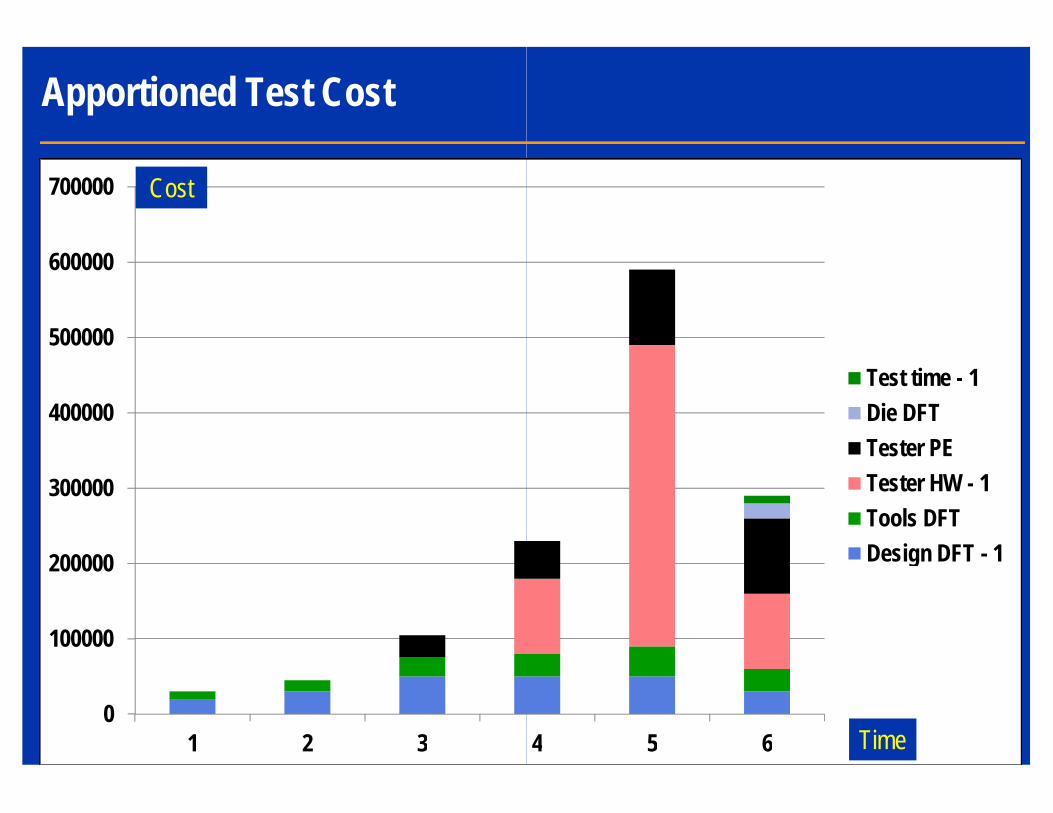
Apportioned Test Cost
0
100000
200000
300000
400000
500000
600000
700000
1 2 3
Cost
4 5 6
Test time - 1Die DFTTester PETester HW - 1Tools DFTDesign DFT - 1
Time

Product Life-time Cost
0
500000
1000000
1500000
2000000
2500000
3000000
1 2 3 4 5 6 7 8 9
Cost
10 11 12 13 14 15 16
Test time - 1Die DFTTester PETester HW - 1Tools DFTDesign DFT - 1
Time

Diverse Markets
q Designs spec’ed and created for one market re¦ Catalogue wireless connectivity chips re¦ DSPs re-used for automotive engine control.¦ Micro-contollers for medical applications.
q Quality is an opportunity cost. Price paid to meet
Parameter Catalog PortableCoverageTime Zero QualityField DPPMTest CostTest PowerPerformanceArea
and created for one market re-used for others. Examples:Catalogue wireless connectivity chips re-used inside cars / planes.
used for automotive engine control.for medical applications.
Quality is an opportunity cost. Price paid to meet vs price incurred not to.
Portable Infrastructure Automotive

Apportioned Quality Cost
0
100000
200000
300000
400000
500000
600000
700000
1 2 3
Cost
4 5 6
Test time - 2Tester HW - 2Design DFT - 2Test time - 1Die DFTTester PETester HW - 1Tools DFTDesign DFT - 1
Time

Apportioned Quality Cost (2)
0
500000
1000000
1500000
2000000
2500000
3000000
3500000
1 2 3 4 5 6 7 8 9
Cost
10 11 12 13 14 15 16
Test time - 2Tester HW - 2Design DFT - 2Test time - 1Die DFTTester PETester HW - 1Tools DFTDesign DFT - 1
Time

Different Techniques Beyond Production TestTechniques
Technology: Cell hardening.Physical design rules.
Margins: Additional design margins.Margin mode testing.
DFT partitioning:Scan partitioning. Clock skewing / staggering. Test res.part.
ATPG: Parametric tests. Defect based tests. Bus BIST.Power aware test.
Power management: Power grid partitioning / overPower isolation switches. Retention.
Device configurability:Pre-shipment calibration. Memory repair. Module isolation.
On-chip test / measurement:Self-test. Self-calibration. Self-repair. Adaptivity.
Die test: Over-test. Stress test.Under-test. Binning. Adaptive test.
System test:Field test. Periodic testing.
Tolerance: Error checking and correction.Redundancy and reconfiguration.
Different Techniques Beyond Production TestYield Reliability Power
xxx
xx
x
Scan partitioning. Clock skewing / staggering. Test res.part. x x
Parametric tests. Defect based tests. Bus BIST. x xx
Power grid partitioning / over-design. x xx
shipment calibration. Memory repair. Module isolation. x
repair. Adaptivity. x
xx
x
x
xxx

How Coverage Impacts Fall-out
0
500
1000
1500
2000
2500
3000
3500
4000
4500
55% 60% 65% 70% 75% 80%
Stuck-at Test Coverage
Reje
ct ra
teout
80% 85% 90% 95% 100%
Stuck-at Test Coverage
Will BrownSeth Ag 1.5Seth Ag 1.8Seth Ag 2.0Seth Ag 2.5DSP empirical
The formulae are a guide. Deviations exist
for different reasons.
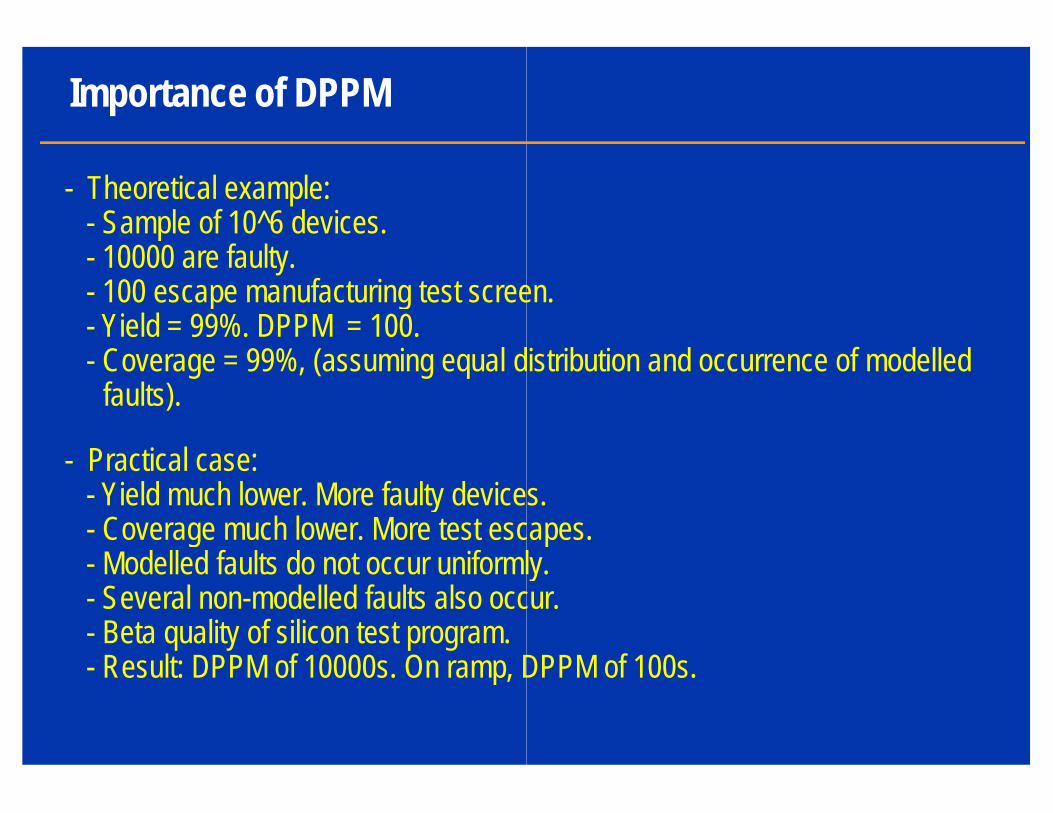
Importance of DPPM
- Theoretical example:- Sample of 10^6 devices.- 10000 are faulty.- 100 escape manufacturing test screen.- Yield = 99%. DPPM = 100.- Coverage = 99%, (assuming equal distribution
faults).
- Practical case:- Yield much lower. More faulty devices.- Coverage much lower. More test escapes.- Modelled faults do not occur uniformly.- Several non-modelled faults also occur.- Beta quality of silicon test program.- Result: DPPM of 10000s. On ramp, DPPM of 100s.
100 escape manufacturing test screen.
distribution and occurrence of modelled
Yield much lower. More faulty devices.Coverage much lower. More test escapes.
faults do not occur uniformly.faults also occur.
Result: DPPM of 10000s. On ramp, DPPM of 100s.

Impact of Non-zero DPPM
Consider a board with ten devices, each with - The DPPM of this board is 10000, i.e. 1%.- One in hundred boards is bad.
Consider an automobile with 100 devices, - The DPPM of this automobile system, (chips
10000, i.e. 1%.- One in hundred automobiles is bad.
Consider an automobile with 100 devices, - The DPPM of this automobile system is 100, i.e
thousand automobiles is bad.
Consider a board with ten devices, each with DPPM of 1000:The DPPM of this board is 10000, i.e. 1%.
Consider an automobile with 100 devices, each with DPPM of 100:The DPPM of this automobile system, (chips alone,other systems apart), is
Consider an automobile with 100 devices, each with DPPM of 1:The DPPM of this automobile system is 100, i.e. 0.01%. One in ten

DPPM CalculationThe Williams and Brown equation relates the coverage for a given yield.
D = (1 - Y^(1-C)), whereY = Yield, 0 <= Y <= 1.C = Coverage, 0 <= C <= 1.D = Defect rate. DPPM = D * 10^6.
Derived from probabilistic models.- All faults are assumed to be distributed equally.- All faults are assumed to occur randomly.- Stronger correlation for stuck-at faults.- Examples:
- DPPM = 0 if coverage = 100% for any yield.- DPPM = 10^6 if coverage = 0% for zero yield.- DPPM = 20000 if coverage = 95% for 70% yield.- DPPM = > 200 if coverage = 99% for 70% yield.
Williams and Brown equation relates the escape rate (DPPM) to the fault
All faults are assumed to be distributed equally.All faults are assumed to occur randomly.
at faults.
DPPM = 0 if coverage = 100% for any yield.DPPM = 10^6 if coverage = 0% for zero yield.DPPM = 20000 if coverage = 95% for 70% yield.DPPM = > 200 if coverage = 99% for 70% yield.

IP Mixture in SOC
A
B
C
Core A: No compression. No bounding. E: Glue logic.Core B: No compression. Bounding only. G: SOC level Core C: Compression + Bounding H: SOC bounding.Core D: Compression only. No bounding. Bounding
H
DE
F
G
Glue logic.Core B: No compression. Bounding only. G: SOC level CoDec(s).Core C: Compression + Bounding H: SOC bounding.
Bounding.
F: DFT logic• Test IPs – Memory BIST,
scan CoDecs, test mode controls, E-Fuse, etc.
• Wrappers – Pin-muxing, analog PMT, 1500 bounding, etc.

Schedule
C -> D -> G(A+B+E) -> F
C -> [Init(A+E) + Init(B) + Init(C) -> D]* -> G(A+B)
C -> [Init(C) -> Init(E) -> [G(A+B) || D]* -> E -> F
C || G(A+B+E) || D -> F
A
B
C
H
Test Scheduling Options
Test Time Test Qual
> G(A+B) -> E -> F
> F
D E
F
G
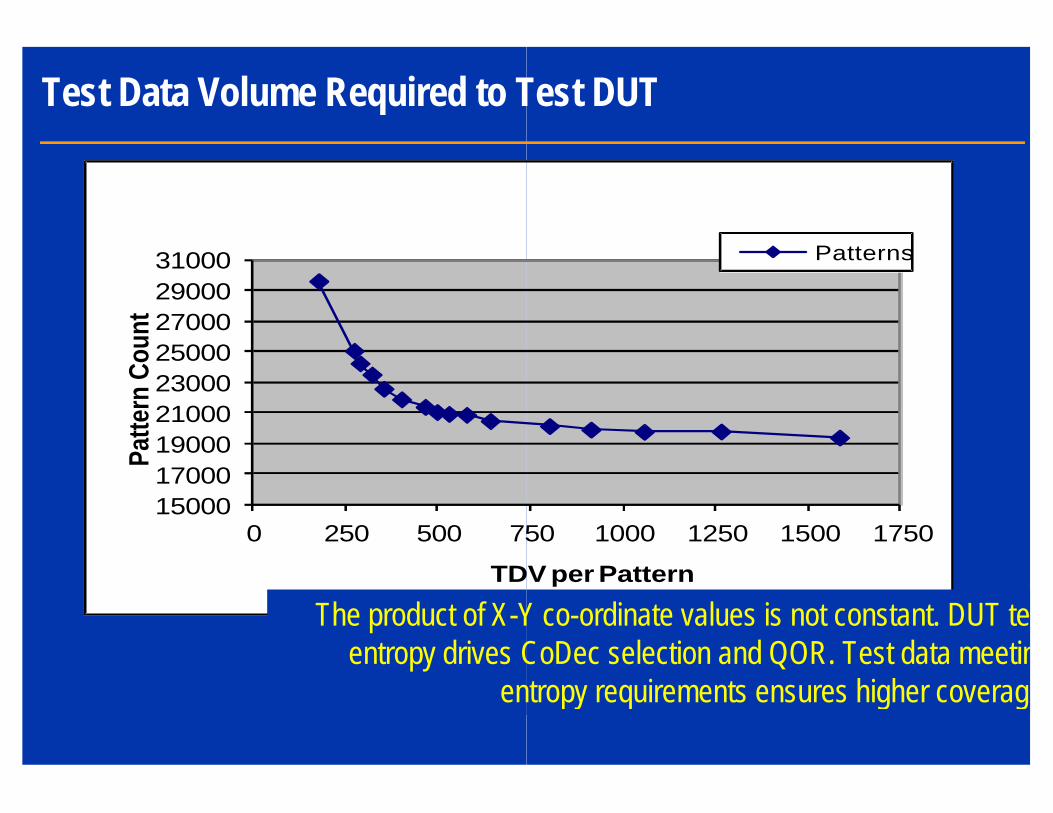
Test Data Volume Required to Test DUT
150001700019000210002300025000270002900031000
0 250 500 750
Patte
rn C
ount
TDV per Pattern
The product of X-Y coentropy drives CoDec
entropy requirements ensures higher coverage.
Test Data Volume Required to Test DUT
750 1000 1250 1500 1750
TDV per Pattern
Patterns
Y co-ordinate values is not constant. DUT test CoDec selection and QOR. Test data meeting
entropy requirements ensures higher coverage.
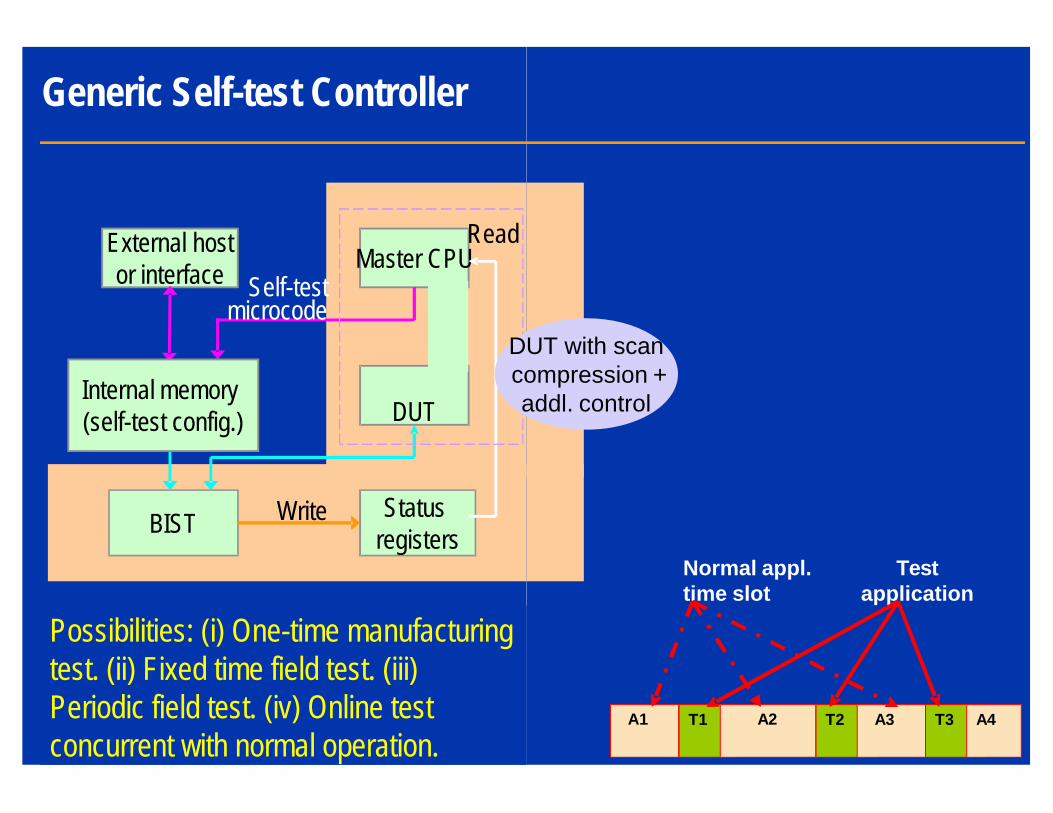
Generic Self-test Controller
External hostor interface Master CPU
DUT
BIST Status registers
Write
Read
microcodeSelf-test
Internal memory (self-test config.)
DUT with scancompression +addl. control
Possibilities: (i) One-time manufacturing test. (ii) Fixed time field test. (iii) Periodic field test. (iv) Online test concurrent with normal operation.
DUT with scancompression +addl. control
A1 T1 A2 T2 A3 T3 A4
Normal appl. time slot
Test application

Scatter Plots – How to Distinguish between Good and BadN
orm
aliz
ed F
max
How to Distinguish between Good and Bad
Process SpreadProcess spread

Illustration: Variability DPPM
q Variability DPPM : Fails intermittently at

Coverage Improvements Across Fault Models
FM2
Pattern Count
FM1
Hybrid ATPG
Cov
erag
e
Stuck-at
q TC1(FM1) + TC2(FM2) vs defect coverage.
q Pattern sets: P1 + P2 versus merged set of patterns.
Coverage Improvements Across Fault Models
at
Transition Path delay
Bridging
Methodology
Optimized Pattern Set
defect coverage.
Pattern sets: P1 + P2 versus merged set of
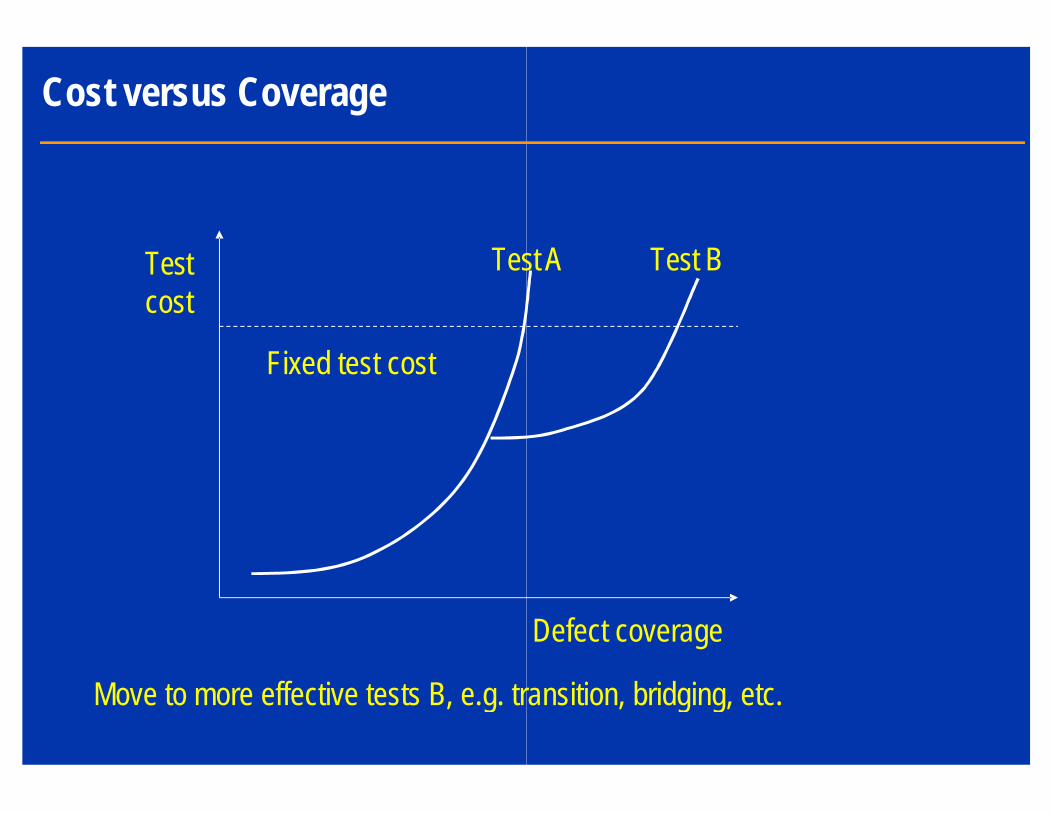
Cost versus Coverage
Testcost
Fixed test cost
Test A
Move to more effective tests B, e.g. transition, bridging, etc.
Defect coverage
Test A Test B
Move to more effective tests B, e.g. transition, bridging, etc.

Cost versus Quality Tradeoffs
Requiredquality
Process capability
Quality
Unacceptablequality
Test allows use of inherently low quality process to manufacture deviceswith high quality levels. Yield loss is made up for by increased competitiveness.
Process capability
Benefitof test
Test allows use of inherently low quality process to manufacture deviceswith high quality levels. Yield loss is made up for by increased competitiveness.
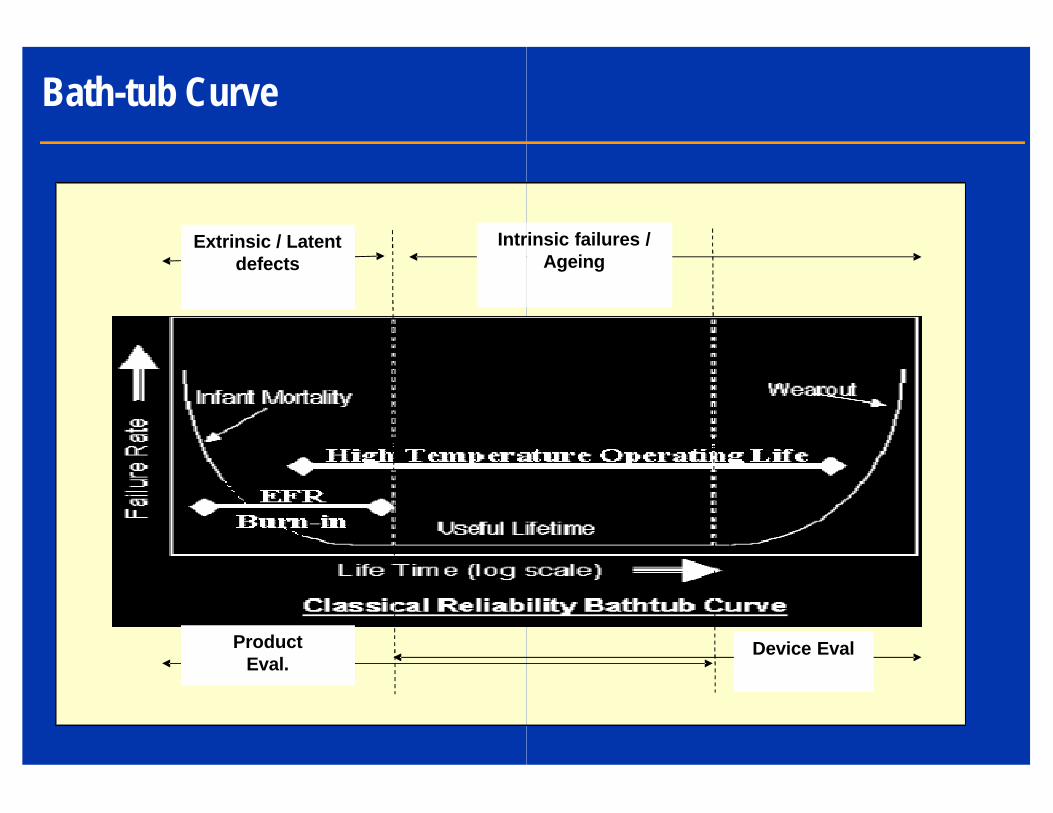
Bath-tub Curve
Extrinsic / Latent defects
Intrinsic failures /
ProductEval.
Intrinsic failures / Ageing
Device Eval

Test Components under Multi-site
q Test 1: 200 ms.
q Tests 2 to N: Less than 20 ms.
MS Factor
X1 X16 X16 -> X64
X16 -> X128
Option 1 220 ms 14 ms NA NA
Option 2 220 ms 1.5 ms 4.5 ms NA
Option 3 SKIP 1.5 ms SKIP 3.25 msMultiple (different)Multiple (different)Multiple (different)
Multiple insertions required.Test content varies in different insertions.Selection of test content, test concurrency and multi
site
Die IP Type of Test
Single Single Single siteSingle Multiple (same) Single siteSingle Multiple (different) Single site
Multiple (same) Single Multi-siteMultiple (same) Multiple (same) Multi-siteMultiple (same) Multiple (different) Multi-site
Multiple (different) Single Non-identicalMultiple (different) Multiple (same) Non-identicalMultiple (different) Multiple (different) Non-identical
Test content varies in different insertions.Selection of test content, test concurrency and multi-site factor important.
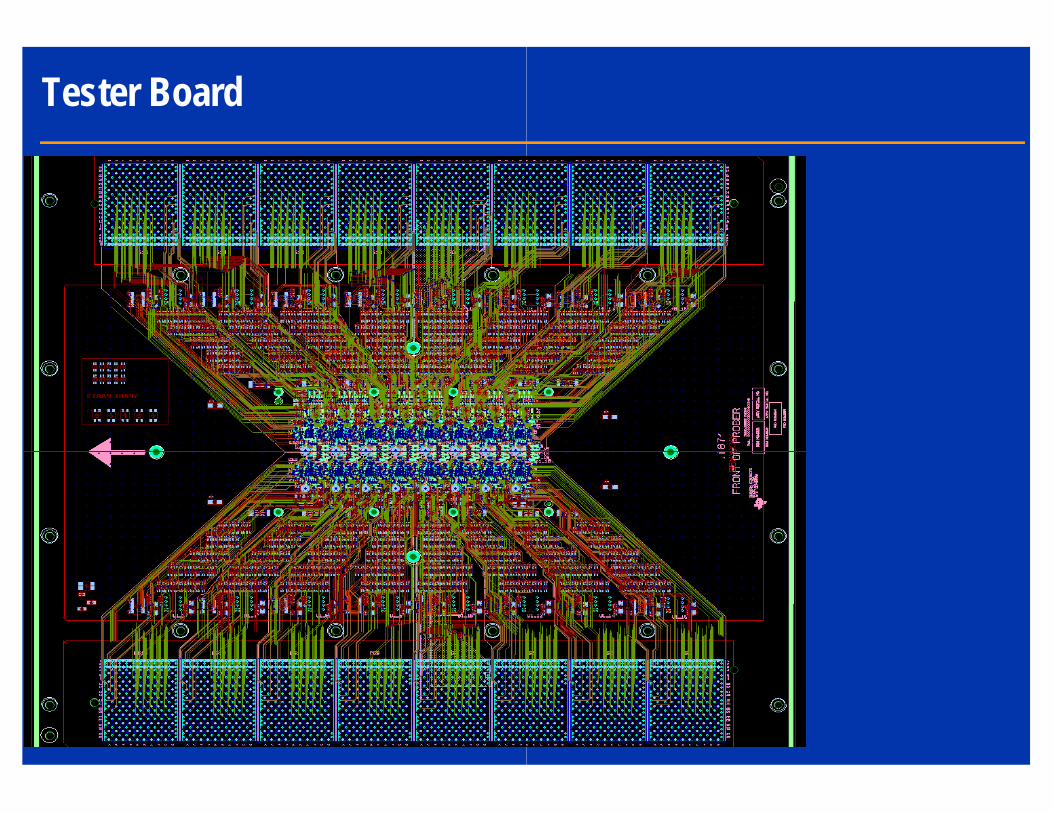
Tester Board

Test Power Concerns
Test power can be several times more than normal mode power
0
5
10
15
VideoDecode
Test (Pre-Opt) *
Test (withOpt)
Nor
mal
ized
Po
wer 5.2X
1.7X
Peak test power issues (IR drop issues) impact yield
Affects both shift and capture operations.

Distinguishing Good Parts – An Analog Process
Good / Perfect Part
SPECIFICATION / FEATURE
TEST
Acceptable Part
FUNCTIONAL TEST
• Defect free.• Identification elusive.• Costly.
• Error free.• Used in speed binning.• Often enabled through
outlier analysis.• May need Schmoo• Parametric defects
targetted.• Targetted tests: Iddq
delay, DFT R/W controls, DC parametrics, functional, etc.
An Analog Process
FUNCTIONAL
Bad Part
DEFECT ORIENTED TEST
Used in speed binning.Often enabled through
Schmoo data.Parametric defects
Iddq, path delay, DFT R/W controls,
,
• Static defects targetted.• Gross errors assumed.• Targetted tests: Stuck-at,
transition, small delay defect, bridging, memory algorithmic tests, etc.
• Successful created, adopted, optimised, adapted.

Four Quadrant Analysis
III
Traditional Tests (Functional, Parametric, …)
Bui
lt-in
Sel
f Tes
ts
(Str
uctu
ral)
Yield Loss
Underkill
II
BAD
BAD
GO
OD
Traditional Tests (Functional, Parametric, …)
Units to Ship
Overkill
I
IV
GOOD

Test Effectiveness Using Venn Diagrams
42
Test Effectiveness Using Venn Diagrams
Thank you.Thank you.
Related Documents