European Regional Development Fund Report Pag. 1/202 Project Acronym e-MOTICON Project Title e-MObility Transnational strategy for an Interoperable COmmunity and Networking in the Alpine Space Project Number 413 Work Package WPT 2 – Strategy Deliverable D.T2.3.1 – e-MOTICON Regional Action Plans Version 0.1/15. 1. 2019 Status Final Authors Blanka Odlazek, BSC, poslovno podporni center, d.o.o., Kranj, RRA Gorenjske Cristina Cavicchioli, Ricerca sul Sistema Energetico - RSE S.p.A. Posoški razvojni center

Welcome message from author
This document is posted to help you gain knowledge. Please leave a comment to let me know what you think about it! Share it to your friends and learn new things together.
Transcript
European Regional Development Fund
Report
Pag. 1/202
Project
Acronym
e-MOTICON
Project Title e-MObility Transnational strategy for an Interoperable COmmunity and Networking in the
Alpine Space
Project Number 413
Work Package WPT 2 – Strategy
Deliverable D.T2.3.1 – e-MOTICON Regional Action Plans
Version 0.1/15. 1. 2019
Status Final
Authors Blanka Odlazek, BSC, poslovno podporni center, d.o.o., Kranj, RRA Gorenjske
Cristina Cavicchioli, Ricerca sul Sistema Energetico - RSE S.p.A.
Posoški razvojni center
European Regional Development Fund
Report
Pag. 2/202
Table of content
Foreword .......................................................................................................................................... 7
1 INTRODUCTION ................................................................................................................................... 7
1.1 Objective of this report ............................................................................................................................ 7
1.2 What are the RAPs for? ............................................................................................................................ 8
1.3 What are the RAP target groups? ............................................................................................................ 8
1.4 RAP’s Guiding Principles ........................................................................................................................... 8
1.5 Intervention lines ..................................................................................................................................... 9 1.5.1 General: KPI for monitoring, evaluation, communication ..............................................................................9
1.6 Methodology ............................................................................................................................................ 9 1.6.1 State of the art analysis .................................................................................................................................10 1.6.1.1 Link with the main policies in the Alpine Space ............................................................................................10 1.6.1.2 E-CS infrastructures in Alpine Space area .....................................................................................................11 1.6.2 E-MOTICON strategy and pillars ...................................................................................................................12 1.6.3 Pilot Action experiences ................................................................................................................................13 1.6.3.1 Role and goals of the pilots ...........................................................................................................................14 1.6.3.2 Short description of the e-MOTICON pilots ..................................................................................................15 1.6.4 A tool to Increase Consciousness of the Territories on their Potentialities: the Local SWOT Analysis .........16 1.6.4.1 How e-MOTICON approach to local SWOT ...................................................................................................17 1.6.5 A tool to gain the objectives: Action .............................................................................................................19
1.7 Coherences ............................................................................................................................................. 19 1.7.1 Coherences with other competent authorities policies ................................................................................19 1.7.1.1 Coherences with European rules and vision on transport, energy & environment......................................19 1.7.1.2 Coherence of e-MOTICON strategy with the European Framework ............................................................22 1.7.2 Coherences with other organisations ...........................................................................................................28
1.8 Coherence with supra regional policies ................................................................................................. 28
1.9 The synergy of the 5 RAP of e-MOTICON Project .................................................................................. 30
2 THE NATIONAL CONTEXT .................................................................................................................. 32
2.1 National state-of-art .............................................................................................................................. 32
2.2 National main policies ............................................................................................................................ 34
2.3 National main actions ............................................................................................................................ 38
3 GORENJSKA REGIONAL ACTION PLAN ............................................................................................... 44
3.1 Identification of Region Gorenjska target groups .................................................................................. 44
3.2 Description of the area of intervention ................................................................................................. 45 3.2.1 The territory and the morphological aspects ................................................................................................46 3.2.2 Demografic features......................................................................................................................................46 3.2.3 Economic features.........................................................................................................................................47 3.2.4 Territory description .....................................................................................................................................47 3.2.5 Infrastructure features ..................................................................................................................................48
European Regional Development Fund
Report
Pag. 3/202
3.2.6 Mobility Analysis: modal split / average daily travel / desired lines grid for systematic mobility ................51 3.2.6.1 Bled ...............................................................................................................................................................51 3.2.6.2 Bohinj ............................................................................................................................................................52 3.2.6.3 Cerklje na Gorenjskem ..................................................................................................................................53 3.2.6.4 Gorje ..............................................................................................................................................................54 3.2.6.5 Gorenja vas – Poljane ....................................................................................................................................54 3.2.6.6 Jezersko .........................................................................................................................................................55 3.2.6.7 Jesenice .........................................................................................................................................................56 3.2.6.8 Kranjska Gora ................................................................................................................................................56 3.2.6.9 Kranj ..............................................................................................................................................................57 3.2.6.10 Naklo .............................................................................................................................................................58 3.2.6.11 Preddvor ........................................................................................................................................................58 3.2.6.12 Radovljica ......................................................................................................................................................59 3.2.6.13 Šenčur ...........................................................................................................................................................60 3.2.6.14 Škofja Loka ....................................................................................................................................................60 3.2.6.15 Tržič ...............................................................................................................................................................61 3.2.6.16 Železniki ........................................................................................................................................................62 3.2.6.17 Žiri .................................................................................................................................................................63 3.2.6.18 Žirovnica ........................................................................................................................................................64 3.2.7 Circulating vehicles........................................................................................................................................64 3.2.8 Energy: Production of electricity, renewable, non-renewable and electric balance ....................................67 3.2.9 Air Quality .....................................................................................................................................................70 3.2.10 Turism ...........................................................................................................................................................72
3.3 Electro mobility description ................................................................................................................... 76 3.3.1 SWOT analysis ...............................................................................................................................................77 3.3.1.1 Strenghts .......................................................................................................................................................78 3.3.1.2 Weaknesses ...................................................................................................................................................79 3.3.1.3 Opportunity ...................................................................................................................................................80 3.3.1.4 Threats ..........................................................................................................................................................81 3.3.2 Comments on SWOT .....................................................................................................................................83
3.4 Review of other competent authorities’ policies and other organization ............................................. 86
3.5 Regional vision, area of intervention and objectives ............................................................................. 88 3.5.1 Regional Vision ..............................................................................................................................................89 3.5.2 Regional plans & roles ...................................................................................................................................89 3.5.3 The route: areas of intervention ...................................................................................................................90 3.5.4 RAP’s objectives ............................................................................................................................................92
3.6 RAP actions ............................................................................................................................................. 94 3.6.1 Action list ......................................................................................................................................................94 3.6.2 Action prioritization ......................................................................................................................................95 3.6.2.1 MCA methodology ........................................................................................................................................96 3.6.2.2 Methodology for Priority Action Definition ..................................................................................................97 3.6.2.3 Ranking ..........................................................................................................................................................99 3.6.3 Action List with prioritization index ........................................................................................................... 107 3.6.4 Action table ................................................................................................................................................ 113
3.7 Coherence of the RAP with other competent authorities' policies and other organization ............... 114
3.8 Monitoring and assessment system .................................................................................................... 116
3.9 Implementation & reporting ................................................................................................................ 118
European Regional Development Fund
Report
Pag. 4/202
4 COMMUNICATION STRATEGY ......................................................................................................... 120
4.1 Main regional, national and other stakeholders .................................................................................. 120
4.2 Measurable communications objectives with evaluation ................................................................... 120 4.2.1 Promoting e-mobility, raising awareness and changing behaviours .......................................................... 121 4.2.2 Facilitating implementation of e-mobility and infrastructure ................................................................... 122 4.2.3 Acquiring resources – human and financial ............................................................................................... 123
4.3 Relevant audiences and available channels ......................................................................................... 124
4.4 A plan of activities and a timetable ...................................................................................................... 125
4.5 Communication risks and mitigation ................................................................................................... 126
4.6 Resources – financial and people, in general ....................................................................................... 126
5 CONCLUSION ................................................................................................................................... 127
6 SOURCES .......................................................................................................................................... 129
7 APPENDIX ........................................................................................................................................ 134
Glossary ............................................................................................................................................................. 202
European Regional Development Fund
Report
Pag. 5/202
Table of tables
Table 1: Final SWOT topics definition ................................................................................................................... 18 Table 2: Supra regional pillars................................................................................................................................. 29 Table 3: The state of play of road connection in Slovenia in 2017 ......................................................................... 49 Table 4: Density of the public road network [km to km2] in Gorenjska: ................................................................ 49 Table 5: The number of vehicles in 2017 by type and municipality: ...................................................................... 64 Table 7: Planned long-term interruptions in 2017: .................................................................................................. 69 Table 8: number of the no. of access of PM10 particles in the main SI measuring locations in 2017 .................... 71 Table 9: Exceeding the ozone warning limit values in 2017 ................................................................................... 71 Table 10: number of tourists arriving to Slovenia by country of origin in 2017 ..................................................... 74 Table 11: SWOT ...................................................................................................................................................... 77 Table 12: Municipal strategic policies on e-mobility by 2018 ................................................................................ 86 Table 12: Areas of intervention ............................................................................................................................... 90 Table 13: Strategic objectives.................................................................................................................................. 93 Table 14: Synthesis table of strategic actions for Gorenjska Region ...................................................................... 94 Table 15: Priority action definition score ................................................................................................................ 98 Table 16: KPI description and weight ..................................................................................................................... 98 Table 17: Ranking table ........................................................................................................................................... 99 Table 17a: Ranking ................................................................................................................................................ 100 Table 18: Action List with prioritization index ..................................................................................................... 108 Table19: Coherence matrix between actions and local policies ............................................................................ 114 Table 20: Monitoring and assessment template..................................................................................................... 116 Table 21: Identified promotional actions and actors ............................................................................................. 121 Table 22: Identified promotional actions and actors ............................................................................................. 122 Table 23: Identified promotional actions and actors promoting by utilizing financial and human resources. ...... 124 Table 24: planning promotional activities for Action plan, example .................................................................... 125
Table of figures
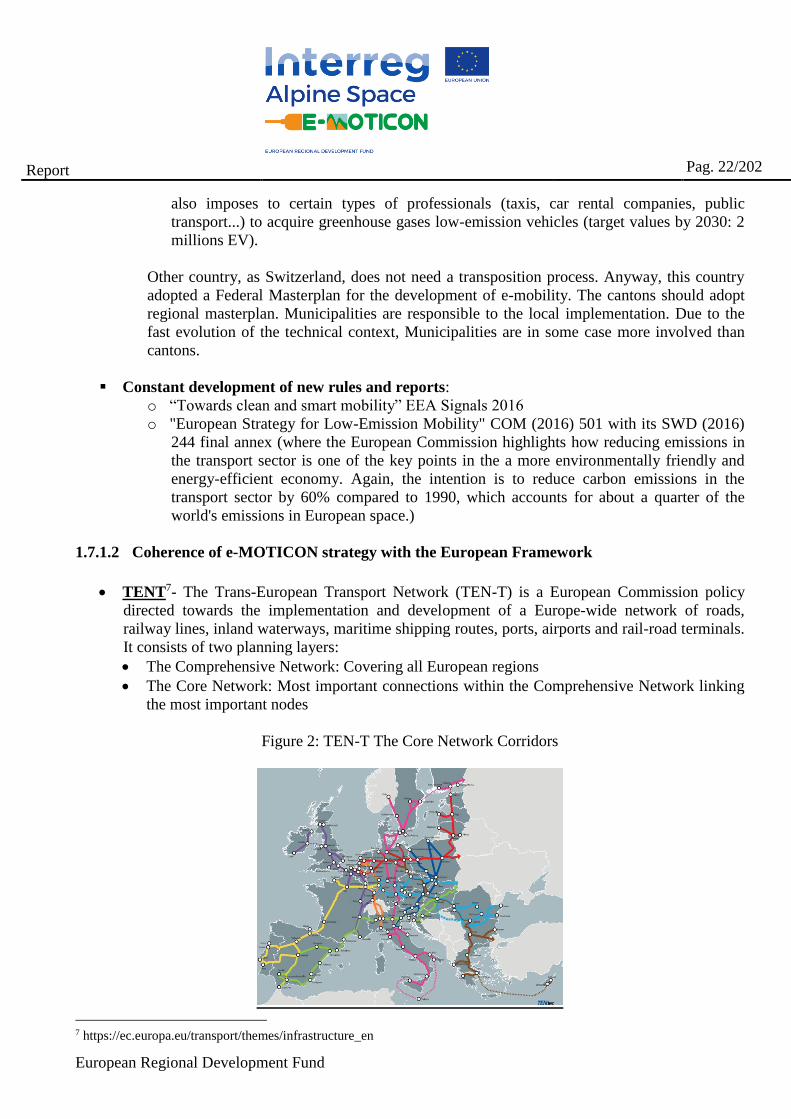
Figure 1: e-MOTICON local SWOT topics survey - average values ...................................................................... 17 Figure 2: TEN-T The Core Network Corridors ....................................................................................................... 22 Figure 3: Alpine region ........................................................................................................................................... 25 Figure 4: Regions of Slovenia; Source: Portal Medicus .......................................................................................... 45 Figure 5 : Municipalities of Gorenjska region ; Source: Ministrstvo za obrambo, URSZ, 2018 ............................ 47 Figure 6: Main highway to AT ................................................................................................................................ 48 Figure 7: Main highway connection to IT ............................................................................................................... 48 Figure 8: A2 conecting Gorenjska with Ljubljana and AT and IT ......................................................................... 49 Figure 9: Slovenian railway connections: Map of Slovenian rail network .............................................................. 50 Figure 10: Rail connections ..................................................................................................................................... 51 Figure 11: Contribution of the transport sector to total emissions of the main air pollutants ................................. 62 Figure 12: Map, Traffic load 2016, area of Gorenjska ............................................................................................ 66 Figure 13: Map, Overview of counting points 2016, area of Gorenjska ................................................................. 66 Figure 14: Areas of operation electro distributing companies in Slovenia. ............................................................. 67 Figure 15: The maximum peak demands over the years of 2015 to 2017 are shown in the following figure: ....... 68 Figure 16: Tourist more visited places in Gorenjska, 2018 ..................................................................................... 73 Figure 17: Three impact criteria ............................................................................................................................ 100
European Regional Development Fund
Report
Pag. 6/202
Table of appendixs Appendix no1: Arrivals and tourists night stays by: country, municipality, measurements and months .............. 134 Appendix no2: Domestic arrivals and tourist overnight stays by: country, municipality, measure, month .......... 135 Appendix no3: Arrivals and tourist overnight stays from abroad by: municipality, country, measurement, and
months ................................................................................................................................................................... 136 Appendix no4: E-CS set-ups by location, specification, owner, operator… in Gorenjska, 2018 ......................... 162 Appendix no5: Action tables ................................................................................................................................. 170 Appendix no.6: Prioritization index ...................................................................................................................... 201
European Regional Development Fund
Report
Pag. 7/202
FOREWORD
Low and inhomogeneous deployment of electro mobility (e-mobility) characterises Alpine Space (AS).
The count of electric charging stations (E-CS) varies from 15 to 235 E-CS per M inhabitants whereas e-
vehicles’(EV) number varies from 70 to 470 per M inhabitants. One reason for the inadequate diffusion
is low interoperability of E-CS often due to the limited integration of planning instruments used by
Public Administrations (PA) and their lack of knowledge in technological innovation and business
modelling. If at all, PAs address the issue in an isolated way and leave the investments to private non-
coordinated initiatives; therefore there is a need of regional administrations’ capacity building and
integrated transnational approach. e-MOTICON brings together 15 partners from 5 countries, involving
40 observers and 8 endorsements from each programme area and Switzerland, including managing
authorities, regional bodies, research centres and private investors. The partnership aims to support PAs
in ensuring homogeneous development of e-mobility, deploying an innovative transnational strategy of
integration among spatial planning, innovative business models and technologies, sustainable mobility
patterns, energy efficiency instruments and policies enabling large diffusion of E-CS and wider
interoperability. After the analysis of policies, business models and technological solutions, e-
MOTICON delivers a White book on innovative E-CS planning to respect e-mobility requirements in
AS transnational strategy and Regional Action Plans. It provides a toolset to anticipate E-CS network
requirements and test it in 3 joint pilot actions. A transnational community involves PAs and
representatives of the e-mobility industrial sector, research centres, regional agencies, end users
(residents & tourists) and public transport agencies to improve PAs capacity on E-CS planning,
cooperation, increase knowledge and enhance consensus.
1 INTRODUCTION
e-MOTICON project support the realization of RAPs in order to support and adapt to local needs on the
subject to enhance the public administration capabilities in building an interoperable infrastructure for
charging electric vehicle in the Alpine Space, coordinating and using the DIFA1 transposition in the
different countries.
The proposed action are coherent with EU policies, Alpine Space area policies (EUSALP, EUREGIO,
Montraf! objectives) for a common long-term vision for a sustainable transport system for the Alpine
Space. The common short- and mid-term targets defined in the strategy, as common target to reach are
translated into actions that are listed and ranked, as a development path. The proposed measures, that
support these targets, will lead to a more harmonised transport system, including the use of new steering
instruments.
Moreover the RAPs will live over the project lifetime, remaining as a living document that can be used
to continue the path towards the long term objectives.
1.1 Objective of this report
e-MOTICON project developed 5 Regional Action Plans for each of the 5 countries (Austria, France,
Germany, Italy, Slovenia). The main objectives of the RAP are to give a common strategy in all the
different areas to enhance the public administration capabilities in building an interoperable
1 Directive 2014/94/EU of the European parliament and of the council: https://eur-lex.europa.eu/legal-
content/en/TXT/?uri=CELEX%3A32014L0094
European Regional Development Fund
Report
Pag. 8/202
infrastructure (E-CS) for charging electric vehicle (EV) in the Alpine Space, considering that low and
inhomogeneous deployment of electro mobility (e-mobility) characterises Alpine Space (AS). One
reason for the inadequate diffusion is low interoperability of E-CS often due to the limited integration of
planning instruments used by Public Administrations (PA) and their lack of knowledge in technological
innovation and business modelling. If at all, PAs address the issue in an isolated way and leave the
investments to private non-coordinated initiatives; therefore there is a need of regional administrations’
capacity building and integrated transnational approach.
1.2 What are the RAPs for?
e-MOTICON Regional Action Plan are intended to
✓ help in defining coherent actions to gain common objectives (long term & medium/long term)
for the Alpine Space Area
✓ help to implement a common Alpine Space Strategy (e-MOTICON Strategy) at Regional/Local
level
✓ support the transportation choices of Public Administrators to:
o make and move more people via e-mobility
o implementing interoperable E-CS.
o increase mobility options,
o improve safety,
o address climate change,
o improve public health,
o create more eco-friendly accessibility to fragile ecosystem areas
1.3 What are the RAP target groups?
e-MOTICON RAP’s target groups are mainly represented by the regional (or local, depending on
National rules) Public Administrations involved in planning and supporting the deployment of
infrastructure networks for charging electric vehicles.
1.4 RAP’s Guiding Principles
The main guiding principles for the RAPs are represented by :
• Environmental & energy goals achievement (at EU, national level, local measurements)
• Transport policies should be managed along the environmental capacities of the sensitive
mountain areas and should not put at risk the health of citizens,
• Look for a sustainable transport system:
o LCA2 approach to assess the environmental value of transport system/solution
o Externalities methodology for measuring impact of transport solution/system
o mobility with less externalities (as e-Mobility) could be locally advantaged because its minor
impact on health & environment
• Public participation and stakeholder involvement: to create awareness about the problem and
ensure a sense of public ownership in order to build support for relevant measures;
2 Life Cycle Assessment - JRC "ILCD Handbook. General guide for Life Cycle Assessment: detailed guidance", EUR24708
EN (2010).
European Regional Development Fund
Report
Pag. 9/202
• Integration: an interoperable E-CS network is an integral part of the mobility environmental
energetic policies for European countries and the whole EU
• E-CS planning should be closely linked to spatial planning and economic promotion policies to
better meet mobility demands in passenger and freight transport to ensure regional development
• Sustainable consumption and production: the use of goods and services that respond to basic
needs and bring a better quality of life, while minimising the use of natural resources, toxic materials
and emissions of waste and pollutants over the life cycle;
• Best available knowledge and socioeconomic effectiveness: actions and operational targets
should be based on available knowledge and take into account the social and economic costs of
pollution compared to the cost and benefits of proposed measures.
1.5 Intervention lines
The main intervention lines are represented by:
• enhance the public administration capabilities in building an interoperable infrastructure for
charging electric vehicle in the Alpine Space
• support local public administration in fulfil health and environmental goals
• contribute to a shared policy that involves the contribution of investors and operators
1.5.1 General: KPI for monitoring, evaluation, communication
The proposed methodology suggests a list of action that will be ranked according local need and
vocation. The actions will be described through use of a list of KPIs3 (Key Performance Indicator). This
approach imply a deep analysis to understand both the present state of the art and what is relevant,
moreover it focus on key activities, associated with the selection of performance indicators. The use of
KPI will:
• assure a simple monitoring of the effect of the actions,
• gives feedback for its evaluation along the time.
• Gives a simple scheme on which develop a communication/information strategy, supporting a
governance model in which administrators and general public can easily understand action
goals, costs, progression.
The use of KPI will also support a prioritization actions based on MultiCriteriaAnalysis4 (MCA), that
will be proposed in the following chapters.
The ranking among actions considers contribution of many features, as action impact, costs and
duration.
1.6 Methodology
e-MOTICON suggests Regional Action Plans to Public Authorities with a transnational approach,
coherent with supra regional policies and plans, on the theme of deploying an interoperable
infrastructure for electric vehicles. This work is done on a solid review of the existing situation (State of
the Art). The RAP proposes also some action for reaching short, medium and long term objectives.
3 A Key Performance Indicator is a measurable value that demonstrates how effectively the process is achieving key
objectives. 4 MultiCriteria Analysis explicitly evaluates multiple conflicting criteria in decision making
European Regional Development Fund
Report
Pag. 10/202
These actions derives also from the Pilot Action experiences (actions with a strong transnational feature)
designed in order to check solution on main open questions.
The scenario analysis of each Alpine Space region has revealed a remarkable diversity of approaches in
terms of promotion and development of e-mobility. Analysis made in e-MOTICON project itself and in
other AS project (e.g iMONITRAF!) are able to provide a broad overview on existing policies, on its
background and actions
1.6.1 State of the art analysis
In general, all the e-MOTICON area of interest has implemented both regulatory and market-based
measures. Most regions use restrictive regulatory ones about traffic with exemptions from bans or from
parking payment for e-mobility. Financial measures are considered in addition or in substitution to the
previous ones; market-based approaches can be found through subsidies for vehicles purchasing,
charging infrastructure installation and subscriptions. The following figure provides an overview of
measures taken by different regions involved in the e-MOTICON project and shows their
implementation at each level.
1.6.1.1 Link with the main policies in the Alpine Space
All countries involved in the e-MOTICON project have implemented policies of support for the
conversion from traditional mobility (based on ice) towards e-mobility. Countries as Germany have so
far implemented an approach based primarily on the application of measures of legislative and
regulatory nature. Italy and Liechtenstein have, with different levels, implemented more market shares.
The distinct national structuring in terms of government and expertise is able to impact strongly in the
kind and in the “magnitude” of measure adopting. Federal governments such as Austria and Switzerland
are characterized by many local variables that differ considerably territories also sparsely far apart.
Actions on information, monitoring and awareness include specific measures can be defined as being a
potentially flexible base and a support for further measures. These actions may include monitoring e.g.
type and amount of traffic e-vehicles flows, service state of E-CS and real time information for
customers that have to adopt a suitable behavior. Awareness campaigns are important to raise awareness
and connect the Alpine transport policy with users. The following table provides a description adopted
by some regional authorities in those terms.
Measures for reducing negative impacts of traffic and sustainable mobility promotion are intended to
limit the negative environmental impacts of existing Alpine traffic volumes. They generally have an
indirect impact on e-mobility, as all measures of this package of policies typically reduce the
attractiveness of the conventional type transport (i.e. ice-vehicles). These policies include permanent
measures as well as emergency measures to tackle air pollution peaks.
Permanent measures include various types of bans which are aimed at different objectives of sustainable
transport in the Alpine Space area. For example, the bans related to highly polluting vehicles (from
which e-mobility is exempt) can be seen as a reference measure to reduce air pollution. To avoid
atmospheric pollution peaks, this policy also includes more targeted interventions that enter into force
only when the air pollution exceeds or is approaching the limit values. In the following table are
presented the permanent measures taken by some Alpine Space regions in order to deal with this aspect.
European Regional Development Fund
Report
Pag. 11/202
Moreover the tourism phenomenon in the Alpine area has been exploited over the years by some local
authorities to develop and promote “clean” mobility solutions, including e-mobility, have been
implemented over the years. Direct services to mountain resorts or luggage transport are services that
meet the e-mobility characteristics. In this context some regions included in the e-MOTICON project
has made use of their good accessibility e.g. along the European traffic corridors, adding measures for
tourists related to sustainable and e-mobility. The use and the promotion of charging infrastructure could
alleviate the negative impacts caused by the presence of conventional vehicles in high natural value
areas.
1.6.1.2 E-CS infrastructures in Alpine Space area
The E-CS network within the Alpine Space area is characterized by considerable variability, often
caused by different territorial planning both at local and national level. This situation has not so far led
to the creation of a single E-CS collection platform inside the whole area; on the other hand, this
phenomenon is also prevented by a constant and rapid extension of locally developed E-CS networks
and a continuous renewal of existing infrastructures. At the moment it can be considered over 10,500
public charging points within the Alpine Space area. Concerning the evolution of charging networks,
there is a strong presence of E-CS characterized by charging power less than or equal to 22 kW (about
50% of the whole sample), characterized for 86.8% by 22 kW - type 2 - plugs (common in Germany,
Austria and Slovenia) and from 13.2% by 3 kW ones (mostly common in France and Italy). These data
doesn’t consider the Swiss case, whose data are not directly verifiable, characterized by various types of
non-standard plugs. In any case estimations (on projections from LEMnet website) relating to the Swiss
Confederation indicate a presence of 650 22 kW - type 2 – E-CS among on a whole number of 3460
ones (about 18.7%).
Given the 54 major players in the Alpine Space area, more than an half is closely involved in energy
activities, in particular in Germany, Slovenia and France. Nevertheless, normally the E-CS operators are
mostly influenced in installation planning of the charging infrastructure by logistical causes and
customer requests. These phenomena lead them mainly to not care the electrical aspects such as
positioning of the infrastructure (e.g. considering the e-network topology) and its impact in terms of
required power. Besides the installation of the infrastructure, the E-CS operators are commonly involved
in the infrastructure operation, excepting some cases like the simple charging device owned by privates,
companies, local authorities or even third parties. In any case the activities that involve the majority of
the E-CS operators (48 of 54) consist in services provision, including management of web platforms that
allow the operation of charging points, the commercial phase of the charging service, the provision of
energy services (usually related to energy suppliers) related, consulting activities on behalf of
municipalities and companies who want to build a charging network, providing access for charge cards
at the E-CS and, finally, the management of electric vehicle fleets. IT support actions are often related to
the previous ones; this kind of activity considers tools management such as web sites, smartphone
applications, access management server for recharging systems (through RFID cards, prepaid cards,
keys, etc.) and maps of the charging network with information on the technical aspects as well as those
on the operating status. Some E-CS operators have been joined their force to feed a common European
web platform (provided in the LEMnet site, in the following figure) able to provide E-CS current place
and service state.
Currently, the regions involved in e-MOTICON project are characterized by different situations relating
to E-CS infrastructure. Considering the main European corridors TEN-T and the international E-road
European Regional Development Fund
Report
Pag. 12/202
network, new e-infrastructures are currently present, under construction or under discussion. The
significant traffic flows related to major alpine corridors and tunnels may represent an enormous
potentiality for a firstly strong implementation of E-CS in the Alpine Space area. The following table
provides an overall vision for the corridor on the existing infrastructure in order of type and placing.
1.6.2 E-MOTICON strategy and pillars
e-Moticon objectives: the project aims to “contribute to the homogeneous diffusion of Electric
Mobility throughout the Alpine Space, providing a transnational strategy for seamless use of electric
vehicles and charging spots with an integrated approach supported by PAs”.
In e-MOTICON Project the term “visions” refers to two different items:
• A long-term vision, which indicates what is expected to be the future of e-mobility in the next
15-20 years. This includes the evolution of both technical aspects, users’ needs & behaviors and
PAs role, activities & organization.
• A project-term vision, which indicates what is wanted to be the future of e-mobility in the
Alpine Space in the next 3 years. strongly related to e-Moticon objectives (which should cover,
at least, a relevant part of the vision).
The Strategic Vision is based on the following main features:
• Public Authorities are a key actor to lead the infrastructure development
• The Alpine Space is made of different realities, from Metropolitan Areas to isolated
rural/mountain areas. The optimal solutions for transport are multiple:
o Local Public Transport in urban, peri-urban and congested areas;
o Rails for freight and passenger transport especially for long-range and cross-country trips
o Low emissions private transport for small cities, towns and mountain communities.
• Technologic solutions are ready and mostly available. It’s now important to choose common
solutions, set up common rules and respect them.
• Goals can be reached according to a “priority approach”
• A set of few, focused and coordinated actions would be sufficient to reach the goals
• Communication, education and training are sometime more important than technical aspects
Six strategic Pillars are defined in order to approach the Strategic Vision, and fulfill the strategic
objectives:
#1—DEFINE THE BEST POSSIBLE ROLES OF PAS: within the Alpine Space, Public
Authorities play many different roles with regards to charging infrastructure deployment. Choices of PAs
can depend on many aspects and can find expression in many different actions. The relevance of PA on
two main aspects is crucial: its commitment towards e-mobility and its availability of money for the
charging infrastructure.
#2—SET SUPRA-REGIONAL COMMON MINIMUM RULES ON INFRASTRUCTURE:
setting supra-regional common minimum rules permits PAs should facilitatethe deployment of a
trnsnational charging infrastructure.
#3—IMPROVE THE INFRASTRUCTURE: it has to be noticed that the diffusion of charging
points is not homogenous around the Alpine Space and that relevant differences exist, both from
one country to another and from different areas in the same country. This leads to the existence
of areas with a high density of charging points (mainly urban and metropolitan areas) but, at the
European Regional Development Fund
Report
Pag. 13/202
same time, to the existence of completely unequipped areas, especially in rural and mountain
areas of some countries. In order to let EV drivers easily travel along the Alpine Space, it is
mandatory to cover “black areas” as soon as possible. These parts of territory often represent
“market failure” areas, where the number of charging events could unlikely create interesting
revenues for the service provider. Despite of that, it is due of the Public Authority to provide EV
charging as a “public service”, in order to let anybody travel in the whole regional territory
without any limits and to allow accessibility also to rural and mountains area, often linked to
touristic attractions (skiing, wellness, lake sailing, trekking, hiking…).
#4—ADOPT AN INTEGRATED, SUPRA-REGIONAL MAPPING TOOL: The need to
find a charging station is a common issue for any EV driver. Nowadays, different solutions are
co-existing for this purpose; each of them still often doesn’t represent the perfect answer, as they
commonly include only a partial representation of the complete infrastructure or partial/not
verified information. Moreover a transnational approach is strongly needed: EV users nowadays
have to adopt and compare different instruments. e-MOTICON partners agree on the need for a
more structured solution, in order to let the drivers have a sure and reliable source of information
for the whole area. They suggest this issue have to be solved by realizing National official
databases for publicly accessible EV recharging points. This database should provide EV drivers
with the location of the charging points, and possibly indicate whether they are free or occupied,
out of order, or momentarily not accessible, for each country in the Alpine Space. These
databases already exist in some European countries, while are still missing or under development
in many other. Once National official databases are available and reliable data are accessible to
third parties, it will be a natural consequence to aggregate them into a “transnational map”.
#5—EMPOWER COMMUNICATION AMONG PUBLIC AUTHORITIES and OTHER
STAKEHOLDERS: in order to create a favourable and homogenous environment for e-
mobility development, there is a strong need of communication and coordination among them.
The scope of this communication is to commonly identify minimum technical requirements for
the infrastructure among different Regions, share knowledge and information about e-mobility,
spread knowledge.
#6—GUARANTEE SYNERGY AMONG PRIVATE AND PUBLIC TRANSPORT :
Because of private transport still represents the biggest component of urban traffic, it is therefore
a crucial aspect on which to intervene through more sustainable solutions as e-mobility.
Nevertheless, it has to be taken into serious consideration that local public transport (LPT),
especially within metropolitan areas, is one of the most effective modal solution and that a
sensible shift from private to public transport would have a very effective impact on
sustainability of urban mobility.
1.6.3 Pilot Action experiences
The e-MOTICON Pilot Actions are intended to test and assess measures to enable stakeholders to contribute to
building an international interoperable E-CS network in the long term in alignment with common strategies and
objectives.
The pilot actions strive to test measures which specifically appeal to the before mentioned target groups and help
them to engage successfully in the development of an interoperable E-CS system empowering them in the long
run to identify and carry out actions which will help trigger the aspired growth of the E-CS network in accordance
with national and international strategies and specific goals.
European Regional Development Fund
Report
Pag. 14/202
1.6.3.1 Role and goals of the pilots
The main goal of the pilot actions is to address the strategic objectives within the document giving support by
gaining new insights, suggesting and testing new technological solutions, supporting exchange of experiences,
providing and distributing knowledge via different channels in the different fields concerning E-CS. With this
strategy of support, empowerment and knowledge gain they also address the bigger strategies, policies and
objectives concerning e-mobility which build the context for the pilot action.
Within the pilot actions concrete activities to support the establishment of interoperable E-CS infrastructure are
performed aiming for the following goals which serve to reach the vision pictured before and the project
objectives by providing concrete deliverables and outputs and supporting the deliverables and outputs of other
tasks performed in the adjacent work packages:
• Testing individual measures in different regions
• Gaining knowledge on the implementation of interoperability measures
• Providing recommendations and best practices for interoperability measures
• Provide newly generated knowledge as input for the other pilot actions and follow-up activities
• By using similar measures in different regions and applying tested measures again later on during the
implementation of the pilots test their replicability
• Demonstrate and test the application of measures supporting national and international E-CS strategies
and planning throughout the Alpine Space
• Generate input especially best practices and recommendations for measures for a guideline
• Generate knowledge for the definition of the planning strategy and a basis for the development of
regional action plans.
The role of the pilot actions is the actual implementation of measures in the field, whereas the role of the strategy
is to provide a theoretical background for E-CS planning and objectives in the short- and long-term. The Pilot
actions striving to derive an improved transnational strategy adjusted for the Alpine Space with concrete
recommended actions. The first with a theoretical focus, the second for practical purposes, but both of them are
intertwined and rely on each other. And again both of them are spread and discussed within thee-MOTICON
transnational community.
In general the benefit added by pilot actions to the project are recommendations for actions that have already been
tested and evaluated concerning their potential effect on E-CS development and empowerment of stakeholders to
get successfully involved in the realization of an interoperable E-CS network.
Action plans not only include the description of challenges and the need for action, together with goals but also
include measures to reach these goals and this is where the pilot actions can help to define regional action plans.
The pilot actions strive to find innovative measures and ways to successfully reach strategic goals to realize an
efficient practical interoperable E-CS network that fulfils the needs of its users. They put these measures to a test,
thus finding out which of them can be recommended under which circumstances and what the potential effects on
the E-CS infrastructure development may be. Therefore they can be very valuable as part of newly developed
regional action plans, as a better estimation of their feasibility and accomplishable results upon their realization
exists. The findings (descriptions of measure plus experiences made during the implementations) are put together
and made available as guidelines, which are directly useable by the regional public authorities, which are the main
drivers of regional action plans. So the guidelines which feature the pilot actions as use cases and best practices
are put to a test within the project to guide the first regional action plans which include measures from the pilot
actions where suitable.
European Regional Development Fund
Report
Pag. 15/202
1.6.3.2 Short description of the e-MOTICON pilots
• The activities carried out in the pilot action e-HUB aim to understand better which measures help to
ensure legal and political interoperability. The main objectives to be supported are:
o Communication (vertical and horizontal): needs, activities, coordination.
o Policy transfer & application (vertical and horizontal).
o Knowledge diffusion: exchange of best practice, technology update on E-CS and e-Mobility, pilot
actions results.
The instruments used for the activities in the pilot regions are: WEB based platform: internal working
space & external/public communication and repository, questionnaires and interviews and local seminars
The Pilot action has three activities:
o Activity 1 – Set up instruments for the help-desk model
o Activity 2 – Transfer and collect information to local authorities and users
o Activity 3 – Guidelines (policy recommendations) on e-mobility for local public authorities and
coordination of local networks
• Problem identified giving the basic idea for the e-TRAIL pilot was that disparities exist between existing
and emerging set-ups of ECS5 and established ECS networks, managing systems within PP regions that
are or could enable integration of regional ECS networks into transnational interoperable and e-roaming
systems. Since they are ECS that are not interoperable and still ECS being set up without the technical
software to be interoperable, the objective of the pilot is increasing the readiness of local /regional ECS
networks to be integrated into local/regional/transnational interoperable and roaming systems and to
improve regional/local policies to better service potential national or foreign investors in ECS
infrastructure and to ease user experience using ECS regardless to where user comes from.
Another thing is that user informational platforms have to be addressed in order to better serve the user.
The existing issues are that in some cases they are several existing platforms not providing unified
information or having the same methodological approach of displaying information. This may confuse the
user and the service providers. In other case(s) information platform has to be set up to enable
information on localization, type of ECS, payment possibilities, availability etc. – in short to enhance
ECS network information both for users, developers and operators. The objective for the informational
platforms is to identify the needs of improvement and do steps for improvement.
Where the above issues do not represent a challenge another developments are going to be realised. ECS
networks will be a part of integrated existing multimodal transport and better services the users. Simple
application of use of the charging infrastructure, an app or mobility card can and will be used to extend
the possibilities of use to other transport systems to ease multimodal mobility travel. Timeframe
milestones will help monitoring the progress of the e-TRAIL pilot activities. Scheduled meetings within
the pilot timeframe will serve as knowledge exchange opportunity and tackle possible obstacles during
the implementation of the activities. It has three activities:
o Activity 1: Setting up interoperable systems
o Activity 2: User information platforms
o Activity 3: E-roaming platforms
• Due to public fundings, the implementation of municipal masterplans on electric mobility and E-CS
infrastructure is increasingly proceeding. It is expected that the activities as well as the issues addressed
5 Regarding the interoperability they are different types of ECS, having different power and therefor time of charging. The
number of phases and the power in kW influences charging time. Three-phase ECS with the power of 11 kW takes for
instance up to 3 hours of charging an empty battery. Three phase ECS with the power of 22 kW takes up to 1 hour to charge
the battery. One phase – domestic ECS up to 7.4 kW take up to 4 hours. One way current on the ultrafast ECS (so called DC)
enables charging in half an hour. They are found usually by the high ways at gas stations for transit traffic.
European Regional Development Fund
Report
Pag. 16/202
will be consistent to a great extent. However, these concepts won´t be extensive in some areas as there are
limited means for elaborating studies and practical investigations. e-MOTICON project can provide
valuable insights to reinforce municipal concepts, adding methods of P&L (process and localization).
This methods include surveys, intercorporate mobility management programs and the acquisition of data
on mobility demands obtained by data loggers applied in conventional vehicles. In this context we
suggest to retrieve viable information from available actors, regions, sources and to set the investigation
work as broad as possible within our opportunities:
The following activity are within P&L:
o Activity 1: “Usage analysis of E-CS infrastructure”
o Activity2: “Survey on service providers, citizens and tourism organizations to improve E-CS
localization and their operation in the Rhône-Alpes region”
o Activity 3: „The role of resident companies in local e-mobility and E-CS masterplanning -
Involvement of an industrial zone in the Berchtesgaden Land as case study“
1.6.4 A tool to Increase Consciousness of the Territories on their Potentialities: the Local SWOT
Analysis
This study is performed on the results of the analysis of the actual situation. The SWOT analysis is a
tool for strategic planning for the evaluation of complex phenomena. In practice this type of study is a
logical process, originally used in business administration and then applied in other areas, allowing you
to make the information gathered around a specific theme systematic and useful.
This methodology was born in the US in the late 60s, it was originally developed for the definition of
business strategies in contexts characterized by uncertainty and strong competitiveness, and only since
the '80s was used as a support for public intervention to analyse choices alternative development
scenarios. Today the use of this method has been extended to the territorial diagnosis and evaluation of
regional programs, since the EC regulations requiring it for the assessment of plans and programs.
The SWOT analysis has become one of the most common methods for evaluating governance; it is used
to carry out the assessment of the strengths (Strengths), of the weaknesses (Weaknesses), opportunities
(Opportunities) and threats (Threats) related to financial planning, scheduling resources or any other
situation that answers the need for streamlining the decision-making processes. The first element that it
is necessary to perform a SWOT analysis consists in defining the objective to be achieved; it must be
explicit and approved by all the participants in the analysis process. The objective has to be then
endorsed during a consultation process by a wide consensus. In brief SWOT analysis leads to the
identification of strengths and weaknesses internal to the program (endogenous), and the context of
external opportunities and threats (external factors). The strengths and weaknesses are all those variables
that are an integral part of the system specifically to the analytical framework on which you can step in
and be modified through interventions and policy proposals. The opportunities and threats, in contrast,
are external variables that can, anyway, influence the system; they have to be kept under control in order
to exploit the positive events and prevent the negative ones.
The validity of the SWOT analysis, in terms of completeness, is linked in a direct manner to the quality
of the preliminary stage. Which is the main subject of the project must be thoroughly studied in order to
highlight all the features, relationships and synergies with other proposals. For this reason it is not only
necessary to know the specific issue but also the framework of the entire full context. In any case, the
lack of an appropriate number of SWOT indicators could anyway offer important possibilities for
further study on that sectors which have proved deficient in information.
European Regional Development Fund
Report
Pag. 17/202
The effectiveness of the analysis depends on the possibility to carry out a cross-reading of the identified
main project elements; to make an easier reading, analysis results are presented as summary form in a
diagram. It seeks, therefore, to bring out the elements able to promote or hinder the achievement of the
objectives. The final result of this activity is then a matrix, organized into four sections containing the
critical elements of the intervention and of the territory.
1.6.4.1 How e-MOTICON approach to local SWOT
The eMOTICON’s SWOT analysis has been developed through a participatory approach, which means
that a proposed conceptual framework has been discussed with all partner regions to integrate their
experiences and interests. The final results is therefore influenced by the context and the needs of the
partner regions.
The project’s SWOT definition had the following sequential phases:
• SWOT topics drawing up draft
The activity was based in a first phase on the drafting of plausible topics, derived from similar other
Interreg projects, taken as models (eg. Project REZIPE).
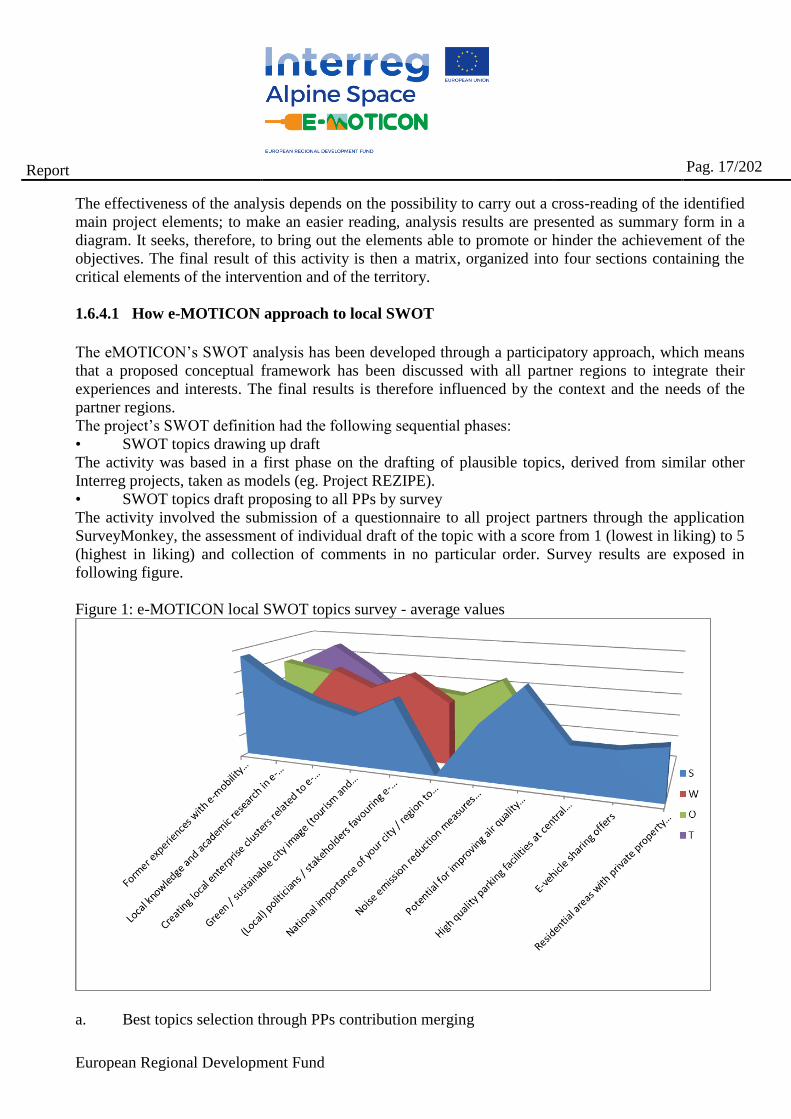
• SWOT topics draft proposing to all PPs by survey
The activity involved the submission of a questionnaire to all project partners through the application
SurveyMonkey, the assessment of individual draft of the topic with a score from 1 (lowest in liking) to 5
(highest in liking) and collection of comments in no particular order. Survey results are exposed in
following figure.
Figure 1: e-MOTICON local SWOT topics survey - average values
a. Best topics selection through PPs contribution merging
European Regional Development Fund
Report
Pag. 18/202
The phase involved the selection of 5 best topic for each category (S, W, O and T), possibly
supplemented by topic derived from individual comments deemed to be of particular relevance.
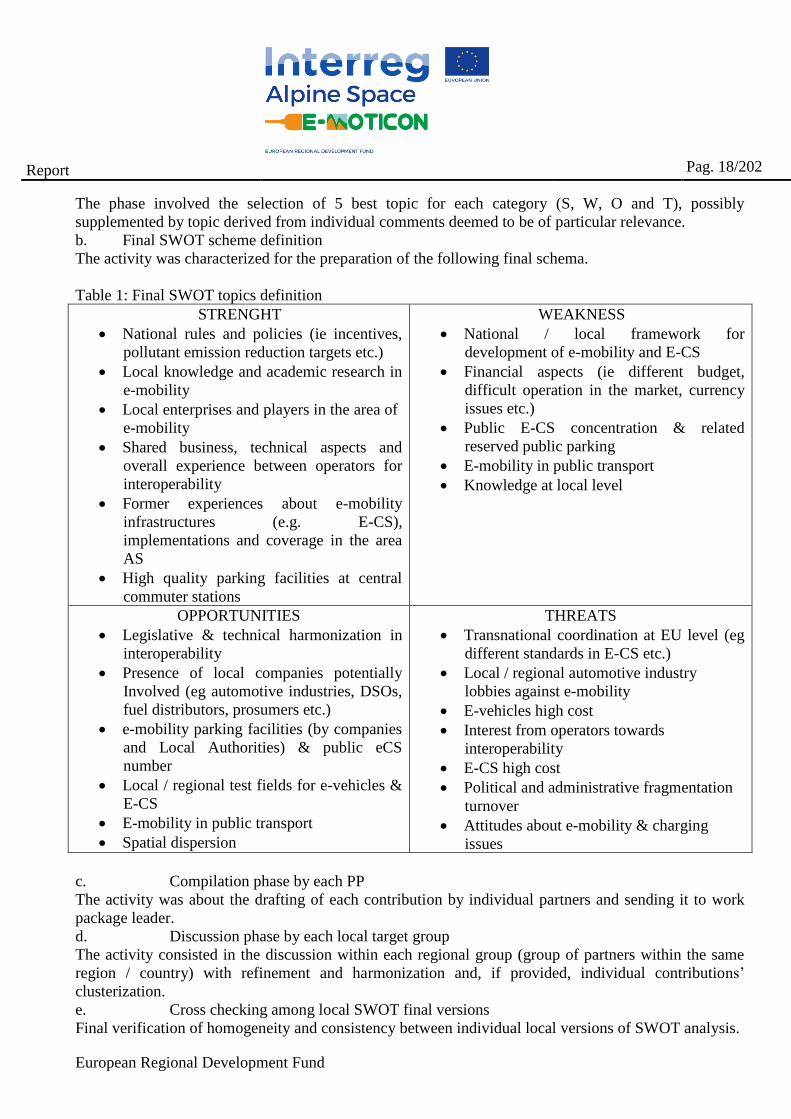
b. Final SWOT scheme definition
The activity was characterized for the preparation of the following final schema.
Table 1: Final SWOT topics definition
STRENGHT
• National rules and policies (ie incentives,
pollutant emission reduction targets etc.)
• Local knowledge and academic research in
e-mobility
• Local enterprises and players in the area of
e-mobility
• Shared business, technical aspects and
overall experience between operators for
interoperability
• Former experiences about e-mobility
infrastructures (e.g. E-CS),
implementations and coverage in the area
AS
• High quality parking facilities at central
commuter stations
WEAKNESS
• National / local framework for
development of e-mobility and E-CS
• Financial aspects (ie different budget,
difficult operation in the market, currency
issues etc.)
• Public E-CS concentration & related
reserved public parking
• E-mobility in public transport
• Knowledge at local level
OPPORTUNITIES
• Legislative & technical harmonization in
interoperability
• Presence of local companies potentially
Involved (eg automotive industries, DSOs,
fuel distributors, prosumers etc.)
• e-mobility parking facilities (by companies
and Local Authorities) & public eCS
number
• Local / regional test fields for e-vehicles &
E-CS
• E-mobility in public transport
• Spatial dispersion
THREATS
• Transnational coordination at EU level (eg
different standards in E-CS etc.)
• Local / regional automotive industry
lobbies against e-mobility
• E-vehicles high cost
• Interest from operators towards
interoperability
• E-CS high cost
• Political and administrative fragmentation
turnover
• Attitudes about e-mobility & charging
issues
c. Compilation phase by each PP
The activity was about the drafting of each contribution by individual partners and sending it to work
package leader.
d. Discussion phase by each local target group
The activity consisted in the discussion within each regional group (group of partners within the same
region / country) with refinement and harmonization and, if provided, individual contributions’
clusterization.
e. Cross checking among local SWOT final versions
Final verification of homogeneity and consistency between individual local versions of SWOT analysis.
European Regional Development Fund
Report
Pag. 19/202
1.6.5 A tool to gain the objectives: Action
For the Regional Action Plan, e-MOTICON partnership agree with the following definition for “action”:
Action means: activities, projects, political actions taken in the short, medium or long term to promote
electric mobility and recharging infrastructure in the territories
The proposed procedure for getting a rank and a prioritization of action gets four steps:
• Area objectives definition
• Definition of the most effective action to get the objectives: the strategic objectives are translated
into strategic actions that bring to the objective achievement.
• Identification of common KPI (for all the Alpine Space) for describing monitoring, evaluation
and communication of actions;
• Action ranking & prioritization; the action list needs a prioritization. e-MOTICON proposes a
Strategic Action Prioritization scheme based on participation-based governance models. The technical
tool proposed for managing the multi objective complex theme is Multi-criteria analysis (MCA). MCA
can manage and translate in operative words the relevance that the Region defines for each action.
1.7 Coherences
1.7.1 Coherences with other competent authorities policies
e-MOTICON Project checks suggests the RAPs to support Regional and local Public Administrations in
their planning and developing duty. These RAPs are developed in coherence with the other
supraregional vision and policies.
1.7.1.1 Coherences with European rules and vision on transport, energy & environment
▪ Paris agreement: (The Paris Agreement commits the countries to maintain the temperature rise
below 2 ° C and, if possible, below 1.5 ° C compared to pre-industrial levels. The Agreement
was signed by Italy, together to 177 Countries, 21 April 2016)
▪ Climate and Energy Package 20306 (it foresees a 40% reduction in greenhouse gas emissions
compared to 1990. This target means a 43% reduction in emissions by 43% compared to 2005
for the sectors involved in the so-called Emissions Trading System (ETS) and a reduction in
greenhouse gas emissions 30%, as compared to 2005, for non-ETS sectors, such as transport.)
▪ Effort Sharing, COM(2016) 482 final, July 20th 2016 (The European target has been declined
at national level by the proposal of the "Effort Sharing" Regulation of the European
Commission, currently being negotiated, which assigns Italy a target of reducing emissions of
non-ETS sectors by 33% compared to 2005)
▪ European Directive 2009/28/EC (forces Member States to promote the use of energy from
renewable sources. Specifically, it defines the commitmens for each Member State to ensure that
its share of renewable energy sources on gross final energy consumption in 2020 is at least equal
6 European Council (23 and 24 October 2014) - Conclusions on 2030 Climate and Energy Policy Framework, SN 79/14, 23
Ottobre 2014.
European Regional Development Fund
Report
Pag. 20/202
to its national general target for the share of renewable energy sources for that year. These
compulsory national targets are consistent with the objective of at least 20% of energy from
renewable sources in the gross final energy consumption of the Community in 2020. And with
the aim to achieve these objectives more easily, each Member State is required to promote and
encourage energy efficiency and energy saving. The Directive was transposed into Italy by
Legislative Decree No 28 of 3 March 2011, in particular Title V, Chapter IV, the support
schemes for the use of renewable energy sources in transport and in Title VII the criteria for
biofuels sustainability and bio-liquids.)
▪ Regulations 510/2011 and 333/2014 on CO2 emissions (European regulations impose
progressively more severe limits on CO2 emissions. In particular, Regulations 510/2011 and
333/2014 define respectively the average fleet target for new light commercial vehicles, equal to
175 gCO2 / km by 2017 and 147 gCO2 / km by 2020, and for new passenger cars, equal to 95
gCO2 / km by 2021. The Commission is also committed to finalize a strategy aimed at reducing
emissions from trucks, buses and coaches before 2030).
▪ World Harmonised Light Vehicle Test Procedure (The European Commission will introduce
a stricter procedure for the certification of passenger cars and light commercial vehicles. Starting
from September 1, 2017, the WLTP (World Harmonized Light Vehicle Test Procedure)
procedure will be introduced, which will require stricter and realistic laboratory tests (the NEDC
cycle will be replaced by the WLTC cycle) and will be completed by roadside testing (RDE -
Real Driving Emissions) carried out using PEMS (Portable Emission Measurement System)
systems. The aim is to drastically reduce the gap between CO2 emissions, consumption and
emissions of pollutants (NOx in the first place) detected according to the current vehicle type
approval procedures and those actually issued in the roadside guidance. It should be noted that a
more severe and more representative evaluation process of actual use will also be used for
electric vehicles, with the application of new approval cycles and attention also to the
consumption of auxiliary devices such as air conditioning.)
▪ White Paper 2011 on Transport (The White Paper on Transport sets up objectives and
measures for an efficient transport system, respecting economic, social and environmental needs.
In particular, in the 2011 White Paper, the user is at the center of transport policy and targets
include increasing road safety levels (eg through harmonization of sanctions and the use of
innovative technology systems), increase awareness among users of transport costs (for example
through a policy of charging for the use of infrastructures), the dissemination of practices such as
intermodality of passenger transport and rationalization of urban transport (eg differentiating
energy sources, stimulating transport demand by experimenting and disseminating examples of
good practice).
▪ Green Paper on urban mobility, 2007: The 2007 Green Paper reflects on the main problems of
European cities. The report, published by the European Commission, is a collection of
reflections aimed at stimulating a public debate on the most critical issues in urban areas: smooth
traffic in cities, city cleanliness, smarter, more secure and affordable urban transport.
• 2014/94/UE Directive on Alternative Fules Infrastructure. Directive 2014/94/EU establishes
a set of measures for the creation of an alternative fuel infrastructure to minimize oil dependence
European Regional Development Fund
Report
Pag. 21/202
and mitigate the environmental impact of transport. At national level, the long-term strategic
objective is to provide support for the rational use of all alternative fuels while maintaining the
neutrality criterion and the search for optimal technical solutions and incentives such as
modalities and in time reduction of emissions in the industry. Alternative fuels are fuels or
sources of energy that may work in substitution (including partial, as in the case of hybrid
vehicles) of fossil fuel sources in the supply of energy for transport: electricity, hydrogen,
biofuels, synthetic fuels and paraffinic, natural gas (including bio methane) in compressed form
(GNC) and liquefied (LNG), liquefied petroleum gas (LPG). Nowadays different types of
national implementation processes of AFID are operating in the AS region:
Some countries, like Italy and Slovenia have only in progress an official AFID transposition,
o In Italy the process is under the Transport & Infrastructure Ministry supervision, but no
official documents are yet available. The first version of the National Plan for
Infrastructure for Recharging Electric Vehicle (PNIRE), now operating in Italy, has no
references to the AFID because it was written before the AFID official release. The
updated version 2015 of PNIRE has reference to the AFID but is still in progress.
Regional and local administrators are responsible for its implementation
o Market development strategy for the establishment of appropriate infrastructure related to
alternative fuels in the transport sector in the Republic of Slovenia was adopted in 2017,
and the Transport Development Strategy of the Republic of Slovenia is now operating.
This strategic document defines future measures on the area of road, railway, air and
maritime transport, including public transport and measures for obtaining sustainable
mobility. General objectives are: to reduce energy use, reduce the cost of users and
managers, reduce the burden on the environment. Specific objectives are: to provide
infrastructure for alternative fuel. Integrated transport strategy for the main Municipality
is under preparation, too.
Other countries, as Austria France and Germany, have a more mature transposition
process:
o In Austria the implementation is successfully proceeding. The transport policy of Austria
has since many years the objective to make mobility more environmentally sustainable.
Planning for multi-level implementation, which in Austria is led by the Transport
Ministry, This approach essentially relies on participatory governance. “Tools” for AFID
implementation (including an Austrian-wide online consultation as well as workshops)
are used to build stakes at different governance levels – often in order to overcome
existing political deadlocks The consultation of all relevant stakeholders, like other
responsible ministries, federal states (Länder) and municipalities as well as vehicle
industry, fuel and electricity suppliers is a condition for successful solutions based on the
consultation process. The results of all workshops will be considered in national strategy
plan for the implementation of the AFID. In addition to the elaboration of the national
strategy plan also the adoption of national legislation is a main task.
o In Germany the implementation is successfully operating. The Federal Ministry of
Transport, mobility and fuel strategy sector is responsible for transposing AFID at
National level. Responsible for transposing AFID at Regional level are the Lander
Ministry of Economic Affairs and Media, Energy and Transport.
o In France the recent national law (LTECV august 2015) is implementing AFID. It sets
ambitious targets to further the deployment of charging infrastructure for electric and
hybrid vehicles (target values by 2030: seven million E-CS –private/public-installed). It
European Regional Development Fund
Report
Pag. 22/202
also imposes to certain types of professionals (taxis, car rental companies, public
transport...) to acquire greenhouse gases low-emission vehicles (target values by 2030: 2
millions EV).
Other country, as Switzerland, does not need a transposition process. Anyway, this country
adopted a Federal Masterplan for the development of e-mobility. The cantons should adopt
regional masterplan. Municipalities are responsible to the local implementation. Due to the
fast evolution of the technical context, Municipalities are in some case more involved than
cantons.
▪ Constant development of new rules and reports:
o “Towards clean and smart mobility” EEA Signals 2016
o "European Strategy for Low-Emission Mobility" COM (2016) 501 with its SWD (2016)
244 final annex (where the European Commission highlights how reducing emissions in
the transport sector is one of the key points in the a more environmentally friendly and
energy-efficient economy. Again, the intention is to reduce carbon emissions in the
transport sector by 60% compared to 1990, which accounts for about a quarter of the
world's emissions in European space.)
1.7.1.2 Coherence of e-MOTICON strategy with the European Framework
• TENT7- The Trans-European Transport Network (TEN-T) is a European Commission policy
directed towards the implementation and development of a Europe-wide network of roads,
railway lines, inland waterways, maritime shipping routes, ports, airports and rail-road terminals.
It consists of two planning layers:
• The Comprehensive Network: Covering all European regions
• The Core Network: Most important connections within the Comprehensive Network linking
the most important nodes
Figure 2: TEN-T The Core Network Corridors
7 https://ec.europa.eu/transport/themes/infrastructure_en
European Regional Development Fund
Report
Pag. 23/202
The ultimate objective of TEN-T is to close gaps, remove bottlenecks and eliminate technical
barriers that exist between the transport networks of EU Member States, strengthening the social,
economic and territorial cohesion of the Union and contributing to the creation of a single
European transport area. The policy seeks to achieve this aim through the construction of new
physical infrastructures; the adoption of innovative digital technologies, alternative fuels and
universal standards; and the modernising and upgrading of existing infrastructures and platforms.
Following a 2013 review of TEN-T policy, nine Core Network Corridors were identified to
streamline and facilitate the coordinated development of the TEN-T Core Network. These are
complemented by two Horizontal Priorities, the ERTMS deployment and Motorways of the Sea;
both established to carry forward the strategic implementation of the objectives of the Core
Network, in-line with the funding period, 2014 to 2020. Oversight of the Corridors and the
implementation of the two Horizontal Priorities lies with European Coordinators; high-level
personalities with long standing experience in transport, financing and European politics,
nominated by the European Commission. First generation Work Plans for each Corridor and
Horizontal Priority were presented in 2014, outlining exact objectives for each Corridor and
Horizontal Priority, within the framework of the TEN-T Core Network. This is a continuous
process, which takes into consideration current developments. EU funding for projects on each
Corridor and Horizontal Priority is provided by the Connecting Europe Facility (CEF), with
relevant Member States obliged to align national infrastructure investment policy with European
priorities. Other sources of funding and financing include the European Structural and
Investment Funds and the European Fund for Strategic Investment.
• ALPINE CONVENTION - The Alpine Convention is an international territorial treaty for the
sustainable development of the Alps. The objective of the treaty is to protect the natural
environment of the Alps while promoting its development. This Framework Convention
involves the European Union and eight states (Austria, Germany, France, Italy, Liechtenstein,
Monaco, Slovenia, and Switzerland). Opened to signature in 1991 and consisting of a
Framework Convention, various implementation protocols and declarations, it entered into force
in 1995, contributing to reinforce the recognition of special qualities and specific characteristics
of the Alps, going beyond national boundaries and seeking international action.
This treaty dedicated to a specific territory is supported by a Permanent Secretariat, created in
2003, that has its main office in Innsbruck, Austria, and a branch office in Bolzano-Bozen, Italy.
The role of this Permanent Secretariat is to support all the other bodies instituted by the Alpine
Convention. The Permanent Committee can establish Working Groups. Under the Convention,
Member States should adopt specific measures in twelve thematic areas (Population and Culture,
Spatial Planning, Air pollution, Soil Conservation, Water Management, Conservation of Nature
and the Countryside, Mountain Farming, Mountain Forests, Tourism and Recreation, Transport,
Energy, and Waste Management). Of these areas, eight are now protocols annexed to the
Framework Convention. Among these protocol we can find the one on Transport.
Protocol on the Implementation of the 1991 Alpine Convention in the Field of Transport -
Transport Protocol8 - The main objectives of the protocol is, observing the precautionary
8 Official Journal of the European Union – L323/15 dell’8.12.2007 - http://www.alpconv.org/en/convention/protocols/Documents/transportprotocolEN.pdf
European Regional Development Fund
Report
Pag. 24/202
principle, the preventive principle and the polluter-pays principle, to pursue a sustainable
transport policy which will:
a) reduce the negative effects of and risks posed by intra- Alpine and transalpine transport
to a level which is not harmful to people, flora and fauna and their environments and
habitats, inter alia, by transferring an increasing amount of transport, especially freight
transport, to the railways, in particular by creating appropriate infrastructures and
incentives in line with market principles;
b) contribute to the sustainable development of the habitats and economic areas in which
people living in the Alpine region dwell and work by implementing a transport policy
which encompasses all modes of transport and is harmonized between the various
Contracting Parties;
c) help to reduce and, as far as possible, avoid any impact which might endanger the role
and natural resources of the Alpine region, the importance of which goes beyond the
boundaries of the Alpine areas, and threaten its natural and cultural heritage;
d) ensure the movement of intra-Alpine and transalpine transport at economically bearable
costs by increasing the efficiency of transport systems and promoting modes oftransport
which are more environmentally-friendly and more economic in terms of natural
resources;
e) ensure fair competition between modes of transport.
The general transport-policy strategy is devoted to ensure sustainability, to promote rational, safe
transport management in a harmonised, cross-border network that:
• ensures coordination between different carriers, modes and types of transport and
encourages intermodality;
• optimises the use of existing transport systems and infrastructures in the Alps, including
through the use of electronic data transmission, and charges external and infrastructure
costs to polluters in line with the damage caused;
• encourages, by means of structural and regional planning measures, the transfer of the
carriage of passengers and goods to more environmentally-friendly means of transport
and to intermodal transport systems;
• recognises and utilises the opportunities for reducing traffic volume.
Moreover the protocol undertakes to adopt the necessary measures so as to ensure as far as
possible:
• the protection of communication routes against natural hazards;
• in areas particularly damaged by transport, the protection of persons and of the
environment;
• the gradual reduction of emissions of harmful substances and noise by all modes of
transport, including through the use of the best technologies available;
• greater transport safety.
The Protocol identifies some Technical Measures:
• the creation and development of user-friendly, environmentally-adapted public transport
systems,
European Regional Development Fund
Report
Pag. 25/202
• the improvement & optimisation of railway infrastructure (by constructing and
developing the major transalpine railway routes),
• the adoption of measures to transfer the long-distance carriage of goods to rail,
• sustain intermodal transport,
• synergies between long-distance passenger transport, regional transport and local
transport
• encourage additional efforts to increase the use of shipping.
• refrain from constructing any new, large-capacity roads for transalpine transport (only if
selected condition are met) .
However, in view of the geography and the settlement pattern of the Alpine region, which cannot
always be efficiently served by public transport alone, the Convention recognise the need, in
remote areas, to create and maintain sufficient transport infrastructures for private transport to
function.
• EUSALP - EU Strategy for the Alpine Region
Figure 3: Alpine region
European Council endorsed an integrated framework, a 'Macroregional strategy', which may be
supported by the European Structural and Investment Funds among others, to address common
challenges faced by a defined geographical area relating to Member States and third countries located in
the same geographical area which thereby benefit from strengthened cooperation contributing to
achievement of economic, social and territorial cohesion.
The Alpine area is composed of territories with contrasted demographic, social and economic trends and
a great cultural and linguistic diversity. This diversity goes along with a great variety of governance
systems and traditions. Both the common specificities of the Alpine area and its variety and diversity
call for cooperation. The Alpine region represents a living and working space for the resident population
and an attractive tourist destination for millions of guests every year. The Alpine region is a unique
territory, which has an important potential for dynamism, but is facing major challenges, such as:
• economic globalisation that requires the territory to distinguish itself as competitive and
innovative by developing the knowledge and information society
• demographic trends, characterised particularly by the combined effects of ageing and new
migration models
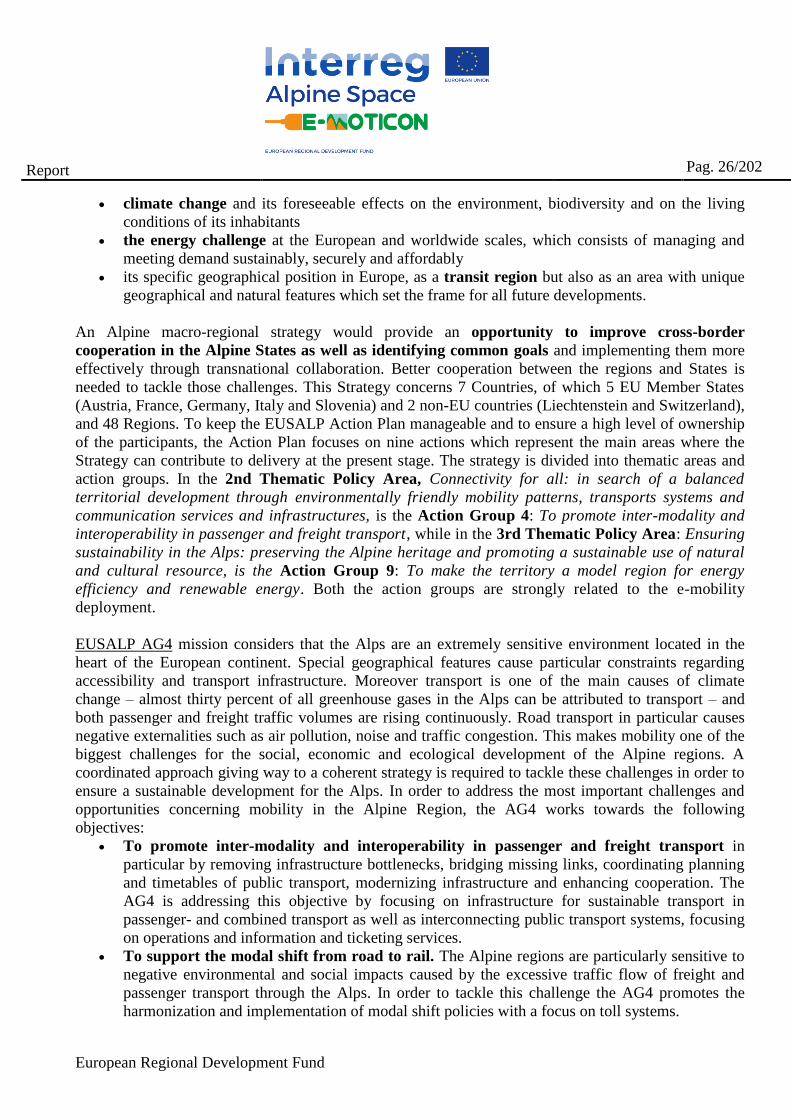
European Regional Development Fund
Report
Pag. 26/202
• climate change and its foreseeable effects on the environment, biodiversity and on the living
conditions of its inhabitants
• the energy challenge at the European and worldwide scales, which consists of managing and
meeting demand sustainably, securely and affordably
• its specific geographical position in Europe, as a transit region but also as an area with unique
geographical and natural features which set the frame for all future developments.
An Alpine macro-regional strategy would provide an opportunity to improve cross-border
cooperation in the Alpine States as well as identifying common goals and implementing them more
effectively through transnational collaboration. Better cooperation between the regions and States is
needed to tackle those challenges. This Strategy concerns 7 Countries, of which 5 EU Member States
(Austria, France, Germany, Italy and Slovenia) and 2 non-EU countries (Liechtenstein and Switzerland),
and 48 Regions. To keep the EUSALP Action Plan manageable and to ensure a high level of ownership
of the participants, the Action Plan focuses on nine actions which represent the main areas where the
Strategy can contribute to delivery at the present stage. The strategy is divided into thematic areas and
action groups. In the 2nd Thematic Policy Area, Connectivity for all: in search of a balanced
territorial development through environmentally friendly mobility patterns, transports systems and
communication services and infrastructures, is the Action Group 4: To promote inter-modality and
interoperability in passenger and freight transport, while in the 3rd Thematic Policy Area: Ensuring
sustainability in the Alps: preserving the Alpine heritage and promoting a sustainable use of natural
and cultural resource, is the Action Group 9: To make the territory a model region for energy
efficiency and renewable energy. Both the action groups are strongly related to the e-mobility
deployment.
EUSALP AG4 mission considers that the Alps are an extremely sensitive environment located in the
heart of the European continent. Special geographical features cause particular constraints regarding
accessibility and transport infrastructure. Moreover transport is one of the main causes of climate
change – almost thirty percent of all greenhouse gases in the Alps can be attributed to transport – and
both passenger and freight traffic volumes are rising continuously. Road transport in particular causes
negative externalities such as air pollution, noise and traffic congestion. This makes mobility one of the
biggest challenges for the social, economic and ecological development of the Alpine regions. A
coordinated approach giving way to a coherent strategy is required to tackle these challenges in order to
ensure a sustainable development for the Alps. In order to address the most important challenges and
opportunities concerning mobility in the Alpine Region, the AG4 works towards the following
objectives:
• To promote inter-modality and interoperability in passenger and freight transport in
particular by removing infrastructure bottlenecks, bridging missing links, coordinating planning
and timetables of public transport, modernizing infrastructure and enhancing cooperation. The
AG4 is addressing this objective by focusing on infrastructure for sustainable transport in
passenger- and combined transport as well as interconnecting public transport systems, focusing
on operations and information and ticketing services.
• To support the modal shift from road to rail. The Alpine regions are particularly sensitive to
negative environmental and social impacts caused by the excessive traffic flow of freight and
passenger transport through the Alps. In order to tackle this challenge the AG4 promotes the
harmonization and implementation of modal shift policies with a focus on toll systems.
European Regional Development Fund
Report
Pag. 27/202
• To develop cooperation and greater integration between the existing bodies and structures
in the field of transport. The close collaboration of the AG4 with different actors involved in
the transport and mobility sectors of the Alpine Regions guarantees an improved coordination
and ensures consistency between existing initiatives in order to avoid duplications and encourage
the alignment of funding. Strong links have already been established with the Alpine
Convention, the Suivi de Zurich Process, as well as the iMONITRAF! Network.
EUSALP AG9 focuses on the promotion of energy efficiency and the production and use of local
renewable energy in the Alpine Region, especially in the public and private sectors. The framework is
provided by, inter alia, the EU’s energy directives, the EU goals for 2020 and the Energy Union
Package. The action aims at supporting a significant reduction of energy consumption in the housing
and mobility sector, as well as in small and medium enterprises. The action promotes energy
management and monitoring systems at different levels. In order to address the most important
challenges and opportunities concerning energy in the Alpine Region, the AG9 works towards the
following objectives:
• Setting up an Alpine energy efficiency cluster. This cluster should serve as a forum for
cooperation and innovation, bring technical solutions for the specific energy needs of the
Alpine Region, and develop energy efficiency processes and products particularly adapted to
the Alpine Region, especially in the housing and mobility sectors.
• ‘Greening the Alpine infrastructure’: focusing on energy efficiency in the building sector
and promote harmonised, affordable and operational assessment tools to be used by public
authorities in order to boost sustainable and low-carbon buildings in the Alpine Region.
• Setting up an Alpine renewable energy cluster while taking into account ecological,
economical and land use issues and considering societal trade-offs.
• Support energy management systems in the Alpine Region by developing, sharing and
installing energy efficiency and decentralised monitoring systems at the local level and by
promoting regional energy monitoring.
• Support a better use of local resources and increase energy self-sufficiency while reducing
impacts on climate and the environment.
Coherence of EUSALP AG 4 and AG9 objectives and action with this RAP proposed actions is
monitored in the document, and the following chapter will show in more details the main issue of the
coherent scheme.
• iMonitraf! - A common transport strategy for the Alpine regions and action plan for
implementation
Some regions in the Alpine Space area are particularly sensitive to the negative impacts of freight
and passenger transport. They consider the most of this impact is due to very high shares of heavy
goods vehicles (HGV), specific topographical features, limited spatial resources and highly
vulnerable ecosystems. To tackle the common challenges, the regions Rhône-Alpes, the autonomous
Province of Bolzano, the autonomous Region of Aosta Valley, the Piedmont Region, the Friuli-
Venezia-Guilia Region, the Canton of Ticino, the Conference of Governments of Central
Switzerland, the Land of Tyrol as well as the European Academy of Bolzano have joined forces in
2005 to develop common solutions. In the frame of two projects under the Alpine Space
Programme, the regions have developed a common monitoring system and have analysed Best
European Regional Development Fund
Report
Pag. 28/202
Practice measures as well as impacts of common steering instruments. Results from these activities
have been discussed with regional policy makers and finally brought together in a common strategy.
As major milestone of the iMONITRAF! project (2009-2012), representatives from seven regions
have signed a common resolution and strategy in May 2012. The strategy sets the framework for a
sustainable transport system in the Alpine Space – reducing negative traffic impacts and preventing
distributional impacts. Major elements are:
▪ A common understanding of targets builds the basis. While short-term targets are focused on
environmental challenges, targets for the long-term aim at maximizing use of rail capacities.
▪ Based on their exchange on Best Practices and innovative steering instruments, the regions agree
to work towards the implementation of common measures. This includes harmonization of
existing regional measures and a modal shift policy.
▪ The regions recognize the need for a further coordinated road traffic management system. They
agree to the need to implement a road freight steering instrument at Alpine Arc level in the mid-
term, focusing on a cap-and-trade approach.
▪ An Action Plan with a proposal to institutionalise the network.
For the period 2013-2016, political representatives of the iMONITRAF! regions have decided to
establish a Coordination Point which will continue the different activities of iMONITRAF!. The
Coordination Point shall support the implementation of activities and milestones towards an
ambitious and coordinated transport policy of the Alpine regions as defined in the iMONITRAF!
resolution and strategy. As basis for further discussions, the common monitoring activities will be
continued, with an annual update of the WebGIS system. Further, the best practice exchange on
regional measures will be continued to support the implementation of a harmonized set of measures
in the long-term. Political networking as well as the identification of political “windows of
opportunity” as well as related actions for iMONITRAF! are further task of the Coordination Point.
Major results of these activities will be presented in annual report as well as the iMONITRAF!
Transport Forums. During the iMONITRAF! meeting on 2 November 2016 in Lucerne, political
representatives of the most affected transit regions have again demonstrated their solidarity and their
willingness to implement a harmonized approach. They have agreed to continue the cooperation for
two more years (2016-2018) under the Lead of Tyrol, with a clear focus on finding broader support
for the Toll Plus proposal – especially at European and national level which will be necessary for
implementation. At European level, the revision of the relevant framework – the Eurovignette
Directive – has been launched in summer 2016 and the iMONITRAF! network will actively lobby
towards the consideration of the Toll Plus proposal in this revision process.
1.7.2 Coherences with other organisations
e-MOTICON project assumes as a general principle that cross-sectorial cooperation is very important in
order to define a governance model in which high competence can support the public administration in
realizing a high quality solution to the territories. For this purpose the project develops RAPS and
Guidelines in close cooperation with the main actors, Public Administrations and stakeholders.
1.8 Coherence with supra regional policies
The following table compare supra regional pillars for EUSALP, Alpine Convention and iMONTRAF!
ones, with the scope to help to understand the global coherence
European Regional Development Fund
Report
Pag. 29/202
Table 2: Supra regional pillars
EUSALP AG4 EUSALP AG9 Alpine
Convention
Transport
Protocol
e-MOTICON
PILLARS
iMontraf!
EUSALP AG9
vision
To promote inter-
modality and
interoperability in
passenger and
freight transport
by removing
infrastructure
bottlenecks,
bridging missing
links,
coordinating
planning and
timetables of
public transport
(including multi-
modal information
and planning
services),
modernising
infrastructure, and
enhancing
cooperation.
EUSALP AG9
vision
The Alpine
Region will make
a long-term
contribution to
meeting Europe’s
energy needs and
at the same time
people in that
Region need to
have sufficient
energy resources
at their disposal to
improve local
living conditions
and economic
productivity.
AC vision is
devoted to ensure
sustainability, to
promote rational,
safe transport
management in a
harmonised, cross-
border network
that ensures
coordination
between different
carriers, modes
and types of
transport and
encourages
intermodality.
e-MOTICON
vision
electric mobility as
a crucial solution
for mobility in
Alpine Space
• public
Authorities are a
key actor to lead
the
infrastructure
development
• The Alpine
Space is made
of different
realities, from
Metropolitan
Areas to
isolated
rural/mountain
areas. The
optimal
solutions for
transport are
multiple:
• Local Public
Transport in
urban, peri-
urban and
congested areas;
• Rails for freight
and passenger
transport
especially for
long-range and
cross-country
trips
• Low emissions
iMontraf! vision
“Together
towards an Alpine
transport
strategy” -
positioning the
Alpine Space as
forerunner /model
region on
sustainable
transport. With
this objective, the
Alps can be seen
as a laboratory for
a sustainable
development in
Europe, inspiring
also other
European
sensitive areas.
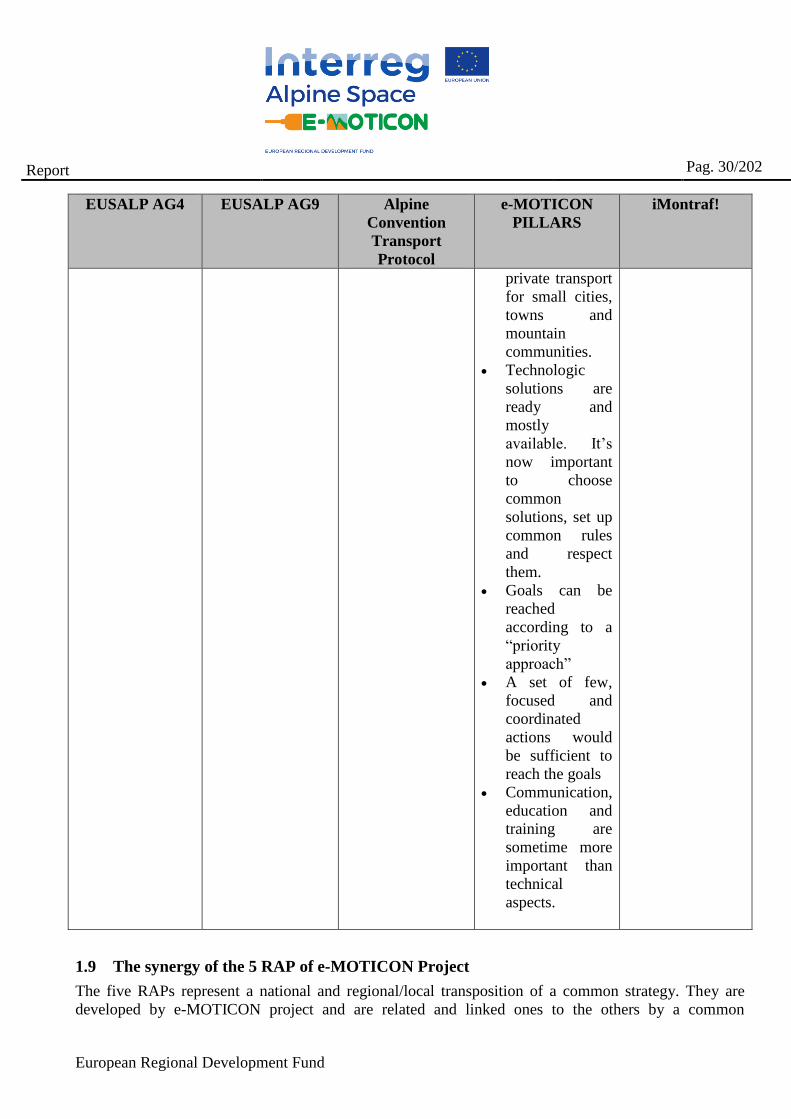
European Regional Development Fund
Report
Pag. 30/202
EUSALP AG4 EUSALP AG9 Alpine
Convention
Transport
Protocol
e-MOTICON
PILLARS
iMontraf!
private transport
for small cities,
towns and
mountain
communities.
• Technologic
solutions are
ready and
mostly
available. It’s
now important
to choose
common
solutions, set up
common rules
and respect
them.
• Goals can be
reached
according to a
“priority
approach”
• A set of few,
focused and
coordinated
actions would
be sufficient to
reach the goals
• Communication,
education and
training are
sometime more
important than
technical
aspects.
1.9 The synergy of the 5 RAP of e-MOTICON Project
The five RAPs represent a national and regional/local transposition of a common strategy. They are
developed by e-MOTICON project and are related and linked ones to the others by a common
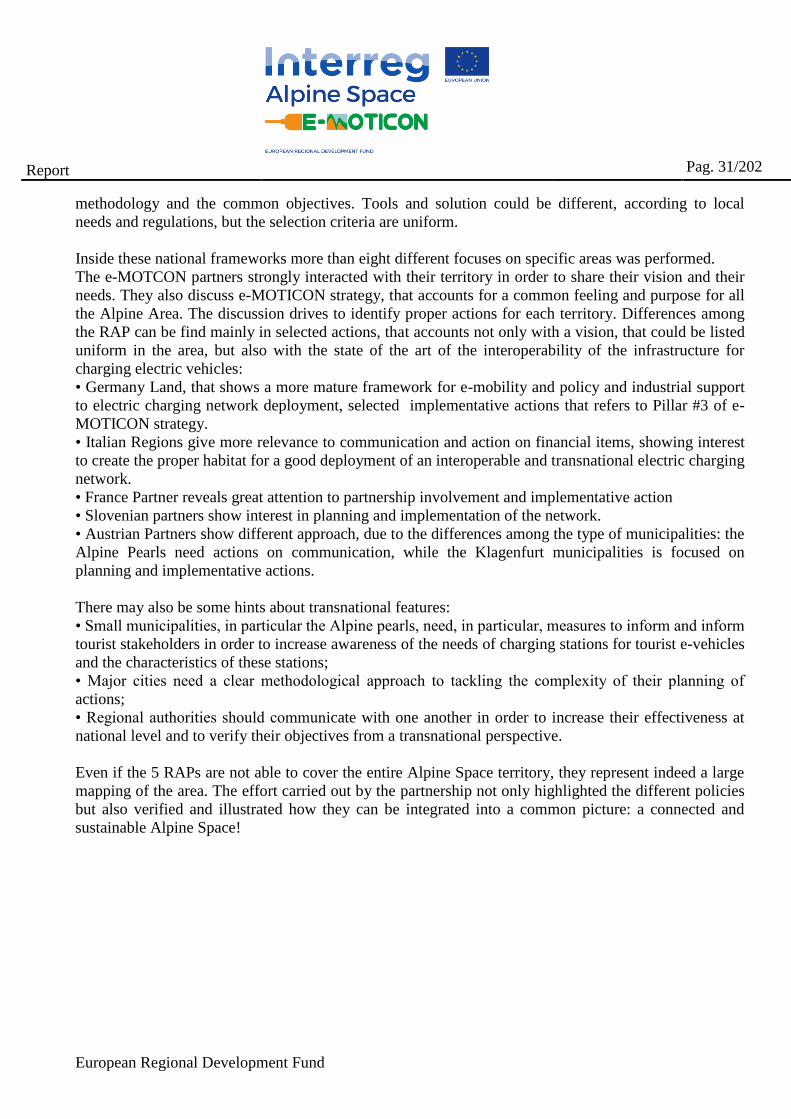
European Regional Development Fund
Report
Pag. 31/202
methodology and the common objectives. Tools and solution could be different, according to local
needs and regulations, but the selection criteria are uniform.
Inside these national frameworks more than eight different focuses on specific areas was performed.
The e-MOTCON partners strongly interacted with their territory in order to share their vision and their
needs. They also discuss e-MOTICON strategy, that accounts for a common feeling and purpose for all
the Alpine Area. The discussion drives to identify proper actions for each territory. Differences among
the RAP can be find mainly in selected actions, that accounts not only with a vision, that could be listed
uniform in the area, but also with the state of the art of the interoperability of the infrastructure for
charging electric vehicles:
• Germany Land, that shows a more mature framework for e-mobility and policy and industrial support
to electric charging network deployment, selected implementative actions that refers to Pillar #3 of e-
MOTICON strategy.
• Italian Regions give more relevance to communication and action on financial items, showing interest
to create the proper habitat for a good deployment of an interoperable and transnational electric charging
network.
• France Partner reveals great attention to partnership involvement and implementative action
• Slovenian partners show interest in planning and implementation of the network.
• Austrian Partners show different approach, due to the differences among the type of municipalities: the
Alpine Pearls need actions on communication, while the Klagenfurt municipalities is focused on
planning and implementative actions.
There may also be some hints about transnational features:
• Small municipalities, in particular the Alpine pearls, need, in particular, measures to inform and inform
tourist stakeholders in order to increase awareness of the needs of charging stations for tourist e-vehicles
and the characteristics of these stations;
• Major cities need a clear methodological approach to tackling the complexity of their planning of
actions;
• Regional authorities should communicate with one another in order to increase their effectiveness at
national level and to verify their objectives from a transnational perspective.
Even if the 5 RAPs are not able to cover the entire Alpine Space territory, they represent indeed a large
mapping of the area. The effort carried out by the partnership not only highlighted the different policies
but also verified and illustrated how they can be integrated into a common picture: a connected and
sustainable Alpine Space!
European Regional Development Fund
Report
Pag. 32/202
2 THE NATIONAL CONTEXT
The regional area action plan is in coherence with national policies promoting the implementation and
diffusion of e-mobility infrastructure. In this chapter the national state of play is going to be presented to
get a broader view which is going to be narrowed down to the regional actions and measures to be taken
in the future.
2.1 National state-of-art
The national ecosystem for electric mobility is well developed in Slovenia, at that point that there are
more E-CSs that are installed than EVs actually registered. The regional electricity suppliers are well
organised and some of them are E-CS operators as well. There are up to seven larger E-CS operators in
the country, each of them playing a major role for the deployment of the current charging network.
European Alternative Fuels Infrastructure Directive 2014/94/EU (Directive) is transposed into Slovenian
legislation by National Alternative Fuels Strategy (Strategy) that was adopted in October 2017. The
Directive was adopted in July 2017. The use of alternative fuels is important in order to achieve the
environmental targets in the area of greenhouse gas and pollutant emissions. Slovenia has stringent
targets, since despite the fact that traffic density is increasing rapidly, it has to reduce greenhouse gas
emissions by 9% in 2030 relative to 2020 levels. This therefore means an increase in emissions of 18%
relative to 2005, however, one has to take into account the fact that traffic on some sections has doubled
since 2005. Freight transport is projected to grow by between 60% and 80%, and private transport by
30% by 2030.
Number of E-CS (2016): 228 (According to the Strategy)
E-CS ≤ 3,7 kW = 97
E-CS ≤ 7,5 – 22 kW = 92
E-CS ≥ 43 kW = 39
No. of sockets (2016): 553 (Source: e-MOTICON T1 research, May 2017).
Normal power motorbike/scooter 3 kW (Schuko) "Type 3A" <22kW: 198 sockets
Normal power car socket "Type2" <22kW: 252 sockets
High Power Multistandard >22kW: 19 sockets
High Power car socket "CHAdeMO >22kW: 36 sockets
High Power car socket "CCs combo2" >22kW: 29 sockets
High power Tesla: 18 sockets.
Through two approved projects, URBAN-e and NEXT-e, (Petrol, one of the Slovenian biggest private
companies is involved in both) that are two bigger projects among several other small-scale initiatives,
there will be 77 new E-CS (10 of them ultra-chargers) installed till 2020.
Interoperability level of E-CSs reaches 57,77% on national level. Region achieving the highest share is
Koroška region with 80%, followed by Osrednjeslovenska and Primorsko-notranjska region with
76,92%. The lowest level of interoperability is present in Savinjska region (31,48%). The area with most
developed E-CS network is the capital of Slovenia, Ljubljana with its immediate surroundings. The
European Regional Development Fund
Report
Pag. 33/202
TEN-T network has 27 fast charging stations and 5 ultra-fast. There are 27 Tesla charger points (18
Superchargers and 24 Destination chargers) set up diagonally from Obalno-kraška region to Pomurska
region and from Gorenjska region to Jugovzhodna Slovenija region (Source: e-MOTICON T1 research,
May 2017).
In 2016 there were 228 E-CS in Slovenia with 553 sockets, 449 EVs and 111 plug-in hybrids.
Currently, in the beginning of 2018, the ratio between the number of electric charging stations (sockets)
and electric vehicles (EV) registered is 1:2. The European reference is 1:10. Share of publicly accessible
E-CSs is 60%, normal power (Schuko) E-CSs form the majority of private E-CSs. The market share of
the BEVs’ sales represented 0.28% of the total purchases in 2016; for the year 2017, the market share is
of 0.47%. 2017 was up to now the best year for the sales of BEVs in Slovenia; the market is growing
slowly but continuously; for instance, it grew up by 671.43% between 2014 and 2017. Till 2013 there
were less than 20 BEVs purchased annually but in 2017 the number of new BEV registrations in
Slovenia amounted up to 336 vehicles. (Source: EAFO, 2018).
Numbers of E-CS and EVs are subjected to constant change and the on-line databases cannot be updated
within real-time. In 2017 a detailed analysis of the charging infrastructure in Slovenia was made by PRC
and BSC Kranj, where several different on-line platforms and portals (Plugshare, Polni.si, Gremo na
elektriko, Chargemap, Tesla, etc.) were used. Due to fast growth of e-mobility and the technology in this
field, the stated numbers cannot present the up-to-date state of play in the country but can on the other
hand portray current and future trends.
The public stakeholders involved in the definition of the electric mobility policies in Slovenia are the
Ministry of Infrastructure with its Energy Directorate, the Ministry of the Environment and spatial
planning, the national Energy Agency of Slovenia, the national Energy Chamber linked to the Chamber
of Commerce and industry.
Regarding the energy supply the data for 2017 is not yet available, but for 2016 15.233 GWh was
delivered to the transmission and distribution system, which is 1.279 GWh more than the previous year,
out of which the delivery form the generating plants using renewable sources of energy was 5.221 GWh
(626 GWh more than in 2015), fossil fuel plans 4.589 GWh (592 GWh more than 2015), nuclear power
plant Krško 5.423 GWh (61 GWh more than 2015). Slovenian power plants produced 13.030 GWh of
electricity, total consumption in Slovenia was 14.173 GWh and was for 1,9% higher in comparison to
2015 (Source: Report on the Energy sector in Slovenia for 2016).
The structure of production is changing. The share of hydroelectric power plants is increasing. On the
other hand, the share of thermal power plants decreased. The share of small producers is slowly
growing. Domestic production sources covered 88% of consumption in 2016, the country had to import
12% of its electricity (source: Report on the Energy sector in Slovenia for 2016). With the opening of
the electricity market in 2001, electrical energy became a marketable commodity for industrial
consumers in Slovenia. Additionally, in 2007, electricity markets have been opened also to households.
Tariff customers are provided with electricity, in accordance with the tariff system, by distribution
companies in the framework of the public service of the supply of electricity to tariff customers.
European Regional Development Fund
Report
Pag. 34/202
Electricity users are able to negotiate the price of electricity with several distributors. Different rates of
the electricity network fee are applied, depending on the voltage level, season (high-middle-low) and
overall consumption of power.
2.2 National main policies
The Slovenian Government introduced specific objectives in order to support the development of
electric mobility in the country, linked with the will of the Government to achieve a secure, sustainable
and competitive energy supply, the increase of the use of renewable sources of energy:
- The development of an E-CS infrastructure on the national highways that is foreseen by the
Energy Act. 27 E-CS are already installed on the highways which already grants a certain
density of the E-CS network in regards to the size of the country;
- From 2055 onwards, private and public transport should be fully electric driven, as stated in the
Slovenian Energetic concept.
The most important national regulations concerning the development of electric mobility are the
following:
Energy Act (2014): it transposes a number of EU directives concerning electricity and gas markets,
energy efficiency and renewable energy sources. It lays down:
- The principles of energy policy, energy market operation rules, manners and forms of providing
public services in the energy sector.
- The principles and measures for achieving a secure energy supply, for increasing energy
efficiency and energy saving and
- principles for increasing the use of energy generated from renewable energy sources.
Furthermore it lays down the:
- Conditions for the operation of energy installations,
- Regulates the responsibilities, organisation and tasks of the Energy Agency and the competences
of other authorities.
The purpose of the act is to ensure a competitive, secure, reliable and accessible supply of energy and
energy services, taking into account the principles of sustainable development.
Energy policy is the implementation of measures in accordance with the principles of this Act, the aim
of which is to achieve a reliable, sustainable and competitive national supply with energy by means of
promoting the following:
- Security and quality of energy supply.
European Regional Development Fund
Report
Pag. 35/202
- Balanced long-term development of energy economy considering trends in energy consumption.
- Planned diversification of various primary energy sources, taking into account their economics.
- Competitive energy supply.
- Use of renewable and low-carbon energy sources.
- Ensuring the priority of efficient energy use over energy supply.
- Environmentally acceptable generation, production, transmission and consumption of all types of
energy.
- Competition in the energy market.
- Flexibility of energy users.
- Consumer protection.
The measures to achieve those objectives are/will be determined in the following long-term planning
documents: the Energy Concept of Slovenia, the National Energy Development Plan and operational
and action plans for individual fields of energy supply and management.
Energy Act directly addresses electro mobility in two articles:
- Article 78: (9) The distribution operator shall be responsible for the development of the basic public
infrastructure of fast EV chargers on the motorway cross;
- Article 382: (2) The operators or owners of public parking lots accessible to the public and the parking
lots of public sector buildings shall report to the ministry responsible for the energy, about the number
of E-CSs and the amount of electricity consumed at charging points.
Decree on renewable energy sources (RES) in transport (2016): this decree lays down the obligation
to reduce greenhouse gas emissions in the life cycle of fuels used for transport; sustainability criteria for
biofuels; verification of compliance with the sustainability criteria for biofuels; methodology for the
calculation of the energy share of renewable energy sources in transport. The Decree was published in
the Official Gazette on 14.10.2016. It came into force on 1.7.2017. This is the deadline when some other
measures should provide the conditions for achieving the set goals. This commitment was also given by
the Government of the Republic of Slovenia in the RES Action Plan, which stipulates that in order to
achieve the goals of renewable energy sources, an appropriate support environment will be provided for
the introduction of biofuels and other renewable energy sources in transport, as well as the promotion of
the introduction of electric vehicles.
European Regional Development Fund
Report
Pag. 36/202
The Decree determines the modalities and measures for completing and verifying the fulfilment of the
obligations of fuel distributors with regard to the placing of biofuels and other renewable energy sources
on the market.
Overall RES energy share in transport as foreseen by the Decree: at least 6,20% in 2017, at least 7,00%
in 2018, at least 8,40% in 2019 and at least 10,00% in 2020. In 2014, the share of RES in transport in
Slovenia amounted to 2.6%, which is a decrease compared to 2013 (3.5%) and also to 2012 (2.9%).
Depending on the absolute value in 2014 and the trend (decrease in the share), it can be estimated that
the achievement of the set intermediate targets and the final target share of 10% of RES in transport in
2020 will be a rather challenging task. Therefore, the legislator included in the new Energy Act also the
obligation to report on the consumption of electric energy for EVs. In 2020, EVs are expected to not
account for more than 10% of all vehicles; nevertheless, charging the EV can have a significant impact
on the fulfilment of obligations under the Directive and the Decree. In order to calculate the energy
share of electric energy consumption from RES in road EVs, the regulation states that the energy value
of the delivered electric energy from RES is multiplied by a factor of 5 (Source: Energy Agency,
February 2017).
The Slovenian Government has issued and adopted the following strategies which aim at fostering the
development of electric mobility in the country thanks to the installation of new publicly accessible E-
CS.
The Transport Development Strategy (2015): this Strategy promotes the use of alternative energy
sources and the introduction of hybrid and electric vehicles, as well as the construction of a network of
charging stations (the related charging infrastructure). According to the environmental requirements at
the national level, the encouragement for the purchase of EVs will have to be initiated and a network of
charging stations will have to be build, so that by 2030 there will be at least 10% transport work done
without greenhouse gas emissions on Slovenian roads. In the Strategy it is estimated that by 2030, in the
structure of passenger cars, around 15% of passenger cars will be electrically or hybrid (plug-in hybrids)
driven. The strategy also indicates that traffic growth would be between 60% and 80% in freight
transport by 2030, and 30% in the segment of passenger transport. In the document it is stated that it is
necessary to provide financial incentives that will encourage individuals to purchase vehicles with
environmentally friendly motor fuels. The Strategy was adopted by the Government of the Republic of
Slovenia on 29th July 2015, together with the Environmental Report for the Comprehensive
Environmental Impact Assessment. The measures stipulated by the Strategy address the entire Slovenian
transport system and clearly and unambiguously require an accelerated drawing up of individual
projects. The Strategy also stipulates the method of project preparation which must be based on actual
needs, attain the objectives of economy and sustainability and eliminate problems defined in measures.
The vision of the transport policy is defined as the provision for the sustainable mobility and supply to
the economy with the following general objectives:
- To improve the mobility and accessibility.
European Regional Development Fund
Report
Pag. 37/202
- To improve the supply of the economy.
- To improve the traffic safety and security.
- To reduce the consumption of energy.
- To reduce the costs of the users and operators.
- To reduce the environmental burden.
The Resolution on transport policy: the Resolution clearly states that the Government is committed to
promote the use of more sustainable vehicles and achieves a better coordination to ensure this. The
implementation of electric mobility systems within the infrastructure or supporting electric mobility is
not explicitly stated; electric mobility should be integrated into the national policies more explicitly and
in more details.
The Spatial Development Strategy (2004): The key framework for spatial development of Slovenia is
formed by a two-stage polycentric urban system, which is defined by the Spatial Development Strategy
of Slovenia, published in the Official Gazette of the Republic of Slovenia, no. 76/2004. The system
consists of centres of national and regional importance, as well as centres of inter-municipal importance
that are centres of functional and / gravitational areas and provide supplies, services and jobs. The
centres are interconnected with the transport infrastructure of the appropriate level. The report on spatial
development (2015) notes the strengthening and enhancement of the functional areas of larger centres.
The centres of national significance include Ljubljana, Kranj, Maribor, Celje, Koper, Novo mesto, Nova
Gorica, as well as strengthening of the lower level centres, especially in the vicinity of Ljubljana (eg.
Domžale and Kamnik) and settlements in the axis of the main traffic axes. The centres focus on day-to-
day migrations, the volume of which is still increasing with personal motor traffic. The document
doesn’t mention implementation of EVs into the transportation systems but it addresses all the other
means and systems: public traffic, air, motorway (land), sea; reduction of use of personal transport
means, enhancement of public transport, bicycling and walking. Under the point 5 “Integrated and
Harmonized Development of Transport and Settlement Networks and the Construction of Public
Infrastructure Facilities”, page 27: “When constructing new infrastructure and modernizing the existing
one, support shall be given to the construction of those energy generation and distribution facilities
which enable a high-quality and reliable energy supply for Slovenia. When determining the location of
new energy generation or distribution facilities, their optimal inclusion in the Slovenian energy network
shall be ensured and excessive environmental impacts prevented while respecting the principles of
sustainable spatial development.”
National Alternative Fuels Strategy (2017): According to the prescriptions contained in the Directive
2014/94/EU, the Slovenian Government has announced its quantitative objectives in terms of E-CS and
EVs in its National Alternative Fuels Strategy. Optimistic scenario sketched by the Slovenian
Government:
- By 2020, the Government plans the installation of 1.200 E-CS throughout the country.
- By the same year, 5.311 registered EVs are previewed by the Government.
European Regional Development Fund
Report
Pag. 38/202
More details about the Strategy in the following chapter (National main actions).
2.3 National main actions
If Slovenia is to achieve its alternative fuels targets by 2030, in addition to measures for improving
public transport, it has to ensure that at least 17% of the cars travelling on its roads are electric or plug-
in hybrids (200,000 vehicles), 12% of light commercial vehicles are electric (11,000 vehicles), a third of
all buses run on compressed natural gas (1,150 buses) and almost 12% of heavy goods vehicles (just
over 4,300 vehicles) run on liquefied natural gas. As the number of vehicles running on alternative fuels
will increase, the number of charging and filling stations will have to be increased also, on motorways
and elsewhere. Slovenia is one of the first countries in Europe to have installed high-powered e-chargers
on its motorway network. This network will be significantly expanded over the next five years, enabling
Slovenia to provide coverage of the Trans-European Transport Network (TEN-T) with chargers. With
the projected growth in traffic, Slovenia will require 1,200 standard-power chargers for domestic
transport by 2020, rising to 7,000 by 2025 and 22,300 by 2030.
Slovenia’s main actions and measures are listed and described in the National Alternative Fuels
Strategy. According to the Strategy, after 2025 Slovenia is going to limit the first registration of
passenger cars and light-commercial vehicles of categories M1 and MG1 and N1, which, according to
the manufacturer's declaration, have CO2 emissions above 100 g/km. Five years latter (after 2030) this
limit will drop to 50 g/km. The Strategy supports an increase in the number of E-Vs, hybrid vehicles and
vehicles using fossil fuels that have a lower adverse impact on the environment than the vehicles we use
today.
The Strategy proposes sets of measures for each alternative fuel, on the basis of which a detailed Action
plan for 2018–2020 is being drawn up (at the moment Action plan is in the proposal phase). Priority is
given to measures that establish a charging infrastructure for electric vehicles and for vehicles using
compressed and liquefied natural gas; this will enable the government to promote the increased
popularity of vehicles that run on alternative fuels. Measures are envisaged for all areas, from financial
incentives, co-financing of the construction of alternative fuels infrastructure and amendments to
legislation, to the promotion of innovative solutions, the acceleration of economic development, public
information and the removal of administrative barriers. Measures relevant for e-mobility are described
below. Action plan will be updated every two years.
The action plan sets out in detail the resources for the implementation of the individual measures,
deadlines and development stakeholders. Financial incentives for the purchase of electric and plug-in
hybrids, exemption from the payment of various fees for electric vehicles, free parking, etc. will
certainly remain part of these measures.
European Regional Development Fund
Report
Pag. 39/202
Slovenia promotes the purchase of alternative-fuel vehicles through subsidies for electric vehicles,
which are also exempt from payment of annual fees for use of vehicles on roads. There are also
favourable loans available for purchasing EVs, E-motorcycles and electric or hybrid-drive bikes whose
CO2 emissions are less than 110 g/km. Vehicles with CO2 emissions less than 110 g/km are charged a
lower rate (0.5%) on their motor vehicle tax. Some municipalities and providers offer free parking and
charging of EVs.
In order to ensure that traffic causes the least possible amount of environmental pollution, Slovenia has
to promote a sustainable transport policy: pedestrian and bicycle traffic in the settlements and increasing
the competitiveness of public transport. But this will not be enough, since due to the dispersed nature of
the settlements in many parts of Slovenia it is difficult to replace car use with public transport. Slovenia
will therefore have to be sufficiently ambitious in its introduction of alternative transport fuels to ensure
that the mobility by private vehicles pollutes the environment as little as possible. This is also one of the
objectives of the Strategy. Another key to a faster transition to green mobility in the area of private
vehicles is the car industry’s contribution through improvements in the area of electro mobility, the use
of hydrogen and fuel cells and innovations and improvements of classical internal combustion engines
(ICE). Technological advancements will allow faster development and will allow Slovenia to reach the
targets more quickly.
MEASURES
Measures to fulfil commitments according to the optimal scenario are divided into different areas that
can together ensure that the objectives are achieved. The measures are interdependent and only as a
whole guarantee that Slovenia will be able to fulfil various commitments in the field of transport.
Measures are described below.
1. Promoting the development of technologies and the economy
Harmonization of the key features of EVs with ICE vehicles (range, price, use of batteries) is expected
by 2025. This is regarding to alternative fuels targets relatively late. Measures are foreseen in the field
of innovation, research and promotion of the economy.
Connection: #2—SET SUPRA-REGIONAL COMMON MINIMUM RULES ON
INFRASTRUCTURE
2. Charging infrastructure
The charging infrastructure for high-capacity chargers will expand in those areas of the TEN-T network
where coverage is not optimal and according to the number of EVs. The installation of public charging
infrastructure in municipal centres and major towns in Slovenia and the charging infrastructure for
multiple dwelling buildings and in private use will be encouraged. Slovenia will ensure that the number
of charging points will ensure an optimal ratio between the number of EVs and the number of charging
points, that is, seven vehicles per public charging station. It will be ensured that simplified payments for
European Regional Development Fund
Report
Pag. 40/202
EV charging will be introduced. Ad hoc charging will be enabled for users who do not have contracts
with suppliers under favourable conditions that ensure non-discriminatory treatment. Charging
infrastructure will have to meet the requirements of the Directive 94/2014 EU. In order to achieve
desired interoperability levels, common E-CSs will be equipped with at least Type 2 sockets or
connectors for vehicles, as described in EN 62196-2 standard. High-capacity charging stations for AC
electric vehicles will be equipped with at least two Type 2 connections as described in EN 62196-2.
High-capacity charging stations for DC electric vehicles will be equipped with at least Combo 2
connectors as described in EN 62196-3.
Connection: #2—SET SUPRA-REGIONAL COMMON MINIMUM RULES ON
INFRASTRUCTURE
Connection: #3— IMPROVE THE INFRASTRUCTURE
3. Financial incentives for vehicles
Slovenia has already implemented financial incentives for the purchase of EVs that cover 50% of the
difference in the price of EVs with the price of the same or comparable ICE vehicle. Subsidies are paid
by EKO Fund on the basis of public calls. In 2017, the subsidy for the purchase of an EV amounted to
EUR 7,500 and for plug-in hybrid to EUR 4.500. Subsidies for the purchase of EVs will be maintained
until large-scale production and harmonization of EVs with comparable characteristics of ICE vehicles
(as regards the range, use and vehicle price) occurs. It is envisaged to simplify the procedures for
granting subsidies and arrange for the subsidization of test vehicles. Subsidies will be gradually reduced
as the EV prices will fall. EVs are exempted from payment of the annual tax on the use of roads (Annual
Fee on the Use of Motor Vehicles Act, Official Gazette RS, No. 57/08). The exemption is foreseen
during the period of EV promotion. Once the number of registered EVs has reached 10% of the total
number of registered vehicles by category, the annual tax will be introduced and will be comparable to
the annual tax of vehicles with the lowest emissions of GHG and pollutants. The annual tax on the use
of roads will be adapted to the environmental parameters of the vehicle and will be proportionate to the
emissions of GHG and pollutants.
Connection: #1—DEFINE THE BEST POSSIBLE ROLES OF PAS
Connection: #5—EMPOWER COMMUNICATION AMONG PUBLIC AUTHORITIES and
OTHER STAKEHOLDERS
4. Amendment of legislation and elimination of administrative barriers
Changing legislation and eliminating administrative barriers will provide a regulatory environment that
will encourage the use of EVs. Measures are foreseen for:
- normative regulation in the field of transport, which encourages positive discrimination for EVs in
parking, the use of certain traffic surfaces, special marks or license plates,
European Regional Development Fund
Report
Pag. 41/202
- integration into advanced systems and advanced communities,
- online / user-friendly applications for subsidizing the purchase of EVs, where the vendors will
arrange for the beneficiary all documentation,
- enabling the EV test drive to be sold as a new one for which the beneficiary could claim a subsidy,
- promoting dynamic tariffs,
- parking arrangements at places reserved for EVs,
- enabling the installation of charging infrastructure for multiple dwellings buildings.
Connection: #1—DEFINE THE BEST POSSIBLE ROLES OF PAS
Connection: #3— IMPROVE THE INFRASTRUCTURE
5. Provision of public transport
Electrically driven and electrically powered electric buses can significantly contribute to reducing
environmental stresses in urban centres, in natural and landscape parks and in protected areas. Incentives
will be provided to replace EURO IV public transport vehicles with alternative fuel vehicles, especially
in places with poor air quality. The environmental parameters of vehicles for the implementation of the
compulsory service of public passenger transport will be part of the tender conditions for granting
concessions. By 2030, vehicles used for public transport of passengers should meet the most up-to-date
environmental requirements.
Connection: #1—DEFINE THE BEST POSSIBLE ROLES OF PAS
Connection: #6—GUARANTEE SYNERGY AMONG PRIVATE AND PUBLIC TRANSPORT
6. Promotional activities to promote electro mobility
Personal experience and good knowledge of technological and user information are an important factor
in deciding on mobility. In city centres, cars that have the highest GHG footprint will be limited. Car-
sharing and co-ownership of vehicles will be encouraged, which can significantly reduce the number of
vehicles in the city centres of major cities. For the transition to low-carbon road vehicles, a
communication strategy will be developed with information on the traffic impact on climate change and
the environment, the characteristics of vehicles on alternative fuels and their properties and the
possibilities of use. Modern online information on charging infrastructure for alternative fuels, their use
and accessibility and on all forms of sustainable mobility will be prepared. Promotional activities and
the promotion of the use of electric vehicles will be carried out in cooperation with non-governmental
organizations.
A program for the supplementary training of professional drivers (program code 95) will be developed
in order to present the advantages and possibilities of using alternative fuels in the transport of goods. In
cooperation with the Craft Chamber and the Chamber of Commerce and Industry of Slovenia,
information on the use of alternative fuels together with the installation of the charging infrastructure
European Regional Development Fund
Report
Pag. 42/202
will be prepared. Advantages and disadvantages of the use of alternative fuels in business operations
will be presented.
Connection: #4—ADOPT AN INTEGRATED, SUPRA-REGIONAL MAPPING TOOL
Connection: #5—EMPOWER COMMUNICATION AMONG PUBLIC AUTHORITIES and
OTHER STAKEHOLDERS
Connection: #6—GUARANTEE SYNERGY AMONG PRIVATE AND PUBLIC TRANSPORT
7. Recommendations to local communities
The Strategy sets out the objectives and paths for achieving the goals at the national level. For the
breakthrough of electrical mobility, much has to be done at the local level, at the level of municipalities.
Therefore, the Strategy recommends municipalities a list of measures that would be recommended at
local level. These measures would accelerate the development of e-mobility, reduce the burden on the
environment and deliver a healthier living environment for the people.
Recommendations:
- Ensuring the installation of public E-CS, including in agglomerated multiple dwelling
neighbourhoods
- Ensuring the preparation of decrees for the regulation of parking of EVs in front of a public
charging infrastructure or the establishment of procedures for installation of charging stations
and parking spaces reservation
- Promoting alternative fuels urban transport and alternative fuels taxi transport
- Driving on yellow lanes
- Exemption of parking fees for electric cars.
Connection: #1—DEFINE THE BEST POSSIBLE ROLES OF PAS
Connection: #3— IMPROVE THE INFRASTRUCTURE
Connection: #5—EMPOWER COMMUNICATION AMONG PUBLIC AUTHORITIES and
OTHER STAKEHOLDERS
National Alternative fuels Strategy Action plan for 2018:
Measures:
- financial and tax incentives,
- elimination of administrative barriers,
- green procurement,
- charging infrastructure co-financing,
- promotional and educational activities,
- recommendations to local communities,
European Regional Development Fund
Report
Pag. 43/202
- recommendations to employers,
- parking policy.
Value of measures altogether for 2018 amounts to € 13,7 MIO (€ 11,1 MIO is already guaranteed). For
2019 the estimated value of the measures amounts to € 35,1 MIO (out of which € 19,4 MIO is already
guaranteed) and for 2020 to € 57,3 MIO (€ 30,6 MIO).
(Source: Presentation of Mr. Bojan Žlender, of Ministry of Infrastructure. Ljubljana, 14.3.2018).
European Regional Development Fund
Report
Pag. 44/202
3 GORENJSKA REGIONAL ACTION PLAN
The present document represent the e-MOTICON proposal for the Gorenjska region by the project
partner BSC, Business Support Center, Ltd, Kranj, Regional Development Agency of Gorenjska (BSC,
Ltd, Kranj) with the support of local administrators of 18 municipalities and stakeholders, for the
planning of an interoperable E-CS network.
The RAP of Gorenjska 2019-2030 (hereinafter: RAP) is the basic document at the regional level for the
implementation of the e-mobility infrastructure in the region. It defines the benefits of the region
development in terms of diffusion of e-mobility infrastructure and knowledge capacity building
regarding e-mobility, defines its development priorities and financially evaluates policy measures and
actions taken by regional public authorities for the diffusion of e-mobility infrastructure and connected
services. It was prepared in accordance with the above mentioned Alpine Space Programme strategic
documents and National strategic documents on e-mobility and mobility on alternative fuels and the
decision of the Development Council of the Gorenjska region on the 10th Board meeting, on the 14th of
February 2017, supporting the preparation of this document, and the Gorenjska Regional Development
Plan 2014-2020, supporting the development of sustainable mobility in Gorenjska region. Within the
Regional Development Plan for Gorenjska 2014-2020, the document is aligned with the objectives
under the chapter Environment, Space and infrastructure.
Within the framework of the Regional Development Plan for Gorenjska 2014-2020, the document meets
the objectives of the chapter Environment, Space and Infrastructure.
3.1 Identification of Region Gorenjska target groups
BSC, Ltd, Kranj, Regional Development Agency of Gorenjska, as the responsible for the preparation of
the Action plan realizes that in order for the plan to be effective in its implementation the target groups
addressed need to be all 18 municipalities of Gorenjska region and Electro Distributers (Gorenjske
elektrarne and Petrol) and other regional facilitators of e-mobility like Tourism Bohinj and SORK
(Svetovalni Organ za Razvoj Kolesarstva Gorenjske – Advisory body for development of cycling in
Gorenjska).
The process of RAP preparation started in December 2017 and ended October 2018, following the
principles:
• The document should be an upgrade of the existing municipal policy documents on Sustainable
mobility like SUMPs, Local energy concept and other.
• The document should be focused, clear and operational.
• Feasibility of actions to be taken is important; therefore the measures will be prioritized on the basis of
Multi-criteria analysis.
• The clarity of decisions on e-mobility infrastructure and integration in other mobility plans and
existing regional and local structures needs to be assured.
• The focus is on an agreement on the key local and regional projects, which will make Gorenjska closer
to the aim of implementing e-mobility.
• RAP must also be based on visions of companies, the state and follow the EU AFID directive,
• The results of the measures need to be integrated in present or future business models and thus self-
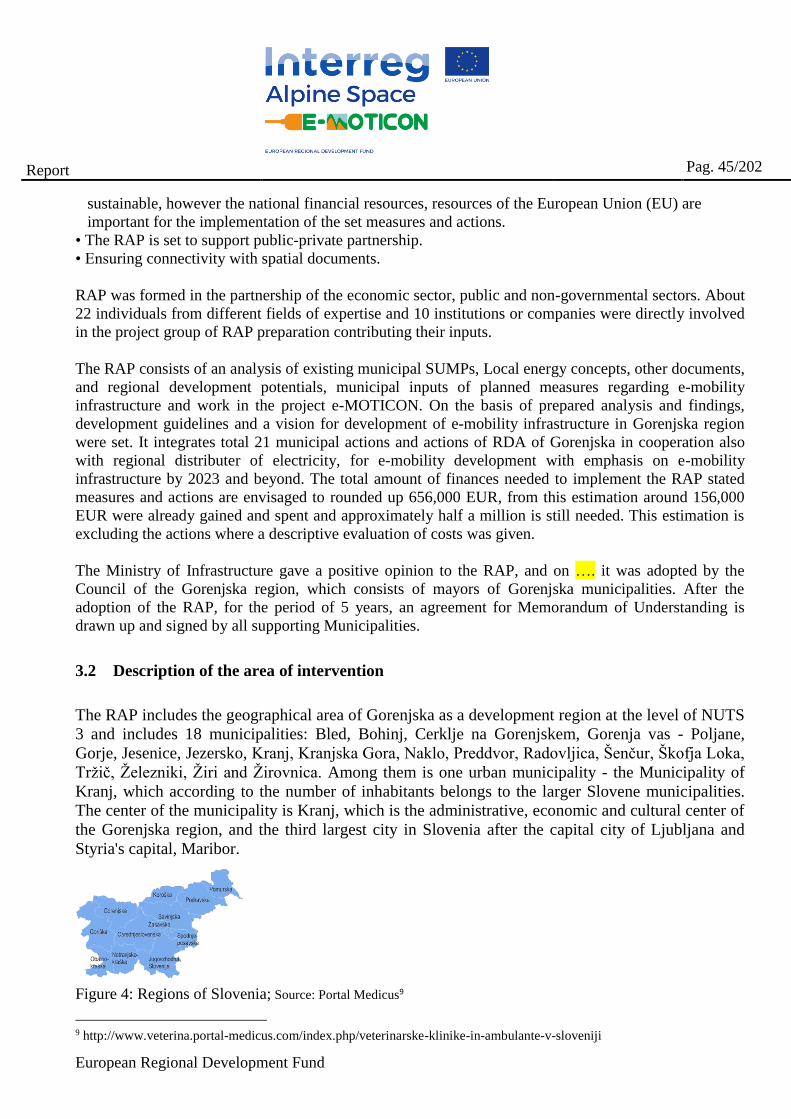
European Regional Development Fund
Report
Pag. 45/202
sustainable, however the national financial resources, resources of the European Union (EU) are
important for the implementation of the set measures and actions.
• The RAP is set to support public-private partnership.
• Ensuring connectivity with spatial documents.
RAP was formed in the partnership of the economic sector, public and non-governmental sectors. About
22 individuals from different fields of expertise and 10 institutions or companies were directly involved
in the project group of RAP preparation contributing their inputs.
The RAP consists of an analysis of existing municipal SUMPs, Local energy concepts, other documents,
and regional development potentials, municipal inputs of planned measures regarding e-mobility
infrastructure and work in the project e-MOTICON. On the basis of prepared analysis and findings,
development guidelines and a vision for development of e-mobility infrastructure in Gorenjska region
were set. It integrates total 21 municipal actions and actions of RDA of Gorenjska in cooperation also
with regional distributer of electricity, for e-mobility development with emphasis on e-mobility
infrastructure by 2023 and beyond. The total amount of finances needed to implement the RAP stated
measures and actions are envisaged to rounded up 656,000 EUR, from this estimation around 156,000
EUR were already gained and spent and approximately half a million is still needed. This estimation is
excluding the actions where a descriptive evaluation of costs was given.
The Ministry of Infrastructure gave a positive opinion to the RAP, and on …. it was adopted by the
Council of the Gorenjska region, which consists of mayors of Gorenjska municipalities. After the
adoption of the RAP, for the period of 5 years, an agreement for Memorandum of Understanding is
drawn up and signed by all supporting Municipalities.
3.2 Description of the area of intervention
The RAP includes the geographical area of Gorenjska as a development region at the level of NUTS
3 and includes 18 municipalities: Bled, Bohinj, Cerklje na Gorenjskem, Gorenja vas - Poljane,
Gorje, Jesenice, Jezersko, Kranj, Kranjska Gora, Naklo, Preddvor, Radovljica, Šenčur, Škofja Loka,
Tržič, Železniki, Žiri and Žirovnica. Among them is one urban municipality - the Municipality of
Kranj, which according to the number of inhabitants belongs to the larger Slovene municipalities.
The center of the municipality is Kranj, which is the administrative, economic and cultural center of
the Gorenjska region, and the third largest city in Slovenia after the capital city of Ljubljana and
Styria's capital, Maribor.
9 http://www.veterina.portal-medicus.com/index.php/veterinarske-klinike-in-ambulante-v-sloveniji
Figure 4: Regions of Slovenia; Source: Portal Medicus9
European Regional Development Fund
Report
Pag. 46/202
3.2.1 The territory and the morphological aspects
Gorenjska is the fourth largest Slovenian region by the number of residents and the sixth by the
area. The area is 2.137 km². Gorenjska lies in the north-western part of Slovenia and borders with
Austria (Carinthia), north, Italy (the Friuli-Venezia Giulia region), west, Goriška region on the
south-west and in the south to south-east it opens towards the Osrednjeslovenska region.
Gorenjska is an Alpine region. The geomorphologically dynamic surface is characterized by high
mountains, among which the highest Triglav, the symbol of Slovene, peaks 2864m high from the
sea level. 70% of Gorenjska represents the mountain world, only 30% of the surface lies in the
valley and flat part of central Slovenia. As many as 40% of the region is located above 1,000 meters
above sea level, 65% of the region of Gorenjska is covered by forests, and over 45% of the region
includes protected areas of nature, including Natura 2000 sites (94,661 hectares or 44.3% of the
region, source: Natura 2000) protected areas of nature.
Present land use is a result of society’s current needs as well as a reflection of historical Land use
patterns. In the most recent period, sub‐urbanization is mainly evident on urban fringe and in
settlements that are close to the corridor connecting to Jesenice, Kranj and the capital city of
Ljubljana. On the other hand, the rural landscape is demographically endangered with ageing and
falling of population. Forest and grassland predominate in the structure of agricultural land. The
main land use interests are development of building land for housing needs, development of
economic activities such as trade centers and some industrial zones, sports facilities, infrastructure,
agricultural activities, tourism needs as hotels, apartments, golf courses and other leisure facilities,
as well as nature reserves and protected areas.
3.2.2 Demografic features
Gorenjska region has 203.800 residents (2017). Population density is 95,4 people/km2. The region
stands out, now for several years, with the highest share of people aged 0–14 (15.8%). The natural
increase in the region was among the highest (1.9 per 1,000 population), while net migration was
negative (–2 per 1,000 population), noted in 2015. As regards the share of people with tertiary education
(28%), the region has been the second in the country.
Unemployment rate in 2015 was 6.9%. Average monthly net earnings of persons employed in the region
were in 2015 below the national average, 1,011 EUR. In 2018, unemployment rate in Gorenjska was
5.5%. In July 2018 there were 2429 men unemployed and 2450 women in Gorenjska (SURS, 2018)10
10 https://ess.gov.si/trg_dela/trg_dela_v_stevilkah/registrirana_brezposelnost#Statistične%20regije
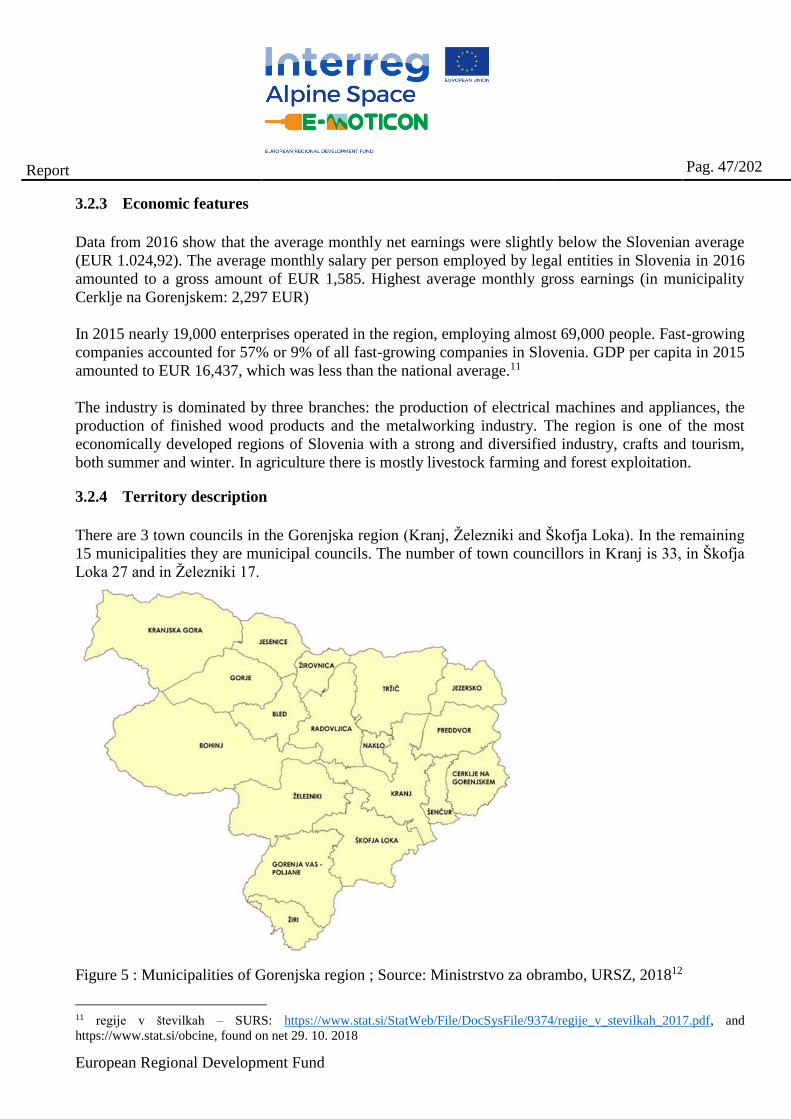
European Regional Development Fund
Report
Pag. 47/202
3.2.3 Economic features
Data from 2016 show that the average monthly net earnings were slightly below the Slovenian average
(EUR 1.024,92). The average monthly salary per person employed by legal entities in Slovenia in 2016
amounted to a gross amount of EUR 1,585. Highest average monthly gross earnings (in municipality
Cerklje na Gorenjskem: 2,297 EUR)
In 2015 nearly 19,000 enterprises operated in the region, employing almost 69,000 people. Fast-growing
companies accounted for 57% or 9% of all fast-growing companies in Slovenia. GDP per capita in 2015
amounted to EUR 16,437, which was less than the national average.11
The industry is dominated by three branches: the production of electrical machines and appliances, the
production of finished wood products and the metalworking industry. The region is one of the most
economically developed regions of Slovenia with a strong and diversified industry, crafts and tourism,
both summer and winter. In agriculture there is mostly livestock farming and forest exploitation.
3.2.4 Territory description
There are 3 town councils in the Gorenjska region (Kranj, Železniki and Škofja Loka). In the remaining
15 municipalities they are municipal councils. The number of town councillors in Kranj is 33, in Škofja
Loka 27 and in Železniki 17.
Figure 5 : Municipalities of Gorenjska region ; Source: Ministrstvo za obrambo, URSZ, 201812
11 regije v številkah – SURS: https://www.stat.si/StatWeb/File/DocSysFile/9374/regije_v_stevilkah_2017.pdf, and
https://www.stat.si/obcine, found on net 29. 10. 2018
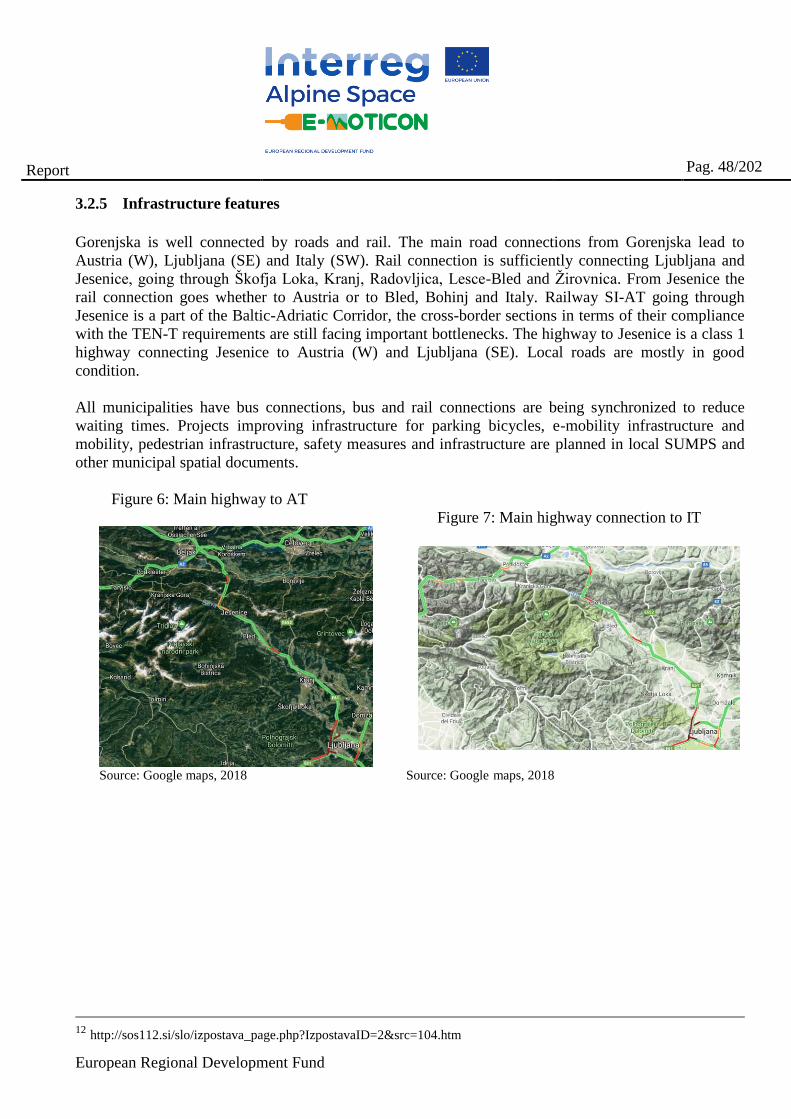
European Regional Development Fund
Report
Pag. 48/202
3.2.5 Infrastructure features
Gorenjska is well connected by roads and rail. The main road connections from Gorenjska lead to
Austria (W), Ljubljana (SE) and Italy (SW). Rail connection is sufficiently connecting Ljubljana and
Jesenice, going through Škofja Loka, Kranj, Radovljica, Lesce-Bled and Žirovnica. From Jesenice the
rail connection goes whether to Austria or to Bled, Bohinj and Italy. Railway SI-AT going through
Jesenice is a part of the Baltic-Adriatic Corridor, the cross-border sections in terms of their compliance
with the TEN-T requirements are still facing important bottlenecks. The highway to Jesenice is a class 1
highway connecting Jesenice to Austria (W) and Ljubljana (SE). Local roads are mostly in good
condition.
All municipalities have bus connections, bus and rail connections are being synchronized to reduce
waiting times. Projects improving infrastructure for parking bicycles, e-mobility infrastructure and
mobility, pedestrian infrastructure, safety measures and infrastructure are planned in local SUMPS and
other municipal spatial documents.
Figure 6: Main highway to AT
Figure 7: Main highway connection to IT
Source: Google maps, 2018 Source: Google maps, 2018
12 http://sos112.si/slo/izpostava_page.php?IzpostavaID=2&src=104.htm
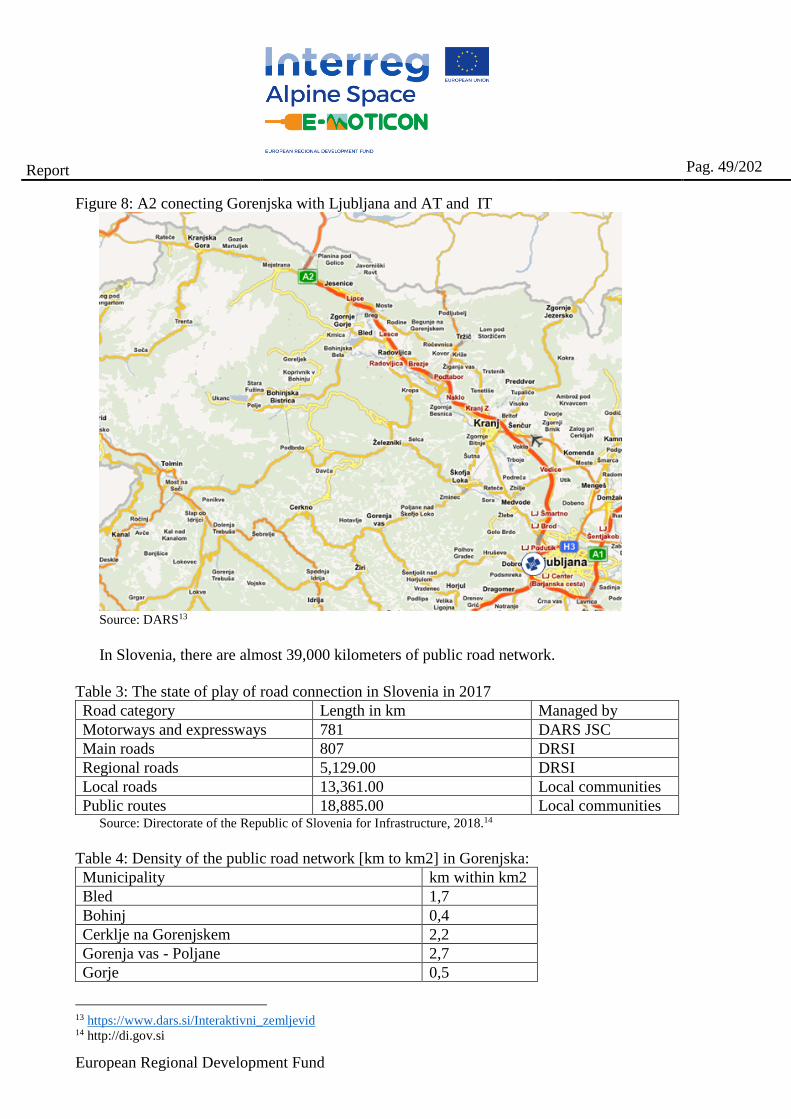
European Regional Development Fund
Report
Pag. 49/202
Figure 8: A2 conecting Gorenjska with Ljubljana and AT and IT
Source: DARS13
In Slovenia, there are almost 39,000 kilometers of public road network.
Table 3: The state of play of road connection in Slovenia in 2017
Road category Length in km Managed by
Motorways and expressways 781 DARS JSC
Main roads 807 DRSI
Regional roads 5,129.00 DRSI
Local roads 13,361.00 Local communities
Public routes 18,885.00 Local communities Source: Directorate of the Republic of Slovenia for Infrastructure, 2018.14
Table 4: Density of the public road network [km to km2] in Gorenjska:
Municipality km within km2
Bled 1,7
Bohinj 0,4
Cerklje na Gorenjskem 2,2
Gorenja vas - Poljane 2,7
Gorje 0,5
13 https://www.dars.si/Interaktivni_zemljevid 14 http://di.gov.si
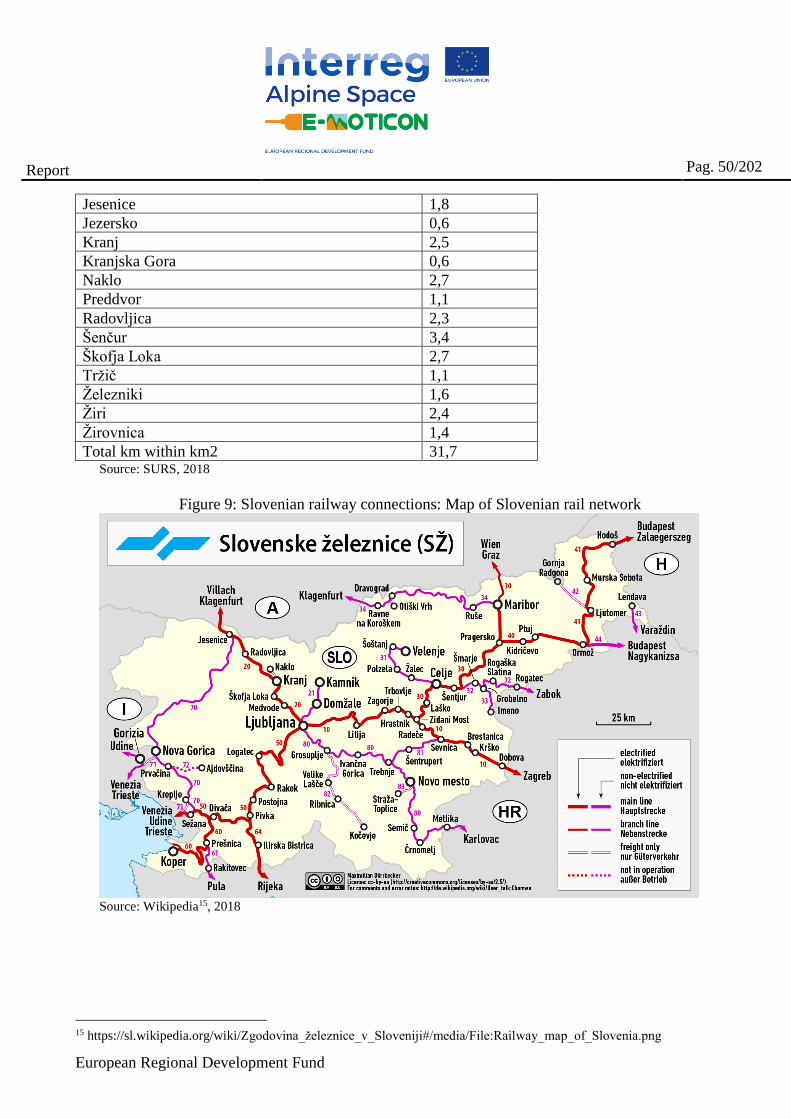
European Regional Development Fund
Report
Pag. 50/202
Jesenice 1,8
Jezersko 0,6
Kranj 2,5
Kranjska Gora 0,6
Naklo 2,7
Preddvor 1,1
Radovljica 2,3
Šenčur 3,4
Škofja Loka 2,7
Tržič 1,1
Železniki 1,6
Žiri 2,4
Žirovnica 1,4
Total km within km2 31,7 Source: SURS, 2018
Figure 9: Slovenian railway connections: Map of Slovenian rail network
Source: Wikipedia15, 2018
15 https://sl.wikipedia.org/wiki/Zgodovina_železnice_v_Sloveniji#/media/File:Railway_map_of_Slovenia.png
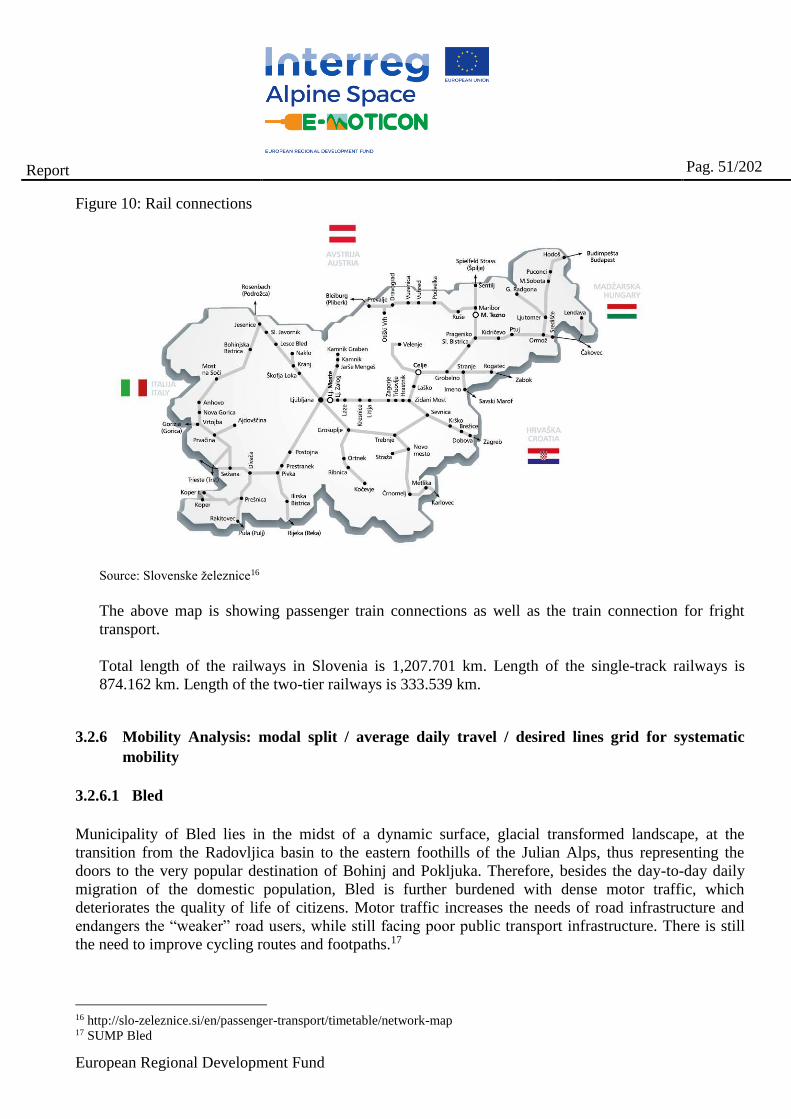
European Regional Development Fund
Report
Pag. 51/202
Figure 10: Rail connections
Source: Slovenske železnice16
The above map is showing passenger train connections as well as the train connection for fright
transport.
Total length of the railways in Slovenia is 1,207.701 km. Length of the single-track railways is
874.162 km. Length of the two-tier railways is 333.539 km.
3.2.6 Mobility Analysis: modal split / average daily travel / desired lines grid for systematic
mobility
3.2.6.1 Bled
Municipality of Bled lies in the midst of a dynamic surface, glacial transformed landscape, at the
transition from the Radovljica basin to the eastern foothills of the Julian Alps, thus representing the
doors to the very popular destination of Bohinj and Pokljuka. Therefore, besides the day-to-day daily
migration of the domestic population, Bled is further burdened with dense motor traffic, which
deteriorates the quality of life of citizens. Motor traffic increases the needs of road infrastructure and
endangers the “weaker” road users, while still facing poor public transport infrastructure. There is still
the need to improve cycling routes and footpaths.17
16 http://slo-zeleznice.si/en/passenger-transport/timetable/network-map 17 SUMP Bled
European Regional Development Fund
Report
Pag. 52/202
Demographic image is negative. Between 2008 and 2016, the number of inhabitants decreased by only
2%, but the worry is that the negative increase in the population (-7.7 ‰ in the municipality of Bled and
0.9 ‰ in Slovenia) and the large share of the elderly population (5.8% of the elderly over 80 in the
municipality of Bled and 4.7% in Slovenia).18
Regarding traffic, there are problems in terms of extending travel distances, since there is an absence of
a competitive public transport, the main mean of transport is car transport. 62% of the inhabitants of the
Municipality of Bled daily migrate to work in other places. 43% of people are daily migrating to work in
Bled from other areas. 71% of people use a car for transport to work and to school, 77% after work for
errands, 87% for a trip to Bohinj, 93% for a trip to Radovljica and so on.19
On the basis of the situation analysis and the completed surveys, public passenger transport (PPT) does
not use all the potential in the municipality. The possibilities for upgrading are mainly in the
optimization of routes and timetables, the integration of PPT into school transport, upgrading the
information system and the ticketing system, expanding the service and fleet, renovating stations and
stops and improving the business model. There is also a great opportunity in multimodality (interlacing
different modes of transport) and better integration of PPT forms with the remaining modes of transport
(e.g. today, there is no provision for passengers wishing to board a bus or train by bike).20
In motion is the planning, construction and building of the northern and southern bypass roads, which
will reduce the traffic pressure in the center. The plan is also to invest in the tourist transport, since Bled
is one of the most touristic destinations in Gorenjska.
3.2.6.2 Bohinj
The goal of the Bohinj municipality is to improve the living and working environment and to reduce the
impacts of traffic on the natural environment by changing the traffic habits and the traffic regime.
The majority of tourists in Bohinj still come with personal vehicles, which is reflected in the high traffic
load of roads and parking areas, especially in summer peaks. According to DRSI data, on the state road
at the countable town of Ribčev Laz in 2016, 1,066,186 vehicle transitions were recorded, of which 34%
were in July and August. Over the past years, the municipality has launched a number of infrastructural
and soft measures that promote the use of sustainable mobility: the construction of cycling routes, the
upgrading of parking spaces with a traffic management system, the purchase of a tourist boat, promotion
of the public transport use... Even so, the railway and public bus are underutilised.
Due to the dispersal of the settlement, the people of Bohinj are mainly dependent on their own transport.
With 517 vehicles per 1,000 inhabitants, the municipality ranks among the Slovenian average (518). In
the worst situation are older people and adolescents without their own transport, who live in
mountainous settlements, where there is no public transport, with the exception of school buses.
16, 17, 18, 19SUMP Bled
European Regional Development Fund
Report
Pag. 53/202
To limit the use of passenger cars, the Municipality introduces measures of soft mobility (set-up of E-
CS, e-boats…), increasing parking spaces, developing smart transport system (info boards), building
cycling and pedestrian infrastructure and slowing down traffic in the settlements.
For e-mobility, just in the 2017, 3 E-CS were set-up, in 2018 there were 4 public E-CS and 2 private
ones in a camping area and at the hotel Park in Bohinjska Bistrica.
In 2018 the transport of elderly people and people with disabilities, who cannot go for the visit to a
doctor, has begun. Transport is done by an electric car. Two electric cars are available for rent in the
Danica camp or at the Bohinj Tourist Board from summer season 2018. The municipality of Bohinj is
also a partner in the project Intergenerational Centers, which was registered for the LEAG programme,
in which Bohinj Municipality will purchase an electric car for the needs of the mobile social service.
The municipality is implementing e-mobility measures also when building new parking lots. The Spatial
Act stipulates that it is necessary to provide one charging station for electric cars at 50 parking places.
3.2.6.3 Cerklje na Gorenjskem
The municipality of Cerklje na Gorenjskem is a sustainable and economically viable municipality that
provides high quality of life, has regulated, efficient and safe transport connections. Cerklje na
Gorenjskem has a favorable position at the transition from the Ljubljana basin to the high mountain
world of the Kamnik-Savinja Alps, the junction of the rich natural environment, the cultural landscape
and the way of life of local people, which is enriched with the environment and the hospitality of the
people living there.
In the southern part of the municipality lies the central international airport in the country. The airport
has great economic importance for the area of the municipality. The development plans of the airport
date to 2040, when it is expected to become the leading provider of airline connections and services for
passenger and freight traffic in the region and achieves the following objectives:
- 4.1 million passengers per year (in 2010, passenger traffic at the airport consisted of 1.4 million
passengers),
- 60000 tonnes of freight traffic per year (in 2010, the freight traffic at the airport was 17310 tonnes),
- 88,000 aircraft movements per year (in 2010, there were 42569 aircraft movements at the airport).
In the extreme northern part of the municipality lies the ski center Krvavec, which, according to the
Strategy of the Construction of Cableways Systems in the Republic of Slovenia, taking into account,
above all, natural features, is considered the first (most promising) group of ski lifts in the country.
The current local energy concept of the municipality (LEK) includes measures about the ways of future
energy supply and use and for the efficient use of energy.
Policy in the transport sector in the municipality directs the development of this sector to the path of
sustainable mobility by promoting effective private and public transport, hiking and cycling. The
general measure that follows this direction is to support free parking spaces for electric vehicles in the
European Regional Development Fund
Report
Pag. 54/202
field of e-mobility. In addition, a general measure to encourage the spread of alternative fuel vehicles is
supported by the introduction of new technologies through the introduction of buses to alternative fuels
(e.g. biodiesel, LPG, etc.). Currently, two public gas vehicles are in use.
Every project in the field of transport should be accompanied by promotional activities that bring traffic
from energy and the environment closer to people.
3.2.6.4 Gorje
Municipality of Gorje measures 116km² and has 2830 residents (SURS, 2016). The neighbouring
municipalities are Bled, Jesenice, Kranjska Gora. The municipality lies on the elevated terrain, 562,2 m
above the sea level. The municipality is connected to other areas with three main roads, one coming
from the highway Jesenice and the other two from Bohinj and Bled.
Partially the area of the municipality is under Triglav national park, it has an area for skiing and ski
cross country running in winter and in it is visited for the activities in the nature and for the natural
heritage. For the mentioned reason there is a traffic load due to tourism, reaching peaks in tourism
seasons. Traffic is hindered because some roads and public roads are too narrow; whereas national roads
are not satisfactorily maintained; there is a lack of parking spaces. Through the village core, a state road
is very busy, but the construction of a bypass is beyond the competence of the municipality. The
municipality has in September 2018, set the table for measuring traffic and speed and marked pedestrian
path to increase road safety.
The economy is based on wood industry, smaller farms, tourism, production and other business. The
roads are therefore burdened with fright traffic. There is no rail connecting the municipality with other
areas. The public transport is limited to bus. Most people use personal car. Every second person in the
municipality had in 2016 a car (54 cars per 100 inhabitants); which was on average 10 years old. In the
field of transport the emphasis of municipal measures are to reduce car traffic and to develop sustainable
and efficient long-distance transport. The municipality supports public road transport on alternative
fuels and e-mobility with free parking spaces for e-cars.
Among persons aged 15-64 (i.e. working age population), approximately 62% are employed or self-
employed persons (i.e. persons in employment), which is more than the Slovenian average (60%) (2016,
SURS). Daily migrations apply to work and educational purposes to the neighbouring municipalities and
Ljubljana. Most residents work outside municipality.
The population is aging and the aging index is higher than the average for Slovenia.
3.2.6.5 Gorenja vas – Poljane
The total area of the municipality is 153.3 km². Poljanska valley on the south side is surrounded by
Polhov Gradec hills, on the north side Škofjeloška hilly area and on the western side hilly area of
Cerkljansko. Settlements lie mostly in the valley, and mountain hutches and lonely farms sometimes
reach over 1000 m above sea level. The geographical position does not favour any main road or rail
connections to the other parts of Slovenia. The municipality has poor traffic connections to main roads
European Regional Development Fund
Report
Pag. 55/202
and the same goes for bus connections within the area - difficult mobility across the area, with road
freight congestion.
The municipality has in the year 2018, 7541 residents. The natality rate is positive, however more
people moved out than moved into the municipality. It is one of the rare municipalities where population
is not aging and the average age is less than the Slovenian average.
Among persons aged 15-64 (i.e. working age population), approximately 65% were employed or self-
employed persons (i.e. persons in employment), which is more than the Slovenian average (60%) (2016,
SURS). Economically municipality puts emphasis on tourism sector in cooperation with the
neighbouring municipalities (Škofja Loka, Žiri and Železniki). The aim is to attract more daily visitors
and tourists to the area and increase the average night stays. This is connected to traffic flows. Therefor
the road connections need to be improved, since the railway stops in Škofja Loka.
In 2016 every second person in the municipality had a car (55 cars per 100 inhabitants); which was on
average 11 years old. The municipality is investing in the road infrastructure, especially in the
maintenance and road safety. In 2017 they have planned new bus station and build new small parking
lot. However the traffic is based predominately on the personal vehicles. Public transport is based on
public bus and school buses for children.
3.2.6.6 Jezersko
Municipality of Jezersko measures 68.8 km2 and has 650 residents. In the west it borders on the Tržič
municipality, in the south to the municipality of Preddvor, in the south-east to the Kamnik municipality
and the municipality of Solčava, and in the north and east to the Republic of Austria. The municipality
has two settlements, the Upper and Lower Jezersko. The municipality has 12,8 km of national road (R1
Preddvor - Zg. Jezersko), which leads through the narrow valley of Kokra and Jezernica to Zg. Jezerski
and further to Jezerski vrh on the border with Austria and represents the main traffic connection of the
municipality. Jezersko is 27 km away from the Kranj - Ljubljana motorway, or to say otherwise, there is
33 minutes drive. The motorway on the Austrian side is 46 km away, which means 51 minutes drive.
The terrain is mountainous. There are 2 settlements, other houses are scattered across the area. The
natality rate is negative; however the population is aging slower than the Slovenian average.
The economy is based on tourism and farming. In 2015 there were approximately 60% of employed or
self-employed persons (i.e. persons in employment) among persons aged 15-64 (i.e., working age
population), which is more than the Slovenian average (58%). Most of the residents daily migrate to
work to other municipalities. Daily travel of the residents several times per day is also connected to
daily errands, like going to a shopping center, attending high school or for acquiring higher education,
taking children to music school, going to the pharmacy etc. Bus connections with Kranj are available 3x
daily for work and additional 4x school hours, on Sundays there is no public transport. Poor public
transport connections with the Brnik and Klagenfurt airports and with the major urban centers accessible
by rail are a limiting factor for the development of sustainable tourism, which the municipality
recognizes as an area with a high development potential.
In 2015 every second person in the municipality had a car (57 cars per 100 inhabitants); which was on
average 10 years old. Promoting sustainable mobility aims to increase people's awareness and promote
European Regional Development Fund
Report
Pag. 56/202
the use of public transport, the use of bicycles and walking, and the gradual introduction of electric
vehicles into municipal fleets.
3.2.6.7 Jesenice
The Municipality of Jesenice has an excellent traffic geographical location with state and international
companies, developed industry, trade and various administrative, educational sectors. Jesenice is
densely populated municipality. The dependence on motor transport increases the need for road
infrastructure and endangers the "weaker" road users, while also facing poor infrastructure of public
passenger transport, unregulated and dangerous cycling and footpaths. Additionally, accessibility is
often limited due to liner barriers, such as railways, the Sava River and the motorway.21
The sociodemographic image is negative. From 2002 to 2016 the number of inhabitants decreased by
approx. 5%. Despite the positive natural increase, employment is declining, especially highly educated
people are moving away. The number of older people over 65 is increasing.
The city of Jesenice and the larger settlements are just beside the A2 motorway, the Karavanke-Obrežje
tunnel and the Jesenice-Ljubljana and Jesenice- Nova Gorica railway lines. Because of the city itself, the
road network is relatively inefficient. Most of the main connections take place in the East-West
direction, while there are less cross-line, North-South, links. The result is a longer travel time and the
associated costs and increased emissions.22
From 2002 to 2015 the trend of rising travel distances and the motorization rate increased from 376 to
459 vehicles per 1,000 inhabitants. The motorization rate is below the Slovenian average (523 vehicles
per 1000 inhabitants). There is a pronounced driving culture among the people. Travel habits survey
shows that most daily trips are done by car, 76% of trips to work or school, 63% of trips for running
errands. Public transport is uncompetitive. 80% of inhabitants do not use public transportation or they
use it once per year. Smaller settlements have almost no alternative to the car use. The bus connections
are insufficient, mostly used for the transport to school, for other uses inconvenient. Rail transport lacks
accompanying infrastructure and the traveling time is longer as per car travel. Bicycle infrastructure is
insufficient and in some cases dangerous. Bike sharing system is being established; however the bikes
are not appropriate for the dynamic terrain.23
There are an insufficient number of parking spaces in front of multi residential buildings and public
parking areas. Dimensions of old parking garages do not correspond to present size of vehicles and thus
hindering their usability.
3.2.6.8 Kranjska Gora
The municipality of Kranjska Gora lies in the north-west of Slovenia, on the border with Austria and
Italy, at the foot of the Julian Alps and Karavanke, in the narrower area of the Triglav National Park.
21 SUMP Jesenice 22 22SUMP Jesenice
European Regional Development Fund
Report
Pag. 57/202
Kranjska Gora is the municipal center and the largest place of the Upper Sava Valley. It is also a
mountain tourist destination and an important, world-famous winter sports center. Tourism traffic peaks
are characteristic for tourist seasons. Kranjska Gora is one of the strongest municipalities in terms of
tourism, especially in winter.
Municipality measures 256.30 km2 and had in 2016, 5.289 residents, of which 28.34% were employed.
Number of persons in employment (per domicile) was in 2016, 2.046 people. The main economic sector
is tourism and wood industry, small farms and business sector. Natality rate has been negative. The
number of vehicles was for the same year 2.858.
In terms of connectivity to other municipality in a maximum of half an hour drive one can reach the
motorway in Italy (Tarvisio), Austria (Villach) or Slovenia (Karavanken tunnel). The nearest train
station is Jesenice, 20 km away, from/to where there is a bus connection. Ljubljana airport is less than
an hour's drive away. Even though there is a public bus transport, the predominant mode of transport is
by car.
Municipality is supporting sustainable mobility, cycling and walking. In terms of e-mobility some
actions for setting up E-CS were taken.
3.2.6.9 Kranj
Kranj municipality is well integrated into regional traffic flows, having good location and providing
good logistical conditions for the economy. The massive use of diversified road network brings with it
certain negative effects on the quality of life. Strong traffic flows by labour migration, economic activity
and tourism development, create the need for investment in road infrastructure. Since the development
of most activities in relation to existing travel habits is linked to road transport, in the future, with no
more radical changes, one can expect the cost increase for infrastructure and environmental impacts.
Pedestrians and cyclists do not have adequate infrastructure (narrow sidewalks, small bicycle surfaces)
and competitive public transport services.
The number of people over 65 years of age is increasing. The consequences of the age structure change
will reflect in the changed mobility habits of the inhabitants. The need for adaptation of the existing
infrastructure for the elderly population will increase.
From 2000-2015, the number of daily migration to work by citizens increased significantly. In 2000,
66% of the population went to work within the municipality, in 2015 only 49.7% of them remained.
Half of the employees travel to work outside the municipality, generating strong traffic flows and raising
the need to maintain road infrastructure. On average, the household cost for a car purchase and
maintenance is 400 euros a month. Municipality encourages local employment and provides alternatives
to car use for the purpose of getting to work.
Residents of smaller towns have very few alternatives to car transportation. Bus stops are poorly
equipped in some places, and the frequency is not satisfactory for most residents. In smaller towns, the
bus is mainly used by school-age children, and the rest do not see it as a suitable alternative. Only 3% of
the inhabitants use the daily long-distance bus. For cycling, safety conditions outside the settlements are
inadequate and there are few connections, cycling from small settlements towards Kranj is rare.
European Regional Development Fund
Report
Pag. 58/202
The Municipality will repair the worn-out roads, together with the external experts establish a car
sharing system, establish P + R system and build other necessary parking spaces.
For the implementation of public services, the Municipality will buy environmentally friendly vehicles
and with the external experts, will provide for the expansion of the network of electric e-charging
stations.
3.2.6.10 Naklo
The surface of Municipality Naklo is 28km2 and has approximately 5.300 residents (SURS, 2014). The
area is connected to the Slovenian motorway cross in the direction of the Ljubljana-Tunnel of the
Karavanke A2, which represents one of the main traffic roads from the northern part of the continent
and one of the main touristic traffic connections in Europe (E 651). In parallel with the highway, a
regional road connects the area with Kranj, Tržič and Radovljica. The area is connected via Kranj to the
Slovenian international rail network. The area of the municipality is connected to the central state airport
- Jože Pučnik Airport Ljubljana with the highway and the regional road (15-20 minutes accessibility).
There is no rail passenger transport in the municipality. Bus transport is transit, carried out by the
company Integral Jesenice and Alpetour Kranj. School transport is organized in the area of the
municipality.
The natality rate was in the year 2014 negative; however the number of people moving into the
municipality was higher than the number of people moving out. The average age is lower than the
Slovenian average. Among persons aged 15-64 (i.e. working age population), approximately 59% were
employed or self-employed persons (i.e. persons in employment), which is more than the Slovenian
average (57%). Economy is based on different kinds of industry and production (metal works, concrete
products, office and shop furniture, wood works …) and business.
Almost every other resident in the municipality had a car (56 cars per 100 people); which was in average
9 years old. (SURS, 2018). In the municipality of Naklo there are 81.7 km of roads, of which 25.2 km
are national roads (regional categories) and 56.5 km of municipal roads. In the municipality of Naklo
there are 9 countable traffic points on the state road. The reason for daily migrations is in average
connected with work and education. Personal car use is predominant, since it enables flexible and fast
transport anytime and anywhere to other parts of Slovenia.
3.2.6.11 Preddvor
The share of transport accounts for almost 40% of total consumption at the level of final energy
consumption in Slovenia. Most of this energy is imported by Slovenia, with an annual cost of over 1
billion euros. With the gradual introduction of e-mobility that would exploit locally produced electricity
as a primary energy source, this money could remain in Slovenia, while helping to make more efficient
use of energy, as well as a substantial reduction in CO2 emissions.
European Regional Development Fund
Report
Pag. 59/202
The municipality of Preddvor measures 87 km2 and has 3619 (2018) residents. The average age of the
residents was in 2014, 42.724 years. The population density is lower than the Slovenian average. The
birth rate is negative; however people do move to Preddvor municipality. Almost every other person in
the municipality had a car in 2014 (54 cars per 100 inhabitants). Migrations to work outside the
municipality are related to most of the working population. Municipality promotes sustainable mobility
and optimization of motor transport, and therefore successfully applied for the Eco Fund tender for the
purchase of the e-charging station for electric vehicles. With the installation of an electric charging
station in the center of Preddvor one of the many sustainable mobility measures that are enshrined in an
integrated transport strategy is fulfilled. The money for the purchase and installation of the charging
station is also financed by the Eco Fund.
Installation of the second electric charging station and free charging encourages citizens and other
potential users to invest in vehicles and space for charging electric cars that will soon be more numerous
on Slovenian roads.
The Municipality of Preddvor is planning indicative projects and activities among which address the
following activities for electric mobility: the purchase of electric vehicles for the needs of primary
schools, fieldworkers of municipalities and societies (possibility of sharing for transportation of children
and elderly people); arranging electric charging stations with parking lots in the center of the Preddvor
and at the gas station; accelerated use of existing electric bicycles (TIC) among citizens.
3.2.6.12 Radovljica
Municipality of Radovljica is well integrated into transport systems, which enable the population to
have good mobility and access to key markets for the economy. Due to the high level of motorization,
the need for investment in road infrastructure is high, but often the needs of the remaining road users
who are experiencing poor public transport infrastructure and dangerous cycling routes and footpaths
are often neglected.
Between 2002 and 2016, the number of inhabitants increased by 3%. Most of the new inhabitants moved
to the city of Radovljica, where the number increased by four percent in the last eight years. The age
structure of the municipality since 2001 indicates aging of population. In the last 15 years the average
age of the population increased by four years. The consequences aging population will begin to be
reflected in the changed mobility habits of the inhabitants. There will also be increased needs for
adaptation of the infrastructure for the elderly population.
15% more workers migrate to work to other municipalities than they come to Radovljica to work from
other municipalities, which means negative economic and environmental consequences. Employees do
longer routes, which cause more discharges with vehicles, but at the same time, lots of time is lost. Most
of the work migrations, 77%, are done by car.
The use of motor vehicles has increased significantly over the past 15 years. This is shown by data on
the motorization rate in the municipality of Radovljica, which climbed from 444 in 2001 to 527 vehicles
per thousand inhabitants in 2015. The figures show an above average number of vehicle owners
24 SURS, found 2. 10. 2018 on https://www.stat.si/obcine/sl/2014/Municip/Index/128
European Regional Development Fund
Report
Pag. 60/202
compared to the Slovenian average (523 vehicles per thousand inhabitants). Driving by car is the
dominant mode of transport.
Measures in the field of e-mobility will include spatial planning based on comprehensive environmental,
spatial and economic analyses, with regard to the establishment or upgrading of infrastructure for
introducing mobility to alternative fuels, promoting the introduction of public transport means to
alternative fuels, multimodal connectivity (new e-car modes - car sharing - the introduction of rental of
electric cars for local and long distance connections), intelligent alternative mobility management
solutions (mobile applications for smart sites, information websites, placement, E-CS or other in
interoperable and roaming systems, etc.).
3.2.6.13 Šenčur
Municipality of Šenčur measures 40,3km2 and is known for its business zones and the proximity to the
National airport.
In Šenčur the number of inhabitants is 8592 (2018, SURS) and is growing faster than average number of
inhabitants in Slovenia. The total population increase positive. The number of the youngest is higher
than the number of the oldest, which is a feature of only a few Slovenian municipalities. By increasing
the number of young people can be expected to increase the need for quality and safe urban areas and
areas that will be intended only for pedestrians and cyclists.
The economy is based on farming, tourism and business sector. Most of the working population drives
to work in the neighbouring city municipality Kranj.
In Šenčur they are several publically available E-CS stations set up. The establishment of the P + R
system in connection with bus lines to Ljubljana and in the vicinity of connections to the AC for the
purpose of switching between different travel modes, for the needs of travel and for the needs of major
events is planned untill 2021. Another innovative public service that they are planning to establish is a
drive-by-call system for older and less mobile citizens and for people without their own car. It’ll be a
public taxi service.
With the introduction of the car sharing station and the electric bike rental system, sustainable mobility
also results in more distant destinations. All mobility networks will be designed to allow intermodality.
The citizens will combine a system of different transports without any effort. Thus, this scenario
represents the most complex approach to sustainable mobility. All foreseen measures are intensively
promoted by major stakeholders.
3.2.6.14 Škofja Loka
The inhabitants living in the Municipality of Škofja Loka make the largest share of their daily journey
by a passenger car, in which the users are mostly transported by themselves. A passenger car is also
used when the routs are short and could be made on foot or by bicycle. The motorization rate, which in
the municipality amounts to 522 passenger cars per 1000 inhabitants, has an impact on the use of
passenger cars.
European Regional Development Fund
Report
Pag. 61/202
Škofja Loka municipality has about 23,000 inhabitants (approximately 11,300 men and 11,700 women).
The average age of citizens is 41.6 years. It is lower than the average age of the population of Slovenia
(43.0 years) and is rising faster than the average in Slovenia. It is expected that in the next twenty years,
the population of the Škofja Loka municipality, older than 65, will increase by almost 50%. In 2015, the
number of live births was higher than the number of deaths. The natural increase per 1,000 people in the
municipality was therefore positive this year, amounting to 3.0 (in Slovenia 0.4). The number of those
who moved out of this municipality was higher than the number of those who immigrated to it. The net
migration per 1,000 inhabitants in the municipality was therefore negative, amounting to -2.4. The sum
of the natural and the net migration per 1,000 inhabitants in the municipality was positive, amounting to
0.6 (the same as in Slovenia). Due to demographic changes, especially the aging of society, the mobility
habits and needs for mobility will also change.
Support for greater use of more environmentally friendly vehicles is shown in set-up of an e-charging
station. The expansion of the network of electric charging stations and gas filling stations will be carried
out with commercial providers.
Gradually, the fleet of municipal administration will be replaced by vehicles on more environmentally
friendly sources. At the same time, other companies and public institutions in the municipality will be
encouraged to follow the moves of the municipal administration.
A parking policy that will allow for more favourable and more affordable parking of alternative-vehicle
vehicles will encourage the replacement of vehicles on fossil fuels and the hiring and sharing of
alternative-powered vehicles.
The use of a car and other forms of motorized traffic is important and in many cases indispensable, an
optimal form of mobility, especially where other forms of mobility is not effective or is impracticable.
3.2.6.15 Tržič
In 2015, according to Eurostat data, Slovenia reached the ninth place in the European Union in the
motorization stage. Expenditure of the average household in Slovenia for personal mobility ranks us
first, in front of all EU members. Similarly in the municipality of Tržič: almost every household is
heavily dependent on a car, in some places two or even three.
GHG emissions from transport in Slovenia increased by 166% by 1986 compared to 1986. Also in the
EU, GHG emissions from the market greatly exceed growth; in the period 1990-2014 they increased by
13% (in Slovenia at that time by almost 97%). The main source of TGP is mostly road transport, which
contributes as much as 99% of all TGP emissions. The share of traffic discharges in total TGP emissions
(32.5% in 2014). (ARSO, 2018)25
Tržič with 517 vehicles per 1000 inhabitants is a highly motorized municipality, which requires a high
degree of diversification of the road network. The municipality is well provided with the road system
and has a good access to the municipality along with roads on the state level and an effective transit
25 http://kazalci.arso.gov.si/?data=group&group_id=4
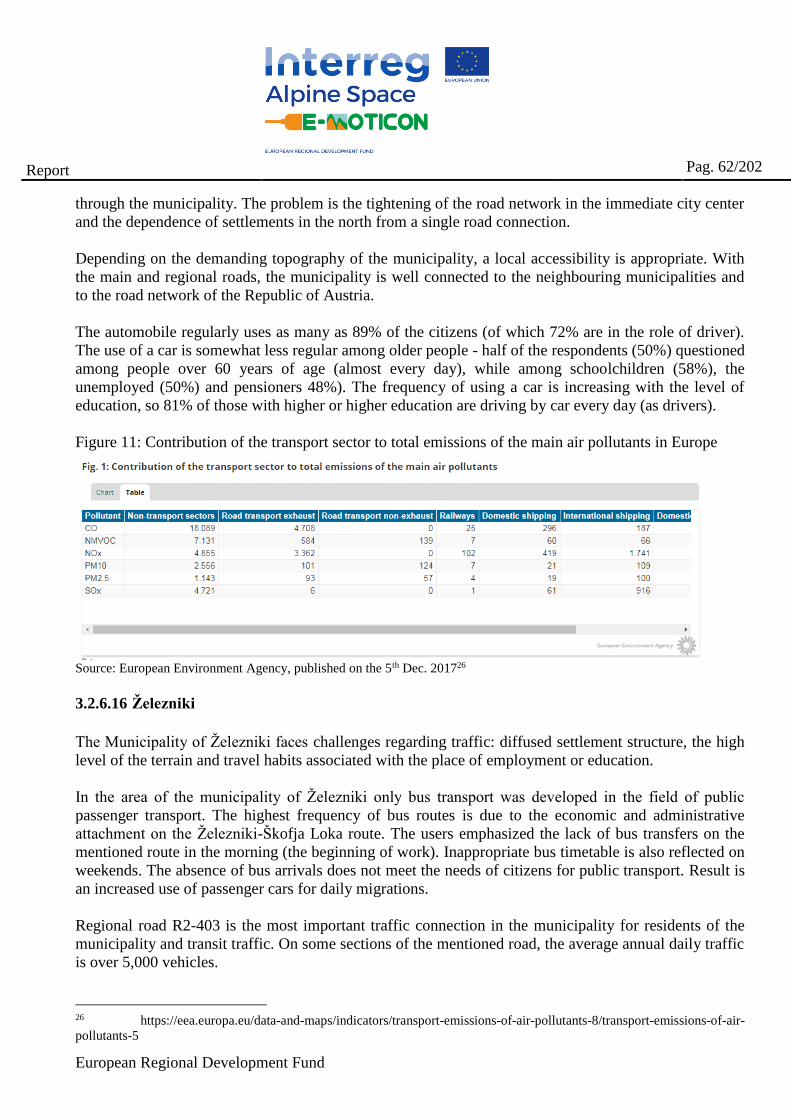
European Regional Development Fund
Report
Pag. 62/202
through the municipality. The problem is the tightening of the road network in the immediate city center
and the dependence of settlements in the north from a single road connection.
Depending on the demanding topography of the municipality, a local accessibility is appropriate. With
the main and regional roads, the municipality is well connected to the neighbouring municipalities and
to the road network of the Republic of Austria.
The automobile regularly uses as many as 89% of the citizens (of which 72% are in the role of driver).
The use of a car is somewhat less regular among older people - half of the respondents (50%) questioned
among people over 60 years of age (almost every day), while among schoolchildren (58%), the
unemployed (50%) and pensioners 48%). The frequency of using a car is increasing with the level of
education, so 81% of those with higher or higher education are driving by car every day (as drivers).
Figure 11: Contribution of the transport sector to total emissions of the main air pollutants in Europe
Source: European Environment Agency, published on the 5th Dec. 201726
3.2.6.16 Železniki
The Municipality of Železniki faces challenges regarding traffic: diffused settlement structure, the high
level of the terrain and travel habits associated with the place of employment or education.
In the area of the municipality of Železniki only bus transport was developed in the field of public
passenger transport. The highest frequency of bus routes is due to the economic and administrative
attachment on the Železniki-Škofja Loka route. The users emphasized the lack of bus transfers on the
mentioned route in the morning (the beginning of work). Inappropriate bus timetable is also reflected on
weekends. The absence of bus arrivals does not meet the needs of citizens for public transport. Result is
an increased use of passenger cars for daily migrations.
Regional road R2-403 is the most important traffic connection in the municipality for residents of the
municipality and transit traffic. On some sections of the mentioned road, the average annual daily traffic
is over 5,000 vehicles.
26 https://eea.europa.eu/data-and-maps/indicators/transport-emissions-of-air-pollutants-8/transport-emissions-of-air-
pollutants-5
European Regional Development Fund
Report
Pag. 63/202
82% of respondents replied that they use a car from all modes of transport. Daily traffic flows in the area
of the municipality are mostly directed towards Škofja Loka as a major employment, administrative and
service center. 92% of the working population works outside the municipality of Železniki in most cases
in larger centers, such as Škofja Loka, Kranj or Ljubljana. 76% of those employed in the municipality of
Železniki (without the citizens of Železniki), they drive to work from the aforementioned towns. This
shows the concentration of traffic in the time of arrivals and departures on the traffic axis in the
direction towards Škofja Loka. As the main two reasons for using the car as a transport mode, the speed
and practicality were determined after the survey was carried out.
In addition to the necessary infrastructure, bus service tailored to the elderly, "transport on call" is an
important solution. It would allow access to the center of the municipality and other settlements for less
mobile residents of distant settlements, to which it is not economically justified to establish new bus
lines. Daily traffic through the segment is burdened by local traffic, and due to production areas, the
segment is burdened by heavy freight. One of the main challenges in the municipality is the limited
development of road infrastructure due to difficult access and distance from the main national road
transport axes. The Municipality plans investing less in the road infrastructure related to the personal car
use.
3.2.6.17 Žiri
Municipality Žiri lies in the western part of Slovenia, with the surface of 49,2 km2 with approximately
4.850 residents. The Municipality of Žiri is surrounded by the municipalities of Gorenja vas - Poljane,
Cerkno, Idrija and Logatec. The natality rate is positive; however the number of people that moved out
of the municipality is higher than the number of people moving in. The average age of the residents is
lower than the Slovenian one. Among persons aged 15-64 (i.e. working age population), about 69%
were employed or self-employed persons (i.e. persons in employment), which is more than the
Slovenian average (60%) (SURS, 2016).
Most areas of the municipality are covered with forest land (62.6% of the area of the municipality),
followed by agricultural land (32.1%). The economy is based on manufacturing industry, like
shoemaking and industrial liquid production, window production and innovative development, then
printing, commerce and similar. In tourism sector the municipality aims to connect with neighbouring
municipalities to develop, promote and market tourism services.
Every second person in the municipality had a car (54 cars per 100 inhabitants); which was on average
11 years old. (SURS, 2016) The regional roads R2 Logatec - Žiri, R2 Žiri - Trebija and R3 Pečnik - Jury
run through the territory of the municipality. The predominant choice of transport is personal car. Public
passenger transport includes regular bus connections with Škofja Loka and Idrija, connections to
Ljubljana (via Škofja Loka and Logatec), school bus to Idrija, connection with Smreč and bus service
leading to Vrsnik. In the area of the town of Žiri and Selo, intermediate bus stops are arranged at
distances of approximately 400 m. In the urban area, the development of non-motorized traffic, such as
cycling and walking, is promoted. The municipality aims at establishing a supportive environment for
sustainable mobility.
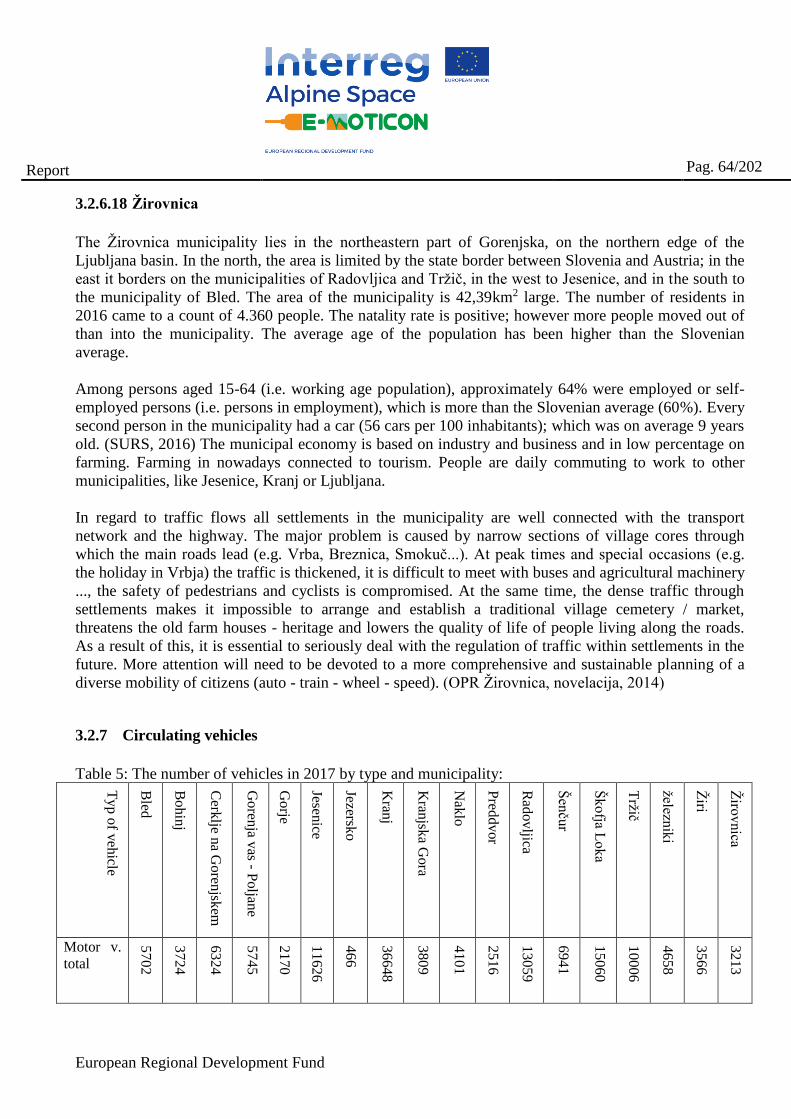
European Regional Development Fund
Report
Pag. 64/202
3.2.6.18 Žirovnica
The Žirovnica municipality lies in the northeastern part of Gorenjska, on the northern edge of the
Ljubljana basin. In the north, the area is limited by the state border between Slovenia and Austria; in the
east it borders on the municipalities of Radovljica and Tržič, in the west to Jesenice, and in the south to
the municipality of Bled. The area of the municipality is 42,39km2 large. The number of residents in
2016 came to a count of 4.360 people. The natality rate is positive; however more people moved out of
than into the municipality. The average age of the population has been higher than the Slovenian
average.
Among persons aged 15-64 (i.e. working age population), approximately 64% were employed or self-
employed persons (i.e. persons in employment), which is more than the Slovenian average (60%). Every
second person in the municipality had a car (56 cars per 100 inhabitants); which was on average 9 years
old. (SURS, 2016) The municipal economy is based on industry and business and in low percentage on
farming. Farming in nowadays connected to tourism. People are daily commuting to work to other
municipalities, like Jesenice, Kranj or Ljubljana.
In regard to traffic flows all settlements in the municipality are well connected with the transport
network and the highway. The major problem is caused by narrow sections of village cores through
which the main roads lead (e.g. Vrba, Breznica, Smokuč...). At peak times and special occasions (e.g.
the holiday in Vrbja) the traffic is thickened, it is difficult to meet with buses and agricultural machinery
..., the safety of pedestrians and cyclists is compromised. At the same time, the dense traffic through
settlements makes it impossible to arrange and establish a traditional village cemetery / market,
threatens the old farm houses - heritage and lowers the quality of life of people living along the roads.
As a result of this, it is essential to seriously deal with the regulation of traffic within settlements in the
future. More attention will need to be devoted to a more comprehensive and sustainable planning of a
diverse mobility of citizens (auto - train - wheel - speed). (OPR Žirovnica, novelacija, 2014)
3.2.7 Circulating vehicles
Table 5: The number of vehicles in 2017 by type and municipality:
Ty
p o
f veh
icle
Bled
Boh
inj
Cerk
lje na G
oren
jskem
Go
renja v
as - Poljan
e
Go
rje
Jesenice
Jezersko
Kran
j
Kran
jska G
ora
Nak
lo
Pred
dv
or
Rad
ovljica
Šen
čur
Ško
fja Lok
a
Tržič
železnik
i
Žiri
Žiro
vnica
Motor v.
total
57
02
37
24
63
24
57
45
21
70
11
626
46
6
36
648
38
09
41
01
25
16
13
059
69
41
15
060
10
006
46
58
35
66
32
13
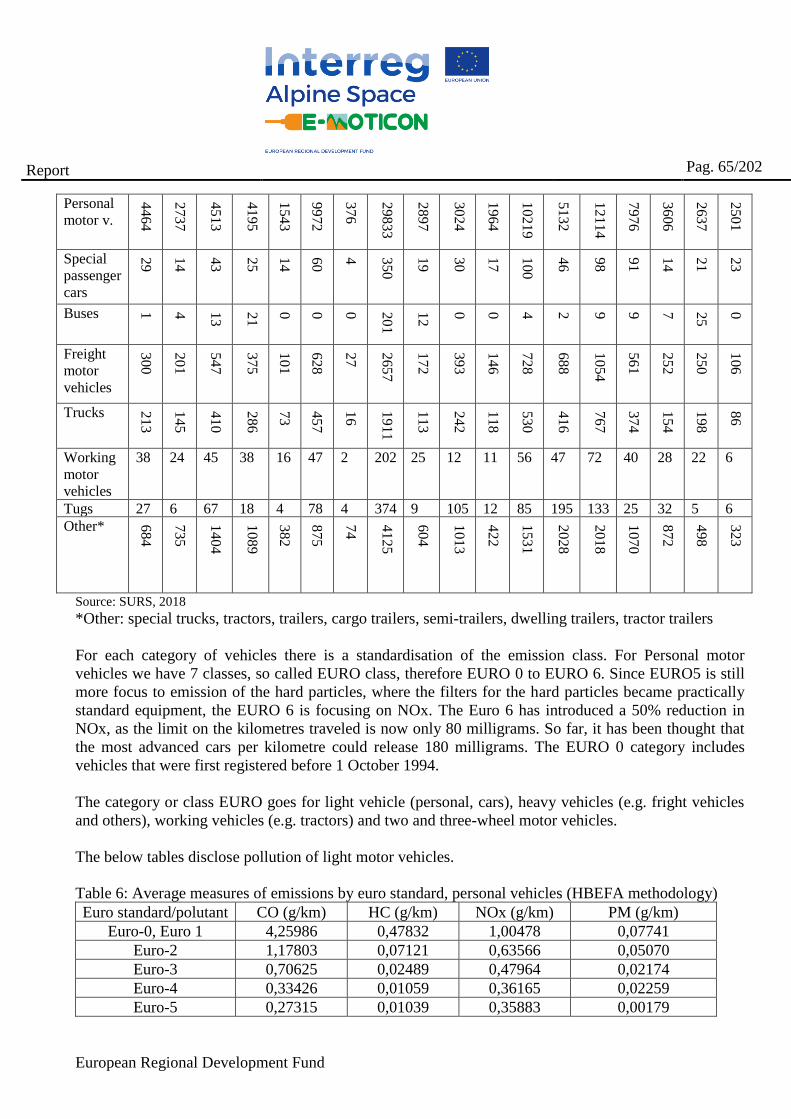
European Regional Development Fund
Report
Pag. 65/202
Personal
motor v.
44
64
27
37
45
13
41
95
15
43
99
72
37
6
29
83
3
28
97
30
24
19
64
10
21
9
51
32
12
11
4
79
76
36
06
26
37
25
01
Special
passenger
cars
29
14
43
25
14
60
4
35
0
19
30
17
10
0
46
98
91
14
21
23
Buses 1
4
13
21
0
0
0
20
1
12
0
0
4
2
9
9
7
25
0
Freight
motor
vehicles
30
0
20
1
54
7
37
5
10
1
62
8
27
26
57
17
2
39
3
14
6
72
8
68
8
10
54
56
1
25
2
25
0
10
6
Trucks 21
3
14
5
41
0
28
6
73
45
7
16
19
11
11
3
24
2
11
8
53
0
41
6
76
7
37
4
15
4
19
8
86
Working
motor
vehicles
38 24 45 38 16 47 2 202 25 12 11 56 47 72 40 28 22 6
Tugs 27 6 67 18 4 78 4 374 9 105 12 85 195 133 25 32 5 6
Other* 684
735
1404
1089
382
875
74
4125
604
1013
422
1531
2028
2018
1070
872
498
323
Source: SURS, 2018
*Other: special trucks, tractors, trailers, cargo trailers, semi-trailers, dwelling trailers, tractor trailers
For each category of vehicles there is a standardisation of the emission class. For Personal motor
vehicles we have 7 classes, so called EURO class, therefore EURO 0 to EURO 6. Since EURO5 is still
more focus to emission of the hard particles, where the filters for the hard particles became practically
standard equipment, the EURO 6 is focusing on NOx. The Euro 6 has introduced a 50% reduction in
NOx, as the limit on the kilometres traveled is now only 80 milligrams. So far, it has been thought that
the most advanced cars per kilometre could release 180 milligrams. The EURO 0 category includes
vehicles that were first registered before 1 October 1994.
The category or class EURO goes for light vehicle (personal, cars), heavy vehicles (e.g. fright vehicles
and others), working vehicles (e.g. tractors) and two and three-wheel motor vehicles.
The below tables disclose pollution of light motor vehicles.
Table 6: Average measures of emissions by euro standard, personal vehicles (HBEFA methodology)
Euro standard/polutant CO (g/km) HC (g/km) NOx (g/km) PM (g/km)
Euro-0, Euro 1 4,25986 0,47832 1,00478 0,07741
Euro-2 1,17803 0,07121 0,63566 0,05070
Euro-3 0,70625 0,02489 0,47964 0,02174
Euro-4 0,33426 0,01059 0,36165 0,02259
Euro-5 0,27315 0,01039 0,35883 0,00179
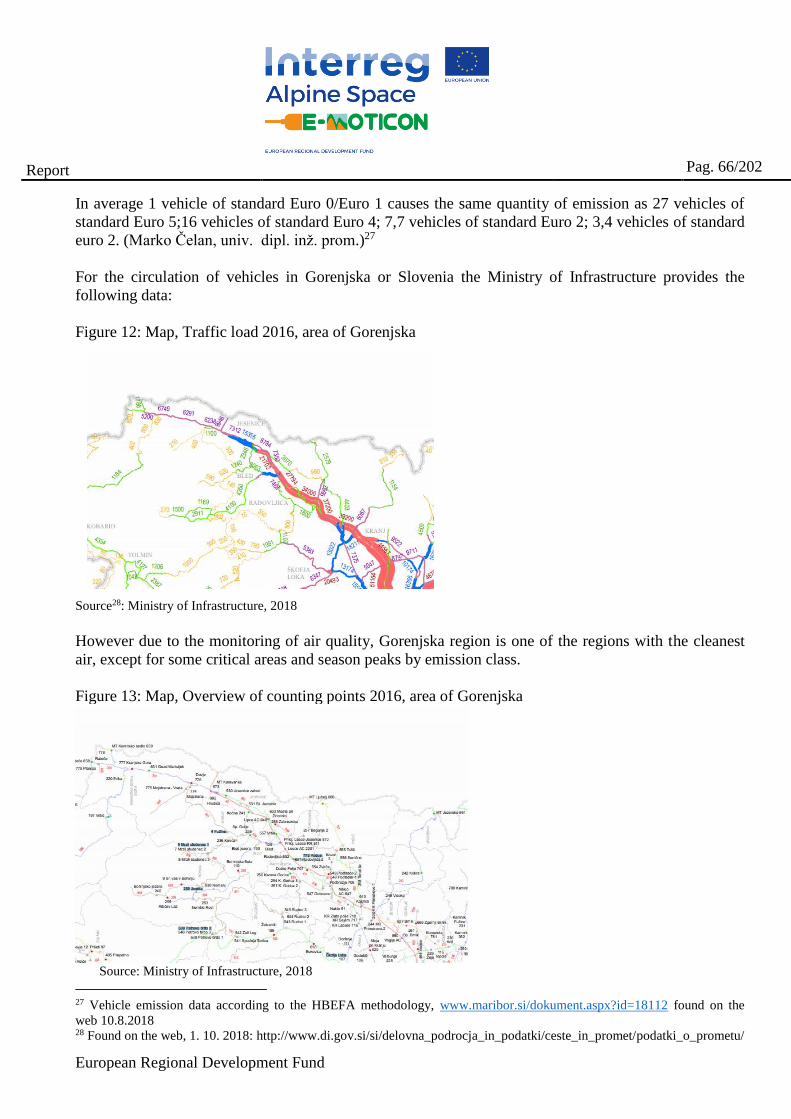
European Regional Development Fund
Report
Pag. 66/202
In average 1 vehicle of standard Euro 0/Euro 1 causes the same quantity of emission as 27 vehicles of
standard Euro 5;16 vehicles of standard Euro 4; 7,7 vehicles of standard Euro 2; 3,4 vehicles of standard
euro 2. (Marko Čelan, univ. dipl. inž. prom.)27
For the circulation of vehicles in Gorenjska or Slovenia the Ministry of Infrastructure provides the
following data:
Figure 12: Map, Traffic load 2016, area of Gorenjska
Source28: Ministry of Infrastructure, 2018
However due to the monitoring of air quality, Gorenjska region is one of the regions with the cleanest
air, except for some critical areas and season peaks by emission class.
Figure 13: Map, Overview of counting points 2016, area of Gorenjska
Source: Ministry of Infrastructure, 2018
27 Vehicle emission data according to the HBEFA methodology, www.maribor.si/dokument.aspx?id=18112 found on the
web 10.8.2018 28 Found on the web, 1. 10. 2018: http://www.di.gov.si/si/delovna_podrocja_in_podatki/ceste_in_promet/podatki_o_prometu/
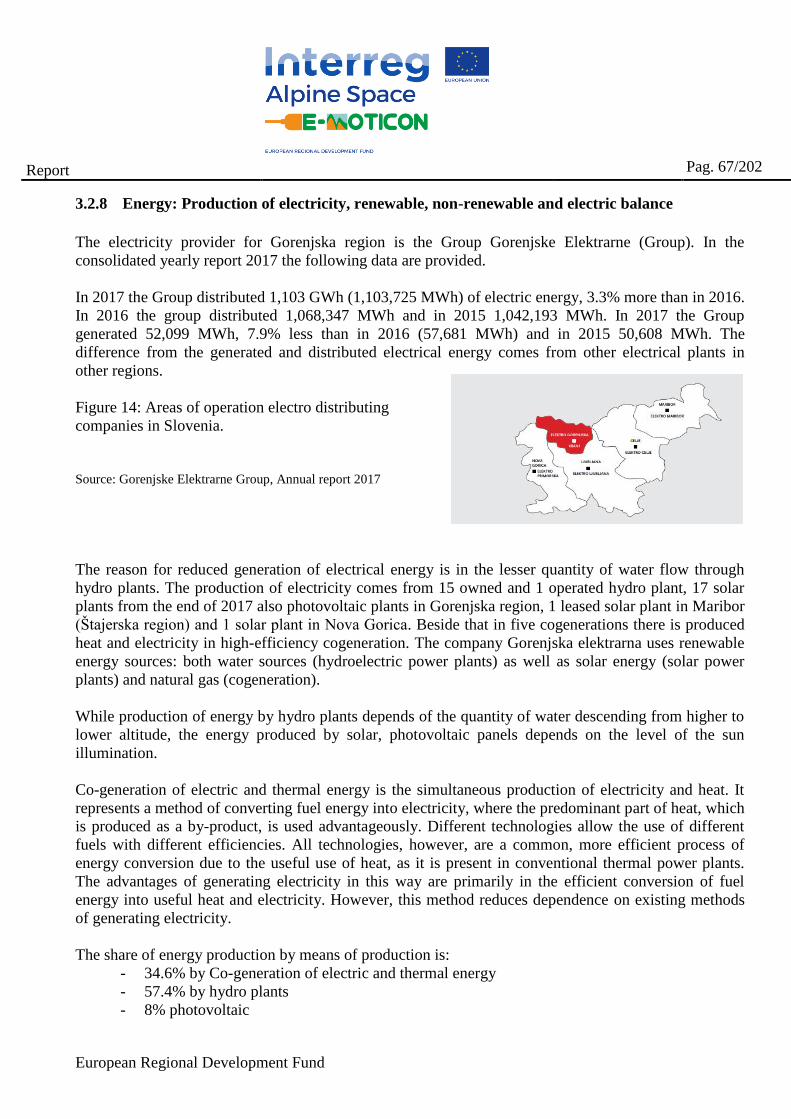
European Regional Development Fund
Report
Pag. 67/202
3.2.8 Energy: Production of electricity, renewable, non-renewable and electric balance
The electricity provider for Gorenjska region is the Group Gorenjske Elektrarne (Group). In the
consolidated yearly report 2017 the following data are provided.
In 2017 the Group distributed 1,103 GWh (1,103,725 MWh) of electric energy, 3.3% more than in 2016.
In 2016 the group distributed 1,068,347 MWh and in 2015 1,042,193 MWh. In 2017 the Group
generated 52,099 MWh, 7.9% less than in 2016 (57,681 MWh) and in 2015 50,608 MWh. The
difference from the generated and distributed electrical energy comes from other electrical plants in
other regions.
Figure 14: Areas of operation electro distributing
companies in Slovenia.
Source: Gorenjske Elektrarne Group, Annual report 2017
The reason for reduced generation of electrical energy is in the lesser quantity of water flow through
hydro plants. The production of electricity comes from 15 owned and 1 operated hydro plant, 17 solar
plants from the end of 2017 also photovoltaic plants in Gorenjska region, 1 leased solar plant in Maribor
(Štajerska region) and 1 solar plant in Nova Gorica. Beside that in five cogenerations there is produced
heat and electricity in high-efficiency cogeneration. The company Gorenjska elektrarna uses renewable
energy sources: both water sources (hydroelectric power plants) as well as solar energy (solar power
plants) and natural gas (cogeneration).
While production of energy by hydro plants depends of the quantity of water descending from higher to
lower altitude, the energy produced by solar, photovoltaic panels depends on the level of the sun
illumination.
Co-generation of electric and thermal energy is the simultaneous production of electricity and heat. It
represents a method of converting fuel energy into electricity, where the predominant part of heat, which
is produced as a by-product, is used advantageously. Different technologies allow the use of different
fuels with different efficiencies. All technologies, however, are a common, more efficient process of
energy conversion due to the useful use of heat, as it is present in conventional thermal power plants.
The advantages of generating electricity in this way are primarily in the efficient conversion of fuel
energy into useful heat and electricity. However, this method reduces dependence on existing methods
of generating electricity.
The share of energy production by means of production is:
- 34.6% by Co-generation of electric and thermal energy
- 57.4% by hydro plants
- 8% photovoltaic
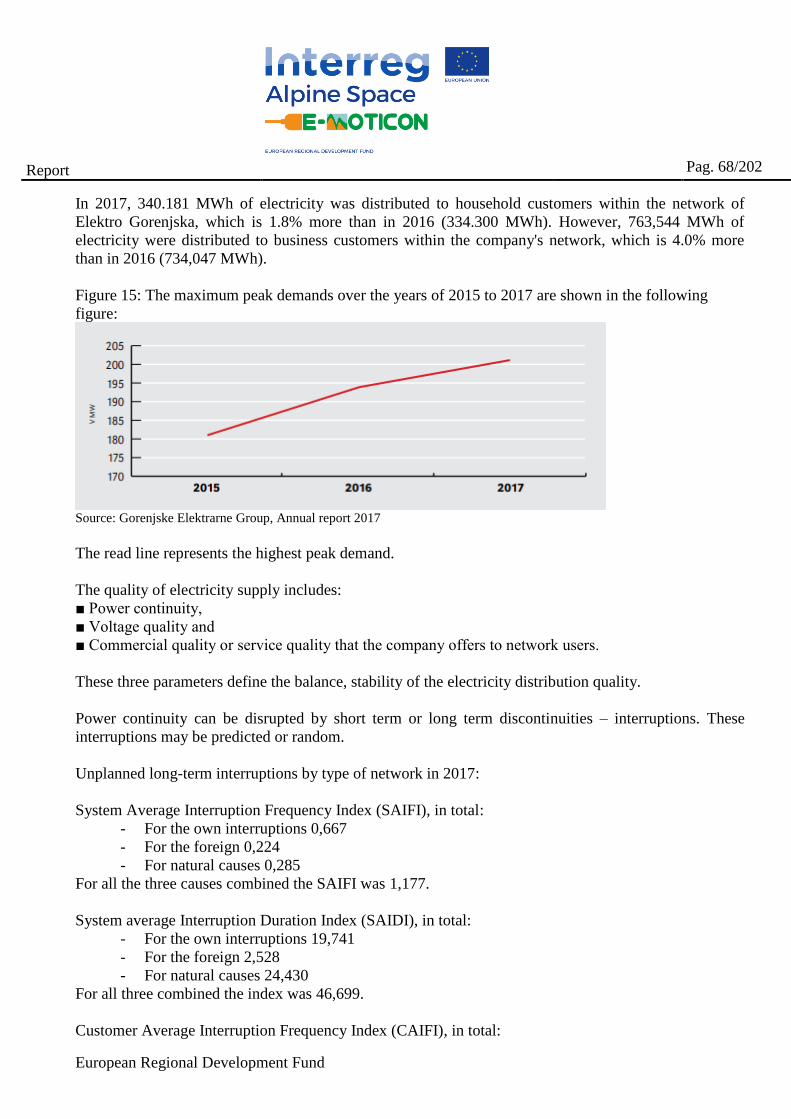
European Regional Development Fund
Report
Pag. 68/202
In 2017, 340.181 MWh of electricity was distributed to household customers within the network of
Elektro Gorenjska, which is 1.8% more than in 2016 (334.300 MWh). However, 763,544 MWh of
electricity were distributed to business customers within the company's network, which is 4.0% more
than in 2016 (734,047 MWh).
Figure 15: The maximum peak demands over the years of 2015 to 2017 are shown in the following
figure:
Source: Gorenjske Elektrarne Group, Annual report 2017
The read line represents the highest peak demand.
The quality of electricity supply includes:
■ Power continuity,
■ Voltage quality and
■ Commercial quality or service quality that the company offers to network users.
These three parameters define the balance, stability of the electricity distribution quality.
Power continuity can be disrupted by short term or long term discontinuities – interruptions. These
interruptions may be predicted or random.
Unplanned long-term interruptions by type of network in 2017:
System Average Interruption Frequency Index (SAIFI), in total:
- For the own interruptions 0,667
- For the foreign 0,224
- For natural causes 0,285
For all the three causes combined the SAIFI was 1,177.
System average Interruption Duration Index (SAIDI), in total:
- For the own interruptions 19,741
- For the foreign 2,528
- For natural causes 24,430
For all three combined the index was 46,699.
Customer Average Interruption Frequency Index (CAIFI), in total:
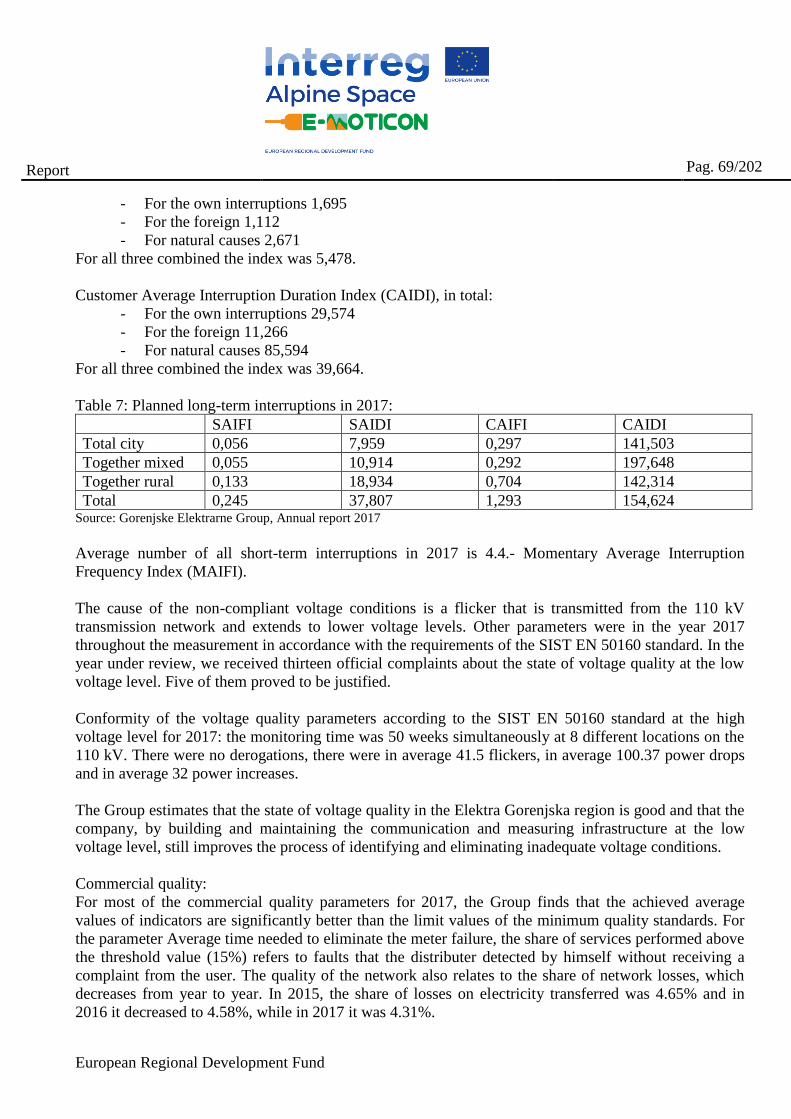
European Regional Development Fund
Report
Pag. 69/202
- For the own interruptions 1,695
- For the foreign 1,112
- For natural causes 2,671
For all three combined the index was 5,478.
Customer Average Interruption Duration Index (CAIDI), in total:
- For the own interruptions 29,574
- For the foreign 11,266
- For natural causes 85,594
For all three combined the index was 39,664.
Table 7: Planned long-term interruptions in 2017:
SAIFI SAIDI CAIFI CAIDI
Total city 0,056 7,959 0,297 141,503
Together mixed 0,055 10,914 0,292 197,648
Together rural 0,133 18,934 0,704 142,314
Total 0,245 37,807 1,293 154,624 Source: Gorenjske Elektrarne Group, Annual report 2017
Average number of all short-term interruptions in 2017 is 4.4.- Momentary Average Interruption
Frequency Index (MAIFI).
The cause of the non-compliant voltage conditions is a flicker that is transmitted from the 110 kV
transmission network and extends to lower voltage levels. Other parameters were in the year 2017
throughout the measurement in accordance with the requirements of the SIST EN 50160 standard. In the
year under review, we received thirteen official complaints about the state of voltage quality at the low
voltage level. Five of them proved to be justified.
Conformity of the voltage quality parameters according to the SIST EN 50160 standard at the high
voltage level for 2017: the monitoring time was 50 weeks simultaneously at 8 different locations on the
110 kV. There were no derogations, there were in average 41.5 flickers, in average 100.37 power drops
and in average 32 power increases.
The Group estimates that the state of voltage quality in the Elektra Gorenjska region is good and that the
company, by building and maintaining the communication and measuring infrastructure at the low
voltage level, still improves the process of identifying and eliminating inadequate voltage conditions.
Commercial quality:
For most of the commercial quality parameters for 2017, the Group finds that the achieved average
values of indicators are significantly better than the limit values of the minimum quality standards. For
the parameter Average time needed to eliminate the meter failure, the share of services performed above
the threshold value (15%) refers to faults that the distributer detected by himself without receiving a
complaint from the user. The quality of the network also relates to the share of network losses, which
decreases from year to year. In 2015, the share of losses on electricity transferred was 4.65% and in
2016 it decreased to 4.58%, while in 2017 it was 4.31%.
European Regional Development Fund
Report
Pag. 70/202
3.2.9 Air Quality
Air quality in Gorenjska region is measured on 2 locations, in the municipality of Kranj and Škofja
Loka. In Kranj there is a standard measuring point, whereas in Škofja Loka the testing measurements of
the air quality were done 3 times, once in 2007 and another time in 2012 and the third time in 2018,
from January till April, with temporary measuring stations at different locations. The devices measure
dust particles, nitrogen oxides, ozone and carbon monoxide in the air, noise levels, and temperature,
humidity and pressure from meteorological data. The measurements showed a higher air pollution in
winter when the limit values for PM10 particles were exceeded occasionally in ambient air, although the
exceedance was lower than the allowed 35 exceedances per year. Similarly, they were measured in the
measurement of ozone concentrations: average measured values during the measurement period do not
exceed the limit values, but the maximum measured hourly concentrations exceeded the threshold value
by 35 percent.29 In Škofja Loka it is known that the greatest air pollution is caused by traffic, solid fuels
and some major industrial plants, while the greatest threat to health is in winter particles in the air and in
the summer of the lower ozone.
The measurement in Kranj showed that the main reasons for air pollution are traffic and heating of the
buildings with fossil fuels and wood and the use of them in factories. In 2018 the concentration of PM10
particles has been exceeded in February 3 times and in March 7 times. For Kranj the measures were to
reduce air pollution was made by Government of the Republic of Slovenia in December 2013. The
measures were defined by long and short measures. The long term refer to investment projects tackling
different kinds of change in heating systems and measures that increase energy efficiency of buildings.
Short term measures refer to tackling the problem at the moment when the concentrations of air
pollutants increase and exceed the thresholds. These measures are:
- reduce the heating of residential and commercial premises where liquid or solid fuels are used as
energy products;
- use fuel to heat rooms that release lower particulate emissions if they have this possibility;
- use public transport;
- reduce the use of passenger cars;
-call upon the people not to carry out outdoor activities in which large quantities of particles are
released.30
Now the measurements on the air quality are also moved on Krvavec, which is in the Municipality of
Cerklje na Gorenjskem. The altitude enables to measure influences of pollutants that may derive from
the airport and all the neighbour municipalities like Šenčur and Kranj.
It has been noticed in 2012 that the city of Jesenice in the Municipality Jesenice also has a problem with
air quality because of the traffic and metallurgy industry, however no measurements are mentioned.
At the measuring locations across Slovenia the table for the year 2017 shows the following:
29 http://gorenjskiglas.si/article/20180305/C/180309906/1020/merijo-kakovost-zraka-in-hrup, 218, August 30 https://uradni-list.si/glasilo-uradni-list-rs/vsebina/2013-01-3945/odlok-o-nacrtu-za-kakovost-zraka-na-obmocju-mestne-
obcine-kranj. August 2018
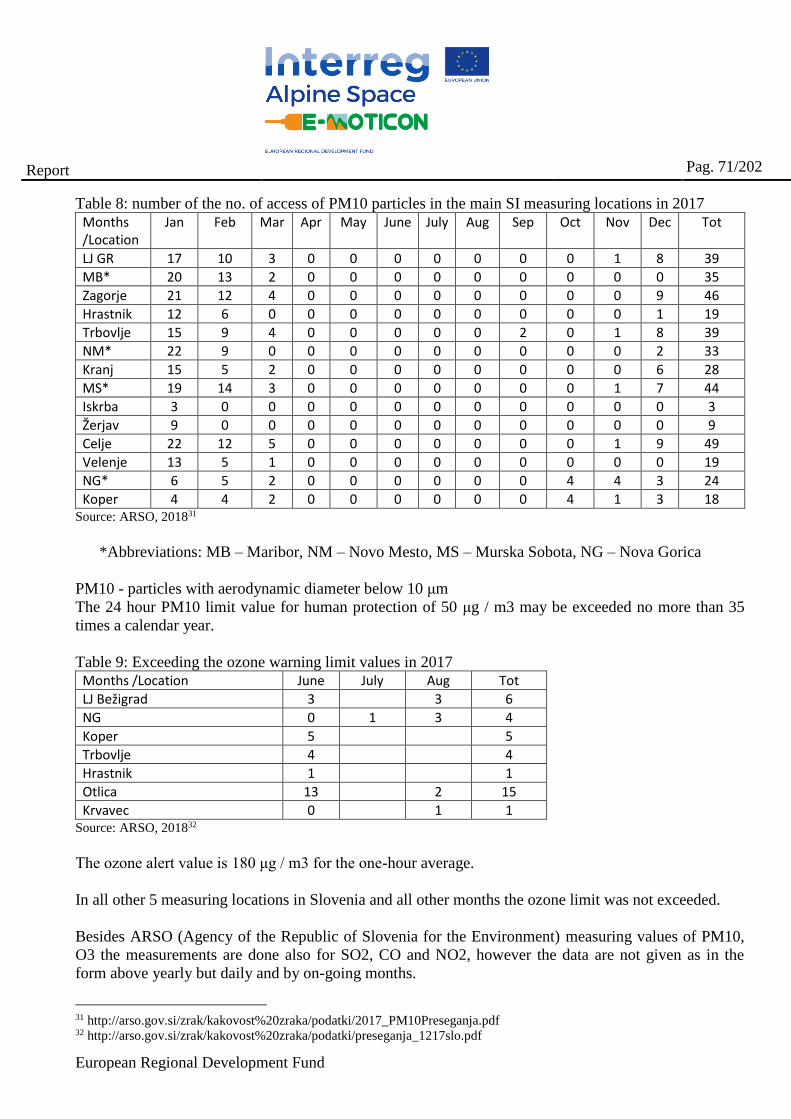
European Regional Development Fund
Report
Pag. 71/202
Table 8: number of the no. of access of PM10 particles in the main SI measuring locations in 2017
Months /Location
Jan Feb Mar Apr May June July Aug Sep Oct Nov Dec Tot
LJ GR 17 10 3 0 0 0 0 0 0 0 1 8 39
MB* 20 13 2 0 0 0 0 0 0 0 0 0 35
Zagorje 21 12 4 0 0 0 0 0 0 0 0 9 46
Hrastnik 12 6 0 0 0 0 0 0 0 0 0 1 19
Trbovlje 15 9 4 0 0 0 0 0 2 0 1 8 39
NM* 22 9 0 0 0 0 0 0 0 0 0 2 33
Kranj 15 5 2 0 0 0 0 0 0 0 0 6 28
MS* 19 14 3 0 0 0 0 0 0 0 1 7 44
Iskrba 3 0 0 0 0 0 0 0 0 0 0 0 3
Žerjav 9 0 0 0 0 0 0 0 0 0 0 0 9
Celje 22 12 5 0 0 0 0 0 0 0 1 9 49
Velenje 13 5 1 0 0 0 0 0 0 0 0 0 19
NG* 6 5 2 0 0 0 0 0 0 4 4 3 24
Koper 4 4 2 0 0 0 0 0 0 4 1 3 18 Source: ARSO, 201831
*Abbreviations: MB – Maribor, NM – Novo Mesto, MS – Murska Sobota, NG – Nova Gorica
PM10 - particles with aerodynamic diameter below 10 μm
The 24 hour PM10 limit value for human protection of 50 μg / m3 may be exceeded no more than 35
times a calendar year.
Table 9: Exceeding the ozone warning limit values in 2017 Months /Location June July Aug Tot
LJ Bežigrad 3 3 6
NG 0 1 3 4
Koper 5 5
Trbovlje 4 4
Hrastnik 1 1
Otlica 13 2 15
Krvavec 0 1 1 Source: ARSO, 201832
The ozone alert value is 180 μg / m3 for the one-hour average.
In all other 5 measuring locations in Slovenia and all other months the ozone limit was not exceeded.
Besides ARSO (Agency of the Republic of Slovenia for the Environment) measuring values of PM10,
O3 the measurements are done also for SO2, CO and NO2, however the data are not given as in the
form above yearly but daily and by on-going months.
31 http://arso.gov.si/zrak/kakovost%20zraka/podatki/2017_PM10Preseganja.pdf 32 http://arso.gov.si/zrak/kakovost%20zraka/podatki/preseganja_1217slo.pdf

European Regional Development Fund
Report
Pag. 72/202
In general the most polluted regions in terms of air quality are Osrednje-Slovenska, the capital of
Ljubljana and its area, Štajerska region, area around Maribor and Murska Sobota, area of Celje in
Savinjska region. In these areas the value of PM10 was in 2017 form 35.1 μg / m3 to 40 μg / m3 in
average. Gorenjska, in the same year had values of PM10 below 20 μg / m3 in average. However peaks
may be seen in the table no. 9 above.
3.2.10 Turism
Gorenjska region is almost entirely an Alpine region. The landscape is mountainous and its large part
belongs to the Triglav National Park, where there is also the highest Slovenian mountain Triglav (2864
m).
Important tourist areas in the Gorenjska region are:
Kranjska Gora in the Zgornjesavska Valley is attractive for visitors in the summer (alpinism, hiking,
biking, fishing ...), as well as winter (skiing, sledding).
Planica is an annual event of the World Cup final in ski jumping, as well as Pokljuka's sporting venue,
which year round hosts the best biathlons in the world.
Bled and Bohinj municipalities have lakes and nature that attract many.
Kranj, is popular for the famous poet France Prešern, Jože Plečnik, the most important Slovenian
architect, river Sava and other tourist sights.
Other important places are Škofja Loka, Radovljica, Brezje, Begunje, Vrba, Žirovnica and Tržič.33
Gorenjska region offers nature experience, adventures, sport activities, traditional and modern cuisine
and has a rich cultural heritage. It is also well positioned it terms of fast connectivity to Austria, Italy
and Ljubljana.
The map below shows the tourist more visited places in Gorenjska.
33 https://viaslovenia.com/sl/slovenija/gorenjska.html
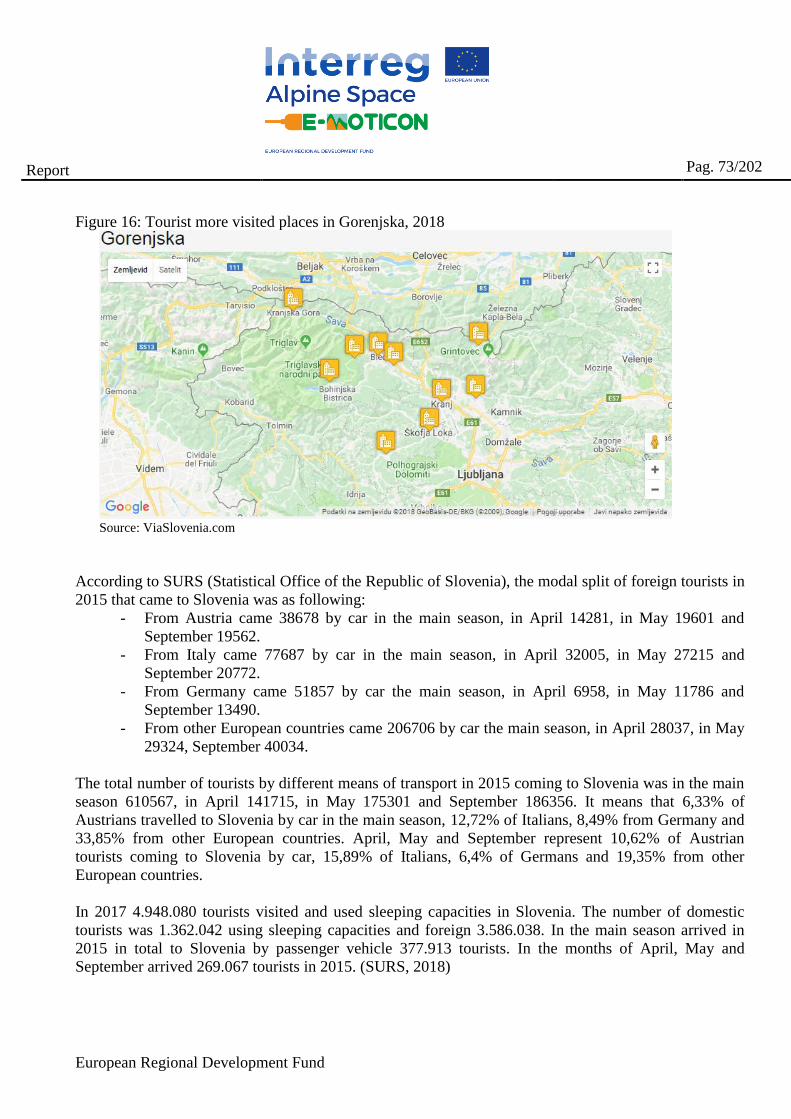
European Regional Development Fund
Report
Pag. 73/202
Figure 16: Tourist more visited places in Gorenjska, 2018
Source: ViaSlovenia.com
According to SURS (Statistical Office of the Republic of Slovenia), the modal split of foreign tourists in
2015 that came to Slovenia was as following:
- From Austria came 38678 by car in the main season, in April 14281, in May 19601 and
September 19562.
- From Italy came 77687 by car in the main season, in April 32005, in May 27215 and
September 20772.
- From Germany came 51857 by car the main season, in April 6958, in May 11786 and
September 13490.
- From other European countries came 206706 by car the main season, in April 28037, in May
29324, September 40034.
The total number of tourists by different means of transport in 2015 coming to Slovenia was in the main
season 610567, in April 141715, in May 175301 and September 186356. It means that 6,33% of
Austrians travelled to Slovenia by car in the main season, 12,72% of Italians, 8,49% from Germany and
33,85% from other European countries. April, May and September represent 10,62% of Austrian
tourists coming to Slovenia by car, 15,89% of Italians, 6,4% of Germans and 19,35% from other
European countries.
In 2017 4.948.080 tourists visited and used sleeping capacities in Slovenia. The number of domestic
tourists was 1.362.042 using sleeping capacities and foreign 3.586.038. In the main season arrived in
2015 in total to Slovenia by passenger vehicle 377.913 tourists. In the months of April, May and
September arrived 269.067 tourists in 2015. (SURS, 2018)
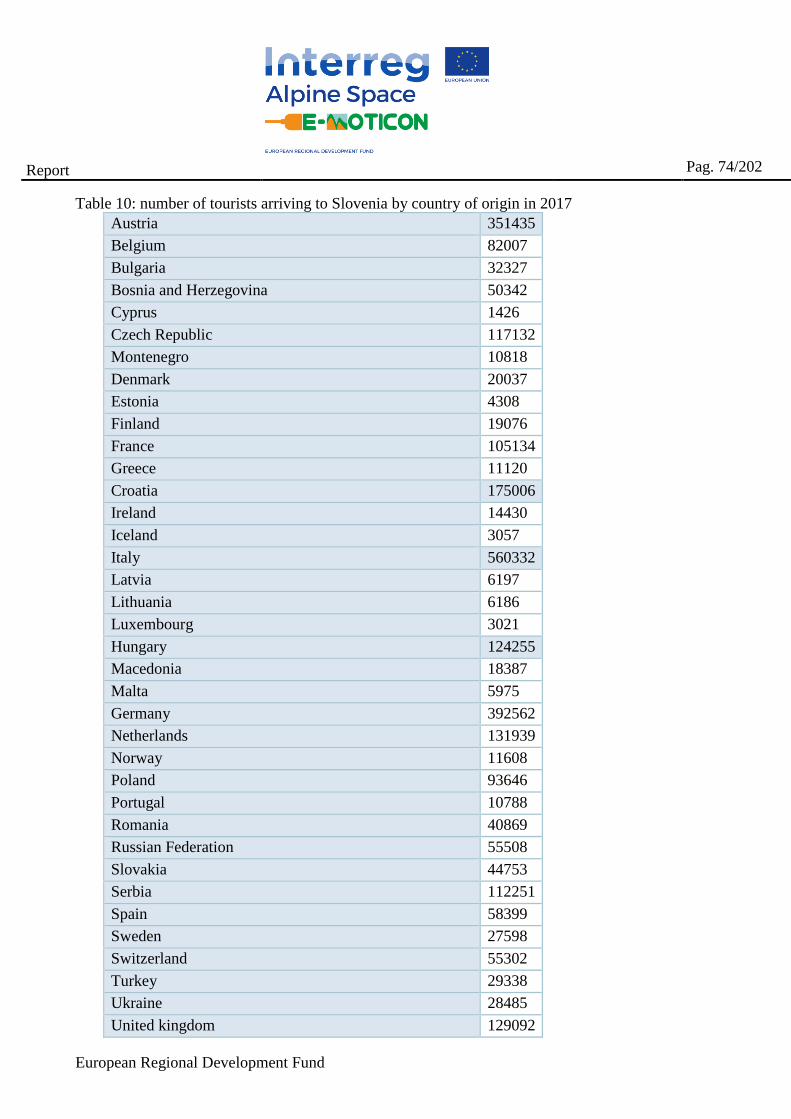
European Regional Development Fund
Report
Pag. 74/202
Table 10: number of tourists arriving to Slovenia by country of origin in 2017
Austria 351435
Belgium 82007
Bulgaria 32327
Bosnia and Herzegovina 50342
Cyprus 1426
Czech Republic 117132
Montenegro 10818
Denmark 20037
Estonia 4308
Finland 19076
France 105134
Greece 11120
Croatia 175006
Ireland 14430
Iceland 3057
Italy 560332
Latvia 6197
Lithuania 6186
Luxembourg 3021
Hungary 124255
Macedonia 18387
Malta 5975
Germany 392562
Netherlands 131939
Norway 11608
Poland 93646
Portugal 10788
Romania 40869
Russian Federation 55508
Slovakia 44753
Serbia 112251
Spain 58399
Sweden 27598
Switzerland 55302
Turkey 29338
Ukraine 28485
United kingdom 129092
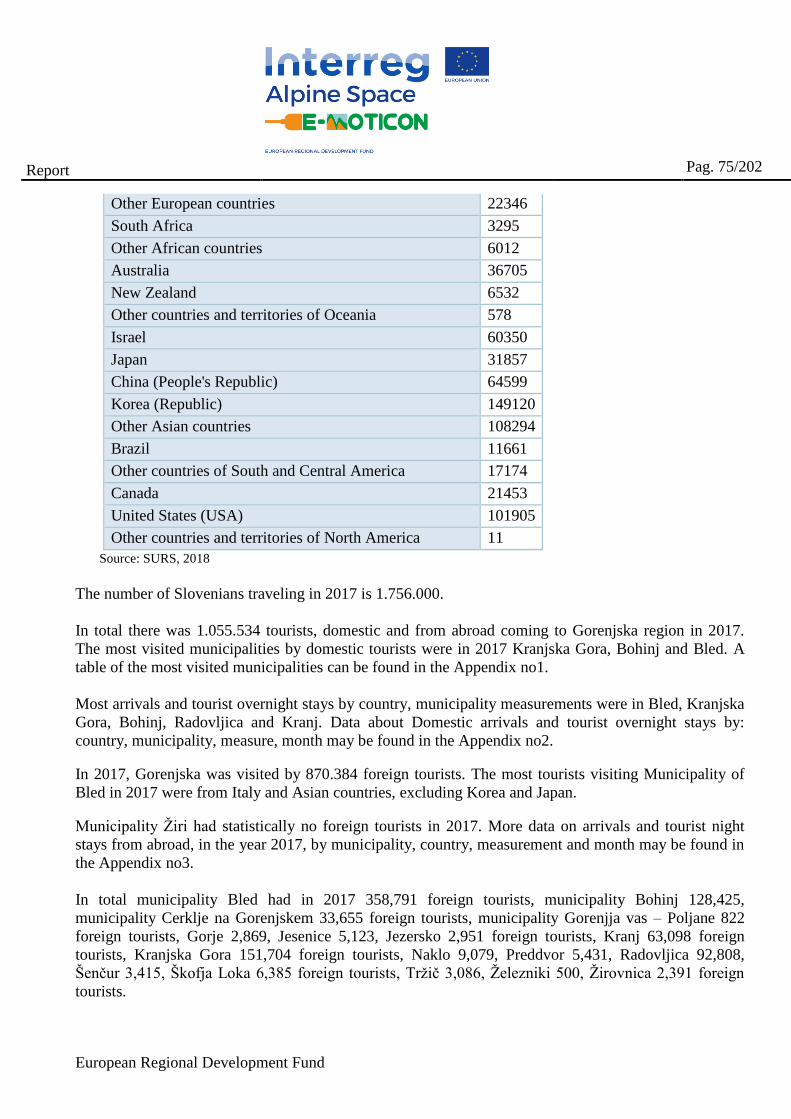
European Regional Development Fund
Report
Pag. 75/202
Other European countries 22346
South Africa 3295
Other African countries 6012
Australia 36705
New Zealand 6532
Other countries and territories of Oceania 578
Israel 60350
Japan 31857
China (People's Republic) 64599
Korea (Republic) 149120
Other Asian countries 108294
Brazil 11661
Other countries of South and Central America 17174
Canada 21453
United States (USA) 101905
Other countries and territories of North America 11
Source: SURS, 2018
The number of Slovenians traveling in 2017 is 1.756.000.
In total there was 1.055.534 tourists, domestic and from abroad coming to Gorenjska region in 2017.
The most visited municipalities by domestic tourists were in 2017 Kranjska Gora, Bohinj and Bled. A
table of the most visited municipalities can be found in the Appendix no1.
Most arrivals and tourist overnight stays by country, municipality measurements were in Bled, Kranjska
Gora, Bohinj, Radovljica and Kranj. Data about Domestic arrivals and tourist overnight stays by:
country, municipality, measure, month may be found in the Appendix no2.
In 2017, Gorenjska was visited by 870.384 foreign tourists. The most tourists visiting Municipality of
Bled in 2017 were from Italy and Asian countries, excluding Korea and Japan.
Municipality Žiri had statistically no foreign tourists in 2017. More data on arrivals and tourist night
stays from abroad, in the year 2017, by municipality, country, measurement and month may be found in
the Appendix no3.
In total municipality Bled had in 2017 358,791 foreign tourists, municipality Bohinj 128,425,
municipality Cerklje na Gorenjskem 33,655 foreign tourists, municipality Gorenjja vas – Poljane 822
foreign tourists, Gorje 2,869, Jesenice 5,123, Jezersko 2,951 foreign tourists, Kranj 63,098 foreign
tourists, Kranjska Gora 151,704 foreign tourists, Naklo 9,079, Preddvor 5,431, Radovljica 92,808,
Šenčur 3,415, Škofja Loka 6,385 foreign tourists, Tržič 3,086, Železniki 500, Žirovnica 2,391 foreign
tourists.
European Regional Development Fund
Report
Pag. 76/202
3.3 Electro mobility description
At the end of 2017, 51% of registered passenger cars were petrol vehicles and 47% on diesel. The
number of "petrol vehicles" decreased by 2% compared to 2016, and the number of "diesel" increased
by 6%. The number of passenger cars for liquefied petroleum gas (LPG or LPG) and combinations with
the aforementioned fuel increased by 6%, the number of passenger cars on compressed natural gas (SZP
or CNG) and on combinations with the mentioned fuel by 39%. The number of hybrid passenger cars
increased by 59% and exceeded the limit of 3,000. The number of electric passenger cars increased by
70%. (SURS, 2018) At the end of 2017 there were 600 of BEV category M1. M1 means vehicles with
up to 8 passenger seats beside the driver seat. Out of these 600, there were 30 registered in Gorenjska.34
In Slovenia the number of E-CS on one of the informational points amounted to 276 in 2018. However
this data are not indicating the total number of the E-CS, because the E-CSs from other service providers
are not necessarily included. The other issue is that not all public E-CS are mapped. Tesla E-CSs are not
included in this count. According to Tesla data there should be 19 Tesla E-CS in Slovenia.
There is by the available data now 28 E-CS with 1 Tesla, set up in Gorenjska region, however they are
12 new public E-CSs predicted just in Bled. Most of them should be set up by the end of 2018.
In the Appendix no4 there is a list of E-CS in Gorenjska region by location, specification, owner,
operator … by the end of 2018.
They are 3 informational portals in Slovenia, providing the location and technical specification of the E-
CS. The informational platform http://www.polni.si/ hasn’t been updated for a long time,
https://www.gremonaelektriko.si/ and https://www.napolni.me/app/map_4.php map also some of the E-
CS that are in the operation and ownership of their competitor, however they provide the technical
specification, not operation data. Service provider, owner and electricity distributer Petrol JSC, has a list
of the E-CS in his operation and ownership listed on its website, however mostly the ones on the
highways. Petrol provides a payment solution by APP and RFID card. Help lone is established by all
interoperable E-CSs. Charging tariff is provided by Petrol in the form of packages. The basic package
costs 0.20 EUR per minute and allows charging on the E-CS from 22.01 kW to 50 kW. Package
Enthusiast offers annual binding contract for 10.4 EUR per month, in this case the first minute is
additionally billed 0.11 EUR per minute when one charges on the E-CS with 22kW to 50kW. There is
20% discount in this package if one charges Petrol’s electricity and has 20EUR bonus on the Petrol’s
club card. The package Free of worries 15,000, costs 39EUR per month with annual binding contract,
the quantity of 225kWh on all the sockets and from this 170kWh on the sockets above 22,01kWh. The
customer has 20% discount also with this package if charging Petrol’s electricity and 40EUR bonus on
the Petrol’s club card. These tariffs are gained from the Petrol’s website on the 13th of August 2018 and
may change, at this date no other service provider was billing for its services.
34 http://www.gorenjskiglas.si/apps/pbcs.dll/article?AID=/20171002/C/171009978&template=printart
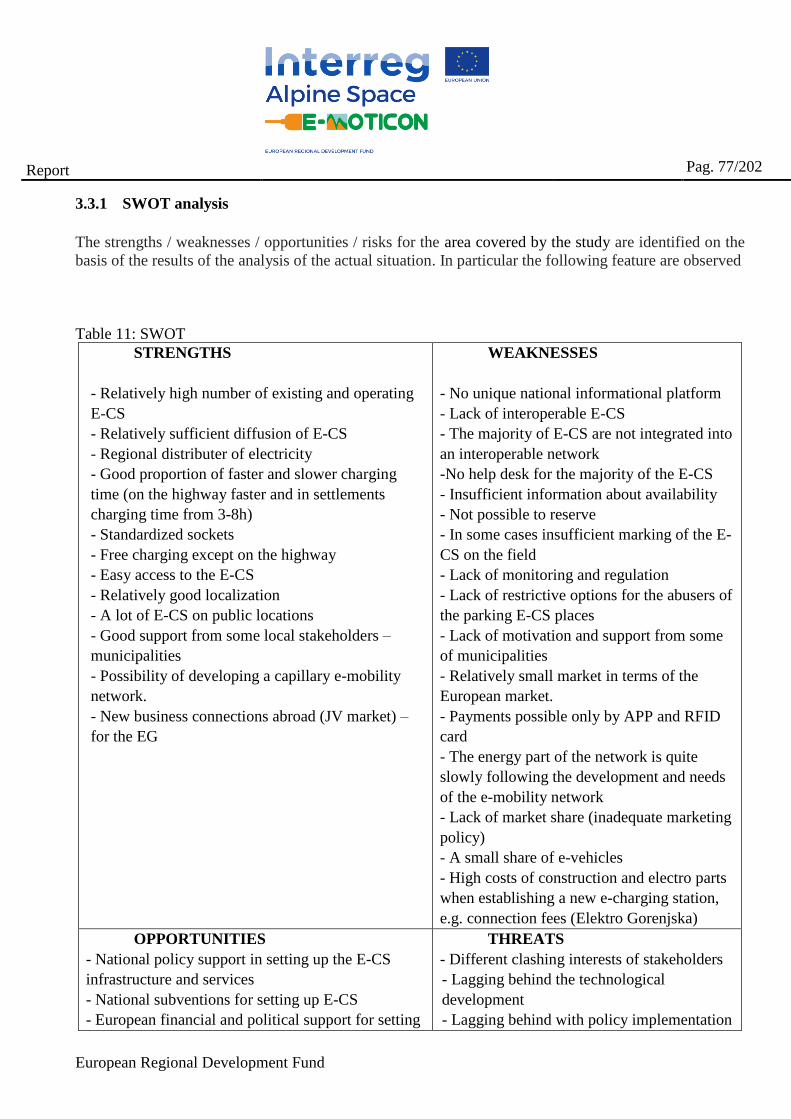
European Regional Development Fund
Report
Pag. 77/202
3.3.1 SWOT analysis
The strengths / weaknesses / opportunities / risks for the area covered by the study are identified on the
basis of the results of the analysis of the actual situation. In particular the following feature are observed
Table 11: SWOT
STRENGTHS
- Relatively high number of existing and operating
E-CS
- Relatively sufficient diffusion of E-CS
- Regional distributer of electricity
- Good proportion of faster and slower charging
time (on the highway faster and in settlements
charging time from 3-8h)
- Standardized sockets
- Free charging except on the highway
- Easy access to the E-CS
- Relatively good localization
- A lot of E-CS on public locations
- Good support from some local stakeholders –
municipalities
- Possibility of developing a capillary e-mobility
network.
- New business connections abroad (JV market) –
for the EG
WEAKNESSES
- No unique national informational platform
- Lack of interoperable E-CS
- The majority of E-CS are not integrated into
an interoperable network
-No help desk for the majority of the E-CS
- Insufficient information about availability
- Not possible to reserve
- In some cases insufficient marking of the E-
CS on the field
- Lack of monitoring and regulation
- Lack of restrictive options for the abusers of
the parking E-CS places
- Lack of motivation and support from some
of municipalities
- Relatively small market in terms of the
European market.
- Payments possible only by APP and RFID
card
- The energy part of the network is quite
slowly following the development and needs
of the e-mobility network
- Lack of market share (inadequate marketing
policy)
- A small share of e-vehicles
- High costs of construction and electro parts
when establishing a new e-charging station,
e.g. connection fees (Elektro Gorenjska)
OPPORTUNITIES
- National policy support in setting up the E-CS
infrastructure and services
- National subventions for setting up E-CS
- European financial and political support for setting
THREATS
- Different clashing interests of stakeholders
- Lagging behind the technological
development
- Lagging behind with policy implementation
European Regional Development Fund
Report
Pag. 78/202
up charging infrastructure
- Lots of good practices from other regions and
abroad – no need of reinventing the wheel
- Expert companies for E-CS interoperable software
development and development of E-CS technology
- Small country, easier to manage and achieve
integration and cohesion
- If all stakeholders in the field of e-mobility
connect, greater transparency and a single service on
the market (what about competitive pricing???)
- Integrated E-CSs network In Slovenia, could
become the part of the European Network of E-CSs
- Competition in the region (is an opportunity to
improve and be also competitive – monopoly is not
good for the user)
- A single information E-CS platform throughout the
region
- Implementation of interoperability in a seamless
European Union,
- National subventions for the purchase of e-vehicles
(7.500 EUR) and hybrid cars (4.500 EUR).
- Relatively small number of users – lack of
the critical mass
- Competition from outside
- Lack of funding
- Lack of investments from electricity
distributers into grids (lack of funds)
- Various platforms with E-CSs control
- Monopolization of e-roaming system
provider, whether domestic or foreign
- Lack of E-CS networks being in a e-
roaming system
- The energy part nationally of the network is
quite slowly following the development and
needs of the e-mobility network
- Security aspects of personal data sharing
and traceability of a single user and trading of
the personal behavioral data.
- Market opening - competitive dynamics.
- A different billing of e-vehicles charging
policy. At present, most e-charging is free of
charge. In spite of its ever-increasing use,
however, e-commerce operators abroad and
home have different prices. Given the fact
that e-vehicles are more expensive than petrol
or diesel ones, it is not cost effective for
someone that travels a lot and abroad to have
it.
3.3.1.1 Strenghts
Relatively high number of existing and operating E-CS relates to the corresponding demand for e-
charging. The positive aspect is also that investors are quickly responding to the market and are even
ahead of it. There is a congestion of E-CS in cities and touristic spots, which again is in line with the
demand. The downside is that they are municipalities that are hesitant in setting up E-CS, therefore not
supporting the promotion of e-mobility, waiting for the private investors or just waiting. On the other
hand these are smaller municipalities with residential houses which are able to have their own e-
charging station if the grid allows. It is sufficient that one has a domestic socket. There is a lot of
potential in home settings, especially since the distances in Slovenia are short. When all service
providers will e-charge upon payment and demand increases, the interest of investment in e-mobility
infrastructure will raise.
European Regional Development Fund
Report
Pag. 79/202
The trend of localisation of E-CS shows a good proportion of faster and slower E-CS charging time. The
E-CSs are placed in front of the shopping centers where people shop for hours and the speed of the e-
charging is adjusted to the consumer habits. The other common placements are in the city on parking
lots and P&R parking lots on the outer limits of the city, at the hotels, public garages and on the
highways. On the highways they are placing the fastest and thus more expensive locations for e-
charging.
The sockets are standardised Type 2, usually Mennekes or CHAdeMO. There is still free e-charging
available, except on the highway, although this is going to change in the near future. A good easy access
with visible signage on the field and a lot of public locations is another positive aspect of the current E-
CS set up, at least at the majority of locations. The interoperable systems are set up, which means a
higher quality of service for the customers also with help line. They are 2 approaches in the promotion
of e-mobility, the municipalities who are pro, support it all the way, thus slowly also changing the
mentality of the residents and the ones who are hesitant are not yet planning or investing. The last are
usually the municipalities that are not very touristic and also not so much the first choice for the private
investors.
Regional distributers of electricity are also owners and operators and service providers of e-charging.
The electricity is relatively cheap, since the systems of electricity production are already set up and are
producing energy from renewable resources like sun and water. There is also a possibility to set up a
capillary e-mobility network, more dispersed setups of E-CS with smaller settings for fast and easy use.
From the investors’ side, the knowledge companies in Slovenia poses is competitive world wide
however they are small companies and the Western Europe is already taken over by other companies,
therefor the opportunity they see is in the new business connections abroad, JV market, setting up
interoperable E-CS infrastructure with the readiness to be included into roaming systems.
In general there is much strength to be emphasized and show that the e-mobility with the interoperable
infrastructure is in progress even if in some of the areas it is still in the initial stages.
3.3.1.2 Weaknesses
The diffusion of E-CS means also giving the user the information where the E-CS is located, the
technical specification and weather is operational. Since they are several service providers these service
providers have established their own informational platforms or joined existing eRoaming platforms that
are closed. This means that if the user who does not have a contract with this service provider or is not
registered cannot see the basic information about the operation of those E-SCs. These discrepancy calls
for a unique national informational platform open to everyone with basic information on location,
technical specifics and operation. This platform would be useful also for statistic monitoring,
regulations, research purposes, knowing where and what kind of E-CSs were set up – if they are
interoperable etc. There are interoperable E-CSs however it is hard to establish the number and location
of them. The same goes for the integration of a single E-CS into the interoperable network. However it
is owner’s prerogative to choose if the E-CS will be included in any network.
European Regional Development Fund
Report
Pag. 80/202
Without E-CS network it is difficult to establish 24/7 help line to assist the customers and at this
moment there are networks or single E-CS that do not provide a telephone number available for support.
Insufficient information about availability is connected to provision of information platforms, apps or
other channels. At this moment a weakness is still that charging cannot be reserved in most of the cases.
When user is not familiar with the area and doesn’t know where to find E-CS a good marking on the
field is necessary. Not all the cases are sufficiently marked on the field. This is especially true for single
standing E-CS units. Hidden installation of E-CS or visible, since free parking is provided, users of
conventional cars are parking on places dedicated for e-charging. Restrictive measures for the abusers
are scarce.
However the most concerning weakness related to the influence and power of public administration is
that still some of the municipalities are not interested in being involved in the implementation of e-
mobility. Some like ad-hock actions, without planning or getting too deep into the possibilities of their
power. There is a lack of motivation and knowledge and a lack of interest to gain knowledge.
Motivation from the national level needs to be applied.
Since Slovenia has around 2M of residents and although it is a transit country the market is still
relatively small in comparison with the European market. It is a threat that the prices will be high to gain
bigger profits since economy of scale has not a big potential. The smallness also means it’s not
particularly interesting for foreign investors and the monopolization of the market is a possibility. In any
case the Slovenian operators are already targeting foreign markets. Regarding the domestic market there
is still relatively small number of e-vehicles on the roads and the costs of connecting E-CS to the grid
are high.
Payments are possible only by an APP and RFID card. This represents a weakness in a sense of
unavailability to certain groups. European legislation demands that the payments are also possible
without any contracts (that includes on-line registration for the purpose of being able to pay). In Alpine
space countries (e.g. Germany and Italy) E-CS have an integrated option for payments by credit cards.
The costs of the payment system by credit cards are comparable to other two general ways of payment
solutions and can be even lower, because there are no intermediaries.
The energy part of the network is quite slowly following the development and needs of the e-mobility
network.
3.3.1.3 Opportunity
The biggest opportunities for public administration to support diffusion of e-mobility infrastructure
come from the national and European incentives. National policies support setting up the E-CS
infrastructure and services by national subventions (Eco Fund) of 100% for purchase price of an E-CS,
and up to 7500 EUR for purchasing an e-car, 85% of the price for e-public transport or hybrids for
municipalities with air quality measurements, 4500 EUR for hybrid cars and subvention for retrofitted e-
European Regional Development Fund
Report
Pag. 81/202
cars up to 50% of the cost. A Fund for Climate Change, in a way connected to Eco Fund, spent 2M EUR
in 2017 for the purchase of environmentally friendly busses for public transport and offers subventions
also for e-cars and e-infrastructure in 2018 for municipalities indirectly managing protected areas of
nature. Agreement of the regional development signed by municipalities (representatives of
municipalities) and the Ministry of Economic Development can result in millions of financial incentives
just for e-mobility. LEAG is another programme supporting implementation of e-mobility investments.
There is European financial and political support for setting up charging infrastructure and purchase of
hybrid and e-vehicles for public transport. They are several financing programs with return and non-
refundable funds, like loans from EIB, CEF with H2020, EFSI and combination of mentioned financing
models. In the smaller scale also Interreg programmes financed from ERDF may be used to purchase E-
CS or small e-vehicles for public use for the purpose of implementing pilot actions. Programme LIFE is
also one of the financing tools that can be used by municipalities to take measures against negative
climate change.
Transnational cooperation and exchange of good practices from other regions abroad and home provide
knowledge and innovative ideas reducing the need of reinventing the wheel. On the other side Slovenia
has the knowhow for innovation in E-CS technology, E-CS interoperable software development,
competitive worldwide. Since Slovenia is a smaller country it should be easier to manage and achieve
integration of regional E-CS networks into joint network, to achieve this interests of singular companies
have to be overcome. If all stakeholders in the field of e-mobility connect, there would be greater
transparency and a single service on the market, however the price of service should be regulated or kept
competitive. E-CSs networks in Slovenia are becoming a part of the European networks of E-CSs. This
is an upside and the opportunity for those networks not yet being integrated in European networks. At
the moment they are a few service providers for e-charging. Number of competitors in the market
represents an opportunity to improve services and be competitive. The mentioned weakness of having
no unique E-CS informational platform throughout the region, Slovenia, represents an opportunity for
the implementation of interoperability in a seamless European Union and its promotion worldwide.
3.3.1.4 Threats
Different clashing interests of stakeholders may influence the service quality for users, manifesting in
the lack of usable information on E-CS location, best choice of service, technical information,
reservation, payment solutions, different pricing rates and lack of user support service. This is
manifested also in various platforms providing different information or a lack of them and different
managing services.
The technological development of e-mobility is quickly increasing and a threat is that the region and its
public administration will start lagging behind the technological development and policy
implementation. The suggestions from the national level are also not always considered by local public
administration. For example, when building a new parking lot the cables for eventual future set-up of E-
CS are not always considered, even if the cost of the future reconstruction of the infrastructure will be
higher than the cost of already preparing the infrastructure for the future at present. The conscious
European Regional Development Fund
Report
Pag. 82/202
decision of the public administration for not being progressive in the implementation of supportive
policies in favor of e-mobility and infrastructure is based by the relatively small number of users, the
lack of critical mass, providing a driving force of the public administration to be more engaged in the e-
mobility supportive measures.
Market opening and competitive dynamics can work both ways. Slovenian companies penetrating
foreign markets or the other way around. Competition from outside in terms of foreign investors is a
threat to domestic companies trying to penetrate and secure the regional market. Although the
competition can be beneficial for the user and development of higher quality of service and lower prices,
it also means that the economic local multiplicator indicating how fast the money is circulating within a
specific local community is lower, because the profits are not staying within the region.
Lack of funding is a threat for the future when the higher overall development status of the region will
reduce the possibilities of getting non-refundable financing or when return financing schemes for the e-
mobility implementation projects will have higher interest rates. Since high investment costs in grid
power expansions there is a threat of the lack of electricity distributers being interested to invest in grids.
The energy sector nationally is quite slowly following the development and needs of the e-mobility
network.
Integration in one e-roaming system could be a threat for a market monopoly, whether is domestic or
foreign. Some of the foreign eRoaming platforms have a largely spread market throughout the Europe.
Big eRoaming platform attracts new service providers to join the platform in order to gain larger group
of customers. Members are paying relatively high costs of connecting data bases (e.g. 25.000 EUR per
year). In order not to lose the territory coverage a member could eventually accept also increase of the e-
roming fees, which influences also the end price for the customer, losing the leverage of autonomous
pricing and service policy. Another aspect is that a part of the profit of the service is channelized to a
foreign country, instead of contributing to national economy.
On the other hand also not unified integration in eRoaming systems may present a threat. When a
municipality owning E-CS is choosing an operator of their E-CS network, it is going to choose the one
offering better services and larger possible network of customers, also providing easy use for foreign
tourists. Not being integrated in eRoaming platform may represent a threat in terms of not being
competitive in service provision for incoming tourism. Gorenjska region is a touristic destination with
high number of visits also by personal vehicles.
Transfer from cash payments as it is an option now when paying gasoline on the gas station to on-line
payments through APPs or with RFID card acquires personal data collection. Every time a person is
charging their e-vehicle on the E-CS which is has this 2 possibilities of payments the location of the
person is identified. Therefor all travels by e-vehicle can be monitored and traced, without a choice.
Data of behavior and habits have value. GDRP is on one side requiring protection of personal data, on
the other side it may come to abuse, respectively the decision of not being traced is unavailable or in
best case omitted.
A different billing of vehicles charging policy relates to the fact that at present – time of this document
preparation, most e-charging is free of charge. In spite of its ever-increasing use, however, e-charging
European Regional Development Fund
Report
Pag. 83/202
operators abroad and home have different prices. Given the fact that e-vehicles are more expensive than
petrol or diesel ones, it is not cost effective for someone that travels a lot and abroad to have it.
3.3.2 Comments on SWOT
Reducing threats with strengths:
Currently are 2 main operators of E-CS in Gorenjska region. One is Petrol JSC and the other is regional
electricity distributer Gorenjske elektrarne Ltd. Gorenjske elektrarne joined the network with Elektro
Ljubljana JSC which has a significant number of E-CS in its network. Gorenjske elektrarne are besides
being electricity distributer and E-CS operator also the owner of 10 E-CS. Petrol has in the operation
now the majority of E-CS in Gorenjska, as well as owning some of them. 26 E-CS and by the end of the
year 36 E-CS that are identified and mostly mapped on the informational platforms represent relatively
high number of operating E-CS. There is an option of fast charging on the highway upon payment. If the
interests of the existing operators could come to common positions the provided information to the users
could be improved and the quality of service to the user could be only higher. Local public
administration has power to demand the cooperation on the level of a joint promotion and provision of
information of technical specification and operation on the common informational platforms. Even
better solution would be forming national informational platform which would give an overview of all
operational E-CS in Slovenia.
Relatively sufficient diffusion of E-CS means that in the more tourists visited municipalities the service
of public e-charging is available with an easy access to E-CS and good localization. In less touristic or
economically less developed municipalities there is not even 1 public E-CS set up. However the
relativeness is also connected to small number of users – lack of the critical mass and therefore most of
the E-CS are being unused most of the time. The role of the public administration to support
implementation of E-CS interoperable infrastructure is therefore needed as well as the support of the
national public administration also in regard to public e-vehicle diffusion.
Public administration on all levels should be prepared to build on their knowledge capacity to support
technological development giving terms of condition to the private investors setting up and operating E-
CS. Public administration should therefore be proactive in policy implementation supporting e-mobility.
Policy implementation (terms of conditions) in the standard of E-CS infrastructure implementation
could secure keeping of the standard also when competitors from outside start being interesting in
setting up their own networks. Slovenia is now in coherence with European standards of technical
features of E-CS (Type 2). For now since there is no critical mass of users and e-charging is mostly for
free Slovenia seems not to be interesting to foreign investors, except Tesla network. Local public
administration should seas every opportunity from non-refundable financial resources to build on the
regional economic competitiveness in the future as well join forces in purchasing e-vehicles or hybrid
vehicles in order to negotiate a better price. In case of no other options also combined financing models
should be used.
A threat “lack of electricity distributers that can be interested in investing in grids” and “the energy part
nationally of the network is quite slowly following the development and needs of the e-mobility
network”, identified by the local electro distributor, may be disappearing when the use of electricity
rises on the grounds of e-charging on the existing infrastructure and new home e-charging installations
European Regional Development Fund
Report
Pag. 84/202
start appearing. With a critical mass of users there is a possibility to invest also in capillary e-mobility
networks. However the municipalities identified a high cost of setting up E-CSs in the part of
construction and being plugged in to the grid. Since the costs are covered by municipalities that do not
generate profit form this, but even are paying for the electricity used on this public E-CSs it is
understandable that they are not very keen on making these investments.
Although the eRoaming systems exist and are spreading, the eRoaming systems still pose questions and
create issues. On one side not all networks in Gorenjska and Slovenia have signed contracts with
roaming platforms. Which means that a user signing a contract with a service provider not being a part
of an eRoaming platform has to find a way to charge and pay for e-charging on the E-CSs which are not
owned by the service provider with whom the user signed the contract. It has been written that the
bigger networks attract more users, since they want to be care free when choosing where to charge their
e-vehicle. This means strengthening the position in the market of the single service provider or
eRoaming platform. On the other side some service providers and owners of E-CS networks are asking
why are the eRoaming platforms needed, since the membership is also costly? They are choosing other
business models proving that there is another way, a more cost effective and equally successful. The
business model saving cost is B2B model.
Electricity distributors have a base of customers and are operating the grids. Operators, owners of E-CS
networks may sign a B2B contracts with the local electricity provider to manage billing, 24/7 help desk
in the local language. Needless to point out that these contracts can and would be signed also among
different electricity distributors to transfer the billings. For RFID cards only a block of numbers is
needed and with this also the privacy can be protected a bit more, since there is no need for the owners
or operators to deal with customers, if are not present in one business entity – electricity distributer - in 1
area. RFID chip can provide the anonymity for the single user in terms of not being identifiable by the
E-CS operator. This could reduce the security threats and privacy issues. The credit card payment
solution needs to be applied. The positive aspects of B2B model are that the costs of the billing could be
reduced by billing the customer monthly with electricity bill upon the real consumption of electricity
regardless to the home or public setting (charge to charge payment system); when the network is set
abroad the electricity distributor integrates customer help line for use of E-CS in the existing electricity
distribution customer help line in the language of the customer. This is especially important because one
of the strengths of our business actors in the sector of E-CS infrastructure is new business connections
abroad (JV market) for energy grids. Another example of increasing the network is signing a contract
with customer providers like abroad ChargeEU where one gets immediately 6000 customers or Plug
Service.
A different, higher prices for e-charging abroad in comparison to Slovenian and regional free charging
options, which very soon will ceased to exist almost completely, higher purchase prices of e-cars in
comparison with conventional ones and with lover performance in terms of km range with full battery (1
time charging) and relatively reduced driving satisfaction35, relatively long time of e-charging if one
cannot charge at home, more stops for e-charging on long travels, still existing problems with e-
35 Slovenian drivers are in majority used to shifting gears, which provides more fun in driving, higher engagement in the
process of driving, more bodily and brain action, faster reaction time of a car from a stand still point to driving in the cross
roads etc. E-vehicles demand adjustment to a new way of driving.
European Regional Development Fund
Report
Pag. 85/202
charging abroad etc. make a change of a conventional car owner to an e-car unappealing. Financial or
policy incentives for the change are therefore one of the driving forces of e-mobility diffusion.
Turning weaknesses into opportunities:
Unique national informational platform can be an opportunity to inform users all over the world about
the growth of E-CS network in Slovenia, eliminating private interests connected to owning these
information. It is an opportunity to gather the statistics on the diffusion, year of set-up and technical
specifics, interoperability etc. The ones who are setting up the E-CS would need to give all the required
data to the electricity provider which would then transfer the data to the manager of the national
informational platform. This good practice could be transferred to other European countries, promoting
e-mobility to potential users.
Lack of interoperability is an opportunity on its own since higher quality of service provided by
interoperability increases the usability and possibility of billing the e-charging. Operators of
interoperable networks have the opportunity to improve their approach of integrating new E-CS into
existing networks. The owners or operators need to identify pros of networking as a business or
reduction of cost opportunity. Interoperability means also opportunity for establishing help desk,
providing information about availability, reservation, monitoring, regulation etc. which increases
customer satisfaction, faster turnover of customers and consequently increases of earnings. The same
can be said for marking on the field as a part of marketing approach.
Lack of restrictive options for the abusers of the parking E-CS places could be solved by adopting a
good practice from Austria, where e-vehicles have different registration plates than conventional cars,
being easily identified. Restrictive measures can be then applied by the responsible public organs.
Lack of motivation and knowledge and support from municipalities is a serious problem, since fast
results without strategic planning are preferred or in some cases the absence of interest for e-mobility
results in refusing any kind of actions in this regard. They are few solutions to tackle this:
- Waiting for a critical mass of users to put pressure on demand which may be a driver for
private investors and public administration
- National level preparing directive, policy for local administration with a set of minimum
requirements to be met by each of the municipalities
- National level preparing financial incentives (calls) to which all municipalities can apply for
purchasing e-vehicles for public transport of specialized vehicles for transporting tourists
- Keeping the national subventions for setting up E-CS and connected infrastructure and for the
purchase of e-vehicles and hybrid cars.
Relatively small market in terms of the European market can be an opportunity for more cohesive,
integrated and seamless use of e-charging infrastructure, easier management. All stakeholders in the
field of e-mobility could connect and provide better transparency and a single service on the market,
providing that the price of e-charging services would be user friendly. In the European Union and
outside of it are opportunities to broaden the market and be more competitive with services already
tested in national one. Small market gives also more flexibility for correcting errors with low costs,
European Regional Development Fund
Report
Pag. 86/202
therefor opportunity for innovation can be higher. Integrated E-CS networks in Slovenia could become a
part of the European network.
Beside APP and RIFD card payment system, the credit card payment system should be applied. Good
practice from abroad showed that the national legislation corresponded to the European one and the
regional authorities communicated it to the economic sector and local public administration by policies.
Municipal policies adapted to monitor the implementation of the credit card payment solution
implementation by investors in public E-CS network.
The energy part of the network is quite slowly following the development and needs of the e-mobility
network, which could be new opportunity for investments.
3.4 Review of other competent authorities’ policies and other organization
Review of the reference instruments / plans / policies related to the Regional Action Plan for the area
covered by the study
Table 12: Municipal strategic policies on e-mobility by 2018
No Name of the reference document Comment
1. Sustainable Urban Mobility Plans 8 municipalities (Bled, Jesenice, Železniki, Škofja Loka,
Tržič, Kranj, Radovljica, Šenčur) in Gorenjska region have
prepared SUMPs. The majority of them are also mentioning
the support to e-mobility. Tržič is the only one not
mentioning e-mobility in the SUMP.
2. Local Energy Concept Action
plan Bohinj
Establishment of e-charging infrastructure for public transport
vehicles and passenger cars. Setting up free parking spaces
for electric vehicles. Encourage companies that provide taxi
services to buy electrically powered vehicles (through
information).
3. Local Energy Concept Action
plan Jesenice
For the field of e-mobility, the LEC Action Plan includes the
activation and supplementation of measuring stations and the
implementation of measurements of air pollution due to
traffic and rationalization in the scope, the installation of e-
charging stations for electric cars, public transport and hybrid
vehicles.
4. Local Energy Concept of the
municipality Cerklje na
Gorenjskem
It integrates supporting introduction of new technologies
through the introduction of buses to alternative fuels (eg:
biodiesel, LPG, etc.) and free parking for electrically powered
vehicles, etc.
5. Development strategy of Jezersko
municipality
E-mobility is mentioned in connection to the introduction of
electric vehicles into the municipal fleet.
5a Local Energy Concept of
municipality Jezersko
Mentioning of the already established set-up of 1 E-CS.
6. Sustainable Development Strategy The Municipality of Preddvor is planning indicative projects
European Regional Development Fund
Report
Pag. 87/202
of the Municipality of Preddvor,
with an emphasis on tourism 2016
- 2026
and activities among which address the following activities
for electric mobility: the purchase of electric vehicles for the
needs of primary schools, fieldworkers of municipalities and
societies (possibility of sharing for transportation of children
and elderly people); arranging electric charging stations with
parking lots in the center of the Preddvor and at the pump;
accelerated use of existing electric bicycles (TIC) among
citizens. From 2019 to 2026, for these measures, activities are
earmarked for EUR 30,000.
6a Local Energy Concept of
Preddvor municipality
Under the section of public transport is indicated the action of
building the infrastructure for the e-vehicles. As a
specification of the investment Preddvor envisages
compulsory purchase of vehicles with less than 120gkm Co2
for public use with 20.000 EUR of municipal contribution
untill 2022; purchase of e-vehicles by private persons and
with Eco fund subventions for 30.000 EUR by 2022;
sustainable mobility training courses.
7. Local Energy Concept of
Radovljica municipality
Supports e-mobility by free parking for electric vehicles, etc.
8. Local Energy Concept of Šenčur
municipality
The document supports mobility on alternative fuel by
creating supporting environment for electric vehicles and
hydrogen vehicles and charging infrastructure for electric and
hydrogen vehicles
9. Local Energy Concept of Škofja
Loka municipality
Establishment of two charging stations for electric vehicles
with self-sufficiency supply for the needs of the municipality
of Škofja Loka from 2012 – 2022, municipality provides
public space, investor is electro distributing company. Low-
emission vehicles in the city administration - 4 no. vehicles
(E85, electricity, natural gas): 2012 – 2022: investor is
municipality; Free parking for vehicles using only alternative
fuels (E85, electricity, natural gas): 2012 – 2022.
10. SEAP Tržič: Sustainable Energy
Action Plan of the Municipality of
Tržič (LEC)
LEAG (Local Energy Agency Gorenjska) will set up 1 E-CS
from 2016 - 2020
11. Local Energy Concept of
municipality Železniki
Introduction of new technologies through the introduction of
buses to alternative fuels (e.g. biodiesel, liquefied petroleum
gas, etc.), free parking for electric vehicles, etc. Ensure a
4.9% share of RES in transport by 2015 and a 10% share by
2020. Provide a 50% share of RES for charging electric
vehicle batteries and hydrogen vehicles by 2015 and a 100%
share of RES by 2020 at public charging stations.
Development of energy and charging infrastructure for the
efficient use of modern, environmentally-friendly vehicles.
12. Local Energy Concept of
municipality Žiri
E-CS infrastructure for electric and hydrogen vehicles.
European Regional Development Fund
Report
Pag. 88/202
13. Project development of the region,
sustainable mobility, municipality
Žiri
Measure mentioned for the set-up of 1 E-CS.
14.
Local Energy Concept of
municipality Žirovnica It does not include actions for implementation of e-mobility
or mobility.
15. Local Energy Concept of
municipality Gorje Municipality Gorje is planning to dedicate a share of parking
spaces for e-vehicles.
16. Local Energy Concept of
municipality Bled
For 2013 the plan was installing e-charging stations for
electric vehicles at one or more service stations.
17. Local Energy Concept of
municipality Gorenja vas -
Poljane
It does not include actions for implementation of e-mobility
or mobility.
18. Local Energy Concept of
municipality Kranj
It does not include actions for implementation of e-mobility
or mobility.
19. Local Energy Concept of
municipality Kranjska Gora
It does not include actions for implementation of e-mobility
or mobility.
20. Local Energy Concept of
municipality Naklo
Under the chapter 10 LEK Objectives, point b. Use of energy
in traffic – measures, the following measures are mentioned
for supporting e-mobility and other sustainable mobility:
efficient vehicles with an internal combustion engine;
economical driving and efficient use of vehicles; electric
battery vehicles and hydrogen vehicles; charging
infrastructure for electric battery vehicles and hydrogen
vehicles; compressed natural gas (SZP) and liquefied natural
gas (UNP); the mixing of biofuels with diesel and petrol;
biofuels and other RES in public transport and agriculture;
SZP in public urban transport
21. Strategy of sustainable
development of Bohinj
municipality 2025+
Electric mobility system: electric vehicles and rental bicycles,
electric charging stations and charging subsidies during the
transitional period, incentives for electric car users, subsidies
for the purchase of electric vehicles of the citizens,
establishing contacts with electric car manufacturers - Bohinj
as test environment.
22. Bohinj for Sustainable traffic
policy
Document from 2017 states that in Bohinj 4 public E-CS were
set up, 1 e-car was purchased for traffic ranger service and the
municipality was running for the LAS funding for the
purchase of another e-vehicle for mobile social services.
3.5 Regional vision, area of intervention and objectives
18 Municipalities of Gorenjska have a different approach and time-line regarding the implementation of
e-mobility infrastructure and transition to the environmentally friendlier e-mobility in comparison to
conventional one. Touristic municipalities or municipalities being pressured by bad air quality are
motivated for a change and the objectives of those are already demonstrating a higher diffusion of e-
mobility infrastructure, cooperation with e-mobility service providers and electro distributers. According
European Regional Development Fund
Report
Pag. 89/202
to the national and European directives and policies the transition to the e-mobility in unavoidable.
Therefor the vision and objectives of Gorenjska region are in coherence with the trend.
3.5.1 Regional Vision
By 2023 Gorenjska region will have 80% of municipalities covered by E-CS interoperable network
infrastructure supported by public administration financial incentives and policies, using the available
resources and will have knowledge empowered public administration in regard to e-mobility.
By 2040 Gorenjska region will have an extensive user friendly e-mobile infrastructure and services
according to European standards, which will enable a complete transition to electrical mobility.
Long term vision for Gorenjska region as a mountainous region includes use of e-mobility in city areas
as well as in rural areas and highlands, according to the technological e-mobility development,
regardless to the private or public choice of transport.
The Regional vision for sustainable mobility is already set in local Sustainable Mobility Plans or LEC
Action Plans and other strategic documents and is complimenting the e-Mobility Transnational strategy
for an Interoperable Community and Networking in the Alpine Space.
The vision of sustainable mobility in Gorenjska region is emphasizing a higher quality of life for the
people also by use of sustainable means of transportation corresponding to the peoples’ needs.
Proposals for the slogan incorporating the vision of e-mobility development were:
- E-mobility on the way with me. (E-mobilnost z menoj na poti.)
- E-mobility reliable co-driver. (E-mobilnost zanesljiv sopotnik.)
- E-mobility for higher quality of life in Gorenjska (E-mobilnost za višjo kakovost življenja na
Gorenjskem.)
- Longevity with e-mobility (Živi dlje z e-mobilnostjo.)
- I love green, thus I’m driving on electricity (Ljubim zeleno, zato vozim na elektriko.)
- I love green, I’m using e-mobility (Ljubim zeleno, sem e-mobilen.)
- E-mobility for clean air and silence (E-mobilnost za sveži zrak in tišino)
- Protect the environment, drive e-vehicle (Varuj okolje, vozi z e-vozilom.)
- Yes for Gorenjska e-mobility (Za e-mobilnost Gorenjske)
3.5.2 Regional plans & roles
Region of Gorenjska aims to gradually upgrade existing E-CS infrastructure for private and public e-
vehicles according to the trend of the demand in the sector of e-mobility and in parallel develop also
infrastructure for the vehicles on alternative fuel. This means that the number of E-CS, the number of
interoperable E-CS and the number of integrated interoperable E-CS in the networks is going to
increase. Networks are going to connect nationally and transnationally. Two payment systems are going
to prevail, with APPs and with the RIFD card. Localization and distribution of fast and slow E-CS are
European Regional Development Fund
Report
Pag. 90/202
going to follow the behavior and needs of the users. The prices will be diversified according to the
service and location.
Public authorities are reducing the use of cars in the city centers with soft and hard measures: slowing
down traffic, closing streets for vehicles, building pedestrian and quite zones, cycling paths, dedicating
parking spaces to e-vehicles and setting up or supporting the set-up of E-CS in the city centers, while
building parking lots outside the city centers; striving to improve the public transport (better service,
hybrid buses, e-mini buses …) and where the regular public transport is not cost affective turning it into
public transport service on call. The measures of reducing the use of private cars are also parking price
policy, supporting e-car sharing systems, buying e-vehicles for the business use and setting-up E-CS for
their employees.
Public authorities cooperate with private investors who are interested to set up infrastructure supporting
the diffusion of e-mobility or mobility of other alternative fuels. Public administration in Gorenjska
region aims to seize available national or European non-refundable financial incentives for the
implementation of the infrastructure and transport on alternative fuel. The role of public administration
in Gorenjska region is perceived more as a supporting one in regard to setting up the E-CS. Even if
owning the E-CS the majority of municipalities are giving the operation and management of E-CS to E-
CS network operating companies which are in the case of Gorenjska in energy business sector
(distributers of electricity, fossil fuel and other corresponding services).
The long-term aim is that ownership and management of e-mobility infrastructure, including the costs of
electricity is transferred from municipalities to private sector and that municipalities are addressing only
the spatial planning, parking policies, regulative policies, concessions for public transport and similar in
connection mobility on alternative fuels.
3.5.3 The route: areas of intervention
The main areas of intervention to be addressed in the RAP are identified from the state of play analysis
and the SWOT analysis. The corresponding themes are listed in the table for Gorenjska region.
Table 12: Areas of intervention
Area of intervention AoI Description
a. Territorial coverage
Note: connection to SO3
18 municiplities of Gorenjska region: Bled, Bohinj, Clerklje
na Gorenjskem, Gorenja vas – Poljane, Gorje, Jezersko,
Jesenice, Kranj, Kranjska gora, Naklo, Preddvor,
Radovljica, Šenčur, Škofja Loka, Tržič, Žiri, Žirovnica,
Železniki
b. Cooperation between Regional
Development Agencies and public
administration in Gorenjska region
and national level
Note: connection to SO1
Cooperation between PAs and RDAs of Gorenjska
supporting the measures and activities connected to e-
mobility and mobility on other alternative fuels
(transregional projects, knowledge capacity building,
exchange and implementation of good practices, signing
Memorandum of understanding for supporting diffusion of
e-mobility).
European Regional Development Fund
Report
Pag. 91/202
c. Installation of e-charging stations
for electric vehicles, public transport
and hybrid vehicles
Note: connection to SO2
Additional E-CS are going to be installed in the
municipalities where the number of E-CS is not promoting e-
mobility, new installations will correspond to EU standard
Type2. Installations of E-CS for all kinds of electric vehicles
will be supported (buses, e-bikes). Policies of PAs will
support purchase of environmentally friendly public
transport vehicles (hybrid, natural gas, biodiesel, hydrogen)
c. Increase interoperability
Note: connection to SO2
Interoperability of E-CS networks will be supported. Non-
interoperable E-CSs are going to be technically upgraded
and new installations will correspond to standard of
interoperability. Increasing of interoperability in technical
terms means connecting E-CS with back office – program
software, to get operational information of E-CS. Operation
management of interoperable networks is going to continue
being under the domain of private companies. The
cooperation of different operators will link to common
interoperable networks.
d. Adoption of a joint politic of
marking e-charging infrastructure on
the field
Note: connection to SO3
Inter-municipal agreement with operators on how to
designate locations of e-charging stations in the field to
increase the visibility of the service.36
e. Air quality measurement
Note: Connected to SO3
Implementation of measurements of air pollution due to
traffic and rationalization in the scope, the installation of e-
charging stations for electric cars, public transport and
hybrid vehicles will be done in Jesenice and continue in
Škofja Loka and Kranj.
f. Parking policy
Note: Connection to SO3
The plan is to increase the number of parking spaces for e-
vehicles (with E-CS infrastructure), continue with the policy
of free parking for e-vehicles until the critical mass of e-
vehicles, increase the service of P&R systems, reduce the
parking space in the city centers, adjust parking pricing
policy to promotion of sustainable transport.
g. Public transport service
Note: connection to SO1
Seize national and EU non-refundable financial subventions
for purchase of hybrid or electric vehicles for public use.
Change public vehicle fleet with combustion engine to
electric battery vehicles. Support e-car sharing system.
Rationalization of public transport service – public transport
on call.
h. Building knowledge capacity of
public administration
Note: connection to SO1 and SO4
Attending knowledge capacity building trainings, public
discussions, cooperating in knowledge exchange projects
and good practice exchange for management of e-mobility
infrastructure, and e-mobility in general.
36 Bled Municipality has this action written in Rules on Traffic Signaling and Traffic Equipment on Roads - floor marking
no. 5354, traffic sign 3118.
European Regional Development Fund
Report
Pag. 92/202
i. Private-public cooperation in
alternative fuel mobility
Note: connection to SO5
Cooperation with electricity providers, private investors in
E-CS infrastructure, E-CS operators, public transport
concessioners, e-car sharing companies and supporting them
with public space locations …
j. Implementing existing policies for
mobility on alternative fuels
Note: connection to SO3
SUMPs and LEC Action plans already include measures for
the implementation of e-mobility infrastructure and mobility
on other alternative fuels. Public administration is
responsible for the implementation and monitoring of the set
measures.
l. Examination of the importance of
the electricity supply site for the E-
CS based on the load on the
electricity network
Note: Connection to SO2
Cooperation with the electricity distributor to coordinate the
public infrastructure of e-charging with the load of the
electricity grid.
m. Energy grid slowly follows
development and needs of the e-
mobility grid
Note: Connection to SO2
In certain areas of the region the lack basic electrical grid
infrastructure is identified. The current electrical grid
network is too weak to supporting of medium or high power
E-CS (ones that take less than 12h to charge an e-vehicle)
n. Utilization of the Eco Fund and
other national financial funds
Note: Connection to SO1
Application for Eco Fund Call for proposals for co-financing
investments in e-mobility and dedicating funds to e-mobility
from the Regional Development Agreement
o. A single regional information
platform e-mobilitygorenjska.si (e-
HUB)
Note: connection to SO4
Supporting regional e-hub for e-mobility run by BSC, Ltd,
Kranj with information. Providing information on the new E-
CS instalations for updating information on E-CS
infrastructure on the regional informational platform e-HUB.
p. Joint promotion of e-mobility
Note: connection to SO4
Active participation of public authorities, suppliers and civil
society on benefits of e-mobility, especially in the field of
reducing emissions and, consequently, maintaining a healthy
environment. Use of different communication tools for
reaching different target groups (children, adolescents, senior
citizens, elderly population ... ). The promotion should
include different approaches to the target groups of users,
including the educational approach, user experience and
preventive measures).
3.5.4 RAP’s objectives
In Gorenjska the strategic approach for the planning of an interoperable infrastructure for electric
vehicle is defined in the following strategic objectives.
European Regional Development Fund
Report
Pag. 93/202
Table 13: Strategic objectives
Strategic Objective SO Description
1. Provide support to the local PA
(municipalities) in the matters of e-
mobility
SORA, RAGOR and BSC, Ltd., Kranj support
Municipalities by preparation, coordination and in
some cases also implementation of projects connected
to e-mobility. RDA of Gorenjska represents
municipalities in communication with the national
public administrative authorities (e.g. Agreement for
the development of regions, coordinating LEAG
project applications and implementation, preparation,
submission and implementation of international
projects, preparation of Regional Development Plan
etc.).
2. Achieve complete interoperability of
electric charging services
RDA of Gorenjska BSC, Ltd, Kranj in cooperation
with operator of regional E-CS and electro distributer
are promoting and supporting by concrete actions the
increase in number of interoperable E-CS and growing
of the interoperable network. Municipalities are
cooperating with electro distributers and operators of
E-CS networks supporting the interoperability of
electric charging services, by facilitating national
subventions of Eco Fund investing in E-CS equipment
and investing with their own funds in the
infrastructural installation of the E-CS, following the
EU technical standards of e-charging infrastructure.
3. Reach an adequate territorial coverage
for electric charging services
Mapping locations - parking spaces for future e-
charging stations. Strategically planning with
corresponding documentation, parking surfaces that
meet the criteria for setting up e-charging stations
(accessibility, frequency, closeness of public
institutions, proximity to regional and motorway
connections, and other sustainable forms of public
transport) and integrating these plans into energy
concepts. Homogeneous diffusion of E-CS networks
throughout Gorenjska region.
4. Make the information on the charging
network available to regional and
transnational users
Updating regional E-HUB, support the idea on national
informational platform for E-CS infrastructure,
provision the local information of newly established E-
CS by municipalities of regional electro distributer.
5. Facilitate contacts between PAs and
stakeholders (companies, private
investors, private citizens, ...)
Cooperation with electricity providers, private
investors in E-CS infrastructure, E-CS operators,
public transport concessioners, e-car sharing
companies and supporting them with public space
locations and infrastructural investments.
6. Integrate public transport and private Promoting the purchase of electric buses for public
European Regional Development Fund
Report
Pag. 94/202
transport transport, purchase of business e-vehicles and setting
up E-CS for their charging on the dedicated locations,
preferably near the P&R parking lots with established
E-CS infrastructure, business zones and at and around
the airport.
2. E-mobility promotion Active operation of municipalities in establishing
contacts with stakeholders (companies, private
investors, individuals ...) who want to obtain
information on e-mobility in the local area and the role
of municipalities as promoters of e-mobility
(mainstreaming the topic in the European Mobility
Week, raising awareness public ...)
3.6 RAP actions
In Gorenjska region the Area of intervention defined by the Administration and the Strategic Objectives
for planning of an interoperable infrastructure for electric vehicle, defines the following Action.
3.6.1 Action list
The Supra regional pillars give transnational strategic guidelines to be followed on the regional level in
order to achieve balanced development in Alpine space for the e-mobility infrastructure and
management. RAP’s objectives in this case define the regional objectives for implementation of
sustainable mobility, in particular diffusion of e-mobility infrastructure and e-mobility in Gorenjska
region to define and categorize actions to be taken achieving these objectives.
Table 14: Synthesis table of strategic actions for Gorenjska Region
Supraregional Pillar
(from Trasnational
Strategy)
RAP’s Objective Actions
Strategy #1 – Define the
best possible roles of PAs
Provide support to the local PA
(municipalities)
• Facilitate acquisition of financial
incentives supporting municipal actions
in diffusion of e-mobility
• Building knowledge capacity concerning
E-CS infrastructure, operation and e-
mobility
Strategy #2 – Set
common minimum rules
on infrastructure access Achieve complete interoperability of
electric charging services
• Initiate and support installation of E-CS
according to EU standards enabling
interoperable connection
• Support and initiate actions creating
interoperable networks
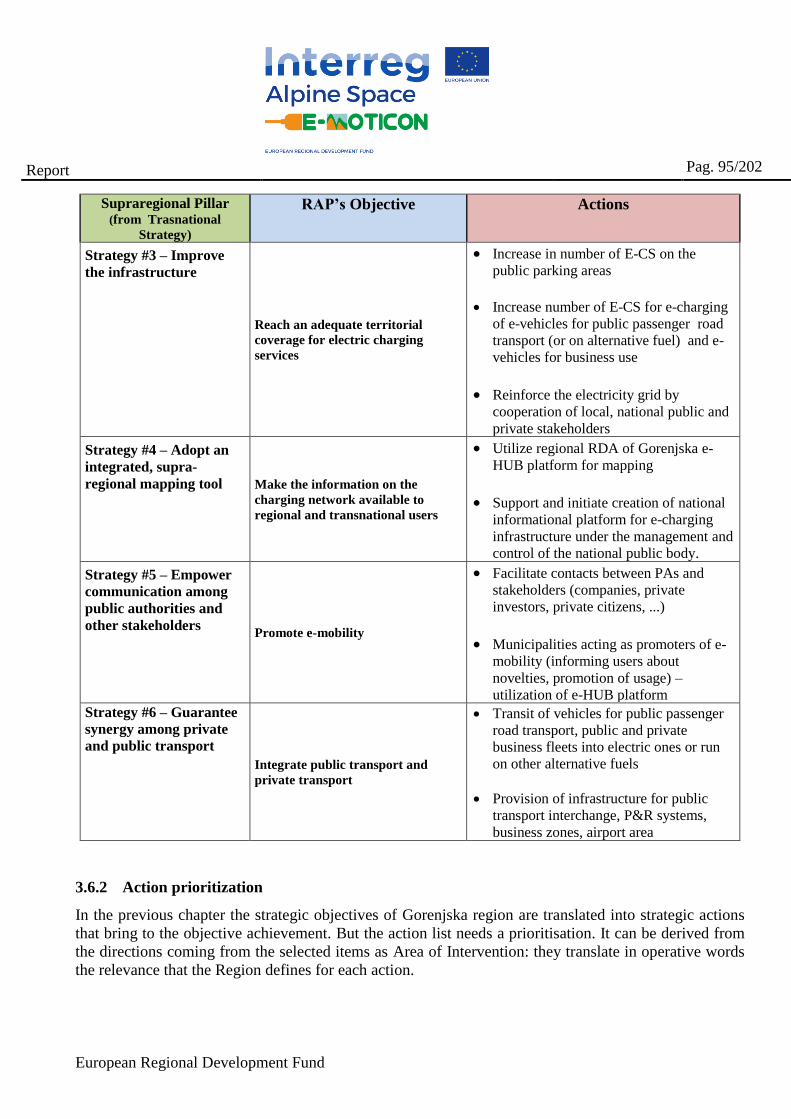
European Regional Development Fund
Report
Pag. 95/202
Supraregional Pillar (from Trasnational
Strategy)
RAP’s Objective Actions
Strategy #3 – Improve
the infrastructure
Reach an adequate territorial
coverage for electric charging
services
• Increase in number of E-CS on the
public parking areas
• Increase number of E-CS for e-charging
of e-vehicles for public passenger road
transport (or on alternative fuel) and e-
vehicles for business use
• Reinforce the electricity grid by
cooperation of local, national public and
private stakeholders
Strategy #4 – Adopt an
integrated, supra-
regional mapping tool Make the information on the
charging network available to
regional and transnational users
• Utilize regional RDA of Gorenjska e-
HUB platform for mapping
• Support and initiate creation of national
informational platform for e-charging
infrastructure under the management and
control of the national public body.
Strategy #5 – Empower
communication among
public authorities and
other stakeholders Promote e-mobility
• Facilitate contacts between PAs and
stakeholders (companies, private
investors, private citizens, ...)
• Municipalities acting as promoters of e-
mobility (informing users about
novelties, promotion of usage) –
utilization of e-HUB platform Strategy #6 – Guarantee
synergy among private
and public transport
Integrate public transport and
private transport
• Transit of vehicles for public passenger
road transport, public and private
business fleets into electric ones or run
on other alternative fuels
• Provision of infrastructure for public
transport interchange, P&R systems,
business zones, airport area
3.6.2 Action prioritization
In the previous chapter the strategic objectives of Gorenjska region are translated into strategic actions
that bring to the objective achievement. But the action list needs a prioritisation. It can be derived from
the directions coming from the selected items as Area of Intervention: they translate in operative words
the relevance that the Region defines for each action.
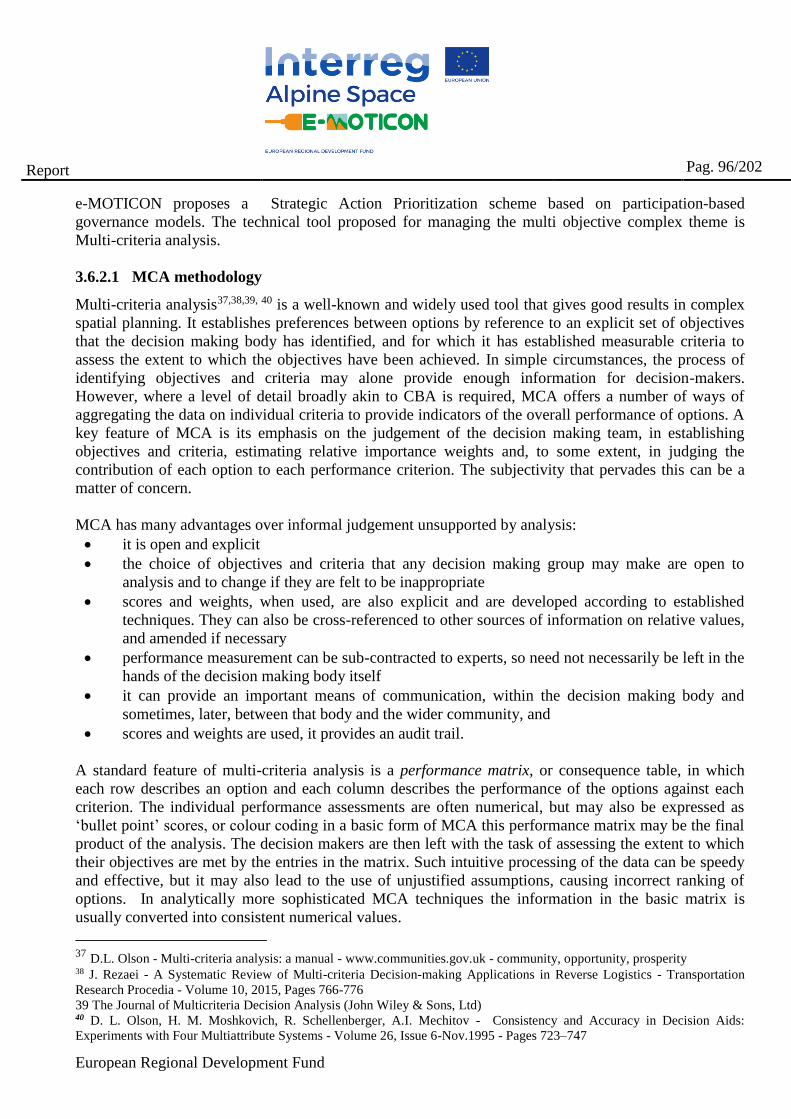
European Regional Development Fund
Report
Pag. 96/202
e-MOTICON proposes a Strategic Action Prioritization scheme based on participation-based
governance models. The technical tool proposed for managing the multi objective complex theme is
Multi-criteria analysis.
3.6.2.1 MCA methodology
Multi-criteria analysis37,38,39, 40 is a well-known and widely used tool that gives good results in complex
spatial planning. It establishes preferences between options by reference to an explicit set of objectives
that the decision making body has identified, and for which it has established measurable criteria to
assess the extent to which the objectives have been achieved. In simple circumstances, the process of
identifying objectives and criteria may alone provide enough information for decision-makers.
However, where a level of detail broadly akin to CBA is required, MCA offers a number of ways of
aggregating the data on individual criteria to provide indicators of the overall performance of options. A
key feature of MCA is its emphasis on the judgement of the decision making team, in establishing
objectives and criteria, estimating relative importance weights and, to some extent, in judging the
contribution of each option to each performance criterion. The subjectivity that pervades this can be a
matter of concern.
MCA has many advantages over informal judgement unsupported by analysis:
• it is open and explicit
• the choice of objectives and criteria that any decision making group may make are open to
analysis and to change if they are felt to be inappropriate
• scores and weights, when used, are also explicit and are developed according to established
techniques. They can also be cross-referenced to other sources of information on relative values,
and amended if necessary
• performance measurement can be sub-contracted to experts, so need not necessarily be left in the
hands of the decision making body itself
• it can provide an important means of communication, within the decision making body and
sometimes, later, between that body and the wider community, and
• scores and weights are used, it provides an audit trail.
A standard feature of multi-criteria analysis is a performance matrix, or consequence table, in which
each row describes an option and each column describes the performance of the options against each
criterion. The individual performance assessments are often numerical, but may also be expressed as
‘bullet point’ scores, or colour coding in a basic form of MCA this performance matrix may be the final
product of the analysis. The decision makers are then left with the task of assessing the extent to which
their objectives are met by the entries in the matrix. Such intuitive processing of the data can be speedy
and effective, but it may also lead to the use of unjustified assumptions, causing incorrect ranking of
options. In analytically more sophisticated MCA techniques the information in the basic matrix is
usually converted into consistent numerical values.
37 D.L. Olson - Multi-criteria analysis: a manual - www.communities.gov.uk - community, opportunity, prosperity 38 J. Rezaei - A Systematic Review of Multi-criteria Decision-making Applications in Reverse Logistics - Transportation
Research Procedia - Volume 10, 2015, Pages 766-776
39 The Journal of Multicriteria Decision Analysis (John Wiley & Sons, Ltd) 40 D. L. Olson, H. M. Moshkovich, R. Schellenberger, A.I. Mechitov - Consistency and Accuracy in Decision Aids:
Experiments with Four Multiattribute Systems - Volume 26, Issue 6-Nov.1995 - Pages 723–747
European Regional Development Fund
Report
Pag. 97/202
MCA techniques commonly apply numerical analysis to a performance matrix in two stages:
• Scoring: the expected consequences of each option are assigned a numerical score on strength of
preference scale for each option for each criterion. More preferred options score higher on the
scale, and less preferred options score lower. In practice, scales extending from 0 to 100 are
often used, where 0 represents a real or hypothetical least preferred option, and 100 is associated
with a real or hypothetical most preferred option. All options considered in the MCA would then
fall between 0 and 100.
• Weighting: numerical weights are assigned to define, for each criterion, the relative valuations of
a shift between the top and bottom of the chosen scale.
There is no normative model of how individuals should make multi-criteria choices that is without
critics. The one that comes closest to universal acceptance is based on multi-attribute utility theory and
derives from the work of von Neumann and Morgenstern41, 19 and of Savage,42in the 1940s and 1950s.
If it can either be proved, or reasonably assumed, that the criteria are preferentially independent of each
other and if uncertainty is not formally built into the MCA model, then the simple linear additive
evaluation model is applicable. The linear model shows how an option’s values on the many criteria can
be combined into one overall value. This is done by multiplying the value score on each criterion by the
weight of that criterion, and then adding all those weighted scores together. However, this simple
arithmetic is only appropriate if the criteria are mutually preference independent. The Analytic
Hierarchy Process (AHP) also develops a linear additive model, but, in its standard format, uses
procedures for deriving the weights and the scores achieved by alternatives which are based,
respectively, on pairwise comparisons between criteria and between options. Thus, for example, in
assessing weights, the decision maker is asked a series of questions, each of which asks how important
one particular criterion is relative to another for the decision being addressed. A number of texts provide
useful surveys of MCA methods.
All the features that describe each strategic action, according to the problem, will be considered as
evaluation criteria in the MCA.
3.6.2.2 Methodology for Priority Action Definition
The prioritization phase scope is to give a ranking that is linked to local PA vision and need, but also
accounts which action could boost at most the implementation of the e-moticon strategy at local level,
and to attain the strategic goal to which it relates. The selection of these actions came out from the
collaboration of e-MOTICON PPs and local authorities. A common structure has been adopted for the
description of the actions, which although hardly adaptable at the same time to the various intervention
aspects, was necessary in order to later perform a MCA analysis for the objective assessment of the
various action on the basis of common criteria. Firstly, each action was, assigned to strategic pillar of
reference. Afterwards, for each project other elements of description have been indicated, among the
other: - objective; - impact, - time and cost.
41 Von Neumann, J, and Morgenstern, O. (1947) Theory of Games and Economic Behaviour, second edition, Princeton
University 42 Savage, L.J. (1954) The Foundations of Statistics Wiley, New York, NY
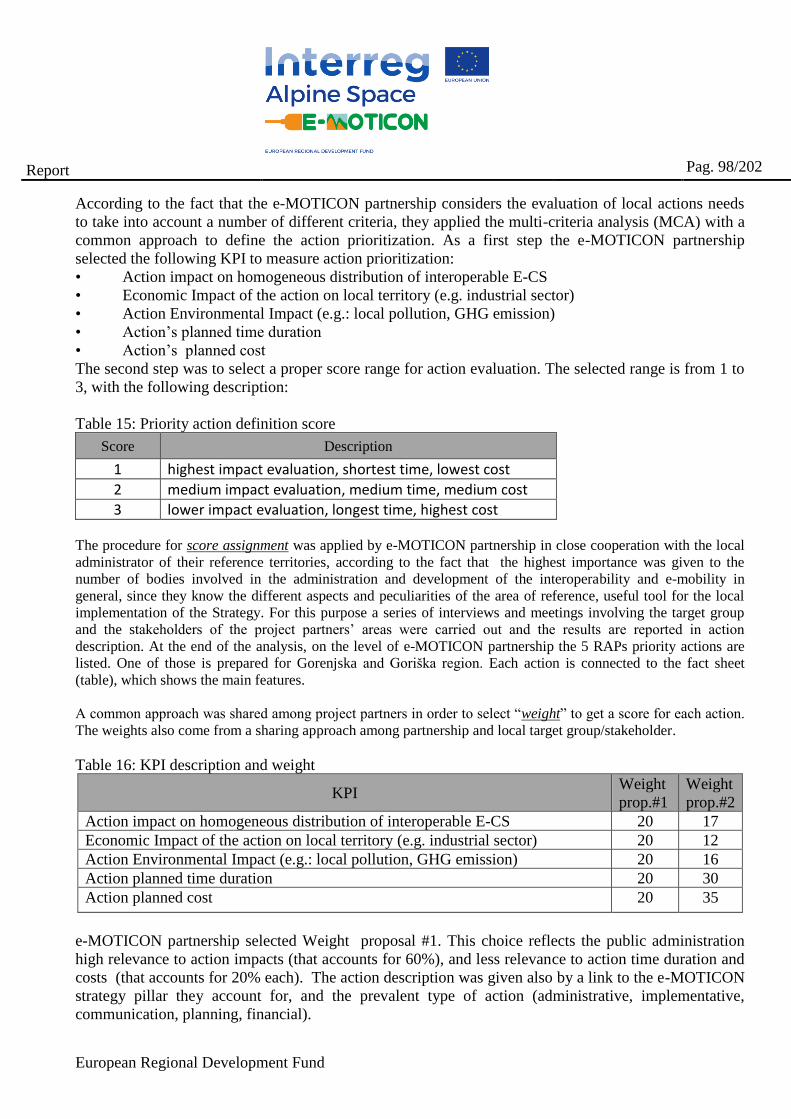
European Regional Development Fund
Report
Pag. 98/202
According to the fact that the e-MOTICON partnership considers the evaluation of local actions needs
to take into account a number of different criteria, they applied the multi-criteria analysis (MCA) with a
common approach to define the action prioritization. As a first step the e-MOTICON partnership
selected the following KPI to measure action prioritization:
• Action impact on homogeneous distribution of interoperable E-CS
• Economic Impact of the action on local territory (e.g. industrial sector)
• Action Environmental Impact (e.g.: local pollution, GHG emission)
• Action’s planned time duration
• Action’s planned cost
The second step was to select a proper score range for action evaluation. The selected range is from 1 to
3, with the following description:
Table 15: Priority action definition score
Score Description
1 highest impact evaluation, shortest time, lowest cost
2 medium impact evaluation, medium time, medium cost
3 lower impact evaluation, longest time, highest cost
The procedure for score assignment was applied by e-MOTICON partnership in close cooperation with the local
administrator of their reference territories, according to the fact that the highest importance was given to the
number of bodies involved in the administration and development of the interoperability and e-mobility in
general, since they know the different aspects and peculiarities of the area of reference, useful tool for the local
implementation of the Strategy. For this purpose a series of interviews and meetings involving the target group
and the stakeholders of the project partners’ areas were carried out and the results are reported in action
description. At the end of the analysis, on the level of e-MOTICON partnership the 5 RAPs priority actions are
listed. One of those is prepared for Gorenjska and Goriška region. Each action is connected to the fact sheet
(table), which shows the main features.
A common approach was shared among project partners in order to select “weight” to get a score for each action.
The weights also come from a sharing approach among partnership and local target group/stakeholder.
Table 16: KPI description and weight
KPI Weight
prop.#1
Weight
prop.#2
Action impact on homogeneous distribution of interoperable E-CS 20 17
Economic Impact of the action on local territory (e.g. industrial sector) 20 12
Action Environmental Impact (e.g.: local pollution, GHG emission) 20 16
Action planned time duration 20 30
Action planned cost 20 35
e-MOTICON partnership selected Weight proposal #1. This choice reflects the public administration
high relevance to action impacts (that accounts for 60%), and less relevance to action time duration and
costs (that accounts for 20% each). The action description was given also by a link to the e-MOTICON
strategy pillar they account for, and the prevalent type of action (administrative, implementative,
communication, planning, financial).
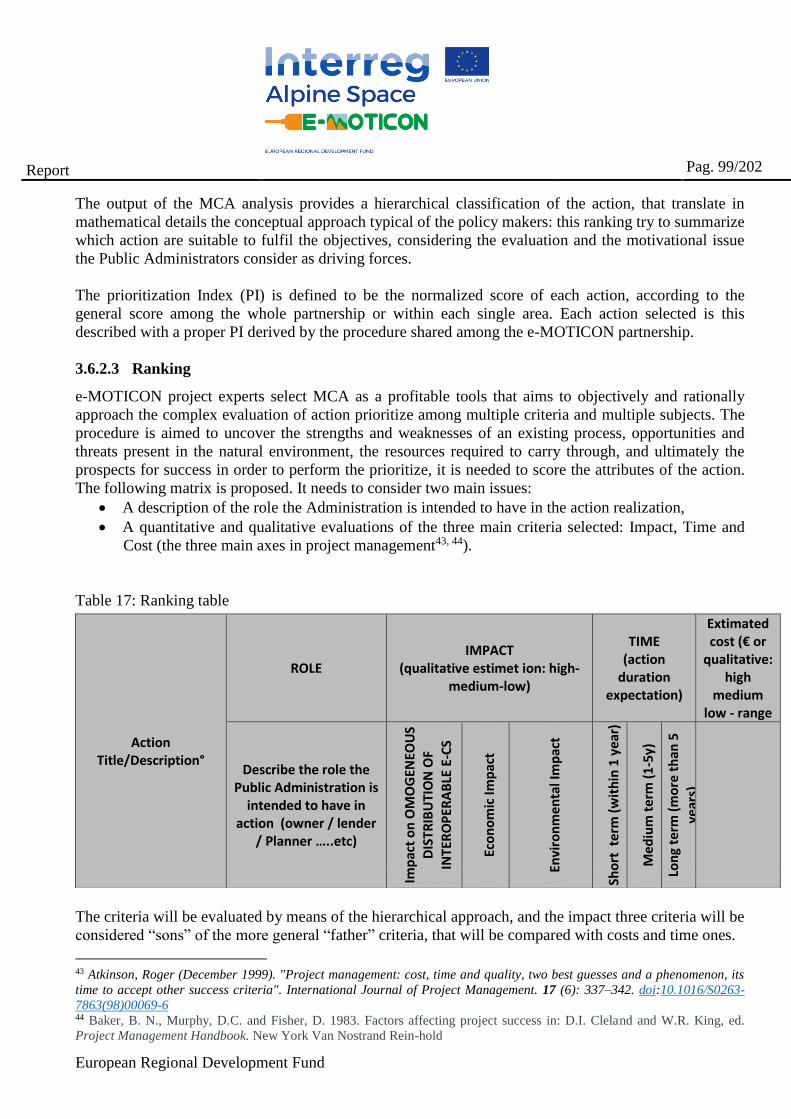
European Regional Development Fund
Report
Pag. 99/202
The output of the MCA analysis provides a hierarchical classification of the action, that translate in
mathematical details the conceptual approach typical of the policy makers: this ranking try to summarize
which action are suitable to fulfil the objectives, considering the evaluation and the motivational issue
the Public Administrators consider as driving forces.
The prioritization Index (PI) is defined to be the normalized score of each action, according to the
general score among the whole partnership or within each single area. Each action selected is this
described with a proper PI derived by the procedure shared among the e-MOTICON partnership.
3.6.2.3 Ranking
e-MOTICON project experts select MCA as a profitable tools that aims to objectively and rationally
approach the complex evaluation of action prioritize among multiple criteria and multiple subjects. The
procedure is aimed to uncover the strengths and weaknesses of an existing process, opportunities and
threats present in the natural environment, the resources required to carry through, and ultimately the
prospects for success in order to perform the prioritize, it is needed to score the attributes of the action.
The following matrix is proposed. It needs to consider two main issues:
• A description of the role the Administration is intended to have in the action realization,
• A quantitative and qualitative evaluations of the three main criteria selected: Impact, Time and
Cost (the three main axes in project management43, 44).
Table 17: Ranking table
The criteria will be evaluated by means of the hierarchical approach, and the impact three criteria will be
considered “sons” of the more general “father” criteria, that will be compared with costs and time ones.
43 Atkinson, Roger (December 1999). "Project management: cost, time and quality, two best guesses and a phenomenon, its
time to accept other success criteria". International Journal of Project Management. 17 (6): 337–342. doi:10.1016/S0263-
7863(98)00069-6 44 Baker, B. N., Murphy, D.C. and Fisher, D. 1983. Factors affecting project success in: D.I. Cleland and W.R. King, ed.
Project Management Handbook. New York Van Nostrand Rein-hold
Action Title/Description°
ROLE IMPACT
(qualitative estimet ion: high-medium-low)
TIME (action
duration expectation)
Extimated cost (€ or
qualitative: high
medium low - range
Describe the role the Public Administration is
intended to have in action (owner / lender
/ Planner …..etc)
Imp
act
on
OM
OG
ENEO
US
DIS
TRIB
UTI
ON
OF
INTE
RO
PER
AB
LE E
-CS
Eco
no
mic
Imp
act
Envi
ron
me
nta
l Im
pac
t
Sho
rt t
erm
(w
ith
in 1
yea
r)
Med
ium
te
rm (
1-5
y)
Lon
g te
rm (
mo
re t
han
5
year
s)
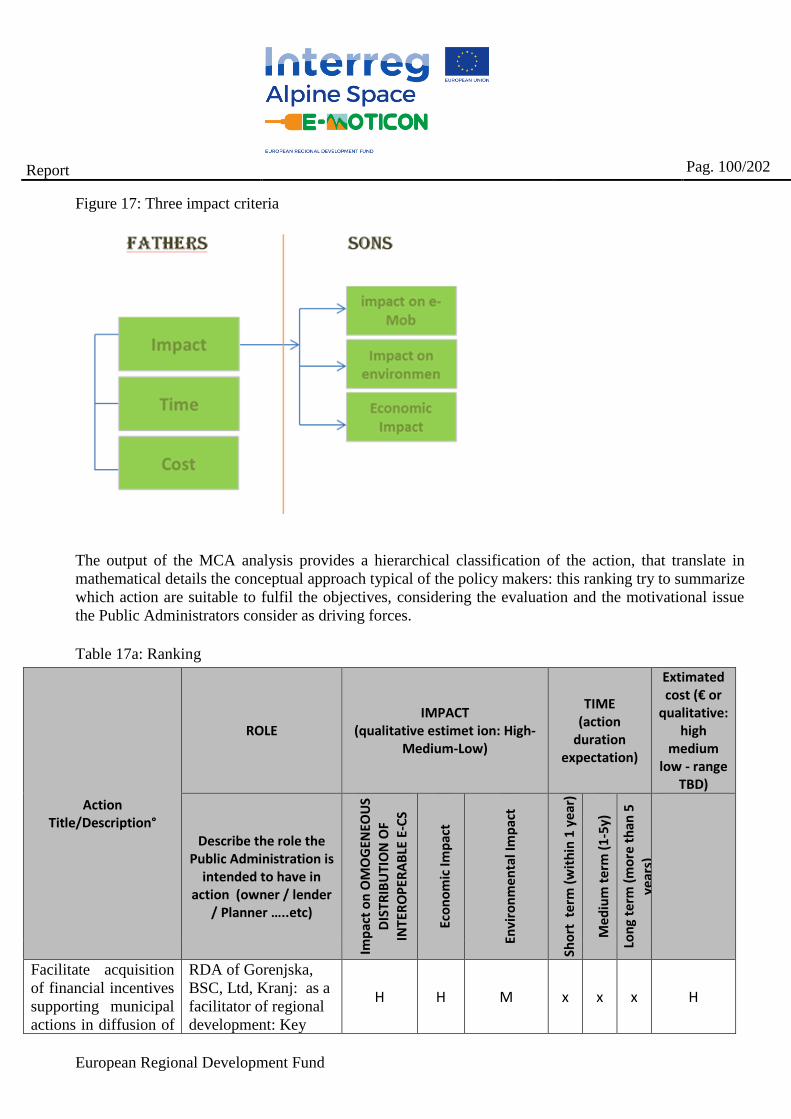
European Regional Development Fund
Report
Pag. 100/202
Figure 17: Three impact criteria
The output of the MCA analysis provides a hierarchical classification of the action, that translate in
mathematical details the conceptual approach typical of the policy makers: this ranking try to summarize
which action are suitable to fulfil the objectives, considering the evaluation and the motivational issue
the Public Administrators consider as driving forces.
Table 17a: Ranking
Action Title/Description°
ROLE IMPACT
(qualitative estimet ion: High-Medium-Low)
TIME (action
duration expectation)
Extimated cost (€ or
qualitative: high
medium low - range
TBD)
Describe the role the Public Administration is
intended to have in action (owner / lender
/ Planner …..etc)
Imp
act
on
OM
OG
ENEO
US
DIS
TRIB
UTI
ON
OF
INTE
RO
PER
AB
LE E
-CS
Eco
no
mic
Imp
act
Envi
ron
me
nta
l Im
pac
t
Sho
rt t
erm
(w
ith
in 1
yea
r)
Med
ium
te
rm (
1-5
y)
Lon
g te
rm (
mo
re t
han
5
year
s)
Facilitate acquisition
of financial incentives
supporting municipal
actions in diffusion of
RDA of Gorenjska,
BSC, Ltd, Kranj: as a
facilitator of regional
development: Key
H H M x x x H
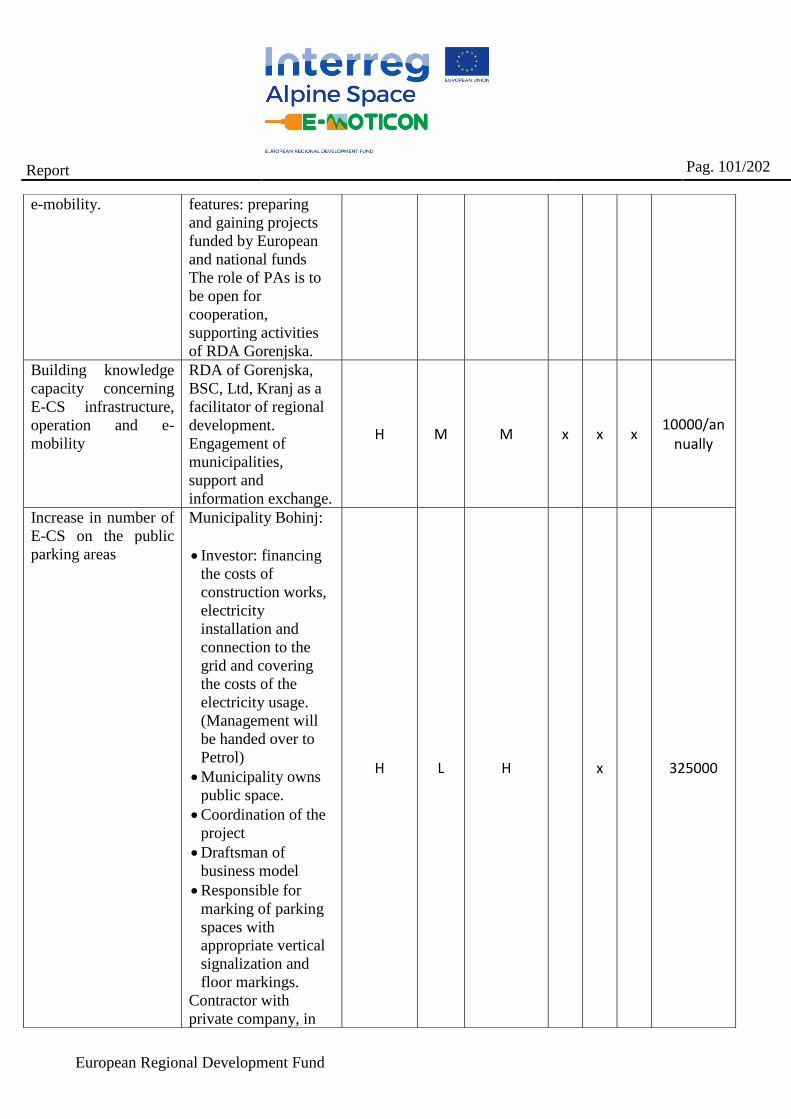
European Regional Development Fund
Report
Pag. 101/202
e-mobility. features: preparing
and gaining projects
funded by European
and national funds
The role of PAs is to
be open for
cooperation,
supporting activities
of RDA Gorenjska.
Building knowledge
capacity concerning
E-CS infrastructure,
operation and e-
mobility
RDA of Gorenjska,
BSC, Ltd, Kranj as a
facilitator of regional
development.
Engagement of
municipalities,
support and
information exchange.
H M M x x x 10000/an
nually
Increase in number of
E-CS on the public
parking areas
Municipality Bohinj:
• Investor: financing
the costs of
construction works,
electricity
installation and
connection to the
grid and covering
the costs of the
electricity usage.
(Management will
be handed over to
Petrol)
• Municipality owns
public space.
• Coordination of the
project
• Draftsman of
business model
• Responsible for
marking of parking
spaces with
appropriate vertical
signalization and
floor markings.
Contractor with
private company, in
H L H x
325000
European Regional Development Fund
Report
Pag. 102/202
case the E-CS is
situated on a private
land.
Municipality Cerklje
na Gorenjskem:
Providing land for the
building of a network
of public parking
spaces with E-CS,
preparation of
investment and project
documentation,
candidacy for the
allocation of state or
European funds,
implementation of the
installation of E-CS.
H L H x H
Municipality Kranj:
Municipal
administration will be
a facilitator of the
action according to the
available financial
incentives.
H H H x x x
5000/E-CS +
infrastructure
Municipality Kranjska
Gora: Providing land
for the setting up E-
CSs, preparation of
investment and project
documentation,
candidacy for the state
funds, implementation
of the installation of
E-CSs.
H L H x
20000
Municipality Bled:
Investor: financing the
costs of construction
works, electricity
installation and
connection to the grid
and covering the costs
of the electricity
usage. (Management
will be handed over to
Petrol)
H L H x
43000
European Regional Development Fund
Report
Pag. 103/202
• Municipality owns
public space.
• Project application
to Eco Fund
(installation and
commissioning of
10 electric
charging stations
on public areas)
• Coordination of
the project
• Draftsman of
business model
• Responsible for
marking of parking
spaces with
appropriate vertical
signalization and
floor markings.
Contractor with
private company, in
case the E-CS is
situated on a private
land,
Municipality Bled:
• Investor: financing
the costs of
construction
works, electricity
installation and
connection to the
grid and covering
the costs of the
electricity usage.
• Municipality holds
the ownership of
the public space.
• Project application
to Eco Fund,
second annual call
(installation and
commissioning of
1 electric charging
stations on public
H L H x
4300
European Regional Development Fund
Report
Pag. 104/202
areas)
• Coordination of
the project
• Draftsman of
business model
• Responsible for
marking of parking
spaces with
appropriate vertical
signalization and
floor markings.
Contractor with
private company, in
case the E-CS is
situated on a private
land,
Municipality Bled:
• Holds the
ownership of the
public space.
• Contractor with
private company,
in case the E-CS is
situated on a
private land
H M H x
N/A
Municipality
Žirovnica: is the
owner of public
spaces, Eco Fund
applicants,
coordinators
responsible for
preparing business
models, mark parking
spaces with
appropriate vertical
signalization and floor
markings, are
contractors with
private persons, if
they are electronic
billing stations on
private land and are
payers for establishing
system (network
L M M x
5000/E-CS +
infrastructure
European Regional Development Fund
Report
Pag. 105/202
connection,
construction work).
Management is passed
on to E-CS.
Municipality Žiri:
• Investor: financing
the costs of
construction
works, electricity
installation and
connection to the
grid and covering
the costs of the
electricity usage.
• Municipality owns
public space.
• Coordination of
the project
Responsible for
marking of parking
spaces with
appropriate vertical
signalization and floor
markings.
M L L x
M
Provision of
infrastructure for
public transport
interchange, P&R
systems, business
zones, airport area
Municipality Bohinj:
Investor, both the
establishment of car
parks and the
provision of transport
H L H x
M
Municipality of
Cerklje na
Gorenjskem: The task
of the municipality is
to encourage
cooperation with
investors. Help
develop e-mobility
development strategy
in areas of greater
economic and tourist
development.
H H H x H
Municipalities acting
as promoters of e-
mobility, utilization
Municipality Cerklje
na Gorenjskem: The
task of the
M L H x
10000
European Regional Development Fund
Report
Pag. 106/202
of e-HUB platform
municipality is to
promote the education
of users - all
generations, beginning
with kindergarten and
elementary school.
Municipality of
Jesenice and Bohinj:
On the basis of
information and data
on priority e-mobility
and interoperability,
the public
administration
(municipality) carries
out the continuous
task of informing and
educating users about
the use and positive
effects, and the
accessibility to
equipment and means
of transport, as well as
on the effects of e-
mobility long term.
M H M x x x 10000/an
nually
Reinforce the
electricity grid by
cooperation of local,
national public and
private stakeholders
Municipality Cerklje
na Gorenjskem,
Kranjska Gora and the
entire Gorenjska: The
task of the
municipality is to
encourage all actors to
begin solving the
problem.
H L L x L
Transit of vehicles for
public passenger road
transport, public and
private business fleets
into electric ones or
run on other
alternative fuels
Municipality Kranj:
Municipal
administration will be
a facilitator of the
action according to the
available financial
incentives.
H L H x x x 30000
Support and initiate
creation of national
informational
platform for e-
Gorenjske elektrarne,
RDA of Gorenjska,
BSC, Ltd, Kranj as a
facilitator of regional
H H M x x L
European Regional Development Fund
Report
Pag. 107/202
Economic impact, described by municipalities in the action tables provided in Appendix no5 is defined
sometimes on what municipality would gain and sometimes on what would be the cost. Therefor when
giving the estimation above it is in terms of the gain for the municipality as administration and not as an
impact on regional economy. If there was an approximate estimation of the future economic impact on
the territory then the evaluations would be different.
3.6.3 Action List with prioritization index
In this chapter the action list table of chapter 3.4.1 is provided with a prioritization index (PI) derived
from the methodology described in the previous tables.
charging
infrastructure under
the management and
control of the national
public body
development for e-
mobility
infrastructure.
Engagement and
commitment of
national public
authorities to
implement this idea.
Utilize regional RDA
of Gorenjska e-HUB
platform for mapping
When municipalities
are choosing GEK to
be the operator of
their E-CS then the
map is updated and
information for users
open to the general
public.
M M M x L
Support and initiate
actions creating
interoperable
networks
RDA of Gorenjska,
BSC, Ltd, Kranj (pilot
action) When
municipalities are
choosing GEK to be
the operator of their
E-CS then the new E-
CS are interoperable
and included in the
network promoted
openly on the
informational map.
H H M x 33000
Initiate and support
installation of E-CS
according to EU
standards enabling
interoperable
connection
RDA of Gorenjska,
BSC, Ltd, Kranj
(within a project), role
of PAs: Engagement,
support and
contribution.
M L M x 150,499.5
5
European Regional Development Fund
Report
Pag. 108/202
The prioritization methodology ranking explained in the chapter 3.6.2.2 applies to the Apendix no.6:
Prioritization index weighting table, where the lower the PI the higher the prioritization for the action
and municipality.
Table 18: Action List with prioritization index
ACTION ROLE IMPACT
(H/M/L)
TIME
( S/M/L
term)
ESTIMATED
COST
(H/M/L)
PI
Facilitate
acquisition of
financial
incentives
supporting
municipal
actions in
diffusion of e-
mobility
Ministries with
subventions provided by
Eco Fund; Development
agencies in Gorenjska as
the main supporting
organizations with
nationally and EU
financed projects; Electro
distributers as investors.
H L H 50
Building
knowledge
capacity
concerning E-CS
infrastructure,
operation and e-
mobility
Participation of the
public administration
experts at transnational
events, events organized
by the EU and ministries
such as TEN-T Days,
events that provide
information on funding
opportunities. Regional
development agencies act
as initiators of projects
and organizers of events
to raise knowledge, local,
regional or transregional
learning interactions,
preparation of policy
documents and using the
regional e-HUB platform
as one of the tools.
M L L 50
Initiate and
support
installation of E-
CS according to
EU standards
enabling
Municipalities as
applicants for national
subventions for
purchasing E-CS keep
the condition of EU
standard, interoperability
M L H 60
European Regional Development Fund
Report
Pag. 109/202
interoperable
connection
and in cooperation with
E-CS operators the
integration of the
installed E-CS into
interoperable networks.
Municipalities provide
support through
investments in
infrastructure
(construction work,
network connections,
markings), preparation of
documentation and cover
of user charges.
Regional development
agencies initiate support
with pilot actions and
projects.
Support and
initiate actions
creating
interoperable
networks
The role of PAs is to
support the projects
building knowledge or
infrastructural capacity
for increasing
interoperable connection.
The role of RDAs is to
counsel, support PAs,
prepare and implement
project supporting the
creation of interoperable
networks.
H L M 21
Facilitate
contacts between
PAs and
stakeholders
(companies,
private investors,
private citizens,
...)
Municipalities are the
main actors of
intervention when it
comes to business
stakeholders needing
municipal services or
when it comes to areas of
extended economical,
including touristic,
development.
Development agencies in
Gorenjska as supporting
organizations with
H L M 41
European Regional Development Fund
Report
Pag. 110/202
national and
transnational networks
facilitating contact
between PAs and
business stakeholders.
Actively informing and
cooperating with national
institutes and electricity
distributers regarding the
lack of efficient
electricity grid capacity
and initiating capacity
building of the grid.
H L M 50
Municipalities as
promoters of e-
mobility
Municipality as the main
coordinator between
providers and users of
interoperability. On the
basis of information and
data on priority e-
mobility and
interoperability, the
public administration
(municipality) carries out
the continuous task of
informing and educating
users about the use and
positive effects, and the
accessibility of
equipment, means of
transport, as well as on
the effects of e-mobility
long term.
H
L
L
31
Increase in
number of E-CS
on the public
parking areas
Municipalities own
public spaces, are project
applicants to Eco Fund,
coordinators, are
responsible for
preparation of business
models, are marking
parking spaces with appropriate vertical
signalization and floor
markings, are contractors
with private people, in
case the e-charging
stations are on private
H
M/L
H
Bled municipality:
31
Bled – Petrol: 11
Kranjska Gora: 21
Kranj: 31
European Regional Development Fund
Report
Pag. 111/202
land, and are the payers
for the establishment of
the system (connection to
the grid, constructional
works). Management is
handed to E-CS
operators.
RDAs support
municipalities as
coordinators between
national and local level
in provision of financial
and policy incentives.
Žirovnica: 41
Bohinj: 50
Cerklje na
Gorenjskem: 50
Žiri: 70
Utilize regional
e-HUB platform RDA Gorenjska, BSC,
Ltd., Kranj manages
regional E-HUB – a
website dedicated to
promote and inform
about e-mobility and e-
infrastructure, policies
and mapping of E-CS
infrastructure. Provision
of information by PAs to
the manager of the
website to inform on the
charging network
available to regional and
transnational users and to
promote local actions
connected to e-mobility.
PAs and Development
agencies promote the
website through their
communication channels
to increase visibility.
H L L 31
Support and
initiate creation
of national
informational
platform for e-
charging
infrastructure
under the
management and
control of the
BSC, Ltd, Kranj and
GEK initiated the idea of
unique national
informational platform
for e-charging
infrastructure. The idea is
supported and promoted
by Gorenjske Elektrarne
and Elektro Ljubljana
and a number of
H L L 21
European Regional Development Fund
Report
Pag. 112/202
national public
body.
municipalities in
Gorenjska. Idea is to be
proposed to the
responsible Ministry.
Transit of
vehicles for
public passenger
road transport,
public and
private business
fleets into
electric ones or
run on other
alternative fuels
Municipality awarding
concession for public
transport acting as
facilitators of the transit.
Public - private
cooperation in
facilitating available
national and EU
resources. Development
agencies and dedicated
offices in the Ministries
play a supporting role.
Public organizations
(municipalities, public
institutes, Triglav
National Park …) are
initiators of the change
when it comes to
organizational fleets for
business use. Private
business entities or
private persons may use
national financial
subventions.
M
L
M45
50
Increase number
of E-CS for e-
charging of
vehicles for
public passenger
road transport
and e-vehicles
for business use
– this action is
included
knowing the
investments of E-
Municipalities are the
main coordinators and
initiators of increasing
the e-charging
infrastructure for public
passenger road transport
with cooperation with
private sector or private
investors.
H
L
H/M46
n/a
Public authorities as
owners or co-owners of
e-vehicle fleet for
H M L47 n/a
45 Medium costs for the municipalities due to Eco Fund subventions and private-public partnerships. 46 The investment cost for municipalities depends on national subventions and public-private partnerships; however it may be
high due to infrastructural costs. 47 Cost evaluation for the preparation of the action.
European Regional Development Fund
Report
Pag. 113/202
CS for buses are
predicted.
business use of public
authorities are
responsible for
integrating the diffusion
of E-CS infrastructure
and localization in their
spatial plans and
initiating their actual set-
up. Public administration
will therefore aim to gain
subventions for the
payment of electricity
used on the public E-CS.
Provision of
infrastructure for
public transport
interchange,
P&R systems,
business zones,
airport area
Public authorities are
responsible for
establishment of P&R
systems and public
transportation: regulated
system of distributed
parking lots with support
system - organized forms
of transport with electric
vans and buses.
RDAs play a supportive
role as coordinators of
facilitators of financial
incentives form other
sources.
H L M-H48 41
Reinforce the
electricity grid
by cooperation
of local, national
public and
private
stakeholders
The responsibility of
local energy distributer
and RDA of Gorenjska
with the municipality
responsible is to
encourage activities on
the side of all actors in
order to improve basic
electrical infrastructure.
H M49 L 50
3.6.4 Action table
Tables of actions can be found in the Appendix no5 providing described information of actions by
municipalities according to the action name, strategic objective, area of intervention, action description,
48 Depends who is the investor and what are the costs of municipalities. 49 The time depends on the financial resources and engagement of the municipality.
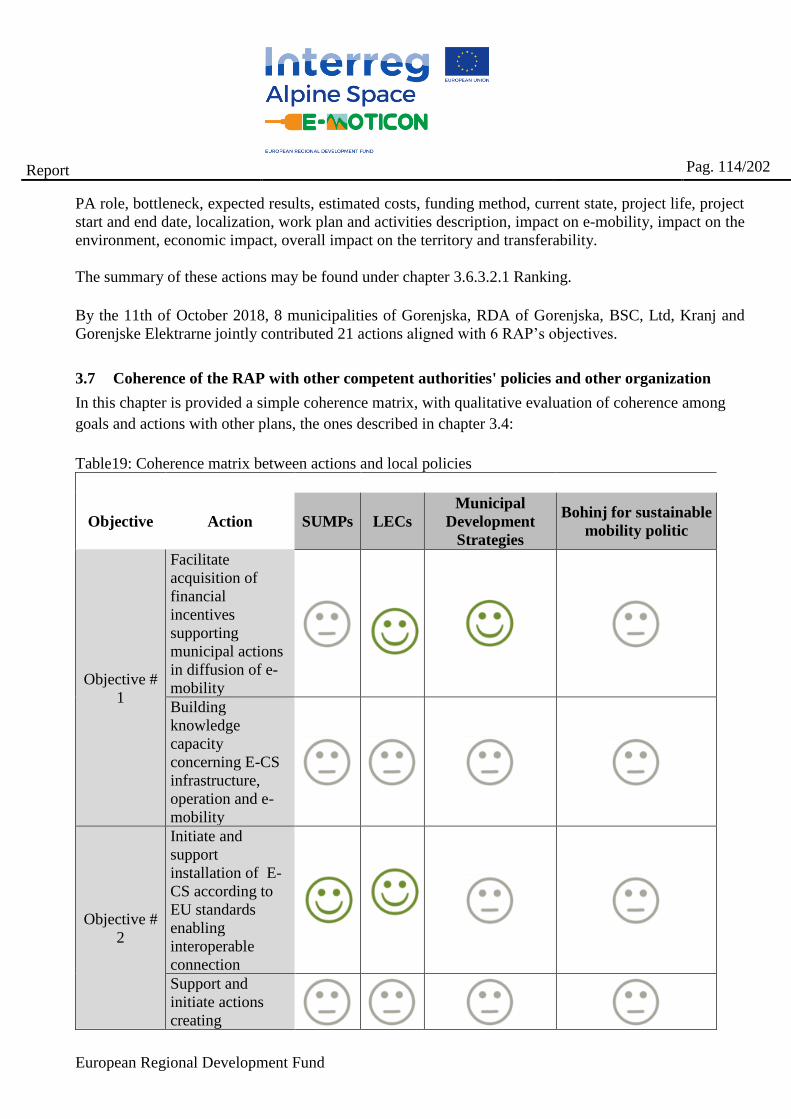
European Regional Development Fund
Report
Pag. 114/202
PA role, bottleneck, expected results, estimated costs, funding method, current state, project life, project
start and end date, localization, work plan and activities description, impact on e-mobility, impact on the
environment, economic impact, overall impact on the territory and transferability.
The summary of these actions may be found under chapter 3.6.3.2.1 Ranking. By the 11th of October 2018, 8 municipalities of Gorenjska, RDA of Gorenjska, BSC, Ltd, Kranj and
Gorenjske Elektrarne jointly contributed 21 actions aligned with 6 RAP’s objectives.
3.7 Coherence of the RAP with other competent authorities' policies and other organization
In this chapter is provided a simple coherence matrix, with qualitative evaluation of coherence among
goals and actions with other plans, the ones described in chapter 3.4:
Table19: Coherence matrix between actions and local policies
Objective Action SUMPs LECs
Municipal
Development
Strategies
Bohinj for sustainable
mobility politic
Objective #
1
Facilitate
acquisition of
financial
incentives
supporting
municipal actions
in diffusion of e-
mobility
Building
knowledge
capacity
concerning E-CS
infrastructure,
operation and e-
mobility
Objective #
2
Initiate and
support
installation of E-
CS according to
EU standards
enabling
interoperable
connection
Support and
initiate actions
creating
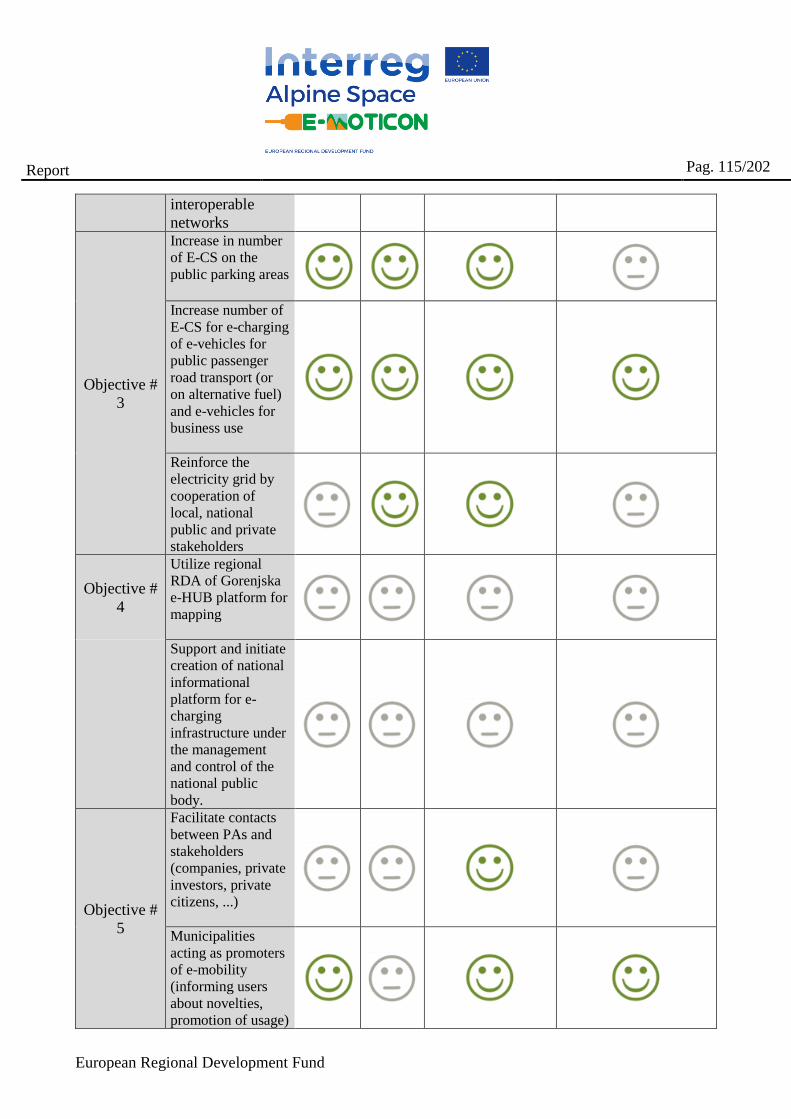
European Regional Development Fund
Report
Pag. 115/202
interoperable
networks
Objective #
3
Increase in number
of E-CS on the
public parking areas
Increase number of
E-CS for e-charging
of e-vehicles for
public passenger
road transport (or
on alternative fuel)
and e-vehicles for
business use
Reinforce the
electricity grid by
cooperation of
local, national
public and private
stakeholders
Objective #
4
Utilize regional
RDA of Gorenjska
e-HUB platform for
mapping
Support and initiate
creation of national
informational
platform for e-
charging
infrastructure under
the management
and control of the
national public
body.
Objective #
5
Facilitate contacts
between PAs and
stakeholders
(companies, private
investors, private
citizens, ...)
Municipalities
acting as promoters
of e-mobility
(informing users
about novelties,
promotion of usage)
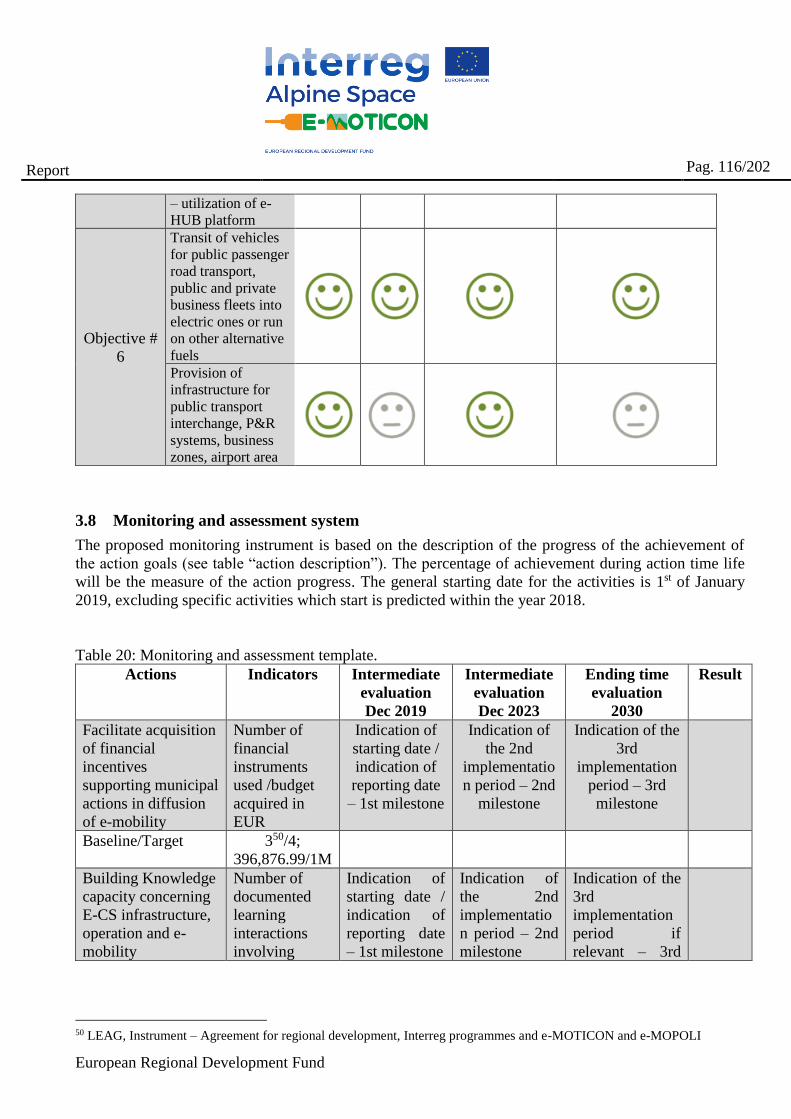
European Regional Development Fund
Report
Pag. 116/202
– utilization of e-
HUB platform
Objective #
6
Transit of vehicles
for public passenger
road transport,
public and private
business fleets into
electric ones or run
on other alternative
fuels
Provision of
infrastructure for
public transport
interchange, P&R
systems, business
zones, airport area
3.8 Monitoring and assessment system
The proposed monitoring instrument is based on the description of the progress of the achievement of
the action goals (see table “action description”). The percentage of achievement during action time life
will be the measure of the action progress. The general starting date for the activities is 1st of January
2019, excluding specific activities which start is predicted within the year 2018.
Table 20: Monitoring and assessment template.
Actions Indicators Intermediate
evaluation
Dec 2019
Intermediate
evaluation
Dec 2023
Ending time
evaluation
2030
Result
Facilitate acquisition
of financial
incentives
supporting municipal
actions in diffusion
of e-mobility
Number of
financial
instruments
used /budget
acquired in
EUR
Indication of
starting date /
indication of
reporting date
– 1st milestone
Indication of
the 2nd
implementatio
n period – 2nd
milestone
Indication of the
3rd
implementation
period – 3rd
milestone
Baseline/Target 350/4;
396,876.99/1M
Building Knowledge
capacity concerning
E-CS infrastructure,
operation and e-
mobility
Number of
documented
learning
interactions
involving
Indication of
starting date /
indication of
reporting date
– 1st milestone
Indication of
the 2nd
implementatio
n period – 2nd
milestone
Indication of the
3rd
implementation
period if
relevant – 3rd
50 LEAG, Instrument – Agreement for regional development, Interreg programmes and e-MOTICON and e-MOPOLI
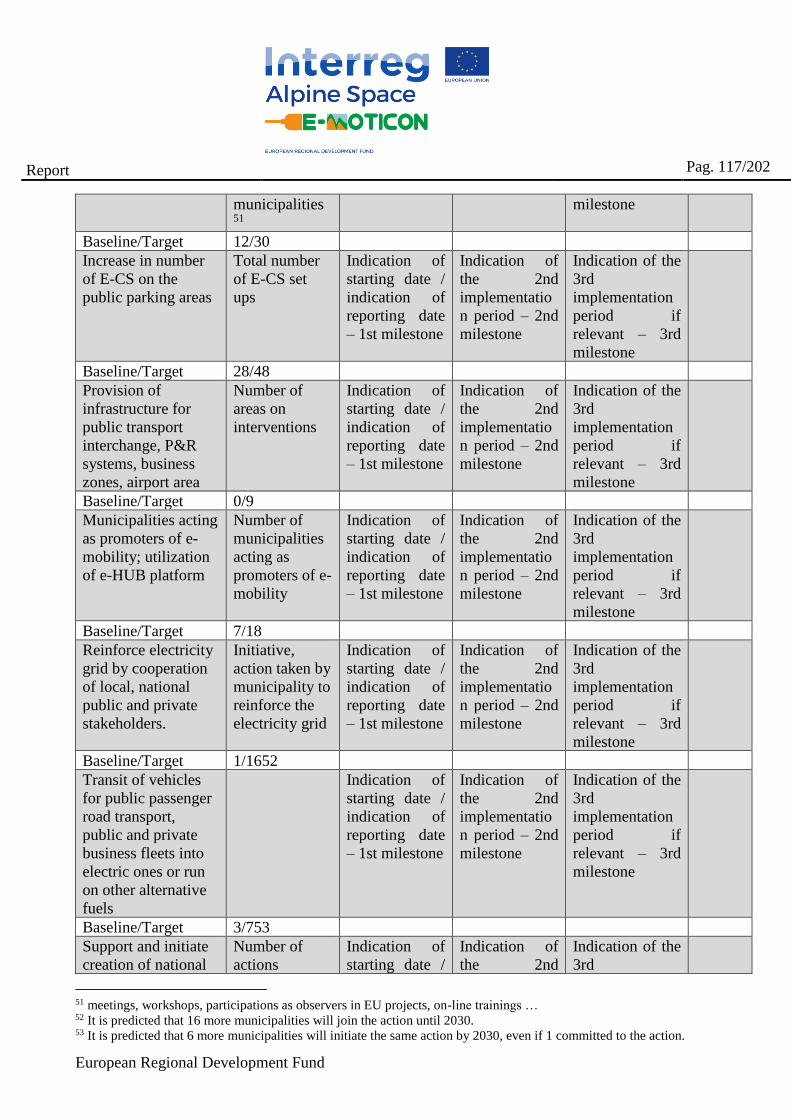
European Regional Development Fund
Report
Pag. 117/202
municipalities51
milestone
Baseline/Target 12/30
Increase in number
of E-CS on the
public parking areas
Total number
of E-CS set
ups
Indication of
starting date /
indication of
reporting date
– 1st milestone
Indication of
the 2nd
implementatio
n period – 2nd
milestone
Indication of the
3rd
implementation
period if
relevant – 3rd
milestone
Baseline/Target 28/48
Provision of
infrastructure for
public transport
interchange, P&R
systems, business
zones, airport area
Number of
areas on
interventions
Indication of
starting date /
indication of
reporting date
– 1st milestone
Indication of
the 2nd
implementatio
n period – 2nd
milestone
Indication of the
3rd
implementation
period if
relevant – 3rd
milestone
Baseline/Target 0/9
Municipalities acting
as promoters of e-
mobility; utilization
of e-HUB platform
Number of
municipalities
acting as
promoters of e-
mobility
Indication of
starting date /
indication of
reporting date
– 1st milestone
Indication of
the 2nd
implementatio
n period – 2nd
milestone
Indication of the
3rd
implementation
period if
relevant – 3rd
milestone
Baseline/Target 7/18
Reinforce electricity
grid by cooperation
of local, national
public and private
stakeholders.
Initiative,
action taken by
municipality to
reinforce the
electricity grid
Indication of
starting date /
indication of
reporting date
– 1st milestone
Indication of
the 2nd
implementatio
n period – 2nd
milestone
Indication of the
3rd
implementation
period if
relevant – 3rd
milestone
Baseline/Target 1/1652
Transit of vehicles
for public passenger
road transport,
public and private
business fleets into
electric ones or run
on other alternative
fuels
Indication of
starting date /
indication of
reporting date
– 1st milestone
Indication of
the 2nd
implementatio
n period – 2nd
milestone
Indication of the
3rd
implementation
period if
relevant – 3rd
milestone
Baseline/Target 3/753
Support and initiate
creation of national
Number of
actions
Indication of
starting date /
Indication of
the 2nd
Indication of the
3rd
51 meetings, workshops, participations as observers in EU projects, on-line trainings … 52 It is predicted that 16 more municipalities will join the action until 2030. 53 It is predicted that 6 more municipalities will initiate the same action by 2030, even if 1 committed to the action.
European Regional Development Fund
Report
Pag. 118/202
informational
platform for e-
charging
infrastructure under
the management and
control of the
national public body
implemented indication of
reporting date
– 1st milestone
implementatio
n period – 2nd
milestone
implementation
period if
relevant – 3rd
milestone
Baseline/Target 0/1
Utilize regional
RDA of Gorenjska
e-HUB platform for
mapping
Number of
active years of
the platform
Indication of
starting date /
indication of
reporting date
– 1st milestone
Indication of
the 2nd
implementatio
n period – 2nd
milestone
Indication of the
3rd
implementation
period if
relevant – 3rd
milestone
Baseline/Target 1/5
Support and initiate
actions creating
interoperable
networks
Number of
measures taken
supporting the
action
Indication of
starting date /
indication of
reporting date
– 1st milestone
Indication of
the 2nd
implementatio
n period – 2nd
milestone
Indication of the
3rd
implementation
period if
relevant – 3rd
milestone
Baseline/Target 154/555
Initiate and support
installation of E-CS
according to EU
standards enabling
interoperable
connections
Indication of
starting date /
indication of
reporting date
– 1st milestone
Indication of
the 2nd
implementatio
n period – 2nd
milestone
Indication of
the 3rd
implementatio
n period if
relevant – 3rd
milestone
Indication of
starting date /
indication of
reporting date –
1st milestone
Baseline/Target 256/357
3.9 Implementation & reporting
The e-MOTICON Regional Action Plan will be implemented during the period 2019-2030, within this
time it shall be monitored by implementation, reviewed and updated in accordance with the outcomes
and needs of the periodic reports – Intermediate evaluations, chapter 3.8 and Quality Status Report in
2030, the EUSALP strategy, the new EU policies, national, regional (i.e. Regional Development Plan
2020 – 2027) and local policies.
54 Pilot action e-TRAIL 55 Initiating preparation of Eco fund call on the bases of RAP; building knowledge capacity regarding interoperability among
PAs by documented learning interventions, issuing guidelines, supporting regional stakeholders, municipal engagement 56 Project and pilot e-TRAIL, 57 Supporting regional stakeholders – execution of the action; initiating the support on the national level; engagement of PAs

European Regional Development Fund
Report
Pag. 119/202
The regional plan will be implemented by means of local measures, guidelines and other agreements and
the proposed and included action tables presented in Appendix no5. The sources of the implementation
will include contracting parties’ national programmes of measures, joint activities and partnerships with
other organisations. Some milestones to support implementation have already been identified.
In order to be able to effectively monitor progress it is necessary to report regional implementation of
the actions set out in this Regional Action Plan.
The Regional Action Plan is an open document that will be updated according to the regional, local
needs and future national policies up to 2030 (i.e. update of the national Action programme for
alternative fuels in traffic, for the period of 2018-2020, prepared June 12th 2018).
European Regional Development Fund
Report
Pag. 120/202
4 COMMUNICATION STRATEGY
This chapter is providing a written reference upon which the progress may be judged. It indicates main
stakeholders and their collaboration. It identifies58:
- Clear and measurable communications objectives with evaluation
- Relevant audiences and available channels
- A plan of activities and a timetable
- Communication risks and mitigation
- Resources – financial and people.
4.1 Main regional, national and other stakeholders
Main regional stakeholders in the Gorenjska region are represented by regional development agencies,
local public authorities (i.e. municipalities, tourism institute), local economic sector and general public;
whereas national stakeholders are ministries, public agencies, NGOs and research institutes; from
economic sector auto-moto industry and producers of equipment and software for e-charging
infrastructure and supportive infrastructure, electricity providers and electricity distributers, E-CS
owners and service providers. Another segment of stakeholders are international funding institutions,
providing ERDF, CEF and other financial instruments and transnational partnership consortiums.
All mentioned stakeholder groups are important for achieving goals of this action plan, even though they
play different roles in the promotion. The communication strategy of this Action plan will focus on
public authorities in Gorenjska region – 18 municipalities, with mentioning of tourism institute
(Tourism Bohinj) and Triglav National park; regional electro distributer Gorenjske Elektrarne and
national public administration (e.g. Ministry of infrastructure).
4.2 Measurable communications objectives with evaluation
Communication objectives relate to the implementation of the Action plan in the next years. The
objectives are implementation of the set actions covering three main segments:
- Promoting e-mobility, raising awareness and changing behaviors
- Facilitating implementation of e-mobility and infrastructure
- Acquiring resources – human and financial
In the process of communicating the objectives they are: A. drivers, the people, organizations who are
initiating and promoting the actions leading to the objectives, B. influencers, who, which might not be
drivers; however they are influencing opinions and final results and C. supporters who support the
actions financially, politically or with other means.
58 University of Oxford, Writing a communications strategy, 2016
European Regional Development Fund
Report
Pag. 121/202
Stakeholders who are pro e-mobility will partner in the actions. The ones who show interest however are
hesitant or opposed need to be persuaded to take action. For those who show no interest the aim is to
capture their attention. Third parties may be used to help persuade and create interest.
4.2.1 Promoting e-mobility, raising awareness and changing behaviours
Changing behaviours is a long term process initiated by raising awareness by promoting e-mobility. It
takes involvement of many different stakeholders segmenting and addressing target groups by custom
made approaches.
This Action Plan combines 2 actions for promotion of e-mobility from 4 municipalities, 4 actions from
RDA of Gorenjska, including up-keep of the e-HUB e-mobilitygorenjska.si website for the regional
promotion of e-mobility. The mentioned two actions address promotion by educating the users and
potential users of all generations, beginning with kindergartens and elementary schools. One action is
described generally and the other specifically targeting beside adults, children as well, changing
behaviors long run.
Other promotional actions not described in the main document, still being implemented are actions
initiated by Elektro Gorenjska that will keep motivating the municipalities for the investments in e-
mobility infrastructure and initiation of activities to upgrade the existing electrical grid for further
development of e-mobility infrastructure.
Gorenjske elektrarne and BSC, Ltd, Gorenjska has agreed to initiate and support the idea of a national
joint e-mobility infrastructure platform in the ownership and operation of the Ministry of infrastructure
that will nationally and internationally promote e-mobility. The Ministry will act as a driver and
influencer and the 2 mentioned organizations as supporters.
BSC, Ltd, Kranj in for the next 5 years committed to promote e-mobility by projects. Some are
supporting the diffusion of e-infrastructure and one on-going, the cooperation with the Ministry of
infrastructure for the promotion of e-vehicles and vehicles on other alternative fuels. This will be
supported by transnational European partnership network and ERDF funds. This action is supported by
1 municipality action in this document. However they are more municipalities in Gorenjska region
supporting this idea, without officially stating the action in this document.
These above mentioned actions will be a tool of persuasion for the local and other stakeholders that are
hesitant or opposed to the implementation of e-mobility and will aim to attract the indifferent
stakeholders.
Total number of promotional actions is therefore higher that described actions by municipalities. It has
to be taken into an account that the promotion of e-mobility will be initiated by the municipalities and
other regional stakeholders not contributing to this document.
Table 21: Identified promotional actions and actors
Action Actors Measure
General promotion of e-mobility 3 municipalities Annualy no. of actions for the
promotion/11 years/ baseline 0/
European Regional Development Fund
Report
Pag. 122/202
target 1 per year
Promotion of e-mobility addressing
specific target groups
1 municipality 11 years / baseline 0 / target 1 per
year
Promotion of e-mobility by website RDA of Gorenjska Baseline 1 year/ target 11 years
Promotion of e-mobility by transnational
projects RDA of Gorenjska Baseline 3 / target at least 1
additional in the next 5 years.
Promotion of e-mobility by national
informational e-infrastructure platform
Ministry of
infrastructure,
RDA of Gorenjska,
GEK
Baseline 0 / target 1
4.2.2 Facilitating implementation of e-mobility and infrastructure
Facilitating implementation of e-mobility and infrastructure can be a latent way of promotion. It helps
by the first objective of raising awareness and changing behaviors. Users of e-vehicles and e-charging
infrastructure are promoters on their own, promoting by example and if properly utilizing their
experience also by their feedback on e-mobility. Potential users of e-vehicles and e-charging
infrastructure get a strong massage of the change and opportunity when seeing the set-ups of e-charging
infrastructure and e-vehicles on the road. Auto-moto industry and producers of equipment and software
for e-charging infrastructure are playing one of the mayor roles in diffusion of e-mobility. They are
responsible for provision of equipment and e-vehicles attractive by design, function, comfort, price and
availability to the customer. If one or more of this segments is unattractive other stakeholders driving
and influencing the transfer to e-mobility will have a harder job at achieving tangible results.
This Action Plan combines 7 types of actions for promotion of e-mobility by facilitating implementation
of e-mobility and infrastructure. 6 municipalities and RDA of Gorenjska committed to implement 16
actions. Beside submitted actions by regional stakeholders, GEK as operator of interoperable E-CS
network, regional electro distributer and owner of E-CS network is initiating promotion of e-mobility
infrastructure.
Actions of e-mobility implementation and infrastructure can be utilized promotionally. Every set up and
initiation of operation of E-CS, construction of P&R systems, setting up interoperable networks of E-CS
and similar actions have to be made official, accompanied by promotional activities and supported by
the Mayor of the municipality. A person within every municipal administration needs to be delegated for
the responsibility of promotional activities utilizing every opportunity and media channel (online, paper,
radio, TV, spreading a rumor, on the spot by signs …) to promote e-mobility and infrastructure. It is
advised that every event is promoted before the event happening and after the event.
Table 22: Identified promotional actions and actors
Action Actors Measure
Promotion of mobility by
initiating projects implementing
e-mobility infrastructure
GEK Baseline implementation of 14
E-CS / target by 2030, 50 E-CS
installations.
Promotion of diffusion of e-
vehicles and vehicles on
RDA of Gorenjska,
municipality/s, Ministry of
Number of actions taken for
diffusion of AFVs. Baseline 5
European Regional Development Fund
Report
Pag. 123/202
alternative fuels (AFV) infrastructure, transnational
cooperation
(project e-MOPOLI, national
legislation, hybrid bus in Kranj,
fleet change of TNP), e-vehicle
for public maintenance Bohinj /
target 6 additional (at least 4
municipalities purchasing AFVs,
1 strategic national policy
change, 1 promotional process
initiated)
Promotion of mobility by
initiating projects implementing
e-mobility infrastructure
Municipalities Baseline 28 E-CS / target 15
action implemented combining
10 actions of E-CS set ups (over
26 E-CS), 2 P&R systems,
enforcing the electricity grid
system and 2 other actions.
4.2.3 Acquiring resources – human and financial
Every attempt of promotion depends on resources. Every stakeholder dedicated to implementing e-
mobility and dedicated infrastructure has to identify and consider, reserve available human and financial
resources to reach the objective.
Well-chosen human resources bring in the needed financial resources. Public authorities, when choosing
the right people for the promotional activities, need to be attentive to the following:
- Is the person chosen for the job interested in the topic to be covered or in the delegated task?
- How good are the communication skills of the person chosen for the job?
- What are the person’s skills and knowledge and do they fit the job requirements?
- Is a person well representing oneself?
- Is the person acceptable for the audience?
- Is a person camera shy, prepared to do the interviews if needed, have speeches …?
- Is the one a busy or a productive person?
- Can the person chosen accept constructive suggestions for improvement and is one keen to
learn?
- Is a person flexible to adjust and mitigate crises?
- What is one’s working ethic; will a person bring an added value to the promotional activities
or just do the job?
- What are the expectations?
Financial resources can be acquired by several financing instruments provided by European and national
funds. For the municipalities interested to gain financial resources for e-mobility and e-mobility
infrastructure they might already know:
- Eco Fund, Fund for climate change
- LEAG
- Cohesion funds
- Nonrefundable co-financing instrument Environmental LIFE programme
European Regional Development Fund
Report
Pag. 124/202
- Nonrefundable co-financing instrument ERDF fund
- Nonrefundable financing instrument Connecting Europe Facility (CEF), IPE – investment
plan for Europe
- European Fund for Strategic Investments (EFSI)
- Combination funding: CEF + EFSI + EIB (EIAH) + SID + private capital
- For investments and energy grid planning: Horizon 2020 Energy Efficiency and intelligent
Energy Europe
One action has been noted directly in the Action plan and one indirectly, indicating municipal
acquisition of Eco Fund financing.
Table 23: Identified promotional actions and actors promoting by utilizing financial and human
resources.
Action Actors Measure
Promoting e-mobility by
facilitating acquisition of
financial incentives supporting
municipal actions in diffusion
of e-mobility.
RDA of Gorenjska, BSC, Ltd,
Kranj
Baseline 359 / target at least 3
additional
4.3 Relevant audiences and available channels
Municipalities and other public authorities can play an important role in e-mobility promotion, leading
by example, by policy making and implementation and active promotion on the events (attending the
events, photographing, making speeches …). Concerning municipalities, the mayors are the first to
communicate the e-mobility support to the general public as well as to the economic sector. Since the
municipalities are in the position of giving concessions to private companies responsible for the public
passenger road transport they should set a quota of e-vehicles and other vehicles on the alternative fuels,
in the fleet of passenger road public transport. By every change of fleet this quota should be applied.
This kind of decision making sends a strong massage of change to all audience.
Depending on who is communicating to whom and what, the relevant groups of audience to be
addressed for the promotion of e-mobility are:
- Economic stakeholders
- Public administration, policy makers
- Trend setters, lobysts
- Regional development agencies
- Institutes
- NGOs
- General public, all generations.
59 E-MOTICON, E-MOPOLI, LEAG
European Regional Development Fund
Report
Pag. 125/202
Channels available to be used are60:
- Media: local, national, international; print, broadcast, web, social
- Lobbying: local and national government, funding bodies, special interest groups
- Marketing: brand, website, advertising, brochures, fliers, video
- Events: conferences, launch events, public speeches, tours of building sites, study visits
4.4 A plan of activities and a timetable
Properly planning promotional activities and implementing them creates a positive image and a good
name to an organisation or a cause. Promoting e-mobility is promoting cleaner environment, reduction
of noise, different user behaviors, different use of energy and a different way of living. Therefor one
should not do it only randomly, when opportunity occurs, even though this is also affective to a point,
it’ll not build an overall image, position, “brand”. It will not support the vision effectively. It is
recommended that municipalities plan the promotional activities annually and create a time table.
Since stakeholders are very much engaged in different activities timing is important. Scheduling the
timetable from the deadline backwards is an approach helping to avoid obstacles, pressure and time
congestions. Always planning a time buffer is essential. Other important aspects are: creating a
timetable of all activities, identifying points of attraction, media coverage, available spokes people and
places of venues, properly plan invitations and registrations, prepare affective monitoring and be
reactive to deviations.
Table 24: planning promotional activities for Action plan, example
May 2019 September 2019 December 2019
Media Announce set-up of new
charging stations, set up
interview, engage
stakeholders
Inform about the
progress
Organize a promotional
event, propose an
interview, engage
mayor
Publications Contact tourism
stakeholder, arrange the
meeting for integration
of the e-mobility
infrastructure change in
the brochure
Print the materials Distribute the brochures
at the opening event
Event Plan the invitation list,
venue, catering,
speakers – do the event
plan
Send out invitations;
engage in the
preparation of the
content.
Execute the event
60 Oxford, 2016
European Regional Development Fund
Report
Pag. 126/202
4.5 Communication risks and mitigation
Even if perfectly planning a project of promotional activity there is always a risk that something goes
wrong. Therefor it is important to identify potential risks preventing achievement of the goal, even very
basic like, what if the responsible person gets ill, who is acting as a wing person? Or where, how one
should act in case of rain at the open event? Who should step in as a substitute for the spoke person if
first choice is not available at that time? Therefor it is important to identify them ahead, consider the
reaction of the involved and mitigate the risks. It is always good to have a plan B.
Always set the monitoring system to verify the results.
4.6 Resources – financial and people, in general
Resources are the most important aspect in every activity, thus as well in promotion, especially since the
promotion may be find in almost every activity. Human resources are the biggest asset and more
important than the financial resources. It is crucial to select the right people for the job.
In terms of creating a team, the responsible needs to define:
- The needs to be addressed to achieve the goal
- Identify the skills, knowledge and character of a person
- Identify inter relations within a team to match, make the right choice of people.
Each of the persons in a team needs to be empowered to do their job independently by the highest
standard, still having the support if needed. Praise is as important if the job is done well as the
consequences if the job is not done well. Measures to avoid mediocracy or worse have to be pre-
established. The concept of empowerment relates to gaining the knowledge, skills to execute the job as
well as to be free in how to do the job to the expected standard. It is important to know the strengths and
deficiencies of the people to fill in the gabs and act, manage, delegate the work accordingly. For every
team as well as for an organization it is essential to identify talents and potentials, protect and invest in
them, to keep or develop them. People destructive to the team or organization’s culture, environment in
general need to be removed from the team or disempowered, even if in average having good results.61
Regarding the financial resources, public authorities (municipalities and other) have an annual budget,
with a very specified plan of costs and few options for rebalancing. It is essential that the organization
expecting funds from municipalities or other public authorities gives a precise evaluation and
description of the cost, investment with results envisaged, conditions and prioritisation to manage
peoples’ expectations, to the deadline set by public authorities. Gaining funding from other sources
(national or EU funds) is an added value. Therefor municipalities have already defined sources of
financing. The support of external organizations, like regional development agency, is helpful in the
acquisition of additional financial resources.
61 This has been recommended by top 5 Slovenian managers, stating that those kinds of people are negatively influencing the
organisational climate, destroying the potential of harmonious development and growth of the other individuals, the team or
the organization.
European Regional Development Fund
Report
Pag. 127/202
5 CONCLUSION
The role of the public administration of the e-mobility promotion and cooperation with all relevant
stakeholders is crucial in this stage of diffusion of e-mobility. The most important impact that the public
authorities may have on the e-mobility and mobility on other alternative fuels is creating corresponding
policies supporting the transition to the new way of energy use and mobility.
Additional promotion is setting up public E-CS infrastructure and changing their own fleets to electric
ones.
There is much to consider, from spatial planning, electricity generation, distribution, grid reinforcement,
e-charging infrastructure – considering: how many multi-dwelling settlements with no or open parking
lots are in the territory, how many with garages where E-CS can be established, how many single
residential homes are in the area and how many of those have the option of home e-charging station;
what is the e-charging capacity in business or public service facilities; touristic areas: where are touristic
flows, where are transit areas, commercial areas, industrial areas and what are the needs of the e- or
other alternative fuel charging infrastructure regarding the type of vehicles used? Currently the co-
financing support for the charging infrastructure of AFV (grants) is dedicated to public authorities.
Otherwise these considerations are in domain of private investors.
Informational platforms for E-CS infrastructure, interoperability and roaming systems are, should be
policy regulated and this is another role of public administration where they are in power and should be
responsible. According to the territorial analysis of the needs, they should set the percentage of non-
interoperable E-CS allowed or needed.
There is still a lack of interest from some local public authorities in supporting e-mobility and e-
charging infrastructure by financial means; because the subventions are a small part of the whole
investment and a lot of times the long and short term costs of investing in e-charging infrastructure are
too high for the municipal budget. The highlight is that private investors are more and more interested in
investing into e-mobility.
The E-CS infrastructure is in relation to the demand sufficient and spreading. The services are
improving. The downside is that the user will need to wait a while until the ad-hoc payment solutions
with credit are implemented also in the current E-CS services, which is already the standard in some
other Alpine space countries and required by European legislation. As well in this case policy makers
play a crucial role, regardless whether are on the local or national level.
The demand side is still lacking. Promotion of e-vehicles and vehicles on other alternative fuels is
another process that is being initiated. Public authorities need to start preparing policies supporting the
acquisition of e-vehicles and other vehicles on alternative fuel.
Promotion of e-mobility is manifested in many ways. Public administration has to consider measurable
communication objectives with evaluation, identify and address relevant audience and use available
communication channels, properly plan activities and timetables, identify risks and mitigate them. All of
the stated can only be done by identifying and acquiring resources.
European Regional Development Fund
Report
Pag. 128/202
Even though all municipalities have been invited to contribute to this document, 10 out of 18 responded
and 9 gave the contribution of actions. For the 8 non responding municipalities one may speculate that
they are satisfied with the actions described in their local documents and they haven’t seen the need to
be included in the regional action plan.
From 18 municipalities and other private entities invited to give the suggestions for slogan and votes on
the proposed ones, 6 municipalities of Gorenjska, 1 regional development agency and 1 electro
distributor voted on the e-mobility slogan for Gorenjska and the most vots got: E-mobility on the way
with me. (E-mobilnost z menoj na poti.)
European Regional Development Fund
Report
Pag. 129/202
6 SOURCES
Directive 2014/94/EU of the European parliament and of the council. August 2018. https://eur-
lex.europa.eu/legal-content/en/TXT/?uri=CELEX%3A32014L0094
Life Cycle Assessment - JRC "ILCD Handbook. General guide for Life Cycle Assessment: detailed
guidance", EUR24708 EN (2010).
European Council (23 and 24 October 2014) - Conclusions on 2030 Climate and Energy Policy
Framework, SN 79/14, 23 October 2014.
European Commission, 2018. Mobility and transport, The Core Network Corridors. August 2018.
https://ec.europa.eu/transport/themes/infrastructure_en
Official Journal of the European Union – L323/15 dell’8.12.2007. December 2017.
http://www.alpconv.org/en/convention/protocols/Documents/transportprotocolEN.pdf
EAFO, European Alternative Fuels Observatory, 2018. August 2018. https://www.eafo.eu/
Agencija za energijo. June 2017. Report on the Energy sector in Slovenia for 2016. April 2018.
https://www.agen-rs.si/documents/54870/68629/Report-on-the-energy-sector-in-Slovenia-for-
2016/de8cc94f-b3f6-4d32-8e79-ce3b0ec386f5
Vlada Republike Slovenije. Energy Act 2014 (Energetski zakon (Uradni list RS, št. 17/14 in 81/15)).
April 2018. http://www.pisrs.si/Pis.web/pregledPredpisa?id=ZAKO6665
Government of the Republic of Slovenia. Decree on renewable energy sources (RES) in transport 2016
(Uredba o obnovljivih virih energije v prometu (Uradni list RS, št. 64/16)). April 2018.
http://www.pisrs.si/Pis.web/pregledPredpisa?id=URED6634&d-49683-s=2&d-49683-p=1&d-49683-
o=2
Ministry of Infrastructure. 2015. The Transport Development Strategy in the Republic of Slovenia 2015.
April 2018.
http://www.mzi.gov.si/fileadmin/mzi.gov.si/pageuploads/DMZ/Strategija_razvoja_prometa_v_RS/Strat
egija_razvoja_prometa_v_RS-koncna_razlicica.pdf
Government of the Republic of Slovenia. The Resolution on transport policy of the Republic of Slovenia
(Resolucija o prometni politiki Republike Slovenije (Intermodalnost: čas za sinergijo) (RePPRS)).
Uradni list RS, št. 58/06. April 2018. http://www.pisrs.si/Pis.web/pregledPredpisa?id=RESO14
Ministry of the Environment and Spatial Planning: B. Bartol, et al. 2004. Spatial Development Strategy
of Slovenia. April 2018.
http://www.mop.gov.si/fileadmin/mop.gov.si/pageuploads/podrocja/prostorski_razvoj/SPRS_angleska_
verzija.pdf
European Regional Development Fund
Report
Pag. 130/202
Ministry of Infrastructure. October 2017. Strategija na področju razvoja trga za vzpostavitev ustrezne
infrastrukture v zvezi z alternativnimi gorivi v prometnem sektorju v Republiki Sloveniji. April 2018.
http://www.energetika-
portal.si/fileadmin/dokumenti/publikacije/alternativna_goriva/strategija_alternativna_goriva_final.pdf
Government of the Republic of Slovenia. Official Gazette RS (Uradni list). September 2017. Annual
Fee on the Use of Motor Vehicles Act, Official Gazette RS, No. 57/08. April 2018. https://www.uradni-
list.si/glasilo-uradni-list-rs/vsebina/2017-01-2435/zakon-o-dajatvahza-motorna-vozila-zdajmv
Presentation of Mr. Bojan Žlender, of Ministry of Infrastructure. Ljubljana, 14.3.2018
Statistical office of the Republic of Slovenia (SURS), Regions in number (Regije v številkah). October
2018 https://www.stat.si/StatWeb/File/DocSysFile/9374/regije_v_stevilkah_2017.pdf,
https://www.stat.si/obcine
Ministrstvo za infrastrukturo, Direkcija Republike Slovenije za infrastrukturo. Ceste, Železnice. October
2018. http://di.gov.si
Statistical office of the Republic of Slovenia (SURS). 2014. Preddvor – Slovenske regije in občine v
številkah. August 2018. https://www.stat.si/obcine/sl/2014/Municip/Index/128
Ministry of the Environment and spatial planning, Slovenian Environment Agency. ARSO okolje,
Kazalci okolja. 2018. Kazalci okolja v Sloveniji. Avgust 2018.
http://kazalci.arso.gov.si/?data=group&group_id=4
European Environment Agency. Dec. 2017. Emissions of air pollutants from transport. August 2018.
https://eea.europa.eu/data-and-maps/indicators/transport-emissions-of-air-pollutants-8/transport-
emissions-of-air-pollutants-5
Gorenjske Elektrarne Group. 2018. Annual report 2017. Avgust 2018. https://www.elektro-
gorenjska.si/resources/files/pdf/porocila/KLPEG_2017_EN_interaktivni.pdf
D. Zavrl Žlebir. Merijo kakovost zraka in hrup. Kranj: Gorenjski Glas, March 2018. August 2018.
http://gorenjskiglas.si/article/20180305/C/180309906/1020/merijo-kakovost-zraka-in-hrup
Government of the Republic of Slovenia. Official Gazette RS (Uradni list, Glasilo Uradni list RS).
Uradni list RS, no. 108/2013, 20. 12. 2013. 3945. Decree on the Air Quality Plan in the Municipality of
Kranj, page 12505. https://uradni-list.si/glasilo-uradni-list-rs/vsebina/2013-01-3945/odlok-o-nacrtu-za-
kakovost-zraka-na-obmocju-mestne-obcine-kranj. August 2018
Ministry fo the Environment and Spatial Planning, Slovenian Environmental Agency (ARSO), Air
quality - data, Exeeding PM10, 2017. September 2018.
http://arso.gov.si/zrak/kakovost%20zraka/podatki/2017_PM10Preseganja.pdf
M. Perdan. Vse več električnih vozil. Kranj: Gorenjski Glas, October 2017. August 2018.
http://www.gorenjskiglas.si/apps/pbcs.dll/article?AID=/20171002/C/171009978&template=printart
European Regional Development Fund
Report
Pag. 131/202
T. Podgornik, P. Filipič, M. Jazbinšek, et al. 2017. Sustainable Urban Mobility Plan Bled. Bled:
Municipality Bled.
T. Podgornik, P. Filipič, M. Jazbinšek, et al. 2017. Sustainable Urban Mobility Plan Jesenice:
Municipality Jesenice.
G. Jovanović, D. Lavrič, P. Lovšin, et al. 2017. Sustainable Urban Mobility Plan Železniki:
Municipality Železniki
B. Bensa, M. Klun, A. Cundrič, C. Gregorc, et al. 2017 Sustainable Urban Mobility Plan Škofja Loka:
Municipality Škofja Loka.
PNZ svetovanje projektiranje d.o.o. 2017. Sustainable Urban Mobility Plan Kranj: Municipality Kranj
G. Pretnar, et al. 2017. Sustainable Urban Mobility Plan Radovljica: Municipality Radovljica.
L. Kobetič, N. Lipušček, N. Britovšek, et al. 2017. Sustainable Urban Mobility Plan Šenčur:
Municipality Šenčur.
M. Golc Goropečnik. 2011. Local Energy Concept Action plan Bohinj: Municipality Bohinj
B. Caglič, K. Caglič, E. Kodrun, R. Caglič. 2011. Local Energy Concept Action plan Jesenice:
Municipality Jesenice.
Eco Consulting, Ltd. 2008. Local Energy Concept of the municipality Cerklje na Gorenjskem:
Municipality Cerklje na Gorenjskem.
Marošek J. 2015. Development strategy of Jezersko municipality 2015-2020+: Municipality jezersko.
Lokalna energetska agencija Gorenjske, ENVIRODUAL, d.o.o. 2012. Local Energy Concept of
municipality Jezersko: Municipality Jezersko.
K&Z, Svetovanje za razvoj d. o. o., Smart G., Štefe T. 2016. Sustainable Development Strategy of the
Municipality of Preddvor with emphasise on tourism 2016-2026: Municipality Preddvor.
ApE – Agencija za prestrukturiranje energetike, d.o.o. 2010. Local Energy Concept of Preddvor
municipality: Municipality Preddvor.
Eco Consulting, d.o.o., Šaver A. 2011. Local Energy Concept of Radovljica municipality: Municipality
Radovljica.
ENVIRODUAL, trajnostno okoljsko in energetsko upravljanje, raziskave in izobraževanje, d.o.o. 2011.
Local Energy Concept of Šenčur municipality: Municipality Šenčur.
European Regional Development Fund
Report
Pag. 132/202
OIKOS, svetovanje za razvoj, d.o.o., Durgutović A., et al. 2012. Local Energy Concept of Škofja Loka
municipality: Municipality Škofja Loka.
Lokalna energetska agencija Gorenjske; ENVIRODUAL, trajnostno okoljsko in energetsko upravljanje,
raziskave in izobraževanje, d.o.o. 2015. Sustainable Energy Action Plan of the Municipality of Tržič:
Municipality Tržič.
Eco Consulting, d.o.o., Energija, Okolje, Ekonomija. 2012. Local Energy Concept of municipality
Železniki: Municipality Železniki.
Lokalna energetska agencija Gorenjske; ENVIRODUAL, trajnostno okoljsko in energetsko upravljanje,
raziskave in izobraževanje, d.o.o. 2012. Local Energy Concept of municipality Žiri: Municipality Žiri.
T. Podgornik, M. Marinšek, N. Zupan. 2016. Local Energy Concept of municipality Žirovnica:
Municipality Žirovnica.
B. Gašperlin. 2012. Local Energy Concept of municipality Gorje: Municipality Gorje.
Eco Consulting, d.o.o., Energija, Okolje, Ekonomija, Kmetec U., Šaver A. et al. 2010. Local Energy
Concept of municipality Bled: Municipality Bled.
Pogačnik K. 2010. Local Energy Concept of municipality Naklo: Municipality Naklo
K&Z, Svetovanje za razvoj d. o. o.. Zupan S. 2017. Strategy of sustainable development of Bohinj
municipality 2025+: Municipality Bohinj.
Municipality Bohinj. 2017. Bohinj for Sustainable traffic policy: Municipality Bohinj.
D. L. Olson, Multi-criteria analysis: a manual. 1995. www.communities.gov.uk - community,
opportunity, prosperity
J. Rezaei. 2015. A Systematic Review of Multi-criteria Decision-making Applications in Reverse
Logistics. Transportation Research Procedia: Volume 10, Pages 766-776.
The Journal of Multicriteria Decision Analysis (John Wiley & Sons, Ltd)
D. L. Olson, H. M. Moshkovich, R. Schellenberger, A.I. Mechitov. Consistency and Accuracy in
Decision Aids: Experiments with Four Multiattribute Systems, Volume 26, Issue 6-Nov.1995 - Pages
723–747
Von Neumann, J, and Morgenstern, O. (1947). Theory of Games and Economic Behaviour, second
edition, Princeton University
L.J. Savage (1954) The Foundations of Statistics Wiley, New York, NY
European Regional Development Fund
Report
Pag. 133/202
R. Atkinson (December 1999). "Project management: cost, time and quality, two best guesses and a
phenomenon, its time to accept other success criteria". International Journal of Project Management. 17
(6): 337–342. doi:10.1016/S0263-7863(98)00069-6
B. N. Baker, D.C. Murphy and D. Fisher. 1983. Factors affecting project success in: D.I. Cleland and
W.R. King, ed. Project Management Handbook. New York Van Nostrand Rein-hold
V. Pearson, C. Culver, Writing a communications strategy15 January 2016. University of Oxford.
Found on the web 22. 10. 2018,
https://www.ox.ac.uk/sites/files/oxford/media_wysiwyg/Writing%20a%20communications%20strategy
%20%2818.02.16%29.pdf
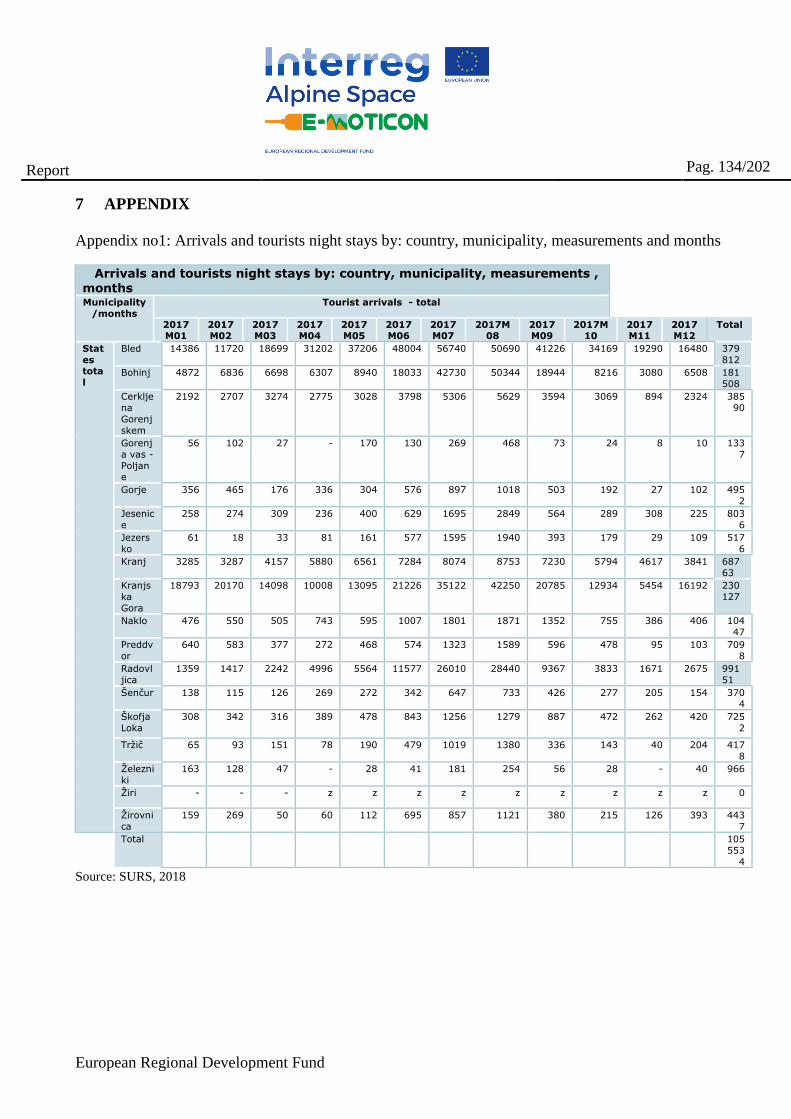
European Regional Development Fund
Report
Pag. 134/202
7 APPENDIX
Appendix no1: Arrivals and tourists night stays by: country, municipality, measurements and months
Arrivals and tourists night stays by: country, municipality, measurements ,
months Municipality
/months
Tourist arrivals - total
2017M01
2017M02
2017M03
2017M04
2017M05
2017M06
2017M07
2017M08
2017M09
2017M10
2017M11
2017M12
Total
Stat
es tota
l
Bled 14386 11720 18699 31202 37206 48004 56740 50690 41226 34169 19290 16480 379
812
Bohinj 4872 6836 6698 6307 8940 18033 42730 50344 18944 8216 3080 6508 181
508
Cerklje
na
Gorenj
skem
2192 2707 3274 2775 3028 3798 5306 5629 3594 3069 894 2324 385
90
Gorenj
a vas -
Poljane
56 102 27 - 170 130 269 468 73 24 8 10 133
7
Gorje 356 465 176 336 304 576 897 1018 503 192 27 102 495
2
Jesenic
e
258 274 309 236 400 629 1695 2849 564 289 308 225 803
6
Jezers
ko
61 18 33 81 161 577 1595 1940 393 179 29 109 517
6
Kranj 3285 3287 4157 5880 6561 7284 8074 8753 7230 5794 4617 3841 687
63
Kranjs
ka
Gora
18793 20170 14098 10008 13095 21226 35122 42250 20785 12934 5454 16192 230
127
Naklo 476 550 505 743 595 1007 1801 1871 1352 755 386 406 104
47
Preddv
or
640 583 377 272 468 574 1323 1589 596 478 95 103 709
8
Radovl
jica
1359 1417 2242 4996 5564 11577 26010 28440 9367 3833 1671 2675 991
51
Šenčur 138 115 126 269 272 342 647 733 426 277 205 154 3704
Škofja
Loka
308 342 316 389 478 843 1256 1279 887 472 262 420 725
2
Tržič 65 93 151 78 190 479 1019 1380 336 143 40 204 417
8
Železni
ki
163 128 47 - 28 41 181 254 56 28 - 40 966
Žiri - - - z z z z z z z z z 0
Žirovni
ca
159 269 50 60 112 695 857 1121 380 215 126 393 443
7
Total 105
553
4
Source: SURS, 2018
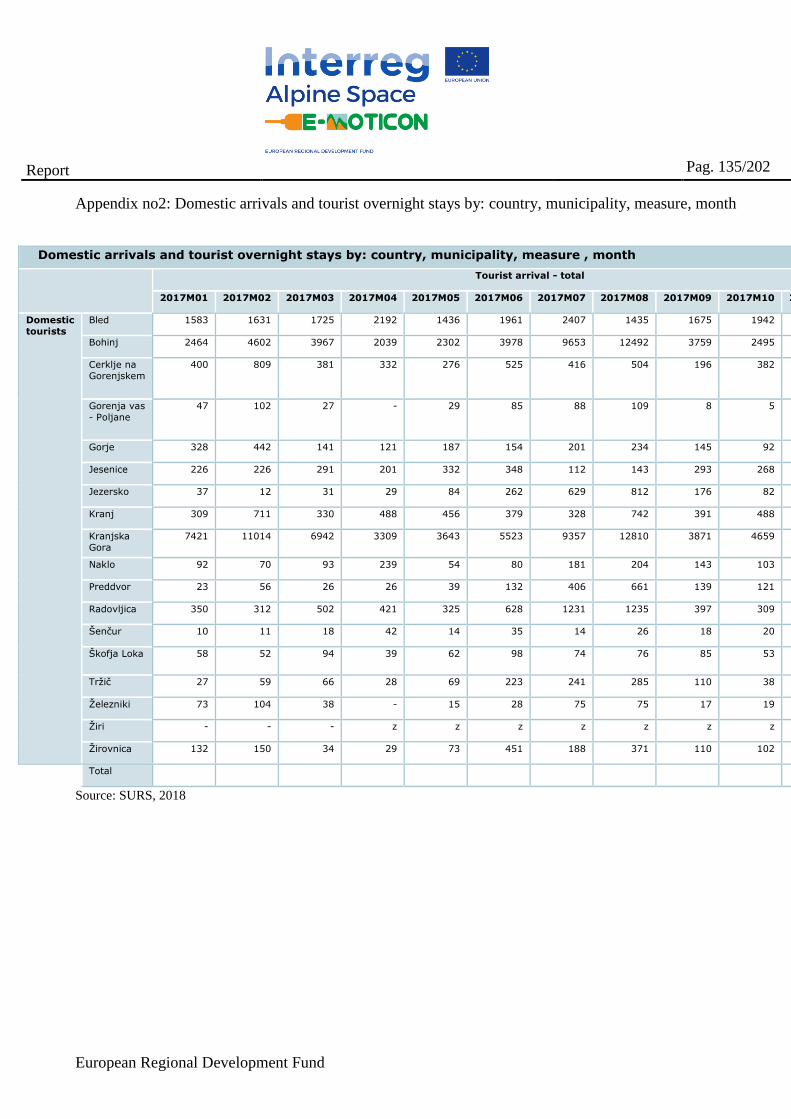
European Regional Development Fund
Report
Pag. 135/202
Appendix no2: Domestic arrivals and tourist overnight stays by: country, municipality, measure, month
Domestic arrivals and tourist overnight stays by: country, municipality, measure , month
Tourist arrival - total
2017M01 2017M02 2017M03 2017M04 2017M05 2017M06 2017M07 2017M08 2017M09 2017M10 2017M11
Domestic
tourists
Bled 1583 1631 1725 2192 1436 1961 2407 1435 1675 1942 1660
Bohinj 2464 4602 3967 2039 2302 3978 9653 12492 3759 2495 1496
Cerklje na
Gorenjskem
400 809 381 332 276 525 416 504 196 382 138
Gorenja vas
- Poljane
47 102 27 - 29 85 88 109 8 5 8
Gorje 328 442 141 121 187 154 201 234 145 92 6
Jesenice 226 226 291 201 332 348 112 143 293 268 256
Jezersko 37 12 31 29 84 262 629 812 176 82 22
Kranj 309 711 330 488 456 379 328 742 391 488 648
Kranjska
Gora
7421 11014 6942 3309 3643 5523 9357 12810 3871 4659 2281
Naklo 92 70 93 239 54 80 181 204 143 103 73
Preddvor 23 56 26 26 39 132 406 661 139 121 31
Radovljica 350 312 502 421 325 628 1231 1235 397 309 308
Šenčur 10 11 18 42 14 35 14 26 18 20 60
Škofja Loka 58 52 94 39 62 98 74 76 85 53 93
Tržič 27 59 66 28 69 223 241 285 110 38 7
Železniki 73 104 38 - 15 28 75 75 17 19 -
Žiri - - - z z z z z z z z
Žirovnica 132 150 34 29 73 451 188 371 110 102 31
Total
Source: SURS, 2018
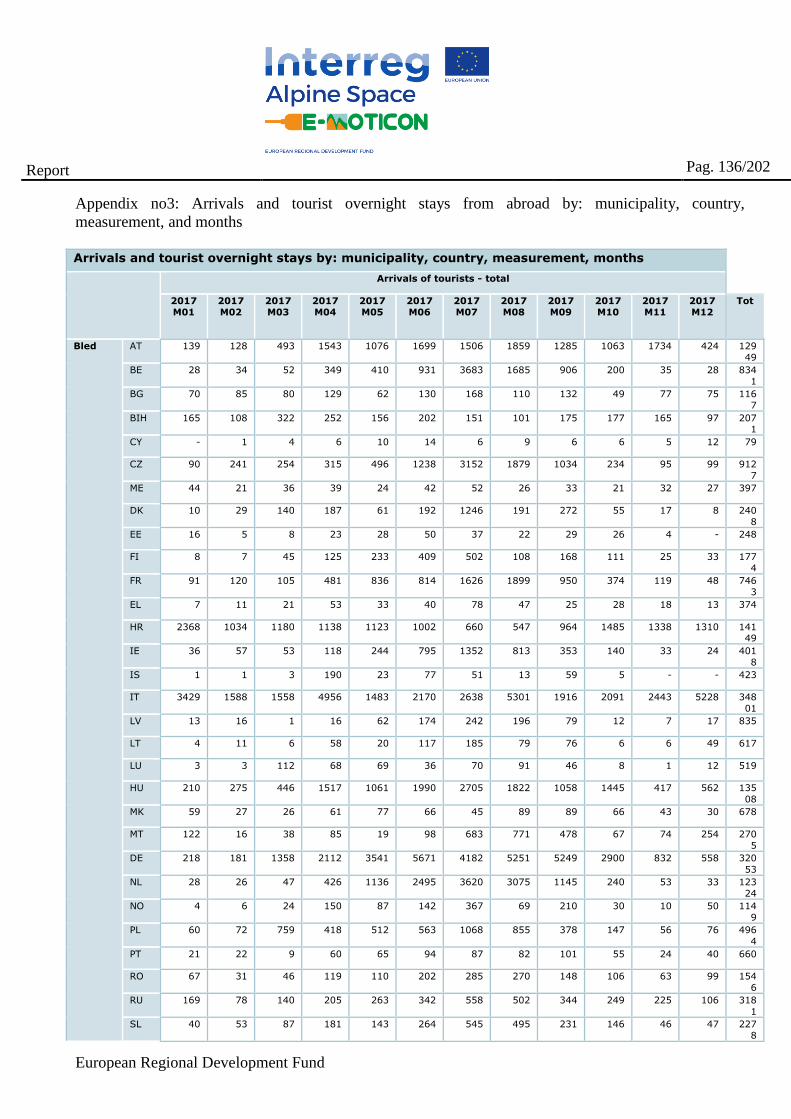
European Regional Development Fund
Report
Pag. 136/202
Appendix no3: Arrivals and tourist overnight stays from abroad by: municipality, country,
measurement, and months
Arrivals and tourist overnight stays by: municipality, country, measurement, months
Arrivals of tourists - total
2017
M01
2017
M02
2017
M03
2017
M04
2017
M05
2017
M06
2017
M07
2017
M08
2017
M09
2017
M10
2017
M11
2017
M12
Tot
Bled AT 139 128 493 1543 1076 1699 1506 1859 1285 1063 1734 424 129
49
BE 28 34 52 349 410 931 3683 1685 906 200 35 28 834
1
BG 70 85 80 129 62 130 168 110 132 49 77 75 116
7
BIH 165 108 322 252 156 202 151 101 175 177 165 97 2071
CY - 1 4 6 10 14 6 9 6 6 5 12 79
CZ 90 241 254 315 496 1238 3152 1879 1034 234 95 99 912
7
ME 44 21 36 39 24 42 52 26 33 21 32 27 397
DK 10 29 140 187 61 192 1246 191 272 55 17 8 240
8
EE 16 5 8 23 28 50 37 22 29 26 4 - 248
FI 8 7 45 125 233 409 502 108 168 111 25 33 177
4
FR 91 120 105 481 836 814 1626 1899 950 374 119 48 746
3
EL 7 11 21 53 33 40 78 47 25 28 18 13 374
HR 2368 1034 1180 1138 1123 1002 660 547 964 1485 1338 1310 14149
IE 36 57 53 118 244 795 1352 813 353 140 33 24 401
8
IS 1 1 3 190 23 77 51 13 59 5 - - 423
IT 3429 1588 1558 4956 1483 2170 2638 5301 1916 2091 2443 5228 348
01
LV 13 16 1 16 62 174 242 196 79 12 7 17 835
LT 4 11 6 58 20 117 185 79 76 6 6 49 617
LU 3 3 112 68 69 36 70 91 46 8 1 12 519
HU 210 275 446 1517 1061 1990 2705 1822 1058 1445 417 562 135
08
MK 59 27 26 61 77 66 45 89 89 66 43 30 678
MT 122 16 38 85 19 98 683 771 478 67 74 254 270
5
DE 218 181 1358 2112 3541 5671 4182 5251 5249 2900 832 558 320
53
NL 28 26 47 426 1136 2495 3620 3075 1145 240 53 33 123
24
NO 4 6 24 150 87 142 367 69 210 30 10 50 114
9
PL 60 72 759 418 512 563 1068 855 378 147 56 76 496
4
PT 21 22 9 60 65 94 87 82 101 55 24 40 660
RO 67 31 46 119 110 202 285 270 148 106 63 99 154
6
RU 169 78 140 205 263 342 558 502 344 249 225 106 318
1
SL 40 53 87 181 143 264 545 495 231 146 46 47 227
8
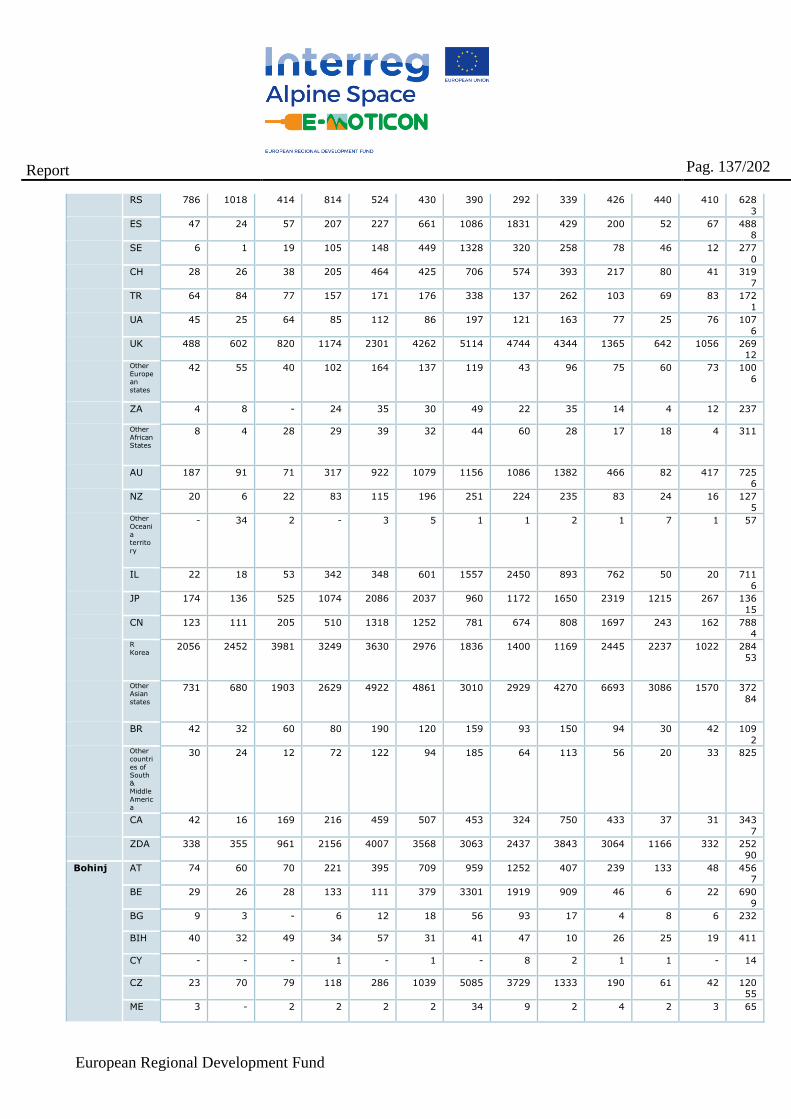
European Regional Development Fund
Report
Pag. 137/202
RS 786 1018 414 814 524 430 390 292 339 426 440 410 628
3
ES 47 24 57 207 227 661 1086 1831 429 200 52 67 4888
SE 6 1 19 105 148 449 1328 320 258 78 46 12 277
0
CH 28 26 38 205 464 425 706 574 393 217 80 41 319
7
TR 64 84 77 157 171 176 338 137 262 103 69 83 172
1
UA 45 25 64 85 112 86 197 121 163 77 25 76 107
6
UK 488 602 820 1174 2301 4262 5114 4744 4344 1365 642 1056 269
12 Other European states
42 55 40 102 164 137 119 43 96 75 60 73 100
6
ZA 4 8 - 24 35 30 49 22 35 14 4 12 237
Other African States
8 4 28 29 39 32 44 60 28 17 18 4 311
AU 187 91 71 317 922 1079 1156 1086 1382 466 82 417 7256
NZ 20 6 22 83 115 196 251 224 235 83 24 16 127
5 Other Oceania territory
- 34 2 - 3 5 1 1 2 1 7 1 57
IL 22 18 53 342 348 601 1557 2450 893 762 50 20 711
6
JP 174 136 525 1074 2086 2037 960 1172 1650 2319 1215 267 136
15
CN 123 111 205 510 1318 1252 781 674 808 1697 243 162 7884
R Korea
2056 2452 3981 3249 3630 2976 1836 1400 1169 2445 2237 1022 284
53
Other Asian states
731 680 1903 2629 4922 4861 3010 2929 4270 6693 3086 1570 372
84
BR 42 32 60 80 190 120 159 93 150 94 30 42 109
2 Other countries of South & Middle America
30 24 12 72 122 94 185 64 113 56 20 33 825
CA 42 16 169 216 459 507 453 324 750 433 37 31 343
7
ZDA 338 355 961 2156 4007 3568 3063 2437 3843 3064 1166 332 252
90
Bohinj AT 74 60 70 221 395 709 959 1252 407 239 133 48 4567
BE 29 26 28 133 111 379 3301 1919 909 46 6 22 690
9
BG 9 3 - 6 12 18 56 93 17 4 8 6 232
BIH 40 32 49 34 57 31 41 47 10 26 25 19 411
CY - - - 1 - 1 - 8 2 1 1 - 14
CZ 23 70 79 118 286 1039 5085 3729 1333 190 61 42 12055
ME 3 - 2 2 2 2 34 9 2 4 2 3 65
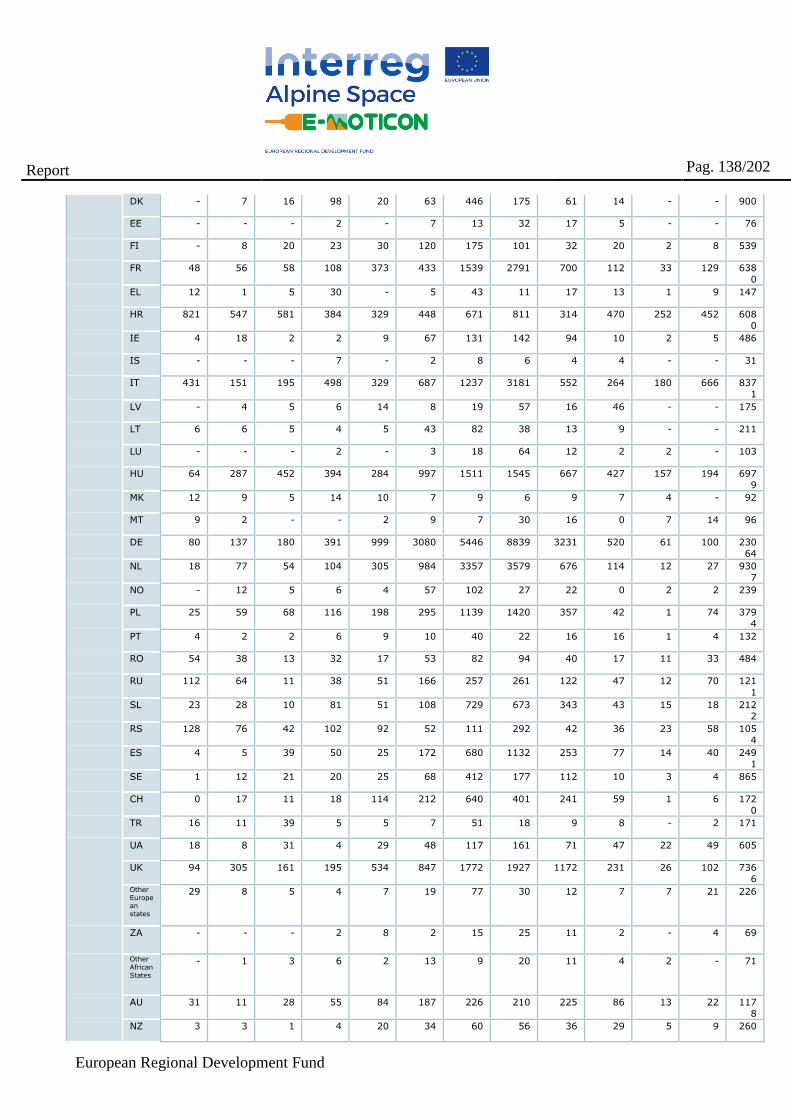
European Regional Development Fund
Report
Pag. 138/202
DK - 7 16 98 20 63 446 175 61 14 - - 900
EE - - - 2 - 7 13 32 17 5 - - 76
FI - 8 20 23 30 120 175 101 32 20 2 8 539
FR 48 56 58 108 373 433 1539 2791 700 112 33 129 638
0
EL 12 1 5 30 - 5 43 11 17 13 1 9 147
HR 821 547 581 384 329 448 671 811 314 470 252 452 608
0
IE 4 18 2 2 9 67 131 142 94 10 2 5 486
IS - - - 7 - 2 8 6 4 4 - - 31
IT 431 151 195 498 329 687 1237 3181 552 264 180 666 837
1
LV - 4 5 6 14 8 19 57 16 46 - - 175
LT 6 6 5 4 5 43 82 38 13 9 - - 211
LU - - - 2 - 3 18 64 12 2 2 - 103
HU 64 287 452 394 284 997 1511 1545 667 427 157 194 697
9
MK 12 9 5 14 10 7 9 6 9 7 4 - 92
MT 9 2 - - 2 9 7 30 16 0 7 14 96
DE 80 137 180 391 999 3080 5446 8839 3231 520 61 100 230
64
NL 18 77 54 104 305 984 3357 3579 676 114 12 27 930
7
NO - 12 5 6 4 57 102 27 22 0 2 2 239
PL 25 59 68 116 198 295 1139 1420 357 42 1 74 379
4
PT 4 2 2 6 9 10 40 22 16 16 1 4 132
RO 54 38 13 32 17 53 82 94 40 17 11 33 484
RU 112 64 11 38 51 166 257 261 122 47 12 70 121
1
SL 23 28 10 81 51 108 729 673 343 43 15 18 212
2
RS 128 76 42 102 92 52 111 292 42 36 23 58 105
4
ES 4 5 39 50 25 172 680 1132 253 77 14 40 249
1
SE 1 12 21 20 25 68 412 177 112 10 3 4 865
CH 0 17 11 18 114 212 640 401 241 59 1 6 172
0
TR 16 11 39 5 5 7 51 18 9 8 - 2 171
UA 18 8 31 4 29 48 117 161 71 47 22 49 605
UK 94 305 161 195 534 847 1772 1927 1172 231 26 102 736
6 Other European states
29 8 5 4 7 19 77 30 12 7 7 21 226
ZA - - - 2 8 2 15 25 11 2 - 4 69
Other African States
- 1 3 6 2 13 9 20 11 4 2 - 71
AU 31 11 28 55 84 187 226 210 225 86 13 22 117
8
NZ 3 3 1 4 20 34 60 56 36 29 5 9 260
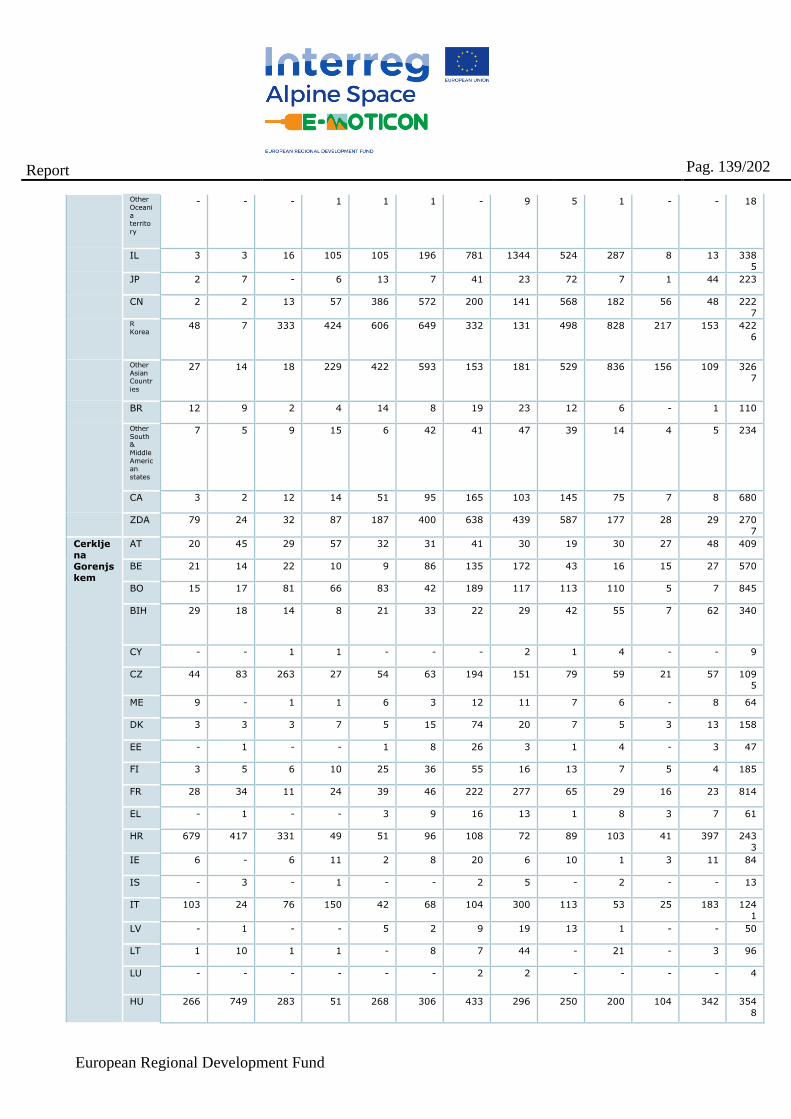
European Regional Development Fund
Report
Pag. 139/202
Other Oceania territory
- - - 1 1 1 - 9 5 1 - - 18
IL 3 3 16 105 105 196 781 1344 524 287 8 13 338
5
JP 2 7 - 6 13 7 41 23 72 7 1 44 223
CN 2 2 13 57 386 572 200 141 568 182 56 48 222
7 R Korea
48 7 333 424 606 649 332 131 498 828 217 153 422
6
Other Asian Countries
27 14 18 229 422 593 153 181 529 836 156 109 326
7
BR 12 9 2 4 14 8 19 23 12 6 - 1 110
Other South & Middle American states
7 5 9 15 6 42 41 47 39 14 4 5 234
CA 3 2 12 14 51 95 165 103 145 75 7 8 680
ZDA 79 24 32 87 187 400 638 439 587 177 28 29 270
7
Cerklje
na
Gorenjs
kem
AT 20 45 29 57 32 31 41 30 19 30 27 48 409
BE 21 14 22 10 9 86 135 172 43 16 15 27 570
BO 15 17 81 66 83 42 189 117 113 110 5 7 845
BIH 29 18 14 8 21 33 22 29 42 55 7 62 340
CY - - 1 1 - - - 2 1 4 - - 9
CZ 44 83 263 27 54 63 194 151 79 59 21 57 1095
ME 9 - 1 1 6 3 12 11 7 6 - 8 64
DK 3 3 3 7 5 15 74 20 7 5 3 13 158
EE - 1 - - 1 8 26 3 1 4 - 3 47
FI 3 5 6 10 25 36 55 16 13 7 5 4 185
FR 28 34 11 24 39 46 222 277 65 29 16 23 814
EL - 1 - - 3 9 16 13 1 8 3 7 61
HR 679 417 331 49 51 96 108 72 89 103 41 397 243
3
IE 6 - 6 11 2 8 20 6 10 1 3 11 84
IS - 3 - 1 - - 2 5 - 2 - - 13
IT 103 24 76 150 42 68 104 300 113 53 25 183 124
1
LV - 1 - - 5 2 9 19 13 1 - - 50
LT 1 10 1 1 - 8 7 44 - 21 - 3 96
LU - - - - - - 2 2 - - - - 4
HU 266 749 283 51 268 306 433 296 250 200 104 342 354
8
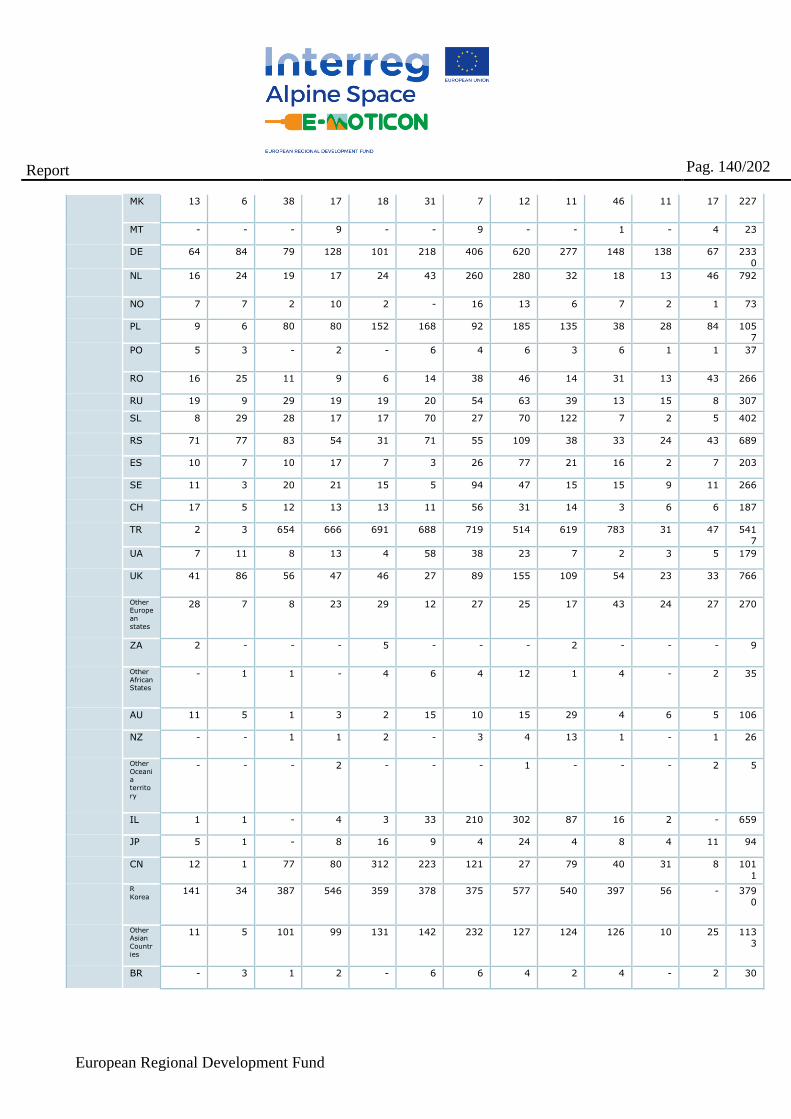
European Regional Development Fund
Report
Pag. 140/202
MK 13 6 38 17 18 31 7 12 11 46 11 17 227
MT - - - 9 - - 9 - - 1 - 4 23
DE 64 84 79 128 101 218 406 620 277 148 138 67 233
0
NL 16 24 19 17 24 43 260 280 32 18 13 46 792
NO 7 7 2 10 2 - 16 13 6 7 2 1 73
PL 9 6 80 80 152 168 92 185 135 38 28 84 105
7
PO 5 3 - 2 - 6 4 6 3 6 1 1 37
RO 16 25 11 9 6 14 38 46 14 31 13 43 266
RU 19 9 29 19 19 20 54 63 39 13 15 8 307
SL 8 29 28 17 17 70 27 70 122 7 2 5 402
RS 71 77 83 54 31 71 55 109 38 33 24 43 689
ES 10 7 10 17 7 3 26 77 21 16 2 7 203
SE 11 3 20 21 15 5 94 47 15 15 9 11 266
CH 17 5 12 13 13 11 56 31 14 3 6 6 187
TR 2 3 654 666 691 688 719 514 619 783 31 47 541
7
UA 7 11 8 13 4 58 38 23 7 2 3 5 179
UK 41 86 56 47 46 27 89 155 109 54 23 33 766
Other Europe
an states
28 7 8 23 29 12 27 25 17 43 24 27 270
ZA 2 - - - 5 - - - 2 - - - 9
Other African States
- 1 1 - 4 6 4 12 1 4 - 2 35
AU 11 5 1 3 2 15 10 15 29 4 6 5 106
NZ - - 1 1 2 - 3 4 13 1 - 1 26
Other Oceania territory
- - - 2 - - - 1 - - - 2 5
IL 1 1 - 4 3 33 210 302 87 16 2 - 659
JP 5 1 - 8 16 9 4 24 4 8 4 11 94
CN 12 1 77 80 312 223 121 27 79 40 31 8 101
1
R Korea
141 34 387 546 359 378 375 577 540 397 56 - 379
0
Other Asian Countries
11 5 101 99 131 142 232 127 124 126 10 25 113
3
BR - 3 1 2 - 6 6 4 2 4 - 2 30
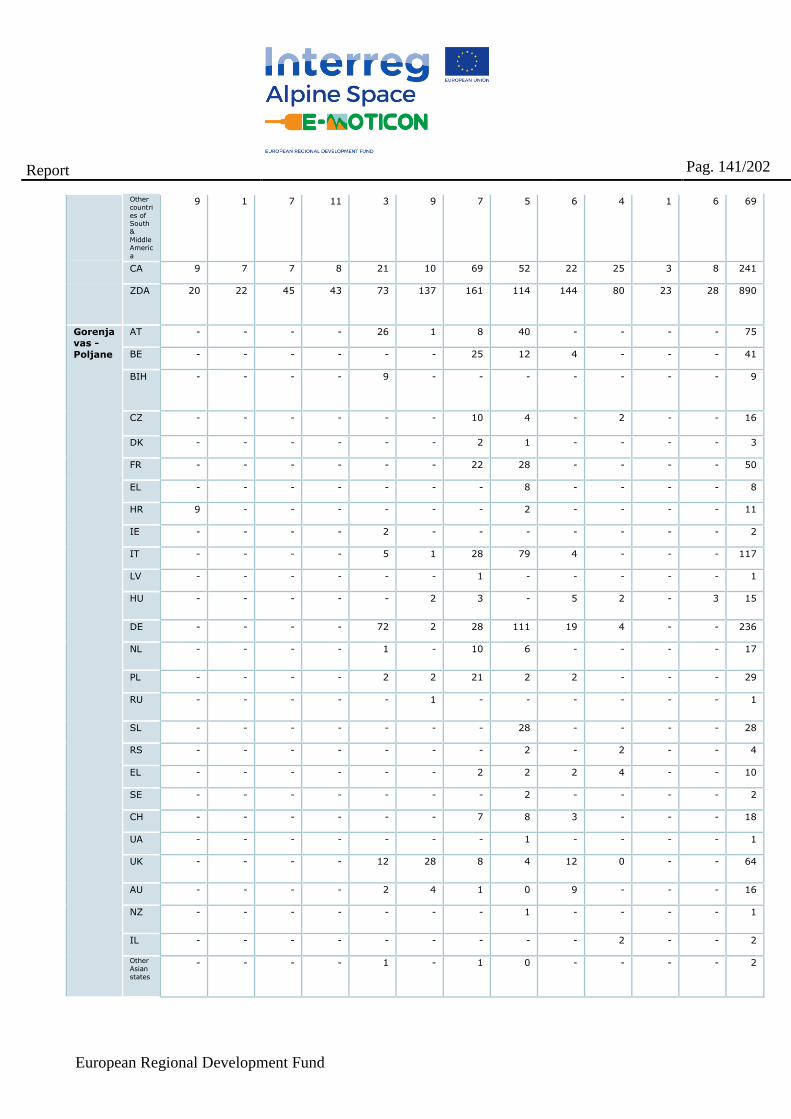
European Regional Development Fund
Report
Pag. 141/202
Other countries of South & Middle America
9 1 7 11 3 9 7 5 6 4 1 6 69
CA 9 7 7 8 21 10 69 52 22 25 3 8 241
ZDA 20 22 45 43 73 137 161 114 144 80 23 28 890
Gorenja
vas -
Poljane
AT - - - - 26 1 8 40 - - - - 75
BE - - - - - - 25 12 4 - - - 41
BIH - - - - 9 - - - - - - - 9
CZ - - - - - - 10 4 - 2 - - 16
DK - - - - - - 2 1 - - - - 3
FR - - - - - - 22 28 - - - - 50
EL - - - - - - - 8 - - - - 8
HR 9 - - - - - - 2 - - - - 11
IE - - - - 2 - - - - - - - 2
IT - - - - 5 1 28 79 4 - - - 117
LV - - - - - - 1 - - - - - 1
HU - - - - - 2 3 - 5 2 - 3 15
DE - - - - 72 2 28 111 19 4 - - 236
NL - - - - 1 - 10 6 - - - - 17
PL - - - - 2 2 21 2 2 - - - 29
RU - - - - - 1 - - - - - - 1
SL - - - - - - - 28 - - - - 28
RS - - - - - - - 2 - 2 - - 4
EL - - - - - - 2 2 2 4 - - 10
SE - - - - - - - 2 - - - - 2
CH - - - - - - 7 8 3 - - - 18
UA - - - - - - - 1 - - - - 1
UK - - - - 12 28 8 4 12 0 - - 64
AU - - - - 2 4 1 0 9 - - - 16
NZ - - - - - - - 1 - - - - 1
IL - - - - - - - - - 2 - - 2
Other Asian states
- - - - 1 - 1 0 - - - - 2
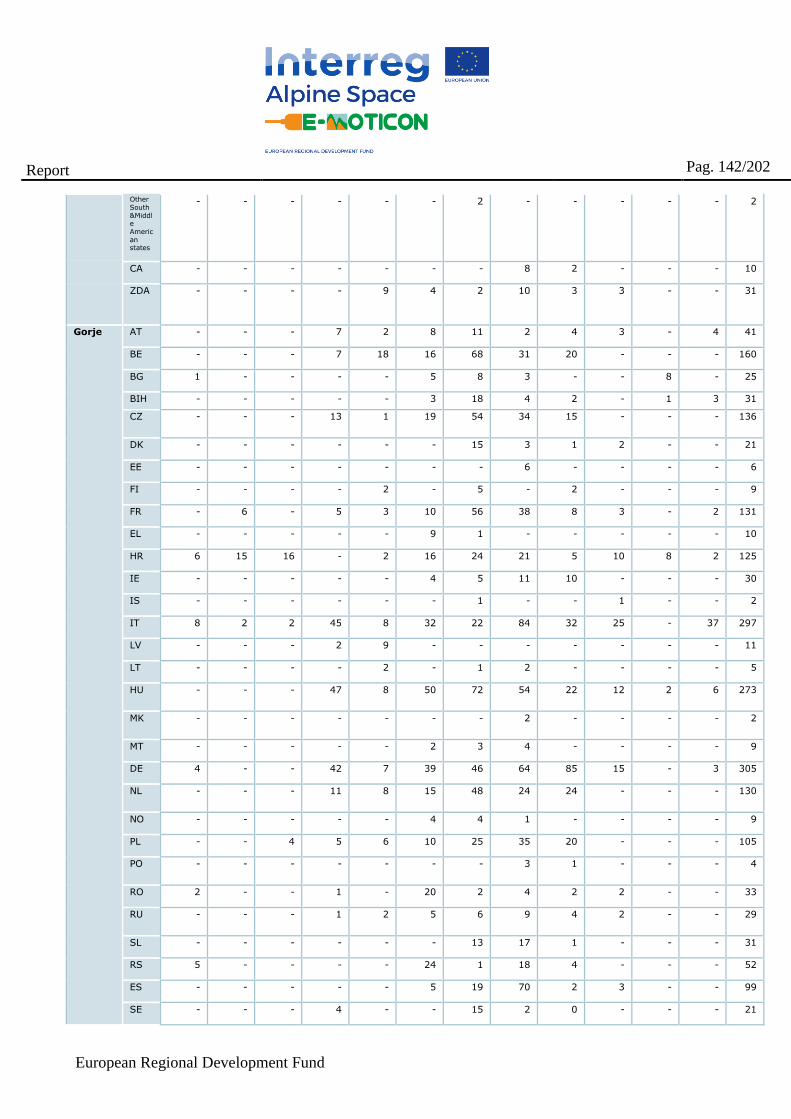
European Regional Development Fund
Report
Pag. 142/202
Other South &Middle American states
- - - - - - 2 - - - - - 2
CA - - - - - - - 8 2 - - - 10
ZDA - - - - 9 4 2 10 3 3 - - 31
Gorje AT - - - 7 2 8 11 2 4 3 - 4 41
BE - - - 7 18 16 68 31 20 - - - 160
BG 1 - - - - 5 8 3 - - 8 - 25
BIH - - - - - 3 18 4 2 - 1 3 31
CZ - - - 13 1 19 54 34 15 - - - 136
DK - - - - - - 15 3 1 2 - - 21
EE - - - - - - - 6 - - - - 6
FI - - - - 2 - 5 - 2 - - - 9
FR - 6 - 5 3 10 56 38 8 3 - 2 131
EL - - - - - 9 1 - - - - - 10
HR 6 15 16 - 2 16 24 21 5 10 8 2 125
IE - - - - - 4 5 11 10 - - - 30
IS - - - - - - 1 - - 1 - - 2
IT 8 2 2 45 8 32 22 84 32 25 - 37 297
LV - - - 2 9 - - - - - - - 11
LT - - - - 2 - 1 2 - - - - 5
HU - - - 47 8 50 72 54 22 12 2 6 273
MK - - - - - - - 2 - - - - 2
MT - - - - - 2 3 4 - - - - 9
DE 4 - - 42 7 39 46 64 85 15 - 3 305
NL - - - 11 8 15 48 24 24 - - - 130
NO - - - - - 4 4 1 - - - - 9
PL - - 4 5 6 10 25 35 20 - - - 105
PO - - - - - - - 3 1 - - - 4
RO 2 - - 1 - 20 2 4 2 2 - - 33
RU - - - 1 2 5 6 9 4 2 - - 29
SL - - - - - - 13 17 1 - - - 31
RS 5 - - - - 24 1 18 4 - - - 52
ES - - - - - 5 19 70 2 3 - - 99
SE - - - 4 - - 15 2 0 - - - 21
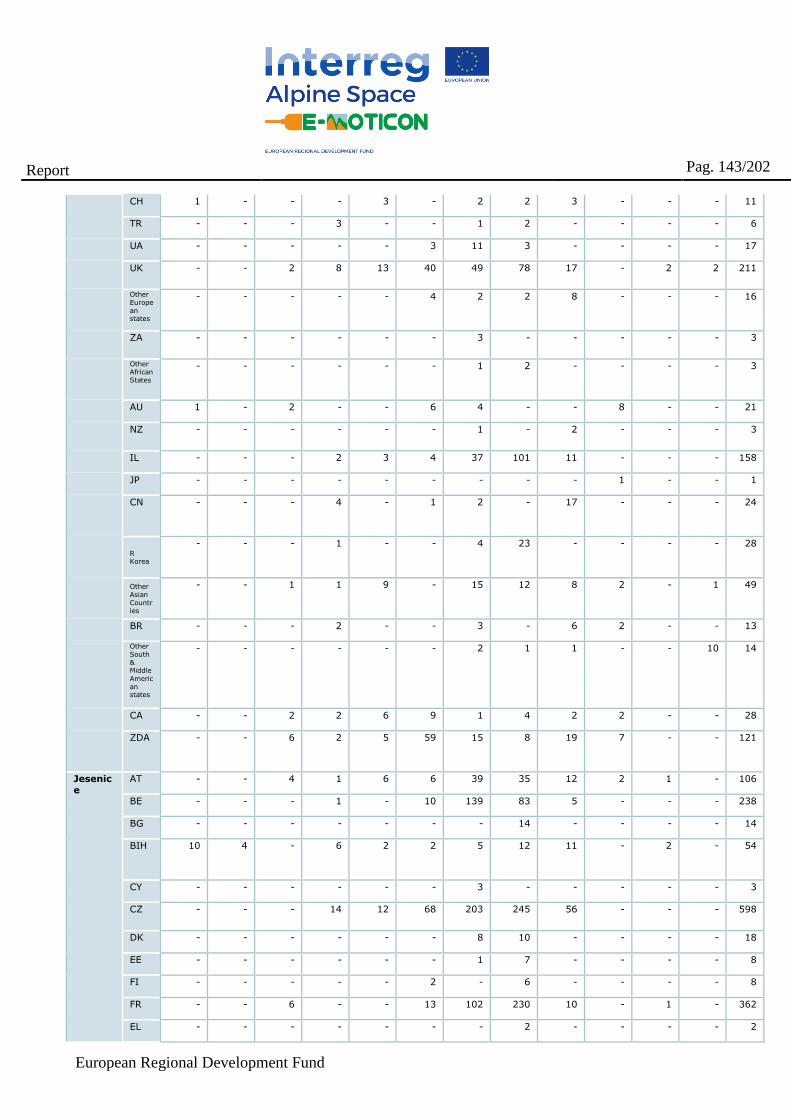
European Regional Development Fund
Report
Pag. 143/202
CH 1 - - - 3 - 2 2 3 - - - 11
TR - - - 3 - - 1 2 - - - - 6
UA - - - - - 3 11 3 - - - - 17
UK - - 2 8 13 40 49 78 17 - 2 2 211
Other European states
- - - - - 4 2 2 8 - - - 16
ZA - - - - - - 3 - - - - - 3
Other African States
- - - - - - 1 2 - - - - 3
AU 1 - 2 - - 6 4 - - 8 - - 21
NZ - - - - - - 1 - 2 - - - 3
IL - - - 2 3 4 37 101 11 - - - 158
JP - - - - - - - - - 1 - - 1
CN - - - 4 - 1 2 - 17 - - - 24
R Korea
- - - 1 - - 4 23 - - - - 28
Other Asian Countries
- - 1 1 9 - 15 12 8 2 - 1 49
BR - - - 2 - - 3 - 6 2 - - 13
Other South & Middle American states
- - - - - - 2 1 1 - - 10 14
CA - - 2 2 6 9 1 4 2 2 - - 28
ZDA - - 6 2 5 59 15 8 19 7 - - 121
Jesenic
e
AT - - 4 1 6 6 39 35 12 2 1 - 106
BE - - - 1 - 10 139 83 5 - - - 238
BG - - - - - - - 14 - - - - 14
BIH 10 4 - 6 2 2 5 12 11 - 2 - 54
CY - - - - - - 3 - - - - - 3
CZ - - - 14 12 68 203 245 56 - - - 598
DK - - - - - - 8 10 - - - - 18
EE - - - - - - 1 7 - - - - 8
FI - - - - - 2 - 6 - - - - 8
FR - - 6 - - 13 102 230 10 - 1 - 362
EL - - - - - - - 2 - - - - 2
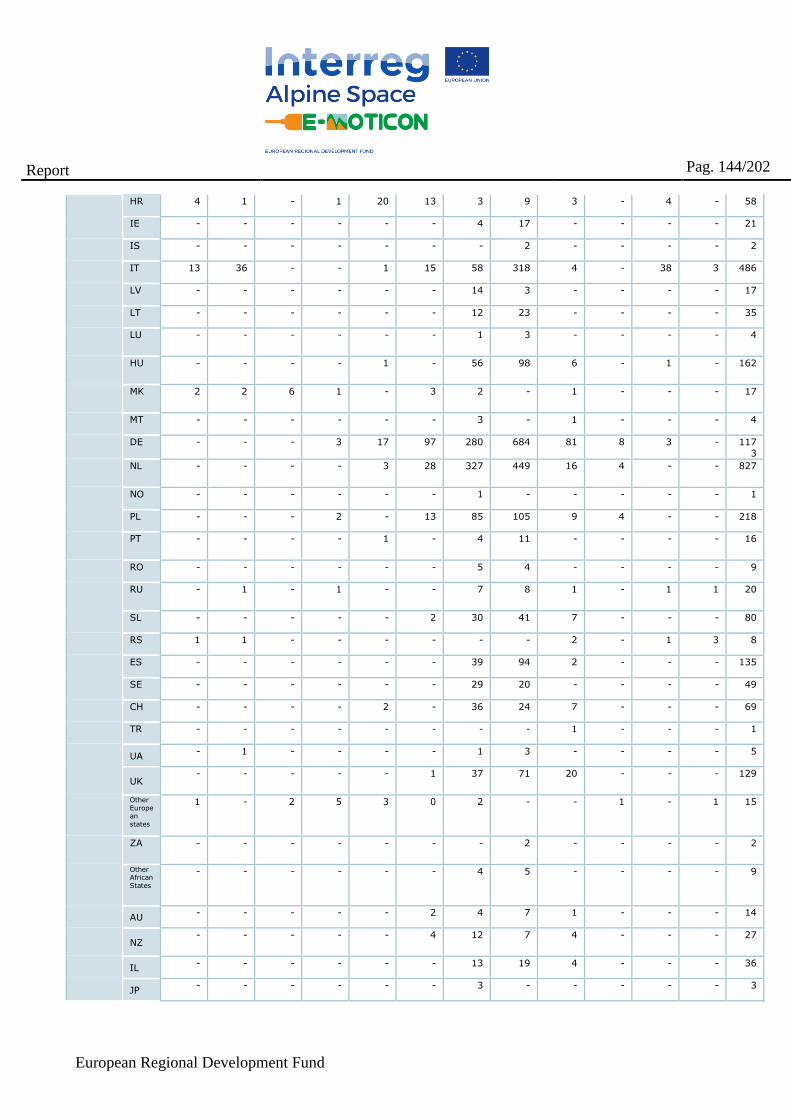
European Regional Development Fund
Report
Pag. 144/202
HR 4 1 - 1 20 13 3 9 3 - 4 - 58
IE - - - - - - 4 17 - - - - 21
IS - - - - - - - 2 - - - - 2
IT 13 36 - - 1 15 58 318 4 - 38 3 486
LV - - - - - - 14 3 - - - - 17
LT - - - - - - 12 23 - - - - 35
LU - - - - - - 1 3 - - - - 4
HU - - - - 1 - 56 98 6 - 1 - 162
MK 2 2 6 1 - 3 2 - 1 - - - 17
MT - - - - - - 3 - 1 - - - 4
DE - - - 3 17 97 280 684 81 8 3 - 117
3
NL - - - - 3 28 327 449 16 4 - - 827
NO - - - - - - 1 - - - - - 1
PL - - - 2 - 13 85 105 9 4 - - 218
PT - - - - 1 - 4 11 - - - - 16
RO - - - - - - 5 4 - - - - 9
RU - 1 - 1 - - 7 8 1 - 1 1 20
SL - - - - - 2 30 41 7 - - - 80
RS 1 1 - - - - - - 2 - 1 3 8
ES - - - - - - 39 94 2 - - - 135
SE - - - - - - 29 20 - - - - 49
CH - - - - 2 - 36 24 7 - - - 69
TR - - - - - - - - 1 - - - 1
UA - 1 - - - - 1 3 - - - - 5
UK - - - - - 1 37 71 20 - - - 129
Other European states
1 - 2 5 3 0 2 - - 1 - 1 15
ZA - - - - - - - 2 - - - - 2
Other African States
- - - - - - 4 5 - - - - 9
AU - - - - - 2 4 7 1 - - - 14
NZ - - - - - 4 12 7 4 - - - 27
IL - - - - - - 13 19 4 - - - 36
JP - - - - - - 3 - - - - - 3
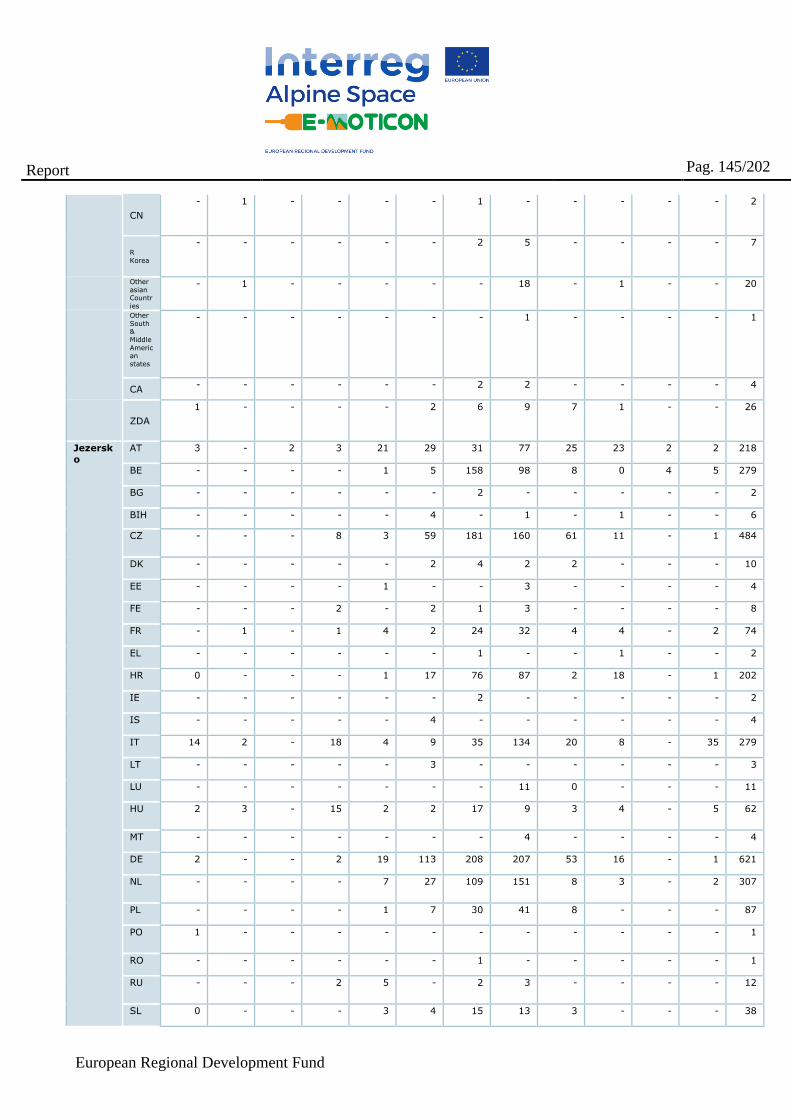
European Regional Development Fund
Report
Pag. 145/202
CN
- 1 - - - - 1 - - - - - 2
R Korea
- - - - - - 2 5 - - - - 7
Other asian Countries
- 1 - - - - - 18 - 1 - - 20
Other South & Middle American states
- - - - - - - 1 - - - - 1
CA - - - - - - 2 2 - - - - 4
ZDA
1 - - - - 2 6 9 7 1 - - 26
Jezersk
o
AT 3 - 2 3 21 29 31 77 25 23 2 2 218
BE - - - - 1 5 158 98 8 0 4 5 279
BG - - - - - - 2 - - - - - 2
BIH - - - - - 4 - 1 - 1 - - 6
CZ - - - 8 3 59 181 160 61 11 - 1 484
DK - - - - - 2 4 2 2 - - - 10
EE - - - - 1 - - 3 - - - - 4
FE - - - 2 - 2 1 3 - - - - 8
FR - 1 - 1 4 2 24 32 4 4 - 2 74
EL - - - - - - 1 - - 1 - - 2
HR 0 - - - 1 17 76 87 2 18 - 1 202
IE - - - - - - 2 - - - - - 2
IS - - - - - 4 - - - - - - 4
IT 14 2 - 18 4 9 35 134 20 8 - 35 279
LT - - - - - 3 - - - - - - 3
LU - - - - - - - 11 0 - - - 11
HU 2 3 - 15 2 2 17 9 3 4 - 5 62
MT - - - - - - - 4 - - - - 4
DE 2 - - 2 19 113 208 207 53 16 - 1 621
NL - - - - 7 27 109 151 8 3 - 2 307
PL - - - - 1 7 30 41 8 - - - 87
PO 1 - - - - - - - - - - - 1
RO - - - - - - 1 - - - - - 1
RU - - - 2 5 - 2 3 - - - - 12
SL 0 - - - 3 4 15 13 3 - - - 38
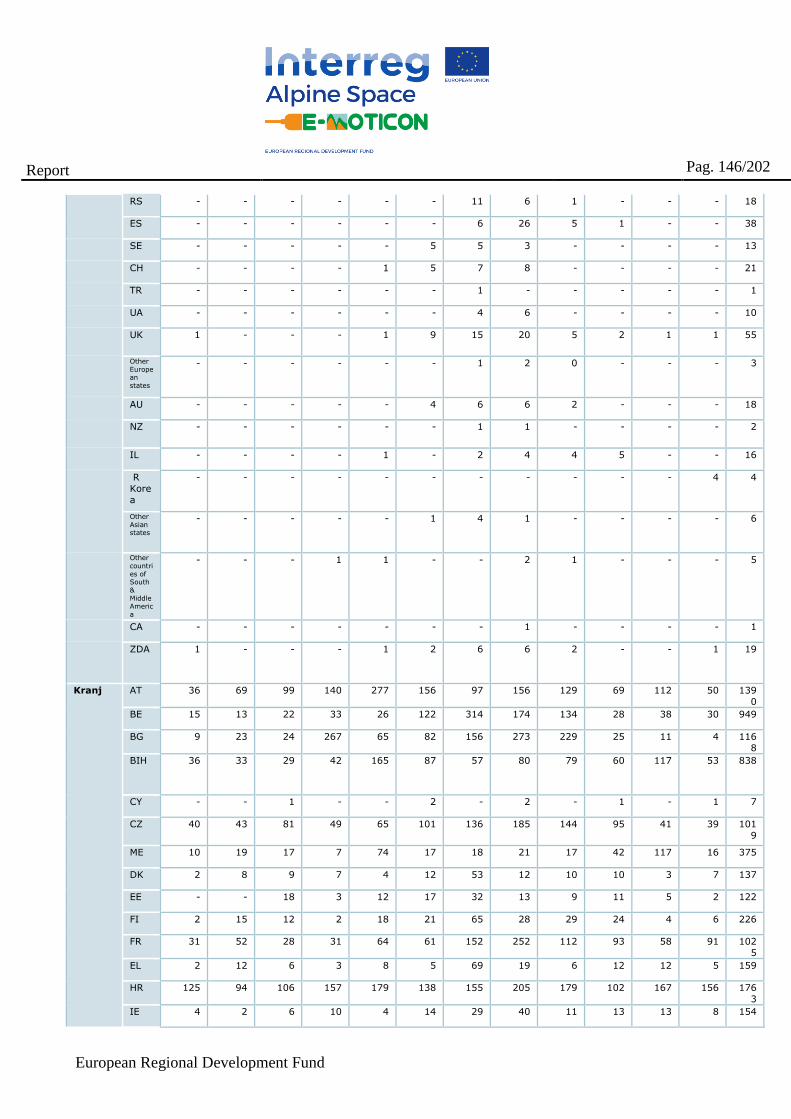
European Regional Development Fund
Report
Pag. 146/202
RS - - - - - - 11 6 1 - - - 18
ES - - - - - - 6 26 5 1 - - 38
SE - - - - - 5 5 3 - - - - 13
CH - - - - 1 5 7 8 - - - - 21
TR - - - - - - 1 - - - - - 1
UA - - - - - - 4 6 - - - - 10
UK 1 - - - 1 9 15 20 5 2 1 1 55
Other
European states
- - - - - - 1 2 0 - - - 3
AU - - - - - 4 6 6 2 - - - 18
NZ - - - - - - 1 1 - - - - 2
IL - - - - 1 - 2 4 4 5 - - 16
R
Kore
a
- - - - - - - - - - - 4 4
Other Asian states
- - - - - 1 4 1 - - - - 6
Other countries of South & Middle America
- - - 1 1 - - 2 1 - - - 5
CA - - - - - - - 1 - - - - 1
ZDA 1 - - - 1 2 6 6 2 - - 1 19
Kranj AT 36 69 99 140 277 156 97 156 129 69 112 50 139
0
BE 15 13 22 33 26 122 314 174 134 28 38 30 949
BG 9 23 24 267 65 82 156 273 229 25 11 4 116
8
BIH 36 33 29 42 165 87 57 80 79 60 117 53 838
CY - - 1 - - 2 - 2 - 1 - 1 7
CZ 40 43 81 49 65 101 136 185 144 95 41 39 101
9
ME 10 19 17 7 74 17 18 21 17 42 117 16 375
DK 2 8 9 7 4 12 53 12 10 10 3 7 137
EE - - 18 3 12 17 32 13 9 11 5 2 122
FI 2 15 12 2 18 21 65 28 29 24 4 6 226
FR 31 52 28 31 64 61 152 252 112 93 58 91 102
5
EL 2 12 6 3 8 5 69 19 6 12 12 5 159
HR 125 94 106 157 179 138 155 205 179 102 167 156 176
3
IE 4 2 6 10 4 14 29 40 11 13 13 8 154
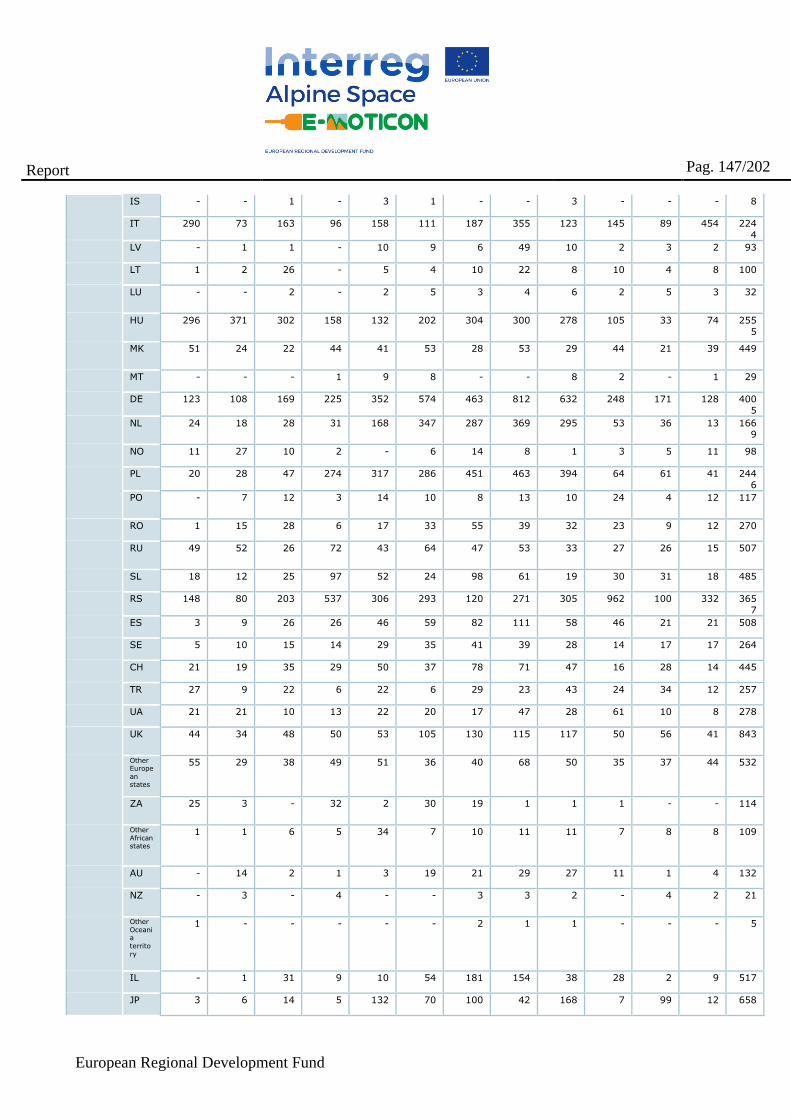
European Regional Development Fund
Report
Pag. 147/202
IS - - 1 - 3 1 - - 3 - - - 8
IT 290 73 163 96 158 111 187 355 123 145 89 454 224
4
LV - 1 1 - 10 9 6 49 10 2 3 2 93
LT 1 2 26 - 5 4 10 22 8 10 4 8 100
LU - - 2 - 2 5 3 4 6 2 5 3 32
HU 296 371 302 158 132 202 304 300 278 105 33 74 255
5
MK 51 24 22 44 41 53 28 53 29 44 21 39 449
MT - - - 1 9 8 - - 8 2 - 1 29
DE 123 108 169 225 352 574 463 812 632 248 171 128 400
5
NL 24 18 28 31 168 347 287 369 295 53 36 13 1669
NO 11 27 10 2 - 6 14 8 1 3 5 11 98
PL 20 28 47 274 317 286 451 463 394 64 61 41 244
6
PO - 7 12 3 14 10 8 13 10 24 4 12 117
RO 1 15 28 6 17 33 55 39 32 23 9 12 270
RU 49 52 26 72 43 64 47 53 33 27 26 15 507
SL 18 12 25 97 52 24 98 61 19 30 31 18 485
RS 148 80 203 537 306 293 120 271 305 962 100 332 365
7
ES 3 9 26 26 46 59 82 111 58 46 21 21 508
SE 5 10 15 14 29 35 41 39 28 14 17 17 264
CH 21 19 35 29 50 37 78 71 47 16 28 14 445
TR 27 9 22 6 22 6 29 23 43 24 34 12 257
UA 21 21 10 13 22 20 17 47 28 61 10 8 278
UK 44 34 48 50 53 105 130 115 117 50 56 41 843
Other European states
55 29 38 49 51 36 40 68 50 35 37 44 532
ZA 25 3 - 32 2 30 19 1 1 1 - - 114
Other African states
1 1 6 5 34 7 10 11 11 7 8 8 109
AU - 14 2 1 3 19 21 29 27 11 1 4 132
NZ - 3 - 4 - - 3 3 2 - 4 2 21
Other Oceania territory
1 - - - - - 2 1 1 - - - 5
IL - 1 31 9 10 54 181 154 38 28 2 9 517
JP 3 6 14 5 132 70 100 42 168 7 99 12 658
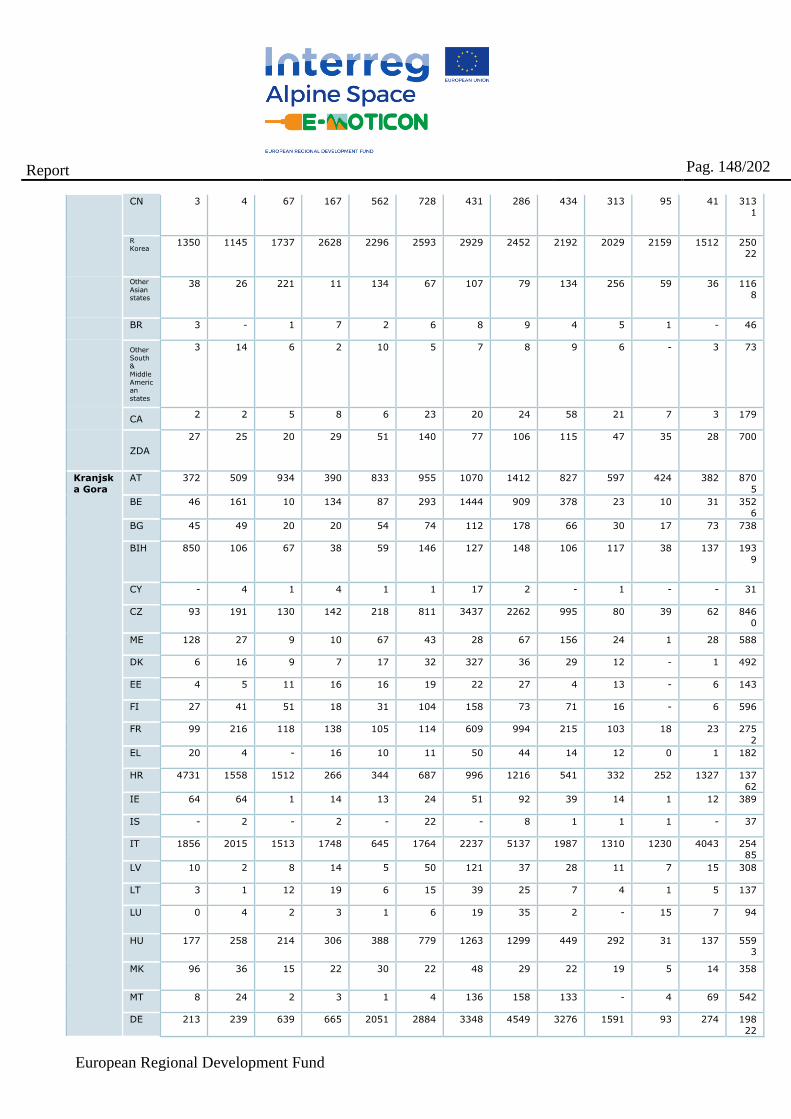
European Regional Development Fund
Report
Pag. 148/202
CN 3 4 67 167 562 728 431 286 434 313 95 41 313
1
R Korea
1350 1145 1737 2628 2296 2593 2929 2452 2192 2029 2159 1512 250
22
Other Asian states
38 26 221 11 134 67 107 79 134 256 59 36 116
8
BR 3 - 1 7 2 6 8 9 4 5 1 - 46
Other South & Middle American states
3 14 6 2 10 5 7 8 9 6 - 3 73
CA 2 2 5 8 6 23 20 24 58 21 7 3 179
ZDA
27 25 20 29 51 140 77 106 115 47 35 28 700
Kranjsk
a Gora
AT 372 509 934 390 833 955 1070 1412 827 597 424 382 870
5
BE 46 161 10 134 87 293 1444 909 378 23 10 31 352
6
BG 45 49 20 20 54 74 112 178 66 30 17 73 738
BIH 850 106 67 38 59 146 127 148 106 117 38 137 193
9
CY - 4 1 4 1 1 17 2 - 1 - - 31
CZ 93 191 130 142 218 811 3437 2262 995 80 39 62 846
0
ME 128 27 9 10 67 43 28 67 156 24 1 28 588
DK 6 16 9 7 17 32 327 36 29 12 - 1 492
EE 4 5 11 16 16 19 22 27 4 13 - 6 143
FI 27 41 51 18 31 104 158 73 71 16 - 6 596
FR 99 216 118 138 105 114 609 994 215 103 18 23 275
2
EL 20 4 - 16 10 11 50 44 14 12 0 1 182
HR 4731 1558 1512 266 344 687 996 1216 541 332 252 1327 137
62
IE 64 64 1 14 13 24 51 92 39 14 1 12 389
IS - 2 - 2 - 22 - 8 1 1 1 - 37
IT 1856 2015 1513 1748 645 1764 2237 5137 1987 1310 1230 4043 254
85
LV 10 2 8 14 5 50 121 37 28 11 7 15 308
LT 3 1 12 19 6 15 39 25 7 4 1 5 137
LU 0 4 2 3 1 6 19 35 2 - 15 7 94
HU 177 258 214 306 388 779 1263 1299 449 292 31 137 5593
MK 96 36 15 22 30 22 48 29 22 19 5 14 358
MT 8 24 2 3 1 4 136 158 133 - 4 69 542
DE 213 239 639 665 2051 2884 3348 4549 3276 1591 93 274 198
22
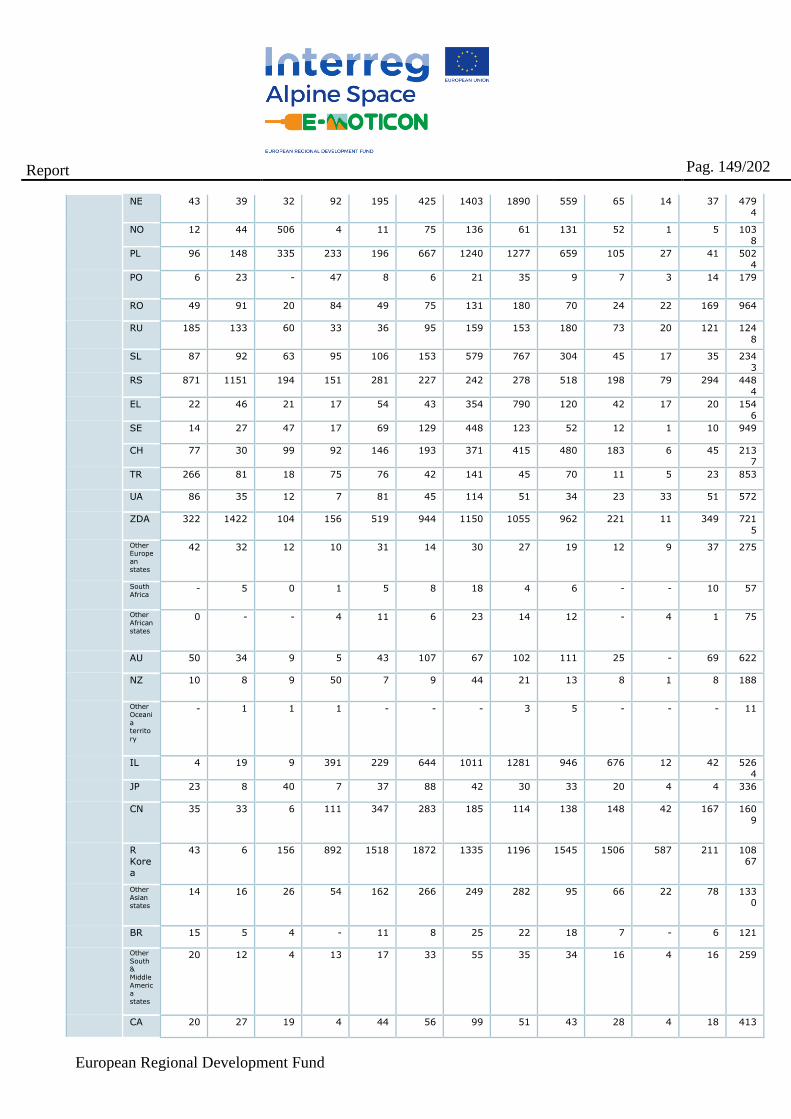
European Regional Development Fund
Report
Pag. 149/202
NE 43 39 32 92 195 425 1403 1890 559 65 14 37 479
4
NO 12 44 506 4 11 75 136 61 131 52 1 5 103
8
PL 96 148 335 233 196 667 1240 1277 659 105 27 41 502
4
PO 6 23 - 47 8 6 21 35 9 7 3 14 179
RO 49 91 20 84 49 75 131 180 70 24 22 169 964
RU 185 133 60 33 36 95 159 153 180 73 20 121 124
8
SL 87 92 63 95 106 153 579 767 304 45 17 35 234
3
RS 871 1151 194 151 281 227 242 278 518 198 79 294 448
4
EL 22 46 21 17 54 43 354 790 120 42 17 20 154
6
SE 14 27 47 17 69 129 448 123 52 12 1 10 949
CH 77 30 99 92 146 193 371 415 480 183 6 45 213
7
TR 266 81 18 75 76 42 141 45 70 11 5 23 853
UA 86 35 12 7 81 45 114 51 34 23 33 51 572
ZDA 322 1422 104 156 519 944 1150 1055 962 221 11 349 721
5
Other European states
42 32 12 10 31 14 30 27 19 12 9 37 275
South Africa
- 5 0 1 5 8 18 4 6 - - 10 57
Other
African states
0 - - 4 11 6 23 14 12 - 4 1 75
AU 50 34 9 5 43 107 67 102 111 25 - 69 622
NZ 10 8 9 50 7 9 44 21 13 8 1 8 188
Other Oceania territory
- 1 1 1 - - - 3 5 - - - 11
IL 4 19 9 391 229 644 1011 1281 946 676 12 42 526
4
JP 23 8 40 7 37 88 42 30 33 20 4 4 336
CN 35 33 6 111 347 283 185 114 138 148 42 167 160
9
R
Kore
a
43 6 156 892 1518 1872 1335 1196 1545 1506 587 211 108
67
Other Asian states
14 16 26 54 162 266 249 282 95 66 22 78 1330
BR 15 5 4 - 11 8 25 22 18 7 - 6 121
Other South & Middle America states
20 12 4 13 17 33 55 35 34 16 4 16 259
CA 20 27 19 4 44 56 99 51 43 28 4 18 413
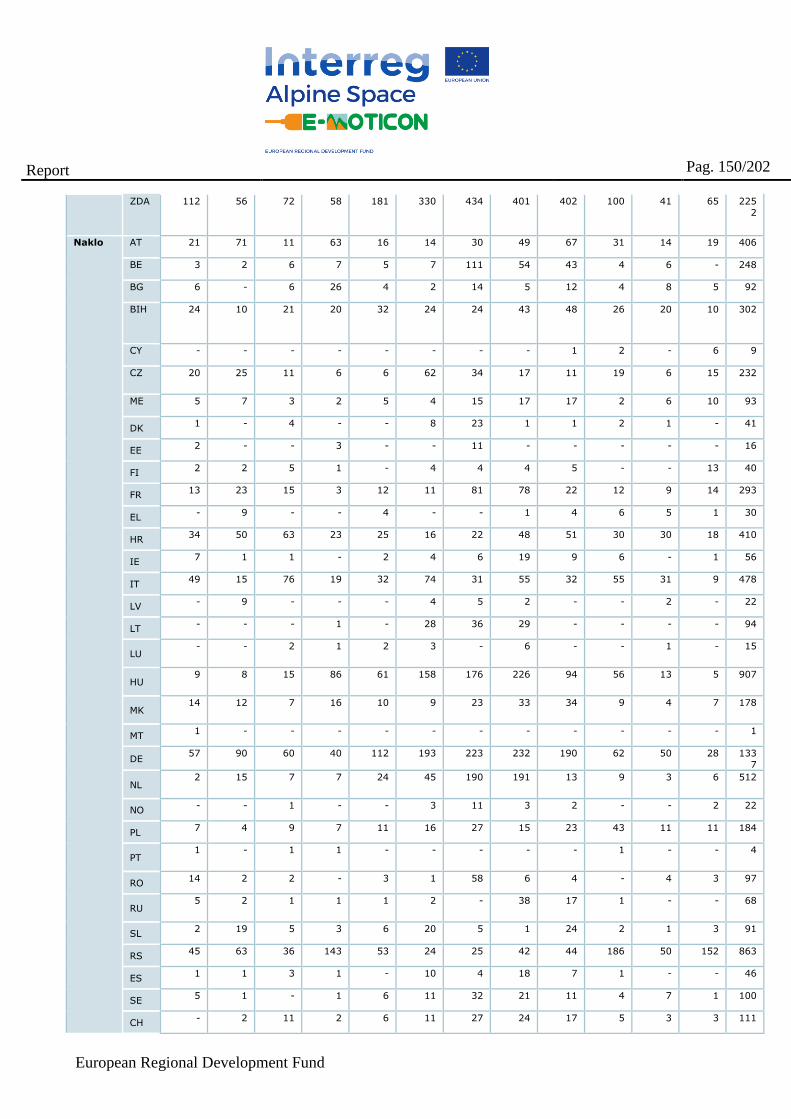
European Regional Development Fund
Report
Pag. 150/202
ZDA 112 56 72 58 181 330 434 401 402 100 41 65 225
2
Naklo AT 21 71 11 63 16 14 30 49 67 31 14 19 406
BE 3 2 6 7 5 7 111 54 43 4 6 - 248
BG 6 - 6 26 4 2 14 5 12 4 8 5 92
BIH 24 10 21 20 32 24 24 43 48 26 20 10 302
CY - - - - - - - - 1 2 - 6 9
CZ 20 25 11 6 6 62 34 17 11 19 6 15 232
ME 5 7 3 2 5 4 15 17 17 2 6 10 93
DK 1 - 4 - - 8 23 1 1 2 1 - 41
EE 2 - - 3 - - 11 - - - - - 16
FI 2 2 5 1 - 4 4 4 5 - - 13 40
FR 13 23 15 3 12 11 81 78 22 12 9 14 293
EL - 9 - - 4 - - 1 4 6 5 1 30
HR 34 50 63 23 25 16 22 48 51 30 30 18 410
IE 7 1 1 - 2 4 6 19 9 6 - 1 56
IT 49 15 76 19 32 74 31 55 32 55 31 9 478
LV - 9 - - - 4 5 2 - - 2 - 22
LT - - - 1 - 28 36 29 - - - - 94
LU - - 2 1 2 3 - 6 - - 1 - 15
HU 9 8 15 86 61 158 176 226 94 56 13 5 907
MK 14 12 7 16 10 9 23 33 34 9 4 7 178
MT 1 - - - - - - - - - - - 1
DE 57 90 60 40 112 193 223 232 190 62 50 28 133
7
NL 2 15 7 7 24 45 190 191 13 9 3 6 512
NO - - 1 - - 3 11 3 2 - - 2 22
PL 7 4 9 7 11 16 27 15 23 43 11 11 184
PT 1 - 1 1 - - - - - 1 - - 4
RO 14 2 2 - 3 1 58 6 4 - 4 3 97
RU 5 2 1 1 1 2 - 38 17 1 - - 68
SL 2 19 5 3 6 20 5 1 24 2 1 3 91
RS 45 63 36 143 53 24 25 42 44 186 50 152 863
ES 1 1 3 1 - 10 4 18 7 1 - - 46
SE 5 1 - 1 6 11 32 21 11 4 7 1 100
CH - 2 11 2 6 11 27 24 17 5 3 3 111
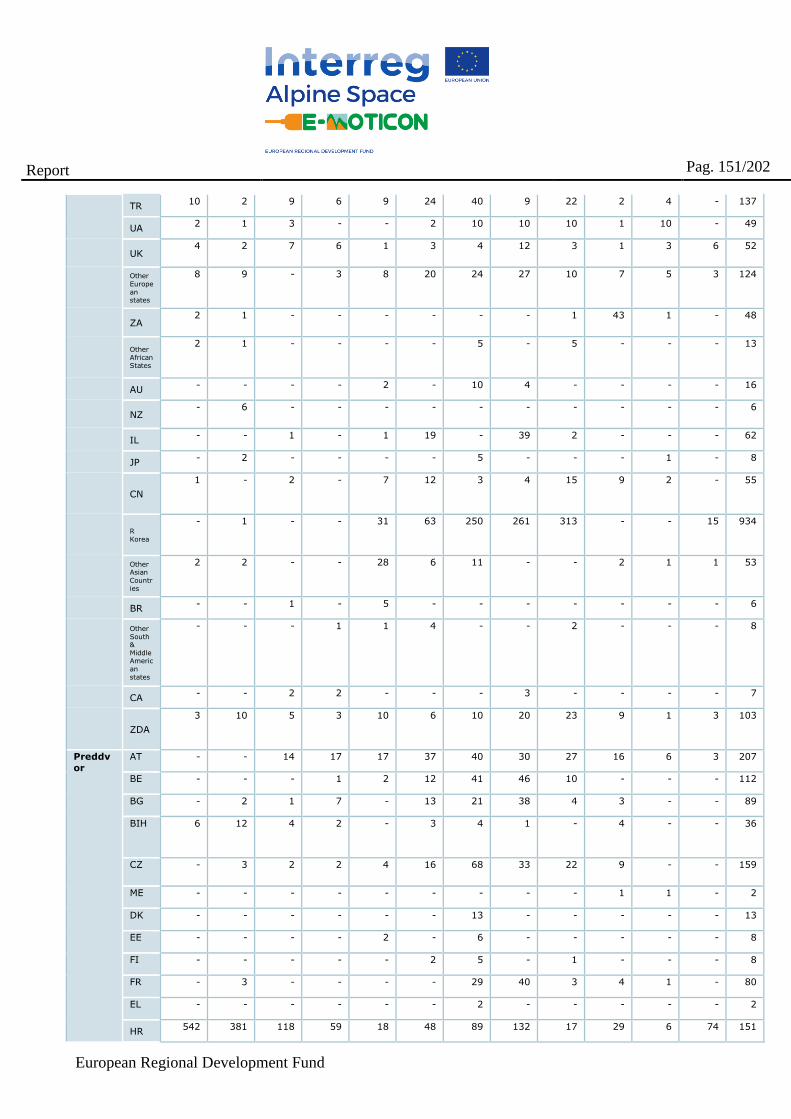
European Regional Development Fund
Report
Pag. 151/202
TR 10 2 9 6 9 24 40 9 22 2 4 - 137
UA 2 1 3 - - 2 10 10 10 1 10 - 49
UK 4 2 7 6 1 3 4 12 3 1 3 6 52
Other European states
8 9 - 3 8 20 24 27 10 7 5 3 124
ZA 2 1 - - - - - - 1 43 1 - 48
Other African States
2 1 - - - - 5 - 5 - - - 13
AU - - - - 2 - 10 4 - - - - 16
NZ - 6 - - - - - - - - - - 6
IL - - 1 - 1 19 - 39 2 - - - 62
JP - 2 - - - - 5 - - - 1 - 8
CN
1 - 2 - 7 12 3 4 15 9 2 - 55
R Korea
- 1 - - 31 63 250 261 313 - - 15 934
Other Asian Countries
2 2 - - 28 6 11 - - 2 1 1 53
BR - - 1 - 5 - - - - - - - 6
Other South & Middle American states
- - - 1 1 4 - - 2 - - - 8
CA - - 2 2 - - - 3 - - - - 7
ZDA
3 10 5 3 10 6 10 20 23 9 1 3 103
Preddv
or
AT - - 14 17 17 37 40 30 27 16 6 3 207
BE - - - 1 2 12 41 46 10 - - - 112
BG - 2 1 7 - 13 21 38 4 3 - - 89
BIH 6 12 4 2 - 3 4 1 - 4 - - 36
CZ - 3 2 2 4 16 68 33 22 9 - - 159
ME - - - - - - - - - 1 1 - 2
DK - - - - - - 13 - - - - - 13
EE - - - - 2 - 6 - - - - - 8
FI - - - - - 2 5 - 1 - - - 8
FR - 3 - - - - 29 40 3 4 1 - 80
EL - - - - - - 2 - - - - - 2
HR 542 381 118 59 18 48 89 132 17 29 6 74 151
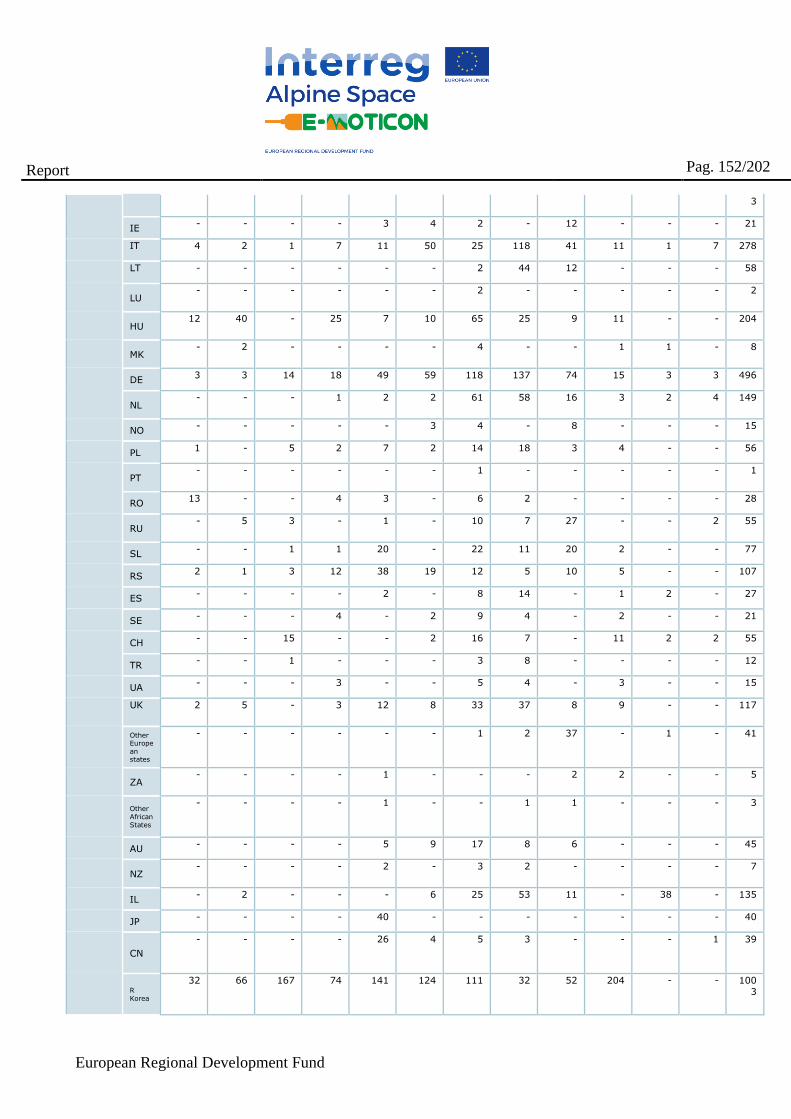
European Regional Development Fund
Report
Pag. 152/202
3
IE - - - - 3 4 2 - 12 - - - 21
IT 4 2 1 7 11 50 25 118 41 11 1 7 278
LT - - - - - - 2 44 12 - - - 58
LU - - - - - - 2 - - - - - 2
HU 12 40 - 25 7 10 65 25 9 11 - - 204
MK - 2 - - - - 4 - - 1 1 - 8
DE 3 3 14 18 49 59 118 137 74 15 3 3 496
NL - - - 1 2 2 61 58 16 3 2 4 149
NO - - - - - 3 4 - 8 - - - 15
PL 1 - 5 2 7 2 14 18 3 4 - - 56
PT - - - - - - 1 - - - - - 1
RO 13 - - 4 3 - 6 2 - - - - 28
RU - 5 3 - 1 - 10 7 27 - - 2 55
SL - - 1 1 20 - 22 11 20 2 - - 77
RS 2 1 3 12 38 19 12 5 10 5 - - 107
ES - - - - 2 - 8 14 - 1 2 - 27
SE - - - 4 - 2 9 4 - 2 - - 21
CH - - 15 - - 2 16 7 - 11 2 2 55
TR - - 1 - - - 3 8 - - - - 12
UA - - - 3 - - 5 4 - 3 - - 15
UK 2 5 - 3 12 8 33 37 8 9 - - 117
Other European states
- - - - - - 1 2 37 - 1 - 41
ZA - - - - 1 - - - 2 2 - - 5
Other African States
- - - - 1 - - 1 1 - - - 3
AU - - - - 5 9 17 8 6 - - - 45
NZ - - - - 2 - 3 2 - - - - 7
IL - 2 - - - 6 25 53 11 - 38 - 135
JP - - - - 40 - - - - - - - 40
CN
- - - - 26 4 5 3 - - - 1 39
R Korea
32 66 167 74 141 124 111 32 52 204 - - 100
3
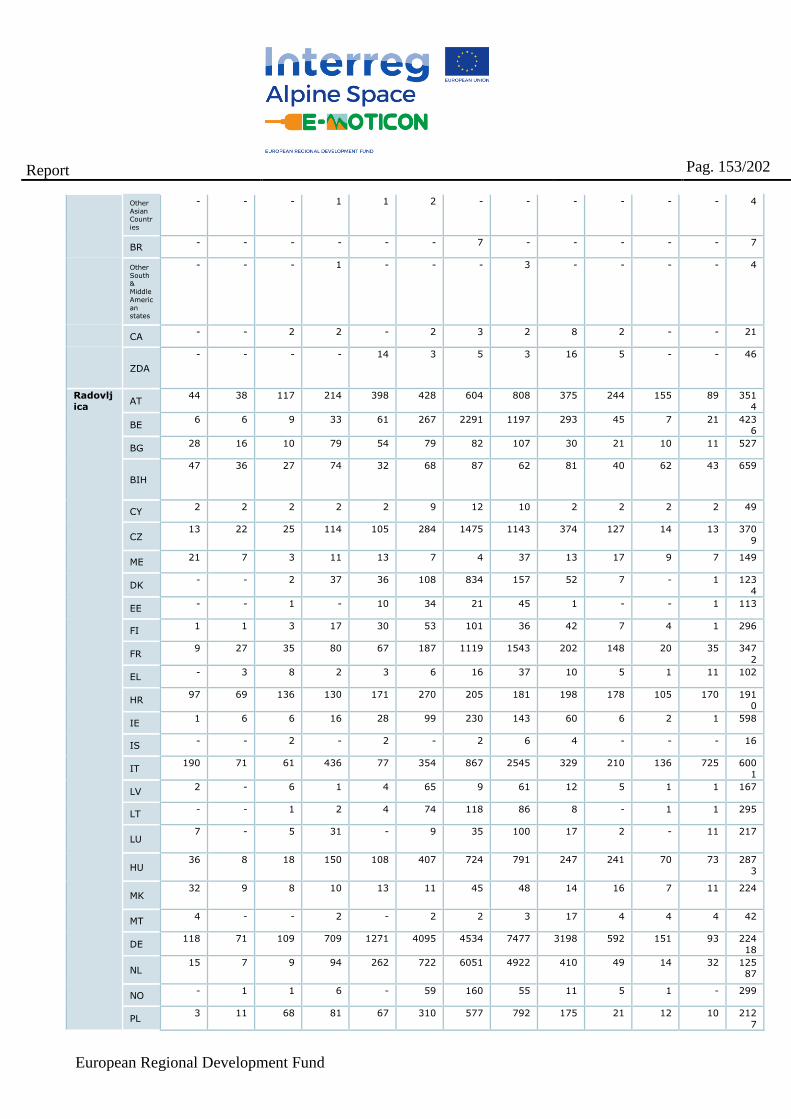
European Regional Development Fund
Report
Pag. 153/202
Other Asian Countries
- - - 1 1 2 - - - - - - 4
BR - - - - - - 7 - - - - - 7
Other South & Middle American states
- - - 1 - - - 3 - - - - 4
CA - - 2 2 - 2 3 2 8 2 - - 21
ZDA
- - - - 14 3 5 3 16 5 - - 46
Radovlj
ica AT
44 38 117 214 398 428 604 808 375 244 155 89 351
4
BE 6 6 9 33 61 267 2291 1197 293 45 7 21 423
6
BG 28 16 10 79 54 79 82 107 30 21 10 11 527
BIH
47 36 27 74 32 68 87 62 81 40 62 43 659
CY 2 2 2 2 2 9 12 10 2 2 2 2 49
CZ 13 22 25 114 105 284 1475 1143 374 127 14 13 370
9
ME 21 7 3 11 13 7 4 37 13 17 9 7 149
DK - - 2 37 36 108 834 157 52 7 - 1 123
4
EE - - 1 - 10 34 21 45 1 - - 1 113
FI 1 1 3 17 30 53 101 36 42 7 4 1 296
FR 9 27 35 80 67 187 1119 1543 202 148 20 35 347
2
EL - 3 8 2 3 6 16 37 10 5 1 11 102
HR 97 69 136 130 171 270 205 181 198 178 105 170 191
0
IE 1 6 6 16 28 99 230 143 60 6 2 1 598
IS - - 2 - 2 - 2 6 4 - - - 16
IT 190 71 61 436 77 354 867 2545 329 210 136 725 600
1
LV 2 - 6 1 4 65 9 61 12 5 1 1 167
LT - - 1 2 4 74 118 86 8 - 1 1 295
LU 7 - 5 31 - 9 35 100 17 2 - 11 217
HU 36 8 18 150 108 407 724 791 247 241 70 73 287
3
MK 32 9 8 10 13 11 45 48 14 16 7 11 224
MT 4 - - 2 - 2 2 3 17 4 4 4 42
DE 118 71 109 709 1271 4095 4534 7477 3198 592 151 93 224
18
NL 15 7 9 94 262 722 6051 4922 410 49 14 32 125
87
NO - 1 1 6 - 59 160 55 11 5 1 - 299
PL 3 11 68 81 67 310 577 792 175 21 12 10 212
7
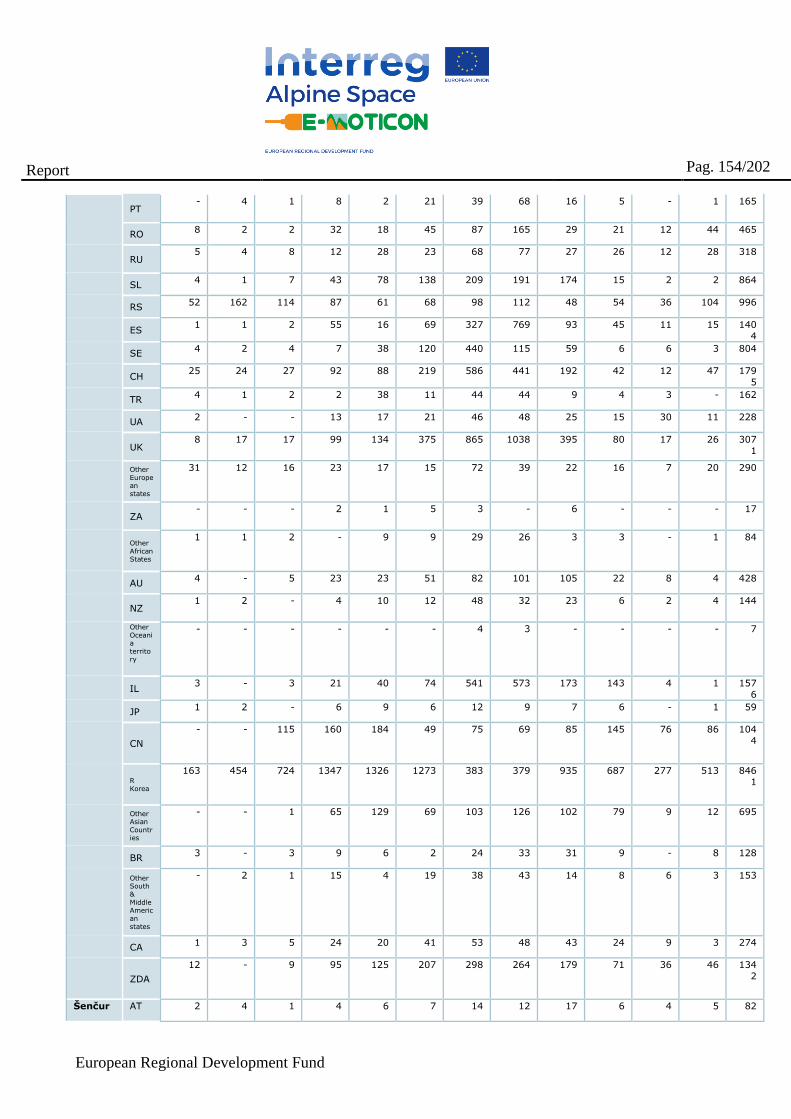
European Regional Development Fund
Report
Pag. 154/202
PT - 4 1 8 2 21 39 68 16 5 - 1 165
RO 8 2 2 32 18 45 87 165 29 21 12 44 465
RU 5 4 8 12 28 23 68 77 27 26 12 28 318
SL 4 1 7 43 78 138 209 191 174 15 2 2 864
RS 52 162 114 87 61 68 98 112 48 54 36 104 996
ES 1 1 2 55 16 69 327 769 93 45 11 15 140
4
SE 4 2 4 7 38 120 440 115 59 6 6 3 804
CH 25 24 27 92 88 219 586 441 192 42 12 47 179
5
TR 4 1 2 2 38 11 44 44 9 4 3 - 162
UA 2 - - 13 17 21 46 48 25 15 30 11 228
UK 8 17 17 99 134 375 865 1038 395 80 17 26 307
1
Other European states
31 12 16 23 17 15 72 39 22 16 7 20 290
ZA - - - 2 1 5 3 - 6 - - - 17
Other African States
1 1 2 - 9 9 29 26 3 3 - 1 84
AU 4 - 5 23 23 51 82 101 105 22 8 4 428
NZ 1 2 - 4 10 12 48 32 23 6 2 4 144
Other Oceania territory
- - - - - - 4 3 - - - - 7
IL 3 - 3 21 40 74 541 573 173 143 4 1 157
6
JP 1 2 - 6 9 6 12 9 7 6 - 1 59
CN
- - 115 160 184 49 75 69 85 145 76 86 104
4
R Korea
163 454 724 1347 1326 1273 383 379 935 687 277 513 846
1
Other Asian Countries
- - 1 65 129 69 103 126 102 79 9 12 695
BR 3 - 3 9 6 2 24 33 31 9 - 8 128
Other South & Middle American states
- 2 1 15 4 19 38 43 14 8 6 3 153
CA 1 3 5 24 20 41 53 48 43 24 9 3 274
ZDA
12 - 9 95 125 207 298 264 179 71 36 46 134
2
Šenčur AT 2 4 1 4 6 7 14 12 17 6 4 5 82
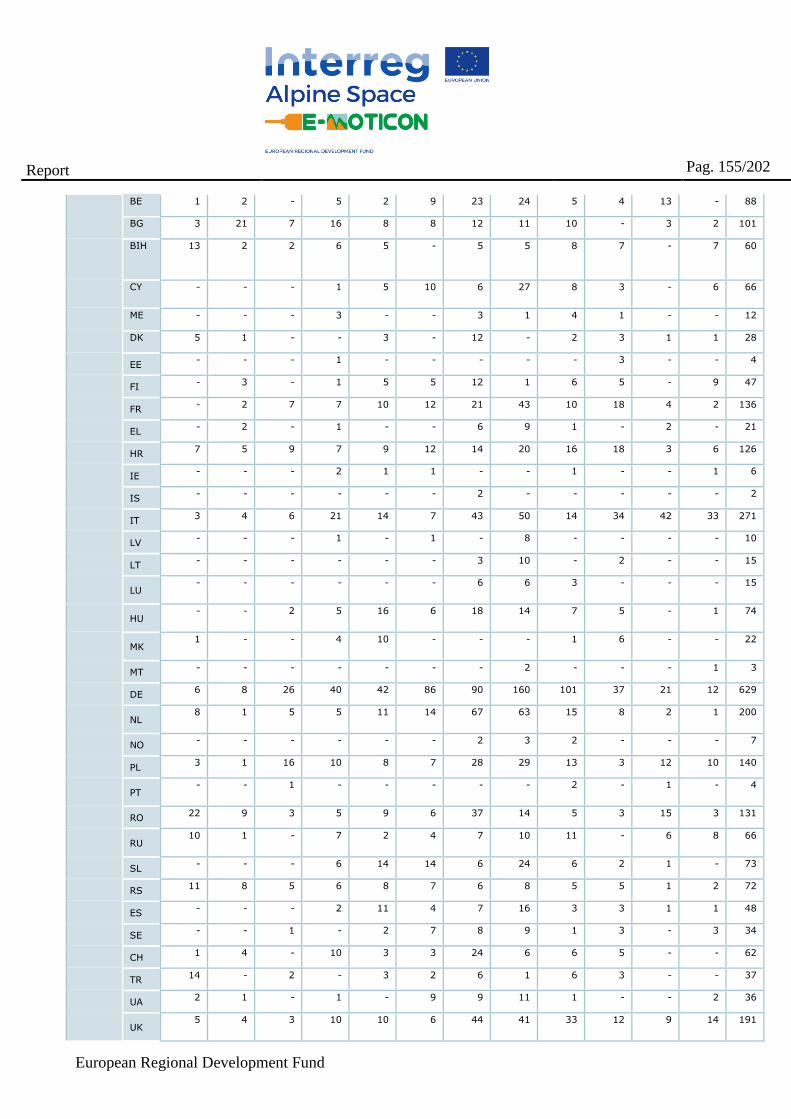
European Regional Development Fund
Report
Pag. 155/202
BE 1 2 - 5 2 9 23 24 5 4 13 - 88
BG 3 21 7 16 8 8 12 11 10 - 3 2 101
BIH 13 2 2 6 5 - 5 5 8 7 - 7 60
CY - - - 1 5 10 6 27 8 3 - 6 66
ME - - - 3 - - 3 1 4 1 - - 12
DK 5 1 - - 3 - 12 - 2 3 1 1 28
EE - - - 1 - - - - - 3 - - 4
FI - 3 - 1 5 5 12 1 6 5 - 9 47
FR - 2 7 7 10 12 21 43 10 18 4 2 136
EL - 2 - 1 - - 6 9 1 - 2 - 21
HR 7 5 9 7 9 12 14 20 16 18 3 6 126
IE - - - 2 1 1 - - 1 - - 1 6
IS - - - - - - 2 - - - - - 2
IT 3 4 6 21 14 7 43 50 14 34 42 33 271
LV - - - 1 - 1 - 8 - - - - 10
LT - - - - - - 3 10 - 2 - - 15
LU - - - - - - 6 6 3 - - - 15
HU - - 2 5 16 6 18 14 7 5 - 1 74
MK 1 - - 4 10 - - - 1 6 - - 22
MT - - - - - - - 2 - - - 1 3
DE 6 8 26 40 42 86 90 160 101 37 21 12 629
NL 8 1 5 5 11 14 67 63 15 8 2 1 200
NO - - - - - - 2 3 2 - - - 7
PL 3 1 16 10 8 7 28 29 13 3 12 10 140
PT - - 1 - - - - - 2 - 1 - 4
RO 22 9 3 5 9 6 37 14 5 3 15 3 131
RU 10 1 - 7 2 4 7 10 11 - 6 8 66
SL - - - 6 14 14 6 24 6 2 1 - 73
RS 11 8 5 6 8 7 6 8 5 5 1 2 72
ES - - - 2 11 4 7 16 3 3 1 1 48
SE - - 1 - 2 7 8 9 1 3 - 3 34
CH 1 4 - 10 3 3 24 6 6 5 - - 62
TR 14 - 2 - 3 2 6 1 6 3 - - 37
UA 2 1 - 1 - 9 9 11 1 - - 2 36
UK 5 4 3 10 10 6 44 41 33 12 9 14 191
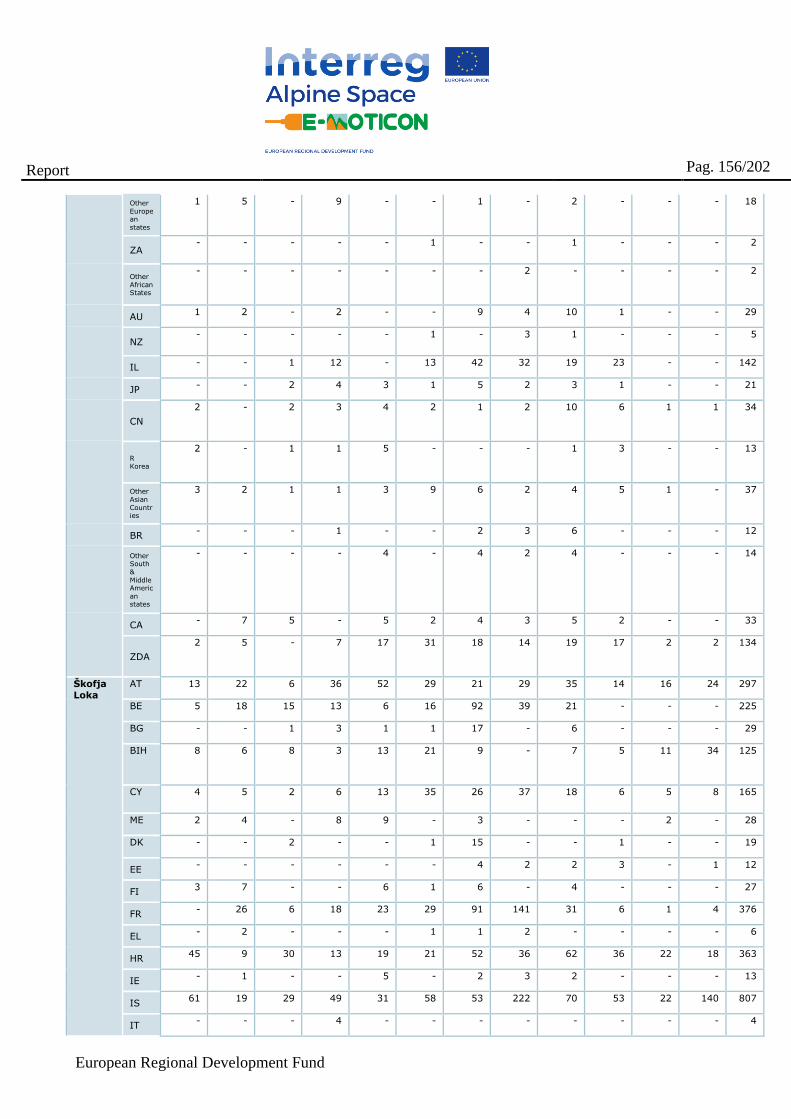
European Regional Development Fund
Report
Pag. 156/202
Other European states
1 5 - 9 - - 1 - 2 - - - 18
ZA - - - - - 1 - - 1 - - - 2
Other African States
- - - - - - - 2 - - - - 2
AU 1 2 - 2 - - 9 4 10 1 - - 29
NZ - - - - - 1 - 3 1 - - - 5
IL - - 1 12 - 13 42 32 19 23 - - 142
JP - - 2 4 3 1 5 2 3 1 - - 21
CN
2 - 2 3 4 2 1 2 10 6 1 1 34
R Korea
2 - 1 1 5 - - - 1 3 - - 13
Other Asian Countries
3 2 1 1 3 9 6 2 4 5 1 - 37
BR - - - 1 - - 2 3 6 - - - 12
Other South & Middle American states
- - - - 4 - 4 2 4 - - - 14
CA - 7 5 - 5 2 4 3 5 2 - - 33
ZDA
2 5 - 7 17 31 18 14 19 17 2 2 134
Škofja
Loka
AT 13 22 6 36 52 29 21 29 35 14 16 24 297
BE 5 18 15 13 6 16 92 39 21 - - - 225
BG - - 1 3 1 1 17 - 6 - - - 29
BIH 8 6 8 3 13 21 9 - 7 5 11 34 125
CY 4 5 2 6 13 35 26 37 18 6 5 8 165
ME 2 4 - 8 9 - 3 - - - 2 - 28
DK - - 2 - - 1 15 - - 1 - - 19
EE - - - - - - 4 2 2 3 - 1 12
FI 3 7 - - 6 1 6 - 4 - - - 27
FR - 26 6 18 23 29 91 141 31 6 1 4 376
EL - 2 - - - 1 1 2 - - - - 6
HR 45 9 30 13 19 21 52 36 62 36 22 18 363
IE - 1 - - 5 - 2 3 2 - - - 13
IS 61 19 29 49 31 58 53 222 70 53 22 140 807
IT - - - 4 - - - - - - - - 4
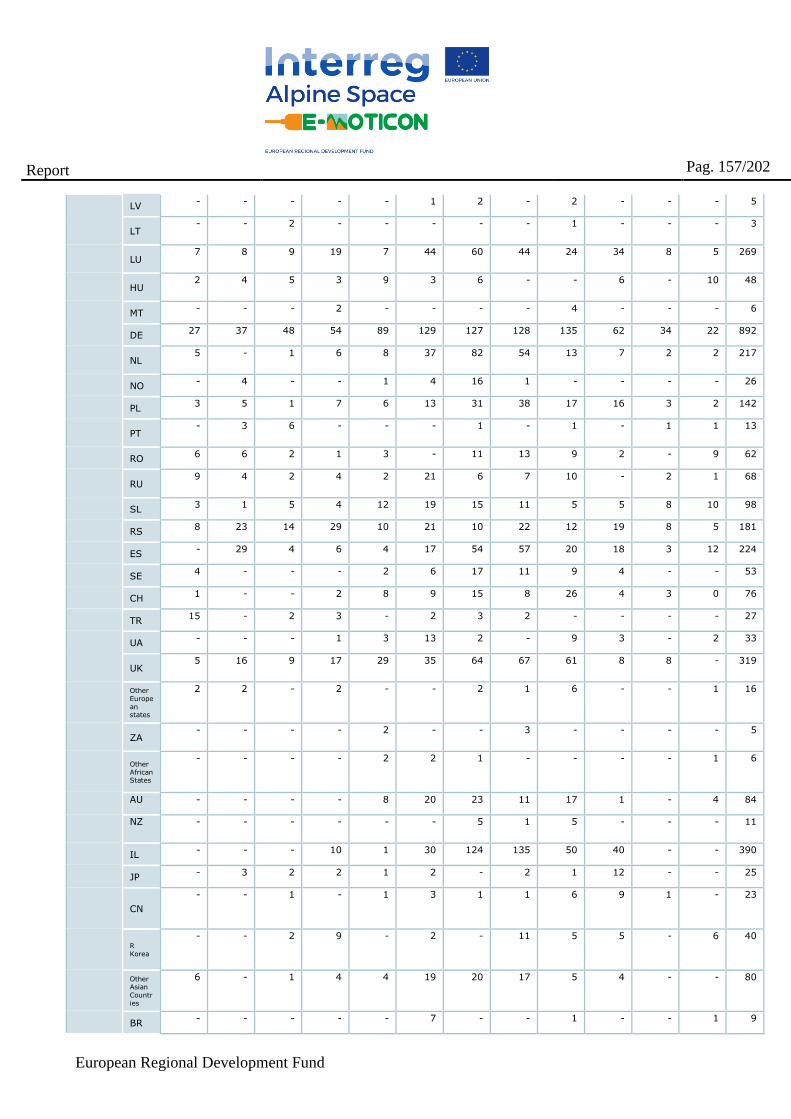
European Regional Development Fund
Report
Pag. 157/202
LV - - - - - 1 2 - 2 - - - 5
LT - - 2 - - - - - 1 - - - 3
LU 7 8 9 19 7 44 60 44 24 34 8 5 269
HU 2 4 5 3 9 3 6 - - 6 - 10 48
MT - - - 2 - - - - 4 - - - 6
DE 27 37 48 54 89 129 127 128 135 62 34 22 892
NL 5 - 1 6 8 37 82 54 13 7 2 2 217
NO - 4 - - 1 4 16 1 - - - - 26
PL 3 5 1 7 6 13 31 38 17 16 3 2 142
PT - 3 6 - - - 1 - 1 - 1 1 13
RO 6 6 2 1 3 - 11 13 9 2 - 9 62
RU 9 4 2 4 2 21 6 7 10 - 2 1 68
SL 3 1 5 4 12 19 15 11 5 5 8 10 98
RS 8 23 14 29 10 21 10 22 12 19 8 5 181
ES - 29 4 6 4 17 54 57 20 18 3 12 224
SE 4 - - - 2 6 17 11 9 4 - - 53
CH 1 - - 2 8 9 15 8 26 4 3 0 76
TR 15 - 2 3 - 2 3 2 - - - - 27
UA - - - 1 3 13 2 - 9 3 - 2 33
UK 5 16 9 17 29 35 64 67 61 8 8 - 319
Other European states
2 2 - 2 - - 2 1 6 - - 1 16
ZA - - - - 2 - - 3 - - - - 5
Other African States
- - - - 2 2 1 - - - - 1 6
AU - - - - 8 20 23 11 17 1 - 4 84
NZ - - - - - - 5 1 5 - - - 11
IL - - - 10 1 30 124 135 50 40 - - 390
JP - 3 2 2 1 2 - 2 1 12 - - 25
CN
- - 1 - 1 3 1 1 6 9 1 - 23
R Korea
- - 2 9 - 2 - 11 5 5 - 6 40
Other Asian Countries
6 - 1 4 4 19 20 17 5 4 - - 80
BR - - - - - 7 - - 1 - - 1 9
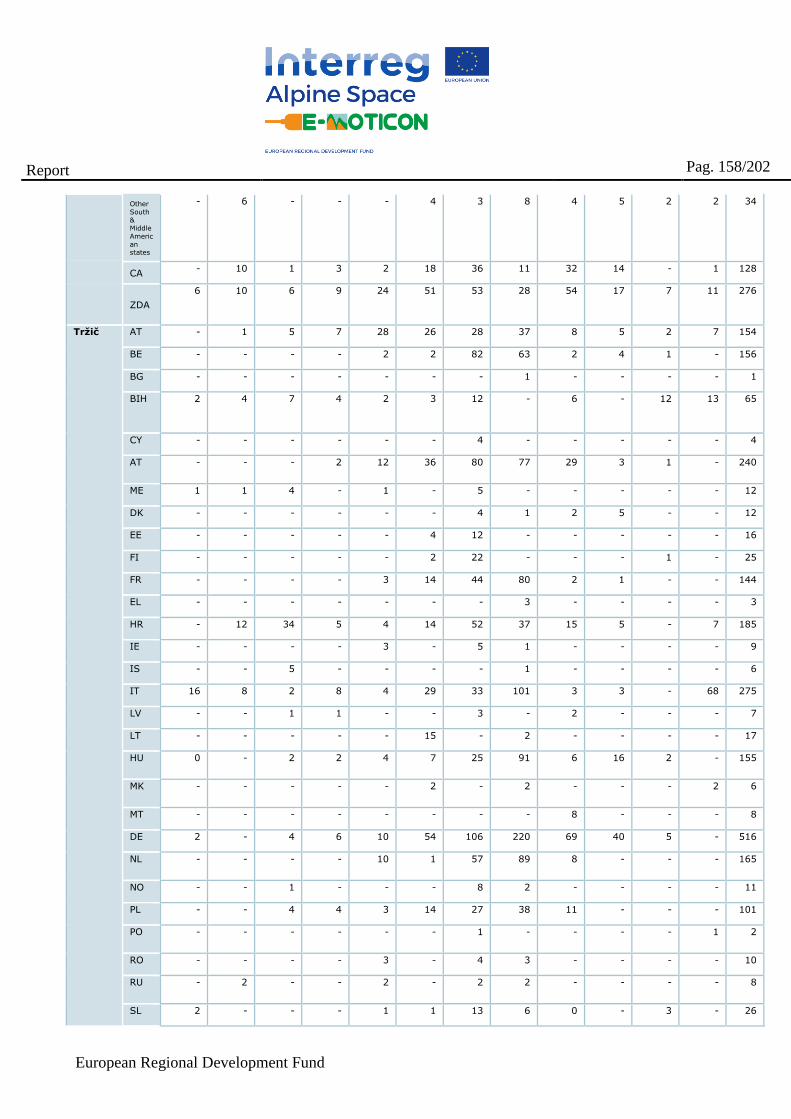
European Regional Development Fund
Report
Pag. 158/202
Other South & Middle American states
- 6 - - - 4 3 8 4 5 2 2 34
CA - 10 1 3 2 18 36 11 32 14 - 1 128
ZDA
6 10 6 9 24 51 53 28 54 17 7 11 276
Tržič AT - 1 5 7 28 26 28 37 8 5 2 7 154
BE - - - - 2 2 82 63 2 4 1 - 156
BG - - - - - - - 1 - - - - 1
BIH 2 4 7 4 2 3 12 - 6 - 12 13 65
CY - - - - - - 4 - - - - - 4
AT - - - 2 12 36 80 77 29 3 1 - 240
ME 1 1 4 - 1 - 5 - - - - - 12
DK - - - - - - 4 1 2 5 - - 12
EE - - - - - 4 12 - - - - - 16
FI - - - - - 2 22 - - - 1 - 25
FR - - - - 3 14 44 80 2 1 - - 144
EL - - - - - - - 3 - - - - 3
HR - 12 34 5 4 14 52 37 15 5 - 7 185
IE - - - - 3 - 5 1 - - - - 9
IS - - 5 - - - - 1 - - - - 6
IT 16 8 2 8 4 29 33 101 3 3 - 68 275
LV - - 1 1 - - 3 - 2 - - - 7
LT - - - - - 15 - 2 - - - - 17
HU 0 - 2 2 4 7 25 91 6 16 2 - 155
MK - - - - - 2 - 2 - - - 2 6
MT - - - - - - - - 8 - - - 8
DE 2 - 4 6 10 54 106 220 69 40 5 - 516
NL - - - - 10 1 57 89 8 - - - 165
NO - - 1 - - - 8 2 - - - - 11
PL - - 4 4 3 14 27 38 11 - - - 101
PO - - - - - - 1 - - - - 1 2
RO - - - - 3 - 4 3 - - - - 10
RU - 2 - - 2 - 2 2 - - - - 8
SL 2 - - - 1 1 13 6 0 - 3 - 26
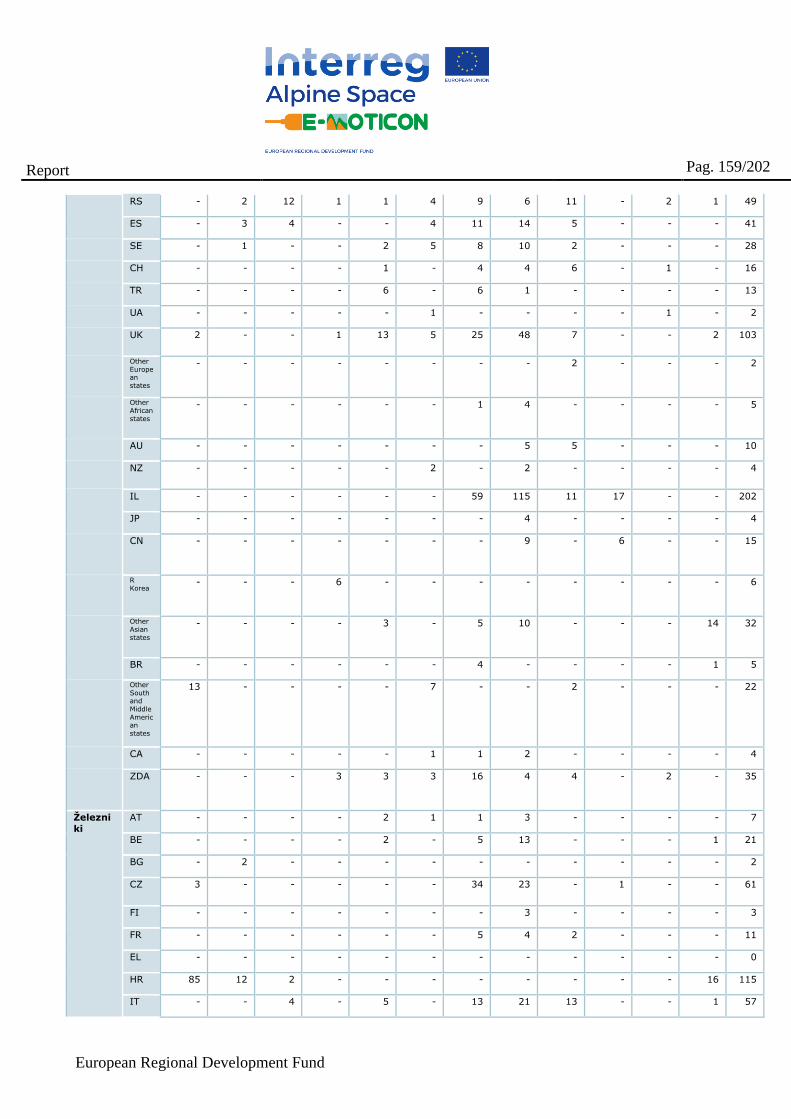
European Regional Development Fund
Report
Pag. 159/202
RS - 2 12 1 1 4 9 6 11 - 2 1 49
ES - 3 4 - - 4 11 14 5 - - - 41
SE - 1 - - 2 5 8 10 2 - - - 28
CH - - - - 1 - 4 4 6 - 1 - 16
TR - - - - 6 - 6 1 - - - - 13
UA - - - - - 1 - - - - 1 - 2
UK 2 - - 1 13 5 25 48 7 - - 2 103
Other
European states
- - - - - - - - 2 - - - 2
Other African states
- - - - - - 1 4 - - - - 5
AU - - - - - - - 5 5 - - - 10
NZ - - - - - 2 - 2 - - - - 4
IL - - - - - - 59 115 11 17 - - 202
JP - - - - - - - 4 - - - - 4
CN - - - - - - - 9 - 6 - - 15
R Korea
- - - 6 - - - - - - - - 6
Other Asian states
- - - - 3 - 5 10 - - - 14 32
BR - - - - - - 4 - - - - 1 5
Other South and Middle American states
13 - - - - 7 - - 2 - - - 22
CA - - - - - 1 1 2 - - - - 4
ZDA - - - 3 3 3 16 4 4 - 2 - 35
Železni
ki
AT - - - - 2 1 1 3 - - - - 7
BE - - - - 2 - 5 13 - - - 1 21
BG - 2 - - - - - - - - - - 2
CZ 3 - - - - - 34 23 - 1 - - 61
FI - - - - - - - 3 - - - - 3
FR - - - - - - 5 4 2 - - - 11
EL - - - - - - - - - - - - 0
HR 85 12 2 - - - - - - - - 16 115
IT - - 4 - 5 - 13 21 13 - - 1 57
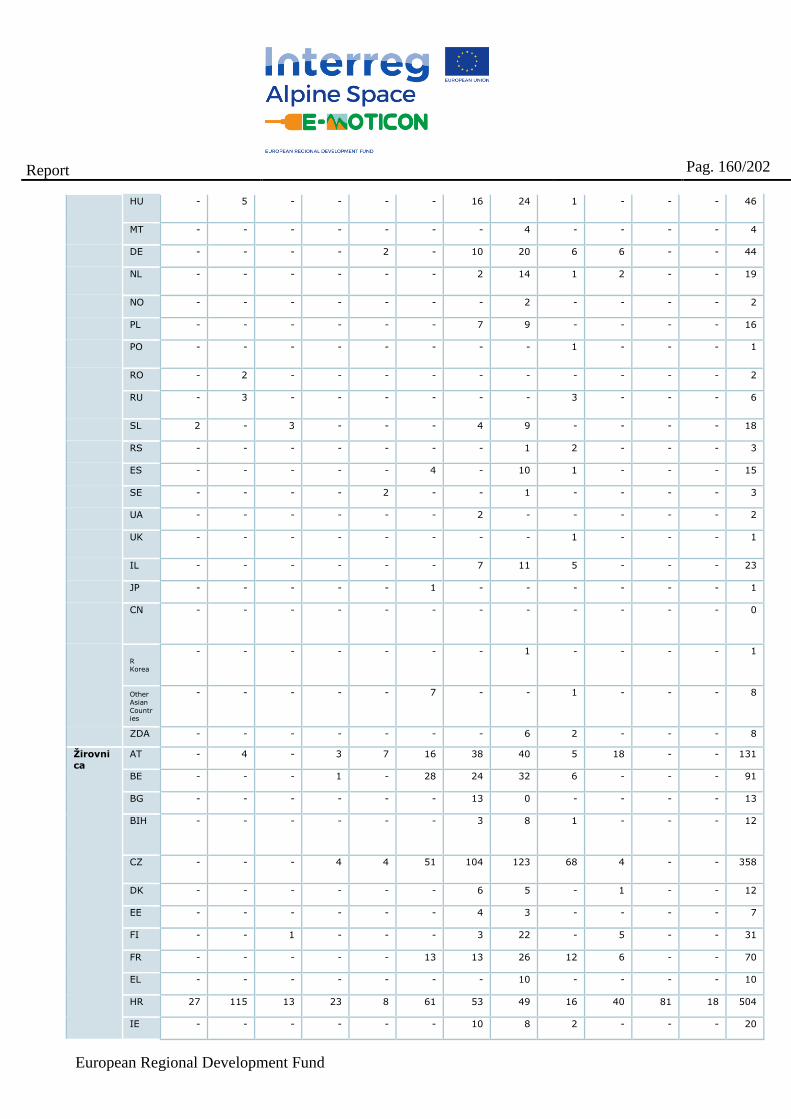
European Regional Development Fund
Report
Pag. 160/202
HU - 5 - - - - 16 24 1 - - - 46
MT - - - - - - - 4 - - - - 4
DE - - - - 2 - 10 20 6 6 - - 44
NL - - - - - - 2 14 1 2 - - 19
NO - - - - - - - 2 - - - - 2
PL - - - - - - 7 9 - - - - 16
PO - - - - - - - - 1 - - - 1
RO - 2 - - - - - - - - - - 2
RU - 3 - - - - - - 3 - - - 6
SL 2 - 3 - - - 4 9 - - - - 18
RS - - - - - - - 1 2 - - - 3
ES - - - - - 4 - 10 1 - - - 15
SE - - - - 2 - - 1 - - - - 3
UA - - - - - - 2 - - - - - 2
UK - - - - - - - - 1 - - - 1
IL - - - - - - 7 11 5 - - - 23
JP - - - - - 1 - - - - - - 1
CN - - - - - - - - - - - - 0
R Korea
- - - - - - - 1 - - - - 1
Other Asian Countries
- - - - - 7 - - 1 - - - 8
ZDA - - - - - - - 6 2 - - - 8
Žirovni
ca
AT - 4 - 3 7 16 38 40 5 18 - - 131
BE - - - 1 - 28 24 32 6 - - - 91
BG - - - - - - 13 0 - - - - 13
BIH - - - - - - 3 8 1 - - - 12
CZ - - - 4 4 51 104 123 68 4 - - 358
DK - - - - - - 6 5 - 1 - - 12
EE - - - - - - 4 3 - - - - 7
FI - - 1 - - - 3 22 - 5 - - 31
FR - - - - - 13 13 26 12 6 - - 70
EL - - - - - - - 10 - - - - 10
HR 27 115 13 23 8 61 53 49 16 40 81 18 504
IE - - - - - - 10 8 2 - - - 20
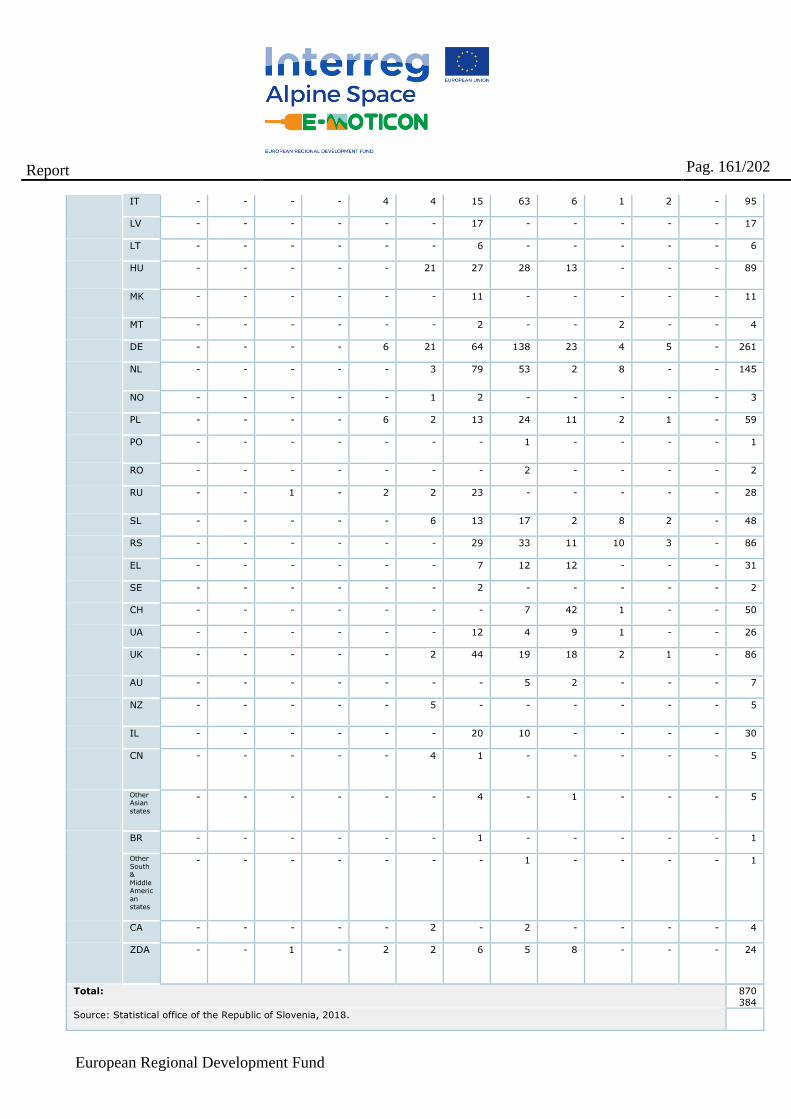
European Regional Development Fund
Report
Pag. 161/202
IT - - - - 4 4 15 63 6 1 2 - 95
LV - - - - - - 17 - - - - - 17
LT - - - - - - 6 - - - - - 6
HU - - - - - 21 27 28 13 - - - 89
MK - - - - - - 11 - - - - - 11
MT - - - - - - 2 - - 2 - - 4
DE - - - - 6 21 64 138 23 4 5 - 261
NL - - - - - 3 79 53 2 8 - - 145
NO - - - - - 1 2 - - - - - 3
PL - - - - 6 2 13 24 11 2 1 - 59
PO - - - - - - - 1 - - - - 1
RO - - - - - - - 2 - - - - 2
RU - - 1 - 2 2 23 - - - - - 28
SL - - - - - 6 13 17 2 8 2 - 48
RS - - - - - - 29 33 11 10 3 - 86
EL - - - - - - 7 12 12 - - - 31
SE - - - - - - 2 - - - - - 2
CH - - - - - - - 7 42 1 - - 50
UA - - - - - - 12 4 9 1 - - 26
UK - - - - - 2 44 19 18 2 1 - 86
AU - - - - - - - 5 2 - - - 7
NZ - - - - - 5 - - - - - - 5
IL - - - - - - 20 10 - - - - 30
CN - - - - - 4 1 - - - - - 5
Other Asian states
- - - - - - 4 - 1 - - - 5
BR - - - - - - 1 - - - - - 1
Other South & Middle American states
- - - - - - - 1 - - - - 1
CA - - - - - 2 - 2 - - - - 4
ZDA - - 1 - 2 2 6 5 8 - - - 24
Total: 870
384
Source: Statistical office of the Republic of Slovenia, 2018.
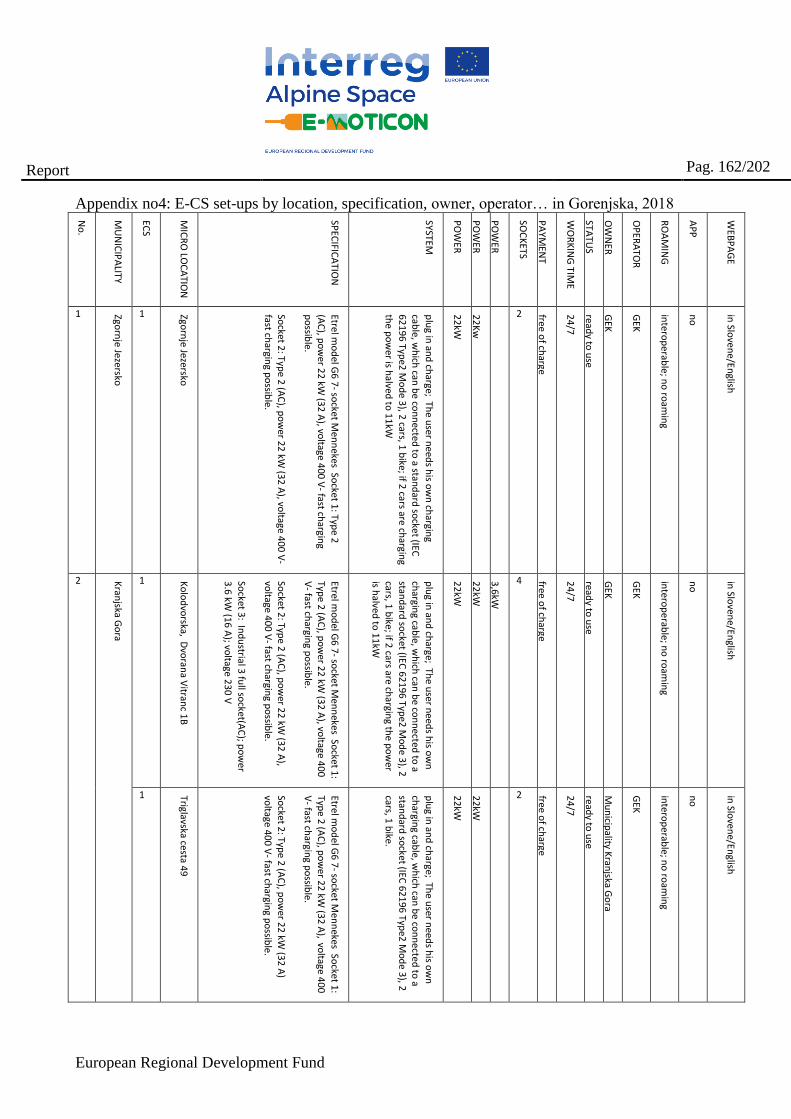
European Regional Development Fund
Report
Pag. 162/202
Appendix no4: E-CS set-ups by location, specification, owner, operator… in Gorenjska, 2018
No
.
MU
NIC
IPA
LITY
ECS
MIC
RO
LOC
ATIO
N
SPEC
IFICA
TION
SYSTEM
PO
WER
PO
WER
PO
WER
SOC
KETS
PA
YMEN
T
WO
RK
ING
TIME
STATU
S
OW
NER
OP
ERA
TOR
RO
AM
ING
AP
P
WEB
PA
GE
1 Zgorn
je Jezersko
1 Zgorn
je Jezersko
Etrel mo
del G
6 7
- socket M
enn
ekes Socket 1
: Type 2
(AC
), po
wer 2
2 kW
(32
A), vo
ltage 400
V- fast ch
arging
po
ssible.
Socket 2
: Type 2
(AC
), po
wer 2
2 kW
(32
A), vo
ltage 40
0 V
- fast ch
arging p
ossib
le.
plu
g in an
d ch
arge; The u
ser need
s his o
wn
chargin
g
cable, w
hich
can b
e con
nected
to a stan
dard
socke
t (IEC
62
19
6 Typ
e2 M
od
e 3), 2
cars, 1 b
ike; if 2 cars are
chargin
g
the p
ow
er is halved
to 1
1kW
22
kW
22
Kw
2 free of ch
arge
24
/7
ready to
use
GEK
GEK
intero
pe
rable; n
o ro
amin
g
no
in Slo
vene/En
glish
2 Kran
jska Go
ra
1 Ko
lod
vorska, D
voran
a Vitran
c 1B
Etrel mo
del G
6 7
- socket M
enn
ekes Socket 1
:
Type 2
(AC
), po
wer 2
2 kW
(32
A), vo
ltage 40
0
V- fast ch
arging p
ossib
le.
Socket 2
: Type 2
(AC
), po
wer 2
2 kW
(32
A),
voltage 4
00
V- fast ch
arging p
ossib
le.
Socket 3
: Ind
ustrial 3
full so
cket(AC
); po
wer
3.6
kW (1
6 A
); voltage 2
30
V
plu
g in an
d ch
arge; The u
ser need
s his o
wn
chargin
g cable, w
hich
can b
e con
nected
to a
stand
ard so
cket (IEC 6
21
96
Type2
Mo
de 3
), 2
cars, 1 b
ike; if 2 cars are ch
arging th
e po
wer
is halved
to 1
1kW
22
kW
22
kW
3,6
kW
4 free of ch
arge
24
/7
ready to
use
GEK
GEK
intero
pe
rable; n
o ro
amin
g
no
in Slo
vene/En
glish
1 Triglavska cesta 49
Etrel mo
del G
6 7
- socket M
enn
ekes Socket 1
:
Type 2
(AC
), po
wer 2
2 kW
(32
A), vo
ltage 40
0
V- fast ch
arging p
ossib
le.
Socket 2
: Type 2
(AC
), po
wer 2
2 kW
(32
A)
voltage 4
00
V- fast ch
arging p
ossib
le.
plu
g in an
d ch
arge; The u
ser need
s his o
wn
chargin
g cable, w
hich
can b
e con
nected
to a
stand
ard so
cket (IEC 6
21
96
Type2
Mo
de 3
), 2
cars, 1 b
ike.
22
kW
22
kW
2 free of ch
arge
24
/7
ready to
use
Mu
nicip
ality Kran
jska Go
ra
GEK
intero
pe
rable; n
o ro
amin
g
no
in Slo
vene/En
glish
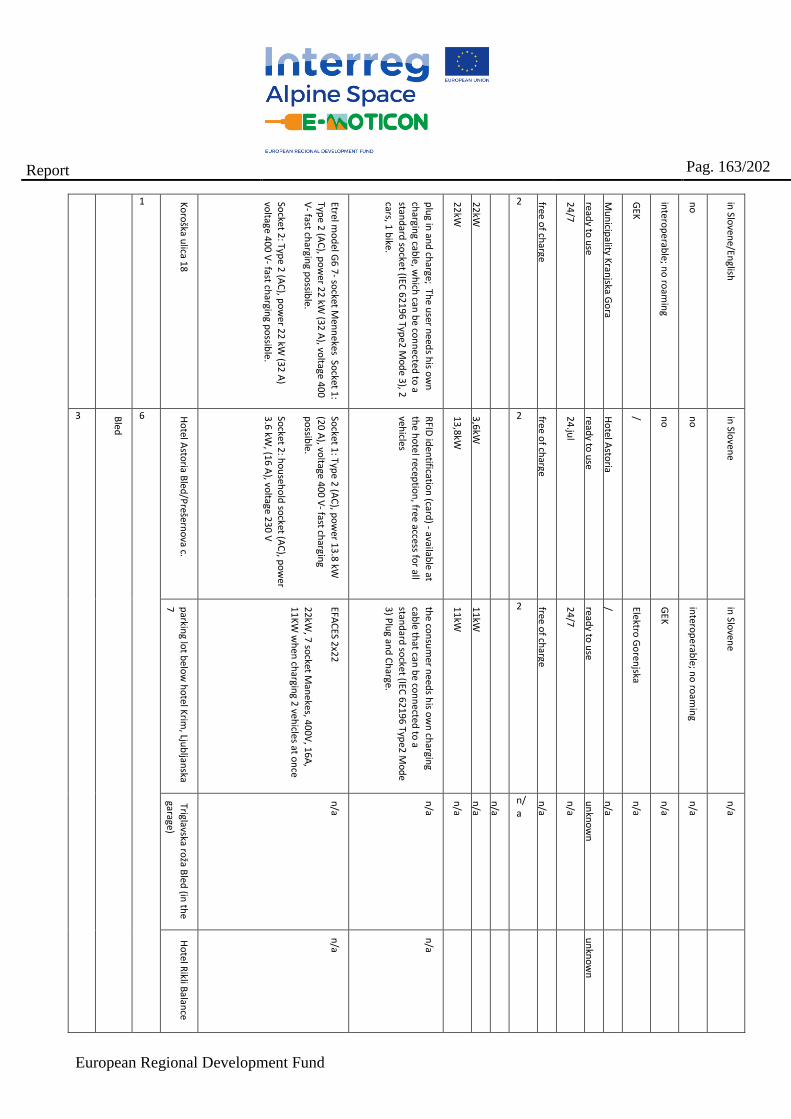
European Regional Development Fund
Report
Pag. 163/202
1 Ko
roška u
lica 18
Etrel mo
del G
6 7
- socket M
enn
ekes Socket 1
:
Type 2
(AC
), po
wer 2
2 kW
(32
A), vo
ltage 40
0
V- fast ch
arging p
ossib
le.
Socket 2
: Type 2
(AC
), po
wer 2
2 kW
(32
A)
voltage 4
00
V- fast ch
arging p
ossib
le.
plu
g in an
d ch
arge; The u
ser need
s his o
wn
chargin
g cable, w
hich
can b
e con
nected
to a
stand
ard so
cket (IEC 6
21
96
Type2
Mo
de 3
), 2
cars, 1 b
ike.
22
kW
22
kW
2 free of ch
arge
24
/7
ready to
use
Mu
nicip
ality Kran
jska Go
ra
GEK
intero
pe
rable; n
o ro
amin
g
no
in Slo
vene/En
glish
3 Bled
6 Ho
tel Asto
ria Bled
/Prešern
ova c.
Socket 1
: Type 2
(AC
), po
wer 1
3.8
kW
(20
A), vo
ltage 40
0 V
- fast chargin
g p
ossib
le.
Socket 2
: ho
useh
old
socket (A
C), p
ow
er 3
.6 kW
, (16
A), vo
ltage 23
0 V
RFID
iden
tification
(card) - availab
le at
the h
ote
l receptio
n, free access fo
r all veh
icles
13
,8kW
3,6
kW
2 free of ch
arge
24
.jul
ready to
use
Ho
tel Asto
ria
/ no
no
in Slo
vene
parkin
g lot b
elo
w h
ote
l Krim
, Ljub
ljanska
7
EFAC
ES 2x2
2
22
kW, 7
socket M
anekes, 4
00
V, 1
6A
,
11
KW
wh
en ch
arging 2
vehicles at o
nce
the co
nsu
mer n
eeds h
is ow
n ch
arging
cable th
at can b
e con
ne
cted to
a stan
dard
socket (IEC
62
19
6 Typ
e2 M
od
e
3) P
lug an
d C
harge.
11
kW
11
kW
2 free of ch
arge
24
/7
ready to
use
/ Elektro G
oren
jska
GEK
intero
pe
rable; n
o ro
amin
g
in Slo
vene
Triglavska roža B
led (in
the
garage)
n/a
n/a
n/a
n/a
n/a
n/a
n/a
n/a
un
kno
wn
n/a
n/a
n/a
n/a
n/a
Ho
tel Rikli B
alance
n/a
n/a
un
kno
wn
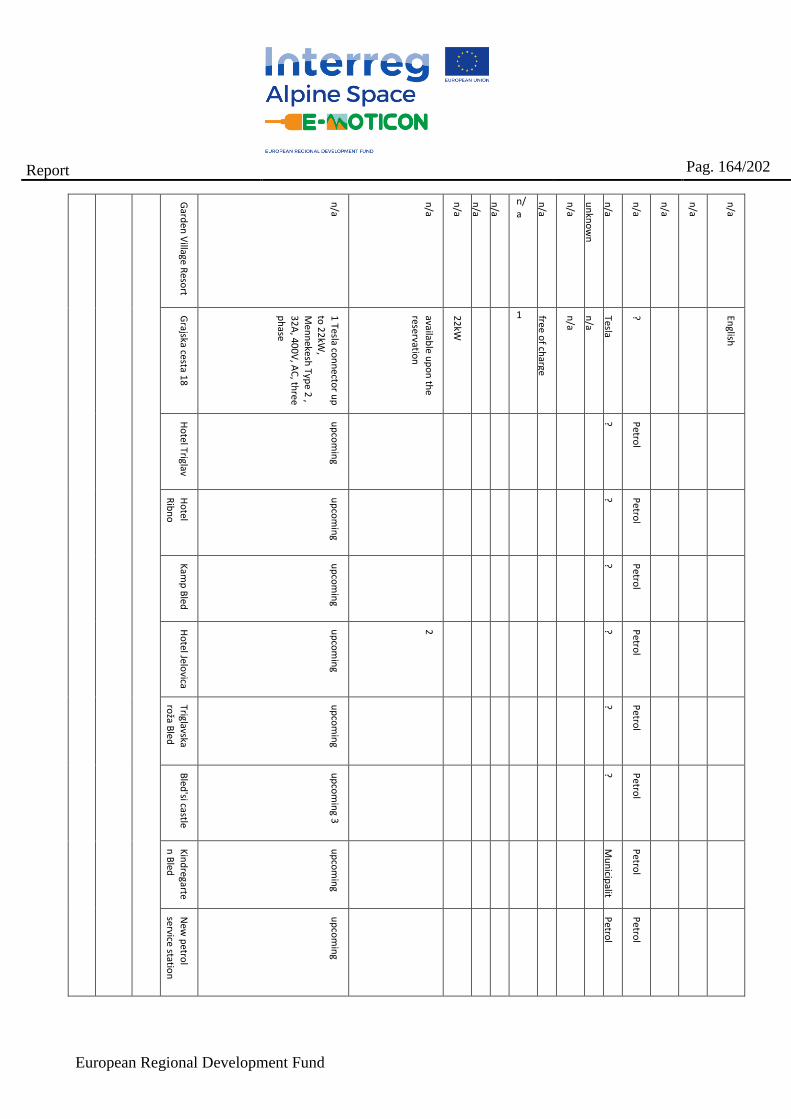
European Regional Development Fund
Report
Pag. 164/202
Gard
en V
illage Reso
rt
n/a
n/a
n/a
n/a
n/a
n/a
n/a
n/a
un
kno
wn
n/a
n/a
n/a
n/a
n/a
Grajska cesta 1
8
1 Tesla co
nn
ector u
p
to 2
2kW
, M
enn
ekesh Typ
e 2 ,
32
A, 40
0V
, AC
, three
ph
ase
available u
po
n th
e
reservation
22
kW
1 free of ch
arge
n/a
n/a
Tesla
? English
Ho
tel Triglav
up
com
ing
? Petro
l
Ho
tel
Rib
no
up
com
ing
? Petro
l
Kam
p B
led
up
com
ing
? Petro
l
Ho
tel Jelovica
up
com
ing
2
? Petro
l
Triglavska
roža B
led
up
com
ing
? Petro
l
Bled
'si castle
up
com
ing 3
? Petro
l
Kin
dregarte
n B
led
up
com
ing
Mu
nicip
alit
y
Petro
l
New
petro
l
service station
up
com
ing
Petro
l
Petro
l
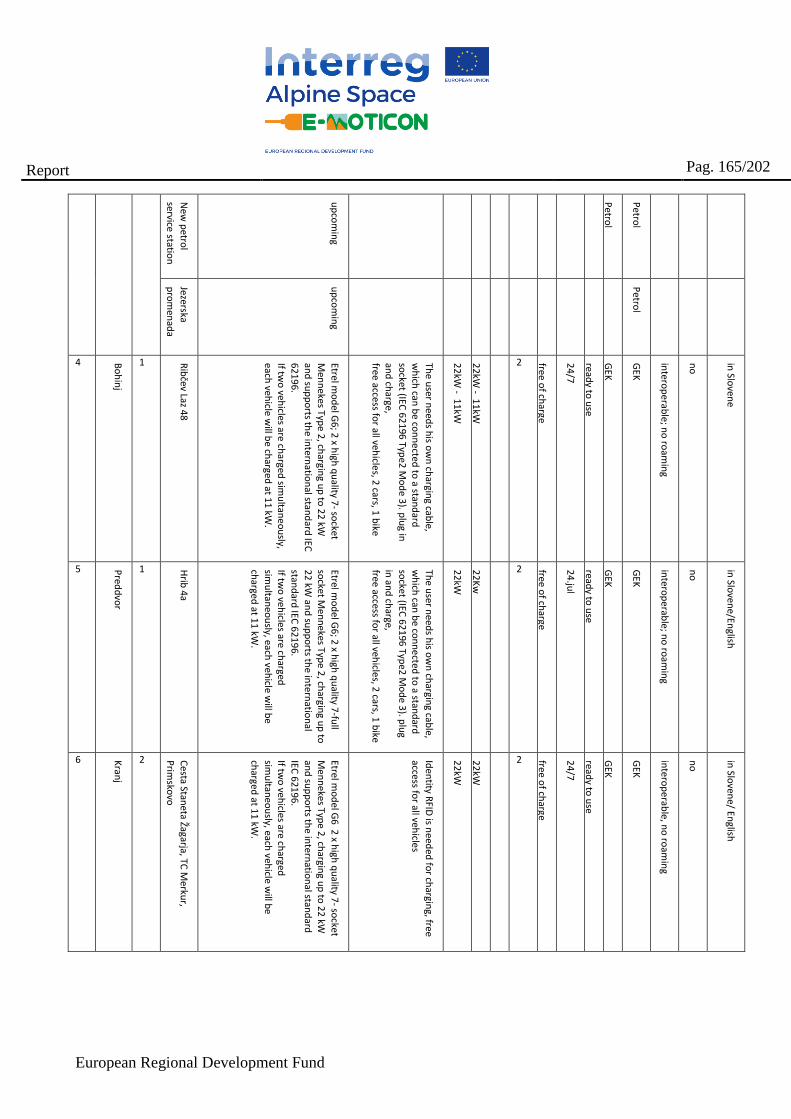
European Regional Development Fund
Report
Pag. 165/202
New
petro
l
service station
up
com
ing
Petro
l
Petro
l
Jezerska
pro
men
ada
up
com
ing
Petro
l
4 Bo
hin
j
1 Rib
čev Laz 48
Etrel mo
del G
6; 2
x high
qu
ality 7- so
cket
Men
nekes Typ
e 2, ch
arging u
p to
22
kW
and
sup
po
rts the in
ternatio
nal stan
dard
IEC
62
19
6.
If two
vehicles are ch
arged sim
ultan
eo
usly,
each veh
icle will b
e charged
at 11
kW.
The u
ser need
s his o
wn
chargin
g cable,
wh
ich can
be co
nn
ected
to a stan
dard
so
cket (IEC 6
21
96 Typ
e2 M
od
e 3). p
lug in
and
charge,
free access for all veh
icles, 2
cars, 1 b
ike
22
kW - 11
kW
22
kW - 11
kW
2 free of ch
arge
24
/7
ready to
use
GEK
GEK
intero
pe
rable; n
o ro
amin
g
no
in Slo
vene
5 Pred
dvo
r
1 Hrib
4a
Etrel mo
del G
6; 2
x high
qu
ality 7-fu
ll
socket M
en
nekes Typ
e 2, ch
arging u
p to
2
2 kW
and
sup
po
rts the in
ternatio
nal
stand
ard IEC
62
19
6.
If two
vehicles are ch
arged
simu
ltaneo
usly, each
vehicle w
ill be
charged
at 11
kW.
The u
ser need
s his o
wn
chargin
g cable,
wh
ich can
be co
nn
ected
to a stan
dard
so
cket (IEC 6
21
96 Typ
e2 M
od
e 3). p
lug
in an
d ch
arge, free access fo
r all vehicle
s, 2 cars, 1
bike
22
kW
22
Kw
2 free of ch
arge
24
.jul
ready to
use
GEK
GEK
intero
pe
rable; n
o ro
amin
g
no
in Slo
vene/En
glish
6 Kran
j
2 Cesta Stan
eta Žagarja, TC M
erkur,
Prim
skovo
Etrel mo
del G
6 2
x high
qu
ality 7- so
cket
Men
nekes Typ
e 2, ch
arging u
p to
22
kW
and
sup
po
rts the in
ternatio
nal stan
dard
IEC 6
219
6.
If two
vehicles are ch
arged
simu
ltaneo
usly, each
vehicle w
ill be
charged
at 11
kW.
Iden
tity RFID
is need
ed fo
r chargin
g, free
access for all veh
icles
22
kW
22
kW
2 free of ch
arge
24
/7
ready to
use
GEK
GEK
intero
pe
rable, n
o ro
amin
g
no
in Slo
vene/ En
glish
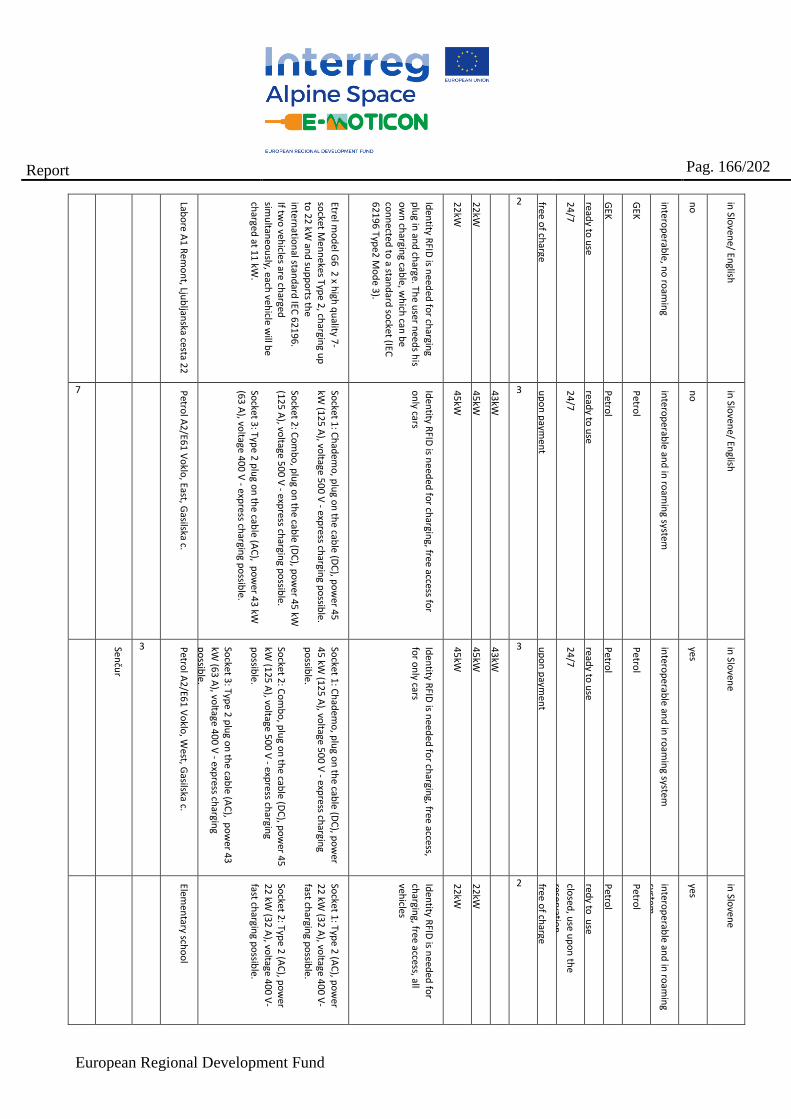
European Regional Development Fund
Report
Pag. 166/202
Labo
re A1
Rem
on
t, Ljub
ljanska cesta 2
2
Etrel mo
del G
6 2
x high
qu
ality 7-
socket M
en
nekes Typ
e 2, ch
arging u
p
to 2
2 kW
and
sup
po
rts the
intern
ation
al stand
ard IEC
62
19
6.
If two
vehicles are ch
arged
simu
ltaneo
usly, each
vehicle w
ill be
charged
at 11
kW.
Iden
tity RFID
is need
ed fo
r chargin
g
plu
g in an
d ch
arge. The u
ser need
s his
ow
n ch
arging cab
le, wh
ich can
be
con
nected
to a stan
dard
socket (IEC
6
21
96
Type2
Mo
de 3
).
22
kW
22
kW
2 free of ch
arge
24
/7
ready to
use
GEK
GEK
intero
pe
rable, n
o ro
amin
g
no
in Slo
vene/ En
glish
7 Petro
l A2
/E61
Vo
klo, East, G
asilska c.
Socket 1
: Ch
adem
o, p
lug o
n th
e cable
(DC
), po
wer 4
5
kW (1
25
A), vo
ltage 50
0 V
- express ch
arging p
ossib
le. So
cket 2: C
om
bo
, plu
g on
the cab
le (DC
), po
wer 4
5 kW
(12
5 A
), voltage 5
00
V - exp
ress chargin
g po
ssible.
Socket 3
: Type 2
plu
g on
the cab
le (AC
), po
wer 4
3 kW
(6
3 A
), voltage 4
00
V - exp
ress chargin
g po
ssible.
Iden
tity RFID
is need
ed fo
r chargin
g, free access for
on
ly cars
45
kW
45
kW
43
kW
3 up
on
paym
ent
24
/7
ready to
use
Petro
l
Petro
l
intero
pe
rable an
d in
roam
ing system
no
in Slo
vene/ En
glish
Senču
r
3 Petro
l A2
/E61
Vo
klo, W
est, Gasilska c.
Socket 1
: Ch
adem
o, p
lug o
n th
e cable
(DC
), po
wer
45
kW (1
25
A), vo
ltage 50
0 V
- express ch
arging
po
ssible.
Socket 2
: Co
mb
o, p
lug o
n th
e cable (D
C), p
ow
er 45
kW
(12
5 A
), voltage 5
00
V - exp
ress chargin
g
po
ssible.
Socket 3
: Type 2
plu
g on
the cab
le (AC
), po
wer 4
3
kW (6
3 A
), voltage 4
00
V - exp
ress chargin
g
po
ssible.
Iden
tity RFID
is need
ed fo
r chargin
g, free access,
for o
nly cars
45
kW
45
kW
43
kW
3 up
on
paym
ent
24
/7
ready to
use
Petro
l
Petro
l
intero
pe
rable an
d in
roam
ing system
yes
in Slo
vene
Elemen
tary scho
ol
Socket 1
: Type 2
(AC
), po
wer
22
kW (3
2 A
), voltage 4
00
V-
fast chargin
g po
ssible.
Socket 2
: Type 2
(AC
), po
wer
22
kW (3
2 A
), voltage 4
00
V-
fast chargin
g po
ssible.
Iden
tity RFID
is need
ed fo
r
chargin
g, free access, all veh
icles
22
kW
22
kW
2 free of ch
arge
closed
, use u
po
n th
e
reservation
redy to
use
Petro
l
Petro
l
intero
pe
rable an
d in
roam
ing
system
yes
in Slo
vene
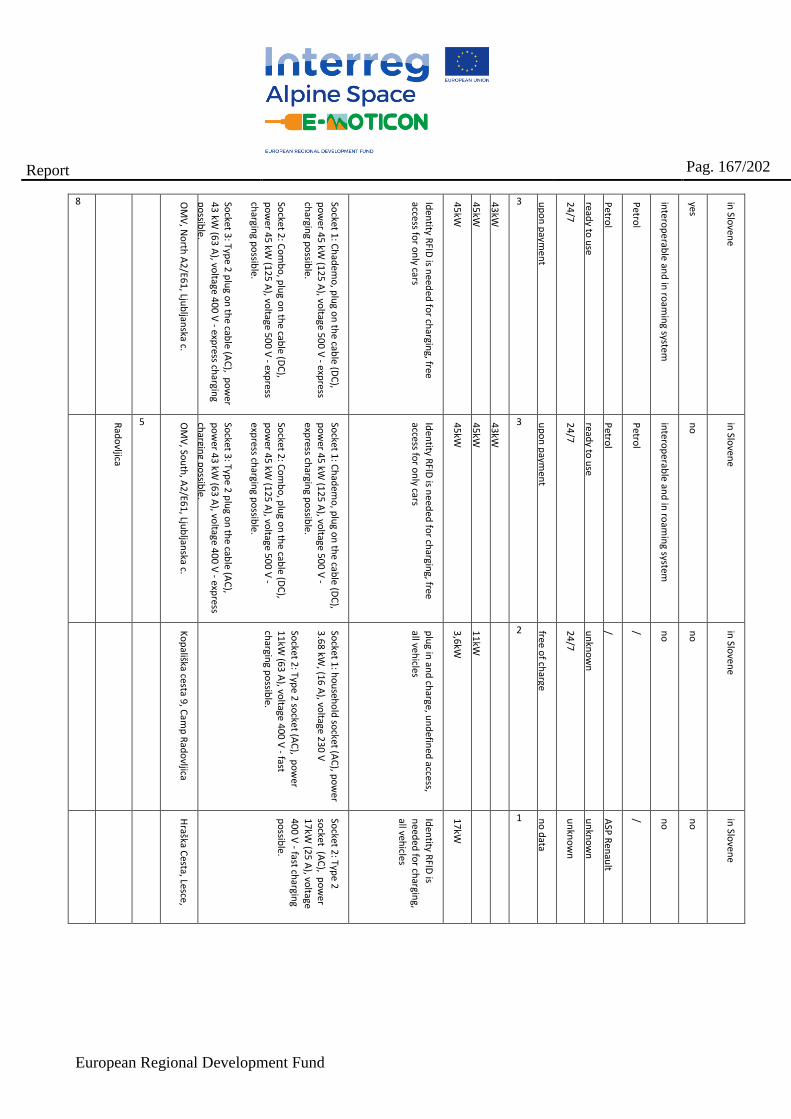
European Regional Development Fund
Report
Pag. 167/202
8 OM
V, N
orth
A2
/E61, Lju
bljan
ska c.
Socket 1
: Ch
adem
o, p
lug o
n th
e cable
(DC
),
po
wer 4
5 kW
(12
5 A
), voltage 5
00
V - exp
ress ch
arging p
ossib
le.
Socket 2
: Co
mb
o, p
lug o
n th
e cable (D
C),
po
wer 4
5 kW
(12
5 A
), voltage 5
00
V - exp
ress
chargin
g po
ssible.
Socket 3
: Type 2
plu
g on
the cab
le (AC
), po
wer
43
kW (6
3 A
), voltage 4
00
V - exp
ress chargin
g
po
ssible.
Iden
tity RFID
is need
ed fo
r chargin
g, free
access for o
nly cars
45
kW
45
kW
43
kW
3 up
on
paym
ent
24
/7
ready to
use
Petro
l
Petro
l
intero
pe
rable an
d in
roam
ing system
yes
in Slo
vene
Rad
ovljica
5 OM
V, So
uth
, A2
/E61, Lju
bljan
ska c.
Socket 1
: Ch
adem
o, p
lug o
n th
e cable
(DC
),
po
wer 4
5 kW
(12
5 A
), voltage 5
00
V -
express ch
arging p
ossib
le.
Socket 2
: Co
mb
o, p
lug o
n th
e cable (D
C),
po
wer 4
5 kW
(12
5 A
), voltage 5
00
V -
express ch
arging p
ossib
le. So
cket 3: Typ
e 2 p
lug o
n th
e cable (A
C),
po
wer 4
3 kW
(63
A), vo
ltage 40
0 V
- express
chargin
g po
ssible.
Iden
tity RFID
is need
ed fo
r chargin
g, free
access for o
nly cars
45
kW
45
kW
43
kW
3 up
on
paym
ent
24
/7
ready to
use
Petro
l
Petro
l
intero
pe
rable an
d in
roam
ing system
no
in Slo
vene
Ko
pališka cesta 9
, Cam
p R
ado
vljica
Socket 1
: ho
useh
old
socket (A
C), p
ow
er
3.6
8 kW
, (16 A
), voltage 2
30
V
Socket 2
: Type 2
socke
t (AC
), po
wer
11
kW (6
3 A
), voltage 4
00 V
- fast ch
arging p
ossib
le.
plu
g in an
d ch
arge, un
defin
ed access,
all vehicles
3,6
kW
11
kW
2 free of ch
arge
24
/7
un
kno
wn
/ / no
no
in Slo
vene
Hraška C
esta, Lesce,
Socket 2
: Type 2
socket (A
C), p
ow
er 1
7kW
(25
A), vo
ltage
40
0 V
- fast chargin
g
po
ssible.
Iden
tity RFID
is
need
ed fo
r chargin
g, all veh
icles
17
kW
1 no
data
un
kno
wn
un
kno
wn
ASP
Ren
ault
/ no
no
in Slo
vene
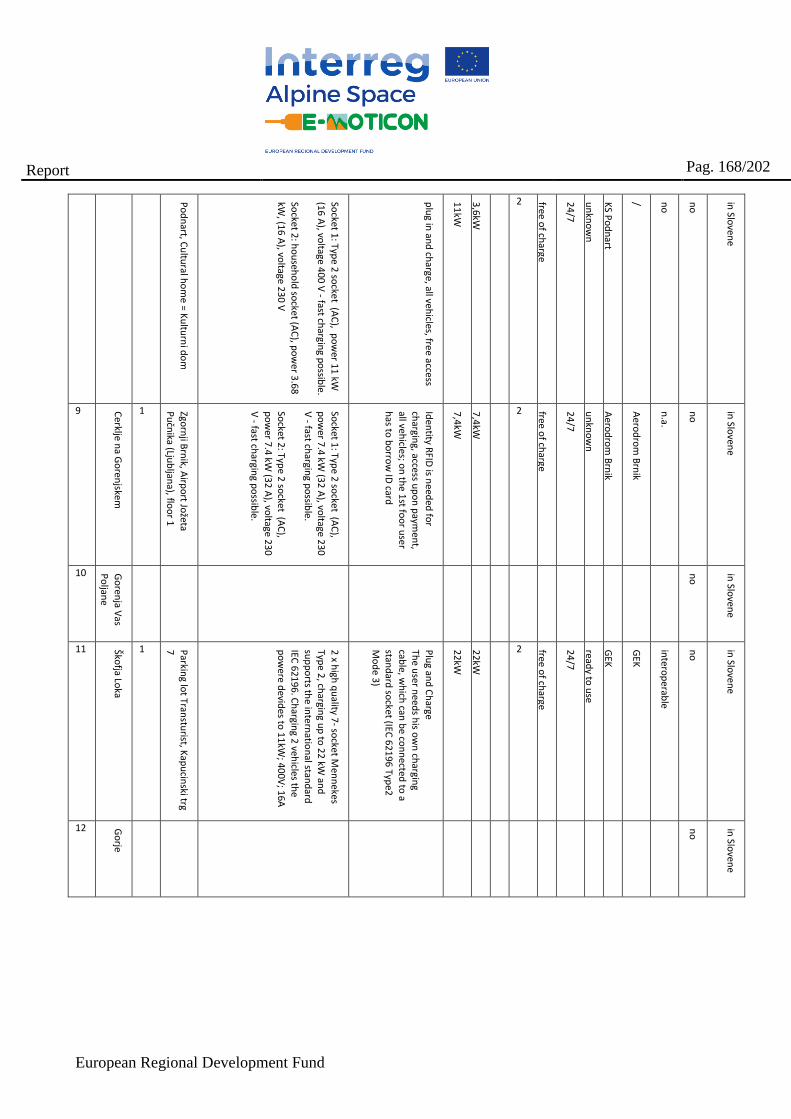
European Regional Development Fund
Report
Pag. 168/202
Po
dn
art, Cu
ltural h
om
e = Ku
lturn
i do
m
Socket 1
: Type 2
socke
t (AC
), po
wer 1
1 kW
(16
A), vo
ltage 40
0 V
- fast chargin
g po
ssible.
Socket 2
: ho
useh
old
socket (A
C), p
ow
er 3.6
8
kW, (1
6 A
), voltage 2
30
V
plu
g in an
d ch
arge, all vehicles, fre
e access
11
kW
3,6
kW
2 free of ch
arge
24
/7
un
kno
wn
KS P
od
nart
/ no
no
in Slo
vene
9 Cerklje n
a Go
renjskem
1 Zgorn
ji Brn
ik, Airp
ort Jo
žeta
Pu
čnika (Lju
bljan
a), floo
r 1
Socket 1
: Type 2
socke
t (AC
),
po
wer 7
.4 kW
(32
A), vo
ltage 23
0
V - fast ch
arging p
ossib
le.
Socket 2
: Type 2
socke
t (AC
), p
ow
er 7.4
kW (3
2 A
), voltage 2
30
V - fast ch
arging p
ossib
le.
Iden
tity RFID
is need
ed fo
r
chargin
g, access up
on
paym
ent,
all vehicles; o
n th
e 1st fo
or u
ser
has to
bo
rrow
ID card
7,4
kW
7,4
kW
2 free of ch
arge
24
/7
un
kno
wn
Aero
dro
m B
rnik
Aero
dro
m B
rnik
n.a.
no
in Slo
vene
10 Go
renja V
as
Po
ljane
no
in Slo
vene
11 Škofja Lo
ka
1 Parkin
g lot Tran
sturist, K
apu
cinski trg
7
2 x h
igh q
uality 7
- socket M
enn
ekes
Type 2
, chargin
g up
to 2
2 kW
and
su
pp
orts th
e inte
rnatio
nal stan
dard
IEC 6
219
6. C
hargin
g 2 veh
icles the
po
were d
evides to
11
kW; 4
00
V; 1
6A
Plu
g and
Ch
arge
The u
ser need
s his o
wn
chargin
g cab
le, wh
ich can
be co
nn
ected to
a
stand
ard so
cket (IEC 6
21
96
Type2
M
od
e 3)
22
kW
22
kW
2 free of ch
arge
24
/7
ready to
use
GEK
GEK
intero
pe
rable
no
in Slo
vene
12 Go
rje
no
in Slo
vene
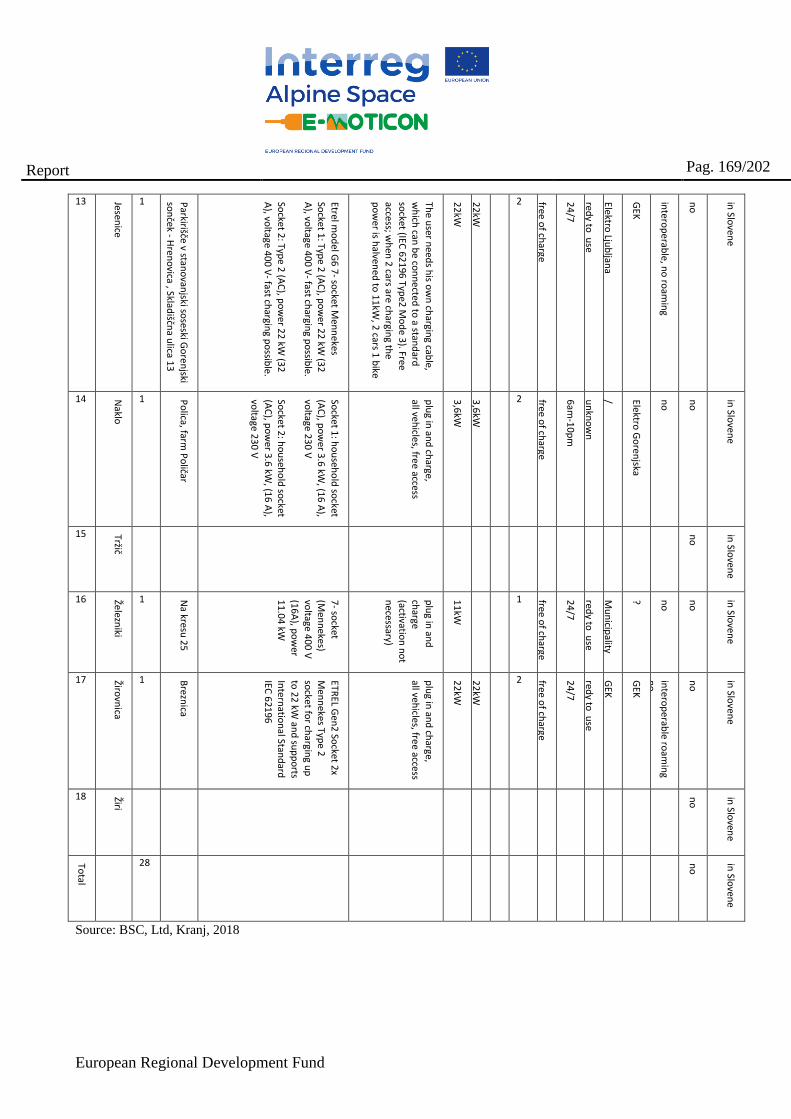
European Regional Development Fund
Report
Pag. 169/202
13 Jesenice
1 Parkirišče v stan
ovan
jski soseski G
ore
njski
son
ček - Hren
ovica , Sklad
iščna u
lica 13
Etrel mo
del G
6 7
- socket M
enn
ekes
Socket 1
: Type 2
(AC
), po
wer 2
2 kW
(32
A
), voltage 4
00
V- fast ch
arging p
ossib
le.
Socket 2
: Type 2
(AC
), po
wer 2
2 kW
(32
A), vo
ltage 40
0 V
- fast chargin
g po
ssible.
The u
ser need
s his o
wn
chargin
g cable,
wh
ich can
be co
nn
ected
to a stan
dard
so
cket (IEC 6
21
96 Typ
e2 M
od
e 3). Free
access; wh
en 2
cars are chargin
g the
po
wer is h
alvened
to 1
1kW
, 2 cars 1
bike
22
kW
22
kW
2 free of ch
arge
24
/7
redy to
use
Elektro Lju
bljan
a
GEK
intero
pe
rable, n
o ro
amin
g
no
in Slo
vene
14 Naklo
1 Po
lica, farm P
oličar
Socket 1
: ho
useh
old
socket
(AC
), po
wer 3
.6 kW
, (16
A),
voltage 2
30
V
Socket 2
: ho
useh
old
socket
(AC
), po
wer 3
.6 kW
, (16
A),
voltage 2
30
V
plu
g in an
d ch
arge,
all vehicles, fre
e access
3,6
kW
3,6
kW
2 free of ch
arge
6am
-10
pm
un
kno
wn
/ Elektro G
oren
jska
no
no
in Slo
vene
15 Tržič
no
in Slo
vene
16 Železniki
1 Na kresu
25
7- so
cket
(Men
nekes)
voltage 4
00
V
(16
A), p
ow
er
11
.04
kW
plu
g in an
d
charge
(activation
no
t
necessary)
11
kW
1 free of ch
arge
24
/7
redy to
use
Mu
nicip
ality
? no
no
in Slo
vene
17 Žirovn
ica 1 B
reznica
ETREL G
en2
Socket 2
x
Men
nekes Typ
e 2
socket fo
r chargin
g up
to 2
2 kW
and
sup
po
rts
Intern
ation
al Stand
ard
IEC 6
219
6
plu
g in an
d ch
arge,
all vehicles, fre
e access
22
kW
22
kW
2 free of ch
arge
24
/7
redy to
use
GEK
GEK
intero
pe
rable ro
amin
g
no
no
in Slo
vene
18 Žiri
no
in Slo
vene
Total
28 no
in Slo
vene
Source: BSC, Ltd, Kranj, 2018
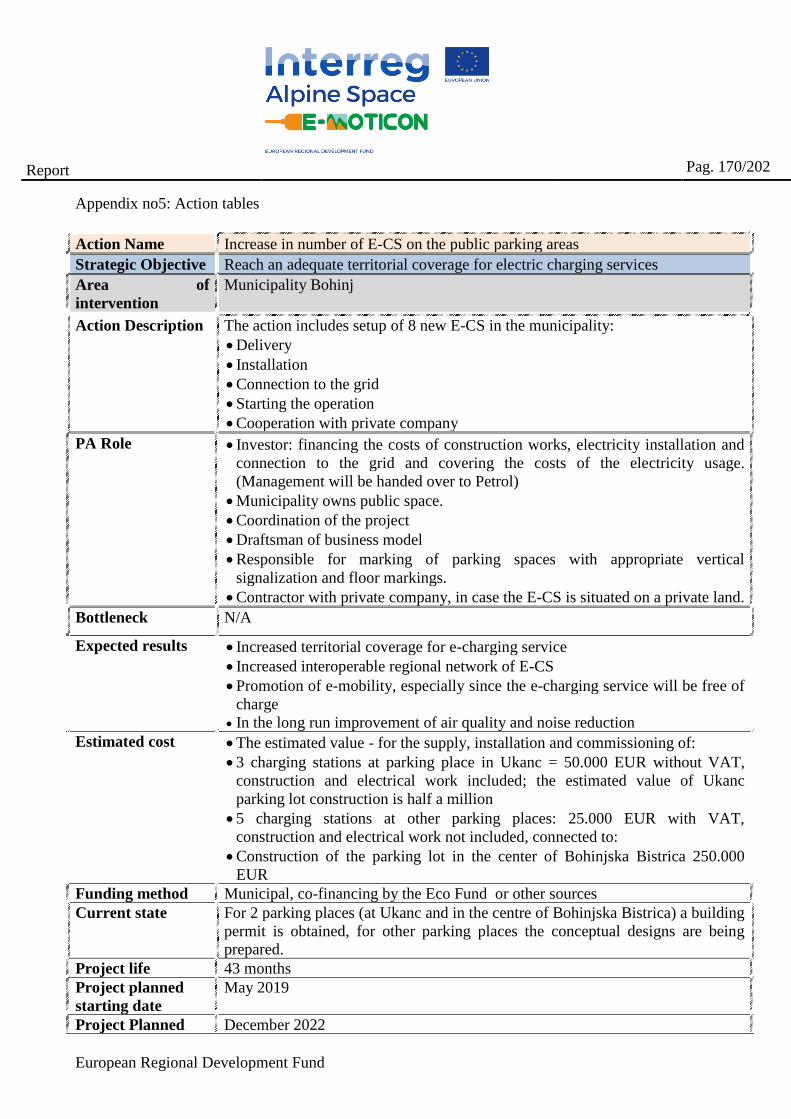
European Regional Development Fund
Report
Pag. 170/202
Appendix no5: Action tables
Action Name Increase in number of E-CS on the public parking areas
Strategic Objective Reach an adequate territorial coverage for electric charging services
Area of
intervention
Municipality Bohinj
Action Description The action includes setup of 8 new E-CS in the municipality:
• Delivery
• Installation
• Connection to the grid
• Starting the operation
• Cooperation with private company
PA Role • Investor: financing the costs of construction works, electricity installation and
connection to the grid and covering the costs of the electricity usage.
(Management will be handed over to Petrol)
• Municipality owns public space.
• Coordination of the project
• Draftsman of business model
• Responsible for marking of parking spaces with appropriate vertical
signalization and floor markings.
• Contractor with private company, in case the E-CS is situated on a private land.
Bottleneck N/A
Expected results • Increased territorial coverage for e-charging service
• Increased interoperable regional network of E-CS
• Promotion of e-mobility, especially since the e-charging service will be free of
charge
• In the long run improvement of air quality and noise reduction
Estimated cost • The estimated value - for the supply, installation and commissioning of:
• 3 charging stations at parking place in Ukanc = 50.000 EUR without VAT,
construction and electrical work included; the estimated value of Ukanc
parking lot construction is half a million
• 5 charging stations at other parking places: 25.000 EUR with VAT,
construction and electrical work not included, connected to:
• Construction of the parking lot in the center of Bohinjska Bistrica 250.000
EUR
Funding method Municipal, co-financing by the Eco Fund or other sources
Current state For 2 parking places (at Ukanc and in the centre of Bohinjska Bistrica) a building
permit is obtained, for other parking places the conceptual designs are being
prepared.
Project life 43 months
Project planned
starting date
May 2019
Project Planned December 2022
European Regional Development Fund
Report
Pag. 171/202
conclusion
Project localization
New station locations:
1. Parking place at Camp Danica in Bohinjska Bistrica (1x)
2. Parking place at Pokljuka (1x)
3. Parking place in the center of Bohinjska Bistrica (1x)
4. Parking place Kobla at Bohinjska Bistrica (2x)
5. Parking place at Ukanc (3x)
Work plan and
activities
description
Non existing
Impact on e-
mobility
High. The critical mass of e-vehicles is missing.
Impact on the
environment
The impact on the environment will be high when e-vehicles will replace
vehicles on diesel or gasoline. Municipality of Bohinj is a highly touristic
destination with tourist congestions in high season causing traffic congestions at
the lake Bohinj and other arterial roads. Noise pollution and quality of air would
improve.
Economic impact The economic impact is going to be negative in short term, on the account of the
Municipality (large costs in construction and electro works, pay for electricity,
insofar as the system will be free, used for the promotional effect ...). Spillover
effects are possible for the territory since this might attract new kind of visitors
supporting local economy.
Overall impact on
the territory
This action is increasing territorial coverage with interoperable E-CS services
and has a promotional effect of a green destination.
Transferability This action can be transferred in any of municipalities in Gorenjska region and
beyond.
European Regional Development Fund
Report
Pag. 172/202
Action Name Provision of infrastructure for public transport interchange, P&R systems,
business zones, airport area
Strategic Objective Integrate public transport and private transport
Area of
intervention
Municipality Bohinj
Action Description The action includes:
• Arrangement of the P + R system, providing affordable transport
• Planned is a system of mobility hubs - Distributed parking system with support
systems and management: bicycle rental, organized modes of transport (where
possible by electric vehicles), traffic modes for slowing traffic and moving
away from the most burdened points (lake bowl, Pokljuka, starting points for
the mountains , the Savica waterfall)
• Main objectives: to relieve the lake basin, key starting points for
mountains and forest roads in Pokljuka motorway, improve quality
• Main product: regulated system of distributed parking lots with support
system - organized forms of transport with electric vans and buses
• What can help: the involvement of all stakeholders.
PA Role Investor, both the establishment of car parks and the provision of transport
Bottleneck Slowly changing travel habits - high dependence on car transport.
Expected results Reduced motor traffic, noise and emissions, improved quality of life of citizens,
improved connectivity and traffic safety
Estimated cost Medium-sized investment - (descriptive)
Funding method Municipal budget, candidacy for state and European funds.
Current state In the summer season, the Bohinj municipality established 3 temporary parking
lots, which acted as P + R (parking place at the Danica camp in Bohinjska
Bistrica, the parking lot Kristal at the beginning of Ribčev Laz and the Senožet
car park in Sredna vas). They provided free shuttle services to Lake Bohinj and
Blato plateau. The analysis for this year’s measures is being prepared, on which
the system will be upgraded and expanded and the frequency of shuttle transfers
will increase.
Project life Annually, in summer season
Project planned
starting date
Each year in the summer season
Project Planned
conclusion
N/A
Project localization
the area of the Bohinj Municipality, the Gorenjska region and the municipalities
of the Julian Alps
Work plan and
activities
description
Analyzes of completed surveys of shuttle users and analyzes of transported
passengers are being prepared. On the basis of these, the organized transport
system will be upgraded and expanded, the frequency of shuttles will increase
and new lines will be introduced. The operation of organized services on certain
European Regional Development Fund
Report
Pag. 173/202
routes will be provided by electric vans and minibuses.
Impact on e-
mobility
High. The critical mass of e-vehicles is missing.
Raising awareness of e-mobility among vehicle users and inhabitants of the
Alpine region. Raising quality of life.
Impact on the
environment
Reduction of environmental pollution (emissions, waste vehicles), noise
reduction.
Economic impact The economic impact is going to be negative in short term, on the account of the
Municipality.
Overall impact on
the territory
The municipality of Bohinj lies in the Triglav National Park, which is part of the
Alpine space, for which it is essential to adopt a sustainability plan to protect this
sensitive ecosystem, which is increasingly condensed with the consequences of
the excessive use of fossil fuel vehicles. Municipality of Bohinj is also partner of
Alpine Pearls, an association of 25 Alpine destination that invite guests to spend
their vacation without their vehicles and by using the sustainable mobility
options offered at every destination.
Transferability The possibility of transferring to other transfer locations as a "good practice
case" would be possible for any municipality in Slovenia as well as in
neighboring countries.
Action Name Increase in number of E-CS on the parking areas
Strategic Objective Reach adequate territorial coverage for electric charging services
Area of
intervention
Municipality Cerklje na Gorenjskem
Action Description The Municipality of Cerklje na Gorenjskem acts a planner and investor in e-
charging stations in public places, and around public facilities (health center,
schools ...).
• Main features: the establishment of a network of public parking spaces with E-
CS.
• Main goals: planning, obtaining project and investment documentation,
implementation of E-CS installation.
• The main product: the installation of E-CS for electric cars.
• What could help: cooperation with electricity distributors, co-financing from
state or European funds.
PA Role Providing land for the building of a network of public parking spaces with E-CS,
preparation of investment and project documentation, candidacy for the
allocation of state or European funds, implementation of the installation of E-CS.
Bottleneck Insufficient basic infrastructure. In the municipality of Cerklje na Gorenjskem
there is a weak electricity network, which would need to be updated and
upgraded to meet the needs of a network quality of E-CS.
Expected results Increased use of transport means on alternative source of fuel (electricity),
consequently affects the improvement of the quality of the environment and
affects the quality of life of citizens.
European Regional Development Fund
Report
Pag. 174/202
Estimated cost Descriptive cost estimation - large (depending on the number of installed E-CS).
On average, an investment in the installation of an E-CS with an independent
connection and measuring point is approximately 11,500 euros, with two
vehicles at the same time being charged at such a charging station (source:
Andraž Zupančič, Chargers for electric cars: today mostly for free, soon nowhere
else; in the journal Dnevnik - https://www.dnevnik.si/1042820244, dated 28
April 2018)
Funding method Candidature for state and European subventions, part of the municipal budget.
Current state Not implemented
Project life N/A
Project planned
starting date
N/A
Project Planned
conclusion
N/A
Project localization
The area of the municipality of Cerklje na Gorenjskem, the center of the
settlement Cerklje na Gorenjskem where the primary school, pharmacy, library,
the Cerklje tourism center, health center, collection center for waste management
are located; settlement Šmartno where there is home for the elderly - Dom Taber;
the village of Zalog pri Cerkljah, where the elementary school is located.
Work plan and
activities
description
The project is not yet in progress, so a work plan and a description of the activity
cannot be presented.
Impact on e-
mobility
The project would have a major impact on e-mobility, which would become
more and more recognizable, and the construction of basic infrastructure would
lead to the actual use of electric cars and thus to the increased use of electric
vehicles.
Impact on the
environment
The environmental impact would be positive, by encouraging the use of
electrically powered vehicles, harmful air emissions and noise emissions would
be reduced. Consequently, the environment quality of the citizens would
increase.
Economic impact In the short term, the investment for the municipality would mean cost and use of
budgetary funds. By obtaining subsidies, costs to the municipal budget could be
reimbursed. In the longer term, the project has a positive impact on the
improvement of the quality of living, which can be more costly in other areas of
environmental protection for which the municipality is responsible.
Overall impact on
the territory
The project would improve the infrastructure for e-mobility throughout the
municipality; accelerate the use of electrically powered vehicles. This would
improve the quality of living in the municipality and raise the level of
environmental protection. The project would help advertise the municipality as
an environmentally friendly municipality. It would be easier to connect
regionally with municipalities active in this field, sharing experiences with them
- examples of good practice. This would create even greater inter-municipal and
regional cooperation.
Transferability The possibility of transferring to other transfer locations as a "good practice
European Regional Development Fund
Report
Pag. 175/202
case" could be for any municipality in Slovenia as well as in neighboring
countries.
Action Name Municipalities as promoters of e-mobility
Strategic Objective Promote e-mobility
Area of
intervention
Municipality Cerklje na Gorenjskem
Action Description On the basis of information and data on the benefits of e-mobility and
interoperability, the municipality implements the continuous task of informing
and educating users about the use, operation and positive effects, and the
possibilities of access to E-CS and means of transport, as well as on the effects of
e-mobility in the long run.
• Main features: informing, raising awareness and educating users about e-
mobility
• Main goals: reducing the number of transport vehicles on fossil fuels,
improving air quality
• Main product: education - organization of workshops, meetings;
production - promotional material.
• What could help: media cooperation, cooperation of providers.
PA Role The task of the municipality is to promote the education of users - all
generations, beginning with kindergarten and elementary school.
Bottleneck Lack of user interest, under-use of electric vehicles, lack of financial resources
for the promotion of e-mobility.
Expected results Improving user awareness of the importance of using e-mobility for better
quality of life. Consequently, increasing the active participation of users. The
expected result is also the establishment of a network of E-CS in the
municipality and the Gorenjska region.
Estimated cost Low/Medium-sized investments - up to 10,000 EUR / year (descriptive)
Funding method Municipal budget, candidacy for state and European funds.
Current state Not implemented
Project life N/A
Project planned
starting date
N/A
Project Planned
conclusion
N/A
Project localization
The area of the municipality of Cerklje na Gorenjskem.
Work plan and
activities
description
The project is not yet in progress, so a work plan and a description of the activity
cannot be presented.
Impact on e-
mobility
Diffusion of information on e-mobility among vehicle users and residents.
Raising the quality of life of citizens.
European Regional Development Fund
Report
Pag. 176/202
Impact on the
environment
Reducing emissions into the environment.
Economic impact In the short term, the investment for the municipality would mean cost and
spending of budgetary funds. By obtaining subsidies, costs to the municipal
budget could be reimbursed. In the longer term, the project has a positive impact
on the improvement of the quality of living, which can be more costly in other
areas of environmental protection for which the municipality is responsible for.
Overall impact on
the territory
The project would improve the infrastructure for e-mobility throughout the
municipality; accelerate the use of electrically powered vehicles. This would
improve the quality of living in the municipality and raise the level of
environmental protection. The project would help advertise the municipality as
an environmentally friendly municipality. It would be easier to connect
regionally with municipalities active in this field, sharing experiences with them
- examples of good practice. This would create even greater inter-municipal and
regional cooperation.
Transferability Transferability as "good practice" could be possible for any municipality in
Slovenia as well as in neighboring countries.
Action Name Reinforce the electricity grid by cooperation of local, national public and private
stakeholders
Strategic Objective Reach an adequate territorial coverage for electric charging services
Area of
intervention
Municipality Cerklje na Gorenjskem, Kranjska Gora and the entire Gorenjska
Action Description Encourage active cooperation between all the main actors (municipalities,
development agency BSC, electricity distributors, the Ministry of Infrastructure),
and encourage them to actively resolve the situation in the field of basic energy
infrastructure. The entire power grid is too weak and incompetent to set up a
quality e-charging network.
• Main features: to encourage activities on the side of all actors in order to solve
the problem.
• Main objectives: improvement of basic electrical infrastructure.
• The main product: organization of meetings between all the main actors
(municipalities, BSC development agency, electricity distributors, Ministry of
Infrastructure).
• What can help: the involvement of all actors.
PA Role The task of the municipality is to encourage all actors to begin solving the
problem.
Bottleneck Lack of interest of all actors (municipalities, BSC development agency,
electricity distributors, Ministry of Infrastructure).
Expected results Improving the awareness of all stakeholders about the importance of providing a
quality power grid. Consequently, it is expected to upgrade and modernize the
European Regional Development Fund
Report
Pag. 177/202
electricity grid.
Estimated cost Medium-sized investment - (descriptive)
Funding method Municipal budget, candidacy for state and European funds, national Eco fund.
Current state Not implemented
Project life N/A
Project planned
starting date
N/A
Project Planned
conclusion
N/A
Project localization
The territory of the Municipality of Cerklje na Gorenjskem and the entire
Gorenjska region.
Work plan and
activities
description
The project is not yet in progress, so we cannot present a work plan and a
description of the activity.
Impact on e-
mobility
The basic prerequisite for successful e-mobility development and the installation
of a high-quality e-charging network. Raising the quality of life of citizens.
Impact on the
environment
Reducing negative emissions into the environment.
Economic impact The project would have no significant economic impact on the municipal budget.
Overall impact on
the territory
The project would improve the infrastructure for e-mobility throughout the
municipality; accelerate the use of electrically powered vehicles. This would
improve the quality of living in the municipality and raise the level of
environmental protection. The project would help advertise the municipality as
an environmentally friendly municipality. It would be easier to connect
regionally with municipalities active in this field, sharing experiences with them
- examples of good practice. This would create even greater inter-municipal and
regional cooperation.
Transferability The possibility of transferring to other locations as a "good practice case" would
be possible for any municipality in Slovenia as well as in neighboring countries.
Action Name Provision of infrastructure for public transport interchange, P&R systems,
business zones, airport area
Strategic Objective Integrate public transport and private transport
Area of
intervention
The Municipality of Cerklje na Gorenjskem, the area of the business zone at the
Ljubljana Jože Pučnik Airport and the areas of tourist development in the
municipality.
Action Description Given the envisaged rapid economic development in the area of Jože Pučnik
Airport Ljubljana and the increasing tourist development of the entire
municipality, the objective of the Občina Cerklje na Gorenjskme is to connect
European Regional Development Fund
Report
Pag. 178/202
the public sector with the investors in this area to the best of their ability to
recognize the benefits of investing in the construction of an e-mobile
infrastructure, which would allow efficient use of vehicles for alternative
propulsion sources. For example, the construction of a network of electric
charging stations for e-cars in the area of the business zone at the Ljubljana Jože
Pučnik Airport, intended for employees in the area as well as passengers and
tourists arriving at the airport. In the coming years, the area will open approx.
2,000 new jobs, and the share of passengers carried at the airport is also
increasing.
• Main features: informing, raising awareness among investors in areas of
economic and tourist development in the municipality,
• Main objectives: reducing the number of transport vehicles on fossil fuels,
improving air quality,
• Main product: organization of meetings; elaboration - e-mobility development
strategies in cooperation with investors and, consequently, investment of
investors in the development of e-mobility.
• What could be helpful: cooperation of the investor's area of economic and
tourist development in the municipality.
PA role The task of the municipality is to encourage cooperation with investors. Help
develop e-mobility development strategy in areas of greater economic and tourist
development.
Bottleneck Lack of investor interest, insufficient use of electric vehicles, lack of financial
resources for the promotion of e-mobility.
Expected results Improving the awareness of investors about the importance of using e-mobility
for our better quality of life. Consequently, the increase in active cooperation
between the municipality and investors. The expected result is also the
establishment of a network of e-charging stations in the area of Jože Pučnik
Airport Ljubljana and in tourist development areas.
Estimated cost Large investments - (descriptive)
Funding method It is anticipated that investors in these areas will join the construction of e-
mobility infrastructure, and candidates for European funding are also likely.
Current state Not implemented
Project life N/A
Project planned
starting date
N/A
Project Planned
conclusion
N/A
Project localization
The area of the Municipality of Cerklje na Gorenjskem - the area of Jože Pučnik
Airport Ljubljana and other areas of tourist development in the municipality.
Work plan and
activities
description
The project is not yet in progress, so we cannot present a work plan and a
description of the activity.
Impact on e-
mobility
Increasing the use of means of transport on alternative power sources. Raising
the quality of life of citizens.
European Regional Development Fund
Report
Pag. 179/202
Impact on the
environment
Reducing negative emissions into the environment.
Economic impact Great economic impact. It is envisaged to involve investors in the area.
Overall impact on
the territory
The project would improve the infrastructure for e-mobility throughout the
municipality; accelerate the use of electrically powered vehicles. This would
improve the quality of living in the municipality and raise the level of
environmental protection. The project would help advertise the municipality as
an environmentally friendly municipality. It would be easier to connect
regionally with municipalities active in this field, sharing experiences with them
- examples of good practice. This would create even greater inter-municipal and
regional cooperation.
Transferability The possibility of transferring to other transfer locations as a "good practice
case" could be for any municipality in Slovenia as well as in neighboring
countries.
Action Name Increase in number of E-CS on the public parking areas
Strategic Objective Reach an adequate territorial coverage for electric charging services
Area of
intervention
Municipality Kranj
Action Description • Gaining Eco fund subvention, cooperation with private business entity for
ground works, installation of E-CS and connection to the grid, preparing legal
basis for externalization of the E-CS management of operation and business
model and taking care for the operational costs (consumption of electricity).
• Transition to environmentally friendly transport, reaching an adequate
territorial coverage for electric charging services, improving air quality.
• E-CS on the public areas
• What could help: national, EU and other subventions, cooperation among
equipment providers, media and promotional material
PA Role Municipal administration will be a facilitator of the action according to the
available financial incentives. According to the municipal and national strategic
objectives the municipality need to support a decrease of CO2 and PM10
particles and all other negative influences causing greenhouse gasses, reducing a
dependence on fossil fuels.
Bottleneck Lack of financial resources.
Expected results • Increase in the interest of purchasing e-vehicles
• Increased transport connectivity
• Following the EU trend
• Purchase of the EU standardized E-CS
• E-charging of vehicles of transit and other guests
• Development of business and jobs in the area of e-mobility
Estimated cost 5000 EUR per E-CS, the number of E-CS is partially depending of the national
subvention capacity per municipality, partially on the emerging needs.
European Regional Development Fund
Report
Pag. 180/202
Funding method • 60% EU funds
• 20% national funds
• Max 20% of own municipal funds
Current state partially implemented
Project life Permanent activity, medium and long term time frame
Project planned
starting date
Permanent activity, not specifically defined
Project Planned
conclusion
Not defined
Project localization Municipality Kranj
Work plan and
activities
description
n/a
Impact on e-
mobility
• Implementing the environmental paradigm and commitments
• Raising the quality of life
• Increasing awareness of e-mobility and changing behavioural habits among
vehicle users and residents
Impact on the
environment
• Reducing emissions in the environment
• Reducing environmental pollution (emissions)
Economic impact • Business development
• New jobs
• Increased efficiency of renewable sources of energy
• Development of new technologies
• Increased use of IT
Overall impact on
the territory
Improving the quality of the environment, in particular air quality. Protecting
sensitive ecosystem, which is part of a wider space. In Europe and the world, we
are increasingly realising that the consequences of excessive use of fossil fuel
means increase in the temperature of the earth's surface, increase in the
proportion of CO2, and emit of other emissions into the air.
Transferability
Entire administration unit of Kranj, once municipality of Kranj and other
neighboring municipalities.
Action Name Transit of vehicles for public passenger road transport, public and private
business fleets into electric ones or run on other alternative fuels
Strategic Objective Integrate public transport and private transport
Area of
intervention
Municipality Kranj
Action Description • Gaining financial subvention, cooperation with private business entities for
the purchase of vehicles on alternative fuel (e-vehicles, hybrids, LNG ...).
European Regional Development Fund
Report
Pag. 181/202
• Transition to environmentally friendly transport, improving air quality.
• Purchase of vehicles for municipal organizations and businesses
• What could help: national, EU and other subventions, cooperation among
equipment providers, media and promotional material
PA Role Municipal administration will be a facilitator of the action according to the
available financial incentives. According to the municipal and national strategic
objectives the municipality need to support a decrease of CO2 and PM10
particles and all other negative influences causing greenhouse gasses, reducing a
dependence on fossil fuels. According to international commitment the
municipality has to strive to reduce usage of personal vehicles, increasing the
usage of public transport.
Bottleneck Lack of financial resources.
Expected results • Increase in the interest of purchasing e-vehicles
• Increased transport connectivity
• Following the EU trend
• E-charging of vehicles of transit and other guests
• Development of business and jobs in the area of e-mobility
Estimated cost 30.000 EUR for the purchase of environmentally friendly vehicles for the public
service use
Funding method - 60% EU funds
- 20% national funds
- Max 20% of own municipal funds
Current state partially implemented
Project life Permanent activity, medium and long term time frame
Project planned
starting date
Permanent activity, not specifically defined
Project Planned
conclusion
Not defined
Project localization Municipality Kranj
Work plan and
activities
description
N/A
Impact on e-
mobility
• Implementing the environmental paradigm and commitments
• Raising the quality of life
• Increasing awareness of e-mobility and changing behavioural habits among
vehicle users and residents
Impact on the
environment
• Reducing emissions in the environment
• Reducing environmental pollution (car waste)
Economic impact • Business development
• New jobs
• Increased efficiency of renewable sources of energy
• Development of new technologies
European Regional Development Fund
Report
Pag. 182/202
• Increased use of IT
• Increase of offer influences decrease of vehicles maintenance costs
Overall impact on
the territory
Improving the quality of the environment, in particular air quality. Protecting
sensitive ecosystem, which is part of a wider space. In Europe and the world, we
are increasingly realising that the consequences of excessive use of fossil fuel
means increase in the temperature of the earth's surface, increase in the
proportion of CO2, and emit of other emissions into the air.
Transferability Entire administration unit of Kranj, once municipality of Kranj and other
neighbouring municipalities.
Action Name Increase in number of E-CS on the parking areas
Strategic Objective Reach adequate territorial coverage for electric charging services
Area of
intervention
Municipality Kranjska Gora
Action Description The Municipality of Kranjska Gora acts a planner and investor in e-charging
stations in public places, and around public facilities:
• Main features: applying to the Eco Fund funding, setting up E-CS, defining
location, cooperation with electricity distributer, defining business plan,
investing in constructional works
• Main goals: provision of the charging infrastructure for users of e-vehicles to
promote e-mobility, target air and noise pollution and start with transition to
mobility on alternative fuels.
• The main product: the installation of 2 E-CS for electric cars.
• What could help: cooperation with electricity distributors, co-financing from
state or European funds.
PA Role Providing land for the setting up E-CSs, preparation of investment and project
documentation, candidacy for the state funds, implementation of the installation
of E-CSs.
Bottleneck Insufficient basic grid infrastructure. In the municipality of Kranjska Gora there
is a weak electricity network, which would need to be updated and upgraded to
meet the needs of a network quality of E-CS.
Expected results • Increased territorial coverage for e-charging service
• Increased interoperable regional network of E-CS
• Promotion of e-mobility, especially since the e-charging service
will be free of charge
• In the long run improvement of air quality and noise reduction
Estimated cost 20.000 EUR
Funding method Municipal budget, acquired funds obtained from the eco-fund
Current state The project is completed (two E-CS with four charging sockets and the
possibility of charge electric bikes)
Project life N/A
Project planned Finished

European Regional Development Fund
Report
Pag. 183/202
starting date
Project Planned
conclusion
Finished
Project localization
The E-CSs were installed in Kranjska Gora on the parking lot at the bus station
and in Mojstrana near the Slovenian Mountain Museum.
Work plan and
activities
description
The project is over. In the future, we plan to install e-charging stations in other
settlements - villages where the number of inhabitants is smaller.
Impact on e-
mobility
Improving the E-CS network, the E-CS are interoperable, the operator is
Gorenjske elektrarne.
Impact on the
environment
Reducing emissions into the environment.
Economic impact The project will have no significant economic impact on the municipal budget.
Overall impact on
the territory
The project improves the e-mobility infrastructure and enables the use of
electrically powered vehicles. This improves the quality of living in the
municipality and raises the level of environmental protection. The project has an
impact on the advertising of the municipality as an environmentally friendly
municipality. In the future, the municipality will more easily connect with the
municipalities that are actively working in this field and exchange experiences
with them - examples of good practice.
Transferability The possibility of transfer to other transfer locations as a "good practice case"
would be possible for any municipality in Slovenia as well as in neighboring
cross-border municipalities.
Action Name Increase in number of E-CS on the public parking areas
Strategic Objective Reach an adequate territorial coverage for electric charging services
Area of intervention Municipality Bled
Action Description The action includes setup of 10 new E-CS in the municipality:
• Delivery
• Installation
• Connection to the grid
• Starting the operation
• Cooperation with private company
PA Role • Investor: financing the costs of construction works, electricity installation and
connection to the grid and covering the costs of the electricity usage.
(Management will be handed over to Petrol)
• Municipality owns public space.
• Project application to Eco Fund (installation and commissioning of 10 electric
charging stations on public areas)
• Coordination of the project
• Draftsman of business model
European Regional Development Fund
Report
Pag. 184/202
• Responsible for marking of parking spaces with appropriate vertical
signalization and floor markings.
• Contractor with private company, in case the E-CS is situated on a private
land,
Bottleneck N/A
Expected results • Increased territorial coverage for e-charging service
• Increased interoperable regional network of E-CS
• Promotion of e-mobility, especially since the e-charging service will be free
of charge
• In the long run improvement of air quality and noise reduction
Estimated cost Contract value - for the supply, installation and commissioning of 10 charging
stations = EUR 43,000 with VAT, construction and electrical work are not
included.
Funding method Municipal, co-financing of EUR 30,000 by the Eco Fund
Current state To be completed, last phase
Project life 11 months
Project planned
starting date
November 2017
Project Planned
conclusion
September 2018
Project localization
New station locations:
1. Hotel Triglav 1 e-polnilna postaja
2. Hotel Ribno1 e-polnilna postaja
3. Ledena dvorana Bled 1 e-polnilna postaja
4. Hotel Jelovica 2 e-polnilni postaji
6. Triglav flower Bled 1 e-polnilna postaja
7. Jezerska promenade 1 e-polnilna postaja
8. Bled Castle 3 e-polnilne postaje
https://www.google.si/maps/@46.3597082,14.1009844,15z/data=!3m1!4b1!4m2!6m1!1s1YPy7
N8Hpfx2IdxSiW_xpcuZpWY_vvcUP?hl=sl
Work plan and
activities
description
Non existing
Impact on e-
mobility
High. The critical mass of e-vehicles is missing.
Impact on the
environment
The impact on the environment will be high when e-vehicles will replace
vehicles on diesel or gasoline. Municipality of Bled is a highly touristic
destination with tourist congestions in high season causing traffic congestions in
the center of the city and its urban arterial roads. Noise pollution and quality of
air would improve.
European Regional Development Fund
Report
Pag. 185/202
Economic impact The economic impact is going to be negative in short term, on the account of the
Municipality (large costs in construction and electro works, pay for electricity,
insofar as the system will be free, used for the promotional effect ...). Spillover
effects are possible for the territory since this might attract new kind of visitors
supporting local economy.
Overall impact on
the territory
This action is increasing territorial coverage with interoperable E-CS services
and has a promotional effect of a green destination.
Transferability This action can be transferred in any of municipalities in Gorenjska region and
beyond.
Action Name Increase in number of E-CS on the public parking areas
Strategic Objective Reach an adequate territorial coverage for electric charging services
Area of intervention Municipality Bled
Action Description The action includes setup of 1 new E-CS in the municipality:
• Delivery
• Installation
• Connection to the grid
• Starting the operation
• Cooperation with private company
PA Role
• Investor: financing the costs of construction works, electricity installation and
connection to the grid and covering the costs of the electricity usage.
• Municipality holds the ownership of the public space.
• Project application to Eco Fund, second annual call (installation and
commissioning of 1 electric charging stations on public areas)
• Coordination of the project
• Draftsman of business model
• Responsible for marking of parking spaces with appropriate vertical
signalization and floor markings.
• Contractor with private company, in case the E-CS is situated on a private
land,
Bottleneck N/A
Expected results • Increased territorial coverage for e-charging service
• Increased interoperable regional network of E-CS
• Promotion of e-mobility, especially since the e-charging service will be free
of charge
• In the long run improvement of air quality and noise reduction
Estimated cost Predicted value - for the supply, installation and commissioning of 1 charging
stations = EUR 4,300 with VAT, construction and electrical work are not
included.
European Regional Development Fund
Report
Pag. 186/202
Funding method
Municipal, co-financing of EUR 3,000 by the Eco Fund
Current state Not implemented, starting phase - planning
Project life N/A
Project planned
starting date
N/A
Project Planned
conclusion
N/A
Project localization
New station locations:
• Kindergarten Bled
https://www.google.si/maps/@46.3597082,14.1009844,15z/data=!3m1!4b1!4m2!6m1!1s1YPy7
N8Hpfx2IdxSiW_xpcuZpWY_vvcUP?hl=sl
Work plan and
activities
description
Non existing
Impact on e-
mobility
High. The critical mass of e-vehicles is missing.
Impact on the
environment
The impact on the environment will be high when e-vehicles will replace
vehicles on diesel or gasoline. In this case the accumulation of the number of E-
CS builds environmental impact.
Economic impact The economic impact is going to be negative in short term, on the account of the
Municipality (large costs in construction and electro works, pay for electricity,
insofar as the system will be free, used for the promotional effect ...).
Overall impact on
the territory
This action is increasing territorial coverage with interoperable E-CS services
and has a promotional effect of a green destination.
Transferability This action can be transferred in any of municipalities in Gorenjska region and
beyond.
Action Name Increase in number of E-CS on the public parking areas
Strategic Objective Reach an adequate territorial coverage for electric charging services
Area of intervention Municipality Bled
Action Description The action includes setup of 2 new E-CS in the municipality:
• Delivery
• Installation
• Connection to the grid
• Starting the operation
• Cooperation with private company
PA Role • Municipality holds the ownership of the public space.
• Contractor with private company, in case the E-CS is situated on a private
European Regional Development Fund
Report
Pag. 187/202
land
Bottleneck N/A
Expected results • Increased territorial coverage for e-charging service
• Increased interoperable regional network of E-CS
• Promotion of e-mobility
• In the long run improvement of air quality and noise reduction
Estimated cost N/A
Funding method The investor is a private company Petrol JSC
Current state Not implemented, starting phase
Project life N/A
Project planned
starting date
In the second half of the 2018
Project Planned
conclusion
The end of 2018
Project localization
• New Petrol service station 1
• New Petrol service station 2
https://www.google.si/maps/@46.3597082,14.1009844,15z/data=!3m1!4b1!4m2!6m1!1s1YPy7
N8Hpfx2IdxSiW_xpcuZpWY_vvcUP?hl=sl
Work plan and
activities
description
Non existing
Impact on e-
mobility
High from the aspect of accumulation of E-CS service provision.
Impact on the
environment
The impact on the environment will be high when e-vehicles will replace
vehicles on diesel or gasoline. In this case the accumulation of the number of E-
CS builds environmental impact.
Economic impact The economic impact is going to be positive on the long run, since service will
be upon payment.
Overall impact on
the territory
This action is increasing territorial coverage with interoperable E-CS services
and has a promotional effect of a green destination.
Transferability This action can be transferred in any of municipalities in Gorenjska region and
beyond.
Action Name Increase in number of E-CS on the public parking areas
Strategic Objective Reach an adequate territorial coverage for electric charging services
Area of intervention Municipality Žirovnica
Action Description The action includes setup of 1 new E-CS in the municipal parking lot:
• Delivery
• Installation
European Regional Development Fund
Report
Pag. 188/202
• Connection to the grid
• Starting the operation
• Cooperation with private company
PA Role Municipalities are owners of public spaces, Eco Fund applicants, coordinators
responsible for preparing business models, mark parking spaces with appropriate
vertical signalization and floor markings, are contractors with private persons, if
they are electronic billing stations on private land and are payers for establishing
system (network connection, construction work). Management is passed on to E-
CS.
Bottleneck Providing the necessary financial resources.
Expected results Establishment of a network of E-CS in Slovenia that are compatible with the
European network
• Increased territorial coverage for e-charging service
• Increased interoperable regional network of E-CS
• Promotion of e-mobility
• In the long run improvement of air quality and noise reduction
Estimated cost 5000 EUR for E-CS, other costs: infrastructural works, connection to the grid are
not cost evaluated.
Funding method There is an assumption that the Municipality itself will finance the installation of
an E-CS.
Current state Not yet implemented.
Project life From March to September 2019
Project planned
starting date
Spring 2019
Project Planned
conclusion
Fall 2019
Project localization By the public parking lot in Završnica.
Work plan and
activities
description
Not yet elaborated.
Impact on e-
mobility
Since this will be the 2nd E-CS in the municipality the impact according to the
demand at this stage is small, however it is high in terms of giving the signal of
future mobility, vision, to people and promoting e-mobility and higher quality of
life.
European Regional Development Fund
Report
Pag. 189/202
Impact on the
environment
Ensuring the highest level of sustainable transport and reducing the negative
impacts of transport on the environment, and thus the development of the
Završnica valley in terms of sustainable development of the Završnice as a
starting point for hiking, biking and mountaineering
Economic impact Medium and long term:
• Greater utilization of renewable energy sources
• Development of new technologies, greater use of IT
• Lower maintenance costs for vehicles
Overall impact on
the territory
There is a public parking lot in the Završnice valley area, and the entire
arrangement of tourist and recreational areas is foreseen for this area. Since the
car park is very busy (especially at the end of the week), the location for the E-
CS installation is carefully selected.
Transferability To the entire Gorenjska region.
Action Name Increase in number of E-CS on the public parking areas
Strategic Objective Reach an adequate territorial coverage for electric charging services
Area of intervention Municipality Žiri
Action Description The action includes setup of 1 or 2 new E-CS in the municipality:
• Delivery
• Installation
• Connection to the grid
• Starting the operation
• Cooperation with private company if possible
PA Role • Investor: financing the costs of construction works, electricity installation and
connection to the grid and covering the costs of the electricity usage.
• Municipality owns public space.
• Coordination of the project
• Responsible for marking of parking spaces with appropriate vertical
signalization and floor markings.
Bottleneck N/A
Expected results • Increased interoperable regional network of E-CS
• Promotion of e-mobility, especially since the e-charging service will be free
of charge
• In the long run improvement of air quality and noise reduction
Estimated cost Average cost of installing one E-CS station
Funding method Municipal, co-financing by the Eco Fund or other sources
Current state Not implemented
Project life N/A
Project planned
starting date
2020 or 2021
Project Planned
conclusion
2022
European Regional Development Fund
Report
Pag. 190/202
Project localization
• New station locations:
1. Parking place in city center
2. Parking place in Postotnik (camping place)
Work plan and
activities
description
Non existing
Impact on e-
mobility
High. The critical mass of e-vehicles is missing.
Impact on the
environment
No big environmental impact in our case but more promotional.
Economic impact The economic impact is going to be negative in short term, on the account of the
Municipality (large costs in construction and electro works, pay for electricity,
insofar as the system will be free, used for the promotional effect ...). Spillover
effects are possible for the territory since this might attract new kind of visitors
supporting local economy.
Overall impact on
the territory
This action is increasing territorial coverage with interoperable E-CS services
and has a promotional effect of a green destination.
Transferability This action can be transferred in any of municipalities in Gorenjska region and
beyond.
Action Name Facilitate contacts between PAs and stakeholders (companies, private investors,
private citizens, ...)
Strategic Objective Promotion of e-mobility
Area of
intervention
Municipality of Jesenice, Radovljica and Bohinj
Action Description Municipality as the main coordinator between providers and users of e-mobility
• Key features: informing, raising awareness and educating users about e-
mobility
• Main objectives: reducing the number of means of transport on fossil fuels,
improving air quality.
• Main product: pilot e-charging on public areas
• What could be helpful: necessary tools: media, promotional material,
cooperation between equipment providers and -e-vehicles
PA Role On the basis of information and data on priority e-mobility and interoperability,
the public administration (municipality) carries out the continuous task of
informing and educating users about the use and positive effects, and the
accessibility to equipment and means of transport, as well as on the effects of e-
mobility long term.
Bottleneck Lack of funds for implementing measures and ignorance of the benefits of e-
mobility;
European Regional Development Fund
Report
Pag. 191/202
Expected results Establishment of a network of E-CS in Slovenia that are compatible with the
European network; Development and investment of companies in the field of e-
mobility;
Estimated cost 10.000 EUR / annually / municipality
Funding method This is a European orientation; therefore the funds should come from European
sources.
Current state Not implemented
Project life Permanent activity - long-term
Project planned
starting date
N/A
Project Planned
conclusion
N/A
Project localization
The area of the Municipality of Jesenice and neighboring municipalities
(Kranjska Gora, Gorje, Žirovnica) - the municipalities are part of the Alpine
region. Alpine region.
Work plan and
activities
description
N/A
Impact on e-
mobility
Raising awareness of e-mobility among vehicle users and inhabitants of the
Alpine region.
Raising quality of life.
Impact on the
environment
Reducing emissions into the environment
Reduction of environmental pollution (emissions, waste vehicles)
Economic impact Greater utilization of renewable energy sources
Development of new technologies, increased use of IT
Lower maintenance costs for vehicles
Overall impact on
the territory
The municipality of Jesenice lies on the edge of the Triglav National Park, which
is part of the Alpine space. The municipality lies in the Upper Sava Valley. It is
bordered by the Karawanks and the Austrian border to the north, and by Mount
Mežakla to the south. The entire direct 100 km zone is part of the European
alpine space, for which it is essential to adopt a sustainability plan to protect this
sensitive ecosystem, which is increasingly condensed with the consequences of
the excessive use of fossil fuel vehicles.
The municipality of Bohinj lies in the Triglav National Park, which is part of the
Alpine space, for which it is essential to adopt a sustainability plan to protect this
sensitive ecosystem, which is increasingly condensed with the consequences of
the excessive use of fossil fuel vehicles. Municipality of Bohinj is also partner of
Alpine Pearls, an association of 25 Alpine destination that invite guests to spend
their vacation without their vehicles and by using the sustainable mobility
options offered at every destination.
Transferability The whole western part of Carinthia and the northeastern part of Italy - the
border regions with Gorenjska.
European Regional Development Fund
Report
Pag. 192/202
Action Name Facilitate acquisition of financial incentives supporting municipal actions in
diffusion of e-mobility.
Strategic Objective Provide support to the local PA (municipalities)
Area of
intervention
Municipalities of Gorenjska region
Action Description RDA of Gorenjska, BSC, Ltd, Kranj as a facilitator of regional development:
• Key features: preparing and gaining projects funded by European and
national funds
• Main objectives: diffusing interoperable E-CS network and use of e-
vehicles and vehicles on other alternative fuels
• Main product: municipal engagement in diffusion of interoperable E-CS
networks and higher percentage of e-vehicles for private and public use
• What could be helpful: cooperation with national and regional
stakeholders and with European partnership networks; continuation of
European co-financing mechanisms, programs.
PA Role The role of PAs is to be open for cooperation, supporting activities of RDA
Gorenjska.
Bottleneck Lack of funds for implementing measures and ignorance of the benefits of e-
mobility. High competitiveness when gaining projects on the European level.
Expected results Meeting the regional needs (municipal needs), improving and filling in the
development gaps regarding interoperable E-CS network, lack of e-vehicles for
public transportation and business use, infrastructural investments for
establishment of sustainable transportation.
Estimated cost Descriptive overall – high cost estimation
Funding method European and national financial resources. In some cases for medium and small
sized projects municipal budget.
Current state Implementation is ongoing by several projects like e-MOTICON, e-MOPOLI,
LEAG.
Project life Permanent activity - long-term
Project planned
starting date
It depends on different implementation or preparation phases. In terms of period:
2014-2020 and for 2021 -2027
Project Planned
conclusion
It depends on different implementation or preparation phases. In terms of period:
2014-2020 and for 2021-2030
Project localization Gorenjska region and spillover affected other areas.
Work plan and
activities
description
Application forms, Regional Development Plan of Gorenjska, strategic
documents as Action Plan for diffusion of e-mobility infrastructure and e-
mobility and other planning documents.
Impact on e-
mobility
High in terms of final results – diffusion of e-mobility infrastructure, setting up
E-CS interoperability, motivating public authorities to invest in e-mobility
infrastructure, promoting e-mobility, increasing success rate of achieving
national objectives for e-mobility.
European Regional Development Fund
Report
Pag. 193/202
Impact on the
environment
Reducing emissions into the environment, reduction of environmental pollution
(emissions, waste vehicles, noise).
Economic impact Supporting economic development in the region by gaining non-refundable
financial resources means direct and indirect effects on economic entities
strengthening market position, increasing competitiveness and innovation
capacity, business networking.
Overall impact on
the territory
Reduction of development discrepancy for diffusion of e-mobility between
different regions in Slovenian and abroad.
Transferability Is possible to other municipalities, Slovenian regions and beyond.
Action Name Building knowledge capacity concerning E-CS infrastructure, operation and e-
mobility
Strategic Objective Provide support to the local PA (municipalities)
Area of
intervention
Municipalities of Gorenjska region
Action Description RDA of Gorenjska, BSC, Ltd, Kranj as a facilitator of regional development:
• Key features: informing, raising awareness and educating public
administration about E-CS infrastructure, operation and e-mobility
• Main objectives: raising knowledge capacity of public administration for
them to be empowered for policy making and implementation of measures
and promotion of e-mobility
• Main product: increased knowledge capacity of public administration
• What could be helpful: e-HUB Gorenjska (http://e-mobilitygorenjska.si/),
cooperation with all e-mobility stakeholders and network abroad, engagement
of municipalities.
PA Role Engagement of municipalities, support and information exchange.
Bottleneck Lack of time and funds for implementing activity long term, lack engagement of
stakeholders.
Expected results Increased awareness, behavioral change, increased knowledge capacity,
strengthened consensus and cooperation. Improved capacity of public
administration in promoting e-mobility.
Estimated cost 10.000 EUR / annually, can be more or less depending on activity, project or
other sources of funding.
Funding method EU funds, municipal funding.
Current state Implementation in progress by e-MOTICON activities: on-line trainings,
workshops, meetings, e-HUB platform (http://e-mobilitygorenjska.si/),
promotional activities etc.
Project life Permanent activity - long-term
Project planned
starting date
Already started in November 2016
Project Planned
conclusion
Possibly in 2030
European Regional Development Fund
Report
Pag. 194/202
Project localization Gorenjska region
Work plan and
activities
description
Work plan is defined by project application form e-MOTICON and other
projects on the topic and by this specific document under the chapter
Communication strategy.
Impact on e-
mobility
Higher awareness and promotion of e-mobility.
Impact on the
environment
Spillover effects, indirect impact on promotion of healthy environment and
therefor higher quality of life.
Economic impact Indirect impact, chain reaction of raising the awareness and changing behavior of
citizens, increased investments in e-mobility.
Overall impact on
the territory
Faster implementation of e-mobility infrastructure, increased investments in e-
vehicles - higher development in the area of e-mobility.
Transferability Transferable as a good practice to different territories.
Action Name Support and initiate creation of national informational platform for e-charging
infrastructure under the management and control of the national public body
Strategic Objective Make the information on the charging network available to regional and
transnational users
Area of
intervention
Gorenjska region
Action Description Gorenjske elektrarne, RDA of Gorenjska, BSC, Ltd, Kranj as a facilitator of
regional development for e-mobility infrastructure:
• Key features: organizing meeting with the national responsible body,
presenting the issue, presenting the idea and the feasibility plan.
• Main objectives: provision of standardized up-to date information to domestic
and foreign users and for the statistical analysis and for the promotion of the
development of the country in terms of e-mobility infrastructure and
regulation.
• Main product: bi-lingual national informational platform for E-CS
infrastructure, providing data on localization, type, technical features,
operation status, payment options and operator to the user; additional data
provision on request: year of establishment, interoperability status, e-roaming
status, owner.
• What could be helpful: commitment of national authorities to establish such a
platform and EU funds.
PA Role Engagement and commitment of national public authorities to implement this
idea.
Bottleneck Lack of interest of national authorities and funds for implementing activity.
Expected results Increased awareness, promotion, research capacity, initiating behavioral change
in users of e-vehicles by providing up-to date information on E-CS network,
strengthened consensus and cooperation of electricity providers and E-CS
European Regional Development Fund
Report
Pag. 195/202
network operators. Improved capacity of municipalities in promoting e-mobility.
Estimated cost N/A,
Funding method Activity co-funded by EU funds, RDA of Gorenjska BSC, Ltd, Kranj and GEK
Current state Initiation of idea
Project life 2018 -2019
Project planned
starting date
May 2018
Project Planned
conclusion
April 2019
Project localization Slovenia
Work plan and
activities
description
• May 2018 meeting with GEK and initiation of the idea upon the identified
problematic of several informational platforms providing omitted data.
• 19. 9. 2018 introduction of the idea to the regional stakeholders and policy
makers on the working meeting in Jesenice. (Gaining approval and support.)
• October 2018 meeting with GEK to define next steps
• November 2018 – January 2019 meeting with national authorities
• January – March 2019 lobbying the idea
• April 2019 verification and evaluation of the action outcome and
dissemination of the result among stakeholders.
Impact on e-
mobility
Higher awareness and promotion of e-mobility nationally and abroad, raised
monitoring, analysis and research capacity.
Impact on the
environment
Indirect impact – attracting tourists with e-vehicles.
Economic impact Indirect impact, chain reaction of raising the awareness and changing behavior of
citizens, increased investments in e-mobility.
Overall impact on
the territory
Improved monitoring of the established E-CS networks, increased awareness
nationally and abroad, increased promotional capacity for e-mobility
infrastructure.
Transferability Transferable as a good practice to different countries.
Action Name Utilize regional RDA of Gorenjska e-HUB platform for mapping
Strategic Objective Make the information on the charging network available to regional and
transnational users
Area of
intervention
Gorenjska region
Action Description Gorenjske elektrarne, RDA of Gorenjska, BSC, Ltd, Kranj as a facilitator of
regional development for e-mobility infrastructure:
• Key features: BSC, Ltd, Kranj established e-HUB on-line e-mobility website
with a map of E-CS, Gorenjske elektrarne provided the map to be imbedded
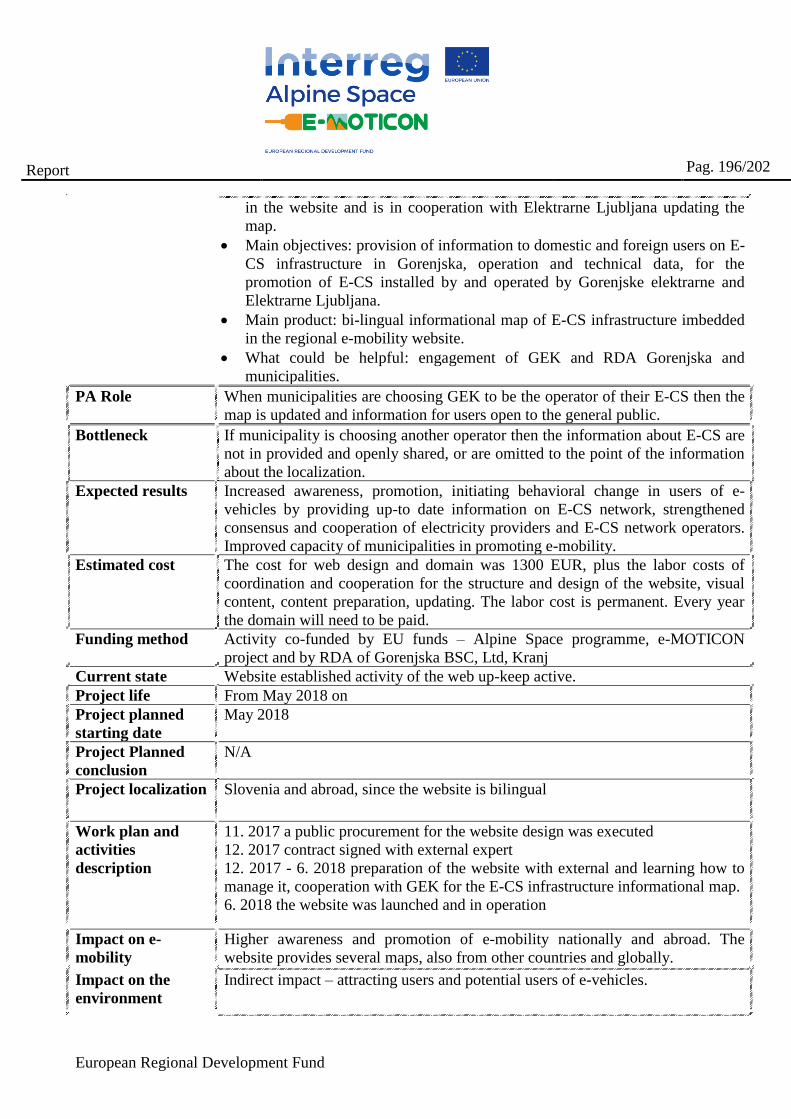
European Regional Development Fund
Report
Pag. 196/202
in the website and is in cooperation with Elektrarne Ljubljana updating the
map.
• Main objectives: provision of information to domestic and foreign users on E-
CS infrastructure in Gorenjska, operation and technical data, for the
promotion of E-CS installed by and operated by Gorenjske elektrarne and
Elektrarne Ljubljana.
• Main product: bi-lingual informational map of E-CS infrastructure imbedded
in the regional e-mobility website.
• What could be helpful: engagement of GEK and RDA Gorenjska and
municipalities.
PA Role When municipalities are choosing GEK to be the operator of their E-CS then the
map is updated and information for users open to the general public.
Bottleneck If municipality is choosing another operator then the information about E-CS are
not in provided and openly shared, or are omitted to the point of the information
about the localization.
Expected results Increased awareness, promotion, initiating behavioral change in users of e-
vehicles by providing up-to date information on E-CS network, strengthened
consensus and cooperation of electricity providers and E-CS network operators.
Improved capacity of municipalities in promoting e-mobility.
Estimated cost The cost for web design and domain was 1300 EUR, plus the labor costs of
coordination and cooperation for the structure and design of the website, visual
content, content preparation, updating. The labor cost is permanent. Every year
the domain will need to be paid.
Funding method Activity co-funded by EU funds – Alpine Space programme, e-MOTICON
project and by RDA of Gorenjska BSC, Ltd, Kranj
Current state Website established activity of the web up-keep active.
Project life From May 2018 on
Project planned
starting date
May 2018
Project Planned
conclusion
N/A
Project localization Slovenia and abroad, since the website is bilingual
Work plan and
activities
description
11. 2017 a public procurement for the website design was executed
12. 2017 contract signed with external expert
12. 2017 - 6. 2018 preparation of the website with external and learning how to
manage it, cooperation with GEK for the E-CS infrastructure informational map.
6. 2018 the website was launched and in operation
Impact on e-
mobility
Higher awareness and promotion of e-mobility nationally and abroad. The
website provides several maps, also from other countries and globally.
Impact on the
environment
Indirect impact – attracting users and potential users of e-vehicles.
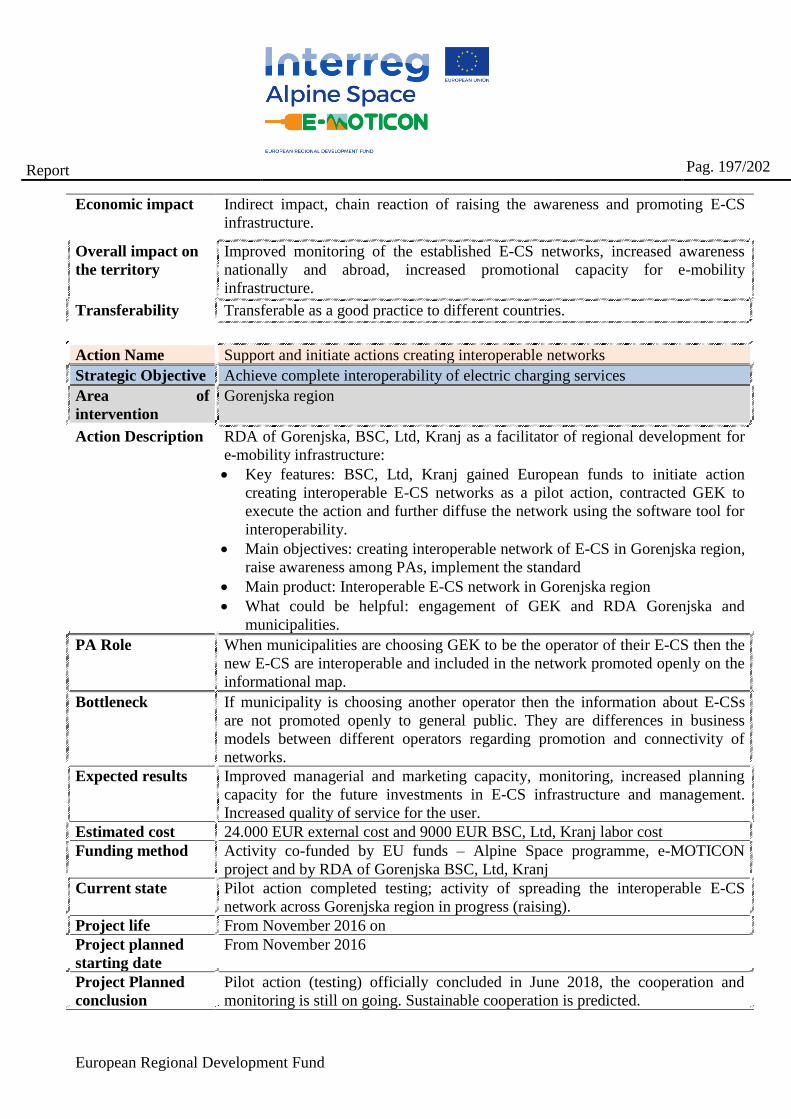
European Regional Development Fund
Report
Pag. 197/202
Economic impact Indirect impact, chain reaction of raising the awareness and promoting E-CS
infrastructure.
Overall impact on
the territory
Improved monitoring of the established E-CS networks, increased awareness
nationally and abroad, increased promotional capacity for e-mobility
infrastructure.
Transferability Transferable as a good practice to different countries.
Action Name Support and initiate actions creating interoperable networks
Strategic Objective Achieve complete interoperability of electric charging services
Area of
intervention
Gorenjska region
Action Description RDA of Gorenjska, BSC, Ltd, Kranj as a facilitator of regional development for
e-mobility infrastructure:
• Key features: BSC, Ltd, Kranj gained European funds to initiate action
creating interoperable E-CS networks as a pilot action, contracted GEK to
execute the action and further diffuse the network using the software tool for
interoperability.
• Main objectives: creating interoperable network of E-CS in Gorenjska region,
raise awareness among PAs, implement the standard
• Main product: Interoperable E-CS network in Gorenjska region
• What could be helpful: engagement of GEK and RDA Gorenjska and
municipalities.
PA Role When municipalities are choosing GEK to be the operator of their E-CS then the
new E-CS are interoperable and included in the network promoted openly on the
informational map.
Bottleneck If municipality is choosing another operator then the information about E-CSs
are not promoted openly to general public. They are differences in business
models between different operators regarding promotion and connectivity of
networks.
Expected results Improved managerial and marketing capacity, monitoring, increased planning
capacity for the future investments in E-CS infrastructure and management.
Increased quality of service for the user.
Estimated cost 24.000 EUR external cost and 9000 EUR BSC, Ltd, Kranj labor cost
Funding method Activity co-funded by EU funds – Alpine Space programme, e-MOTICON
project and by RDA of Gorenjska BSC, Ltd, Kranj
Current state Pilot action completed testing; activity of spreading the interoperable E-CS
network across Gorenjska region in progress (raising).
Project life From November 2016 on
Project planned
starting date
From November 2016
Project Planned
conclusion
Pilot action (testing) officially concluded in June 2018, the cooperation and
monitoring is still on going. Sustainable cooperation is predicted.
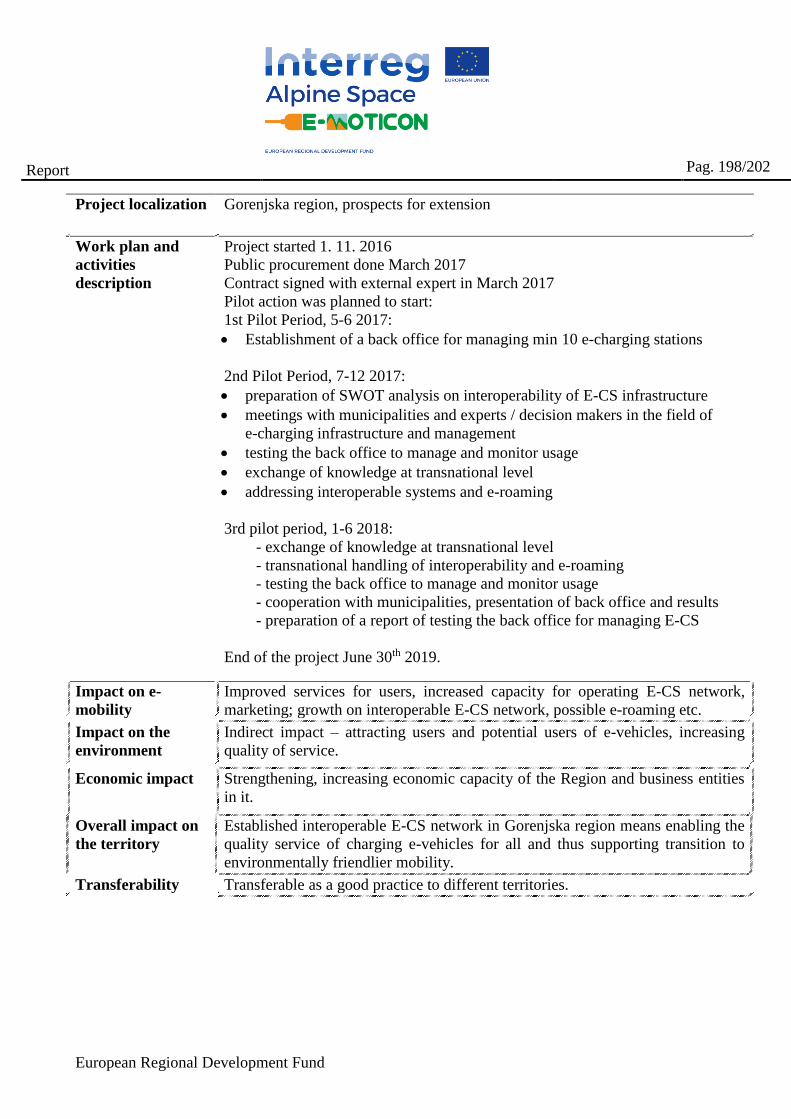
European Regional Development Fund
Report
Pag. 198/202
Project localization Gorenjska region, prospects for extension
Work plan and
activities
description
Project started 1. 11. 2016
Public procurement done March 2017
Contract signed with external expert in March 2017
Pilot action was planned to start:
1st Pilot Period, 5-6 2017:
• Establishment of a back office for managing min 10 e-charging stations
2nd Pilot Period, 7-12 2017:
• preparation of SWOT analysis on interoperability of E-CS infrastructure
• meetings with municipalities and experts / decision makers in the field of
e-charging infrastructure and management
• testing the back office to manage and monitor usage
• exchange of knowledge at transnational level
• addressing interoperable systems and e-roaming
3rd pilot period, 1-6 2018:
- exchange of knowledge at transnational level
- transnational handling of interoperability and e-roaming
- testing the back office to manage and monitor usage
- cooperation with municipalities, presentation of back office and results
- preparation of a report of testing the back office for managing E-CS
End of the project June 30th 2019.
Impact on e-
mobility
Improved services for users, increased capacity for operating E-CS network,
marketing; growth on interoperable E-CS network, possible e-roaming etc.
Impact on the
environment
Indirect impact – attracting users and potential users of e-vehicles, increasing
quality of service.
Economic impact Strengthening, increasing economic capacity of the Region and business entities
in it.
Overall impact on
the territory
Established interoperable E-CS network in Gorenjska region means enabling the
quality service of charging e-vehicles for all and thus supporting transition to
environmentally friendlier mobility.
Transferability Transferable as a good practice to different territories.
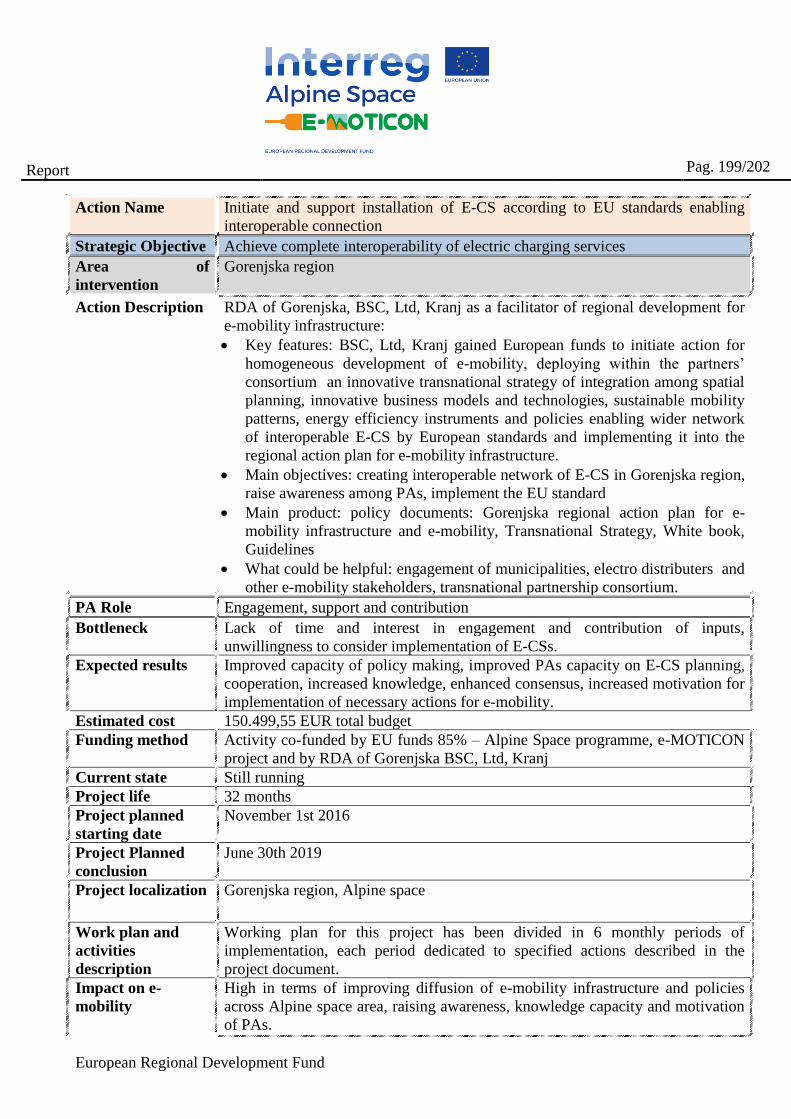
European Regional Development Fund
Report
Pag. 199/202
Action Name Initiate and support installation of E-CS according to EU standards enabling
interoperable connection
Strategic Objective Achieve complete interoperability of electric charging services
Area of
intervention
Gorenjska region
Action Description RDA of Gorenjska, BSC, Ltd, Kranj as a facilitator of regional development for
e-mobility infrastructure:
• Key features: BSC, Ltd, Kranj gained European funds to initiate action for
homogeneous development of e-mobility, deploying within the partners’
consortium an innovative transnational strategy of integration among spatial
planning, innovative business models and technologies, sustainable mobility
patterns, energy efficiency instruments and policies enabling wider network
of interoperable E-CS by European standards and implementing it into the
regional action plan for e-mobility infrastructure.
• Main objectives: creating interoperable network of E-CS in Gorenjska region,
raise awareness among PAs, implement the EU standard
• Main product: policy documents: Gorenjska regional action plan for e-
mobility infrastructure and e-mobility, Transnational Strategy, White book,
Guidelines
• What could be helpful: engagement of municipalities, electro distributers and
other e-mobility stakeholders, transnational partnership consortium.
PA Role Engagement, support and contribution
Bottleneck Lack of time and interest in engagement and contribution of inputs,
unwillingness to consider implementation of E-CSs.
Expected results Improved capacity of policy making, improved PAs capacity on E-CS planning,
cooperation, increased knowledge, enhanced consensus, increased motivation for
implementation of necessary actions for e-mobility.
Estimated cost 150.499,55 EUR total budget
Funding method Activity co-funded by EU funds 85% – Alpine Space programme, e-MOTICON
project and by RDA of Gorenjska BSC, Ltd, Kranj
Current state Still running
Project life 32 months
Project planned
starting date
November 1st 2016
Project Planned
conclusion
June 30th 2019
Project localization Gorenjska region, Alpine space
Work plan and
activities
description
Working plan for this project has been divided in 6 monthly periods of
implementation, each period dedicated to specified actions described in the
project document.
Impact on e-
mobility
High in terms of improving diffusion of e-mobility infrastructure and policies
across Alpine space area, raising awareness, knowledge capacity and motivation
of PAs.
European Regional Development Fund
Report
Pag. 200/202
Impact on the
environment
Indirect impact – attracting users and potential users of e-vehicles to get to the
critical mass when the impact on the environment will be measurable.
Economic impact Strengthening, increasing economic capacity of the Region and business entities,
improving capacity of PAs to support regional economy.
Overall impact on
the territory
Increasing capacity of e-mobility infrastructure.
Transferability Transferable as a good practice to different territories.
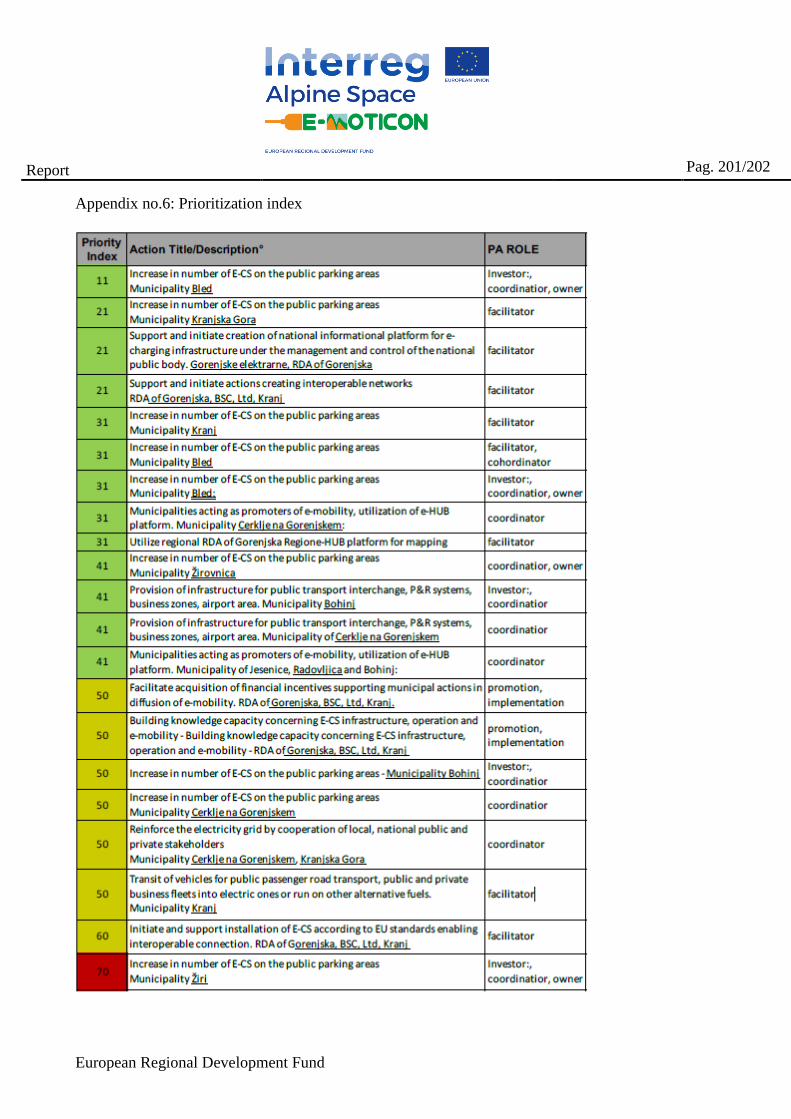
European Regional Development Fund
Report
Pag. 201/202
Appendix no.6: Prioritization index
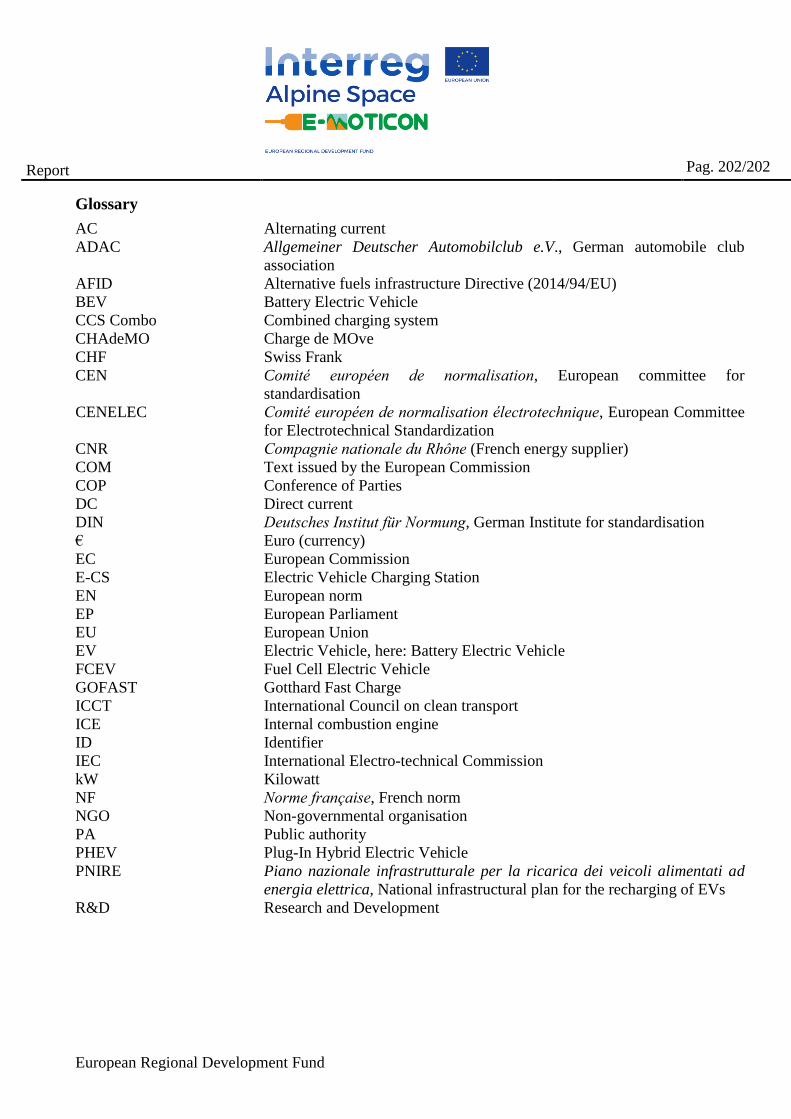
European Regional Development Fund
Report
Pag. 202/202
Glossary
AC Alternating current
ADAC Allgemeiner Deutscher Automobilclub e.V., German automobile club
association
AFID Alternative fuels infrastructure Directive (2014/94/EU)
BEV Battery Electric Vehicle
CCS Combo Combined charging system
CHAdeMO Charge de MOve
CHF Swiss Frank
CEN Comité européen de normalisation, European committee for
standardisation
CENELEC Comité européen de normalisation électrotechnique, European Committee
for Electrotechnical Standardization
CNR Compagnie nationale du Rhône (French energy supplier)
COM Text issued by the European Commission
COP Conference of Parties
DC Direct current
DIN Deutsches Institut für Normung, German Institute for standardisation
€ Euro (currency)
EC European Commission
E-CS Electric Vehicle Charging Station
EN European norm
EP European Parliament
EU European Union
EV Electric Vehicle, here: Battery Electric Vehicle
FCEV Fuel Cell Electric Vehicle
GOFAST Gotthard Fast Charge
ICCT International Council on clean transport
ICE Internal combustion engine
ID Identifier
IEC International Electro-technical Commission
kW Kilowatt
NF Norme française, French norm
NGO Non-governmental organisation
PA Public authority
PHEV Plug-In Hybrid Electric Vehicle
PNIRE Piano nazionale infrastrutturale per la ricarica dei veicoli alimentati ad
energia elettrica, National infrastructural plan for the recharging of EVs
R&D Research and Development
Related Documents