1 Temporal Dynamism, Soil Processes and Niche Complementarity: Novel Approaches to Understanding Diversity-Function Relationships. E J SCHOFIELD PHD 2020

Welcome message from author
This document is posted to help you gain knowledge. Please leave a comment to let me know what you think about it! Share it to your friends and learn new things together.
Transcript
1
Temporal Dynamism, Soil Processes and Niche Complementarity:
Novel Approaches to Understanding Diversity-Function
Relationships.
E J SCHOFIELD
PHD 2020
2
Temporal Dynamism, Soil Processes and Niche Complementarity:
Novel Approaches to Understanding Diversity-Function
Relationships.
Emily Jane Schofield
A thesis submitted in partial fulfilment of the requirements of the
Manchester Metropolitan University for the degree of
Doctor of Philosophy
Department of Natural Sciences
Faculty of Science and Engineering
The Manchester Metropolitan University
The James Hutton Institute
2020
3
Contents
Chapter 1 - Temporal dynamism of resource capture: a missing factor in ecology?........10
1.1 -What is temporal dynamism and why is it important?.................................................11
1.2 - Examples of temporal dynamism in plant communities……………………………….…………..12
1.3 - Why does it matter that temporal dynamism has been overlooked?.........................13
1.4 - Why has temporal dynamism in resource capture been overlooked?........................15
1.5 – Research Questions………………………………………………………………….…………….……………....16
1.6 - How to measure short-term temporal dynamism in resource capture and competition?.......................................................................................................................17
1.7 - What is the future strategy to study temporal dynamism?........................................21
1.8 – Conclusions………………………………………………………………………………………….….………..…….21
References………………………………………………………………………………………………….……..…………….22
Chapter 2 - Cultivar differences and impact of plant-plant competition on temporal
patterns of nitrogen and biomass accumulation…………………………………..….………..……..29
2.1 – Introduction…………………………………………………………………………………………………….…....31
2.2 - Materials and Methods…………………………………………………………………………………….…….33
2.3 – Results…………………………………………………………………………………………………………….……..37
2.4 – Discussion………………………………………………………………………………………………………..…….42
2.5 – Conclusions…………………………………………………………………………………………………………….46
References………………………………………………………………………………………………………………………47
Chapter 3 - Model and software choice affect analysis of temporal dynamism in plants –
shorter harvesting intervals increase accuracy over replication……………..………..…..……50
3.1 – Introduction………………………………………………………………………………………………………..…51
3.2 – Materials and Methods………………………………………………………………………………………….55
3.3 – Results……………………………………………………………………………………………………………………56
3.4 – Discussion………………………………………………………………………………………………………………60
3.5 – Conclusions…………………………………………………………………………………………………………….63
4
References…………………………………………………………………………………………………………………….64
Chapter 4 - Temporal patterns of soil processes: cultivar differences and the impact of
plant-plant competition………………………………………………………………………….………………….68
4.1 – Introduction…………………………………………………………………………….………….………………….69
4.2 - Materials and methods…………………………………………………………….……………………………..71
4.3 – Results……………………………………………………………………………………………….…………………..78
4.4 – Discussion………………………………………………………………………………………………………….…..82
4.5 – Conclusions……………………………………………………………………………………………………..……..87
References……………………………………………………………………………………………………………………..87
Chapter 5 - Plant-plant competition influences temporal dynamism of soil microbial
enzyme activity………………………………………………………………………………………..…..………….90
5.1 – Introduction………………………………………………………………………………………………………….92
5.2 - Materials and methods………………………………………………………………………………………….94
5.3 – Results………………………………………………………………………………………………………………….99
5.4 – Discussion…………………………………………………………………………………………………………….107
5.5 – Conclusions………………………………………………………………………………………………………....112
References……………………………………………………………………………………………………………………113
Chapter 6 - Gene expression response to intra- and inter- cultivar competition and potential consequences for temporal dynamics of resource……………………………..……..118
6.1 – Introduction………………………………………………………………………………………………………...119
6.2 - Materials and Methods…………………………………………………………………………………………122
6.3 – Results………………………………………………………………………………………………………………….125
6.4 – Discussion…………………………………………………………………………………………………………….130
6.5 – Conclusions…………………………………………………………………………………………………………..135 References…………………………………………………………………………………………………………………….135
5
Chapter 7 - The temporal dynamics of salicylic acid and jasmonic acid production in
response to early stage plant-plant competition……………..……………………………..…….….139
7.1 – Introduction………………………………………………………………………………………………………….140
7.2 - Materials and Methods………………………………………………………………………………………….143
7.3 – Results……………………………………………………………………………………………………;…………….146
7.4 – Discussion……………………………………………………………………………………………….…………….147
7.5 – Conclusions…………………………………………………………………………………………….…………….150
References………………………………………………………………………………………………………….…………151
Chapter 8 - Has temporal dynamism in resource capture been lost in modern barley
cultivars?....................................................................................................................156
8.1 – Introduction…………………………………………………………………………………………………………157
8.2 - Materials and Methods…………………………………………………………………………………………160
8.3 – Results………………………………………………………………………………………………………………….162
8.4 – Discussion…………………………………………………………………………………………………………….169
8.5 – Conclusions…………………………………………………………………………………………….…………….176
References………………………………………………………………………………………………………….………...176
General conclusions………………………………………………………………………………………………….....182
Appendix 1……………………………………………………………………………………………………………………192
Appendix 2……………………………………………………………………………………………………………………198
Appendix 3…………………………………………………………………………………………………………………...199
Appendix 4……………………………………………………………………………………………………………………209
Published papers………………………………………………………………………………………………………….211
6
List of Figures
Figure 1.1 - Theoretical role of temporal dynamism in plant coexistence…………14
Figure 2.1 – Timing of peak nitrogen and biomass accumulation rate, the shoot nitrogen concentration and absolute maximum accumulated total biomass at the end of the experiment in barley (Hordeum vulgare)…………………………………………………………..38
Figure 2.2 – Mean cumulative nitrogen and biomass accumulation of Tammi and Proctor barley cultivars over time………………………………………………………………………………….39
Figure 2.3 - Mean Relative Intensity Index of barley (Hordeum vulgare) Tammi and Proctor cultivars in inter- and intra- cultivar competition……………………….…………………..….41
Figure 3.1 – A hypothetical fitted logistic growth curve of biomass from successive harvesting with the corresponding derived instantaneous accumulation rate curve…………………………………………………………………………………………………………………52
Figure 3.2 – An example of the fitted logistic curves produced by the different models and software programs………………………………………………………………………………………….57
Figure 3.3 – The effect of replicate number and sampling frequency on the estimate of peak biomass accumulation rate…………………………………………………………………..………….59
Figure 4.1 – Root-derived rate of soil respiration per unit biomass derived from isotopic and respiration data of two barley cultivars grown together or in isolation…………….79
Figure 4.2 – Root priming effect over time in soils under two barley cultivars relative to the unplanted controls……………………………………………………………………………………………80
Figure 4.3 – Mean soil solution concentration of total organic carbon from pots containing barley cultivars grown in isolation, inter- or intra- cultivar competition…………….81
Figure 4.4 – Mean concentration of NO3 and NH4 extracted from soil samples at the end of the soil respiration experiment………………………………………………………………………….82
Figure 5.1 – Mean cellulase and leucine aminopeptidase (pmol mm-2 h-1) along the root axis
of Proctor roots grown in isolation, intra- and inter- cultivar competition…….…………………………………………………………………………………………………101
Figure 5.2 – Images of the sampled rhizoboxes, showing the consistent sampling location used in this study and the relationship between root presence and soil enzyme activity.
…………………………………………………………………………………………………………………...……103
Figure 5.3 - Soil zymography images showing (pmol mm-2 h-1) cellulase activity around Proctor roots sampled from plants grown in isolation and competition as well as a bare soil control………………………………………………………………………………………………………….…104
7
Figure 5.4 - Soil zymography images showing (pmol mm-2 h-1) leucine aminopeptidase activity around Proctor roots sampled from plants grown in isolation and competition as well as a bare soil control………..………………………………………………………………………105
Figure 5.5 – The mean percentage of sampled areas in which the activity of cellulase and leucine aminopeptidase were recorded……….…………………………………………………106
Figure 6.1- Functional groups of genes significantly (P ≤ 0.05, with a ≥ 2 fold change in expression) differentially expressed in competition treatments compared to Proctor plants in isolation…………………………………………………………………………………………….………...127
Figure 7.1 – Concentration of salicylic acid extracted from roots of Proctor sampled over the first month of growth……………………………………………………………………..……………....146
Figure 8.1 – The pedigree of the four cultivars used in this study highlighted in orange and generations between them………………………………………………………….………………….160
Figure 8.2 – Cumulative shoot biomass accumulation of the four barley cultivars in this study; Proctor, Krona, Annabell and Chanson………………..………………………….…….164
Figure 8.3 – The absolute maximum biomass accumulation and timing of peak biomass accumulation rate of Proctor, Krona, Annabell and Chanson……………….….….…..165
Figure 8.4 – Cumulative shoot nitrogen concentration of Proctor, Krona, Annabell and Chanson barley cultivars used in this study…………….……………………………….……..167
Figure 8.5 - The absolute maximum nitrogen accumulation and timing of peak nitrogen accumulation rate of Proctor, Krona, Annabell and Chanson………….……..……….168
Figure 9.1 – A summary of the core studies carried out in this thesis, detailing the timing of each study and how they relate to each other within the first 50 days of barley growth……………………………………………………………………………………………….…..….…..185
Figure 9.2 – Links between the studies in this thesis based on experimental evidence and existing literature………………………………………………………………………………………….186
List of Diagrams
Diagram 4.1 – Experimental setup of the soil respiration experiment, showing the positioning of the plants and respiration chamber…………………………………………73
List of Tables
Table 4.1 – Frequency of data collected in this study and the statistical test applied for analysis……………………………………………………………………………………………………..……76
8
Table 5.1 – Mean total root length and biomass at 33 days after planting of Proctor barley plants……………………………………………………………………………………………………….……100
Table 6.1 - qRT-PCR primers used in this study…………………………………..………...125
Table 6.2 - List of significantly (P ≤ 0.05 with ≥ 2 fold change in expression) differentially expressed genes common to both competition treatments, with annotated functions from the UniProt database……………………………………………………………………………….……128
Table 6.3 – Comparison of the expression patterns of three genes selected for validation measured by microarray and qRT-PCR in the three treatments………………….…130
Table 8.1 – Summary of the biomass and nitrogen responses to intra- and inter- cultivar competition…………………………………………………………………………………………………..169

9
Acknowledgements
I would first like to thank my supervisors Rob Brooker, Eric Paterson, Jenny Rowntree,
Francis Brearley and Liz Price for their support and advice though a seemingly unending
number of drafts. Their combination of practical and academic advice provided a solid basis
of support which made my experiments and writing considerably less stressful that it could
have been. I would also like to thank Allan Sim, Jenny Morris and Maira Guzman for their
technical help and advice when I was learning new lab methodologies and practical day to
day support.
I would also like to thank the members of staff from both Manchester Metropolitan
University and the James Hutton Institute who helped with a number of different studies.
Thanks to Clare Trinder and David Robinson for the use of their dataset and advice on the
reanalysis of it. From Manchester Metropolitan University I would like to thank David
Megson for his invaluable help with the stress hormone detection and quantification. At the
James Hutton Institute I would like to thank Tim George and Lionel Dupey for their help with
zymography and Adrian Newton for his advice about barley cultivars. I would also like to
thank Pete Hedley and Joanne Russell for their help with the microarrays and data analysis
in the gene expression study. I would especially like to thank Mark Brewer for his statistical
help and advice in all of the data analysis in the thesis.
Thanks to fellow students Imelda Uwase and Jose van Paassen for their sympathetic
ear and positivity during long hours in the lab. I would also like to thank my friends and Roy
for providing me with much needed relaxation time. Special thanks go to my Mum, Dad, my
brother Will and partner Andrew for their daily support and encouragement, I couldn’t have
done it without you.
For Jack Schofield and Tom Morris who inspired my love of plants.
10
General abstract
The temporal dynamics of key processes are a poorly understood yet potentially important
factor in our understanding of plant coexistence in communities. Plants occupying the same
spatial but differing temporal niches can coexist through niche differentiation, allowing
coexistence in complex ecosystems. This thesis used barley as a model plant to investigate
the temporal dynamics of plant and soil processes associated with nutrient uptake, and
whether such dynamics might promote co-existence in competing plants.
Through a series of lab-based studies I found that competition between barley
cultivars can lead to a shift in the timing of peak nitrogen accumulation rate. However,
estimates of peak nitrogen accumulation rate can be influenced by the experimental design,
software program and statistical model used in these studies. At a molecular level, plant
competition leads to temporally dynamic changes in the concentration of the plant
hormone salicylic acid. There were also changes in gene expression depending on the
identity of a neighbouring plant.
I also explored the temporal dynamics of soil processes associated with plant
nutrient uptake at a pot and root scale. At a pot scale, plant-plant competition did not lead
to a significant shift in the temporal dynamics of soil carbon, nitrogen or microbial biomass.
However, at a single root level, plant-plant competition led to a shift in the timing of peak
activity of soil enzymes associated with nutrient turnover, indicating that the impact of
plants on the soil microbial community might be one component of the mechanisms
allowing temporally dynamic responses of plants to their neighbours.
I also found that the ability to shift the timing of peak nitrogen accumulation rate in
response to plant-plant competition has been conserved in modern cultivars of barley. This
ability can be used in the development of greater complementarity in crop mixtures to
improve crop yield stability.
I demonstrated in this thesis that shifts in the temporal dynamics of plant nitrogen
uptake in response to plant-plant competition involve both plant and soil components and
can be inherited. These results contribute to our understanding of plant-plant competition
dynamics and are applicable to both developing approaches for sustainable agriculture and
for understanding coexistence in plant communities.
11
Chapter 1
Temporal dynamism of resource capture: a missing factor in ecology?
Published as: Schofield E.J., Rowntree J.K., Paterson E., Brooker R.W. (2018) Temporal
Dynamism of Resource Capture: A Missing Factor in Ecology? Trends in Ecology & Evolution,
33(4), 277–286. I carried out the literature review which was then reviewed and edited by
the other authors.
Contents
1.1 - What is temporal dynamism and why is it important?
1.2 - Examples of temporal dynamism in plant communities
1.3 - Why does it matter that temporal dynamism has been overlooked?
1.4 - Why has temporal dynamism in resource capture been overlooked?
1.4.1– Tradition
1.4.2 - Traditional techniques
1.4.3 - Difficulties in measurement
1.5 – Research Questions
1.6 - How to measure short-term temporal dynamism in resource capture and competition?
1.6.1 - Does temporal dynamism in resource capture lead to coexistence?
1.6.2 - How is temporal dynamism in nutrient uptake moderated in response to neighbours?
1.6.3 - How do interactions with soil organisms influence temporal dynamism in resource uptake?
1.6.4 - How does temporal dynamism of resource capture influence plant physiology and morphology?
1.7 - What is the future strategy to study temporal dynamism?
1.8 - Conclusions
12
Abstract
The temporal dynamics of plant resource uptake and the impacts on plant-plant interactions
have important regulatory roles in multi-species communities. By modifying resource
acquisition timing, plants might reduce competition and promote coexistence. But despite
the potential to advance our understanding of community processes, this aspect of plant
community ecology has historically received limited attention. This is partially a
consequence of an historic reliance on measures made at single points in time. However,
due to current technological advances this is a golden opportunity to study within-growing
season temporal dynamism of resource capture by plants. This chapter presents new
technologies that can be used to study this critical aspect of temporal dynamism and help
deliver a vision for future development of this research field.
1.1 - What is temporal dynamism and why is it important?
Understanding plant community composition and functioning are fundamental challenges in
ecology. We have yet to fully understand why specific communities exist at certain points in
space and time, why some communities are more diverse than others, and how diversity
impacts ecosystem function. In plant communities many theories have been proposed to
explain plant coexistence including cyclical disturbance (Grime, 1977; Bongers et al., 2009),
different individual responses to species interactions (Rowntree et al., 2011), multiple
limiting resources (Tilman, 1982; Valladares et al., 2015), intraspecific trait variation
(Mitchell and Bakker, 2014) and facilitative plant-plant interactions, particularly in extreme
environments (Brooker et al., 2007; Butterfield et al., 2013).
However, short-term (i.e. within-growing season) temporal dynamism in resource
acquisition might be central to addressing these fundamental questions. Temporal
dynamism can be described as a form of heterochrony, controlled by intrinsic gene
expression but also influenced by external environmental factors such as climatic conditions
(Geuten and Coenen, 2013). However, apart from in a few cases we rarely consider within-
growing season temporal dynamism in resource acquisition as a topic in its own right, in
part because it has historically proven hard to measure. This is in contrast to our knowledge
of plant phenology about which much is known. Phenological studies have shown the

13
importance of timing in the structure and functioning of plant communities (Tang et al.,
2016). Therefore, there can be expected to be similar important consequences for temporal
dynamism in resource capture.
If different species temporally segregate uptake of common resources to avoid
competition, increased complementarity can promote plant coexistence (Li et al., 2014),
with profound implications for biodiversity-ecosystem function relationships. Importantly,
due to the wealth of analytical approaches now available, now is a good opportunity to
address the historic oversight of within-growing season temporal dynamism.
Before considering these new opportunities, previous studies of temporal dynamism
will be examined and why short-term temporal dynamism has been overlooked to date.
New experimental approaches to address identified knowledge gaps will be presented,
considering the potential influence on other areas of ecology
1.2 - Examples of temporal dynamism in plant communities
Previous research provides clear examples of the importance of temporal dynamism in the
structure and functioning of plant communities. Arguably one of the most well studied
examples is plant-pollinator interaction dynamics, as flowering phenology can lead to
competition or facilitation for pollinators, with inter- and intra- annual dynamics (Kipling and
Warren, 2014; MacLeod et al., 2016). In arid environments temporal dynamism has been
found in the growth response of plants to erratic inputs of water (Thompson and Gilbert,
2014), depending on the timing of the water input in the growing season, and the time since
the previous water input (Schwinning et al., 2004).
Other examples of temporal dynamism in plant communities involve processes
linked to the temporal dynamics of nutrient uptake. One way in which non-native species
can become invasive is by occupying a novel spatial or temporal niche (Wolkovich and
Cleland, 2014). Occupying a novel temporal niche, left vacant by the native plant
community, could allow the invasive species to capture nutrients at a time of reduced
competition from the native community. The link to the temporal dynamics of nutrient
uptake has not yet been proven experimentally but dynamism in resource uptake could
14
have a role in plant invasions. A similar example is the phenology of hemi-parasitic plants.
The lifecycle of hemi-parasites occurs earlier in the growing season than their hosts,
influencing nitrogen cycling with earlier leaf fall than the host community (March and
Watson, 2007; Mudrák et al., 2016). However, this is another case where the link to
temporal dynamism of nutrient uptake has not been fully explored.
Some of the examples above clearly have a link to resource capture. A few
experimental studies have sought to measure this process in more detail. One such example
is that of McKane et al. (2002), who found in an arctic field study that coexisting species
segregated the form of nitrogen, rooting depth and timing of nitrogen uptake in a tundra
plant community. This is thought to lead to coexistence through niche differentiation
reducing competition for key limiting factors. Another example is the Trinder et al. (2012)
paper, which used a series of destructive harvests to examine the temporal dynamics of
nitrogen uptake and biomass accumulation of Dactylis glomerata (Cock’s foot) and Plantago
lanceolata (Ribwort plantain). Trinder et al. found that in response to interspecific
competition both species shifted the timing of the maximum rate of biomass accumulation
and nitrogen uptake by up to 17 days (Trinder et al., 2012). The species diverged the timing
of these resource capture processes, presumably to limit direct competition for resources.
The presence of a range of previous studies looking at temporal dynamism but few
that have been able to specifically address temporal dynamism of resource capture suggests
a technological limitation that has prevented direct studies.
1.3 - Why does it matter that temporal dynamism has been overlooked?
Many of the fundamental processes and properties of many terrestrial communities are
governed by the outcome of plant-plant interactions (Lortie et al., 2004). Temporal
segregation of nutrient uptake could support a high species diversity and have a stabilising
effect on communities (Trinder et al., 2013), at a species (Proulx et al., 2010) and genotypic
level (Fridley et al., 2007), as the community uses a greater proportion of the available
resources (Allan et al., 2011). But despite a huge amount of work on plant-plant
interactions, especially competition, there are still unanswered fundamental questions
about the role of plant interactions in governing plant community composition.
15
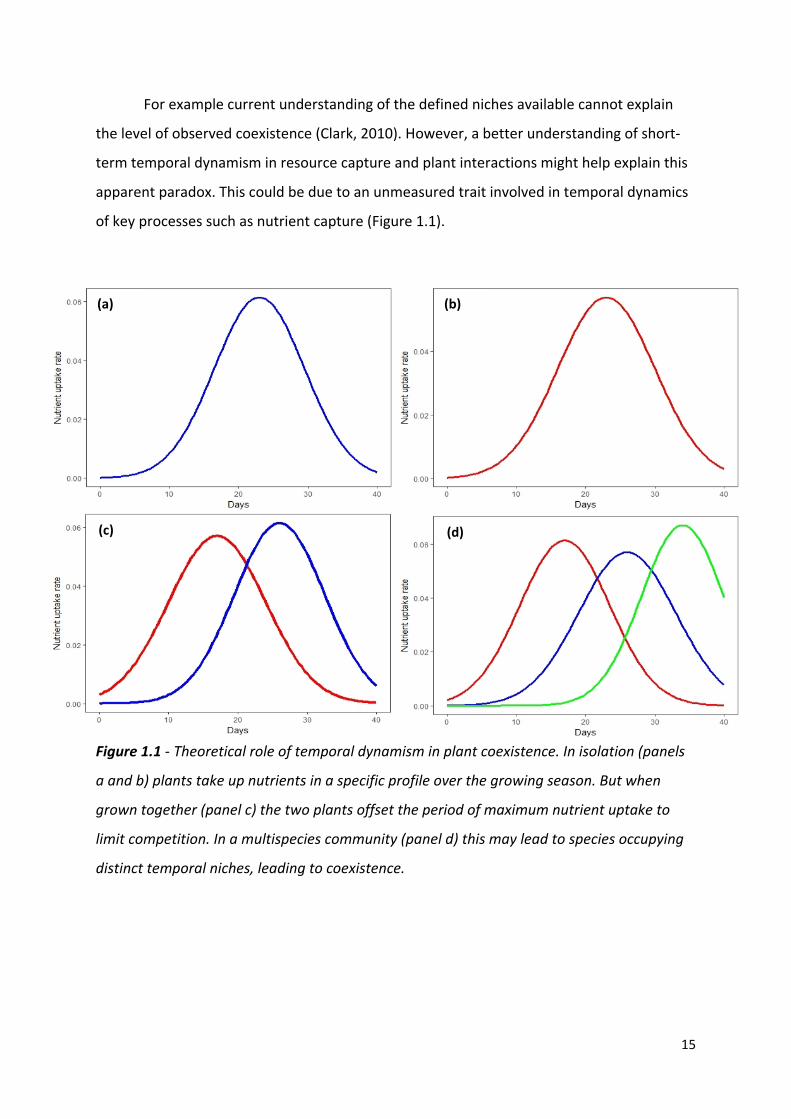
For example current understanding of the defined niches available cannot explain
the level of observed coexistence (Clark, 2010). However, a better understanding of short-
term temporal dynamism in resource capture and plant interactions might help explain this
apparent paradox. This could be due to an unmeasured trait involved in temporal dynamics
of key processes such as nutrient capture (Figure 1.1).
Figure 1.1 - Theoretical role of temporal dynamism in plant coexistence. In isolation (panels
a and b) plants take up nutrients in a specific profile over the growing season. But when
grown together (panel c) the two plants offset the period of maximum nutrient uptake to
limit competition. In a multispecies community (panel d) this may lead to species occupying
distinct temporal niches, leading to coexistence.
(a)
(d) (c)
(b)
16
1.4 - Why has temporal dynamism in resource capture been overlooked?
It is clear that temporal dynamism in plant community processes and interactions can be
critical for regulating community structure and function. However, there is very limited
knowledge about temporal dynamism of plant-plant interactions within a growing season.
Here the reasons for why this oversight might have occurred are considered below.
1.4.1 - Tradition
Plant ecology has traditionally relied on one final biomass measurement to assess the
consequences of plant-plant interactions. Biomass is a relatively cheap and easy measure of
plant responses, making large-scale greenhouse and field studies possible (Trinder et al.,
2013). However, there are some drawbacks to using single time point measurements of
biomass to assess plant-plant interactions, and especially temporal dynamism. First, the
accumulation of biomass is rarely solely influenced by competition alone, due to the
influence of external environmental factors (Trinder et al., 2012). This makes it an unreliable
direct measure of the outcome of competition. Second, many studies use only single
harvests to assess the outcome of plant-plant interactions, which is clearly inappropriate for
measuring short-term temporal dynamism in resource capture. In addition, the precise
timing of biomass harvest and measurement within a growing season can influence the
perceived outcome of the plant interaction, as plants grow and develop at different times
throughout the year (Trinder et al., 2013). The same criticisms can also be made of other
common annual, single time-point measurements, for example flower production and seed
set. To understand the role of temporal dynamism of resource capture in regulating
community dynamics, repeated measures of resource capture are required.
1.4.2 Traditional techniques
Comparatively traditional approaches, for example plant biomass and tissue nutrient
content analysis, can be used to explore issues of temporal dynamism in plant interactions,
so long as they are coupled to multiple harvesting points through time, as used by Trinder et
al. (2012) to examine the temporal dynamics of resource capture in Plantago lanceolata and
17
Dactylis glomerata. However, although the multiple harvest approach is a valuable tool, it is
destructive and requires large-scale, labour intensive studies. It also means that the
subtleties of individual level temporal dynamics of resource capture and competition cannot
be tracked.
1.4.3 - Difficulties in measurement
Single-harvest measurements of biomass might have become the tradition because doing
anything else is difficult. The inclusion in a study of multiple harvests to track temporal
dynamism of resource capture and plant interactions through time will increase the size and
complexity of an experiment, and therefore reduce the complexity of the questions that can
be asked (Allan et al., 2011; Li et al., 2014). Also, multiple harvesting means responses are
averaged over many plants, potentially masking subtle individual responses in resource
capture and growth. Using alternative non-destructive methods instead would allow a single
plant to be studied over time.
Previous studies have looked at temporal dynamism of processes related to resource
capture, with a limited look directly at temporal dynamism of resource capture directly. This
is likely to be due to technological limitations to study resource uptake temporal dynamics
directly such as the use of destructive harvesting. This strengthens the case for the use of
innovative new technologies to give temporal dynamism of resource capture the attention it
deserves.
1.5 – Research questions
A series of questions forming a research agenda is required to advance the study of
temporal dynamism of resource uptake. Initially it needs to be established whether
temporal dynamism in nutrient uptake really leads to a reduction in competition and
promote coexistence. This is the important initial question to form the basis of future
research. The mechanism by which temporal dynamism of nutrient uptake occurs is the
natural follow-up area of investigation, focusing on potential signalling pathways between
neighbouring plants. Also, due to the importance of soil microbes in nutrient mobilisation,

18
the role and influence of the soil community on the temporal dynamics of nutrient uptake
merits further investigation.
This opens up a range of questions about the consequences of temporal dynamism
of resource capture. The influence on the physiology and morphology of the individual is a
clear starting point. However, it is the influence on the wider community that is of greater
interest to a range of ecologists. There are potential impacts on any organism that interacts
with plants including herbivores (vertebrate and invertebrate) and pollinators. This is likely
to ultimately have cascading effects on the whole food chain, influencing the structure and
function of entire ecosystems.
1.6 - How to measure short-term temporal dynamism in resource capture and
competition?
In order to address the identified key research questions, new technological approaches are
required to look at this complex series of processes involved in nutrient capture. This
section will discuss how current technology can be used to study temporal dynamism of
resource capture.
1.6.1 - Does temporal dynamism in resource capture lead to coexistence?
To address this question a method to detect the presence of temporal dynamism is needed.
Destructive harvesting seems like an obvious first choice and could well form the basis of
initial studies of temporal dynamism. However, to study temporal dynamism directly, non-
destructive techniques are likely to be required to examine the multiple steps in the process
of nutrient uptake.
To take up mineral nutrients, plants are reliant on soil biota to drive nutrient cycles
that mobilise organic nutrient stocks into plant-available forms. Increasing evidence
indicates that plants exert significant control over this process, changing rates of soil organic
matter (SOM) mineralisation (de Vries and Caruso, 2016; Laliberté, 2016), primarily through
the impacts of rhizodeposition on microbial process rates (rhizosphere priming effects, RPE
(Kuzyakov, 2010; Mommer et al., 2016)). As rhizodeposition varies with plant development,
19
species and genotype (Chaparro et al., 2013; Bardgett et al., 2014; Mwafulirwa et al., 2016),
there are likely to be important implications of these plant-microbe interactions for the
temporal dynamics of resource capture in mixed plant communities that remain to be
resolved.
In terms of studying components of the system that are related to plant nutrient
availability and acquisition, one method is to study the timing of the rhizosphere priming
effect for plants in competition vs. isolated plants. For example, recalcitrant and labile forms
of nitrogen are mineralised by soil bacteria and fungi (Andrews et al., 2013) and mycorrhizal
fungi provide phosphate to plants (Johri et al., 2015). Stable isotope labelling (15N/13C) of
plants or soil provides a means of quantifying these processes, allowing plant impacts on soil
nutrient cycles to be determined (McKane et al., 1990). This can be done non-destructively
through isotopic partitioning of soil CO2 efflux into plant and SOM-derived components
(Lloyd et al., 2016) or tracing 15N fluxes (derived from labelled organic matter) in soil
solution (Zambrosi et al., 2012; Yang et al., 2013; Studer et al., 2014). This allows the key
processes of soil community priming and nitrogen mobilisation to be measured over time.
1.6.2 - How is temporal dynamism in nutrient uptake moderated in response to neighbours?
Traditionally plant responses to a neighbouring plant have thought to occur when the zones
of nutrient depletion in the soil overlap (Ge et al., 2000). However, as the complexities of
plant-plant communication are revealed (Babikova et al., 2013), it is becoming clear that this
might not be the case. One way to look at dynamic plant responses to a neighbour is
through the use of gene expression markers. The most commonly used method to study
gene expression in response to an external change is RNA sequencing (RNAseq). Studies in
Arabidopsis thaliana have identified that common stress response pathways such as
jasmonate expression are activated in response to a competitor (Masclaux, Bruessow,
Schweizer, Gouhier-Darimont, Keller and Reymond, 2012). However, it is unclear whether
these responses can be translated to other species and more realistic experimental setups.
Despite these uncertainties, the use of molecular markers represents a unique opportunity
to understand competition at a molecular level and the sequence of events that take place
20
within a plant from competitor perception, to changes in the temporal dynamics of resource
capture.
1.6.3 - How do interactions with soil organisms influence temporal dynamism in resource
uptake?
The soil microbial community is known to be temporally dynamic, varying with season, plant
species and plant developmental stage (Lortie et al., 2004). Molecular techniques such as
sequencing the 16S ribosomal RNA extracted from rhizosphere soil samples taken over a
time series can provide a view of how the active microbial community changes. Shi et al.
(2016) took this approach further and produced a network of microbial diversity over a
growing season, showing how plants promote a beneficial rhizosphere, compared to the
bulk soil (Shi et al., 2016). This approach provides a view of dynamic interactions between
plants and the soil microbial community, allowing the tracking of soil community activity
and associated nutrient availability over time.
Another exciting development integrating the spatial dynamism of the soil
community activity over a growing season is zymography. This approach focusses on specific
functions of the soil community such as cellulase and chitinase activity (Spohn and
Kuzyakov, 2014) and has already been used to identify ‘hot moments’ when microbial
activity is higher than normal levels (Kuzyakov and Blagodatskaya, 2015). Such ‘moments’
can be occasional or occur periodically with events like spring growth and autumn leaf fall
(Philippot et al., 2009). Soil zymography can be used to identify the areas of the plant root
system where temporal dynamics of nutrient acquisition is most important (Spohn and
Kuzyakov, 2014). This allows not just the soil community structure but also its activity to be
tracked over time and linked to plant nutrient uptake dynamics.
21
1.6.4 - How does temporal dynamism of resource capture influence plant physiology and
morphology?
Temporal dynamism of nutrient capture is likely to influence the physiology and morphology
of roots as they are directly involved in nutrient uptake. This could involve changes in root
foraging behaviour and root architecture in response to a neighbouring plant.
To study root growth and foraging activity over time, one approach is the use of
microrhizotrons. These are small cameras inserted into the soil to record root foraging
behaviour and are particularly useful to look at fine root development (McCormack et al.,
2015; Warren et al., 2015). However, they are limited as they do not give a view of the
whole root system. Instead whole root system growth dynamics can be studied using plants
grown in Perspex boxes and photographed using high definition cameras for phenomic
analysis in automated root phenotyping facilities (Marshall et al., 2016). This allows for a
root system to be studied in-situ, as well as dynamic root architecture changes and root
foraging to be tracked over time. As seen in arid environments root architecture traits can
be vital for temporal dynamism studies. Therefore, techniques such as these will allow
studies of temporal dynamism of nutrient uptake to include the dynamics of root growth.
For a more detailed 3D view of root architecture, X—ray CT scanning can be used to
visualise plant roots grown in pots. The development of specialist root tracking software and
facilities will allow much larger and more complex experiments to be carried out into
dynamic competition for soil resources between the roots of multiple individuals. This
approach has already been used to study root growth in response to competition between
Populus tremuloides (quaking aspen) and Picea mariana (black spruce) seedlings. Both
species increased rooting depth and altered root architecture in response to a competitor
(Dutilleul et al., 2015). Using this approach with a time series of successive scans will allow
us to see a 3D view of the dynamism of root growth, and the traits of dynamic root
placement to be viewed with high temporal resolution.
22
1.7 - What is the future strategy to study temporal dynamism?
Temporal dynamism could be a vital mechanism by which plants coexist in complex
communities. There is now an ideal opportunity to understand the within-growing season
temporal dynamics of resource capture as part of broader ecological system dynamics. As
nutrient acquisition is a series of distinct, but interconnected processes, an integrated
approach is required (Harris, 1967). A vast amount of knowledge can be gained about
temporal dynamism in resource uptake from using these cutting edge technologies.
The ultimate goal in this field of research should be to integrate temporal dynamism
as a factor in existing niche models, to define new niche space and aid the explanation of
coexistence in complex communities. This approach can then be applied to other temporally
dynamic processes, answering other fundamental questions about ecosystem functioning.
1.8 - Conclusions
Now is an ideal time to study and integrate within-growing season temporal dynamism into
our understanding of coexistence. To achieve this, a clear research framework and the use
of cutting-edge technology to study the individual stages of resource capture are required.
This chapter has presented a clear set of questions that need to be answered in order to
understand the mechanism and consequences of temporal dynamism in nutrient uptake.
Although studying temporally dynamism of resource capture is not going to be straight
forward, the potential benefit to our understanding of ecosystem functioning is likely to be
considerable. Lessons learnt by studying the temporal dynamics of resource capture can
then be applied to study other temporally dynamic ecological processes.
This thesis will use barley (Hordeum vulgare) as a model plant to investigate the
effect of plant-plant competition on the temporal dynamics of resource capture. The use of
barley allows the results of this thesis to be of relevance to both sustainable agriculture,
specifically plant mixtures, as well as grassland ecology as barley is a grass species. It also
allows molecular approaches to be used to study intracellular processes associated with
nutrient uptake temporal dynamism, such as gene expression. Genetic approaches are often
23
not possible in wild grass species, as many do not have reference genomes available.
Therefore, the use of barley allows these types of analyses to be carried out.
This thesis will initially take a successive harvest approach similar to Trinder et al.
(2012), using barley as a model plant, specifically two cultivars (Proctor and Tammi) grown
in isolation, inter- and intra- cultivar competition (Chapter 2). The potential influence of the
statistical model design and software used to analyse the temporal datasets in these types
of studies will then be assessed (Chapter 3). This will then be followed up by two studies of
soil processes, the first at a pot level studying the effect of plant competition on the
temporal dynamics of soil processes including soil respiration and soil nitrogen dynamics
(Chapter 4). Then a second at a single root level to study the effect of plant-plant
interactions on the dynamics of the soil microbial community activity using zymography
(Chapter 5). This chapter will use two enzyme classes to examine the effect of plant-plant
competition on soil organic matter turnover and nitrogen cycling dynamics.
The gene expression patterns of barley in inter- and intra- cultivar competition will
be examined in Chapter 6. Microarrays will be used to identify genes up- and down-
regulated in response to competition and differences in expression between inter- and
intra- cultivar competition. The plant stress hormone production associated with plant-plant
competition will be characterised in Chapter 7 using two plant hormones associated with
abiotic and biotic stress, jasmonic acid and salicylic acid. The relative concentrations in roots
will be used to assess the molecular response to plant-plant competition.
Descendants of the original cultivars will then be used to investigate whether the
descendants of Proctor, a cultivar first introduced in 1955, have inherited a temporally
dynamic response to competition for resources (Chapter 8). The same successive harvesting
approach as Chapter 2 and statistical analysis from Chapter 3 will be used for this study.
References
Allan, E., Weisser, W., Weigelt, A., Roscher, C., Fischer, M. and Hillebrand, H. (2011) More
diverse plant communities have higher functioning over time due to turnover in
24
complementary dominant species. Proceedings of the National Academy of Sciences of the
United States of America, 108(41), 17034–9.
Andersen, M. K., Hauggaard-Nielsen, H., Weiner, J. and Jensen, E. S. (2007) Competitive
dynamics in two- and three-component intercrops. Journal of Applied Ecology, 44(3), 545–
551.
Andrews, M., Raven, J. A. and Lea, P. J. (2013) Do plants need nitrate? The mechanisms by
which nitrogen form affects plants. Annals of Applied Biology, 163(2) 174–199.
Babikova, Z., Gilbert, L., Bruce, T. J. A., Birkett, M., Caulfield, J. C., Woodcock, C., Pickett, J. A.
and Johnson, D. (2013) Underground signals carried through common mycelial networks
warn neighbouring plants of aphid attack. Ecology letters, 16(7) 835–43.
Bardgett, R. D., Mommer, L. and De Vries, F. T. (2014) Going underground: root traits as
drivers of ecosystem processes. Trends in Ecology & Evolution, 29(12), 692–9.
Bongers, F., Poorter, L., Hawthorne, W. D. and Sheil, D. (2009) The intermediate disturbance
hypothesis applies to tropical forests, but disturbance contributes little to tree diversity.
Ecology letters, 12(8), 798–805.
Brooker, R. W., Maestre, F. T., Callaway, R. M., Lortie, C. L., Cavieres, L. A., Kunstler, G.,
Liancourt, Pi. P., Tielbörger, K., Travis, J. M. J., Anthelme, F., Armas, C., Coll, L., Corcket, E.,
Delzon, S., Forey, E., Kikvidze, Z., Olofsson, J., Pugnaire, F. F., Quiroz, C. L., Saccone, P.,
Schiffers, K., Seifan, M., Touzard, B., Michalet, R., Tielborger, K., Travis, J. M. J., Anthelme, F.,
Armas, C., Coll, L., Corcket, E., Delzon, S., FOREY, E., Kikvidze, Z., Olofsson, J., Pugnaire, F. F.,
Quiroz, C. L., Saccone, P., Schiffers, K., Seifan, M., Touzard, B. and Michalet, R. (2007)
Facilitation in plant communities: the past, the present, and the future. Journal of Ecology,
96(0), 18–34.
Butterfield, B. J., Cavieres, L. A., Callaway, R. M., Cook, B. J., Kikvidze, Z., Lortie, C. J.,
Michalet, R., Pugnaire, F. I., Schöb, C., Xiao, S., Zaitchek, B., Anthelme, F., Björk, R. G.,
Dickinson, K., Gavilán, R., Kanka, R., Maalouf, J.-P., Noroozi, J., Parajuli, R., Phoenix, G. K.,
Reid, A., Ridenour, W., Rixen, C., Wipf, S., Zhao, L. and Brooker, R. W. (2013) Alpine cushion
plants inhibit the loss of phylogenetic diversity in severe environments. Ecology letters,
16(4), 478–86.
25
Chaparro, J. M., Badri, D. V., Bakker, M. G., Sugiyama, A., Manter, D. K. and Vivanco, J. M.
(2013) Root exudation of phytochemicals in Arabidopsis follows specific patterns that are
developmentally programmed and correlate with soil microbial functions. PLoS ONE, 8(2),
e55731.
Clark, J. S. (2010) Individuals and the Variation Needed for High Species Diversity in Forest
Trees. Science, 327(5969) 1129–1132.
Dutilleul, P., Wegner, L. H., Jones, K., Bauerle, T. L., Paya, A. M., Silverberg, J. L. and Padgett,
J. (2015) X-ray computed tomography uncovers root–root interactions: quantifying spatial
relationships between interacting root systems in three dimensions. Frontiers in Plant
Science, 6, 274.
Fridley, J. D., Grime, J. P. and Bilton, M. (2007) Genetic identity of interspecific neighbours
mediates plant responses to competition and environmental variation in a species-rich
grassland. Journal of Ecology, 95(5), 908–915.
Ge, Z., Rubio, G. and Lynch, J. P. (2000) The importance of root gravitropism for inter-root
competition and phosphorus acquisition efficiency: results from a geometric simulation
model. Plant and Soil, 218(1–2), 159–71.
Geuten, K. and Coenen, H. (2013) Heterochronic genes in plant evolution and development.
Frontiers in Plant Science, 4, 381.
Grime, J. P. (1977) Evidence for the Existence of Three Primary Strategies in Plants and Its
Relevance to Ecological and Evolutionary Theory on JSTOR. The American Naturalist,
111(982), 1169–1194.
Harris, G. A. (1967) Some Competitive Relationships between Agropyron spicatum and
Bromus tectorum. Ecological Monographs, 37(2), 89–111.
Johri, A. K., Oelmüller, R., Dua, M., Yadav, V., Kumar, M., Tuteja, N., Varma, A., Bonfante, P.,
Persson, B. L. and Stroud, R. M. (2015) Fungal association and utilization of phosphate by
plants: success, limitations, and future prospects. Frontiers in microbiology, 6, 984.
Kipling, R. P. and Warren, J. (2014) An investigation of temporal flowering segregation in
species-rich grasslands. Ecological Research, 29(2), 213–224.
26
Kuzyakov, Y. (2010) Priming effects: Interactions between living and dead organic matter.
Soil Biology and Biochemistry, 42(9), 1363–1371.
Kuzyakov, Y. and Blagodatskaya, E. (2015) Microbial hotspots and hot moments in soil:
Concept & review. Soil Biology and Biochemistry, 83, 184-199.
Laliberté, E. (2016) Below-ground frontiers in trait-based plant ecology. New Phytologist,
213(4), 1597–1603.
Li, C., Dong, Y., Li, H., Shen, J. and Zhang, F. (2014) The dynamic process of interspecific
interactions of competitive nitrogen capture between intercropped wheat (Triticum
aestivum L.) and Faba Bean (Vicia faba L.). PloS one, 9(12) p. e0119659.
Lloyd, D. A., Ritz, K., Paterson, E. and Kirk, G. J. D. (2016) Effects of soil type and composition
of rhizodeposits on rhizosphere priming phenomena. Soil Biology and Biochemistry, 103,
512–521.
Lortie, C. J., Brooker, R. W., Choler, P., Kikvidze, Z., Michalet, R., Pugnaire, F. I. and Callaway,
R. M. (2004) Rethinking plant community theory. Oikos, 107(2), 433–438.
MacLeod, M., Genung, M. A., Ascher, J. S. and Winfree, R. (2016) Measuring partner choice
in plant-pollinator networks: using null models to separate rewiring and fidelity from
chance. Ecology, 97(11), 2925–2931.
March, W. A. and Watson, D. M. (2007) Parasites boost productivity: effects of mistletoe on
litterfall dynamics in a temperate Australian forest. Oecologia, 154(2), 339–347.
Marshall, A. H., Collins, R. P., Humphreys, M. W. and Scullion, J. (2016) A new emphasis on
root traits for perennial grass and legume varieties with environmental and ecological
benefits. Food and energy security, 5(1), 26–39.
Masclaux, F. G., Bruessow, F., Schweizer, F., Gouhier-Darimont, C., Keller, L. and Reymond,
P. (2012) Transcriptome analysis of intraspecific competition in Arabidopsis thaliana reveals
organ-specific signatures related to nutrient acquisition and general stress response
pathways. BMC plant biology, 12, 227.
McCormack, M. L., Dickie, I. A., Eissenstat, D. M., Fahey, T. J., Fernandez, C. W., Guo, D.,
Helmisaari, H. S., Hobbie, E. A., Iversen, C. M., Jackson, R. B., Lammi-Kujansuu, J., Norby, R.
27
J., Phillips, R. P., Pregitzer, K. S., Pritchard, S. G., Rewald, B. and Zadworny, M. (2015)
Redefining fine roots improves understanding of below-ground contributions to terrestrial
biosphere processes. New Phytologist, 207(3), 505–518.
McKane, R. B., Grigal, D. F. and Russelle, M. P. (1990) Spatiotemporal Differences in 15N
Uptake and the Organization of an Old-Field Plant Community. Ecology, 71(3), 1126–1132.
McKane, R. B., Johnson, L. C., Shaver, G. R., Nadelhoffer, K. J., Rastetter, E. B., Fry, B., Giblin,
A. E., Kielland, K., Kwlatkowski, B. L., Laundre, J. A. and Murray, G. (2002) Resource-based
niches provide a basis for plant species diversity and dominance in arctic tundra. Nature,,
415(6867), 68–71.
Mitchell, R. M. and Bakker, J. D. (2014) Quantifying and comparing intraspecific functional
trait variability: a case study with Hypochaeris radicata. Functional Ecology, 28(1), 258–269.
Mommer, L., Kirkegaard, J. and van Ruijven, J. (2016) Root-Root Interactions: Towards A
Rhizosphere Framework. Trends in Plant Science, 21(3), 209–217.
Mudrák, O., de Bello, F., Doležal, J. and Lepš, J. (2016) Changes in the functional trait
composition and diversity of meadow communities induced by Rhinanthus minor L. Folia
Geobotanica, 51, 1–11.
Mwafulirwa, L., Baggs, E. M., Russell, J., George, T., Morley, N., Sim, A., de la Fuente Cantó,
C. and Paterson, E. (2016) Barley genotype influences stabilization of rhizodeposition-
derived C and soil organic matter mineralization. Soil Biology and Biochemistry, 95, 60–69.
Philippot, L., Hallin, S., Börjesson, G. and Baggs, E. M. (2009) Biochemical cycling in the
rhizosphere having an impact on global change. Plant and Soil, 321(1-2), 61–81.
Proulx, R., Wirth, C., Voigt, W., Weigelt, A., Roscher, C., Attinger, S., Baade, J., Barnard, R. L.,
Buchmann, N., Buscot, F., Eisenhauer, N., Fischer, M., Gleixner, G., Halle, S., Hildebrandt, A.,
Kowalski, E., Kuu, A., Lange, M., Milcu, A., Niklaus, P. A., Oelmann, Y., Rosenkranz, S., Sabais,
A., Scherber, C., Scherer-Lorenzen, M., Scheu, S., Schulze, E. D., Schumacher, J.,
Schwichtenberg, G., Soussana, J. F., Temperton, V. M., Weisser, W. W., Wilcke, W. and
Schmid, B. (2010) Diversity promotes temporal stability across levels of ecosystem
organization in experimental grasslands. PLoS ONE, 5(10), 1–8.
28
Rowntree, J. K., Cameron, D. D. and Preziosi, R. F. (2011) Genetic variation changes the
interactions between the parasitic plant-ecosystem engineer Rhinanthus and its hosts.
Philosophical Transactions of the Royal Society B: Biological Sciences, 366, 1380–1388.
Schwinning, S., Sala, O. E., Loik, M. E. and Ehleringer, J. R. (2004) Thresholds, memory, and
seasonality: Understanding pulse dynamics in arid/semi-arid ecosystems. Oecologia, 141(2),
191–193.
Shi, S., Nuccio, E. E., Shi, Z. J., He, Z., Zhou, J. and Firestone, M. K. (2016) The interconnected
rhizosphere: High network complexity dominates rhizosphere assemblages. Ecology letters,
19(8), 926–936.
Spohn, M. and Kuzyakov, Y. (2014) Spatial and temporal dynamics of hotspots of enzyme
activity in soil as affected by living and dead roots-a soil zymography analysis. Plant and Soil,
379(1–2), 67–77.
Studer, M. S., Siegwolf, R. T. W. and Abiven, S. (2014) Carbon transfer, partitioning and
residence time in the plant-soil system: a comparison of two 13CO2 labelling techniques.
Biogeosciences, 11(6), 1637–1648.
Tang, J., Körner, C., Muraoka, H., Piao, S., Shen, M., Thackeray, S. J. and Yang, X. (2016)
‘Special Feature : International LTER Emerging opportunities and challenges in phenology : a
review.’ Ecosphere, 7, 1–17.
Thompson, K. and Gilbert, F. (2014) Spatiotemporal variation in the endangered Thymus
decussatus in a hyper-arid environment. Journal of Plant Ecology, 8(1), 79–90.
Tilman, D. (1982) Resource Competition and Community Structure. Princeton University
Press, New Jersey, USA.
Trinder, C., Brooker, R., Davidson, H. and Robinson, D. (2012) Dynamic trajectories of growth
and nitrogen capture by competing plants. New Phytologist, 193(4), 948–958.
Trinder, C. J., Brooker, R. W. and Robinson, D. (2013) Plant ecology’s guilty little secret:
Understanding the dynamics of plant competition. Functional Ecology, 27(4), 918–929.
Valladares, F., Bastias, C. C., Godoy, O., Granda, E. and Escudero, A. (2015) Species
coexistence in a changing world. Frontiers in Plant Science, 6, 1–16.
29
de Vries, F. T. and Caruso, T. (2016) Eating from the same plate? Revisiting the role of labile
carbon inputs in the soil food web. Soil Biology and Biochemistry, 102, 4–9.
Warren, J. M., Hanson, P. J., Iversen, C. M., Kumar, J., Walker, A. P. and Wullschleger, S. D.
(2015) Root structural and functional dynamics in terrestrial biosphere models - evaluation
and recommendations. New Phytologist, 205(1), 59–78.
Wolkovich, E. M. and Cleland, E. E. (2014) Phenological niches and the future of invaded
ecosystems with climate change. AoB PLANTS, 6, 1–16.
Yang, H., Yu, Z., Zhang, Q., Tang, J. and Chen, X. (2013) Plant neighbor effects mediated by
rhizosphere factors along a simulated aridity gradient. Plant and Soil, 369(1–2), 165–176.
Zambrosi, F. C. B., Mattos, D., Boaretto, R. M., Quaggio, J. A., Muraoka, T. and Syvertsen, J.
P. (2012) Contribution of phosphorus (32P) absorption and remobilization for citrus growth.
Plant and Soil, 355(1–2), 353–362.
30
Chapter 2
Cultivar differences and impact of plant-plant competition on temporal
patterns of nitrogen and biomass accumulation
Published as: Schofield E.J., Rowntree J.K., Paterson E., Brewer M.J., Price E.A.C., Brearley
F.Q., Brooker R.W. (2019) Cultivar differences and impact of plant-plant competition on
temporal patterns of nitrogen and biomass accumulation. Frontiers in Plant Science, 10, 215.
I conceived the experimental design, collected and analysed the data, and wrote the
manuscript.
Contents
2.1 - Introduction
2.2 - Materials and Methods
2.2.1 - Temporal patterns of nitrogen and biomass accumulation
2.2.2 - Soil characteristics
2.2.3 - Setup and growing conditions
2.2.4 - Sequential harvesting
2.2.5 - Data analysis
2.2.5.1 - Temporal patterns of nitrogen and biomass accumulation
2.2.5.2 - Shoot C:N
2.2.6 - Neighbour effects
2.3 - Results
2.3.1 - Temporal dynamics of nitrogen uptake
2.3.2 - Maximum accumulated shoot nitrogen
2.3.3 - Temporal dynamics of biomass accumulation
2.3.4 - Maximum accumulated total plant biomass
2.3.5 - Shoot C:N
2.3.6 - Neighbour effects
31
2.4 - Discussion
2.4.1 - Shifts in the timing of biomass accumulation in response to competition
2.4.2 - Shifts in the timing of nitrogen accumulation in response to competition
2.4.3 -Temporal segregation of nitrogen and biomass accumulation
2.4.4 - Impact of competition on final nitrogen and biomass accumulation
2.4.5 - Shoot C:N in response to identity of a competing individual
2.4.6 - Is greater complementarity achieved?
2.5 – Conclusions
Abstract
Current niche models cannot explain multi-species plant coexistence in complex
ecosystems. One explanatory factor is within-growing season temporal dynamism of
resource capture by plants. However, the timing and rate of resource capture are
themselves likely to be mediated by plant-plant competition. This study used barley
(Hordeum vulgare) as a model species to examine the impacts of intra-specific competition,
specifically inter- and intra-cultivar competition on the temporal dynamics of resource
capture. Nitrogen and biomass accumulation of an early and late cultivar grown in isolation,
inter- or intra- cultivar competition were investigated using sequential harvests. I did not
find changes in the temporal dynamics of biomass accumulation in response to competition.
However, peak nitrogen accumulation rate was significantly delayed for the late cultivar by
14.5 days and advanced in the early cultivar by 0.5 days when in intra-cultivar competition;
there were no significant changes when in inter-cultivar competition. This may suggest a
form of kin recognition as the target plants appeared to identify their neighbours and only
responded temporally to intra-cultivar competition. The Relative Intensity Index found
competition occurred in both the intra- and inter- cultivar mixtures, but a positive Land
Equivalence Ratio value indicated complementarity in the inter-cultivar mixtures compared
to intra-cultivar mixtures. The reason for this is unclear but may be due to the timing of the
final harvest and may not be representative of the relationship between the competing
plants. This study demonstrates neighbour-identity-specific changes in temporal dynamism
in nutrient uptake. This contributes to our fundamental understanding of plant nutrient
32
dynamics and plant-plant competition whilst having relevance to sustainable agriculture.
Improved understanding of within-growing season temporal dynamism would also improve
our understanding of coexistence in complex plant communities.
2.1 - Introduction
Niche differentiation is suggested to lead to coexistence of plants by reducing competition,
either for a specific form of a resource or simultaneous demand for the same resource
(Silvertown, 2004). However, in complex plant communities such as rain forests and
grasslands there are seemingly insufficient niches to explain coexistence of the many
species present. Plants seem to occupy the same niche dimensions but without it leading to
competitive exclusion (Clark, 2010).
One factor which is often not included in niche models is time, more specifically the
temporal dynamism of key developmental and physiological processes such as resource
capture (Schofield et al., 2018). Competition can be influenced by temporally dynamic
physiological processes (Poorter et al., 2013), such as flowering (Kipling and Warren, 2014)
and nutrient uptake (Jaeger et al., 1999). Differences in the temporal dynamics of nutrient
capture could reduce temporal niche overlap, reducing competition for resources. This
could result in increased complementarity and promote coexistence (Ashton et al., 2010).
As well as temporal dynamism influencing competition, competition can influence
the temporal dynamics of resource capture, although the extent to which these processes
affect each other is unclear. As there are many aspects of temporal dynamism in plant
communities that are not fully understood, temporal dynamism in resource capture may be
currently unsuitable as an indicator of plant-plant competition. However, a change in the
temporal dynamics of resource capture may be a wider consequence of competition or a
mechanism by which plants avoid direct competition for resources. Trinder et al. (2012)
found a change in the temporal dynamics of nitrogen and biomass accumulation in response
to inter-specific plant-plant competition. But the impact of competition on temporal
dynamism in resource capture, and how this could influence coexistence in plant
communities, remains largely unexplored (Schofield et al., 2018).
33
There is in particular a lack of information on the relationship between temporal
dynamism and intra-specific competition, and how the degree of relatedness of competitors
might influence temporal dynamism. The genetic distance between competing individuals
can influence the functional plasticity of an individual response to competition (G. P.
Murphy et al., 2017), including biomass allocation and root morphology (Semchenko et al.,
2017). Differential competitive responses have been demonstrated between closely related
individuals (G. P. Murphy et al., 2017), including in a number of crop species (Dudley and
File, 2007). The use of two cultivars in this study allows a tight control of the relatedness of
individuals, which in turn allows us to address how diversity regulates interactions and
ultimately functions in a range of systems (not least for the development of sustainable
agricultural practice (Schöb et al., 2018)). In this sense, crop species are ideal model systems
for undertaking such studies.
Here, I conducted a pot experiment with barley (Hordeum vulgare) as a model
species, using an early and a late cultivar. Barley is a suitable model in this case as its
nutrient uptake has been studied in detail to optimise the timing of fertiliser application in
agriculture (Nielsen and Jensen, 1986), allowing us to address fundamental ecological
questions of plant coexistence, as well as investigating a topic of relevance for agricultural
practices.
It is expected that early and late cultivars of barley will have different temporal
dynamics of nitrogen uptake and biomass accumulation, in a similar way to two species or
genotypes in a natural system. The two cultivars in this study have been bred for different
uses and therefore will have differing combinations of traits. Tammi has been bred for an
early lifecycle (Nitcher et al., 2013), whereas Proctor was bred for malting quality (Hornsey,
2003). The nitrogen uptake and biomass accumulation dynamics are predicted to be altered
by plant-plant competition, and this will be more pronounced in intra-cultivar compared to
inter-cultivar competition as the individuals will more completely occupy the same niche
space.
This study aimed to understand: (1) whether early and late cultivars of barley exhibit
temporal dynamics in nitrogen uptake and biomass, (2) how plant-plant competition
changes the temporal dynamics of nitrogen and biomass accumulation in early and late
34
barley cultivars, (3) how any temporally dynamic response differs with inter- and intra-
cultivar competition, and ultimately (4) how this impacts on niche complementarity.
2.2 – Materials and methods
2.2.1 - Temporal patterns of nitrogen and biomass accumulation
A pot-based competition study was used to investigate temporal dynamism in nitrogen
uptake, using barley (Hordeum vulgare) as a model species. An early (Tammi: T) and late
(Proctor: P) cultivar of barley (sourced from The James Hutton Institute, Dundee, Scotland)
were chosen as they have similar height and limited tillering, enabling the study to focus on
phenological rather than physiological differences. Each cultivar was grown in pots either in
isolation, or with another individual of either the same or other cultivar (i.e. T, P, TT, PP, TP).
2.2.2 - Soil characteristics
Soil was sourced from an agricultural field (Balruddery Farm, Invergowrie, Scotland,
56.4837° N, 3.1314° W) that had previously contained spring barley (Hordeum vulgare) and
had been subject to standard management for barley production (including fertiliser
addition at a rate of 500 kg of 22N-4P-14K ha-1 yr-1). The soil had an organic matter content
(humus) of 6.2% ± 0.3% SEM (loss-on-ignition, n = 4) and a mean pH (in water) of 5.7 ±0.02
SEM (n = 4), a total inorganic nitrogen concentration of 1.55 ± 0.46 mg g-1 (n = 4) and
microbial C biomass (using a chloroform extraction) of 0.06 ± 0.002 SEM mg g-1 (n = 4)
(analysed by Konelab Aqua 20 Discrete Analyser (Thermo Scientific, Waltham, MA USA)).
The soil was passed through a 6 mm sieve and then stored at room temperature until use.
No fertilization of the soil occurred during the experiment.
2.2.3 - Setup and growing conditions
Seeds of both cultivars were germinated in the dark on damp paper towels and planted into
cylindrical 2 L pots (diameter 152 mm, height 135 mm) with five replicate pots of each of
the five treatments for each planned harvest (11 harvests in total), giving a total of 275 pots.
35
The pots were randomized to account for potential positional effects and grown in
controlled environment rooms (Conviron, Isleham, UK) at a constant 15°C with an 8/16
(day/night) hour photoperiod (irradiance of 100 - 150 µmol m-2 s-1) and 65% relative
humidity, to mimic local spring-time conditions. The pots were watered twice weekly and
the soil was kept moist to avoid competition for water. Mesh screens (45 x 16 cm, mesh size
0.08 mm (Harrod Horticulture, Lowestoft, UK)) were inserted in those pots containing two
plants to separate the plants above ground, and ensure competitive interactions only
occurred below ground. Foliage was relatively upright without support and the presence of
a screen – although important in ensuring above-ground competition was minimised – was
unlikely to have resulted in differences in shoot development in pots with two plants
compared to one.
2.2.4 - Sequential harvesting
Five randomly selected pots of each treatment were harvested every five days until ear
formation (when grain begins to form) was observed on the early Tammi cultivar (60 days).
During this period both cultivars produced flag leaves, the stage prior to grain production,
when most nitrogen has already been absorbed (Spink et al., 2015). This covered the period
most likely to contain the peak nitrogen and biomass accumulation rate for both cultivars,
the focus of this study. The plants were then removed from the pots, the roots washed, and
individual shoot and root material separated. The root and shoot material of each plant
were dried at 30°C until a stable weight was reached and weighed. Milled shoot samples
were analysed for carbon and nitrogen concentration (Flash EA 1112 Series, Thermo
Scientific, Bremen, Germany).
2.2.5 - Data analysis
2.2.5.1 - Temporal patterns of nitrogen and biomass accumulation
To analyse temporal changes in biomass and nitrogen accumulation, the rate of each was
modelled with logistic growth curves using non-linear least squares (nls) models (R Core
Team, 2015). A cumulative time series data set of biomass accumulation was bootstrapped
36
using resampling with replacement 1000 times to estimate variability and confidence
intervals. A logistic growth curve was used as the nls model and this was fitted to each of
the bootstrapped data sets to produce a set of logistic instantaneous uptake rate curves for
each treatment, as well as sets of modelled maximum accumulation values. This was then
repeated for the nitrogen accumulation data set. A non-linear model was used as the
growth dynamics of plants with determinate growth such as barley (Yin et al., 2003) are
mostly sigmoidal, making a linear growth model unsuitable (Robinson et al., 2010).
Therefore, the use of the non-linear least squares model with bootstrapping is a robust
method to examine the temporal dynamism of resource capture of annual species and to
properly account for uncertainty. Significant differences between the timing of peak
accumulation and final maximum accumulation between treatments were determined from
the difference in bootstrapped 95 % confidence intervals of the model outputs (Appendix 1,
Supplementary R Code 1).
2.2.5.2 - Shoot C:N
C:N ratio at the final harvest (65 days after planting) was analysed using an ANOVA test from
the MASS package in R (R Statistical Software, R Core Team, 2016) as the residuals were
normally distributed, with treatment as the fixed factor and C:N as the response variable
(Appendix 1, Supplementary R Code 2). A Tukey post-hoc test was carried out to compare
the individual treatment groups.
2.2.6 - Neighbour effects
The effect of a neighbouring plant on a target plant’s biomass was quantified using the
Relative Intensity Index (RII; Equation 1), an index that accounts for both competitive and
facilitative interactions between neighbouring plants (Díaz-Sierra et al., 2017). RII was
calculated using the final harvest biomass data. For each cultivar, RII was calculated
separately for plants grown in intra- and inter- specific competition. The mean total biomass
of each cultivar grown in isolation was used for the Isolation value, and the individual RII
value was then calculated for each plant of that cultivar experiencing competition.

37
Equation 1
𝑅𝑅𝑅𝑅𝑅𝑅 = (𝐶𝐶𝐶𝐶𝐶𝐶𝐶𝐶𝐶𝐶𝐶𝐶𝐶𝐶𝐶𝐶𝐶𝐶𝐶𝐶𝐶𝐶 – 𝑅𝑅𝐼𝐼𝐶𝐶𝐼𝐼𝐼𝐼𝐶𝐶𝐶𝐶𝐶𝐶𝐶𝐶)
(𝐶𝐶𝐶𝐶𝐶𝐶𝐶𝐶𝐶𝐶𝐶𝐶𝐶𝐶𝐶𝐶𝐶𝐶𝐶𝐶𝐶𝐶 + 𝑅𝑅𝐼𝐼𝐶𝐶𝐼𝐼𝐼𝐼𝐶𝐶𝐶𝐶𝐶𝐶𝐶𝐶)
Competition = Mean biomass of plant when in competition, Isolation = Mean biomass of
plant in isolation.
The land equivalent ratio (LER; Equation 2) was used to determine if the inter-
cultivar mixture (TP) overyielded when compared to intra-cultivar competition (TT or PP)
(Mead and Willey, 1980). The mean LER value was calculated by randomly pairing inter- and
intra- cultivar competition treatments using a random number generator. A LER value was
calculated for each pairing, from which a mean and standard error of the mean was
calculated. A mean LER value above 1 indicates that inter-cultivar pairings produced more
biomass than to intra-cultivar combinations. As the residuals were normally distributed, the
LER and RII values were compared between competition treatments using an ANOVA test as
above, with treatment as the fixed factor and either LER or RII as the response variable
(Supplementary R Code 2).
Equation 2
𝐿𝐿𝐿𝐿𝑅𝑅 = 𝑇𝑇𝐼𝐼𝐶𝐶𝐶𝐶𝐶𝐶 𝐶𝐶𝐶𝐶𝑚𝑚𝐶𝐶𝑚𝑚𝑚𝑚𝐶𝐶 𝑏𝑏𝐶𝐶𝐶𝐶𝐶𝐶𝐼𝐼𝐼𝐼𝐼𝐼
𝑇𝑇𝐼𝐼𝐶𝐶𝐶𝐶𝐶𝐶 𝐶𝐶𝑜𝑜𝐶𝐶 𝑐𝑐𝑚𝑚𝐼𝐼𝐶𝐶𝐶𝐶𝑐𝑐𝐼𝐼𝑚𝑚 𝑏𝑏𝐶𝐶𝐶𝐶𝐶𝐶𝐼𝐼𝐼𝐼𝐼𝐼+
𝑃𝑃𝑚𝑚𝐶𝐶𝑐𝑐𝐶𝐶𝐶𝐶𝑚𝑚 𝐶𝐶𝐶𝐶𝑚𝑚𝐶𝐶𝑚𝑚𝑚𝑚𝐶𝐶 𝑏𝑏𝐶𝐶𝐶𝐶𝐶𝐶𝐼𝐼𝐼𝐼𝐼𝐼𝑃𝑃𝑚𝑚𝐶𝐶𝑐𝑐𝐶𝐶𝐶𝐶𝑚𝑚 𝐶𝐶𝑜𝑜𝐶𝐶 𝑐𝑐𝑚𝑚𝐼𝐼𝐶𝐶𝐶𝐶𝑐𝑐𝐼𝐼𝑚𝑚 𝑏𝑏𝐶𝐶𝐶𝐶𝐶𝐶𝐼𝐼𝐼𝐼𝐼𝐼
Tammi mixture biomass = Tammi biomass when in competition with Proctor, Tammi own
cultivar biomass = Tammi biomass of the focal plant when in competition with another
Tammi. Proctor mixture biomass = Proctor yield when in competition with Tammi, Proctor
own cultivar biomass = Proctor biomass when in competition with another Proctor.

38
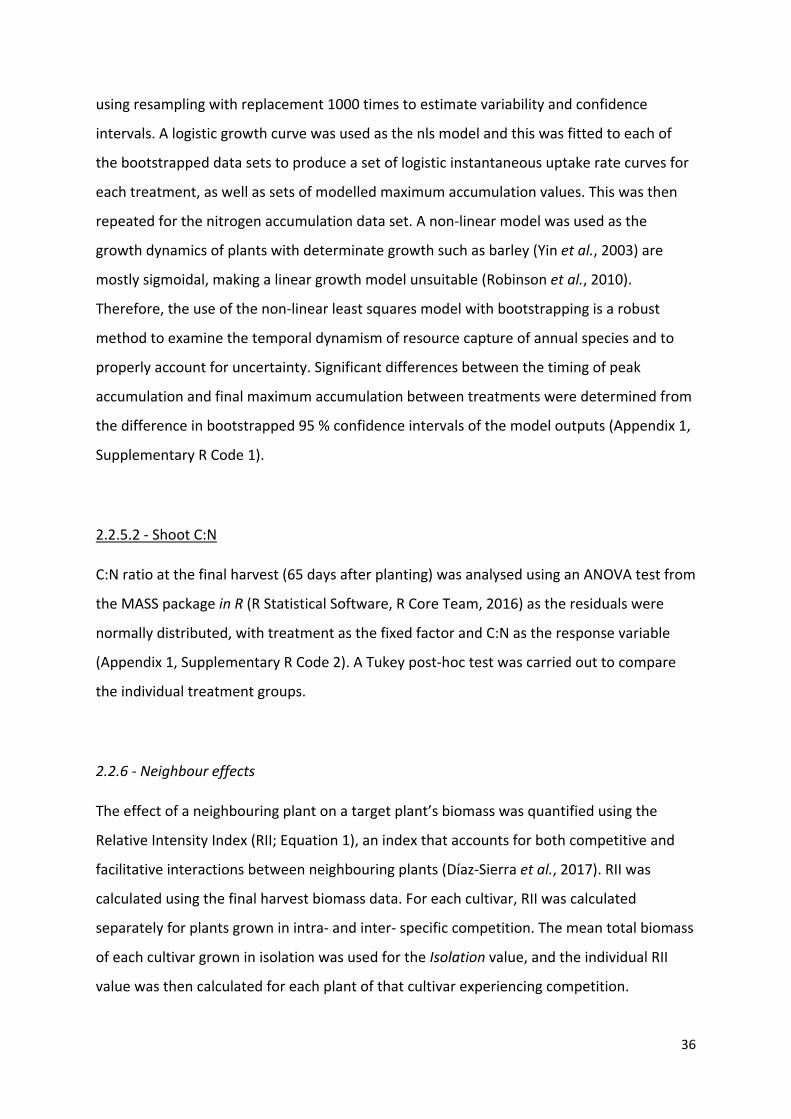
2.3 - Results
Nitrogen (Figure 2.1a) and biomass (Figure 2.1b) accumulation were temporally distinct for
both cultivars. The peak rate of nitrogen accumulation occurred between 17.5 – 19.0 days
after planting for Tammi and 19.5 – 35.0 days for Proctor. The peak rate of biomass
accumulation occurred between 47 – 48 days after planting for Tammi and 47.0 – 51.5 days
for Proctor (Model details in Appendix 1, Table A1).
39
Figure 2.1 – Timing of peak nitrogen (panel 1a) and biomass (panel 1b) accumulation rate,
the shoot nitrogen concentration and absolute maximum accumulated total biomass at the
end of the experiment in barley (Hordeum vulgare). Bootstrapped modelled accumulation
derived from non-linear least squares model (T = Tammi, P = Proctor, TP-T = Tammi in
competition with Proctor, TP-P = Proctor in competition with Tammi, TT = Tammi own
(b)
(a)
40
cultivar competition, PP = Proctor own cultivar competition). Error bars represent the 95%
confidence intervals derived from the non-linear least squares model.
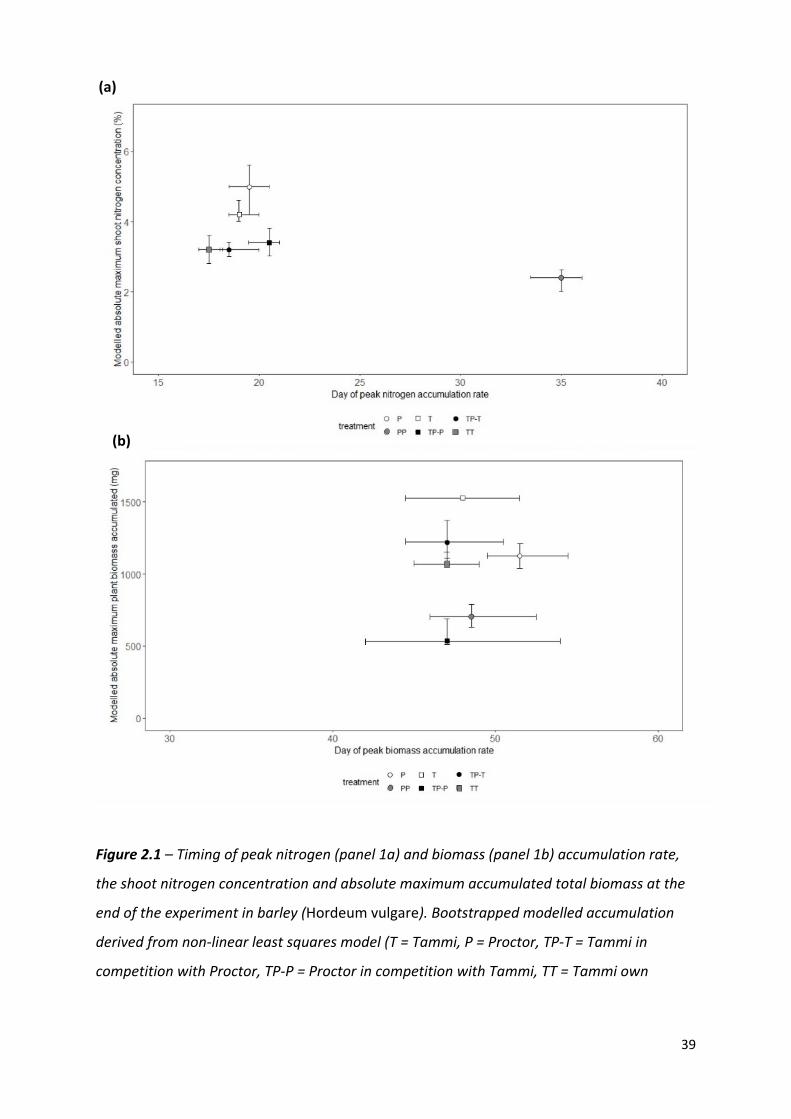
2.3.1 - Temporal dynamics of nitrogen uptake
Nitrogen uptake for both cultivars followed similar temporal dynamics, increasing until 45
days after planting, then plateauing (Figure 2.2a and 2.2b). There was no significant change
in the timing of peak nitrogen uptake rate in response to inter-cultivar competition for
either cultivar. However, both cultivars showed a significant shift in peak accumulation rate
in response to intra-cultivar competition (Figure 2.1a). Tammi demonstrated an advance in
peak uptake rate by 0.5 days and Proctor a delay of 14.5 days (Appendix 1, Table A2).
Figure 2.2 – Mean cumulative nitrogen (panels 2a and 2b) and biomass (panels 2c and 2d)
accumulation of Tammi and Proctor barley cultivars over time. Pots contained Proctor in
0
5
10
15
20
25
30
35
16 21 26 31 36 40 45 50 55 60
Cum
ulat
ive
shoo
t nitr
ogen
co
ncen
trat
ion
(%)
Days since planting
P TP-P PP
0
5
10
15
20
25
30
35
16 21 26 31 36 40 45 50 55 60
Cum
ulat
ive
shoo
t nitr
ogen
co
ncen
trat
ion
(%)
Days since planting
T TP-T TT
0
2
4
6
8
10
11 16 21 26 31 36 40 45 50 55 60
Cum
ulat
ive
biom
ass (
g)
Days since planting
P TP-P PP
0
2
4
6
8
10
11 16 21 26 31 36 40 45 50 55 60
Cum
ulat
ive
biom
ass (
g)
Days since planting
T TP-T TT
(a)
(b)
(c) (d)

41
isolation (P), in competition with Tammi (TP) and in competition with another Proctor (PP),
Tammi in isolation (T), in competition with Proctor (TP) and another Tammi (TT). Error bars
are two times the standard error of the mean.
2.3.2 - Maximum accumulated shoot nitrogen
Proctor’s absolute maximum shoot nitrogen concentration was significantly lower when in
competition with Tammi or Proctor compared to isolation (Figure 2.1a). Inter-cultivar
competition caused a significantly lower maximum shoot nitrogen concentration compared
to intra-cultivar competition for Proctor but not Tammi. Intra-cultivar competition caused a
significantly lower maximum shoot nitrogen concentration for Tammi but not Proctor
(Appendix 1, Table A3).
2.3.3 - Temporal dynamics of biomass accumulation
Biomass accumulation increased throughout the growing period with a lag period until 31
days after planting and then rapidly increased during the remainder of the experiment
(Figure 2.2c and 2.2d). In response to competition, Tammi did not exhibit a shift in peak
biomass accumulation rate, with peak accumulation rate always occurring 47 – 48 days after
planting. Proctor biomass accumulation rate peaked between 48 – 51.5 days after planting
(Figure 2.1b); although there was a trend towards an earlier peak in biomass accumulation
when in competition there were no significant differences between treatments (Appendix 1,
Table A2).
2.3.4 - Maximum accumulated total plant biomass
For both Tammi and Proctor, absolute maximum accumulated biomass was significantly
lower when in competition compared to isolation (Figure 2.1b). However, neither cultivar
demonstrated a significant difference between intra- and inter- cultivar competition in
maximum accumulated biomass (Appendix 1, Table A3).
42
2.3.5 - Shoot C:N
Proctor in isolation had a C:N ratio of about half that of Tammi in isolation throughout the
experiment i.e. more nitrogen relative to carbon. However, for neither cultivar were there
significant differences in C:N ratio between plants in isolation compared to plants in
competition at the end of the experiment (Proctor (F(2,17) = 1.44, P = 0.26); Tammi (F(2,17) =
2.74, P = 0.09) (Details in Appendix 1, Table A4).
2.3.6 - Neighbour effects
The significantly negative RII of final biomass indicated competitive interactions for both
cultivars irrespective of whether they were in inter- or intra- cultivar mixtures. RII values
also showed that Tammi and Proctor experienced a greater intensity of competition when in
inter-cultivar compared to intra-cultivar competition (Figure 2.3). Proctor in intra-cultivar
competition experienced the lowest intensity of competition; however, there was no
significant difference between the competition treatments (F(3,26) = 2.86, P = 0.06).
The LER value for Tammi and Proctor in competition was 2.05 (± 0.35 standard
error), indicating that the inter-cultivar mixture had a greater total biomass (root and shoot)
than would be expected from the intra-cultivar mixtures.
Figure 2.3 - Mean Relative Intensity Index of barley (Hordeum vulgare) Tammi and Proctor
cultivars in inter- and intra- cultivar competition. The more negative the result the greater
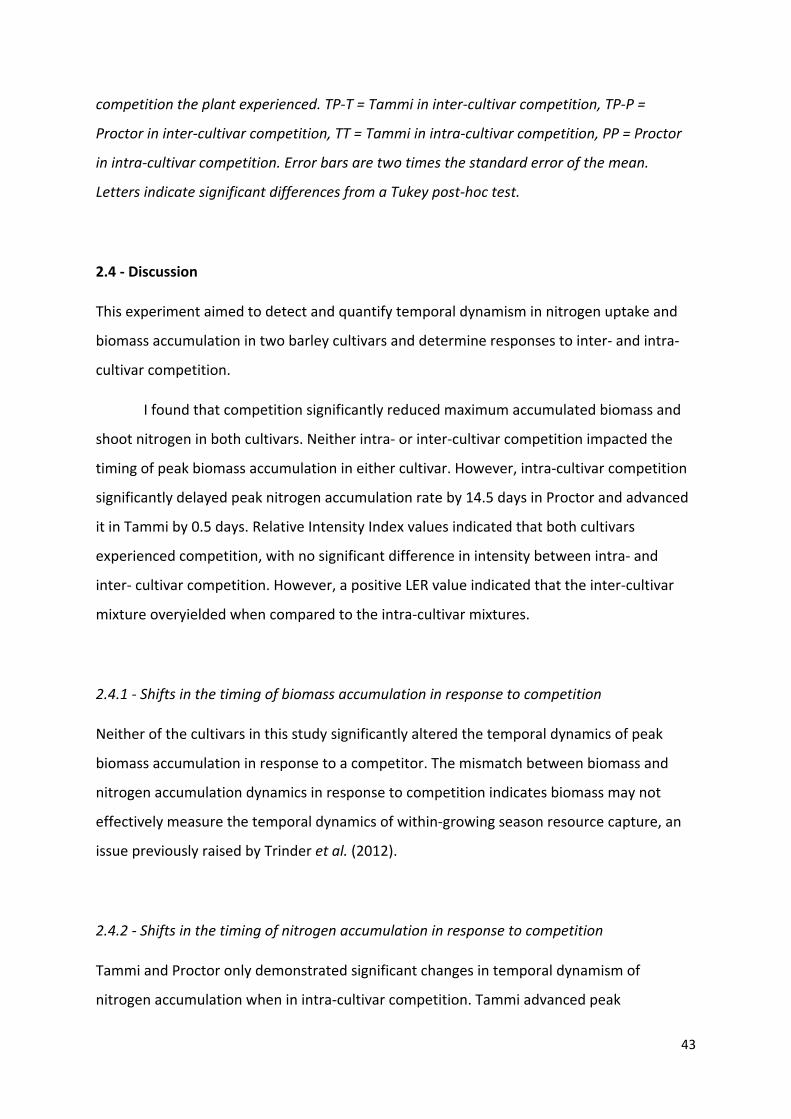
43
competition the plant experienced. TP-T = Tammi in inter-cultivar competition, TP-P =
Proctor in inter-cultivar competition, TT = Tammi in intra-cultivar competition, PP = Proctor
in intra-cultivar competition. Error bars are two times the standard error of the mean.
Letters indicate significant differences from a Tukey post-hoc test.
2.4 - Discussion
This experiment aimed to detect and quantify temporal dynamism in nitrogen uptake and
biomass accumulation in two barley cultivars and determine responses to inter- and intra-
cultivar competition.
I found that competition significantly reduced maximum accumulated biomass and
shoot nitrogen in both cultivars. Neither intra- or inter-cultivar competition impacted the
timing of peak biomass accumulation in either cultivar. However, intra-cultivar competition
significantly delayed peak nitrogen accumulation rate by 14.5 days in Proctor and advanced
it in Tammi by 0.5 days. Relative Intensity Index values indicated that both cultivars
experienced competition, with no significant difference in intensity between intra- and
inter- cultivar competition. However, a positive LER value indicated that the inter-cultivar
mixture overyielded when compared to the intra-cultivar mixtures.
2.4.1 - Shifts in the timing of biomass accumulation in response to competition
Neither of the cultivars in this study significantly altered the temporal dynamics of peak
biomass accumulation in response to a competitor. The mismatch between biomass and
nitrogen accumulation dynamics in response to competition indicates biomass may not
effectively measure the temporal dynamics of within-growing season resource capture, an
issue previously raised by Trinder et al. (2012).
2.4.2 - Shifts in the timing of nitrogen accumulation in response to competition
Tammi and Proctor only demonstrated significant changes in temporal dynamism of
nitrogen accumulation when in intra-cultivar competition. Tammi advanced peak
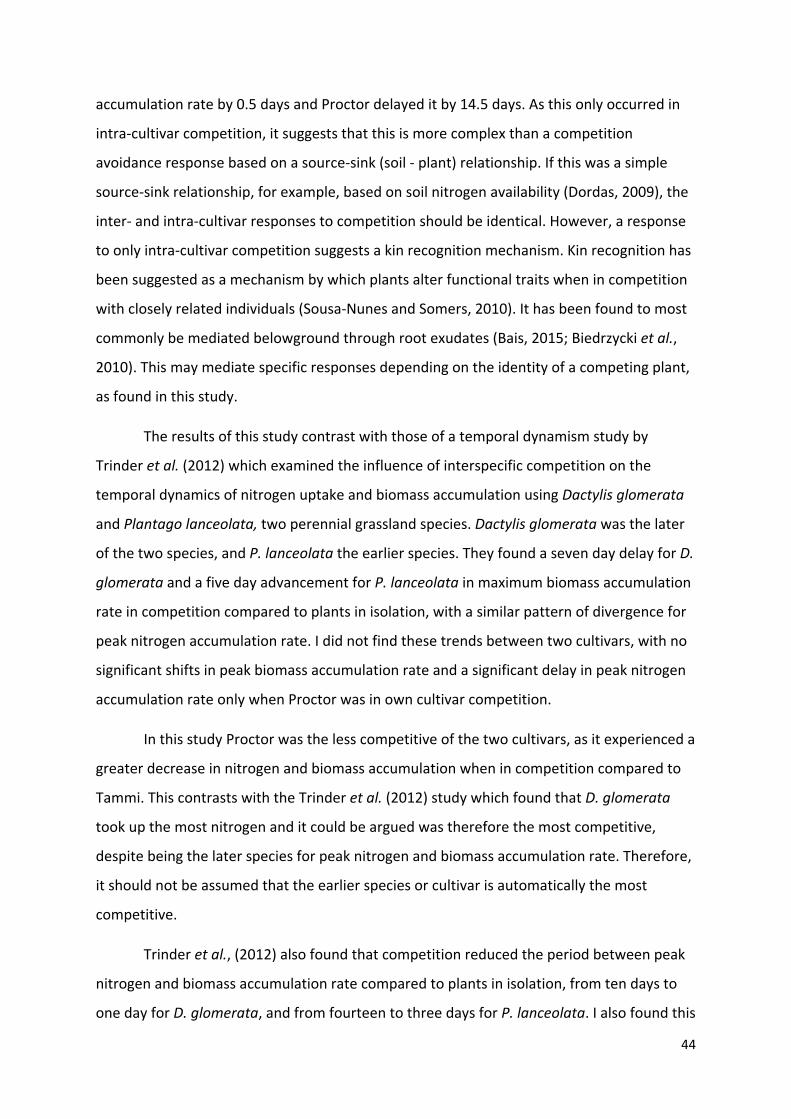
44
accumulation rate by 0.5 days and Proctor delayed it by 14.5 days. As this only occurred in
intra-cultivar competition, it suggests that this is more complex than a competition
avoidance response based on a source-sink (soil - plant) relationship. If this was a simple
source-sink relationship, for example, based on soil nitrogen availability (Dordas, 2009), the
inter- and intra-cultivar responses to competition should be identical. However, a response
to only intra-cultivar competition suggests a kin recognition mechanism. Kin recognition has
been suggested as a mechanism by which plants alter functional traits when in competition
with closely related individuals (Sousa-Nunes and Somers, 2010). It has been found to most
commonly be mediated belowground through root exudates (Bais, 2015; Biedrzycki et al.,
2010). This may mediate specific responses depending on the identity of a competing plant,
as found in this study.
The results of this study contrast with those of a temporal dynamism study by
Trinder et al. (2012) which examined the influence of interspecific competition on the
temporal dynamics of nitrogen uptake and biomass accumulation using Dactylis glomerata
and Plantago lanceolata, two perennial grassland species. Dactylis glomerata was the later
of the two species, and P. lanceolata the earlier species. They found a seven day delay for D.
glomerata and a five day advancement for P. lanceolata in maximum biomass accumulation
rate in competition compared to plants in isolation, with a similar pattern of divergence for
peak nitrogen accumulation rate. I did not find these trends between two cultivars, with no
significant shifts in peak biomass accumulation rate and a significant delay in peak nitrogen
accumulation rate only when Proctor was in own cultivar competition.
In this study Proctor was the less competitive of the two cultivars, as it experienced a
greater decrease in nitrogen and biomass accumulation when in competition compared to
Tammi. This contrasts with the Trinder et al. (2012) study which found that D. glomerata
took up the most nitrogen and it could be argued was therefore the most competitive,
despite being the later species for peak nitrogen and biomass accumulation rate. Therefore,
it should not be assumed that the earlier species or cultivar is automatically the most
competitive.
Trinder et al., (2012) also found that competition reduced the period between peak
nitrogen and biomass accumulation rate compared to plants in isolation, from ten days to
one day for D. glomerata, and from fourteen to three days for P. lanceolata. I also found this
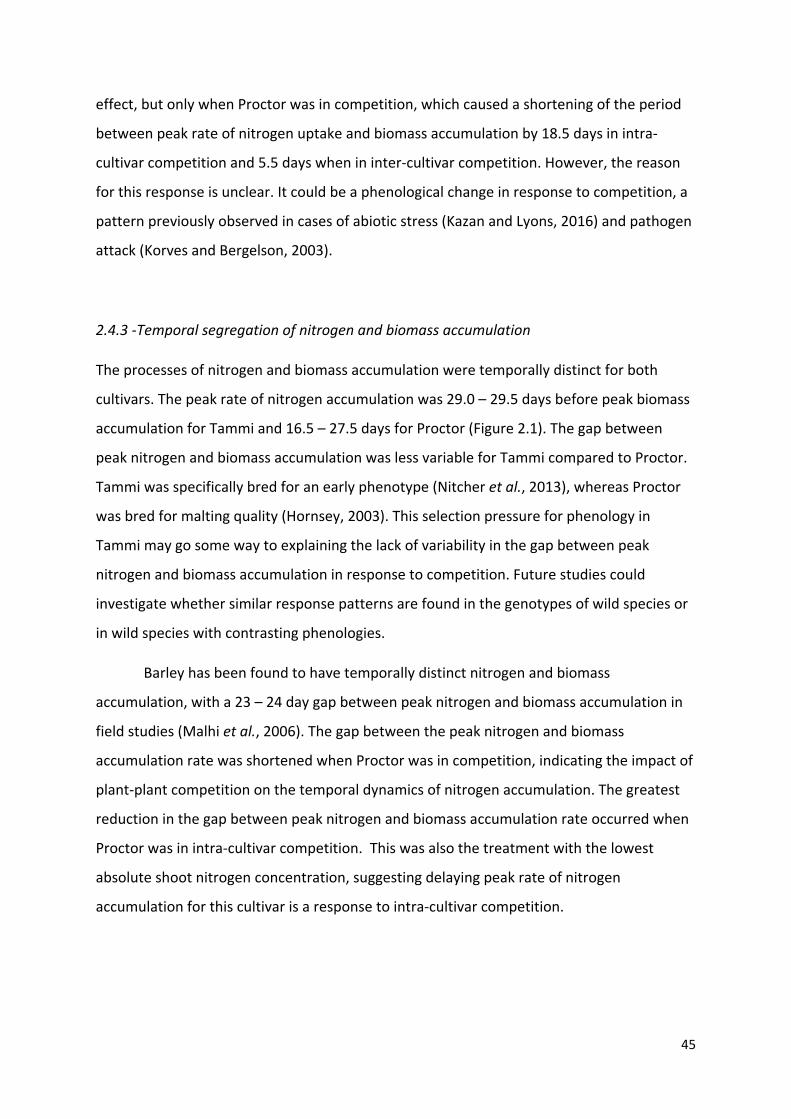
45
effect, but only when Proctor was in competition, which caused a shortening of the period
between peak rate of nitrogen uptake and biomass accumulation by 18.5 days in intra-
cultivar competition and 5.5 days when in inter-cultivar competition. However, the reason
for this response is unclear. It could be a phenological change in response to competition, a
pattern previously observed in cases of abiotic stress (Kazan and Lyons, 2016) and pathogen
attack (Korves and Bergelson, 2003).
2.4.3 -Temporal segregation of nitrogen and biomass accumulation
The processes of nitrogen and biomass accumulation were temporally distinct for both
cultivars. The peak rate of nitrogen accumulation was 29.0 – 29.5 days before peak biomass
accumulation for Tammi and 16.5 – 27.5 days for Proctor (Figure 2.1). The gap between
peak nitrogen and biomass accumulation was less variable for Tammi compared to Proctor.
Tammi was specifically bred for an early phenotype (Nitcher et al., 2013), whereas Proctor
was bred for malting quality (Hornsey, 2003). This selection pressure for phenology in
Tammi may go some way to explaining the lack of variability in the gap between peak
nitrogen and biomass accumulation in response to competition. Future studies could
investigate whether similar response patterns are found in the genotypes of wild species or
in wild species with contrasting phenologies.
Barley has been found to have temporally distinct nitrogen and biomass
accumulation, with a 23 – 24 day gap between peak nitrogen and biomass accumulation in
field studies (Malhi et al., 2006). The gap between the peak nitrogen and biomass
accumulation rate was shortened when Proctor was in competition, indicating the impact of
plant-plant competition on the temporal dynamics of nitrogen accumulation. The greatest
reduction in the gap between peak nitrogen and biomass accumulation rate occurred when
Proctor was in intra-cultivar competition. This was also the treatment with the lowest
absolute shoot nitrogen concentration, suggesting delaying peak rate of nitrogen
accumulation for this cultivar is a response to intra-cultivar competition.
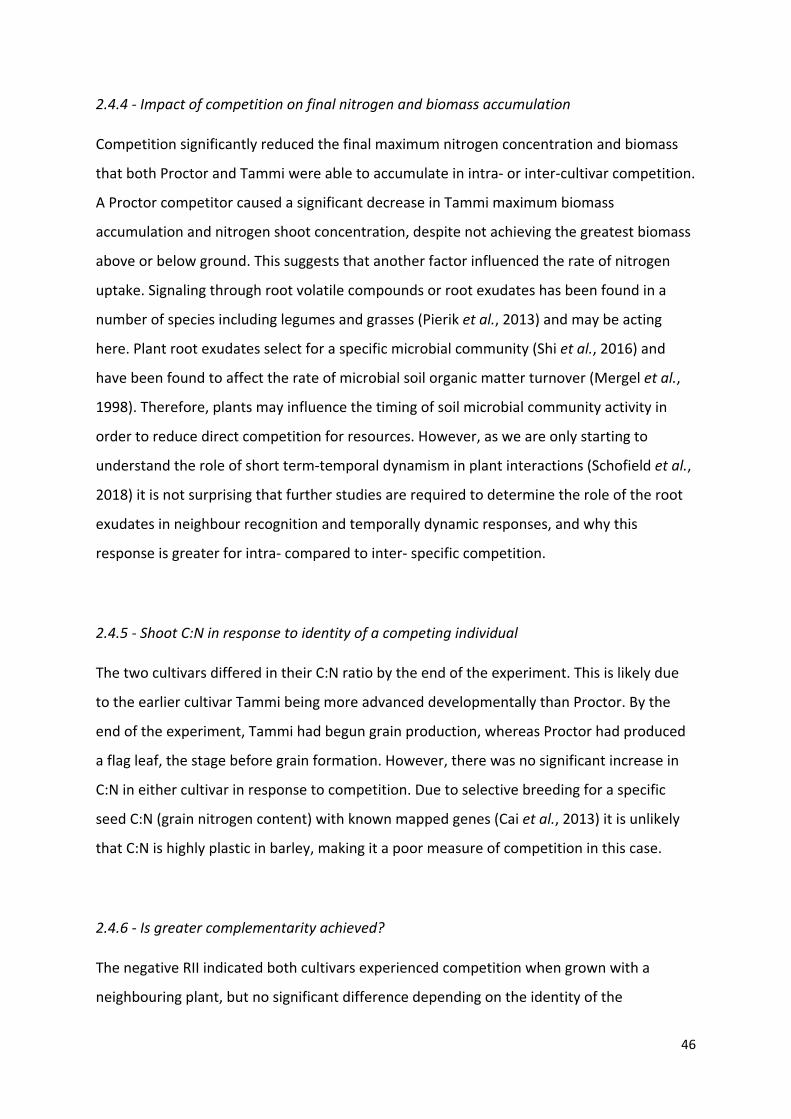
46
2.4.4 - Impact of competition on final nitrogen and biomass accumulation
Competition significantly reduced the final maximum nitrogen concentration and biomass
that both Proctor and Tammi were able to accumulate in intra- or inter-cultivar competition.
A Proctor competitor caused a significant decrease in Tammi maximum biomass
accumulation and nitrogen shoot concentration, despite not achieving the greatest biomass
above or below ground. This suggests that another factor influenced the rate of nitrogen
uptake. Signaling through root volatile compounds or root exudates has been found in a
number of species including legumes and grasses (Pierik et al., 2013) and may be acting
here. Plant root exudates select for a specific microbial community (Shi et al., 2016) and
have been found to affect the rate of microbial soil organic matter turnover (Mergel et al.,
1998). Therefore, plants may influence the timing of soil microbial community activity in
order to reduce direct competition for resources. However, as we are only starting to
understand the role of short term-temporal dynamism in plant interactions (Schofield et al.,
2018) it is not surprising that further studies are required to determine the role of the root
exudates in neighbour recognition and temporally dynamic responses, and why this
response is greater for intra- compared to inter- specific competition.
2.4.5 - Shoot C:N in response to identity of a competing individual
The two cultivars differed in their C:N ratio by the end of the experiment. This is likely due
to the earlier cultivar Tammi being more advanced developmentally than Proctor. By the
end of the experiment, Tammi had begun grain production, whereas Proctor had produced
a flag leaf, the stage before grain formation. However, there was no significant increase in
C:N in either cultivar in response to competition. Due to selective breeding for a specific
seed C:N (grain nitrogen content) with known mapped genes (Cai et al., 2013) it is unlikely
that C:N is highly plastic in barley, making it a poor measure of competition in this case.
2.4.6 - Is greater complementarity achieved?
The negative RII indicated both cultivars experienced competition when grown with a
neighbouring plant, but no significant difference depending on the identity of the
47
competitor. This contrasts with the positive LER value which indicated overyielding of the
two cultivars when grown in inter-cultivar competition compared to intra-cultivar
competition. The reason for this is unclear and may be due to the timing of the final harvest,
before both cultivars had set seed. This highlights the difficulty of using multiple metrics to
measure the outcome of competition, especially as the measurements were only taken at
the end of the experiment i.e. at a single timepoint. Therefore, single timepoint competition
indices should be used with caution when examining the consequences of temporal
dynamism of resource capture.
There is a need to understand the extent to which a species or genotype is
temporally dynamic and the factors that lead to temporal dynamism in resource capture.
This will allow temporal dynamism in resource capture to be included in models of
coexistence, furthering our understanding of coexistence in complex plant communities.
2.5 - Conclusions
This study demonstrates how a previously understudied factor in plant community
coexistence, within-growing season temporal dynamism of resource capture, can be
measured through successive harvesting and the novel application of commonly used
statistical approaches. Only peak nitrogen accumulation rate was temporally dynamic in
response to competition, not biomass peak accumulation rate or shoot C:N. Therefore, I
suggest that to understand the temporal dynamics of resource capture within a growing
season, direct measures of mineral resources accumulated (e.g. nitrogen uptake) are
important to understand the mechanisms of temporally dynamic responses to competition.
By measuring shoot nitrogen accumulation rate over time, intra-cultivar competition was
found to advance peak nitrogen accumulation rate in Tammi and delay it in Proctor. This
suggests that temporally dynamic nitrogen uptake responses are greater in intra-cultivar
competition and may be due to kin recognition. This may be mediated through root
exudates and the soil microbial community, an area that requires further investigation and
extension to semi-natural and natural ecosystems. Ultimately understanding the role of
temporal dynamism in plant communities will lead to improved niche models of coexistence
in plant communities.

48
References
Ashton, I. W., Miller, A. E., Bowman, W. D. and Suding, K. N. (2010) Niche complementarity
due to plasticity in resource use: Plant partitioning of chemical N forms. Ecology, 91(11),
3252–3260.
Bais, H. P. (2015) Shedding light on kin recognition response in plants. New Phytologist,
205(1), 4–6.
Biedrzycki, M. L., Jilany, T. A., Dudley, S. A. and Bais, H. P. (2010) Root exudates mediate kin
recognition in plants. Communicative & Integrative Biology, 3(1), 28–35.
Cai, S., Yu, G., Chen, X., Huang, Y., Jiang, X., Zhang, G. and Jin, X. (2013) Grain protein
content variation and its association analysis in barley. BMC Plant Biology, 13(1), 13–35.
Clark, J. S. (2010) Individuals and the Variation Needed for High Species Diversity in Forest
Trees. Science, 327(5969), 1129–1132.
Díaz-Sierra, R., Verwijmeren, M., Rietkerk, M., de Dios, V. R. and Baudena, M. (2017) A new
family of standardized and symmetric indices for measuring the intensity and importance of
plant neighbour effects. Methods in Ecology and Evolution, 8(5), 580–591.
Dordas, C. (2009) Dry matter, nitrogen and phosphorus accumulation, partitioning and
remobilization as affected by N and P fertilization and source-sink relations. European
Journal of Agronomy, 30(2), 129–139.
Dudley, S. A. and File, A. L. (2007) Kin recognition in an annual plant. Biology Letters, 3(4),
435–438.
Hornsey, I. S. (2003) History of Beer and Brewing. Royal Society of Chemistry, Cambridge,
UK.
Jaeger, C. H., Monson, R. K., Fisk, M. C. and Schmidt, S. K. (1999) Seasonal Partitioning of
Nitrogen by Plants and Soil Microorganisms in an Alpine Ecosystem. Ecological Society of
America, 80(6), 1883–1891.
Kazan, K. and Lyons, R. (2016) The link between flowering time and stress tolerance. Journal
of Experimental Botany, 67(1), 47–60.
49
Kipling, R. P. and Warren, J. (2014) An investigation of temporal flowering segregation in
species-rich grasslands. Ecological Research, 29(2), 213–224.
Korves, T. M. and Bergelson, J. (2003) A developmental response to pathogen infection in
Arabidopsis. Plant Physiology, 133(1), 339–347.
Malhi, S. S., Johnston, A. M., Schoenau, J. J., Wang, Z. L. and Vera, C. L. (2006) Seasonal
biomass accumulation and nutrient uptake of wheat, barley and oat on a Black Chernozem
Soil in Saskatchewan. Canadian Journal of Plant Science, 86(4), 1005–1014.
Mead, R. and Willey, R. W. (1980) The concept of a “land equivalent ratio” and advantages
in yields from intercropping. Experimental Agriculture, 16(3), 217–228.
Mergel, A., Timchenko, A. and Kudeyarov, V. (1998) Role of plant root exudates in soil
carbon and nitrogen transformation. In Root Demographics and Their Efficiencies in
Sustainable Agriculture, Grasslands and Forest Ecosystems. Springer, Netherlands, 43–54.
Murphy, G. P., Swanton, C. J., Van Acker, R. C. and Dudley, S. A. (2017) Kin recognition,
multilevel selection and altruism in crop sustainability. Journal of Ecology, 105(4), 930–934.
Nielsen, N. E. and Jensen, H. E. (1986) The course of nitrogen uptake by spring barley from
soil and fertilizer nitrogen. Plant and Soil, 91(3), 391–395.
Nitcher, R., Distelfeld, A., Tan, C., Yan, L. and Dubcovsky, J. (2013) Increased copy number at
the HvFT1 locus is associated with accelerated flowering time in barley. Molecular Genetics
and Genomics, 288(5–6), 261–275.
Pierik, R., Mommer, L. and Voesenek, L. A. (2013) Molecular mechanisms of plant
competition: Neighbour detection and response strategies. Functional Ecology, 27(4), 841–
853.
Poorter, H., Anten, N. P. R. and Marcelis, L. F. M. (2013) Physiological mechanisms in plant
growth models: do we need a supra-cellular systems biology approach? Plant, Cell &
Environment, 36(9), 1673–1690.
R Core Team (2015) R: A Language and Environment for Statistical Computing. R Foundation
for Statistical Computing, 1, 409.
50
Robinson, D., Davidson, H., Trinder, C. and Brooker, R. (2010) Root-shoot growth responses
during interspecific competition quantified using allometric modelling. Annals of Botany,
106(6), 921–926.
Schöb, C., Brooker, R. W. and Zuppinger-Dingley, D. (2018) Evolution of facilitation requires
diverse communities. Nature Ecology & Evolution, 2(9), 1381–1385.
Schofield, E. J., Rowntree, J. K., Paterson, E. and Brooker, R. W. (2018) Temporal Dynamism
of Resource Capture: A Missing Factor in Ecology? Trends in Ecology and Evolution, 33(4),
277–286.
Semchenko, M., Saar, S. and Lepik, A. (2017) Intraspecific genetic diversity modulates plant-
soil feedback and nutrient cycling. New Phytologist, 216, 90–98.
Shi, S., Nuccio, E. E., Shi, Z. J., He, Z., Zhou, J. and Firestone, M. K. (2016) The interconnected
rhizosphere: High network complexity dominates rhizosphere assemblages. Ecology letters,
19(8), 926–936.
Silvertown, J. (2004) Plant coexistence and the niche. Trends in Ecology & Evolution, 19(11),
605–611.
Sousa-Nunes, R. and Somers, W. G. (2010) Phosphorylation and dephosphorylation events
allow for rapid segregation of fate determinants during Drosophila neuroblast asymmetric
divisions. Communicative and Integrative Biology, 3(1), 28–35.
Spink, J., Blake, J., Bingham, I., Hoad, S. and Foulkes, J. (2015) Barley growth guide Managing
barley growth. [https://cereals.ahdb.org.uk/media/186381/g67-barley-growth-guide.pdf.],
(Accessed 21/01/2020).
Trinder, C., Brooker, R., Davidson, H. and Robinson, D. (2012) Dynamic trajectories of growth
and nitrogen capture by competing plants. New Phytologist, 193(4), 948–958.
Yin, X., Goudriaan, J., Lantinga, E. A., Vos, J. and Spiertz, H. J. (2003) A flexible sigmoid
function of determinate growth. Annals of Botany, 91(3), 361–371.
51
Chapter 3
Model and software choice affect analysis of temporal dynamism in plants –
shorter harvesting intervals increase accuracy over replication
Contents
3.1 – Introduction
3.2 – Materials and methods
3.2.1 - Comparison of model parametrisation
3.2.2 - Comparison of software programs
3.2.3 - Effect of sampling frequency and replicate number
3.3 - Results
3.3.1 - Comparison of model parameterisation
3.3.2 - Comparison of software programs
3.3.3 - Effect of sampling frequency and replicate number
3.4 – Discussion
3.4.1 - Effect of model parameterisation
3.4.2 - Effect of curve fitting statistical software
3.4.3 - Effect of sampling frequency and replicates on model estimates
3.4.4 - Are there potential ecological consequences of the analysis approach and experimental design of temporal dynamism studies?
3.5 – Conclusions
Abstract
Logistic growth curves have been used for over a hundred years to describe the dynamics of
plant growth and resource capture. This includes studies of the temporal dynamics of
resource capture by plants in competition, a potentially important factor influencing
coexistence in complex plant communities. Logistic growth curves can enable us to assess
52
the dynamics, timing and scale of peak resource accumulation. However, both the data
analysis approach and experimental design can influence the outcome of logistic growth
curve modelling. This study first examined the effect of statistical model parameterisation
and analytical software program choice on the estimate of peak accumulation rate timing.
Two and three parameter models were compared in R, then Microsoft Excel and R were
compared with the same model design. Second, a dummy dataset was constructed to
investigate the effect of replicate number and sampling frequency on peak accumulation
rate timing. Model parameterisation caused a shift of 3 – 15 days and software program a
shift of 3 – 11 days in peak biomass accumulation rate estimate. The dummy dataset
analysis found that both replicates and sampling frequency significantly affected the
estimate derived from the model. With sampling intervals of six days or less there was little
effect of replicate number. With greater sampling intervals estimates were larger.
Therefore, this chapter recommends the use of a three parameter instead of a two
parameter logistic model, as it accounts for variation in the starting value. It is also
recommended sampling at a frequency of fewer than six days with 3 - 5 replicates in similar
studies. It is also recommended that before logistic growth curve fitting is undertaken, the
model design and the software program used to analyse the data should both be thoroughly
explored to ensure they are fit for purpose and avoid confounding effects. Also, when
designing experiments prior to such analyses, frequent sampling with a limited replicate
number is the best use of limited resources whilst maintaining the accuracy and precision of
timing estimates.
3.1 - Introduction
For the last century, logistic models have been used to visualise the growth dynamics of
individuals and populations (Hunt, 1982; Yin et al., 2003). In population ecology they are
used to describe the growth of a population from initial colonisation, through a period of
exponential growth until the carrying capacity of the environment is reached (Vandermeer,
2010). Logistic curves are also used to describe the growth of plants with determinate
growth, such as annual species and crops which have a defined final biomass (Yin et al.,
2003). The characteristic sigmoidal accumulation curve creates a bell-shaped curve of
instantaneous uptake rate (Hunt, 1982).
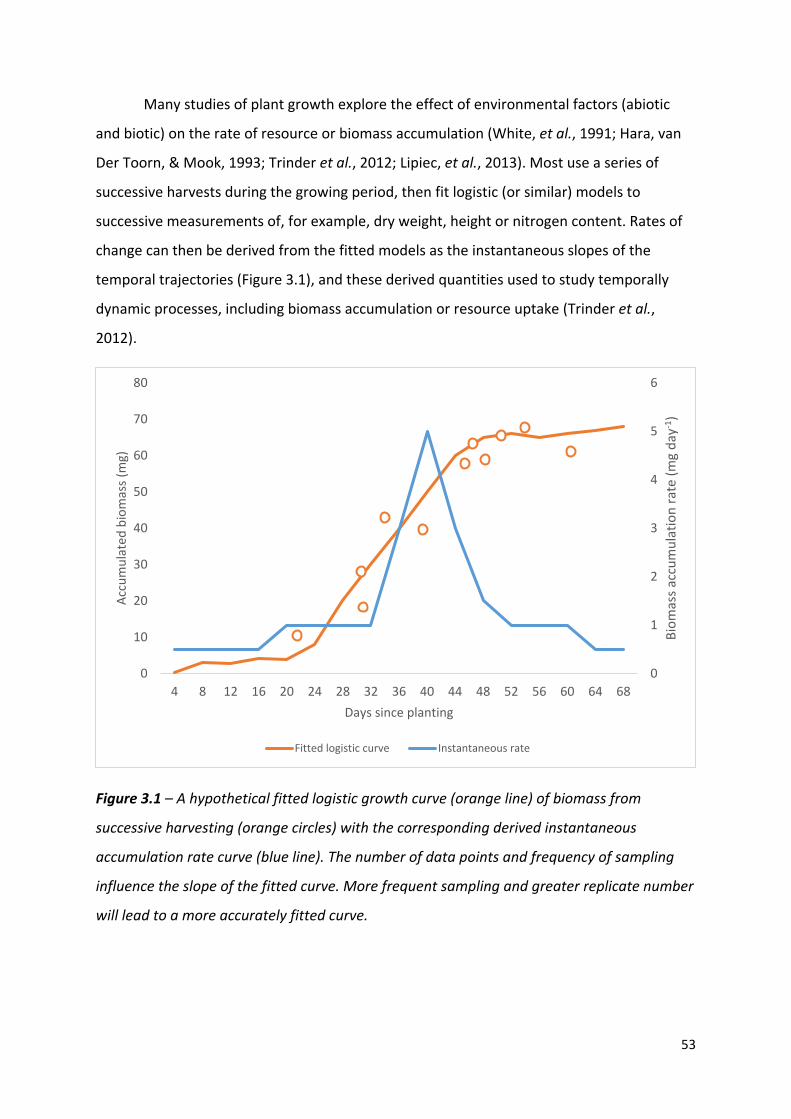
53
Many studies of plant growth explore the effect of environmental factors (abiotic
and biotic) on the rate of resource or biomass accumulation (White, et al., 1991; Hara, van
Der Toorn, & Mook, 1993; Trinder et al., 2012; Lipiec, et al., 2013). Most use a series of
successive harvests during the growing period, then fit logistic (or similar) models to
successive measurements of, for example, dry weight, height or nitrogen content. Rates of
change can then be derived from the fitted models as the instantaneous slopes of the
temporal trajectories (Figure 3.1), and these derived quantities used to study temporally
dynamic processes, including biomass accumulation or resource uptake (Trinder et al.,
2012).
Figure 3.1 – A hypothetical fitted logistic growth curve (orange line) of biomass from
successive harvesting (orange circles) with the corresponding derived instantaneous
accumulation rate curve (blue line). The number of data points and frequency of sampling
influence the slope of the fitted curve. More frequent sampling and greater replicate number
will lead to a more accurately fitted curve.
0
1
2
3
4
5
6
0
10
20
30
40
50
60
70
80
4 8 12 16 20 24 28 32 36 40 44 48 52 56 60 64 68Bi
omas
s acc
umul
atio
n ra
te (m
g da
y-1)
Accu
mul
ated
bio
mas
s (m
g)
Days since planting
Fitted logistic curve Instantaneous rate
54
Temporal dynamism is a potentially crucial factor in models of plant community
coexistence (Schofield, et al., 2018), and such modelling allows us to gain important
information about the impact of experimental treatments (including the presence of
neighbours) on the rates of processes through time. As the model-derived values are at a
finer temporal resolution than the data on which they are based, they can provide greater
detail about the dynamics of continuously varying processes. However, those few studies
addressing directly the measurement of temporal dynamism in resource capture have
employed a number of different logistic model designs and software programs to analyse
their data and fit logistic (or related) models. This makes comparisons between such studies
and any subsequent meta-analyses difficult to carry out.
Two studies provide the focus for this chapter: Trinder et al. (2012) and Schofield et
al. (2019). Both studies focused on the temporal dynamics of resource capture using
successive harvests but used different models and software programs to analyse the
datasets. Trinder et al. (2012) measured resource capture in two competing grassland
species, grown either in competition or isolation. Using successive harvesting of Dactylis
glomerata and Plantago lanceolata, the study aimed to understand interspecific
competition as a temporally dynamic process rather than relying on potentially misleading
‘snapshot’ comparisons of final yields (Gibson et al., 1999). Schofield et al. (2019) used
successive harvests to examine cultivar differences in temporal dynamics in response to
intra-specific competition in barley (Hordeum vulgare).
When comparing these studies, the initial factor to consider is the design of the
logistic model used to analyse the data. Both Trinder et al. (2012) and Schofield et al. (2019)
used the logistic growth equation. Trinder et al. (2012) used a two-parameter form of the
logistic growth curve, whereas Schofield et al. (2019) used a three-parameter logistic model.
However, differences in the number of parameters used in fitting logistic growth curves may
have influenced the modelled peak nitrogen and biomass accumulation rate values. Trinder
et al. (2012) used a two parameter logistic model to model the growth between two time
points, using the asymptote (ymax) and a scaling factor (r) from a fixed initial value, whereas
the logistic curve modelling undertaken by Schofield et al. (2019) used the nls (non-linear
least squares) function in R, taking the midpoint of the logistic curve (xmid), asymptote
(ymax) and scaling factor (scal) as parameters. Understanding the extent to which such
55
analytical differences might impact on the results is essential in drawing informed
comparisons between multiple studies, as well as improving the accuracy of peak nutrient
uptake rate estimates and is the first focus for this chapter.
Another factor in the analysis of these datasets is the software program used to
analyse the data. Those studies that have addressed the measurement of temporal
dynamism in resource capture have employed a number of different software programs to
analyse their data and fit logistic (or related) models, including SAS (Andersen et al., 2007;
Moreira et al., 2015), SPSS (W. P. Zhang et al., 2017) and MATLAB (Neumann et al., 2017).
Two of the more commonly used software programs are Microsoft Excel using the SOLVER
add-in (Robinson, Davidson, Trinder, & Brooker, 2010; Trinder et al., 2012; Li, et al, 2014; Li
et al., 2016) and R Statistical Software (R Core Team, 2015) (using nls within the stats
package) (Dormann & Roxburgh, 2005; Paine et al., 2012; Wei et al., 2018; Schofield et al.,
2019). As Trinder et al. (2012) used Microsoft Excel and Schofield et al. (2019) used R, a
comparison of these software programs as analytical tools is the second focus for this
chapter.
In addition to the influence of analytical approach, the frequency of sampling and
sampling effort at each time point (number of replicates) can affect estimates (Figure 3.1) of
temporally dynamic processes (Miller-Rushing et al., 2008). Sampling frequency and effort
are often limited by practical considerations such as the growth form of the plant being
studied, time, space and funding available (Goldberg & Barton, 1992; Trinder et al.,
2013). But there must exist both a minimum sampling effort below which the quality of
information provided is worthless, and a maximum above which further increases in effort
provide only disproportionately small returns. Identifying sampling regimes that are both
optimal and practical is a long-standing problem in experimental design. Temporal
dynamism studies often vary in sampling frequency and replicate number. Paine et al.
(2012) suggested that a minimal number of replicates with very frequent sampling would
provide the most accurate representation of growth dynamics. However, there are few
studies that test this hypothesis to provide recommendations using a specific curve fitting
model. One such study by Kreyling et al. (2018) found that, when sampling environmental
drivers along a gradient, an increase in sampling locations at the expense of replicates
improved the predictive success and reduced systematic over or under estimation of the
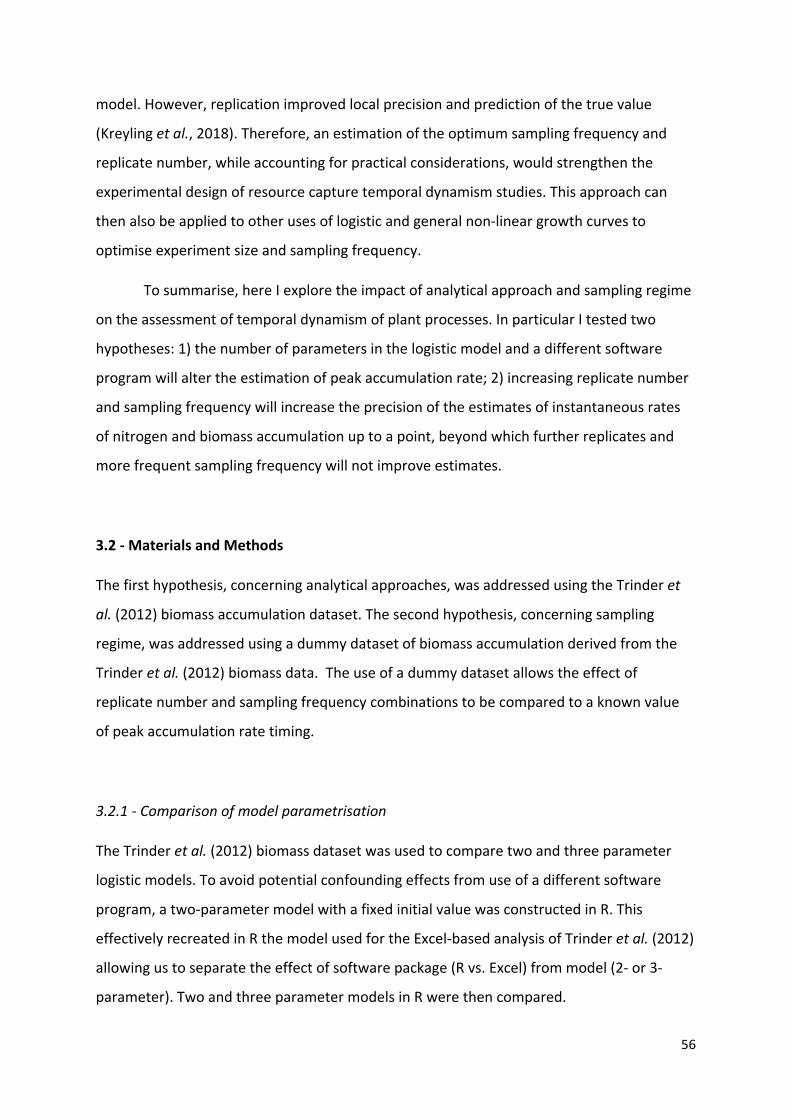
56
model. However, replication improved local precision and prediction of the true value
(Kreyling et al., 2018). Therefore, an estimation of the optimum sampling frequency and
replicate number, while accounting for practical considerations, would strengthen the
experimental design of resource capture temporal dynamism studies. This approach can
then also be applied to other uses of logistic and general non-linear growth curves to
optimise experiment size and sampling frequency.
To summarise, here I explore the impact of analytical approach and sampling regime
on the assessment of temporal dynamism of plant processes. In particular I tested two
hypotheses: 1) the number of parameters in the logistic model and a different software
program will alter the estimation of peak accumulation rate; 2) increasing replicate number
and sampling frequency will increase the precision of the estimates of instantaneous rates
of nitrogen and biomass accumulation up to a point, beyond which further replicates and
more frequent sampling frequency will not improve estimates.
3.2 - Materials and Methods
The first hypothesis, concerning analytical approaches, was addressed using the Trinder et
al. (2012) biomass accumulation dataset. The second hypothesis, concerning sampling
regime, was addressed using a dummy dataset of biomass accumulation derived from the
Trinder et al. (2012) biomass data. The use of a dummy dataset allows the effect of
replicate number and sampling frequency combinations to be compared to a known value
of peak accumulation rate timing.
3.2.1 - Comparison of model parametrisation
The Trinder et al. (2012) biomass dataset was used to compare two and three parameter
logistic models. To avoid potential confounding effects from use of a different software
program, a two-parameter model with a fixed initial value was constructed in R. This
effectively recreated in R the model used for the Excel-based analysis of Trinder et al. (2012)
allowing us to separate the effect of software package (R vs. Excel) from model (2- or 3-
parameter). Two and three parameter models in R were then compared.
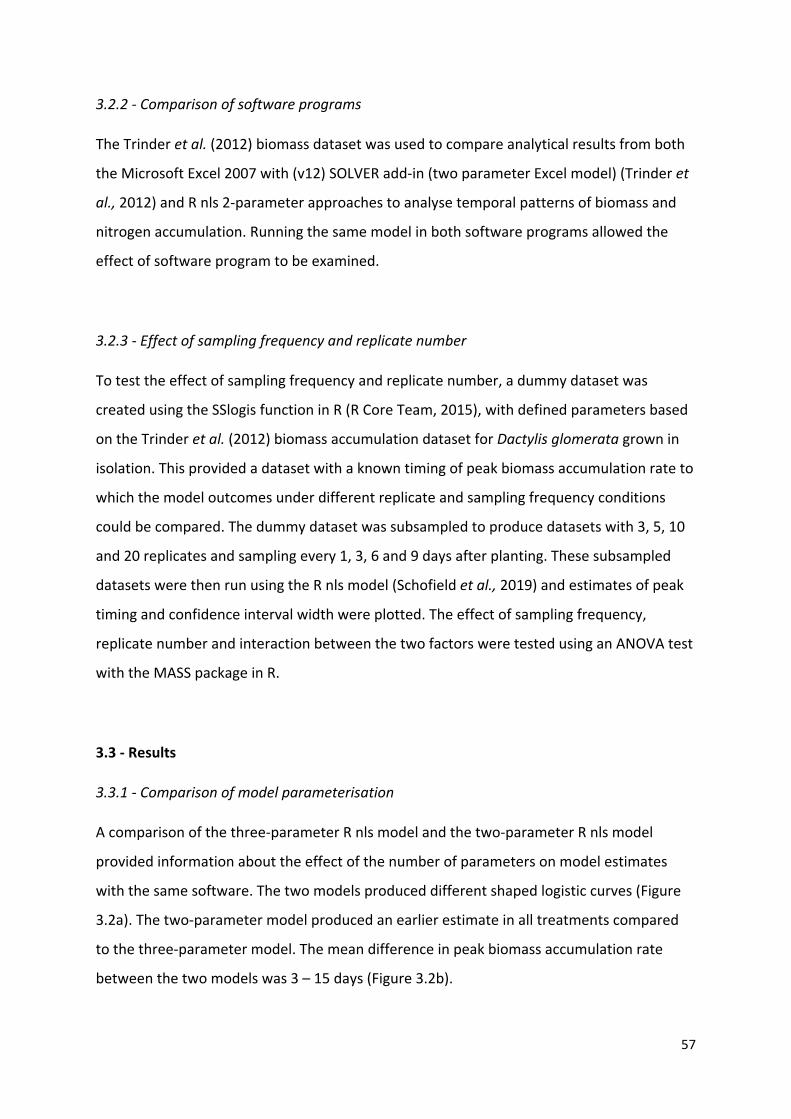
57
3.2.2 - Comparison of software programs
The Trinder et al. (2012) biomass dataset was used to compare analytical results from both
the Microsoft Excel 2007 with (v12) SOLVER add-in (two parameter Excel model) (Trinder et
al., 2012) and R nls 2-parameter approaches to analyse temporal patterns of biomass and
nitrogen accumulation. Running the same model in both software programs allowed the
effect of software program to be examined.
3.2.3 - Effect of sampling frequency and replicate number
To test the effect of sampling frequency and replicate number, a dummy dataset was
created using the SSlogis function in R (R Core Team, 2015), with defined parameters based
on the Trinder et al. (2012) biomass accumulation dataset for Dactylis glomerata grown in
isolation. This provided a dataset with a known timing of peak biomass accumulation rate to
which the model outcomes under different replicate and sampling frequency conditions
could be compared. The dummy dataset was subsampled to produce datasets with 3, 5, 10
and 20 replicates and sampling every 1, 3, 6 and 9 days after planting. These subsampled
datasets were then run using the R nls model (Schofield et al., 2019) and estimates of peak
timing and confidence interval width were plotted. The effect of sampling frequency,
replicate number and interaction between the two factors were tested using an ANOVA test
with the MASS package in R.
3.3 - Results
3.3.1 - Comparison of model parameterisation
A comparison of the three-parameter R nls model and the two-parameter R nls model
provided information about the effect of the number of parameters on model estimates
with the same software. The two models produced different shaped logistic curves (Figure
3.2a). The two-parameter model produced an earlier estimate in all treatments compared
to the three-parameter model. The mean difference in peak biomass accumulation rate
between the two models was 3 – 15 days (Figure 3.2b).
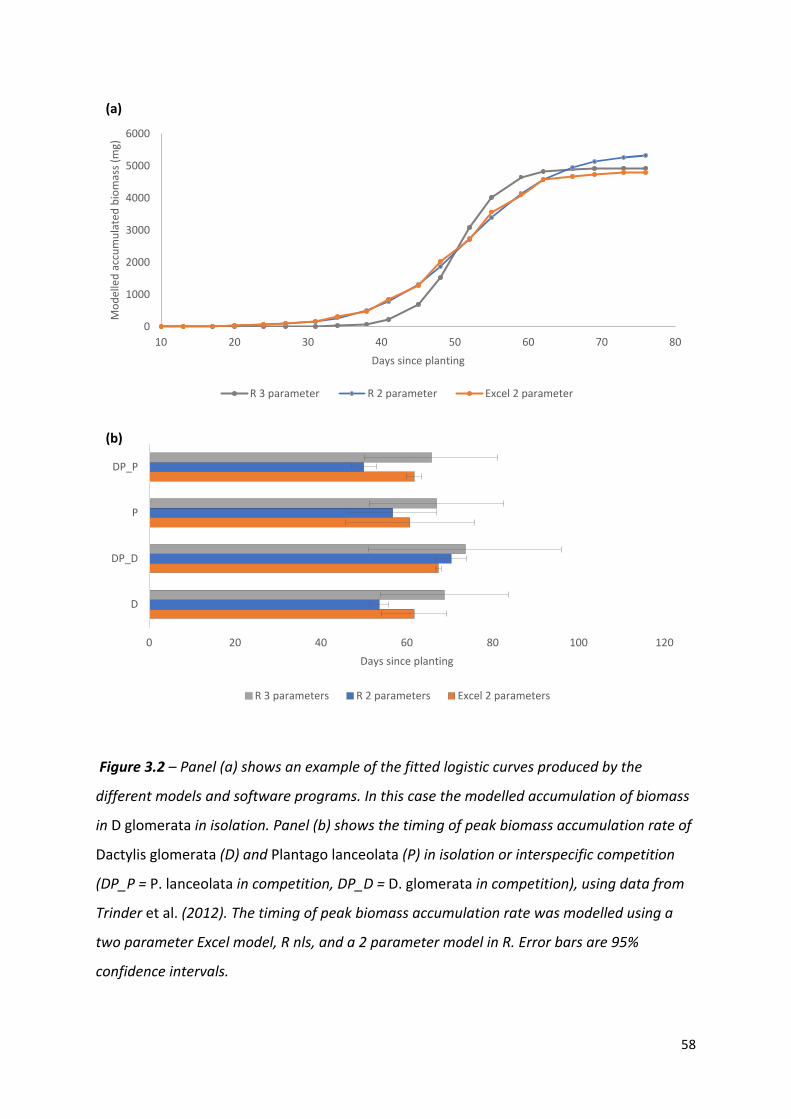
58
Figure 3.2 – Panel (a) shows an example of the fitted logistic curves produced by the
different models and software programs. In this case the modelled accumulation of biomass
in D glomerata in isolation. Panel (b) shows the timing of peak biomass accumulation rate of
Dactylis glomerata (D) and Plantago lanceolata (P) in isolation or interspecific competition
(DP_P = P. lanceolata in competition, DP_D = D. glomerata in competition), using data from
Trinder et al. (2012). The timing of peak biomass accumulation rate was modelled using a
two parameter Excel model, R nls, and a 2 parameter model in R. Error bars are 95%
confidence intervals.
0 20 40 60 80 100 120
D
DP_D
P
DP_P
Days since planting
R 3 parameters R 2 parameters Excel 2 parameters
0
1000
2000
3000
4000
5000
6000
10 20 30 40 50 60 70 80
Mod
elle
d ac
cum
ulat
ed b
iom
ass (
mg)
Days since planting
R 3 parameter R 2 parameter Excel 2 parameter
(a)
(b)
59
3.3.2 - Comparison of software programs
When the two-parameter model was run in both Excel (two parameter Excel model) and R
(two parameter R model), the model estimates were different between software programs.
However, the two programs produced similar shaped curves (Figure 3.2a). The two
parameter R model produced an earlier estimate of peak biomass accumulation rate in
three of the four treatments when compared to the estimate produced by the two
parameter Excel model (Figure 3.2b). The mean difference in peak biomass accumulation
rate was 3 to 11 days
3.3.3 - Effect of sampling frequency and replicate number
The dummy dataset peak accumulation rate timing was at 55.0 days after planting (54.6-
55.5 95% CI) (Figure 3.3a). When sampling was less frequent than 3 days, the estimate
became less precise, as indicated by a widening of the confidence interval widths (Figure
3.3b). With a 6-day sampling interval, the estimate was still close to the known value, i.e.
within 1.6 days (52.02 - 57.66 95% CI with 5 replicates). At a 9-day sampling interval, the
estimate varied by up to 3 days from the known value and had confidence interval widths of
6 - 8 days (e.g. 50.67 – 57.60 95% CI with 5 replicates). Sampling frequency had a significant
effect on the estimate of peak accumulation rate timing (F(3, 14985) = 864.5, P = < 0.01).
Less frequent sampling coupled with fewer replicates led to a less accurate estimate
with larger confidence intervals. The 95% confidence interval width was decreased with an
increase in replicate number, but the confidence intervals were still wider than with more
frequent sampling. The greatest disparity with the known value was at a 9-day sampling
frequency, when only 3 replicates were used. Beyond ten replicates there was little impact
of replicate number (Figure 3.3a). Although replicate number had a minimal effect with the
most frequent sampling, it had a much greater impact when sampling was less frequent.
Overall, replicate number had a significant effect on the estimate of peak accumulation rate
timing (F(3, 14985) = 263.1, P = < 0.01). The combination of a low replicate number and
infrequent sampling led to the estimates furthest from the known value with the largest
confidence intervals. There was a significant interaction between replicate number and
sampling frequency (F(8, 14985) = 411.7, P = < 0.01).
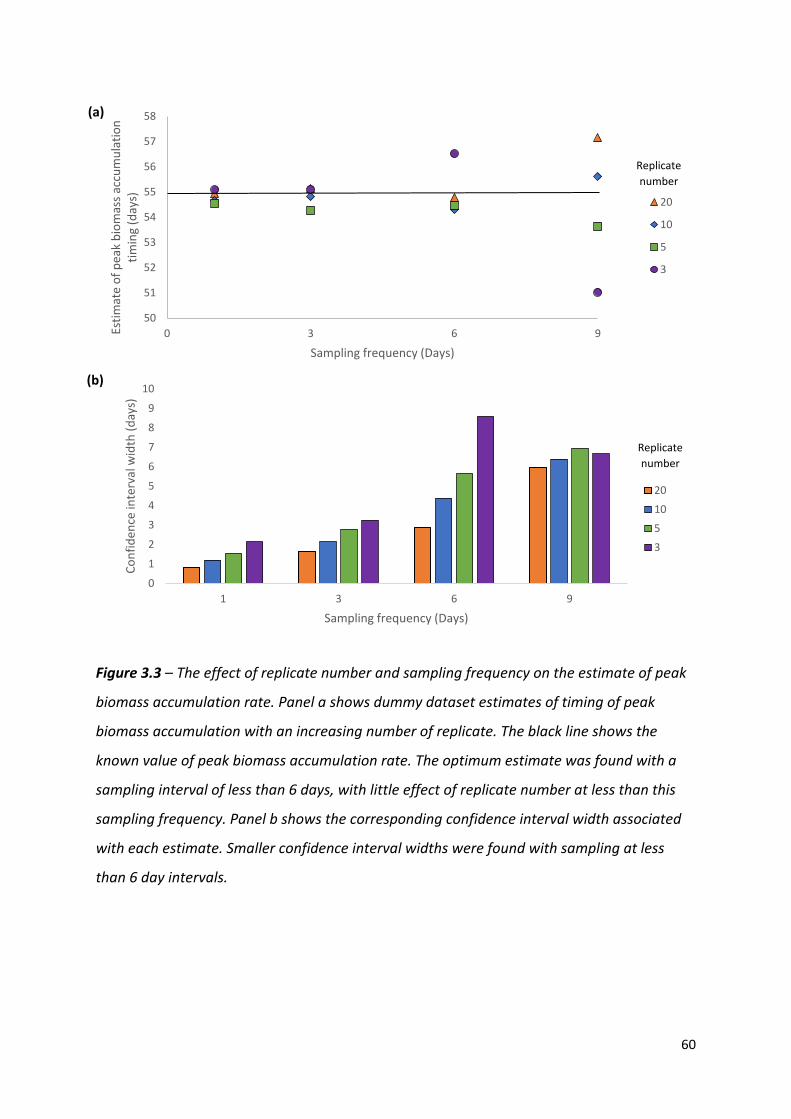
60
Figure 3.3 – The effect of replicate number and sampling frequency on the estimate of peak
biomass accumulation rate. Panel a shows dummy dataset estimates of timing of peak
biomass accumulation with an increasing number of replicate. The black line shows the
known value of peak biomass accumulation rate. The optimum estimate was found with a
sampling interval of less than 6 days, with little effect of replicate number at less than this
sampling frequency. Panel b shows the corresponding confidence interval width associated
with each estimate. Smaller confidence interval widths were found with sampling at less
than 6 day intervals.
0
1
2
3
4
5
6
7
8
9
10
1 3 6 9
Conf
iden
ce in
terv
al w
idth
(day
s)
Sampling frequency (Days)
20
10
5
3
50
51
52
53
54
55
56
57
58
0 3 6 9Estim
ate
of p
eak
biom
ass a
ccum
ulat
ion
timin
g (d
ays)
Sampling frequency (Days)
20
10
5
3
(a)
(b)
Replicate number
Replicate number

61
3.4 - Discussion
This study looked at the effect of model parameterisation and the software program used to
analyse the data on the modelled timing of plant peak biomass accumulation rate. The
effect of two commonly used software programs for data analysis, Microsoft Excel and R as
well as two and three parameterised logistic models were examined using the Trinder et al.
(2012) dataset of biomass accumulation. The software used and model parameterisation
caused a shift in peak biomass accumulation rate of up to 15 days. A dummy dataset was
also constructed with a known peak biomass accumulation rate timing to investigate the
effect of sampling frequency and replicate number on the model outcome. Both sampling
frequency and replicate number had a significant impact on the timing of peak biomass
accumulation rate, affecting the estimate of peak accumulation rate and the associated
confidence intervals.
3.4.1 - Effect of model parameterisation
The number of parameters used to fit the logistic growth curves impacted the estimate of
peak biomass accumulation rate timing by 3 -15 days. The two-parameter model used a
fixed initial value as one of the model parameters, giving only two available parameters with
which the model could be fitted (Trinder et al., 2012). The use of a model with a fixed initial
value assumes this starting value had no error associated with it, which cannot be true of a
measurement. This limitation in model fitting is likely to have accounted for the differences
observed between the two and three parameter models in this study. This suggests that the
use of a three-parameter logistic model would be more appropriate than a two-parameter
model in temporal dynamism studies, as it accounts for variation in the initial starting value.
Therefore, the design and parameterisation of a logistic model can have a profound effect
on the estimate of peak biomass accumulation rate timing.
3.4.2 - Effect of curve fitting statistical software
There were differences in the estimate of peak accumulation rate between the two
software programs even when the same basic model was used to analyse the Trinder et al.
62
(2012) dataset. The two parameter R model produced an earlier estimate of peak biomass
accumulation rate compared to the two parameter Excel model. The difference between
the two software programs was 3 – 11 days, a similar effect as found for differences in
model parameterisation. Consequently, direct comparisons of conclusions drawn from
logistic growth curves calculated using different software programs should be made with
caution, as differing calculation processes appear to affect modelled estimates of peak
accumulation rate. The raw data of temporal dynamism studies therefore should be made
available and reanalysed with the most up to date models when comparing multiple studies
in order to draw accurate comparisons between different ecosystems and species.
The version of Microsoft Excel SOLVER add-in used by Trinder et al. (2012) to fit the
logistic growth curve has been found to have significant issues when fitting nonlinear least
squares models (calculated using the SOLVER add-in). McCullough and Heiser (2008) found
that SOLVER tended to state it had found a converged result when in fact it had not. The
methodology of the calculation is opaque and not readily available, making it unclear if a
solution has been reached or not (Mélard, 2014). These consistent errors lead many
statisticians to recommend against the use of Excel to carry out statistical tests (McCullough
and Wilson, 2005; Mccullough and Heiser, 2008) and this study would echo these
recommendations.
When fitting logistic growth curves, the user often has to provide starting values for
the program to fit the model. In a previous study, when Excel and R were compared using
test datasets with starting values close to the true value, Excel was found to successfully fit
logistic curves to 20 of the 27 test datasets, whilst R successfully fit logistic curves to all of
the same test datasets provided (Odeh et al., 2010). However, the same study (Odeh et al.,
2010) found both software programs performed equally well when analysing linear
regressions. Therefore, the limitations of the software program used for analyses should be
researched prior to use to ensure they are fit for purpose, as each have strengths and
weaknesses when performing different statistical tests.
63
3.4.3 - Effect of sampling frequency and replicates on model estimates
The most accurate estimate (closest to the known value) of peak accumulation rate timing
was found with a sampling frequency of 1 - 6 days. At this sampling frequency there was
little effect of replicate number, with variation from the known value of less than 1 day
between the different numbers of replicates. The dataset only covered 60 growing days, a
relatively small proportion of the total lifecycle of most plants. However, many plant
competition experiments are of a similar length (Trinder et al. 2012). This is not to say that a
sampling interval less than every 6 days is ideal for all plant lifeforms or environmental
conditions, as the dummy dataset used was based on a forb (D. glomerata) growing in
greenhouse conditions. Further studies are required to find the optimum sampling
frequency and replicate number for other lifeforms, timescales and environmental
conditions. Therefore, running a pilot or simulation study prior to carrying out a large scale
temporal dynamism study would determine the appropriate sampling frequency and
replicate number under different conditions.
When designing experiments there are practical considerations including: space,
time and cost (Trinder et al., 2013). This dummy dataset analysis demonstrates that in
temporal dynamism studies of this type, more frequent sampling led to more accurate
estimates of peak accumulation rate timing. With up to a three day sampling frequency,
three replicates is sufficient, whereas at six days and above five replicates are required for
good temporal resolution. This echoes the findings of Kreyling et al. (2018) that sampling
locations (or in this case sampling frequency) are of greater importance when examining
trends compared to replication. However, replicates are of importance when detecting
differences between treatments, as increased replication reduced the confidence interval
size. Therefore, three replicates should be the minimum for statistical robustness to allow
the model to run successfully. The balance between sampling frequency and replicate
number should therefore be in favour of sampling frequency but not completely disregard
replicate number, to ensure the balance between the detection of treatment differences
and sufficient temporal resolution.
64
3.4.4 - Are there potential ecological consequences of the analysis approach and
experimental design of temporal dynamism studies?
Both the number of model parameters and software program caused a change of up to 15
days in the estimate of peak biomass accumulation rate. This suggests that both the model
and software program have a similar impact on the estimated outcome. The ecological
importance of these shifts in peak accumulation rate depends on the species being studied
and the length of the study. For annual or short-lived species, differences in estimates of
peak accumulation rate timing may have important consequences for the ecological
conclusions drawn from them. For example, the lifespan of spring barley can be as little as
four months or ~120 days with ~60 days of active nutrient uptake (Spink, Blake, Bingham,
Hoad, & Foulkes, 2015; Schofield et al., 2019). Therefore, a difference of 15 days represents
25 % of the total nutrient uptake period and 12.5 % of the total lifecycle and so, in short
lived species such as annual crops, the differences in peak accumulation rate caused by
differences in model parameterisation and software program used for analyses may
represent a significant proportion of the lifecycle of the plant. However, in perennial species
that store resources between seasons these differences may have less impact on ecological
conclusions as a result of different model and software program use.
3.5 - Conclusions
Both model parameterisation and the choice of software program caused a similar shift in
the estimate of peak biomass accumulation rate, by up to 15 days. Therefore, when
analysing data from temporal dynamism studies, both the number of parameters included
in the model and the software used should be considerations. Although these differences
are a matter of days, when studying short-lived individuals they may be important in the
drawing of ecological conclusions. Microsoft Excel should be used with caution as there is
evidence of errors in calculations when fitting non-linear models. Before a software
program is used the parameterisation and calculation process should be researched to
ensure that it is fit for purpose, as these can affect estimates of temporally dynamic
processes. The number of replicates was found to have an overall smaller impact on the
timing of peak accumulation rate, whilst sampling frequency had a greater effect on model
65
estimates. Therefore, when there are practical limitations, sampling frequency and
experiment length should be prioritised. These factors are important in the design of
experiments looking at the within-growing season temporal dynamics of resource capture
and the factors that influence temporal dynamism of resource capture. The findings of this
chapter will be used in the experimental design of Chapter 8.
References
Andersen, M. K., Hauggaard-Nielsen, H., Weiner, J. and Jensen, E. S. (2007) Competitive
dynamics in two- and three-component intercrops. Journal of Applied Ecology, 44(3), 545–
551.
Dormann, C. F. and Roxburgh, S. H. (2005) Experimental evidence rejects pairwise modelling
approach to coexistence in plant communities. Proceedings of the Royal Society B: Biological
Sciences, 272(1569), 1279–1285.
Gibson, D., Connolly, J., Hartnett, D. and Weidenhamer, J. (1999) Designs for greenhouse
studies of interactions between plants. Journal of Ecology, 87, 1–16.
Goldberg, D. E. and Barton, A. M. (1992) Patterns and Consequences of Interspecific
Competition in Natural Communities : A Review of Field Experiments with Plants. American
Naturalist, 139(4), 771–801.
Hara, T., van Der Toorn, J. and Mook, J. H. (2006) Growth Dynamics and Size Structure of
Shoots of Phragmites Australis, a Clonal Plant. Journal of Ecology, 81(1), 47–60.
Hunt, R. (1982) Plant growth curves. The functional approach to plant growth analysis.
Edward Arnold Ltd, London.
John Vandermeer (2010) How Populations Grow: The Exponential and Logistic Equations
Learn Science at Scitable. Nature Education.
[https://www.nature.com/scitable/knowledge/library/how-populations-grow-the-
exponential-and-logistic-13240157.] (Accessed on 2nd October 2018)
Kreyling, J., Schweiger, A. H., Bahn, M., Ineson, P., Migliavacca, M., Morel-Journel, T.,
Christiansen, J. R., Schtickzelle, N. and Larsen, K. S. (2018) To replicate, or not to replicate –

66
that is the question: how to tackle nonlinear responses in ecological experiments. Ecology
Letters, 21(11), 1629–1638.
Li, C., Dong, Y., Li, H., Shen, J. and Zhang, F. (2014) The dynamic process of interspecific
interactions of competitive nitrogen capture between intercropped wheat (Triticum
aestivum L.) and Faba Bean (Vicia faba L.). PloS ONE, 9(12), e.0119659.
Li, C., Dong, Y., Li, H., Shen, J. and Zhang, F. (2016) Shift from complementarity to facilitation
on P uptake by intercropped wheat neighboring with faba bean when available soil P is
depleted. Scientific Reports, 6(1), 18663.
Lipiec, J., Doussan, C., Nosalewicz, A. and Kondracka, K. (2013) Effect of drought and heat
stresses on plant growth and yield: A review. International Agrophysics, 27(4), 463–477.
Mccullough, B. D. D. and Heiser, D. A. (2008) On the accuracy of statistical procedures in
Microsoft Excel 2007. Computational Statistics & Data Analysis, 52(10), 4570–4578.
McCullough, B. D. and Wilson, B. (2005) On the accuracy of statistical procedures in
Microsoft Excel 2003. Computational Statistics & Data Analysis, 49(4), 1244–1252.
Mélard, G. (2014) On the accuracy of statistical procedures in Microsoft Excel 2010.
Computational Statistics, 29(5), 1095–1128.
Miller-Rushing, A. J., Inouye, D. W. and Primack, R. B. (2008) How well do first flowering
dates measure plant responses to climate change? The effects of population size and
sampling frequency. Journal of Ecology, 96(6), 1289–1296.
Moreira, E. N., Vale, F. X. R., Paul, P. A., Rodrigues, F. A. and Jesus Júnior, W. C. (2015)
Temporal Dynamics of Soybean Rust Associated With Leaf Area Index in Soybean Cultivars
of different Maturity Groups. Plant Disease, 99(9), 1216–1226.
Neumann, K., Zhao, Y., Chu, J., Keilwagen, J., Reif, J. C., Kilian, B. and Graner, A. (2017)
Genetic architecture and temporal patterns of biomass accumulation in spring barley
revealed by image analysis. BMC Plant Biology, 17(1), 137.
Odeh, O. O., Featherstone, A. M. and Bergtold, J. S. (2010) Reliability of statistical software.
American Journal of Agricultural Economics, 92(5), 1472–1489.
67
Paine, C. E. T., Marthews, T. R., Vogt, D. R., Purves, D., Rees, M., Hector, A. and Turnbull, L.
A. (2012) How to fit nonlinear plant growth models and calculate growth rates: an update
for ecologists. Methods in Ecology and Evolution, 3(2), 245–256.
Robinson, D., Davidson, H., Trinder, C. and Brooker, R. (2010) Root-shoot growth responses
during interspecific competition quantified using allometric modelling. Annals of Botany,
106(6), 921–926.
Schofield, E. J., Rowntree, J. K., Paterson, E., Brewer, M. J., Price, E. A. C., Brearley, F. Q. and
Brooker, R. W. (2019) Cultivar differences and impact of plant-plant competition on
temporal patterns of nitrogen and biomass accumulation. Frontiers in Plant Science, 10, 215.
Schofield, E. J., Rowntree, J. K., Paterson, E. and Brooker, R. W. (2018) Temporal Dynamism
of Resource Capture: A Missing Factor in Ecology? Trends in Ecology and Evolution, 33(4),
277–286.
Spink, J., Blake, J., Bingham, I., Hoad, S. and Foulkes, J. (2015) Barley growth guide Managing
barley growth. [https://cereals.ahdb.org.uk/media/186381/g67-barley-growth-guide.pdf.],
(Accessed 23/01/2020).
R Core Team (2015) R: A Language and Environment for Statistical Computing. R Foundation
for Statistical Computing, 1, 409.
Trinder, C., Brooker, R., Davidson, H. and Robinson, D. (2012) Dynamic trajectories of growth
and nitrogen capture by competing plants. New Phytologist, 193(4), 948–958.
Trinder, C. J., Brooker, R. W. and Robinson, D. (2013) Plant ecology’s guilty little secret:
Understanding the dynamics of plant competition. Functional Ecology, 27(4), 918–929.
Wei, X., Ge, T., Zhu, Z., Hu, Y., Liu, S., Li, Y., Wu, J. and Razavi, B. S. (2018) Expansion of rice
enzymatic rhizosphere: temporal dynamics in response to phosphorus and cellulose
application. Plant and Soil, 445, 169–181.
White, P. J., Cooper, H. D., Clarkson, D. T. and Earnshaw, M. J. (1991) Effects of low
temperature on growth and nutrient accumulation in rye (Secale cereale) and wheat
(Triticum aestivum). Annals of Botany, 67(1), 23–31.

68
Yin, X., Goudriaan, J., Lantinga, E. A., Vos, J. and Spiertz, H. J. (2003) A flexible sigmoid
function of determinate growth. Annals of Botany, 91(3), 361–371.
Zhang, W. P., Liu, G. C., Sun, J. H., Fornara, D., Zhang, L. Z., Zhang, F. F. and Li, L. (2017)
Temporal dynamics of nutrient uptake by neighbouring plant species: evidence from
intercropping. Functional Ecology, 31(2), 469–479.
69
Chapter 4
Temporal patterns of soil processes: cultivar differences and the impact of
plant-plant competition
Contents
4.1 - Introduction
4.2 - Materials and methods
4.2.1 - Soil characteristics
4.2.2 - Experimental setup
4.2.3 - Soil respiration sampling
4.2.4 - Soil solution sampling
4.2.5 - Soil nitrogen
4.2.6 - Statistical analysis
4.2.6.1 - Root derived respiration
4.2.6.2 - SOM derived respiration
4.2.6.3 - Root Priming effect
4.3 - Results
4.3.1 - Root biomass
4.3.2 - Root derived respiration
4.3.3 - Root priming effect
4.3.4 - Microbial biomass
4.3.5 - Soil solution analysis
4.3.6 - Soil nitrogen
4.4 - Discussion
4.4.1. - Root respiration and priming are not temporally dynamic in response to competition
4.4.2 - Effect on final soil nitrogen concentration
4.4.3 - Are soil processes temporally dynamic in response to plant-plant competition?
4.5 – Conclusions
70
Abstract
The soil microbial community has an important role in plant-plant competition by
converting nutrients locked away in soil organic matter into forms suitable for plant uptake.
Plants can reduce competition for resources through niche differentiation including
changing the temporal dynamics of nutrient uptake to reduce direct competition and
therefore promote coexistence. However, the role of soil processes in the temporal
dynamics of nutrient uptake in response to plant-plant competition has yet to be explored.
This study used two barley cultivars, Tammi and Proctor, grown in isolation, intra- or inter-
cultivar competition. Root derived and primed soil respiration were measured using 13C
labelled CO2, alongside soil solution samples taken to analyse soil nitrogen and organic
carbon dynamics. Soil nitrogen concentrations and microbial biomass were analysed at the
end of the experiment. Root derived and primed soil respiration peaked at 29 days after
planting and then decreased but showed no change in temporal dynamics with competition.
However, plants in competition had lower respiration per unit biomass. Mineral soil
nitrogen decreased during the experiment and dissolved organic carbon concentration
increased, indicating soil organic matter breakdown. Only organic carbon demonstrated a
change in temporal dynamism in response to competition. This suggests that there is a need
to look at specific soil processes as not all may be temporally dynamic in response to
competition.
4.1 - Introduction
The soil microbial community has an important role in nutrient cycling, mining soil organic
matter (SOM) for nutrients that are then made accessible to plants through microbial
turnover (Hodge et al., 2000). This background process is influenced by seasonal pulses of
nutrients associated with spring warming in temperate environments (Bardgett et al., 2005)
or seasonal rains in semi-arid environments, providing temporally dynamic inputs of
nutrients into a system (Chesson et al., 2004).
Much of the activity of the soil microbial community is supported by plant roots,
through the exudation of low molecular weight organic compounds into the rhizosphere
(Alegria Terrazas et al., 2016; de Vries and Caruso, 2016; Laliberté, 2016). This stimulates
71
the soil microbial community to mine SOM for nutrients (Rhizosphere Priming Effect (RPE)
(Dijkstra et al., 2013)). In this study priming is defined as the plant driven SOM
mineralisation activity carried out by the soil microbial community (i.e. the increase in SOM
mineralisation, relative to unplanted soil). The RPE is dependent on the availability of
nutrients (Dijkstra et al., 2013), soil carbon-nitrogen ratio (C:N) (Lloyd et al., 2016) and
microbial demand for resources (Hodge et al., 2000). There is increasing evidence that root
exudation of labile carbon can stimulate the activity of SOM decomposers and provide the
plant with enhanced nutrient availability (Hamilton III and Frank, 2001). The RPE is could
well be temporally dynamic, as root exudation quality and quantity varies with plant
developmental stage (Chaparro et al. 2012), as well as between genotypes and species
(Mommer et al. 2016). Therefore, RPE is a critical component of plant nutrient uptake and is
likely to be an intrinsic component of the temporal dynamics of nutrient uptake.
The temporal dynamics (timing and rate) of nutrient uptake are important for plant
development, successful flowering (Ne’eman et al., 2006), viable seed set (Fenner, 1991)
and long term species survival. The timing and rate of nutrient uptake varies over the course
of a growing season, and in some species coincides with plant demand (Trinder et al., 2012).
Differences in the temporal dynamics of nutrient uptake are evident at a species (Trinder et
al., 2012) and genotype level (Schofield et al., 2019). These dynamics may be one
mechanism by which plants segregate nutrient uptake over time, reducing direct
competition for resources and ultimately promoting coexistence. This may be important to
understand coexistence in complex ecosystems. In current niche models there are
seemingly insufficient niches to explain the coexistence of species in ecosystems such as
rain forests and grasslands (Clark, 2010). However, these models often overlook time as a
factor, in particular within-growing season temporal dynamism of nutrient uptake (Schofield
et al., 2018). Therefore, understanding the temporal dynamics of nutrient uptake would
allow the integration of another currently missing factor in niche models.
Temporal dynamism in nutrient uptake has the potential to alter plant interactions
but competition can also impact the temporal dynamics of nutrient uptake. Trinder et al.
(2012) found that interspecific competition between Dactylis glomerata and Plantago
lanceolata altered the temporal dynamics of nitrogen and biomass accumulation in both
72
species. Therefore, plant-plant competition can influence the temporal dynamics of
resource uptake, which can in turn influence the extent of competition between individuals.
A previous study (Schofield et al., 2019) used barley (Hordeum vulgare) as a model species,
growing two cultivars with differing phenology, an early (Tammi) and late (Proctor), in
isolation, intra-cultivar and inter-cultivar competition. Temporally dynamic shifts were not
evident in the rate of biomass accumulation but were found in peak nitrogen accumulation
rate. Proctor delayed peak nitrogen uptake rate by 14.5 days and Tammi advanced it by 0.5
days when in intra-cultivar competition compared to inter-cultivar competition and plants in
isolation. This study will test whether, in parallel to these plant level effects, the temporal
dynamics of soil processes are impacted by plant-plant competition. It is expected that peak
priming of the soil microbial community will be significantly delayed when Proctor is in
intra-cultivar competition but not in the other treatments, in line with the shifts observed in
Chapter 2 (Schofield et al., 2019).
4.2 - Materials and Methods
4.2.1 - Soil characteristics
The soil was sampled from an agricultural field (Balruddery Farm, Invergowrie, Scotland,
56.4837° N, 3.1314° W) that had previously contained spring barley (Hordeum vulgare) and
had been subject to standard management for barley production (including fertiliser
addition at a rate of 500 kg of 22N-4P-14K ha-1 yr-1). The soil had an organic matter content
(humus) of 6.2% ± 0.3% SEM (loss-on-ignition, n = 4) and a mean pH (in water) of 5.7 ±0.02
SEM (n = 4), a total inorganic nitrogen concentration of 1.55 ± 0.46 mg g-1 (n = 4) and
microbial C biomass (using a chloroform extraction) of 0.06 ± 0.002 SEM mg g-1 (n = 4)
(analysed by Konelab Aqua 20 Discrete Analyser (Thermo Scientific, Waltham, MA USA)).
The soil was passed through a 6 mm sieve and stored at 4°C prior to use.
4.2.2 - Experimental setup
In this experiment two cultivars of Barley (Hordeum vulgare), the early developing Tammi
and late Proctor were grown in isolation, and in intra- or inter- cultivar competition (T, P, TT,
73
PP, TP). Plants were grown in a carbon-13 enriched CO2 (13CO2) environment during the
entire growth period. This continuous labelling ensures that the plant C is uniformly labelled
above and below ground, and therefore allows partitioning of plant and soil sources of
respiration. Respiration by plant roots as well as respiration of 13C-labelled root exudates by
the soil microbial community will result in detectable 13CO2 in soil respiration gas samples.
This is a useful measure of plant investment in roots over time. In addition, any increase
(relative to the unplanted controls) in soil organic matter derived respiration (12CO2) found
in the planted treatments provides an indication of the priming effect plant roots are having
on the soil microbial community (Murphy et al., 2015).
The pots were packed to a dry bulk density of 1 g cm-3 and watered to 54 % of the
soil water holding capacity, to provide sufficient moisture to the plants whilst limiting
waterlogging of the soil. This was maintained by watering twice a week, including on the day
of soil respiration sampling for the duration of the experiment, to limit competition for
water. Pots containing bare soil were included as controls. Seeds of Tammi and Proctor
cultivars of barley were germinated before being planted into pots, with four replicates of
each treatment, 24 pots in total. The pots also contained a respiration chamber, a jar with a
sealed lid containing ports to allow flushing of the headspace and an open bottom inserted
2 cm into the soil in the middle of the pot (headspace volume 210 ml). Germinated barley
plants were planted at the side of the respiration chamber when the pot contained one
plant, and on either side of a respiration chamber in pots with two plants (Diagram 4.1).
Pots with rigid sides (diameter = 102 mm, depth = 135 mm) were used to avoid shifting of
the respiration chamber when the pots were moved.
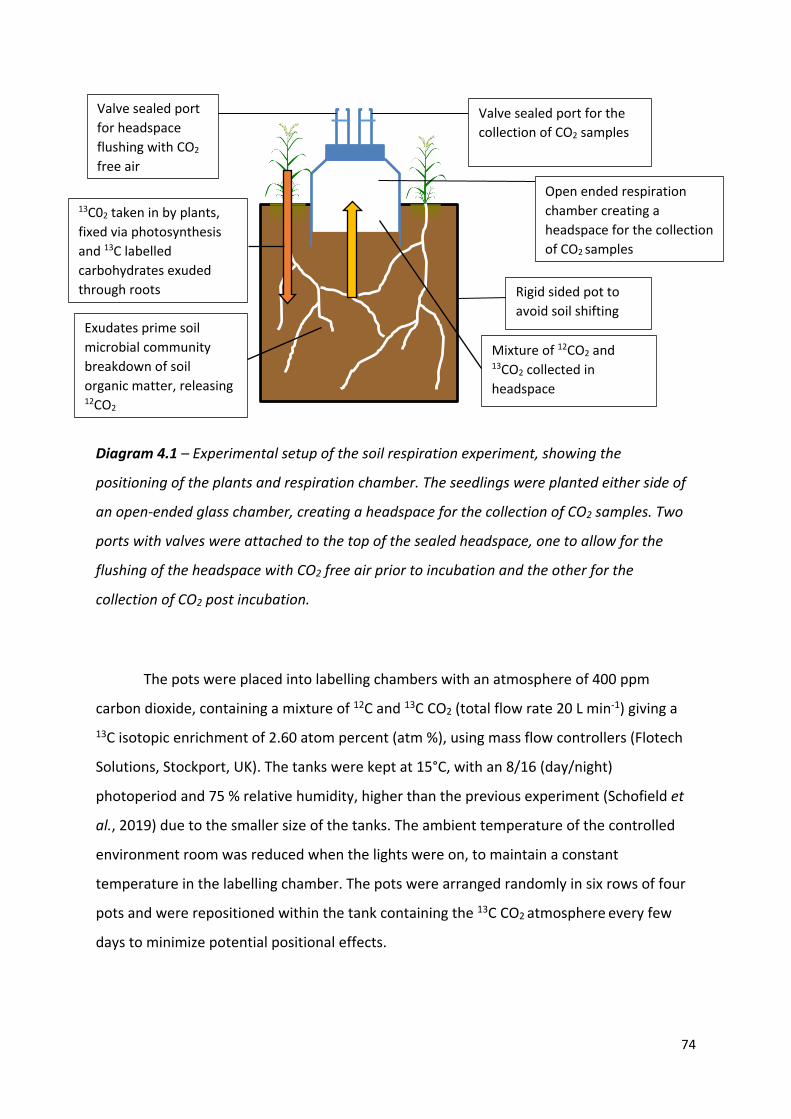
74
Diagram 4.1 – Experimental setup of the soil respiration experiment, showing the
positioning of the plants and respiration chamber. The seedlings were planted either side of
an open-ended glass chamber, creating a headspace for the collection of CO2 samples. Two
ports with valves were attached to the top of the sealed headspace, one to allow for the
flushing of the headspace with CO2 free air prior to incubation and the other for the
collection of CO2 post incubation.
The pots were placed into labelling chambers with an atmosphere of 400 ppm
carbon dioxide, containing a mixture of 12C and 13C CO2 (total flow rate 20 L min-1) giving a 13C isotopic enrichment of 2.60 atom percent (atm %), using mass flow controllers (Flotech
Solutions, Stockport, UK). The tanks were kept at 15°C, with an 8/16 (day/night)
photoperiod and 75 % relative humidity, higher than the previous experiment (Schofield et
al., 2019) due to the smaller size of the tanks. The ambient temperature of the controlled
environment room was reduced when the lights were on, to maintain a constant
temperature in the labelling chamber. The pots were arranged randomly in six rows of four
pots and were repositioned within the tank containing the 13C CO2 atmosphere every few
days to minimize potential positional effects.
Rigid sided pot to avoid soil shifting
Open ended respiration chamber creating a headspace for the collection of CO2 samples
Valve sealed port for the collection of CO2 samples
Valve sealed port for headspace flushing with CO2 free air
13C02 taken in by plants, fixed via photosynthesis and 13C labelled carbohydrates exuded through roots
Exudates prime soil microbial community breakdown of soil organic matter, releasing 12CO2
Mixture of 12CO2 and 13CO2 collected in headspace
75
4.2.3 - Soil respiration sampling
Soil respiration samples were taken once a week for six weeks through a valve in the
respiration chamber. On sampling days, the headspace of the respiration chamber was
flushed with CO2 free air for five minutes, the CO2 concentration recorded, and the jars
sealed (C1 value in Equation 2). The pots were then replaced into the tanks and incubated in
the dark for three hours. Ten ml of air from the headspace of each pot was sampled, the
CO2 concentration recorded (EGM-4, PP Systems, Amesbury, Massachusetts, USA) and
samples taken for isotopic analysis. The 12C to 13C ratio was analysed using a gas bench
(Deltaplus Advantage Thermo Scientific, Bremen, Germany) interfaced with an isotopic ratio
mass spectrometer (Trace Ultra GC Thermo Scientific, Bremen, Germany). After 42 days, the
pots were harvested, the shoots separated and the total root biomass for the pot washed.
The shoots and roots were stored at -20°C then freeze dried and weighed.
4.2.4 - Soil solution sampling
Soil solution samples were taken weekly using a micro-rhizon soil solution sampler (Van
Walt Environmental Equipment & Services, Surrey, UK) and frozen at -20°C prior to analysis.
Soil solution samples were selected for analysis covering the period of 21-35 days after
planting, the period of maximum soil microbial community priming based on the soil-
derived CO2 flux results. Solutions were analysed for nitrate (NO3), ammonium (NH4), total
organic carbon (TOC), total nitrogen in soil solution (TN) and total organic nitrogen (TON)
concentration directly, using a Konelab Aqua 20 Discrete Analyser (Thermo Scientific,
Waltham, MA USA).
4.2.5 - Soil mineral nitrogen
The bulk soil mineral nitrogen concentration at the end of the soil respiration experiment
was measured using potassium chloride (KCl) extraction (McTaggart and Smith, 1993). Fifty
ml of 1 M KCl was added to the wet equivalent of 12.5 g of dry soil. This was then mixed in
an end-over-end shaker for 1 hour, then filtered through Type 1 Whatman filter paper (GE
Healthcare Life Sciences, Buckinghamshire, UK), which had been pre-rinsed with 1 M KCl
76
three times. The samples were analysed using a Konelab Aqua 20 Discrete Analyser (Thermo
Scientific, Waltham, MA USA).
4.2.6 - Microbial biomass
Microbial biomass was measured by the difference in dissolved organic carbon (DOC)
concentration between extracts from chloroform fumigated and non-fumigated soil samples
(Vance et al., 1987). Two samples of moist soil were taken from a homogenous soil sample
from each pot at the end of the experiment, with the equivalent mass of 12.5 g dry soil. The
samples to be fumigated were placed in a vacuum desiccator containing chloroform and a
vacuum applied overnight. The fumigated and non-fumigated soils were then added to 50
ml 0.5 M potassium sulphate (K2SO4) and mixed using an end-over-end shaker for 30 min.
The samples were filtered through Whatman 42 filter paper (GE Healthcare Life Sciences,
Buckinghamshire, UK) and analysed using an OI 1010 TOC Analyser (O.I. Analytical, Texas,
USA). The difference in carbon content between the fumigated and non-fumigated samples
was then used to determine the microbial biomass (conversion factor 0.45 (Wu et al., 1990))
per pot.
4.2.6 - Statistical analysis
The data were analysed differently, depending on whether it was a repeated measure or
was sampled at the end of the experiment (Table 4.1).
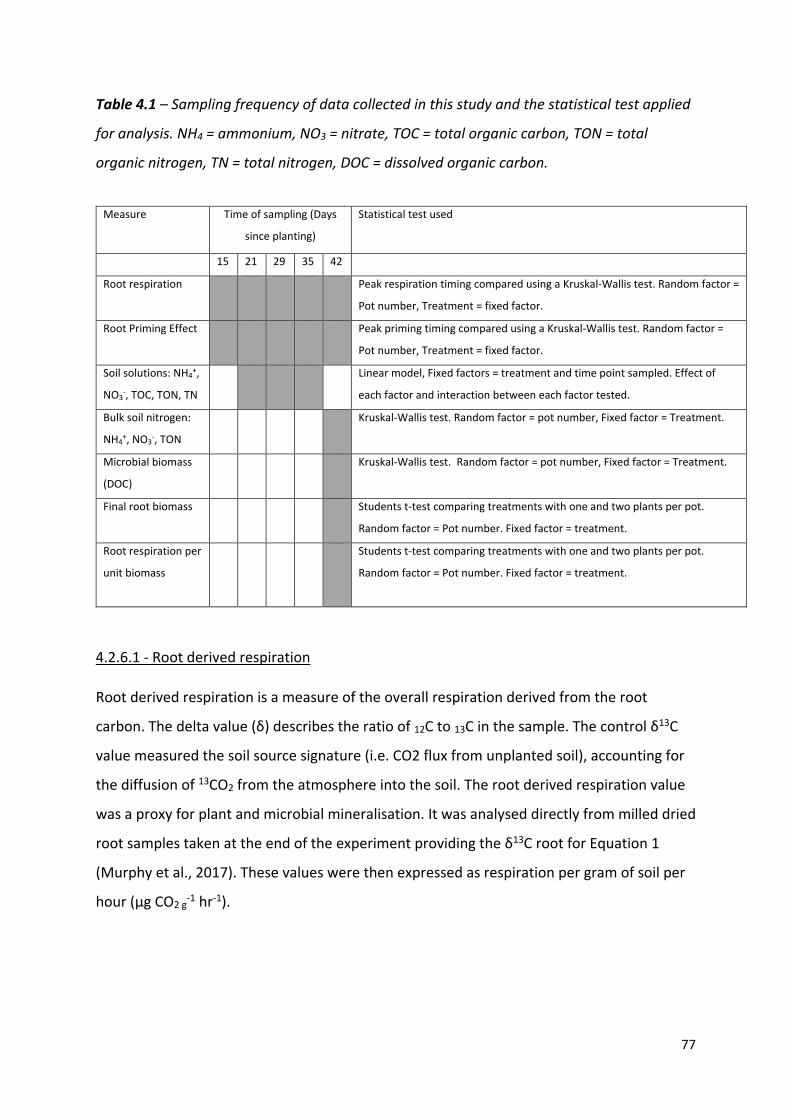
77
Table 4.1 – Sampling frequency of data collected in this study and the statistical test applied
for analysis. NH4 = ammonium, NO3 = nitrate, TOC = total organic carbon, TON = total
organic nitrogen, TN = total nitrogen, DOC = dissolved organic carbon.
4.2.6.1 - Root derived respiration
Root derived respiration is a measure of the overall respiration derived from the root
carbon. The delta value (δ) describes the ratio of 12C to 13C in the sample. The control δ13C
value measured the soil source signature (i.e. CO2 flux from unplanted soil), accounting for
the diffusion of 13CO2 from the atmosphere into the soil. The root derived respiration value
was a proxy for plant and microbial mineralisation. It was analysed directly from milled dried
root samples taken at the end of the experiment providing the δ13C root for Equation 1
(Murphy et al., 2017). These values were then expressed as respiration per gram of soil per
hour (µg CO2 g-1 hr-1).
Measure Time of sampling (Days
since planting)
Statistical test used
15 21 29 35 42
Root respiration Peak respiration timing compared using a Kruskal-Wallis test. Random factor =
Pot number, Treatment = fixed factor.
Root Priming Effect Peak priming timing compared using a Kruskal-Wallis test. Random factor =
Pot number, Treatment = fixed factor.
Soil solutions: NH4+,
NO3-, TOC, TON, TN
Linear model, Fixed factors = treatment and time point sampled. Effect of
each factor and interaction between each factor tested.
Bulk soil nitrogen:
NH4+, NO3
-, TON
Kruskal-Wallis test. Random factor = pot number, Fixed factor = Treatment.
Microbial biomass
(DOC)
Kruskal-Wallis test. Random factor = pot number, Fixed factor = Treatment.
Final root biomass Students t-test comparing treatments with one and two plants per pot.
Random factor = Pot number. Fixed factor = treatment.
Root respiration per
unit biomass
Students t-test comparing treatments with one and two plants per pot.
Random factor = Pot number. Fixed factor = treatment.
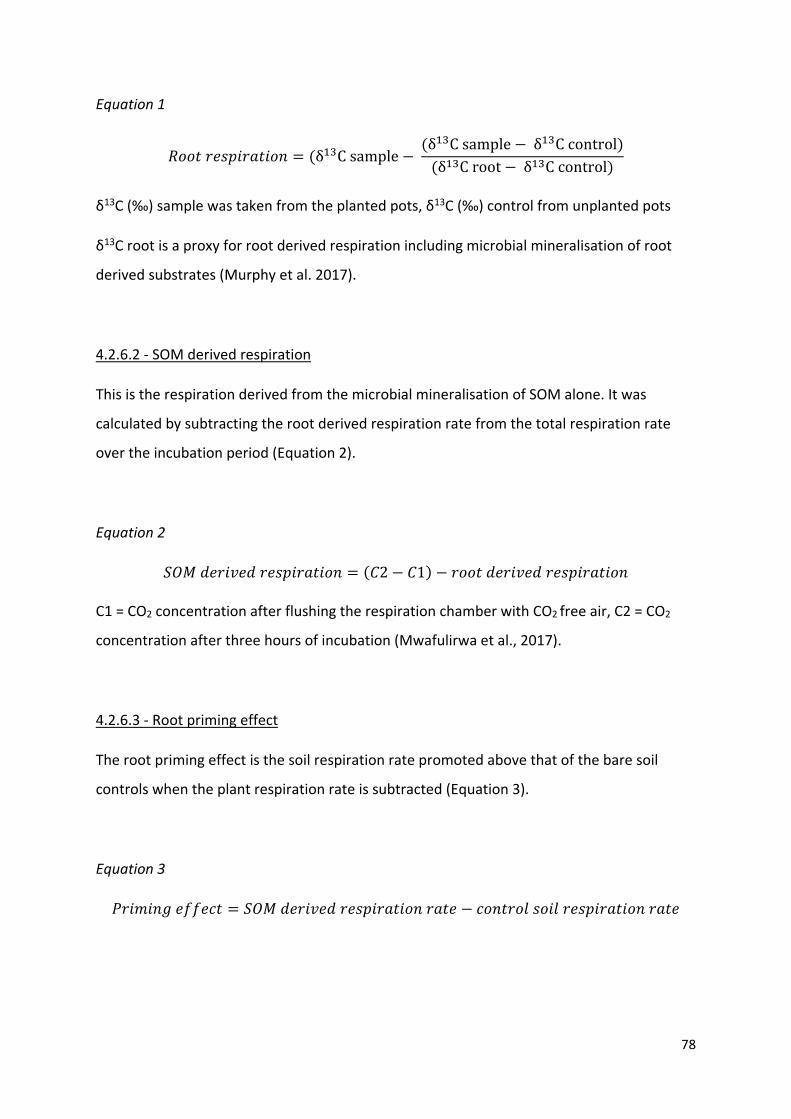
78
Equation 1
𝑅𝑅𝐶𝐶𝐶𝐶𝐶𝐶 𝑚𝑚𝐶𝐶𝐼𝐼𝐶𝐶𝐶𝐶𝑚𝑚𝐼𝐼𝐶𝐶𝐶𝐶𝐶𝐶𝐶𝐶 = (δ13C sample − (δ13C sample − δ13C control)
(δ13C root − δ13C control)
δ13C (‰) sample was taken from the planted pots, δ13C (‰) control from unplanted pots
δ13C root is a proxy for root derived respiration including microbial mineralisation of root
derived substrates (Murphy et al. 2017).
4.2.6.2 - SOM derived respiration
This is the respiration derived from the microbial mineralisation of SOM alone. It was
calculated by subtracting the root derived respiration rate from the total respiration rate
over the incubation period (Equation 2).
Equation 2
𝑆𝑆𝑆𝑆𝑆𝑆 𝑑𝑑𝐶𝐶𝑚𝑚𝐶𝐶𝑐𝑐𝐶𝐶𝑑𝑑 𝑚𝑚𝐶𝐶𝐼𝐼𝐶𝐶𝐶𝐶𝑚𝑚𝐼𝐼𝐶𝐶𝐶𝐶𝐶𝐶𝐶𝐶 = (𝐶𝐶2 − 𝐶𝐶1) − 𝑚𝑚𝐶𝐶𝐶𝐶𝐶𝐶 𝑑𝑑𝐶𝐶𝑚𝑚𝐶𝐶𝑐𝑐𝐶𝐶𝑑𝑑 𝑚𝑚𝐶𝐶𝐼𝐼𝐶𝐶𝐶𝐶𝑚𝑚𝐼𝐼𝐶𝐶𝐶𝐶𝐶𝐶𝐶𝐶
C1 = CO2 concentration after flushing the respiration chamber with CO2 free air, C2 = CO2
concentration after three hours of incubation (Mwafulirwa et al., 2017).
4.2.6.3 - Root priming effect
The root priming effect is the soil respiration rate promoted above that of the bare soil
controls when the plant respiration rate is subtracted (Equation 3).
Equation 3
𝑃𝑃𝑚𝑚𝐶𝐶𝐶𝐶𝐶𝐶𝐶𝐶𝑃𝑃 𝐶𝐶𝑒𝑒𝑒𝑒𝐶𝐶𝑐𝑐𝐶𝐶 = 𝑆𝑆𝑆𝑆𝑆𝑆 𝑑𝑑𝐶𝐶𝑚𝑚𝐶𝐶𝑐𝑐𝐶𝐶𝑑𝑑 𝑚𝑚𝐶𝐶𝐼𝐼𝐶𝐶𝐶𝐶𝑚𝑚𝐼𝐼𝐶𝐶𝐶𝐶𝐶𝐶𝐶𝐶 𝑚𝑚𝐼𝐼𝐶𝐶𝐶𝐶 − 𝑐𝑐𝐶𝐶𝐶𝐶𝐶𝐶𝑚𝑚𝐶𝐶𝐼𝐼 𝐼𝐼𝐶𝐶𝐶𝐶𝐼𝐼 𝑚𝑚𝐶𝐶𝐼𝐼𝐶𝐶𝐶𝐶𝑚𝑚𝐼𝐼𝐶𝐶𝐶𝐶𝐶𝐶𝐶𝐶 𝑚𝑚𝐼𝐼𝐶𝐶𝐶𝐶
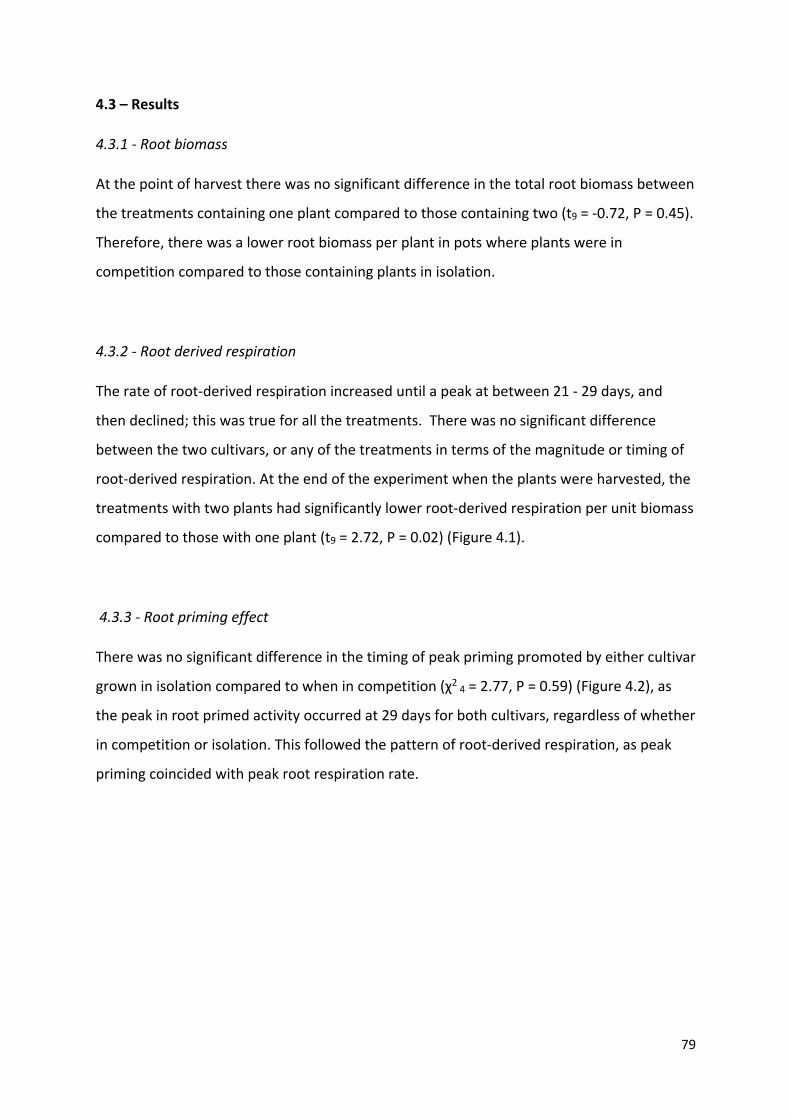
79
4.3 – Results
4.3.1 - Root biomass
At the point of harvest there was no significant difference in the total root biomass between
the treatments containing one plant compared to those containing two (t9 = -0.72, P = 0.45).
Therefore, there was a lower root biomass per plant in pots where plants were in
competition compared to those containing plants in isolation.
4.3.2 - Root derived respiration
The rate of root-derived respiration increased until a peak at between 21 - 29 days, and
then declined; this was true for all the treatments. There was no significant difference
between the two cultivars, or any of the treatments in terms of the magnitude or timing of
root-derived respiration. At the end of the experiment when the plants were harvested, the
treatments with two plants had significantly lower root-derived respiration per unit biomass
compared to those with one plant (t9 = 2.72, P = 0.02) (Figure 4.1).
4.3.3 - Root priming effect
There was no significant difference in the timing of peak priming promoted by either cultivar
grown in isolation compared to when in competition (χ2 4 = 2.77, P = 0.59) (Figure 4.2), as
the peak in root primed activity occurred at 29 days for both cultivars, regardless of whether
in competition or isolation. This followed the pattern of root-derived respiration, as peak
priming coincided with peak root respiration rate.
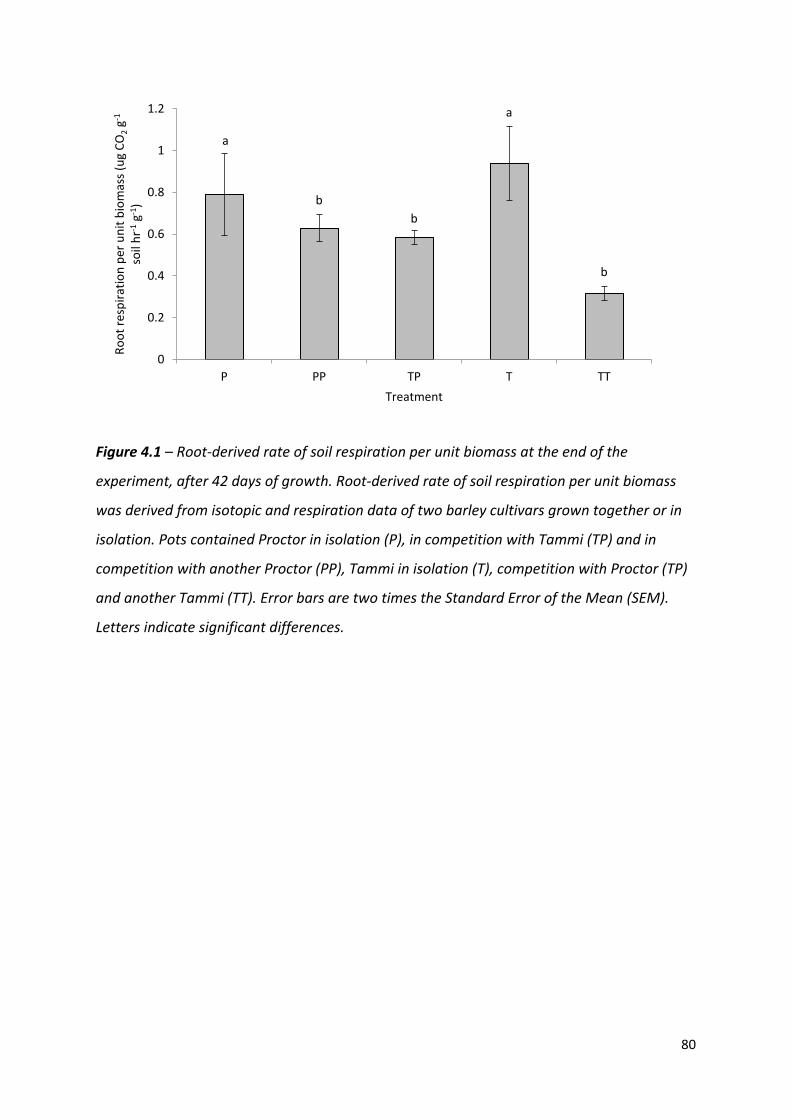
80
Figure 4.1 – Root-derived rate of soil respiration per unit biomass at the end of the
experiment, after 42 days of growth. Root-derived rate of soil respiration per unit biomass
was derived from isotopic and respiration data of two barley cultivars grown together or in
isolation. Pots contained Proctor in isolation (P), in competition with Tammi (TP) and in
competition with another Proctor (PP), Tammi in isolation (T), competition with Proctor (TP)
and another Tammi (TT). Error bars are two times the Standard Error of the Mean (SEM).
Letters indicate significant differences.
a
bb
a
b
0
0.2
0.4
0.6
0.8
1
1.2
P PP TP T TT
Root
resp
iratio
n pe
r uni
t bio
mas
s (ug
CO
2g-1
soil
hr-1
g-1)
Treatment
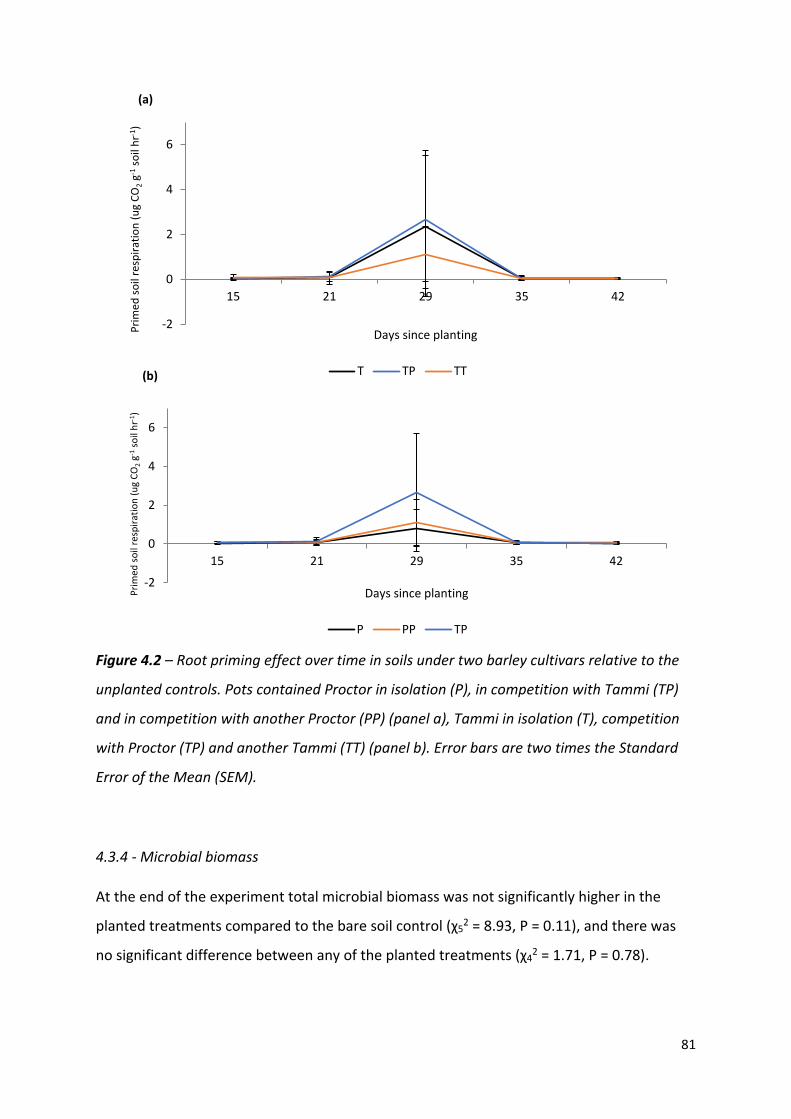
81
Figure 4.2 – Root priming effect over time in soils under two barley cultivars relative to the
unplanted controls. Pots contained Proctor in isolation (P), in competition with Tammi (TP)
and in competition with another Proctor (PP) (panel a), Tammi in isolation (T), competition
with Proctor (TP) and another Tammi (TT) (panel b). Error bars are two times the Standard
Error of the Mean (SEM).
4.3.4 - Microbial biomass
At the end of the experiment total microbial biomass was not significantly higher in the
planted treatments compared to the bare soil control (χ52 = 8.93, P = 0.11), and there was
no significant difference between any of the planted treatments (χ42 = 1.71, P = 0.78).
-2
0
2
4
6
15 21 29 35 42
Prim
ed so
il re
spira
tion
(ug
CO2
g-1so
il hr
-1)
Days since planting
T TP TT
-2
0
2
4
6
15 21 29 35 42
Prim
ed so
il re
spira
tion
(ug
CO2
g-1so
il hr
-1)
Days since planting
P PP TP
(a)
(b)
82
4.3.5 - Soil solution analysis
The concentration of ammonium (NH4+) in the soil solution samples was not significantly
affected by time or treatment between the planted treatments (F(12,46) = 1.09, P = 0.39). This
was also found for nitrate (F(12,46) = 1.92, P = 0.06), total organic nitrogen (F(14, 44) = 1.62, P =
0.11) and total nitrogen (F(14, 45) = 1.55, P = 0.13).
There were significant effects of both time (F(2, 45) = 9.52, P <0.01) and treatment (F(4,
45) = 4.23, P <0.01) on the concentration of TOC in the soil solutions (Figure 4.3). However, at
the end of the experiment there was no significant difference between the treatments.
There was also no significant interaction between time and treatment (F(8, 45) = 0.79, P =
0.61).
Figure 4.3 – Mean soil solution concentration of total organic carbon from pots containing
barley cultivars grown in isolation, inter- or intra- cultivar competition. Proctor = P, Proctor
and Proctor = PP, Tammi and Proctor = TP, Tammi = T, Tammi and Tammi = TT. Error bars
are the twice the standard error of the mean. Letters indicate significant differences.
aa
a
bb
b
0
5
10
15
20
25
30
P PP TP T TT
Aver
age
TOC
conc
entr
atio
n (m
g l-1
)
Treatment21 days 29 days 35 days
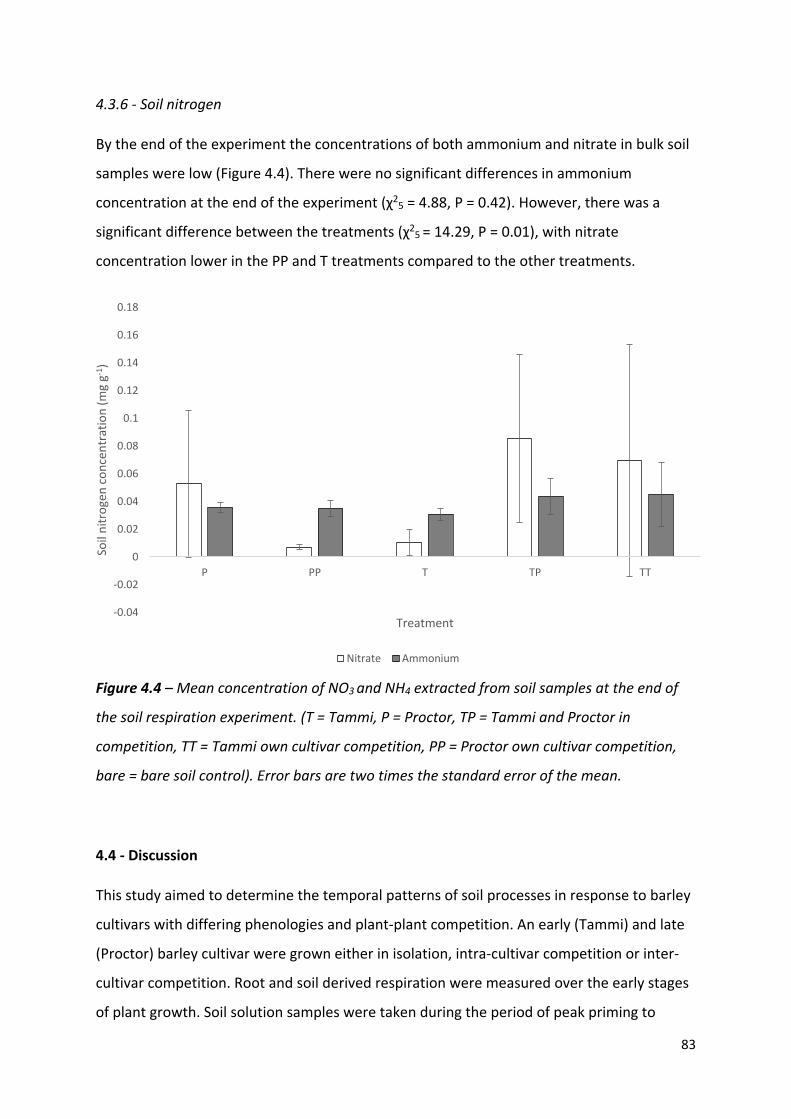
83
4.3.6 - Soil nitrogen
By the end of the experiment the concentrations of both ammonium and nitrate in bulk soil
samples were low (Figure 4.4). There were no significant differences in ammonium
concentration at the end of the experiment (χ25 = 4.88, P = 0.42). However, there was a
significant difference between the treatments (χ25 = 14.29, P = 0.01), with nitrate
concentration lower in the PP and T treatments compared to the other treatments.
Figure 4.4 – Mean concentration of NO3 and NH4 extracted from soil samples at the end of
the soil respiration experiment. (T = Tammi, P = Proctor, TP = Tammi and Proctor in
competition, TT = Tammi own cultivar competition, PP = Proctor own cultivar competition,
bare = bare soil control). Error bars are two times the standard error of the mean.
4.4 - Discussion
This study aimed to determine the temporal patterns of soil processes in response to barley
cultivars with differing phenologies and plant-plant competition. An early (Tammi) and late
(Proctor) barley cultivar were grown either in isolation, intra-cultivar competition or inter-
cultivar competition. Root and soil derived respiration were measured over the early stages
of plant growth. Soil solution samples were taken during the period of peak priming to
-0.04
-0.02
0
0.02
0.04
0.06
0.08
0.1
0.12
0.14
0.16
0.18
P PP T TP TT
Soil
nitr
ogen
con
cent
ratio
n (m
g g-1
)
Treatment
Nitrate Ammonium
84
examine potential impacts of priming on nitrogen dynamics. Bulk soil samples from the end
of the experiment were taken to determine if there was any cultivar or competition effect
on the final soil mineral nitrogen concentration and microbial biomass.
4.4.1 - Root respiration and priming are not temporally dynamic in response to competition
Root respiration and priming were not significantly different between pots containing plants
in competition compared to isolation. This indicates the impact that competition had on net
root respiration and priming as the measurements taken were at the pot scale. The
measurements taken in this study when plants were in competition represent the combined
fluxes of both plants, instead of each individual plant separately. Competition may have
caused upregulation in one individual and downregulation in the other, leading to a lack of
individual response resolution. Further studies labelling an individual plant could determine
if there is variation at an individual plant scale.
Root biomass and total respiration at the end of the experiment were not
significantly different between treatments containing one or two plants. However, at the
end of the experiment there was a lower root respiration per unit biomass in treatments
with two plants. This indicates that competition limited plant growth and activity. A low
respiration per unit biomass in the competition treatments may also be due to the period of
low RPE at the end of the experiment (Figure 4.2). This may have been because soil nitrogen
became depleted more quickly in these pots compared to those that contained only one
plant.
Peak root respiration and the root priming effect both occurred between 25-29 days
after planting in all treatments. The fact these events coincide supports the root priming
effect theory, as greater root respiration indicates more root activity (including the
exudation of organic carbon), which can lead to priming of the soil community and turnover
of the soil microbial community within days (Hodge et al., 2000).
The rhizosphere priming effect, mediated by impacts of root exudation of microbial
communities, did not exhibit any temporally dynamic change in response to the presence of
a competitor, regardless of the identity of the competitor. Soil community priming is
85
important when concentrations of bioavailable nutrients are insufficient to support plant
requirements (Dijkstra et al., 2013). This experiment used a fertilized agricultural soil, with
high nitrogen content at the beginning of the experiment, which may have delayed a
competition response in a neighbouring plant. Detection of a neighbouring plant can occur
through overlapping of nitrogen depletion zones (Craine and Dybzinski, 2013) or through
belowground signaling, for example using volatile organic compounds or root exudates
(Pierik et al., 2013). However, the dataset was highly variable and the frequency of sampling
may have been too low to measure the timing of these soil processes, many of which occur
over the timescale of hours (Hodge et al., 2000). Therefore, a clear determination of fine
scale temporal dynamism of RPE may require a similar study at a finer temporal scale. Also,
a direct focus on specific microbial processes involved in nutrient mobilisation from organic
matter rather than carbon mineralisation would lead to a more sensitive assay of soil
microbial processes.
Despite the effect of RPE, at the end of the experiment there was no significant
difference in the microbial biomass between the planted treatments. By the end of the
experiment there was extensive root growth, and so all soil within the pots was considered
to be rhizosphere. This could indicate that any increase in microbial biomass was transient,
occurring during the period of peak priming and was therefore not recorded at the end of
the experiment. Alternatively it could suggest that priming by plants in competition
compared to those in isolation does not support a larger microbial population but a
community with different functioning (Houlden et al., 2008). The observed temporal
dynamics of TOC indicates SOM mining during the period, with a stronger response likely to
be found as soil closer to roots is sampled.
There was a significantly higher total TOC concentration in the soil solutions sampled
from planted treatments compared to the unplanted control. As positive priming of the soil
community occurred it indicates SOM was being broken down by the soil microbial
community (Dijkstra et al., 2013). There were also significant differences between some of
the planted treatments and over time. However, there was no significant difference in TOC
concentration at the final sampling date, suggesting that although cultivar and competition
may have altered the temporal dynamics of TOC formation, it had little effect on the final
TOC concentration. This contrasts with the soil respiration results, which suggest little
86
temporal dynamism in the soil community activity. This suggests that changes in the
temporal dynamics of the soil community may be better examined by looking at individual
processes instead of total activity. Further studies including measures of microbial
community structure and function changes over time are needed to test this hypothesis.
The lack of difference in soil nitrogen at the end of the study suggests that plants
took up all the available nitrogen, depleting the mineral nitrogen pool. The concentration of
nitrogen in soil solution is a function of both production (SOM breakdown) and consumption
(plant uptake) processes. Therefore, differences in the concentration of nitrogen forms may
be due to an increase or decrease in either the production of nitrate and ammonium or
plant consumption rates. As NO3 and NH4 are intermediates between SOM and plant
assimilated nitrogen (Hodge et al., 2000), they are unlikely to be highly abundant in the soil
solution, as they are rapidly taken up by plants. Any differences between the treatments
therefore would be an indication of a bottleneck in the nitrogen mineralisation process
(Chapman et al., 2006). There may also be a balance between immobilization of nitrogen by
microbes and plant uptake, leading to competition between plants and microbes for
different forms of nitrogen. The intensity of competition depends on the predominant
nitrogen form, its availability and demand for it (Schimel and Bennett, 2004). As it is the
depolymerisation of macromolecules that is thought to be the limiting factor in nitrogen
mineralisation (Schimel and Bennett, 2004), understanding the dynamics of the breakdown
of macromolecules may help explain nitrogen dynamics in this study.
There was also no significant differences found in the soil samples taken at the end
of the experiment, with no significant difference in NH4, NO3 or TON between any of the
planted treatments. By the end of the experiment the plants were exhibiting symptoms of
nitrogen deficiency and remobilisation of nitrogen from the older leaves. This is supported
by the significant decrease in total nitrogen in the planted soils compared to the bare soil
controls. Therefore, all the planted treatments utilised the available nitrogen, with plants in
isolation absorbing more nitrogen per unit biomass than those in competition until the
nitrogen in the pots was depleted. The absence of promotion of an increase in RPE may
have been due to the life stage of the plants. All the plants in this study had begun to
produce flag leaves, the growth stage prior to grain production, a sign of a reduction in
nitrogen uptake and an increase in nitrogen remobilisation. This may explain why nitrogen
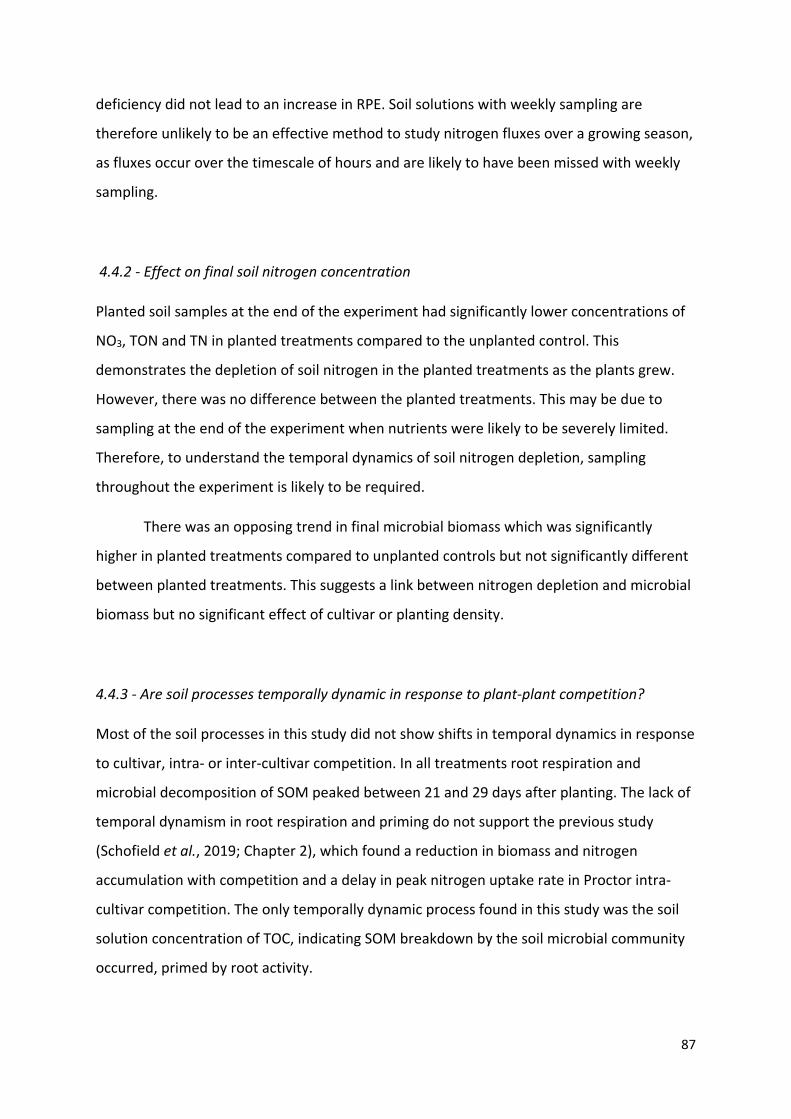
87
deficiency did not lead to an increase in RPE. Soil solutions with weekly sampling are
therefore unlikely to be an effective method to study nitrogen fluxes over a growing season,
as fluxes occur over the timescale of hours and are likely to have been missed with weekly
sampling.
4.4.2 - Effect on final soil nitrogen concentration
Planted soil samples at the end of the experiment had significantly lower concentrations of
NO3, TON and TN in planted treatments compared to the unplanted control. This
demonstrates the depletion of soil nitrogen in the planted treatments as the plants grew.
However, there was no difference between the planted treatments. This may be due to
sampling at the end of the experiment when nutrients were likely to be severely limited.
Therefore, to understand the temporal dynamics of soil nitrogen depletion, sampling
throughout the experiment is likely to be required.
There was an opposing trend in final microbial biomass which was significantly
higher in planted treatments compared to unplanted controls but not significantly different
between planted treatments. This suggests a link between nitrogen depletion and microbial
biomass but no significant effect of cultivar or planting density.
4.4.3 - Are soil processes temporally dynamic in response to plant-plant competition?
Most of the soil processes in this study did not show shifts in temporal dynamics in response
to cultivar, intra- or inter-cultivar competition. In all treatments root respiration and
microbial decomposition of SOM peaked between 21 and 29 days after planting. The lack of
temporal dynamism in root respiration and priming do not support the previous study
(Schofield et al., 2019; Chapter 2), which found a reduction in biomass and nitrogen
accumulation with competition and a delay in peak nitrogen uptake rate in Proctor intra-
cultivar competition. The only temporally dynamic process found in this study was the soil
solution concentration of TOC, indicating SOM breakdown by the soil microbial community
occurred, primed by root activity.
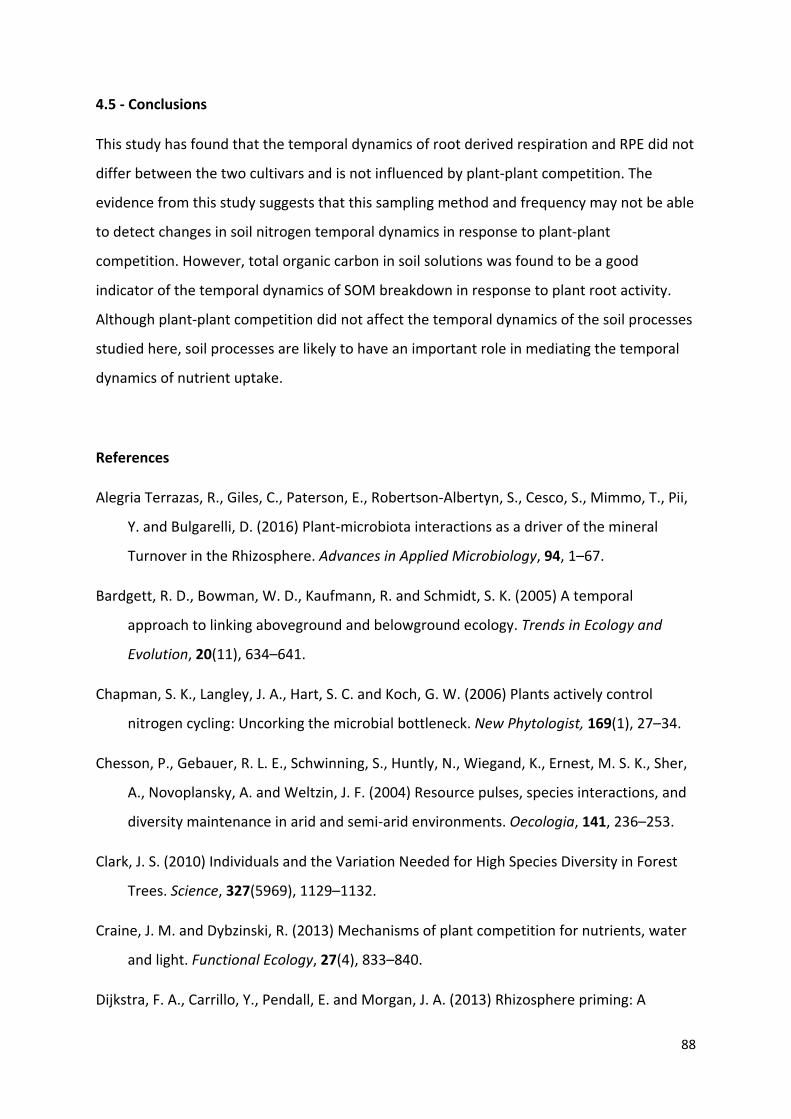
88
4.5 - Conclusions
This study has found that the temporal dynamics of root derived respiration and RPE did not
differ between the two cultivars and is not influenced by plant-plant competition. The
evidence from this study suggests that this sampling method and frequency may not be able
to detect changes in soil nitrogen temporal dynamics in response to plant-plant
competition. However, total organic carbon in soil solutions was found to be a good
indicator of the temporal dynamics of SOM breakdown in response to plant root activity.
Although plant-plant competition did not affect the temporal dynamics of the soil processes
studied here, soil processes are likely to have an important role in mediating the temporal
dynamics of nutrient uptake.
References
Alegria Terrazas, R., Giles, C., Paterson, E., Robertson-Albertyn, S., Cesco, S., Mimmo, T., Pii,
Y. and Bulgarelli, D. (2016) Plant-microbiota interactions as a driver of the mineral
Turnover in the Rhizosphere. Advances in Applied Microbiology, 94, 1–67.
Bardgett, R. D., Bowman, W. D., Kaufmann, R. and Schmidt, S. K. (2005) A temporal
approach to linking aboveground and belowground ecology. Trends in Ecology and
Evolution, 20(11), 634–641.
Chapman, S. K., Langley, J. A., Hart, S. C. and Koch, G. W. (2006) Plants actively control
nitrogen cycling: Uncorking the microbial bottleneck. New Phytologist, 169(1), 27–34.
Chesson, P., Gebauer, R. L. E., Schwinning, S., Huntly, N., Wiegand, K., Ernest, M. S. K., Sher,
A., Novoplansky, A. and Weltzin, J. F. (2004) Resource pulses, species interactions, and
diversity maintenance in arid and semi-arid environments. Oecologia, 141, 236–253.
Clark, J. S. (2010) Individuals and the Variation Needed for High Species Diversity in Forest
Trees. Science, 327(5969), 1129–1132.
Craine, J. M. and Dybzinski, R. (2013) Mechanisms of plant competition for nutrients, water
and light. Functional Ecology, 27(4), 833–840.
Dijkstra, F. A., Carrillo, Y., Pendall, E. and Morgan, J. A. (2013) Rhizosphere priming: A
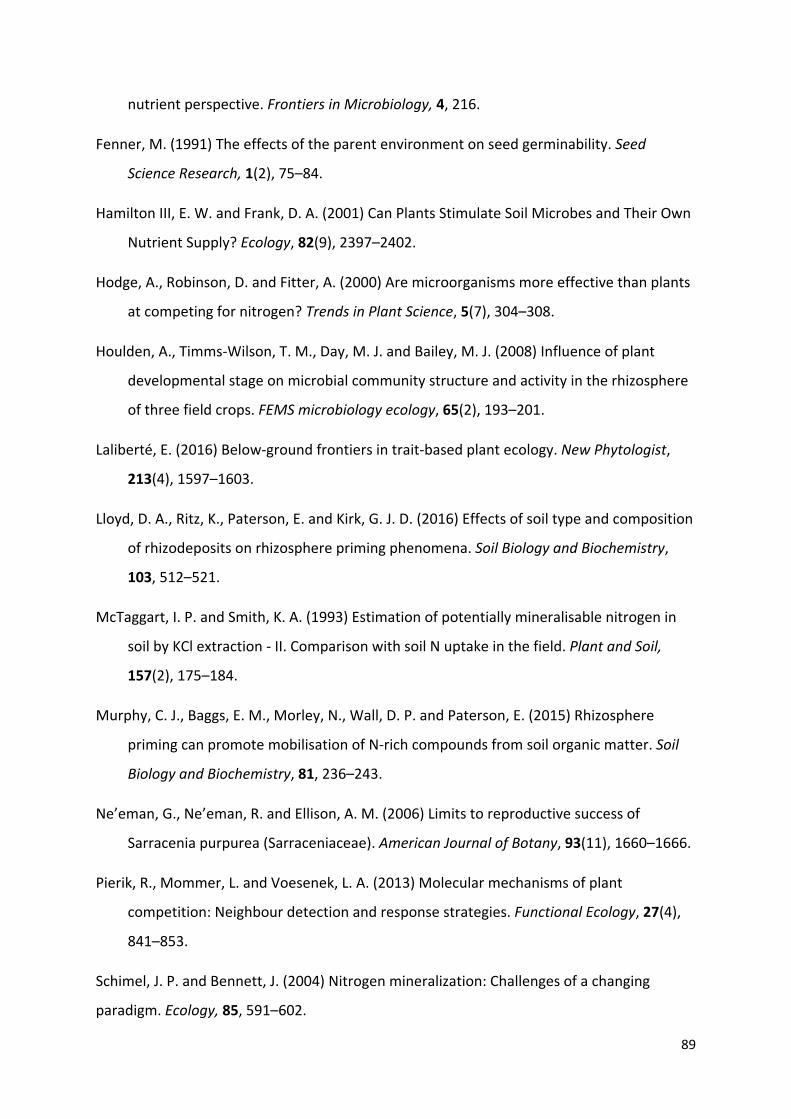
89
nutrient perspective. Frontiers in Microbiology, 4, 216.
Fenner, M. (1991) The effects of the parent environment on seed germinability. Seed
Science Research, 1(2), 75–84.
Hamilton III, E. W. and Frank, D. A. (2001) Can Plants Stimulate Soil Microbes and Their Own
Nutrient Supply? Ecology, 82(9), 2397–2402.
Hodge, A., Robinson, D. and Fitter, A. (2000) Are microorganisms more effective than plants
at competing for nitrogen? Trends in Plant Science, 5(7), 304–308.
Houlden, A., Timms-Wilson, T. M., Day, M. J. and Bailey, M. J. (2008) Influence of plant
developmental stage on microbial community structure and activity in the rhizosphere
of three field crops. FEMS microbiology ecology, 65(2), 193–201.
Laliberté, E. (2016) Below-ground frontiers in trait-based plant ecology. New Phytologist,
213(4), 1597–1603.
Lloyd, D. A., Ritz, K., Paterson, E. and Kirk, G. J. D. (2016) Effects of soil type and composition
of rhizodeposits on rhizosphere priming phenomena. Soil Biology and Biochemistry,
103, 512–521.
McTaggart, I. P. and Smith, K. A. (1993) Estimation of potentially mineralisable nitrogen in
soil by KCl extraction - II. Comparison with soil N uptake in the field. Plant and Soil,
157(2), 175–184.
Murphy, C. J., Baggs, E. M., Morley, N., Wall, D. P. and Paterson, E. (2015) Rhizosphere
priming can promote mobilisation of N-rich compounds from soil organic matter. Soil
Biology and Biochemistry, 81, 236–243.
Ne’eman, G., Ne’eman, R. and Ellison, A. M. (2006) Limits to reproductive success of
Sarracenia purpurea (Sarraceniaceae). American Journal of Botany, 93(11), 1660–1666.
Pierik, R., Mommer, L. and Voesenek, L. A. (2013) Molecular mechanisms of plant
competition: Neighbour detection and response strategies. Functional Ecology, 27(4),
841–853.
Schimel, J. P. and Bennett, J. (2004) Nitrogen mineralization: Challenges of a changing
paradigm. Ecology, 85, 591–602.
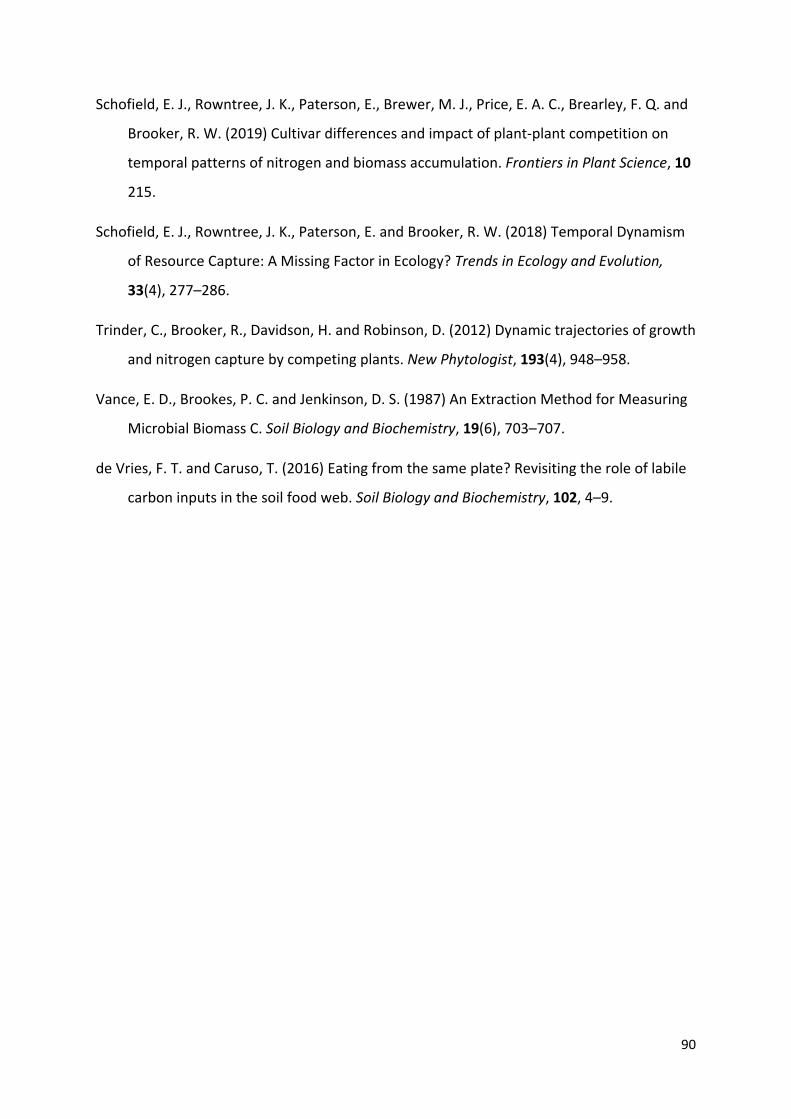
90
Schofield, E. J., Rowntree, J. K., Paterson, E., Brewer, M. J., Price, E. A. C., Brearley, F. Q. and
Brooker, R. W. (2019) Cultivar differences and impact of plant-plant competition on
temporal patterns of nitrogen and biomass accumulation. Frontiers in Plant Science, 10
215.
Schofield, E. J., Rowntree, J. K., Paterson, E. and Brooker, R. W. (2018) Temporal Dynamism
of Resource Capture: A Missing Factor in Ecology? Trends in Ecology and Evolution,
33(4), 277–286.
Trinder, C., Brooker, R., Davidson, H. and Robinson, D. (2012) Dynamic trajectories of growth
and nitrogen capture by competing plants. New Phytologist, 193(4), 948–958.
Vance, E. D., Brookes, P. C. and Jenkinson, D. S. (1987) An Extraction Method for Measuring
Microbial Biomass C. Soil Biology and Biochemistry, 19(6), 703–707.
de Vries, F. T. and Caruso, T. (2016) Eating from the same plate? Revisiting the role of labile
carbon inputs in the soil food web. Soil Biology and Biochemistry, 102, 4–9.
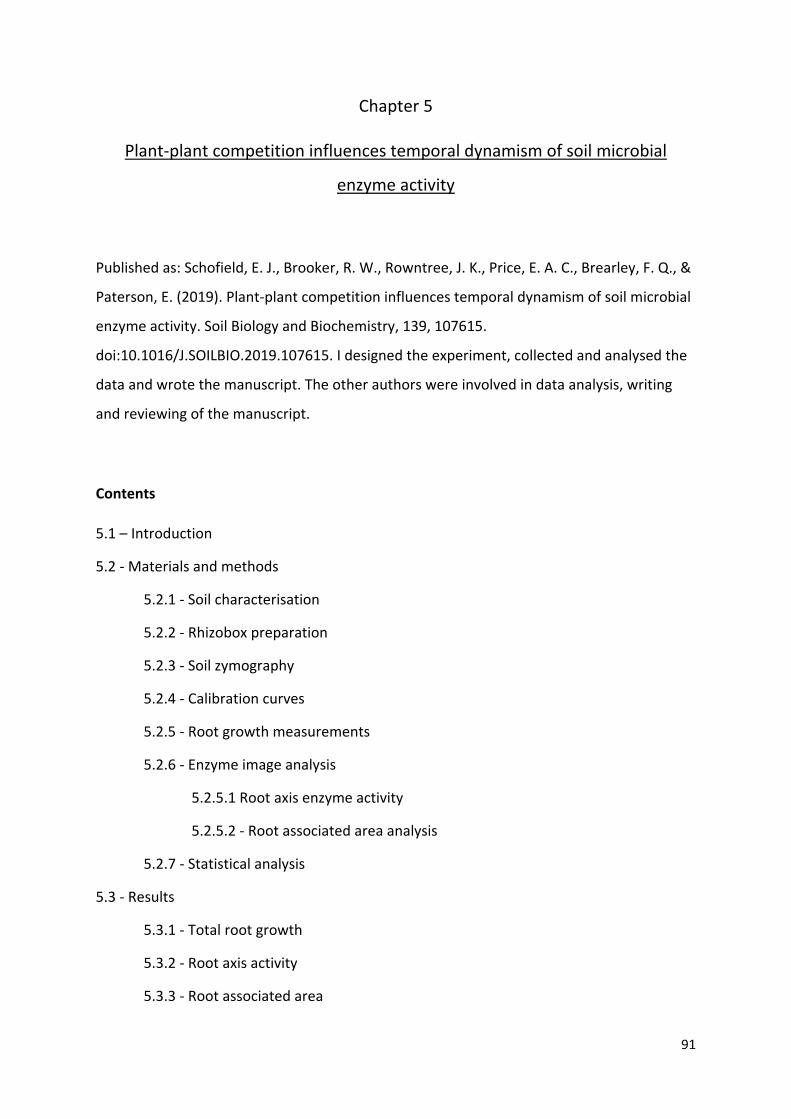
91
Chapter 5
Plant-plant competition influences temporal dynamism of soil microbial
enzyme activity
Published as: Schofield, E. J., Brooker, R. W., Rowntree, J. K., Price, E. A. C., Brearley, F. Q., &
Paterson, E. (2019). Plant-plant competition influences temporal dynamism of soil microbial
enzyme activity. Soil Biology and Biochemistry, 139, 107615.
doi:10.1016/J.SOILBIO.2019.107615. I designed the experiment, collected and analysed the
data and wrote the manuscript. The other authors were involved in data analysis, writing
and reviewing of the manuscript.
Contents
5.1 – Introduction
5.2 - Materials and methods
5.2.1 - Soil characterisation
5.2.2 - Rhizobox preparation
5.2.3 - Soil zymography
5.2.4 - Calibration curves
5.2.5 - Root growth measurements
5.2.6 - Enzyme image analysis
5.2.5.1 Root axis enzyme activity
5.2.5.2 - Root associated area analysis
5.2.7 - Statistical analysis
5.3 - Results
5.3.1 - Total root growth
5.3.2 - Root axis activity
5.3.3 - Root associated area
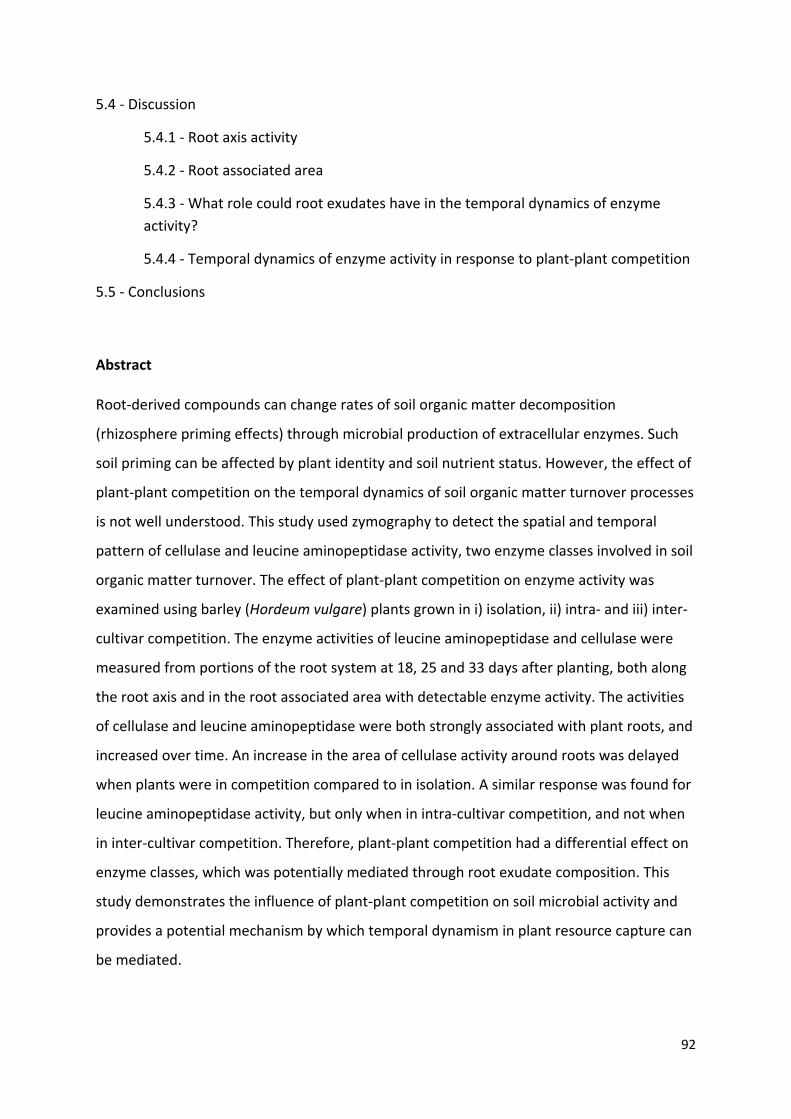
92
5.4 - Discussion
5.4.1 - Root axis activity
5.4.2 - Root associated area
5.4.3 - What role could root exudates have in the temporal dynamics of enzyme activity?
5.4.4 - Temporal dynamics of enzyme activity in response to plant-plant competition
5.5 - Conclusions
Abstract
Root-derived compounds can change rates of soil organic matter decomposition
(rhizosphere priming effects) through microbial production of extracellular enzymes. Such
soil priming can be affected by plant identity and soil nutrient status. However, the effect of
plant-plant competition on the temporal dynamics of soil organic matter turnover processes
is not well understood. This study used zymography to detect the spatial and temporal
pattern of cellulase and leucine aminopeptidase activity, two enzyme classes involved in soil
organic matter turnover. The effect of plant-plant competition on enzyme activity was
examined using barley (Hordeum vulgare) plants grown in i) isolation, ii) intra- and iii) inter-
cultivar competition. The enzyme activities of leucine aminopeptidase and cellulase were
measured from portions of the root system at 18, 25 and 33 days after planting, both along
the root axis and in the root associated area with detectable enzyme activity. The activities
of cellulase and leucine aminopeptidase were both strongly associated with plant roots, and
increased over time. An increase in the area of cellulase activity around roots was delayed
when plants were in competition compared to in isolation. A similar response was found for
leucine aminopeptidase activity, but only when in intra-cultivar competition, and not when
in inter-cultivar competition. Therefore, plant-plant competition had a differential effect on
enzyme classes, which was potentially mediated through root exudate composition. This
study demonstrates the influence of plant-plant competition on soil microbial activity and
provides a potential mechanism by which temporal dynamism in plant resource capture can
be mediated.
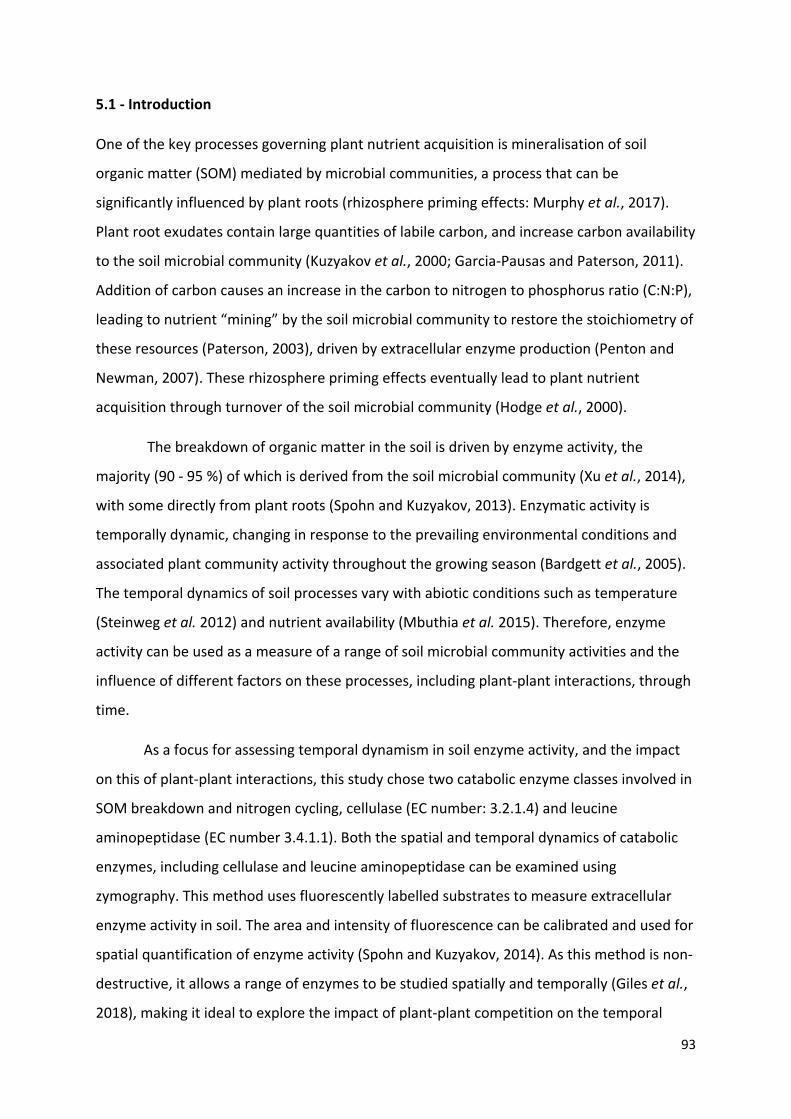
93
5.1 - Introduction
One of the key processes governing plant nutrient acquisition is mineralisation of soil
organic matter (SOM) mediated by microbial communities, a process that can be
significantly influenced by plant roots (rhizosphere priming effects: Murphy et al., 2017).
Plant root exudates contain large quantities of labile carbon, and increase carbon availability
to the soil microbial community (Kuzyakov et al., 2000; Garcia-Pausas and Paterson, 2011).
Addition of carbon causes an increase in the carbon to nitrogen to phosphorus ratio (C:N:P),
leading to nutrient “mining” by the soil microbial community to restore the stoichiometry of
these resources (Paterson, 2003), driven by extracellular enzyme production (Penton and
Newman, 2007). These rhizosphere priming effects eventually lead to plant nutrient
acquisition through turnover of the soil microbial community (Hodge et al., 2000).
The breakdown of organic matter in the soil is driven by enzyme activity, the
majority (90 - 95 %) of which is derived from the soil microbial community (Xu et al., 2014),
with some directly from plant roots (Spohn and Kuzyakov, 2013). Enzymatic activity is
temporally dynamic, changing in response to the prevailing environmental conditions and
associated plant community activity throughout the growing season (Bardgett et al., 2005).
The temporal dynamics of soil processes vary with abiotic conditions such as temperature
(Steinweg et al. 2012) and nutrient availability (Mbuthia et al. 2015). Therefore, enzyme
activity can be used as a measure of a range of soil microbial community activities and the
influence of different factors on these processes, including plant-plant interactions, through
time.
As a focus for assessing temporal dynamism in soil enzyme activity, and the impact
on this of plant-plant interactions, this study chose two catabolic enzyme classes involved in
SOM breakdown and nitrogen cycling, cellulase (EC number: 3.2.1.4) and leucine
aminopeptidase (EC number 3.4.1.1). Both the spatial and temporal dynamics of catabolic
enzymes, including cellulase and leucine aminopeptidase can be examined using
zymography. This method uses fluorescently labelled substrates to measure extracellular
enzyme activity in soil. The area and intensity of fluorescence can be calibrated and used for
spatial quantification of enzyme activity (Spohn and Kuzyakov, 2014). As this method is non-
destructive, it allows a range of enzymes to be studied spatially and temporally (Giles et al.,
2018), making it ideal to explore the impact of plant-plant competition on the temporal
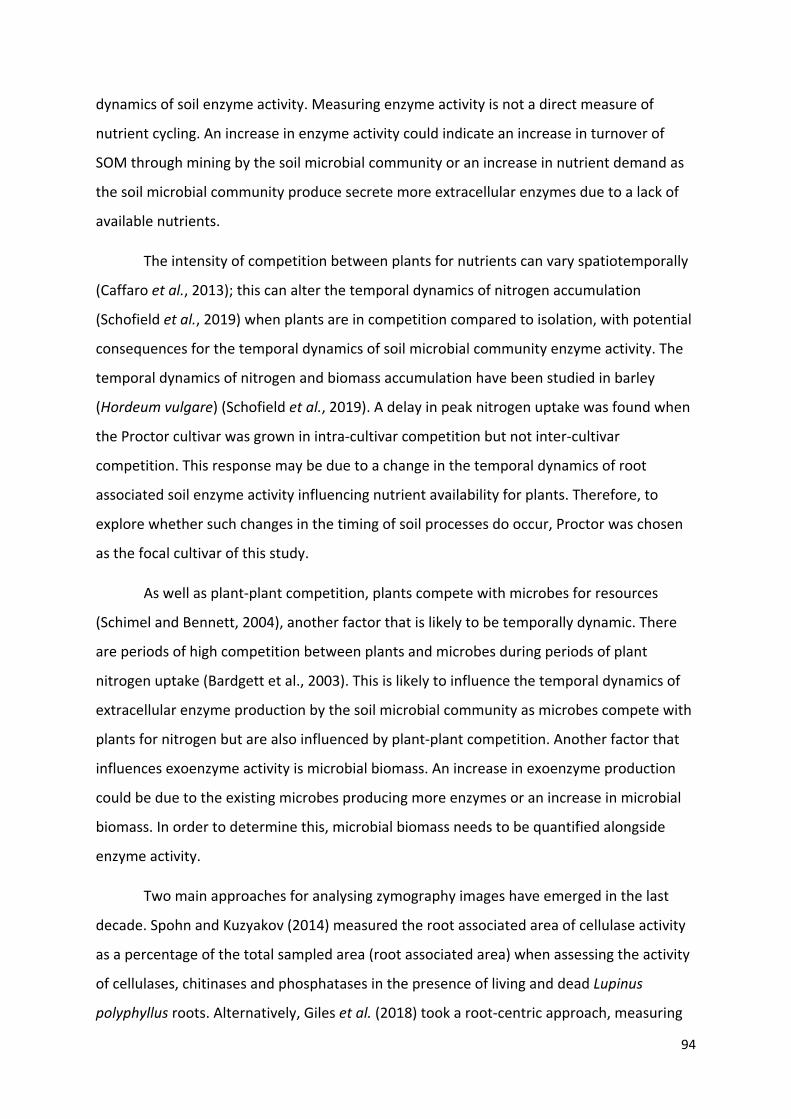
94
dynamics of soil enzyme activity. Measuring enzyme activity is not a direct measure of
nutrient cycling. An increase in enzyme activity could indicate an increase in turnover of
SOM through mining by the soil microbial community or an increase in nutrient demand as
the soil microbial community produce secrete more extracellular enzymes due to a lack of
available nutrients.
The intensity of competition between plants for nutrients can vary spatiotemporally
(Caffaro et al., 2013); this can alter the temporal dynamics of nitrogen accumulation
(Schofield et al., 2019) when plants are in competition compared to isolation, with potential
consequences for the temporal dynamics of soil microbial community enzyme activity. The
temporal dynamics of nitrogen and biomass accumulation have been studied in barley
(Hordeum vulgare) (Schofield et al., 2019). A delay in peak nitrogen uptake was found when
the Proctor cultivar was grown in intra-cultivar competition but not inter-cultivar
competition. This response may be due to a change in the temporal dynamics of root
associated soil enzyme activity influencing nutrient availability for plants. Therefore, to
explore whether such changes in the timing of soil processes do occur, Proctor was chosen
as the focal cultivar of this study.
As well as plant-plant competition, plants compete with microbes for resources
(Schimel and Bennett, 2004), another factor that is likely to be temporally dynamic. There
are periods of high competition between plants and microbes during periods of plant
nitrogen uptake (Bardgett et al., 2003). This is likely to influence the temporal dynamics of
extracellular enzyme production by the soil microbial community as microbes compete with
plants for nitrogen but are also influenced by plant-plant competition. Another factor that
influences exoenzyme activity is microbial biomass. An increase in exoenzyme production
could be due to the existing microbes producing more enzymes or an increase in microbial
biomass. In order to determine this, microbial biomass needs to be quantified alongside
enzyme activity.
Two main approaches for analysing zymography images have emerged in the last
decade. Spohn and Kuzyakov (2014) measured the root associated area of cellulase activity
as a percentage of the total sampled area (root associated area) when assessing the activity
of cellulases, chitinases and phosphatases in the presence of living and dead Lupinus
polyphyllus roots. Alternatively, Giles et al. (2018) took a root-centric approach, measuring
95
phosphatase activity along Hordeum vulgare root axis (root axis). The Spohn and Kuzyakov
(2014) method takes a subsection of the greyscale values, excluding the lightest and darkest
pixels; in contrast Giles et al. (2018) used the total pixel range. The Spohn and Kuzyakov
(2014) method excludes pixels that are extremely bright, which may skew the total dataset.
However, by focussing on the extent of activity in terms of area instead of intensity of
activity along the root axis, a relatively small proportion of the soil volume, subtle temporal
dynamics of enzyme activity may be more easily detected.
This study aimed to determine the influence of plant-plant competition on the
activity of the soil microbial community while keeping other environmental factors constant.
Whilst this study has not measured the effect of plant-plant competition on plant-microbe
competition directly, the former has been suggested to influence the latter (Hortal et al.,
2017). This study took the opportunity to use both approaches for analysing zymography
images. The aim was to determine the effect of plant-plant competition on the temporal
activity dynamics of the two enzyme classes, outside of the zone of most intense
competition. Plant root architecture can demonstrate a compensatory response to plant-
plant competition (Caffaro et al., 2013). It is expected that enzyme activity surrounding
plant roots will show similar trends to root architecture, with increased enzyme activity
surrounding roots outside the zone of most intense competition when the plants are in
competition compared to isolation. As competition can be less intense between more
closely related individual plants, due to changes in the temporal dynamics of resource
capture, it is expected that interactions between more closely related individuals will
promote less intense enzyme activity than inter-cultivar competition.
5.2 - Materials and methods
5.2.1 - Soil characterisation
Soil was collected from an agricultural field that had previously been cropped with spring
barley (Hordeum vulgare) and had been subject to standard fertilisation conditions (500 kg
of N ha-1 yr-1 in the ratio of N 22 : P 4 : K 14) (Balruddery Farm, Invergowrie, Scotland,
56.4837° N, 3.1314° W). The soil was then passed through a 3 mm sieve to homogenise the
substrate and then stored at 4°C until planting. The soil had an organic matter content
96
(humus) of 6.2 % ± 0.3 % SEM (loss-on-ignition, n = 4) and a mean pH (in water) of 5.7 ± 0.02
SEM (n = 4), a total inorganic nitrogen concentration of 1.55 ± 0.46 mg g-1 (n = 4) and
microbial C biomass (using a chloroform extraction) of 0.06 ± 0.002 SEM mg g-1 (n = 4). No
fertilisation occurred during the experiment.
5.2.2 - Rhizobox preparation
Rhizoboxes (150 mm x 150 mm x 10 mm Perspex boxes with a removable side for access to
roots) were packed to a bulk density of 1.26 g cm-3, ensuring the soil was level with the edge
of each box. Seeds of Proctor and Tammi barley (Hordeum vulgare) cultivars were pre-
germinated on damp tissue paper in the dark at room temperature for two days before
planting. Three replicates of each treatment: Proctor alone (P), Proctor in intra-cultivar
competition (PP) and Proctor in inter-cultivar competition with Tammi (TP) were planted, as
well as a bare soil control, giving 12 rhizoboxes in total. In the planted treatments, the
germinated seeds were placed on the surface of the soil, ensuring contact between the
emerging roots and soil surface, and then the side of the box was replaced and secured. In
the planted treatments containing two plants, the germinated seeds were placed 2.5 cm
apart to ensure no aboveground interaction between the two plants.
The rhizoboxes were wrapped in foil to exclude light from the roots and placed at a
45° angle to encourage root growth over the soil surface. The rhizoboxes were kept in a
controlled environment cabinet (Jumo IMAGO 3000, Harlow, Essex, UK) at a constant 15°C,
65 % relative humidity and a 16/8 (day/night) (light intensity: 200 µmol m-2 s-1) photoperiod
for the duration of the experiment to mimic local springtime conditions. Each rhizobox was
watered weekly with sufficient water to maintain soil moisture at field capacity and prevent
root desiccation.
5.2.3 - Soil zymography
Enzyme activity was measured three times at weekly intervals between 18 and 39 days after
planting. This is the period prior to and including peak barley nitrogen accumulation rate
found in the previous study (Schofield et al. 2019; Chapter 2). Areas away from the
97
competition zone between the two plants were visually identified and labelled on the
rhizobox rim to ensure measurements of soil enzyme activity occurred at a consistent
location throughout the study. These were roots of the focal individual that consistently did
not encounter roots of the other individual within the system. This setup was used to
indicate whether a compensatory or systemic response to plant-plant competition could be
detected in soil enzyme activity.
Two fluorescently labelled substrates were selected for this study; 4-
methylumbellferyl ß-D-cellobioside, a substrate of cellulase which was imaged at 365 nm
(excitation at 365 nm, emission at 455 nm) and L-leucine-7-amido-methylcoumarin
hydrochloride, a substrate of leucine aminopeptidase that was imaged at 302 nm (excitation
at 327 nm, emission at 349 nm) (Sigma-Aldrich, Reading, UK). Both substrates were diluted
to a 6 mM concentration, the concentration used in previous studies using
methylumbellferyl ß-D-cellobioside (Spohn and Kuzyakov, 2014) and the optimum
concentration found during preliminary experiments (results not shown). A 47 mm diameter
polyamide membrane (Whatman, GE Healthcare, Buckinghamshire, UK) was soaked in 300
µl of 6 mM of 4-methylumbellferyl ß-D-cellobioside or L-leucine-7-amido-methylcoumarin
hydrochloride. On sampling days, the side of each rhizobox was removed and a 1 % agarose
(Invitrogen, Carlsbad, CA, USA) gel of 1 mm thickness was placed on the soil surface to
protect the membrane from soil particles which could adhere to it and disrupt the final
image, whilst allowing the diffusion of extracellular enzymes (Spohn and Kuzyakov, 2014).
The membrane was then placed on top of the gel and the foil was replaced over the top to
exclude light and minimise moisture loss during enzyme assays.
Previous studies have incubated similar substrate soaked membranes for between
30 minutes and 3 hours (Spohn and Kuzyakov, 2014; Giles et al., 2018). Therefore, a
preliminary study was carried out which found that, for this system, an incubation of 1 hour
gave a good level of resolution and UV intensity when viewed (results not shown). Following
incubation (1 h), the membrane was placed onto a fresh 1 % agarose gel to minimise
bubbling of the membrane during imaging. The membrane and gel were then placed in an
UV imaging box (BioDoc-It2 Imager, Analytik Jena, Upland, CA) and imaged at 365 nm (Spohn
and Kuzyakov, 2014). This was repeated for L-leucine-7-amido-methylcoumarin
hydrochloride, which was imaged at 302 nm (Ma et al., 2018). This order of substrate
98
sampling was maintained throughout the experimental period (Spohn and Kuzyakov, 2014).
The sampled area was marked on the rim of each rhizobox to ensure that the same area was
sampled each time for both enzymes. After sampling, the rhizobox was watered and
replaced in the controlled environment chamber.
5.2.4 - Calibration curves
Known dilutions of 4-methylumbelliferone (the fluorescent tag of 4-methylumbellferyl ß-D-
cellobioside) and 7-amino-4-methylcoumarin (the fluorescent tag of L-leucine-7-amido-
methylcoumarin hydrochloride ) (1, 2, 4, 6 mM) were prepared and used to soak
membranes, using the same procedure as the experiment (Giles et al., 2018). The
membranes were then imaged using the same method and settings as the samples. The
images were used to calculate the substrate concentration per mm2 and provide the
calibration curve values from the sample images. This also informed the range of 8 bit
greyscale values (the integer brightness value per pixel between 0 - 255) sampled in the
percentage area analysis (Spohn and Kuzyakov, 2014).
5.2.5 - Root growth measurements
The roots of each rhizobox were photographed weekly from 4 - 39 days after planting using
an iPhone 6 (8 - megapixel iSight camera with 1.5 µm pixels, Apple Inc). The root
architecture photographs were then analysed using the SmartRoot plugin (Lobet et al.,
2011) of the ImageJ software (Schneider et al., 2012). The roots of each plant were manually
traced and labelled using the Trace tool. This was used to measure total root length over
time. Dry root biomass was also recorded at the end of the experiment by drying roots at
100 ° C for 24 hours.
The effect of time and treatment on the measured root architecture parameters
were assessed using a Generalized Least Squares model using the nlme package in R (R
statistical software, R Core Team, 2016). Time and treatment were included as fixed factors
as well as the interaction between treatment and time. A covariate of rhizobox number and
treatment was included to account for autocorrelation caused by the repeated measures in
99
this study. This was followed by an ANOVA test (MASS package, R statistical software, R
Core Team, 2016).
5.2.6 - Enzyme image analysis
The intensity and location of enzyme activity was analysed using two approaches: root axis
activity (Giles et al., 2018) and root associated area (Spohn and Kuzyakov, 2014). These two
approaches differ in that the root axis activity records soil enzyme activity only along the
root itself, whereas the root associated area measures soil enzyme activity in the
surrounding rhizosphere as well. By comparing these two approaches the most appropriate
image analysis method to study the temporal dynamics in root associated soil microbial
activity can be determined. Root associated area was defined as the percentage of the total
sampled area with greyscale values above a threshold defined by the calibration curves that
indicated enzyme activity.
5.2.5.1 Root axis enzyme activity
For this approach, root axis image analysis technique developed by Giles et al. (2018) was
used. Proctor roots contained within the sample area were tracked using the segmented
line tool in the Fiji image analysis software (Schindelin et al., 2012). The RProfile plugin
developed by Giles et al. (2018) was then used to extract a profile of greyscale values along
the sampled root. The nodes of the segmented line placed along the root were then
centralised and placed evenly along the sampled root to refine the data using the Python
script developed by Giles et al. (2018). The mean greyscale value was calculated for each
root (subsequently referred to as ‘root axis activity’).
5.2.5.2 - Root associated area analysis
To measure the root associated area of enzyme activity, the approach developed by Spohn
and Kuzyakov (2014) was used. Each image was first converted into an 8-bit greyscale
image. The range of 80 - 170 grey values was extracted from each image (informed by the
100
calibration curves) then split into 10 grey value increments, and the area of each increment
measured using Image J Software (Schneider et al., 2012). This was then expressed as a
percentage of the total membrane area (subsequently referred to root associated area). The
percentage root associated area was then compared between treatments. The mean
enzyme activity rate was the most common enzyme activity rate, i.e. the rate with the
greatest percentage cover of the total sampled area.
5.2.7 - Statistical analysis
The effect of time and treatment on the root axis activity and root associated area were
each assessed using a Generalised Least Squares model, accounting for repeated measures
with an autocorrelation term, using the nlme package (Pinheiro et al., 2016) in R (R Core
Team, 2015). This was followed by an ANOVA test for significant differences using the MASS
package (Venables and Ripley, 2002) in R (R Core Team, 2015). The interaction between
treatment and time was included as a fixed factor, to detect differences between
treatments in enzyme activity temporal dynamics, with an autocorrelation term for
treatment and rhizobox number.
5.3 - Results
5.3.1 - Total root growth
Total root length increased over time for all treatments (Table 5.1). There was a significant
effect of treatment (F(2,52) = 5.45, P = <0.01) and time (F(4,52) = 45.04, P = <0.01) on total root
length but no significant interaction between treatment and time (F(8,52) = 1.27, P = 0.28).
There was no significant difference in total root biomass between the different treatments
at 33 days (F(2,10) = 0.78, P = 0.48).
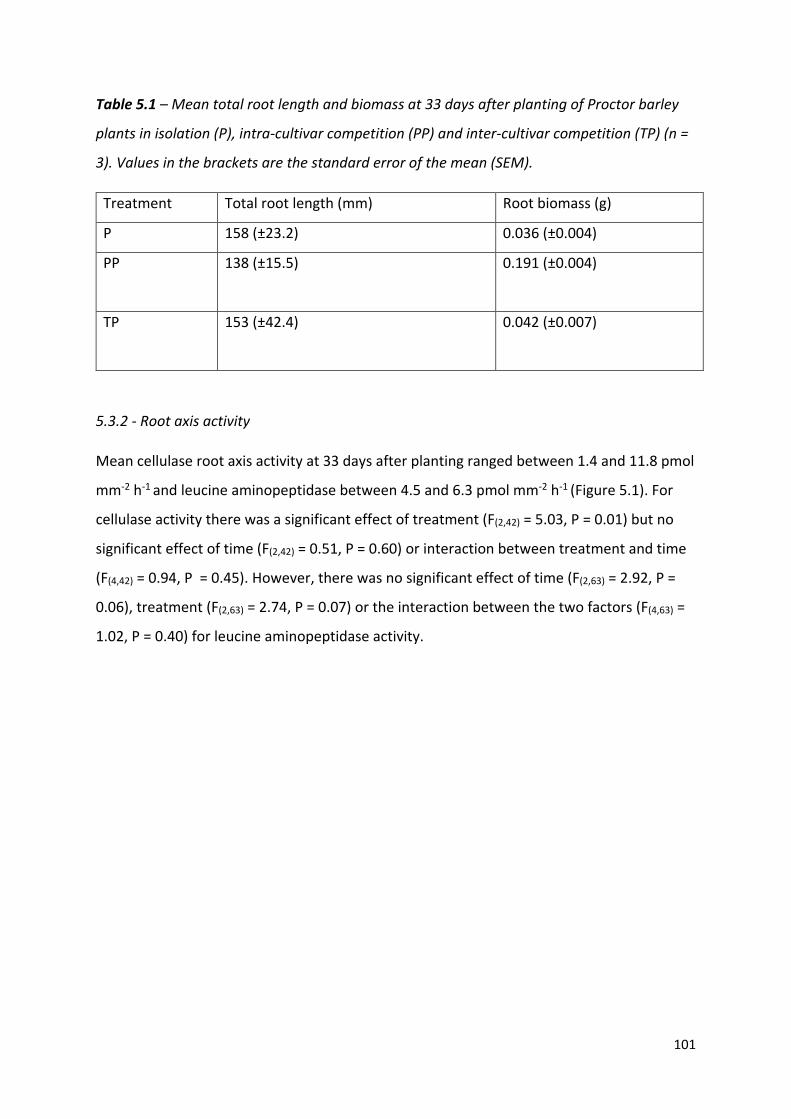
101
Table 5.1 – Mean total root length and biomass at 33 days after planting of Proctor barley
plants in isolation (P), intra-cultivar competition (PP) and inter-cultivar competition (TP) (n =
3). Values in the brackets are the standard error of the mean (SEM).
Treatment Total root length (mm) Root biomass (g)
P 158 (±23.2) 0.036 (±0.004)
PP 138 (±15.5)
0.191 (±0.004)
TP 153 (±42.4)
0.042 (±0.007)
5.3.2 - Root axis activity
Mean cellulase root axis activity at 33 days after planting ranged between 1.4 and 11.8 pmol
mm-2 h-1 and leucine aminopeptidase between 4.5 and 6.3 pmol mm-2 h-1 (Figure 5.1). For
cellulase activity there was a significant effect of treatment (F(2,42) = 5.03, P = 0.01) but no
significant effect of time (F(2,42) = 0.51, P = 0.60) or interaction between treatment and time
(F(4,42) = 0.94, P = 0.45). However, there was no significant effect of time (F(2,63) = 2.92, P =
0.06), treatment (F(2,63) = 2.74, P = 0.07) or the interaction between the two factors (F(4,63) =
1.02, P = 0.40) for leucine aminopeptidase activity.
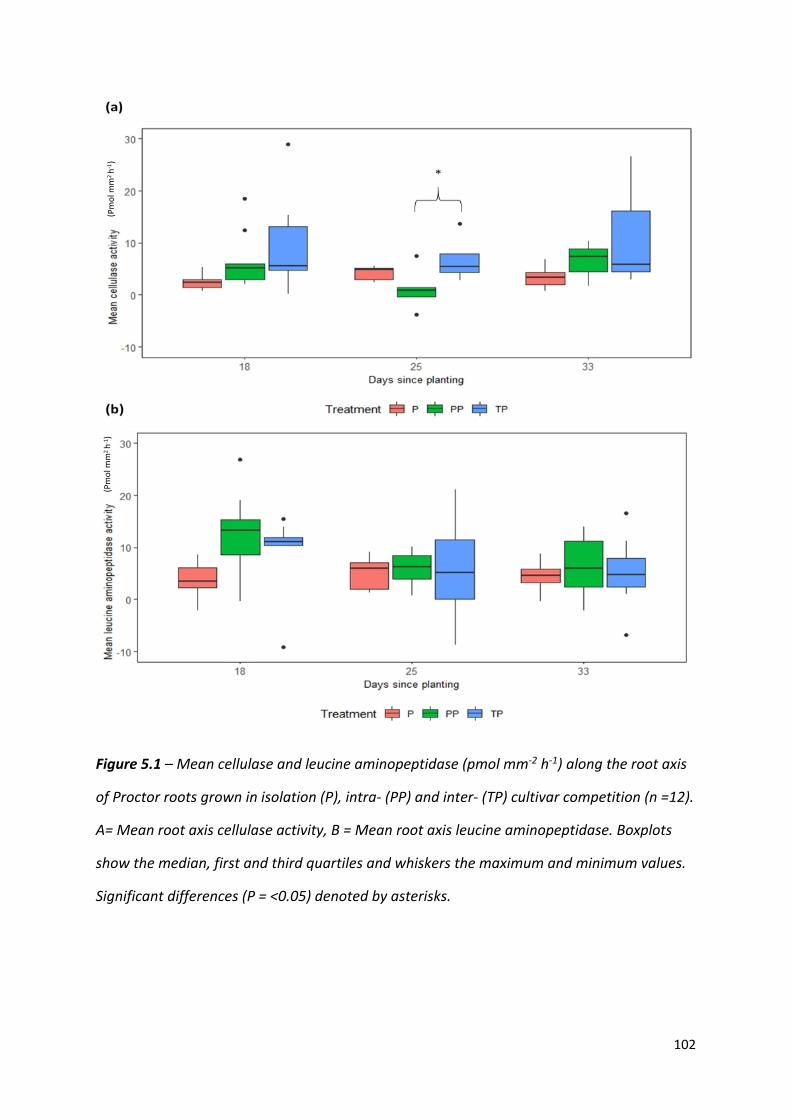
102
Figure 5.1 – Mean cellulase and leucine aminopeptidase (pmol mm-2 h-1) along the root axis
of Proctor roots grown in isolation (P), intra- (PP) and inter- (TP) cultivar competition (n =12).
A= Mean root axis cellulase activity, B = Mean root axis leucine aminopeptidase. Boxplots
show the median, first and third quartiles and whiskers the maximum and minimum values.
Significant differences (P = <0.05) denoted by asterisks.
(Pm
ol m
m2
h-1)
(Pm
ol m
m2
h-1)
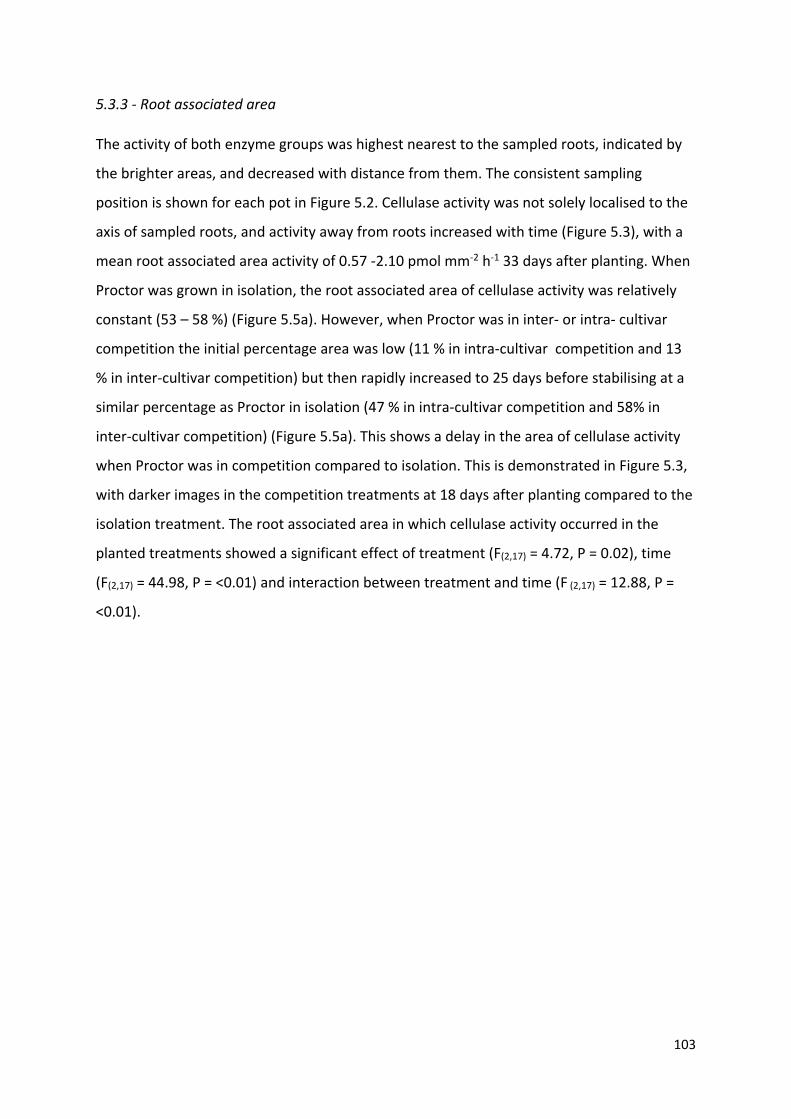
103
5.3.3 - Root associated area
The activity of both enzyme groups was highest nearest to the sampled roots, indicated by
the brighter areas, and decreased with distance from them. The consistent sampling
position is shown for each pot in Figure 5.2. Cellulase activity was not solely localised to the
axis of sampled roots, and activity away from roots increased with time (Figure 5.3), with a
mean root associated area activity of 0.57 -2.10 pmol mm-2 h-1 33 days after planting. When
Proctor was grown in isolation, the root associated area of cellulase activity was relatively
constant (53 – 58 %) (Figure 5.5a). However, when Proctor was in inter- or intra- cultivar
competition the initial percentage area was low (11 % in intra-cultivar competition and 13
% in inter-cultivar competition) but then rapidly increased to 25 days before stabilising at a
similar percentage as Proctor in isolation (47 % in intra-cultivar competition and 58% in
inter-cultivar competition) (Figure 5.5a). This shows a delay in the area of cellulase activity
when Proctor was in competition compared to isolation. This is demonstrated in Figure 5.3,
with darker images in the competition treatments at 18 days after planting compared to the
isolation treatment. The root associated area in which cellulase activity occurred in the
planted treatments showed a significant effect of treatment (F(2,17) = 4.72, P = 0.02), time
(F(2,17) = 44.98, P = <0.01) and interaction between treatment and time (F (2,17) = 12.88, P =
<0.01).
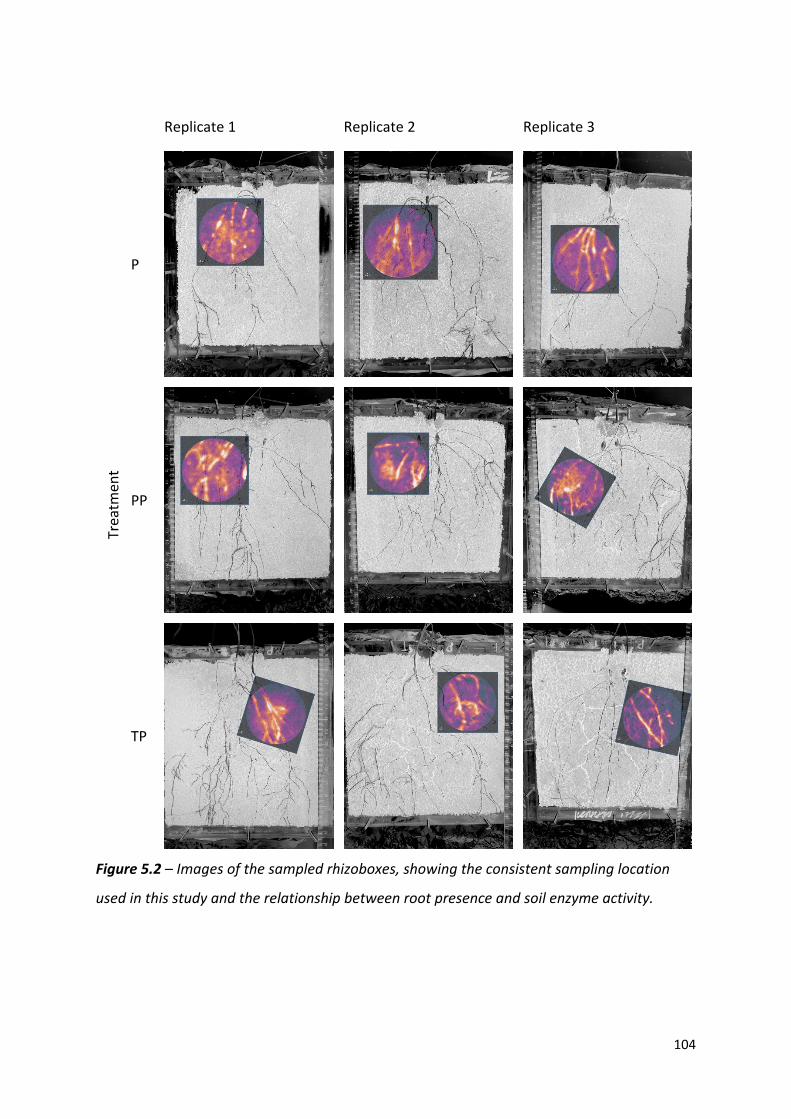
104
Figure 5.2 – Images of the sampled rhizoboxes, showing the consistent sampling location
used in this study and the relationship between root presence and soil enzyme activity.
Replicate 1 Replicate 2 Replicate 3 Tr
eatm
ent
P
PP
TP
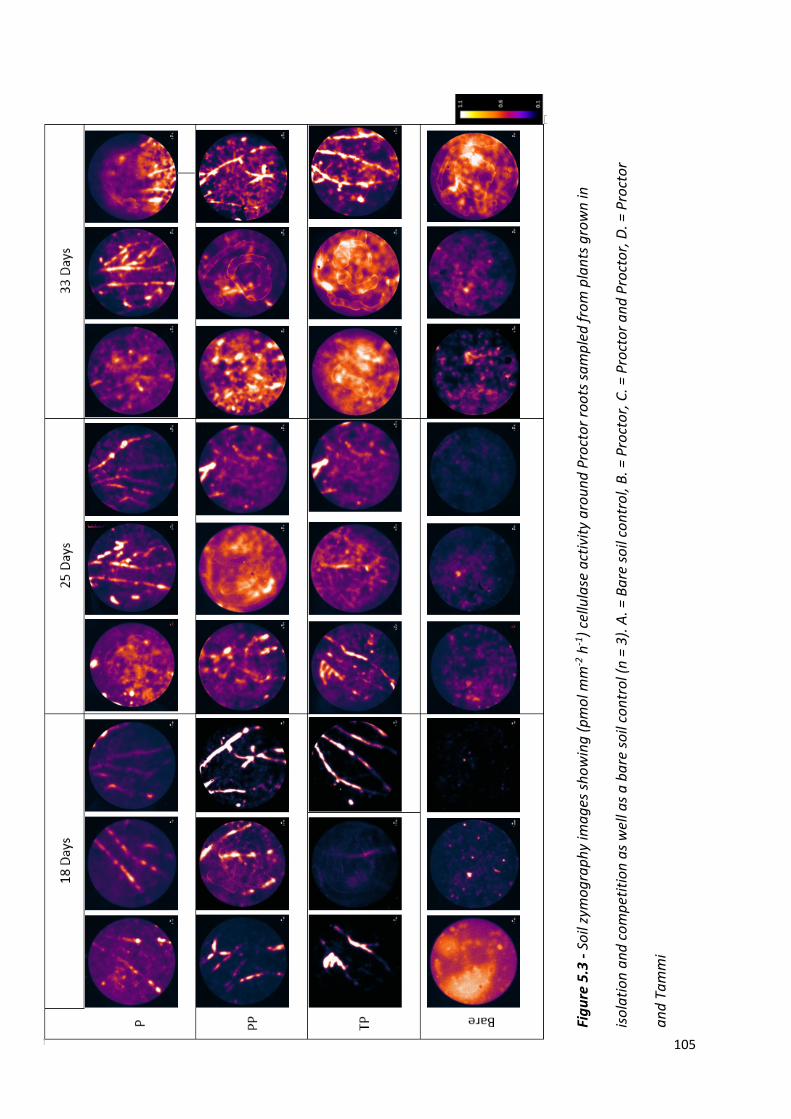
105
Figu
re 5
.3 -
Soil
zym
ogra
phy
imag
es sh
owin
g (p
mol
mm
-2 h
-1) c
ellu
lase
act
ivity
aro
und
Proc
tor r
oots
sam
pled
from
pla
nts g
row
n in
isola
tion
and
com
petit
ion
as w
ell a
s a b
are
soil
cont
rol (
n =
3). A
. = B
are
soil
cont
rol,
B. =
Pro
ctor
, C. =
Pro
ctor
and
Pro
ctor
, D. =
Pro
ctor
and
Tam
mi
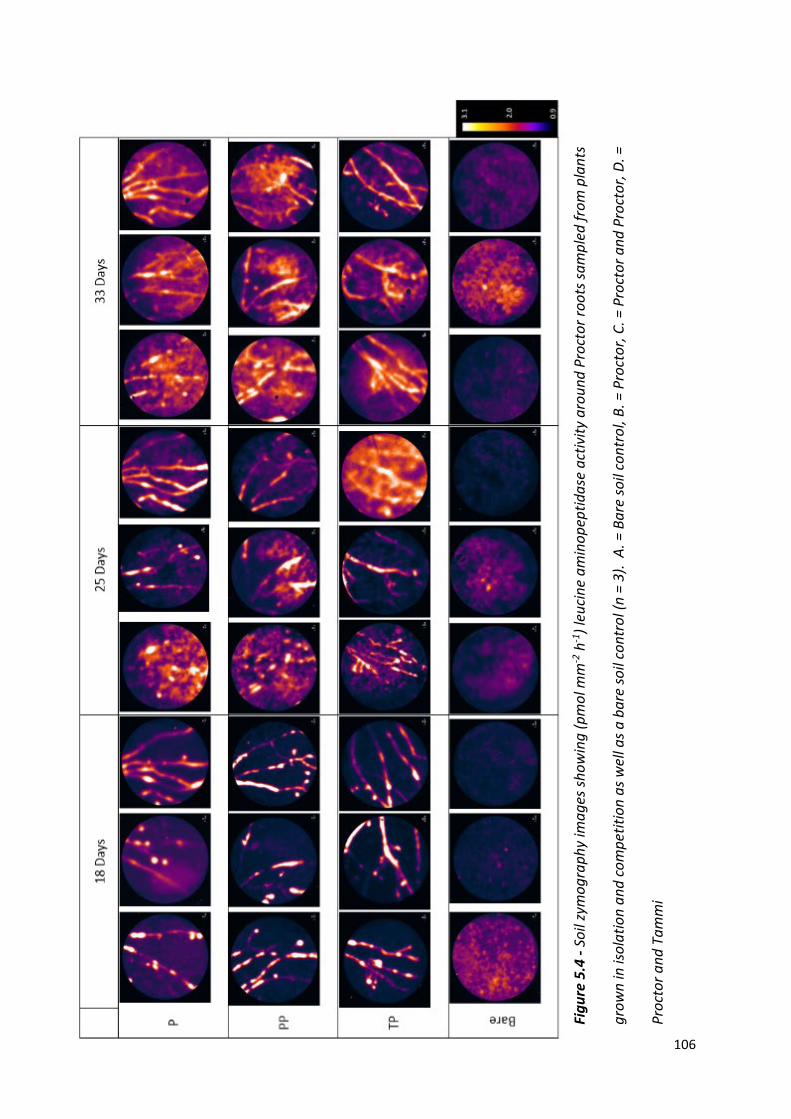
106
Figu
re 5
.4 -
Soil
zym
ogra
phy
imag
es sh
owin
g (p
mol
mm
-2 h
-1) l
euci
ne a
min
opep
tidas
e ac
tivity
aro
und
Proc
tor r
oots
sam
pled
from
pla
nts
grow
n in
isol
atio
n an
d co
mpe
titio
n as
wel
l as a
bar
e so
il co
ntro
l (n
= 3)
. A.
= B
are
soil
cont
rol,
B. =
Pro
ctor
, C. =
Pro
ctor
and
Pro
ctor
, D. =
Proc
tor a
nd T
amm
i
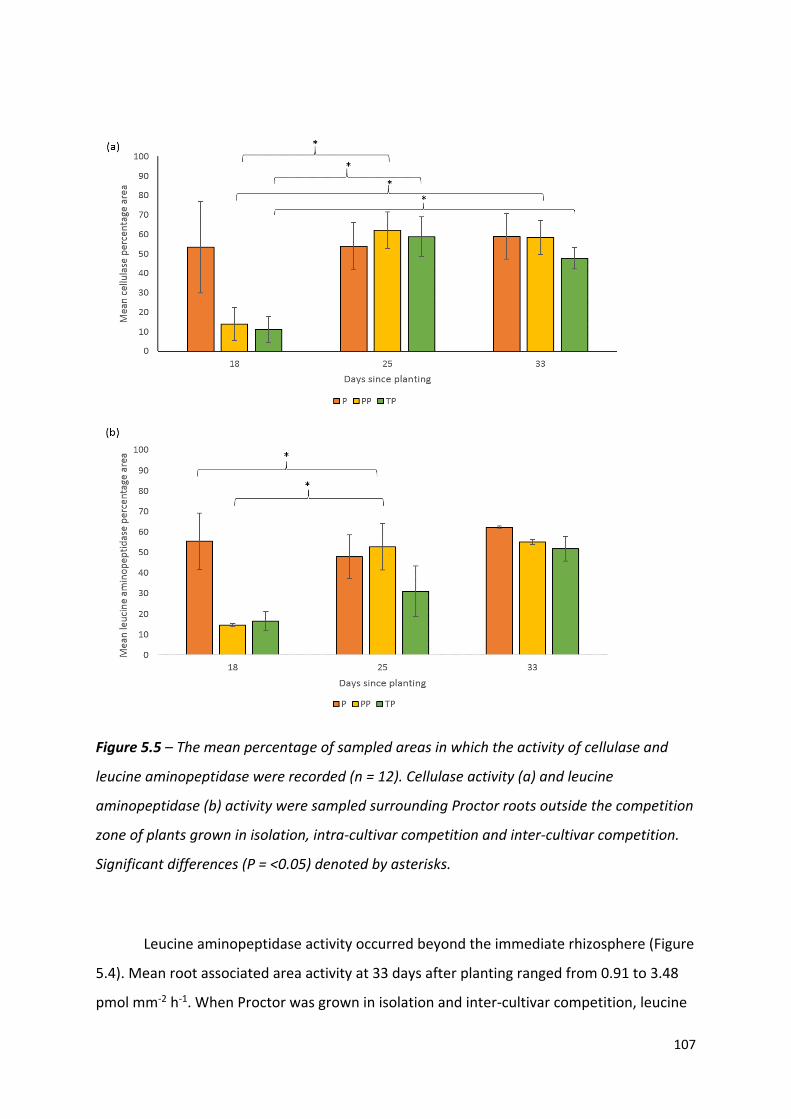
107
Figure 5.5 – The mean percentage of sampled areas in which the activity of cellulase and
leucine aminopeptidase were recorded (n = 12). Cellulase activity (a) and leucine
aminopeptidase (b) activity were sampled surrounding Proctor roots outside the competition
zone of plants grown in isolation, intra-cultivar competition and inter-cultivar competition.
Significant differences (P = <0.05) denoted by asterisks.
Leucine aminopeptidase activity occurred beyond the immediate rhizosphere (Figure
5.4). Mean root associated area activity at 33 days after planting ranged from 0.91 to 3.48
pmol mm-2 h-1. When Proctor was grown in isolation and inter-cultivar competition, leucine
108
aminopeptidase root associated area steadily increased over time (Figure 5.5b). At 25 days,
the intra-cultivar competition root associated area was lower (31 %) than in isolation (48 %)
and inter-cultivar competition (52 %) (Figure 5.5b), indicating a delay in leucine
aminopeptidase activity in intra-cultivar competition compared to isolation and inter-
cultivar competition. This is demonstrated in Figure 5.4, with darker images in the intra-
cultivar competition treatment at 18 days after planting compared to the isolation and
inter-cultivar competition treatments. There was a significant effect of treatment (F(2,17) =
31.72, P = <0.01), time (F(2,17) = 30.36, P = <0.01) and a significant interaction between time
and treatment on the root associated percentage area of leucine aminopeptidase activity
(F(2,17) = 7.42, P = <0.01). Model details are in Appendix 2, Supplementary Figure A1.
5.4 - Discussion
This experiment aimed to determine the effect of plant-plant competition in barley on the
temporal dynamics of nutrient cycling by measuring activity of cellulase and leucine
aminopeptidase, two enzyme classes associated with nutrient turnover, specifically of
carbon and nitrogen. Root axis activity for both enzyme classes was not significantly
temporally dynamic (the interaction between time and treatment) when the focal plant
(Proctor cultivar of barley) was in intra- and inter- cultivar competition compared to
isolation. However, using the Spohn and Kuzyakov (2014) root associated area approach,
cellulase activity was found to be delayed when in intra- and inter- cultivar competition
compared to isolation (significant interaction between treatment and time). In contrast,
leucine aminopeptidase root associated area was delayed when in intra-competition, but
not inter-cultivar competition compared to isolation (significant interaction between
treatment and time). This demonstrates that the temporal dynamics of soil enzyme activity
were influenced by plant-plant competition independent of other environmental factors,
that plant-plant competition did not have a uniform effect on different classes of soil
enzymes, and that the observed effects are also dependent on the method of
measurement.
109
5.4.1 - Root axis activity
Both cellulase and leucine aminopeptidase mean root axis activity was much higher than the
whole sampled area, 3 - 4 times higher for leucine aminopeptidase and 4 - 6 times for
cellulase. This is most likely due to the influence of plant root exudates, which provide a
source of labile carbon, increase the rate of SOM mineralisation and, consequently, carbon
and nitrogen cycling in the rhizosphere compared to bulk soil (Bengtson et al., 2012; C. J.
Murphy et al., 2017). However, along root activity did not vary significantly over time for
either enzyme class. The area of root system sampled was in the zone of maturation, a zone
associated with a stable rate of nutrient uptake (Giles et al., 2018). I hypothesised that
plant-plant competition would have changed the temporal dynamics of root axis enzymatic
activity, but it seems the inherent stability of this root zone was greater than the influence
of plant-plant competition. Other root zones are associated with uptake of specific
nutrients, for example the apical root zone is associated with iron absorption and the
elongation zone with sulphur uptake (Travis S Walker et al., 2003). Therefore, depending on
the root zone sampled and nutrient studied, there will likely be differing patterns of enzyme
activity.
There is the potential for some enzyme activity to be produced by the plants
themselves: up to 10 % (Xu et al., 2014). Plant-derived leucine aminopeptidases genes have
been detected in the plant genome, and found to have a role in protein turnover (Bartling
and Weiler, 1992). Plants also have cellulases, but these are used for remodelling of cell
walls and are not thought to be strong enough for large scale degradation of cellulose
(Hayashi et al., 2005). Therefore, due to their intra-cellular roles, it is unlikely that plant-
derived enzymes contributed to the enzyme activity outside of the plant roots detected in
this study.
5.4.2 - Root associated area
Cellulase and leucine aminopeptidase root associated area were not solely confined to the
root axis, with increased activity across the sampled areas, including background soil
activity. Cellulase root associated area was temporally dynamic, with a delay in peak enzyme
activity (i.e. when the largest percentage area of membrane was recording either cellulase
110
or leucine aminopeptidase activity) when in competition compared to isolation. The
zymography assay measured total cellulase activity of multiple microbial functional groups
and did not differentiate between exo- and endo-glucanase activities. Exo-glucanases break
glucose from the end of cellulase polymers, whilst endo-glucanases break bonds within the
cellulose chains (Pappan et al., 2011). There may have been differing dynamics if endo- and
exo-glucanase activity were examined separately.
Leucine aminopeptidase root associated area also demonstrated a delay in activity
but only when Proctor was in intra-cultivar competition. This delay in leucine
aminopeptidase root associated area when in intra-cultivar competition echoes a similar
trend to the delay of 14.5 days in Proctor peak above-ground nitrogen accumulation rate
found in a previous study (Schofield et al., 2019). The mechanism that links these two
observations is not clear. Proctor plants may have delayed peak root exudate production
when in intra-cultivar competition, influencing microbial activity to limit competition
between the two plants. However, there may also be further mechanisms, for example
involving plant-microbe signalling, already known to be important in recruitment of
microbial symbionts and plant growth promoting rhizobacteria (Chagas et al., 2018;
Labuschagne et al., 2018).
As the same area was sampled consistently over the experiment, the sampled area
became increasingly far from the root tip, a known hotspot of soil microbial community
enzyme activity. This may have influenced the activity of the two enzyme classes.
Phosphatase activity has previously been found to vary with distance from the root tip (Giles
et al. 2018), which may have influenced the results presented. However, there was no
significant difference in root biomass or total root length between any of the treatments
(Table 5.1), indicating that the relative sampling position remained consistent across
treatments in this study. One benefit of sampling in the mature root zone is that it allows
comparisons among treatments as the sampled areas were all a similar distance from the
root tip at each time point. The zone of maturation is a region of the root with less
exudation compared to the zone of elongation (Badri and Vivanco, 2009), but with root hairs
that provide greater surface area for nutrient absorption (Gilroy and Jones, 2000). There
may have also been an influence of root branching which occurred in some of the sampled
areas due to plant foraging for nutrients (Forde, 2014). This hypothesis requires further
111
sampling of a greater proportion of the root system for a high resolution of spatiotemporal
trends in microbial enzyme activity with root branching.
5.4.3 - What role could root exudates have in the temporal dynamics of enzyme activity?
The different patterns of soil enzyme activity associated with the three treatments may
have been driven by differences in root exudation, with changes in root exudate
composition then affecting microbial activity. Plants select for a specific microbial
community through root exudates (Hu et al., 2018; Shi et al., 2011). Therefore, root
exudates may do more than simply increase the rate of nitrogen mineralisation (Mergel et
al., 1998), and may also influence the timing of mineralisation by influencing soil microbial
community composition.
Root exudation quality and quantity is known to change over time (van Dam and
Bouwmeester, 2016) with root exudates increasing the carbon to nitrogen ratio in the
rhizosphere, regulating mining of SOM by the soil microbial community (Chaparro et al.,
2012; Meier et al., 2017). Exudates also act as a form of signalling between plants (van Dam
and Bouwmeester, 2016), eliciting a change in root architecture (Caffaro et al., 2013),
branching (Forde, 2014) and biomass allocation (Schmid et al., 2015). Therefore, the
observed delay in soil enzyme activity could be regulated by temporally dynamic root
exudation. Root branching would have also increased the total root area within the
measurement areas, potentially increasing the total exudates available to the soil microbial
community and promoting greater enzymatic activity. Consequently, the active control of
root exudates instead of root biomass or surface area alone may be an important part of the
mechanism behind the observed shifts in soil microbial community activity. Combining this
research with measurements of microbial biomass in the rhizosphere soil would help
determine if the increase in exudation is promoting an increase in exoenzyme production
through priming of the soil microbial community (Dijkstra et al., 2013) or if increases in
exoenzyme production are due to an increased microbial biomass. This is an avenue for
future research.
112
5.4.4 - Temporal dynamics of enzyme activity in response to plant-plant competition
The soil enzyme classes in this study demonstrated different temporal patterns in activity in
response to changes in plant-plant competition. Relative to the isolated-plant control, the
temporal dynamics of cellulase root associated area were influenced by both intra- and
inter-cultivar competition, whereas leucine aminopeptidase dynamics were only
significantly influenced by intra-cultivar competition.
The influence of plant-plant competition on the temporal dynamics of root
associated enzyme area occurred beyond the immediate zone surrounding the root. This
contrasts with the results of Ma et al. (2018), who found a strong localisation of leucine
aminopeptidase and cellulase activity close to plant roots across the whole root system.
Furthermore, they found that the root associated area did not increase over time around
lentil roots (Lens culinaris) and only began to increase around Lupin (Lupinus albus) roots
eight weeks into the study (Ma et al. 2018). This is much later than the barley in this study,
where sampling occurred in the first month of growth, the period prior to peak nitrogen
accumulation rate in these barley cultivars (Schofield et al., 2019). This is likely to be a
period of soil microbial community priming to mine for nitrogen within soil organic matter
and may account for the differences between Ma et al.’s and this study. In this study the
extent of the rhizosphere and therefore activity of leucine aminopeptidase and cellulase
may have increased over time, as labile carbon in root exudates diffused away from roots
and the zone of nutrient depletion surrounding roots enlarged.
This study does however have its limitations. The rhizobox system is a very artificial
setup with roots growing in a single plane, which would influence root growth and
development. This does not account for the 3D nature of root growth and interactions with
the soil particles and the soil microbial community. More complex interactions and
temporally dynamic responses may be occurring in a 3D system through localised changes in
the soil microbial community. Therefore, development of the zymography method in order
to sample 3D root systems is a natural avenue for future research. There also need to be
measures of nutrient concentration and microbial biomass as measurements of enzyme
activity alone cannot be directly extrapolated as an indicator of nutrient cycling. Including
these measures would determine if greater enzyme activity was due to an increase in
microbial biomass or increased microbial demand for nutrients.
113
The temporal dynamics of enzyme activity are likely to be strongly influenced by
environmental conditions including temperature (Steinweg et al. 2012), soil moisture
(Barros et al. 1995) and soil nutrient concentration (Mbuthia et al. 2015). This study
demonstrates that the temporal dynamics of the two groups of enzymes, both involved in
nutrient turnover, were affected differently by plant-plant competition when grown in
constant environmental conditions. This could be due to the composition of root exudates
and concentration of secondary metabolites that selected for a soil microbial community
with specific functions (Hu et al., 2018; Shi et al., 2016). Plants could have therefore
regulated soil microbial community activity through the differing sensitivity of microbial
taxa to root exudates (Shi et al., 2011; Zhang et al., 2017).
5.5 - Conclusions
Root axis activity of leucine aminopeptidase and cellulase was not temporally dynamic in
response to plant-plant competition. Plant-plant competition influenced the root associated
area of the two enzyme classes in this study differently. The extent of root associated
cellulase area was delayed by inter- and intra-cultivar competition, whilst leucine
aminopeptidase root associated area was only delayed by intra-cultivar competition. This
may have been mediated through root exudates selecting for specific microbial functions.
Therefore, conclusions concerning the temporal dynamics of nutrient cycling are likely to be
dependent on the enzyme class being studied and method of image analysis used. Changes
in these temporal dynamics may have been mediated through changes in the quantity and
composition of root exudates by plants in competition, leading to a delay in peak soil
enzyme activity. The extent of plant root influence was found to increase over time as
exudates diffused away from roots, an important factor in studies of the soil microbial
community activity. This study therefore demonstrates the close link between the temporal
dynamics of plant and microbial resource capture and the influence each process has on the
other.
114
References
Badri, D. V. and Vivanco, J. M. (2009) Regulation and function of root exudates. Plant, Cell
and Environment, 32(6), 666–681.
Bardgett, R. D., Streeter, T. C. T. C. and Bol, R. (2003) Soil Microbes Compete Effectively With
Plants For Organic-Nitrogen Inputs To Temperate Grasslands. Ecology, 84(5), 1277–1287.
Bardgett, R. D., Bowman, W. D., Kaufmann, R. and Schmidt, S. K. (2005) A temporal
approach to linking aboveground and belowground ecology. Trends in Ecology and
Evolution, 20(11), 634–641.
Barros, N., Gomez-Orellana, I., Feijóo, S. and Balsa, R. (1995) The effect of soil moisture on
soil microbial activity studied by microcalorimetry. Thermochimica Acta, 249, 161–168.
Bartling, D. and Weiler, E. W. (1992) Leucine aminopeptidase from Arabidopsis thaliana
Molecular evidence for a phylogenetically conserved enzyme of protein turnover in higher
plants. European Journal of Biochemistry, 205(1), 425–431.
Bengtson, P., Barker, J. and Grayston, S. J. (2012) Evidence of a strong coupling between
root exudation, C and N availability, and stimulated SOM decomposition caused by
rhizosphere priming effects. Ecology and Evolution, 2(8), 1843–52.
Caffaro, M. M., Vivanco, J. M., Botto, J. and Rubio, G. (2013) Root architecture of
Arabidopsis is affected by competition with neighbouring plants. Plant Growth Regulation,
70(2), 141–147.
Chagas, F. O., Pessotti, R. D. C., Caraballo-Rodríguez, A. M. and Pupo, M. T. (2018) Chemical
signaling involved in plant-microbe interactions. Chemical Society Reviews, 47(5), 1652–
1704.
Chaparro, J. M., Sheflin, A. M., Manter, D. K. and Vivanco, J. M. (2012) Manipulating the soil
microbiome to increase soil health and plant fertility. Biology and Fertility of Soils, 48, 489–
499.
van Dam, N. M. and Bouwmeester, H. J. (2016) Metabolomics in the Rhizosphere: Tapping
into Belowground Chemical Communication. Trends in Plant Science, 21(3), 256-265.
115
Forde, B. G. (2014) Nitrogen signalling pathways shaping root system architecture: An
update. Current Opinion in Plant Biology, 21, 30–36.
Garcia-Pausas, J. and Paterson, E. (2011) Microbial community abundance and structure are
determinants of soil organic matter mineralisation in the presence of labile carbon. Soil
Biology and Biochemistry, 43(8), 1705–1713.
Giles, C. D., Dupuy, L., Boitt, G., Brown, L. K., Condron, L. M., Darch, T., Blackwell, M. S. A.,
Menezes-Blackburn, D., Shand, C. A., Stutter, M. I., Lumsdon, D. G., Wendler, R., Cooper, P.,
Wearing, C., Zhang, H., Haygarth, P. M. and George, T. S. (2018) Root development impacts
on the distribution of phosphatase activity: Improvements in quantification using soil
zymography. Soil Biology and Biochemistry, 116, 158–166.
Gilroy, S. and Jones, D. L. (2000) Through form to function: Root hair development and
nutrient uptake. Trends in Plant Science, 5(2), 56–60.
Hayashi, T., Yoshida, K., Woo Park, Y., Konishi, T. and Baba, K. (2005) Cellulose metabolism in
plants. International Review of Cytology, 247, 1–34.
Hodge, A., Robinson, D. and Fitter, A. (2000) Are microorganisms more effective than plants
at competing for nitrogen? Trends in Plant Science, 5(7), 304–308.
Hortal, S., Lozano, Y. M., Bastida, F., Armas, C., Moreno, J. L., Garcia, C. and Pugnaire, F. I.
(2017) Plant-plant competition outcomes are modulated by plant effects on the soil
bacterial community. Scientific Reports, 7(1), 17756.
Hu, L., Robert, C. A. M., Cadot, S., Zhang, X., Ye, M., Li, B., Manzo, D., Chervet, N., Steinger,
T., van der Heijden, M. G. A., Schlaeppi, K. and Erb, M. (2018) Root exudate metabolites
drive plant-soil feedbacks on growth and defense by shaping the rhizosphere microbiota.
Nature Communications, 9(1), 738.
Kuzyakov, Y., Friedel, J. . and Stahr, K. (2000) Review of mechanisms and quantification of
priming effects.’ Soil Biology and Biochemistry, 32(11–12), 1485–1498.
Labuschagne, N., Madala, N. E., Piater, L. A., Mhlongo, M. I. and Dubery, I. A. (2018) The
Chemistry of Plant–Microbe Interactions in the Rhizosphere and the Potential for
116
Metabolomics to Reveal Signaling Related to Defense Priming and Induced Systemic
Resistance. Frontiers in Plant Science, 9, 1–17.
Lobet, G., Pagès, L. and Draye, X. (2011) A Novel Image-Analysis Toolbox Enabling
Quantitative Analysis of Root System Architecture. Plant Physiology, 157(1), 29–39.
Ma, X., Zarebanadkouki, M., Kuzyakov, Y., Blagodatskaya, E., Pausch, J. and Razavi, B. S.
(2018) Spatial patterns of enzyme activities in the rhizosphere: Effects of root hairs and root
radius. Soil Biology and Biochemistry, 118, 69–78.
Mbuthia, L. W., Acosta-Martínez, V., DeBruyn, J., Schaeffer, S., Tyler, D., Odoi, E., Mpheshea,
M., Walker, F. and Eash, N. (2015) Long term tillage, cover crop, and fertilization effects on
microbial community structure, activity: Implications for soil quality. Soil Biology and
Biochemistry, 89, 24–34.
Meier, I. C., Finzi, A. C. and Philiips, R. P. (2017) Root exudates increase N availability by
stimulating microbial turnover of fast-cycling N pools. Soil Biology and Biochemistry, 106,
119–128.
Mergel, A., Timchenko, A. and Kudeyarov, V. (1998) Role of plant root exudates in soil
carbon and nitrogen transformation. In Root Demographics and Their Efficiencies in
Sustainable Agriculture, Grasslands and Forest Ecosystems. Springer, Netherlands, 43–54.
Murphy, C. J., Baggs, E. M., Morley, N., Wall, D. P. and Paterson, E. (2017) Nitrogen
availability alters rhizosphere processes mediating soil organic matter mineralisation. Plant
and Soil, 417(1–2), 499–510.
Pappan, K., Wang, H., Prade, R., Segato, F., Mort, A., Lee, D. and Squina, F. (2011) High-
Temperature Enzymatic Breakdown of Cellulose. Applied and Environmental Microbiology,
77(15), 5199–5206.
Paterson, E. (2003) Importance of rhizodeposition in the coupling of plant and microbial
productivity. European Journal of Soil Science, 54(4), 741–750.
Penton, C. R. and Newman, S. (2007) Enzyme activity responses to nutrient loading in
subtropical wetlands. Biogeochemistry, 84(1), 83–98.
117
Pinheiro, J., Bates, D., DebRoy, S., Sarkar, D. and Team, R. C. (2016) _nlme: Linear and
Nonlinear Mixed Effects Models_., R package version 3.1-128, (URL: http://CRAN.R-pro.) ,
(Accessed 23/01/2020).
Schindelin, J., Arganda-Carreras, I., Frise, E., Kaynig, V., Longair, M., Pietzsch, T., Preibisch, S.,
Rueden, C., Saalfeld, S., Schmid, B., Tinevez, J.-Y., White, D. J., Hartenstein, V., Eliceiri, K.,
Tomancak, P. and Cardona, A. (2012) Fiji: an open-source platform for biological-image
analysis. Nature Methods, 9(7), 676–682.
Schimel, J. P. and Bennett, J. (2004) Nitrogen mineralization: Challenges of a changing
paradigm. Ecology, 85, 591–602.
Schmid, C., Bauer, S. and Bartelheimer, M. (2015) Should I stay or should I go? Roots
segregate in response to competition intensity. Plant and Soil, 391(1–2), 283–291.
Schneider, C. A., Rasband, W. S. and Eliceiri, K. W. (2012) NIH Image to ImageJ: 25 years of
image analysis. Nature Methods, 9(7), 671–675.
Schofield, E. J., Rowntree, J. K., Paterson, E., Brewer, M. J., Price, E. A. C., Brearley, F. Q. and
Brooker, R. W. (2019) Cultivar differences and impact of plant-plant competition on
temporal patterns of nitrogen and biomass accumulation. Frontiers in Plant Science, 10, 215.
Shi, S., Nuccio, E. E., Shi, Z. J., He, Z., Zhou, J. and Firestone, M. K. (2016) The interconnected
rhizosphere: High network complexity dominates rhizosphere assemblages. Ecology letters,
19(8), 926–936.
Shi, S., Richardson, A. E., O’Callaghan, M., DeAngelis, K. M., Jones, E. E., Stewart, A.,
Firestone, M. K. and Condron, L. M. (2011) Effects of selected root exudate components on
soil bacterial communities. FEMS Microbiology Ecology, 77(3), 600–610.
Spohn, M. and Kuzyakov, Y. (2013) Distribution of microbial- and root-derived phosphatase
activities in the rhizosphere depending on P availability and C allocation - Coupling soil
zymography with 14C imaging. Soil Biology and Biochemistry, 67, 106–113.
Spohn, M. and Kuzyakov, Y. (2014) Spatial and temporal dynamics of hotspots of enzyme
activity in soil as affected by living and dead roots-a soil zymography analysis. Plant and Soil,
379(1–2), 67–77.
118
Steinweg, J. M., Dukes, J. S. and Wallenstein, M. D. (2012) Modelling the effects of
temperature and moisture on soil enzyme activity: Linking laboratory assays to continuous
field data. Soil Biology and Biochemistry, 55, 85–92.
R Core Team (2015) R: A Language and Environment for Statistical Computing. R Foundation
for Statistical Computing, 1, 409.
Venables, W. N. and Ripley, B. D. I. (2002) Modern Applied Statistics with S. Fourth Edition,
Springer, New York.
Walker, T. S., Bais, H. P., Grotewold, E. and Vivanco, J. M. (2003) Root exudation and
rhizosphere biology. Plant physiology, 132(1), 44–51.
Xu, Z., Yu, G., Zhang, X., Ge, J., He, N., Wang, Q. and Wang, D. (2014) The variations in soil
microbial communities, enzyme activities and their relationships with soil organic matter
decomposition along the northern slope of Changbai Mountain. Applied Soil Ecology, 86,
19–29.
Zhang, R., Vivanco, J. M. and Shen, Q. (2017) The unseen rhizosphere root–soil–microbe
interactions for crop production. Current Opinion in Microbiology, 37, 8–14.
119
Chapter 6
Gene expression response to intra- and inter- cultivar competition and
potential consequences for temporal dynamics of resource capture
Contents
6.1 – Introduction
6.2 - Materials and methods
6.2.1 - Soil characterisation
6.2.2 - Experimental setup
6.2.3 - RNA microarray analysis
6.2.4 - Data analysis
6.2.5 - Validation of microarrays using qRT-PCR
6.3 - Results
6.3.1 - Common competition genes
6.3.2 - Intra-cultivar competition genes
6.3.3 - Inter-cultivar competition genes
6.3.4 - Validation of expression patterns using qRT-PCR
6.4 - Discussion
6.4.1 - Genes of unknown function
6.4.2 - Patterns of gene expression
6.4.3 - Multiple testing and validation
6.4.4 - What does this mean in terms of plant-plant competition?
6.5 - Conclusions
Abstract
Belowground, plants are known to respond to the presence of a neighbouring individual
through the modification of root architecture, changing patterns of root branching and the
120
temporal dynamics of nutrient uptake. However, to aid in elucidating the mechanisms
behind a change in the temporal dynamics of nutrient uptake, the changes at a gene
expression level require characterisation. This study aimed to characterise gene expression
associated with intra-specific plant-plant competition during early plant growth. Barley
(Hordeum vulgare, cv. Proctor) plants were grown in isolation, intra-cultivar and inter-
cultivar competition for 19 days, then root material was harvested for gene expression
analysis. A core set of genes were identified that were significantly differentially expressed
in both competition treatments (17 total, 11 upregulated, 6 downregulated). Genes that
were unique to each competition treatment were also identified. A greater number of genes
were significantly differentially expressed in inter-cultivar competition (117 total, 58
upregulated, 59 downregulated) compared to intra-cultivar competition (41 total, 22
upregulated, 19 downregulated). The combination of up and down regulated genes in each
competition treatment had a number of different identified functions. The majority of
significantly differentially expressed genes were associated with plant growth and
development, suggesting a growth pattern change in response to the presence of a
competitor. This indicates a differential response at a gene expression level depending on
the identity of a competing individual, and at a time which is likely to be prior to
competition induced nutrient deficiency. Therefore, plants may be able to respond
differently depending on how closely related they are to a competitor, to potentially favour
those that are more closely related and compete more intensely with more distantly related
individuals.
6.1 - Introduction
Plants respond to stress in a number of ways depending on the type of stress i.e. abiotic or
biotic (Ramakrishna and Ravishankar, 2011; Schmid et al., 2013) or the combination of
stresses a plant is experiencing (Bowsher et al., 2017). Reponses can include a change in
shoot architecture due to shading stress (Cahill, 2003) or root architecture changes from
nutrient deficiency stress as roots forage for nutrients (Caffaro et al., 2013). Plants can also
alter the partitioning of resources between roots and shoots in response to nutrient
limitation and plant-plant competition (Berendse and Möller, 2009), as well as the timing of
key processes, such as resource capture, to limit competition for common resources
121
(Schofield et al., 2018). Changes in the temporal dynamics of resource capture have been
found in response to plant-plant competition in annual (Schofield et al., 2019) and perennial
(Trinder et al., 2012) species.
Mediation of plant responses to stress occurs at a molecular level through a series of
plant growth regulators (Verma et al., 2016). These cause changes in gene expression via
transcription factors, which then mediates downstream responses to stress (Does et al.,
2013). The suite of genes up or down regulated are specific to the type of stress or
combination of stresses being experienced by the plant (Suzuki et al., 2014). Also, when
there is a combination of stresses, for example heat and drought (which often co-occur), the
profile of gene expression is not a combination of the two individual stresses, but a unique
pattern of expression (Zandalinas et al., 2018). These patterns may ‘tailor’ the response of a
plant to specific environmental conditions, to minimise the negative impacts of stress.
A few studies have addressed the issue of gene expression patterns associated with
plant-plant competition. These studies identified the accumulation of defensive secondary
metabolites (Masclaux, Bruessow, Schweizer, Gouhier-Darimont, Keller, Reymond, et al.,
2012) and pathogen related proteins in response to plant-plant competition (Schmid et al.,
2013). The role of pathogen related proteins in plant-plant competition is unclear, but the
proteins have been associated with a biotic stress response (Schmid et al., 2013). Also,
genes associated with nutrient starvation, cold and salinity stress were upregulated in
response to plant-plant competition (Schmid et al., 2013). Bowsher et al. (2017), using
Trifolium species grown in field soil, found a core set of genes associated with both biotic
and abiotic stress expressed in response to plant-plant competition. In addition, differential
gene expression was found in response to a heterospecific competitor compared to a
conspecific competitor (Bowsher et al., 2017). Conspecific competition has also been found
to elicit a change in gene expression in a neighbouring individual (Subrahmaniam et al.,
2018). Intra-cultivar competition in barley has been found to elicit a temporally dynamic
response in nitrogen accumulation rate (Schofield et al., 2019; Chapter 2) but the impact of
this at a molecular level has yet to be explored.
Barley (Hordeum vulgare) has been the subject of a concerted effort to sequence
and annotate its genome, to identify genes with known functions (Schulte et al., 2009).
Using barley as a model plant provides information about plant-plant competition in an
122
ecologically (grasses) and economically (cereals) important group. In crop plants,
competition between individuals is likely to influence yield. Therefore, in order to maintain
or increase crop yields we need to better understand the mechanism behind interactions
between neighbouring plants. The majority of gene expression studies have been carried
out using the model plant Arabidopsis thaliana grown in lab conditions (Masclaux,
Bruessow, Schweizer, Gouhier-Darimont, Keller, Reymond, et al., 2012; Schmid et al., 2013;
Subrahmaniam et al., 2018). In contrast, the use of a crop species grown in soil, as in this
study, provides information relevant to both agriculture and ecology.
Previous studies can help us pinpoint combinations of cultivars and key time points
during intra-cultivar interactions which are likely to be of interest with respect to gene
expression. Specifically, the previous study (Schofield et al., 2019; Chapter 2) examined the
temporal dynamics of peak nitrogen uptake rate in an early cultivar, Tammi, and late
cultivar, Proctor, when the plants were in isolation, intra- and inter- cultivar competition.
Peak nitrogen accumulation rate significantly shifted in both cultivars with intra-cultivar
competition, but not inter-cultivar competition compared to isolation. At 19 days after
planting, nitrogen accumulation rate peaked for Proctor plants in isolation and inter-cultivar
competition but not intra-cultivar competition, which peaked at 33 days after planting
(Schofield et al., 2019; Chapter 2). Based on these data, I would expect differences in the
pattern of gene expression at 19 days after planting between plants in intra-cultivar
competition, compared to those in isolation or inter-cultivar competition, and the latter pair
to be more similar to each other.
In this study, therefore, I examined the patterns of gene expression of Proctor plants
grown in isolation, intra- and inter-cultivar competition at 19 days after planting. The aim of
the study was to identify specific and common sets of differentially expressed genes when
Proctor was grown under inter- and intra-cultivar competition conditions compared to when
it was grown in isolation.
123
6.2 - Materials and methods
6.2.1 - Soil characterisation
Soil was collected from an agricultural field that had previously cropped spring barley
(Hordeum vulgare), and had previously been cultivated using standard fertilisation practice
(500 kg of 22N-4P-14K ha-1 yr-1) (Sourced from Balruddery Farm, Invergowrie, Scotland,
56.4837° N, 3.1314° W). The soil was homogenised through a 6 mm sieve and thoroughly
mixed, then stored at 4°C until planting. The soil organic content was 6.2 % ± 0.3 % SEM
(loss-on-ignition, n = 4), with a mean pH of 5.7 ± 0.02 SEM (n = 4) in water.
6.2.2 - Experimental setup
Proctor plants were grown in isolation (P), intra-cultivar competition (PP) and inter-cultivar
competition with Tammi (TP), with four replicates of each of the three treatments, giving 12
pots in total. Pots (diameter = 102 mm, depth = 135 mm) were filled to a bulk density of 1 g
cm-3. Proctor and Tammi plants were pre-germinated on damp tissue paper at room
temperature in the dark for three days prior to planting. Germinated seeds were planted 25
mm deep and approximately 50 mm apart within the pot. Pots were grown in a greenhouse
(18 °C with supplementary lighting) for 19 days with weekly watering to 60 % water holding
capacity to limit competition for water. Mesh screens (45 x 16 cm, mesh size 0.08 mm
(Harrod Horticulture, Lowestoft, UK)) were inserted into pots to ensure competition only
occurred underground.
Harvesting was carried out after 19 days in replicate blocks. This was during the
period of peak nitrogen accumulation rate, and prior to peak biomass accumulation rate
and grain filling (Schofield et al., 2019; Chapter 2). The plants were removed from pots,
separated and roots rinsed. The washed roots of each individual were placed into vials,
sealed and placed into liquid nitrogen within three minutes of harvesting. The vials were
then stored at -80 °C until RNA was extracted.
124
6.2.3 - RNA microarray analysis
This method uses short pieces of DNA, complementary to known genes (identified through
genome sequencing) that are individually printed on a glass slide known as a microarray.
The microarray slide in this study had 61,000 complementary sequences printed on it. RNA
was extracted from the samples, cleaned and converted into cDNA. The cDNA was then
labelled using a fluorescent dye and added to the slide. The slides were incubated overnight
and then scanned for fluorescence at each printed gene. The level of fluorescence was then
used to determine whether the expression of the gene increased or decreased (Kaliyappan
et al., 2012) in each of the competition treatments compared to plants in isolation.
RNA was extracted using a Qiagen RNeasy Mini Kit (Qiagen, Manchester, UK), as
recommended by the manufacturer with an additional clean-up step consisting of a phenol-
chloroform extraction (Toni et al., 2018). RNA was quantified using a NanoDrop™
2000/2000c (Thermo Fisher Scientific, UK) and quality measured using a Bioanalyser (Agilent
Technologies UK, Edinburgh UK).
Microarray processing was performed using a custom-designed barley Agilent
microarray (A-MEXP-2357; www.ebi.ac.uk/arrayexpress). One microarray was used for each
of the twelve replicates. The microarray contains c. 61,000 60-mer probes derived from
predicted barley transcripts and full-length cDNAs (IBGSC, 2012). Samples were labelled
using an Agilent One Colour Low Input Quick Amp Labelling Kit (Agilent, Santa Clara, CA,
USA) and hybridised to microarrays as recommended according to the ‘One-Color
Microarray-Based Gene Expression Analysis’ protocol (v 6.5, Agilent Technologies). Scanning
was performed using an Agilent G2565CA Microarray Scanner (Agilent, Santa Clara, CA, USA)
at 3 µm resolution.
6.2.4 - Data analysis
Data from the scanned microarray images were extracted using Feature Extraction Software
(v. 10.7.3.1; Aglient, Santa Clara, CA, USA). Following visual quality control, data from each
microarray was imported into GeneSpring software (v. 7.3; Aglient, Santa Clara, CA, USA) for
data analysis. Data were normalised using default Agilent FE one-colour settings in
125
GeneSpring. In addition, data were filtered to remove inconsistent probe data flagged as
absent in more than one replicate per sample. Following filtering using feature flags to
assess outliers in the data, reliable data from 26,006 probes were taken forward for
statistical analysis. Putative differentially expressed genes (≥ two-fold change) were
identified through pairwise analysis (Student’s t-test) of Proctor plants in isolation (P) with
intra-specific competition (PP: 41 genes) or inter-specific competition (TP: 117 genes). Gene
lists were compared to identify those which are common or specific to each competition
type. Corrections for multiple testing did not allow any genes though the filtering process,
due to the subtle nature of the expected changes in gene expression.
Differentially expressed genes were categorised by function using the rice
annotation description in the UniProt database (www.uniprot.org). Based on the rice
described function, the genes were placed into five categories: growth and development;
plant stress; genome rearrangement; gene expression control; and those of unknown
function.
6.2.5 - Validation of microarrays using qRT-PCR
A technical validation was carried out to validate the trends in gene expression observed in
the microarrays using quantitative reverse transcription-PCR (qRT-PCR). For this, five stress
response genes that were significantly differentially expressed in the microarrays were
selected (MLOC_74116.1 – Chalcone synthase, MLOC_25773.1 – Jasmonate induced,
MLOC_23705.2 – Jacalin lectin like protein, MLOC_81765.1 – WIP wounding protein,
MLOC_44884.1 – Zinc finger protein, plus protein phosphatase 2 (PDF2), a commonly used
housekeeping gene (Warzybok and Migocka, 2013) as an internal control. As stress genes
were predicted to be upregulated in response to plant-plant competition, these were
chosen for the validation to confirm the observed microarray gene expression patterns.
Primer pairs were designed for each of the five genes (Table 6.1) with an internal probe
using the Roche Universal ProbeLibrary (Roche, Basel, Switzerland). RNA from each
treatment was pooled, treated with a DNase (DNase I kit, Thermo-Fisher Scientific,
Manchester, United Kingdom) and converted to cDNA (TaqMan® cDNA kit, Thermo-Fisher
Scientific, Manchester, United Kingdom).
126
Primer pair efficiencies were initially tested using serial dilutions which were then
analysed using StepOne thermocycler (ThermoFisher Scientific (Applied Biosystems),
Waltham, MA, USA). Only three primer pairs were efficient enough to be carried forward to
the validation: MLOC_23705.2 – Jacalin lectin like protein, MLOC_25773.1 – Jasmonate
induced and MLOC_74116.1 – Chalcone synthase. These were taken forward to the qRT-PCR
assay and analysed using a StepOne thermocycler (ThermoFisher Scientific (Applied
Biosystems), Waltham, MA, USA) (15 min 95°C, followed by 40 cycles of 10 seconds 95°C
and 60 seconds at 60°C) with three technical replicates for each treatment. The results were
then normalised to the isolation (P) treatment. These results were compared to the gene
expression patterns from the microarray to confirm the magnitude and direction (up or
down regulation) of gene expression.
Table 6.1 - qRT-PCR primers used in this study.
Gene name Forward primer Reverse primer Reference gene
Chalcone
synthase
cagaagacgaggtgggtgat gcagaaggccatcaagga MLOC_74116.1
Jasmonate
induced
ttgttaaaggcgagcttgagt acaagacgtcccgtatggag MLOC_25773.1
Jacalin lectin like
protein
ggaaatggagggggtgataa cgagccactgctaactgtgat MLOC_23705.2
WIP wounding
protein
atgcatgggaaatcagtggt attgatttcggttgcgtttt MLOC_81765.1
Zinc finger protein cctacagagcatgcatagttgc aggaaaaaggattttccgatg MLOC_44884.1
6.3 - Results
6.3.1 - Common competition genes
A core set of genes was identified by comparing the list of genes significantly differentially
expressed in each competition treatment. This identified 17 genes common to both
competition treatments (Figure 6.1). Six of these genes were downregulated and 11
127
upregulated (Table 6.2). Of these, four upregulated genes were associated with plant stress
response, including genes induced by jasmonate production, abiotic stress, reactive oxygen
species production and genes involved in flavonoid production (Table 6.2). The majority of
the significantly differentially expressed genes identified that were common to both
competition treatments had functions linked with plant metabolism and growth, with one
gene identified as being involved in the control of gene expression. The remaining genes
were of unknown function. Two genes were found to be differentially downregulated in
intra-cultivar competition and upregulated in inter-cultivar competition. One was associated
with abiotic stress tolerance, whereas the other had a role in general plant metabolism.
6.3.2 - Intra-cultivar competition genes
A total of 41 genes (listed in Appendix 3) were significantly differentially expressed (P ≤ 0.05
with ≥ 2 fold change in expression) only when the plants were in intra-cultivar competition
compared to plants grown in isolation. The identified genes consisted of those associated
with plant growth and development (34 %), stress (24 %), gene expression regulation (9 %)
and genome rearrangement (7 %) (Figure 6.1). The majority of the stress associated genes
were downregulated, with only three genes upregulated (Figure 6.1). Genes associated with
biotic and abiotic stress were downregulated, as well as genes associated with fungal
pathogen response. Plant growth and development associated genes were both up and
down regulated, with similar mixed patterns for gene expression and genome
rearrangement. Of the ten genes with unknown function, seven were upregulated and three
downregulated (Figure 6.1).
6.3.3 - Inter-cultivar competition genes
A total of 117 genes (listed in Appendix 3, Table A2) were significantly (P ≤ 0.05 with ≥ 2 fold
change in expression) differentially expressed only in the inter-cultivar competition
compared to isolation, 76 more than Proctor in intra-cultivar competition. The identified
genes significantly differentially expressed were from a range of functional groups, with the
majority (53 %) associated with plant growth and development. A further 15 % were
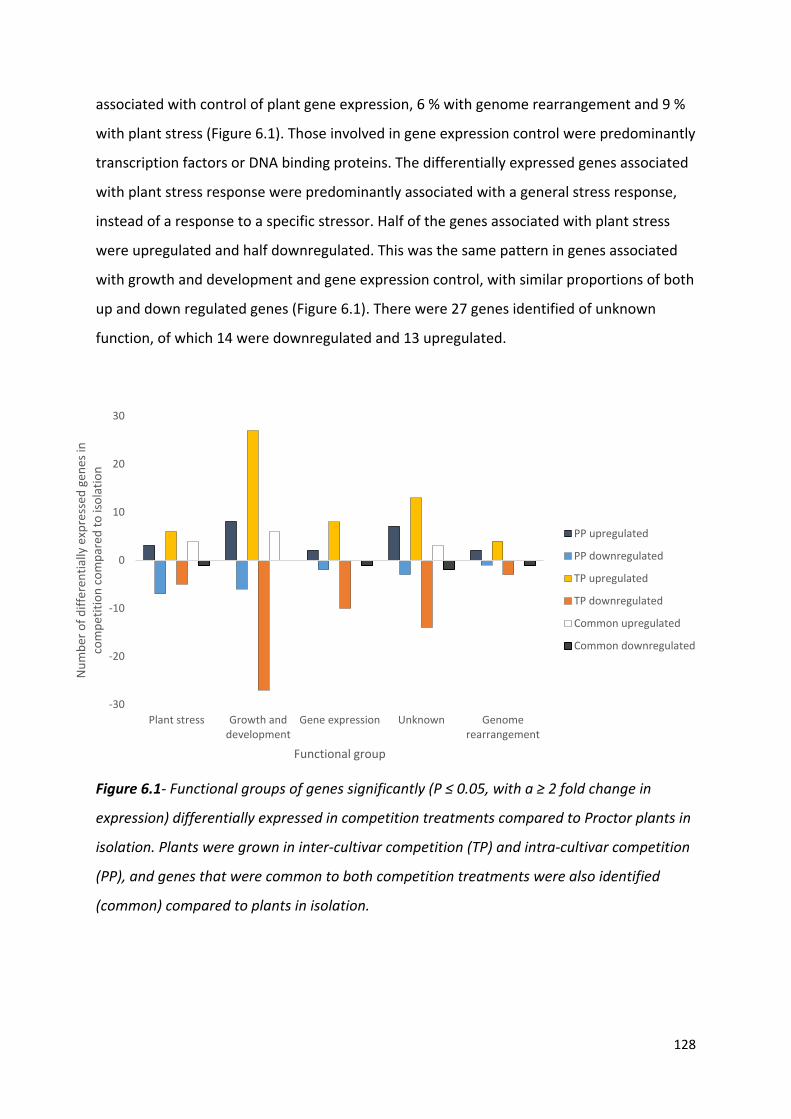
128
associated with control of plant gene expression, 6 % with genome rearrangement and 9 %
with plant stress (Figure 6.1). Those involved in gene expression control were predominantly
transcription factors or DNA binding proteins. The differentially expressed genes associated
with plant stress response were predominantly associated with a general stress response,
instead of a response to a specific stressor. Half of the genes associated with plant stress
were upregulated and half downregulated. This was the same pattern in genes associated
with growth and development and gene expression control, with similar proportions of both
up and down regulated genes (Figure 6.1). There were 27 genes identified of unknown
function, of which 14 were downregulated and 13 upregulated.
Figure 6.1- Functional groups of genes significantly (P ≤ 0.05, with a ≥ 2 fold change in
expression) differentially expressed in competition treatments compared to Proctor plants in
isolation. Plants were grown in inter-cultivar competition (TP) and intra-cultivar competition
(PP), and genes that were common to both competition treatments were also identified
(common) compared to plants in isolation.
-30
-20
-10
0
10
20
30
Plant stress Growth anddevelopment
Gene expression Unknown Genomerearrangement
Num
ber o
f diff
eren
tially
exp
ress
ed g
enes
in
com
petit
ion
com
pare
d to
isol
atio
n
Functional group
PP upregulated
PP downregulated
TP upregulated
TP downregulated
Common upregulated
Common downregulated
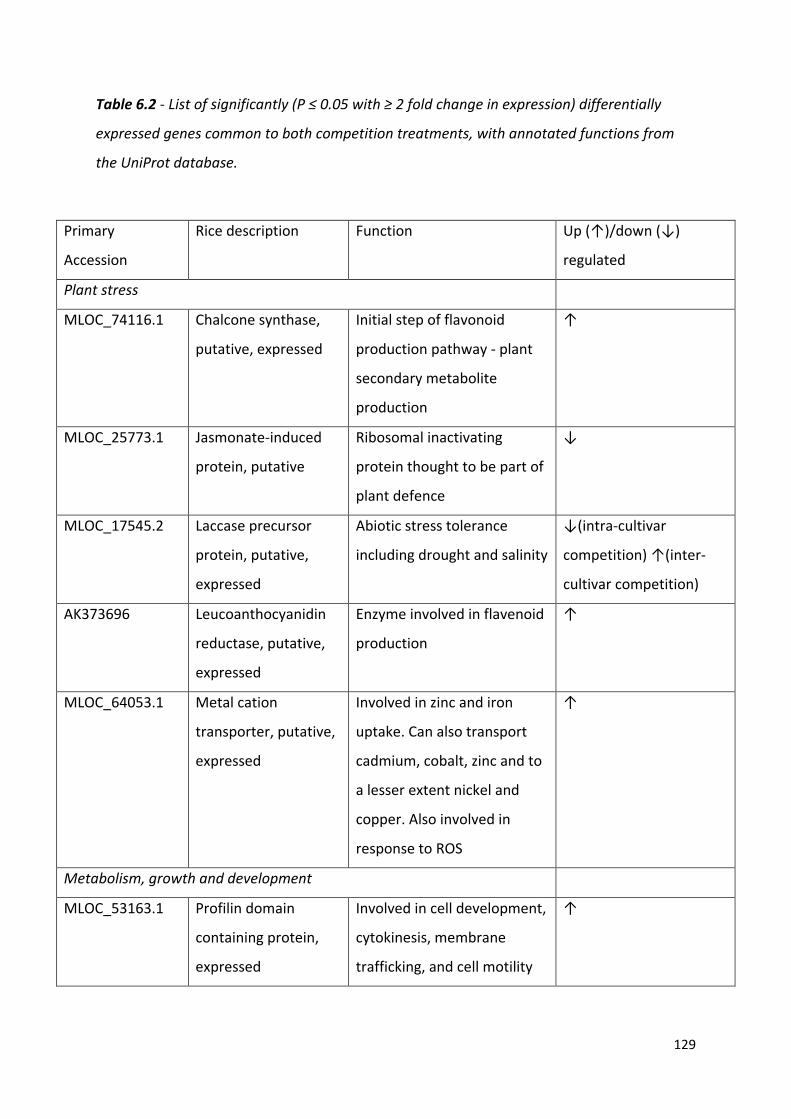
129
Table 6.2 - List of significantly (P ≤ 0.05 with ≥ 2 fold change in expression) differentially
expressed genes common to both competition treatments, with annotated functions from
the UniProt database.
Primary
Accession
Rice description Function Up (↑)/down (↓)
regulated
Plant stress
MLOC_74116.1 Chalcone synthase,
putative, expressed
Initial step of flavonoid
production pathway - plant
secondary metabolite
production
↑
MLOC_25773.1 Jasmonate-induced
protein, putative
Ribosomal inactivating
protein thought to be part of
plant defence
↓
MLOC_17545.2 Laccase precursor
protein, putative,
expressed
Abiotic stress tolerance
including drought and salinity
↓(intra-cultivar
competition) ↑(inter-
cultivar competition)
AK373696 Leucoanthocyanidin
reductase, putative,
expressed
Enzyme involved in flavenoid
production
↑
MLOC_64053.1 Metal cation
transporter, putative,
expressed
Involved in zinc and iron
uptake. Can also transport
cadmium, cobalt, zinc and to
a lesser extent nickel and
copper. Also involved in
response to ROS
↑
Metabolism, growth and development
MLOC_53163.1 Profilin domain
containing protein,
expressed
Involved in cell development,
cytokinesis, membrane
trafficking, and cell motility
↑
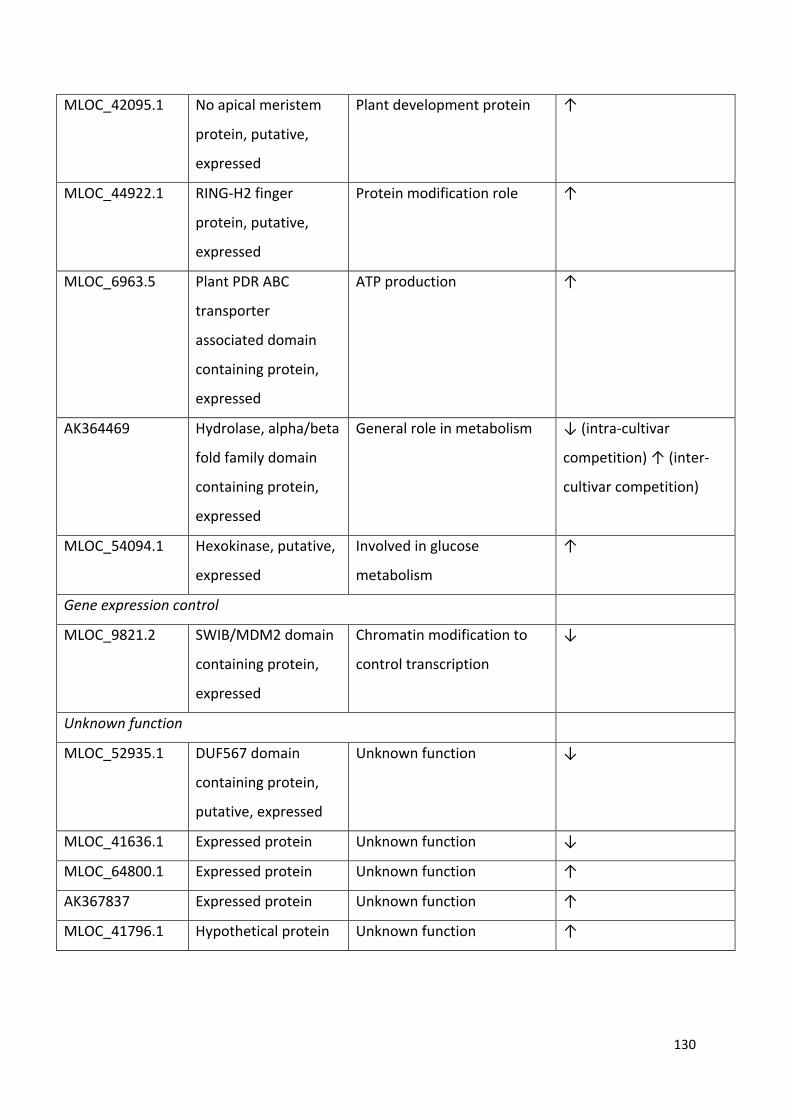
130
MLOC_42095.1 No apical meristem
protein, putative,
expressed
Plant development protein ↑
MLOC_44922.1 RING-H2 finger
protein, putative,
expressed
Protein modification role ↑
MLOC_6963.5 Plant PDR ABC
transporter
associated domain
containing protein,
expressed
ATP production ↑
AK364469 Hydrolase, alpha/beta
fold family domain
containing protein,
expressed
General role in metabolism ↓ (intra-cultivar
competition) ↑ (inter-
cultivar competition)
MLOC_54094.1 Hexokinase, putative,
expressed
Involved in glucose
metabolism
↑
Gene expression control
MLOC_9821.2 SWIB/MDM2 domain
containing protein,
expressed
Chromatin modification to
control transcription
↓
Unknown function
MLOC_52935.1 DUF567 domain
containing protein,
putative, expressed
Unknown function ↓
MLOC_41636.1 Expressed protein Unknown function ↓
MLOC_64800.1 Expressed protein Unknown function ↑
AK367837 Expressed protein Unknown function ↑
MLOC_41796.1 Hypothetical protein Unknown function ↑
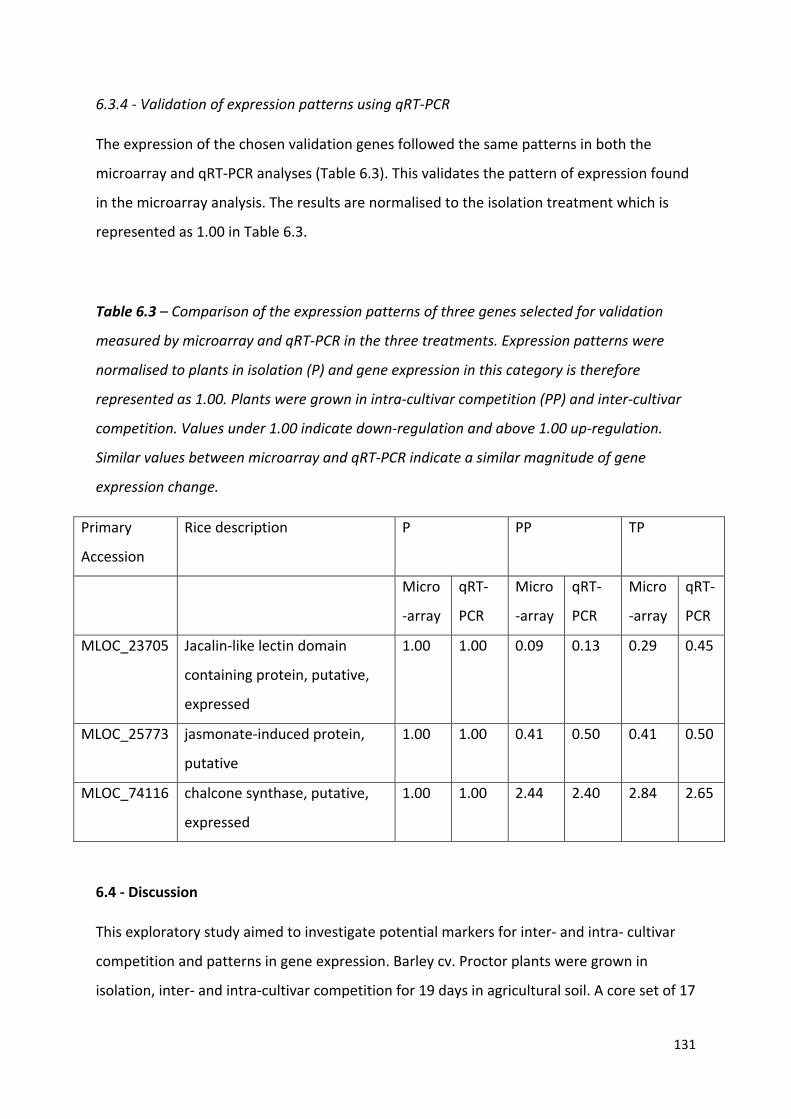
131
6.3.4 - Validation of expression patterns using qRT-PCR
The expression of the chosen validation genes followed the same patterns in both the
microarray and qRT-PCR analyses (Table 6.3). This validates the pattern of expression found
in the microarray analysis. The results are normalised to the isolation treatment which is
represented as 1.00 in Table 6.3.
Table 6.3 – Comparison of the expression patterns of three genes selected for validation
measured by microarray and qRT-PCR in the three treatments. Expression patterns were
normalised to plants in isolation (P) and gene expression in this category is therefore
represented as 1.00. Plants were grown in intra-cultivar competition (PP) and inter-cultivar
competition. Values under 1.00 indicate down-regulation and above 1.00 up-regulation.
Similar values between microarray and qRT-PCR indicate a similar magnitude of gene
expression change.
6.4 - Discussion
This exploratory study aimed to investigate potential markers for inter- and intra- cultivar
competition and patterns in gene expression. Barley cv. Proctor plants were grown in
isolation, inter- and intra-cultivar competition for 19 days in agricultural soil. A core set of 17
Primary
Accession
Rice description P PP TP
Micro
-array
qRT-
PCR
Micro
-array
qRT-
PCR
Micro
-array
qRT-
PCR
MLOC_23705 Jacalin-like lectin domain
containing protein, putative,
expressed
1.00 1.00 0.09 0.13 0.29 0.45
MLOC_25773 jasmonate-induced protein,
putative
1.00 1.00 0.41 0.50 0.41 0.50
MLOC_74116 chalcone synthase, putative,
expressed
1.00 1.00 2.44 2.40 2.84 2.65
132
genes were significantly differentially expressed in both competition treatments, but there
were also genes that were uniquely expressed in each of the competition treatments. A
total of 117 (58 upregulated, 59 downregulated) genes were differentially expressed in
inter-cultivar competition, compared to 41 (22 upregulated, 19 downregulated) in intra-
cultivar competition. The majority of genes were associated with growth and development
but there were others associated with plant stress and the control of gene expression.
6.4.1 - Genes of unknown function
A total of 42 differentially expressed genes were of unknown function, with a mixture of up
and down regulation. The current barley whole genome sequence was completed in 2012
and is yet to be fully annotated (Mayer et al., 2012a). Consequently the rice genome was
used for many of the functional annotations in this study: rice was the first complete crop
genome to be published in 2006 and is well annotated (Jackson, 2016). The genes in this
study that are of unknown function have either not been annotated in rice, are not similar
enough to the rice homologues, or are unique to barley. Future barley annotation projects
may allow the function of these genes to be identified. This includes transcriptome
sequencing to validate gene annotation, using closely related species as a reference genome
(Mayer et al., 2012a).
6.4.2 - Patterns of gene expression
Gene expression differed between the two competition treatments in terms of the total
number of genes significantly differentially expressed, the pattern of up and down
regulation and the function of the genes. The observation of a core set of ‘competition
genes’ differentially expressed in both competition treatments, as well as uniquely
expressed genes in each competition treatment, has been found previously by Bowsher et
al. (2017) in Trifolium fucatum, and Schmid et al. (2013) in Arabidopsis thaliana. This
included genes associated with disease resistance (Bowsher et al., 2017), gene expression
and transcription factors (Schmid et al., 2013). In these earlier studies, core genes
represented multiple functions, the same trend as found in this study. It is thought that
133
these are involved in the recognition of a neighbouring individual regardless of its identity
(Bowsher et al., 2017), something again supported by this study.
In this study, the upregulated core ‘competition genes’ included those involved in
abiotic stress response, indicating that simply categorising genes as involved in plant stress
may be too simplistic, as they are part of a larger signalling pathway which can also be
involved in responses to plant-plant interactions. There was also an unexpected lack of
nutrient deficiency associated genes expressed in the competition treatments. This suggests
that the gene-level response to plant-plant competition is not the same as nutrient
deficiency. Notably the sampling point for this study may have been before nutrient
deficiency responses occurred. At 19 days after planting, there were minimal physical root-
root interactions and peak nitrogen accumulation rate occurred (Schofield et al., 2019;
Chapter 2). Further experiments with sampling throughout the growth period could be used
to characterise dynamics of competition interactions as nutrient deficiency becomes
increasingly apparent.
The plant stress genes identified in this study (Appendix 3, Tables 1A and 2A) have
been associated with both biotic and abiotic stress responses. Stress responses linked to
pathogen defence have been found in Arabidopsis thaliana plants grown in both inter- and
intra- specific competition (Masclaux, Bruessow, Schweizer, Gouhier-Darimont, Keller,
Reymond, et al., 2012; Schmid et al., 2013). Defence responses, in particular increased
jasmonate associated gene expression, have been found to lead to the upregulation of
nutrient deficiency response genes (Schmid et al., 2013). However, this study found a
mixture of up and down regulation of plant stress associated genes. In addition, there were
differing patterns of gene expression in terms of gene identity, and up or down regulation
between the inter- and intra-cultivar competition treatments. The combination of up and
down regulation of a number of genes may mediate the intensity of a plant response to a
neighbouring plant, depending on the identity of a neighbour. The combination of gene
function and level of expression may consequently ‘tailor’ the response to a neighbouring
plant, as discussed below.
The majority of significantly expressed genes were categorised as part of a growth
and development response to competition. Many of these genes have only generalised
identified functions or are involved in a large range of cellular processes (The UniProt
134
Consortium, 2018). Therefore, characterising the growth response in each competition
treatment is difficult. Further studies with more frequent sampling over the growth period
would provide more evidence of a link between the observed gene expression patterns and
growth responses such as biomass and nutrient accumulation.
A number of the identified genes were associated with the control of gene
expression through histone modifications and transcription factors (The UniProt
Consortium, 2018). The expression pattern of these genes mimicked the pattern seen in the
growth and development genes and may therefore be part of the same growth processes.
Changes in the control of gene expression could indicate changes in the physiology and
morphology of Proctor roots in competition (Malamy, 2005).
6.4.3 - Multiple testing and validation
The expression of genes in this study were subtle and did not pass through a multiple
testing correction filter. This suggests that at this stage of growth there are only subtle
changes in gene expression. However, the direction and magnitude of expression in the
microarrays were confirmed in the qRT-PCR validation. This demonstrates that the gene
expression patterns were unlikely to be an artefact of the microarray data analysis. The
magnitude of these gene expression responses to plant-plant competition may increase
over time or with greater environmental stress, allowing genes to pass through the filter.
The inclusion of multiple time points in future studies would allow this hypothesis to be
tested.
6.4.4 - What does this mean in terms of plant-plant competition?
Competition between plants has traditionally been characterised as a scramble for limited
available resources, with plant responses occurring due to resource depletion (Schenk,
2006). At the early stage of plant growth investigated in this study, during the period of
peak nitrogen accumulation and prior to peak biomass accumulation rate and grain
production, there was a lack of genes differentially expressed that were associated with
nutrient stress or foraging. However, there were changes in the expression of genes
135
associated with plant growth and other stress roles. These changes in gene expression
patterns potentially indicate the detection of a neighbouring individual occurred before
nutrients became limiting, suggesting a form of neighbour recognition. Furthermore, fewer
gene expression changes were found in intra-cultivar competition compared to inter-cultivar
competition, indicating that not only the presence but also the identity of a neighbour can
be detected by the plants. Such an effect has previously been found in Trifolium (Bowsher et
al., 2017) in response to a congeneric individual compared to a heterospecific individual.
These studies included competition for light which likely to have led to different gene
expression patterns to those in this chapter, where shading was limited using mesh screens.
If this study was repeated with competition aboveground also allowed, the pattern of
differentially expressed genes would likely be different due to the additional effect of
shading.
Such responses may indicate a form of kin recognition. Kin recognition is the
modification of plant behaviour depending on the identity of a neighbouring plant (Dudley
et al., 2013). Underlying mechanisms include root exudates (Semchenko et al., 2014),
volatile compounds (Delory et al., 2016) or via the soil microbial community (Hortal et al.,
2017a) prior to physical root contact. The unique chemical fingerprint of an individual can
be recognised by a neighbouring plant, which can then respond depending on neighbour
identity (Karban et al., 2013; Depuydt, 2014). The differences in gene expression patterns of
plants in inter- and intra- cultivar competition in this study provide evidence for differing
responses depending on neighbour identity. Differences in gene expression between plants
in isolation and intra-cultivar competition also suggest that the mechanism of recognition of
a closely related individual (self/non-self-recognition) is different to recognition of its own
roots (self-recognition) (Biedrzycki et al., 2010; Depuydt, 2014).
Kin recognition is thought to lead to reduced strength of competition between
closely related individuals (Dudley et al., 2013), although there is no direct evidence for this
in this study. The identity of the genes differentially expressed in intra-cultivar competition
is likely to form part of the response to a closely related neighbouring individual, and gene
identity may be of greater importance than simply the number of differentially expressed
genes. Future research, using more quantitative methods such as RNA sequencing (Pounds,
136
2006) and into the function of genes identified in this study may elucidate the mechanism
behind the observed differences, and confirm the patterns observed here.
6.5 - Conclusions
This study demonstrates plant recognition of the identity of a neighbour at a molecular level
before it is reflected through changes in nitrogen and biomass accumulation dynamics. This
is characterised by a change in expression of genes predominantly associated with growth
and development, plant stress and gene expression control. A core set of genes was
identified associated with both inter- and intra- cultivar competition. The gene expression
patterns in this study indicate differences in responses depending on the identity of a
neighbouring individual. This may be more dependent on the function of the genes than
simply the number of differentially expressed genes, but the power of detection is weak.
These findings suggest differential root growth responses depending on the identity of a
neighbouring plant, providing further evidence for kin recognition in barley. No nutrient
stress associated genes were found to be differentially expressed in this study, but the
differential expression of growth and development genes may occur prior to nutrient stress.
Therefore, it is likely that detection of a neighbouring competitor occurs prior to nutrient
deficiency.
References
Berendse, F. and Möller, F. (2009) Effects of competition on root–shoot allocation in
Plantago lanceolata L.: adaptive plasticity or ontogenetic drift? Plant Ecology, 201(2), 567–
573.
Biedrzycki, M. L., Jilany, T. A., Dudley, S. A. and Bais, H. P. (2010) Root exudates mediate kin
recognition in plants. Communicative & Integrative Biology, 3(1), 28–35.
Bowsher, A. W., Shetty, P., Anacker, B. L., Siefert, A., Strauss, S. Y. and Friesen, M. L. (2017)
Transcriptomic responses to conspecific and congeneric competition in co-occurring
Trifolium. Journal of Ecology, 105(3), 602–615.
137
Caffaro, M. M., Vivanco, J. M., Botto, J. and Rubio, G. (2013) Root architecture of
Arabidopsis is affected by competition with neighbouring plants. Plant Growth Regulation,
70(2), 141–147.
Cahill, J. F. (2003) Lack of relationship between below-ground competition and allocation to
roots in 10 grassland species. Journal of Ecology, 91(4), 532–540.
Delory, B. M., Delaplace, P., Fauconnier, M. L. and du Jardin, P. (2016) Root-emitted volatile
organic compounds: Can they mediate belowground plant-plant interactions? Plant and Soil,
402(1–2), 1–26.
Depuydt, S. (2014) Arguments for and against self and non-self root recognition in plants.
Frontiers in Plant Science, 5, 614.
Does, D. Van der, Leon-Reyes, A., Koornneef, A., Verk, M. C. Van, Rodenburg, N., Pauwels, L.,
Goossens, A., Körbes, A. P., Memelink, J., Ritsema, T., Wees, S. C. M. Van and Pieterse, C. M.
J. (2013) Salicylic Acid Suppresses Jasmonic Acid Signaling Downstream of SCFCOI1-JAZ by
Targeting GCC Promoter Motifs via Transcription Factor ORA59. The Plant Cell, 25(2), 744–
761.
Dudley, S. A., Murphy, G. P. and File, A. L. (2013) Kin recognition and competition in plants.
Functional Ecology, 27(4), 898–906.
Hortal, S., Lozano, Y. M., Bastida, F., Armas, C., Moreno, J. L., Garcia, C. and Pugnaire, F. I.
(2017) Plant-plant competition outcomes are modulated by plant effects on the soil
bacterial community, Scientific Reports, 7(1), 17756.
Jackson, S. A. (2016) Rice: The First Crop Genome. Rice, 9(1), 14.
Kaliyappan, K., Palanisamy, M., Govindarajan, R. and Duraiyan, J. (2012) Microarray and its
applications. Journal of Pharmacy and Bioallied Sciences, 4(6), 310.
Karban, R., Shiojiri, K., Ishizaki, S., Wetzel, W. C. and Evans, R. Y. (2013) Kin recognition
affects plant communication and defence. Proceedings of the Royal Society B: Biological
Sciences, 280(1756), 20123062.
Malamy, J. E. (2005) Intrinsic and environmental response pathways that regulate root
system architecture. Plant, Cell and Environment, 28(1), 67–77.
138
Masclaux, F. G., Bruessow, F., Schweizer, F., Gouhier-Darimont, C., Keller, L., Reymond, P.,
Bowsher, A. W., Shetty, P., Anacker, B. L., Siefert, A., Strauss, S. Y., Friesen, M. L., Schmid, C.,
Bauer, S. and Bartelheimer, M. (2012) Transcriptome analysis of intraspecific competition in
Arabidopsis thaliana reveals organ-specific signatures related to nutrient acquisition and
general stress response pathways. BMC plant biology, 12(1), 227.
Mayer, K. F. X., Waugh, R., Langridge, P., Close, T. J., Wise, R. P., Graner, A., Matsumoto, T.,
Sato, K., Schulman, A., Ariyadasa, R., Schulte, D., Poursarebani, N., Zhou, R., Steuernagel, B.,
Mascher, M., Scholz, U., Shi, B., Madishetty, K., Svensson, J. T., Bhat, P., Moscou, M., Resnik,
J., Muehlbauer, G. J., Hedley, P., Liu, H., Morris, J., Frenkel, Z., Korol, A., Bergès, H., Taudien,
S., Felder, M., Groth, M., Platzer, M., Himmelbach, A., Lonardi, S., Duma, D., Alpert, M.,
Cordero, F., Beccuti, M., Ciardo, G., Ma, Y., Wanamaker, S., Cattonaro, F., Vendramin, V.,
Scalabrin, S., Radovic, S., Wing, R., Morgante, M., Nussbaumer, T., Gundlach, H., Martis, M.,
Poland, J., Pfeifer, M., Moisy, C., Tanskanen, J., Zuccolo, A., Spannagl, M., Russell, J., Druka,
A., Marshall, D., Bayer, M., Swarbreck, D., Sampath, D., Ayling, S., Febrer, M., Caccamo, M.,
Tanaka, T., Wannamaker, S., Schmutzer, T., Brown, J. W. S., Fincher, G. B. and Stein, N.
(2012) A physical, genetic and functional sequence assembly of the barley genome. Nature,
491(7426), 711–716.
Pounds, S. B. (2006) Estimation and control of multiple testing error rates for microarray
studies. Briefings in Bioinformatics, 7(1), 25–36.
Ramakrishna, A. and Ravishankar, G. A. (2011) Influence of abiotic stress signals on
secondary metabolites in plants. Plant Signaling and Behavior, 6(11), 1720–1731.
Schenk, H. J. (2006) Root competition: Beyond resource depletion. Journal of Ecology, 94(4),
725–739.
Schmid, C., Bauer, S., Müller, B. and Bartelheimer, M. (2013) Belowground neighbor
perception in Arabidopsis thaliana studied by transcriptome analysis: roots of Hieracium
pilosella cause biotic stress. Frontiers in Plant Science, 4, 296.
Schofield, E. J., Rowntree, J. K., Paterson, E., Brewer, M. J., Price, E. A. C., Brearley, F. Q. and
Brooker, R. W. (2019) Cultivar differences and impact of plant-plant competition on
temporal patterns of nitrogen and biomass accumulation. Frontiers in Plant Science, 10, 215.
139
Schofield, E. J., Rowntree, J. K., Paterson, E. and Brooker, R. W. (2018) Temporal Dynamism
of Resource Capture: A Missing Factor in Ecology? Trends in Ecology and Evolution, 33(4),
277–286.
Schulte, D., Close, T. J., Graner, A., Langridge, P., Matsumoto, T., Muehlbauer, G., Sato, K.,
Schulman, A. H., Waugh, R., Wise, R. P. and Stein, N. (2009) The International Barley
Sequencing Consortium - At the Threshold of Efficient Access to the Barley Genome. Plant
Physiology, 149, 142–147.
Semchenko, M., Saar, S. and Lepik, A. (2014) Plant root exudates mediate neighbour
recognition and trigger complex behavioural changes. New Phytologist, 204(3), 631–637.
Subrahmaniam, H. J., Libourel, C., Journet, E. P., Morel, J. B., Muños, S., Niebel, A., Raffaele,
S. and Roux, F. (2018) The genetics underlying natural variation of plant–plant interactions,
a beloved but forgotten member of the family of biotic interactions. Plant Journal, 93(4),
747–770.
Suzuki, N., Rivero, R. M., Shulaev, V., Blumwald, E. and Mittler, R. (2014) Abiotic and biotic
stress combinations. New Phytologist, 203(1), 32–43.
Toni, L. S., Garcia, A. M., Jeffrey, D. A., Jiang, X., Stauffer, B. L. and Sucharov, S. D. M. C. C.
(2018) Optimization of phenol-chloroform RNA extraction. MethodsX, 5, 599–608.
Trinder, C., Brooker, R., Davidson, H. and Robinson, D. (2012) Dynamic trajectories of growth
and nitrogen capture by competing plants. New Phytologist, 193(4), 948–958.
UniProt Consortium, T. (2018) UniProt: the universal protein knowledgebase. Nucleic Acids
Research, 46(5), 2699–2699.
Verma, V., Ravindran, P. and Kumar, P. P. (2016) Plant hormone-mediated regulation of
stress responses. BMC Plant Biology, 16(1), 86.
Warzybok, A. and Migocka, M. (2013) Reliable Reference Genes for Normalization of Gene
Expression in Cucumber Grown under Different Nitrogen Nutrition. PLoS ONE, 8(9), e72887.
Zandalinas, S. I., Mittler, R., Balfagón, D., Arbona, V. and Gómez-Cadenas, A. (2018) Plant
adaptations to the combination of drought and high temperatures. Physiologia Plantarum,
162(1), 2–12.
140
Chapter 7
The temporal dynamics of salicylic acid and jasmonic acid production in
response to early stage plant-plant competition
Contents
7.1 – Introduction
7.2 - Materials and methods
7.2.1 - Soil characterisation
7.2.2 - Experimental setup
7.2.3 – Harvesting
7.2.4 - Extraction of jasmonic acid and salicylic acid
7.2.5 - Data quantification and analysis
7.3 - Results
7.3.1 - Salicylic acid
7.3.2 - Jasmonic acid
7.4 – Discussion
7.4.1 - Salicylic acid
7.4.2 - Jasmonic acid
7.4.3 - Potential link with temporal dynamism in nutrient uptake
7.4.4 - Understanding the mechanism of plant-plant competition at a molecular level
7.5 - Conclusions
Abstract
Plant-plant competition, both inter- and intra- specific, has been found to change the
temporal dynamics of resource capture. This may be a missing factor in explaining plant
coexistence in complex plant communities. The mechanisms behind a temporally dynamic
response to a neighbouring plant are unclear but is likely to be mediated via plant growth
141
regulators. To address this, an experiment was conducted to examine how plant growth
regulators, common indicators of plant stress, vary with plant-plant competition over time.
Two target plant stress hormones were selected, salicylic acid and jasmonic acid, which
moderate the response of plants to both biotic and abiotic stress. Barley was chosen as a
model plant and was grown in isolation, and in intra- and inter- cultivar competition. Plants
were harvested at intervals between 15 – 27 days after planting, covering the period up to
and including plant peak nitrogen accumulation rate. Jasmonic and salicylic acid were
extracted from roots and analysed using a High Performance Liquid Chromatography High-
Resolution Quadrupole Time-of-Flight Mass Spectrometer. Whilst jasmonic acid was not
detected in the samples, the concentration of salicylic acid in plants in isolation was higher
than basal levels measured in previous studies, suggesting that all the plants in this study
were under some level of stress. The concentration of salicylic acid varied over time but
there were no statistically significant effects of the treatments. At 21 days after planting,
there was a trend towards a greater concentration of salicylic acid in the competition
treatments and a greater concentration in intra-cultivar competition compared to inter-
cultivar competition. This supports the theory that salicylic acid potentially has a role in the
acclimation of plants to competition stress.
7.1 - Introduction
Plants respond to competition from neighbouring plants in a number of ways including
changes in physiology (Trinder et al., 2013), biochemistry (Laliberté, 2016) and the temporal
dynamics of resource capture (Trinder et al., 2012). The timing and rate of nutrient capture
have been shown to change with intra- (Schofield et al., 2019) and inter- specific plant-plant
competition (Trinder et al., 2012). A change in the temporal dynamics of nutrient uptake is
thought to reduce direct competition and promote coexistence between plants (Schofield et
al., 2018). However, the mechanism that regulates changes in the temporal dynamics of
nutrient capture in response to plant-plant competition is unclear.
As plant roots grow they release a range of compounds including volatile organic
compounds (VOCs) (Ninkovic et al., 2016) and water soluble compounds in root exudates
(Yang et al., 2013). These chemical signatures are often unique at the species and genotype
142
level, allowing inter- and intra- specific recognition of neighbouring individuals (Chaparro et
al., 2012). The presence of a competing individual or root exudates of a competitor have
been found to induce a change in plant root architecture (Caffaro et al., 2013). At a
molecular level, a neighbouring plant can cause upregulation of stress associated plant
growth regulators (PGRs), including salicylic acid (SA) and jasmonic acid (JA) (van Dam and
Bouwmeester, 2016). However, the temporal relationships between SA and JA production
and nutrient capture when plants are in competition have yet to be explored.
The presence of a neighbouring plant belowground is initially detected by receptors
embedded in the root epidermis (Trewavas, 2002). The signal is transduced via the
production of reactive oxygen species (ROS) and calcium ions within cells (Tuteja and
Mahajan, 2011). Under abiotic stress and some cases of biotic stress this has been found to
cause an increase in abscisic acid concentration (Rejeb et al., 2014). This in turn induces the
production of SA and JA (Verma et al., 2016). These PGRs are involved in the mediation of
responses to biotic stress such as pathogen and pest attack (An and Mou, 2011) and abiotic
stresses including drought and salinity (Ahmad et al., 2016; Zhu, 2016). Salicylic acid
production has been found to be associated with a response to drought (Khan et al., 2015)
and biotrophic pests (Glazebrook, 2005), whereas jasmonic acid production has been more
frequently associated with necrotrophic pest response (L. Zhang et al., 2017). The relative
proportion of these two PGRs moderate a specific response to a stressor through crosstalk,
each mediating the expression of the other PGR to produce either an antagonistic or
synergistic response (Does et al., 2013). The balance between JA and SA is specific to each
stressor or combination of stresses being experienced (Zandalinas et al., 2018). This may
include the stress of a neighbouring individual competing for a limited pool of resources, for
example soil nitrogen, a hypothesis which has yet to be tested.
Due to its importance as a crop plant, barley (Hordeum vulgare) has been the focus
of previous research, including characterisation of the timing and rates of nitrogen and
biomass accumulation (Schofield et al., 2019; Chapter 2). Proctor was chosen as the focal
cultivar for this study as in a previous study (Schofield et al., 2019; Chapter 2) it
demonstrated large temporal shifts in nitrogen accumulation in response to a neighbour.
Specifically, it shifted peak nitrogen accumulation 14.5 days later when in intra-cultivar
competition compared to plants in isolation and inter-cultivar competition, from 19.5 to 33
143
days after planting (Schofield et al., 2019; Chapter 2). At a molecular level, plant-plant
competition in Proctor has also been examined at a single time point (Chapter 6) using
microarrays to characterise gene expression in Proctor roots of plants in inter- and intra-
cultivar competition. At 19 days after planting there were more genes differentially
expressed under inter-cultivar competition compared to intra-cultivar competition. The
genes that were up- and down-regulated had a range of roles in defence, growth and
development, and the control of gene expression. These processes are often regulated by
plant hormones and the crosstalk between them (Masclaux, Bruessow, Schweizer, Gouhier-
Darimont, Keller, Reymond, et al., 2012; Verma et al., 2016). Therefore, measuring the
concentration of plant growth regulators could be used to investigate the timing and
magnitude of plant-plant competition at a molecular level.
This study focussed on the period surrounding peak nitrogen accumulation rate,
when competition is expected to be the most intense, and tested how two plant stress
indicators (JA and SA) varied with plant-plant competition treatments and over time in
barley (Hordeum vulgare cv. Proctor) roots. Concentrations of JA and SA were measured in
Proctor roots grown in intra- and inter- cultivar competition compared to plants grown in
isolation. Samples were analysed between 15 to 27 days of growth, which covers the period
surrounding peak nitrogen accumulation rate (19 days) in this cultivar. It is expected that: 1)
there will be higher concentrations of JA and SA in the competition treatments compared to
plants in isolation, indicating that these plants are experiencing elevated levels of stress; 2)
the concentration of SA and JA will be temporally dynamic and will increase over time as
nutrients become depleted, and that the relative concentration of SA compared to JA will
also increase over time as nutrients become depleted, mimicking the pattern of SA and JA
seen in nutrient deficiency stress (Khan et al., 2015); 3) inter-cultivar competition with
Tammi will produce the greatest of the two stress responses (i.e. the highest concentration
of SA and JA) in Proctor plants, as in a previous study (Chapter 2) the individuals of this
cultivar did not alter the temporal dynamics of nitrogen accumulation to potentially reduce
the stress of plant-plant competition (Schofield et al., 2019).
144
7.2 - Materials and methods
7.2.1 - Soil characterisation
Soil was used from an agricultural field that had contained spring barley (Hordeum vulgare)
and had been subjected to standard fertilisation conditions previously (500 kg of 22N-4P-
14K ha-1 yr-1) (Sourced from Balruddery Farm, Invergowrie, Scotland, 56.4837° N, 3.1314°
W). Upon collection, the soil was homogenised and passed through a 6 mm sieve, then
stored at 4°C prior to planting. It had an organic matter content of 6.2 % ± 0.3 % SEM (loss-
on-ignition, n = 4) and a mean pH (in water) of 5.7 ± 0.02 SEM (n = 4).
7.2.2 - Experimental setup
For this study I used the same cultivars of barley (Hordeum vulgare) as were used by
Schofield et al. (2019) (Chapter 2). Proctor plants were grown in isolation (P), intra- (PP) or
inter- cultivar competition with Tammi (TP), with three replicates of the three treatments
for each of the five harvests (45 pots total). Cylindrical 2 litre pots (diameter 152 mm, height
135 mm) were filled with field soil. Seeds of both cultivars were pre-germinated on damp
tissue paper for two days before planting. In pots containing two plants, seeds were planted
approximately 5 cm apart and an aboveground mesh screen placed between the two
individuals (45 x 16 cm, mesh size 0.08 mm (Harrod Horticulture, Lowestoft, UK)) to ensure
competitive interactions only occurred belowground. The presence of a screen was unlikely
to have led to differences in shoot development as the foliage was upright; therefore
screens were only inserted into pots with two plants.
To account for potential positional effects, the pots were randomised and then
grown in a controlled environment room (Conviron, Isleham, UK). The rooms were kept at
15°C constantly with an 8/16 (day/night) hour photoperiod and 65 % relative humidity, to
mimic local spring conditions.
145
7.2.3 - Harvesting
Five harvests were carried out between 15 and 27 days after planting. This covered the
majority of the nitrogen uptake period (17 – 33 days after planting; Schofield et al., 2019).
At each harvest all plants were harvested within 2 hours of each other. The plants were
removed from pots, the roots washed, then shoot and root material separated. The roots
were then flash frozen in liquid nitrogen within 3 minutes of harvest to halt metabolic
activity. Material was stored at -80°C prior to freeze drying, and then stored at room
temperature until extraction of JA and SA.
7.2.4 - Extraction of jasmonic acid and salicylic acid
The extraction and analysis method developed by Forcat et al. (2008) was used in this study.
Sampled root material was ground and extracted using a 10% methanol, 1% acetic acid
(Sigma-Aldrich, Poole, United Kingdom) extraction solution. Internal deuterated standards
of 5000 ng ml-1 salicylic acid-D6 and jasmonic-D5 acid (Sigma-Aldrich, Poole, United
Kingdom) were added to measure percentage recovery during analysis whilst differentiating
from native sources of JA and SA in the samples. The extracts were filtered through a 0.2 µm
filter (Fisher Scientific, Loughborough, United Kingdom) to remove any remaining
particulates. A solvent exchange was then carried out based on initial trial data (not
presented) to improve SA and JA peak shape. The 10 % methanol extraction solution was
replaced with 95 % distilled water 5 % acetonitrile (Sigma-Aldrich, Poole, United Kingdom)
to match the mobile phase of the solvent. The extracts were then stored in 50 µl of this
solvent in glass vials at 4°C prior to analysis.
The analytical instrument in this study differed from that used by Forcat et al. (2008).
An Accucore 3 µm C18 100 mm x 2.0 mm column (Thermo Scientific, Waltham,
Massachusetts, USA) was used at 35°C. Samples (50 µl) were analysed using an Agilent 1260
series Agilent 6540 UHD Accurate-Mass High Performance Liquid Chromatography High-
Resolution Quadrupole Time-of-Flight Mass Spectrometer (HPLC-HRqTOFMS) (Aglient, Santa
Clara, California, USA). The solvent gradient was 5% A (95% H2O: 5% CH3CN: 0.1% CHOOH),
95% B (95% CH3CN: 5% H2O: 0.1% CHOOH) to 95% A, 5% B over 15 min. To avoid
contamination in the instrument, the first 2 min of the run was directed to waste. A needle
146
wash and blank was run after every sample to avoid contamination between samples. The
solvent flow rate was 0.2 ml min-1. The HPLC-HRqTOFMS ion source was Dual Agilent Jet
Stream Electrospray Ionization (AJS ESI) with a negative ion polarity. The method was
optimised to the following conditions: gas temperature 325°C, gas flow 5 l min-1, Gas Sheath
Flow 10 (arbitrary units), fragmentor voltage 80V.
7.2.5 - Data quantification and analysis
Undeuterated standard SA and JA (Sigma-Aldrich, Poole, United Kingdom) were run at
concentrations of 0.05 - 99 pg µl-1 with internal deuterated standard at 50 pg µl-1 to
determine the detection limit of the instrument. This found that the range of 0.2 – 20 pg µl-1
of the undeuterated standard could be reliably quantified by the instrument. The inclusion
of internal deuterated standards at a known concentration allowed the quantification of SA
and JA whilst differentiating from the SA and JA present in the sample. Deuteration, the
addition of deuterium, a heavy form of hydrogen, gave the standards a slightly different
mass compared to the compounds being analysed, allowing them to be differentiated within
the samples. This allowed the areas of the peaks to be compared and the concentration of
the undeuterated SA and JA determined. Standard concentrations of undeuterated and
deuterated SA and JA were run at the start and end of the instrument run and blanks run
between each sample to monitor instrument performance over the course of running the
samples.
The effects of time, treatment and interactions between these two factors were
examined with a Generalised Least Squares model using the nlme package (Pinheiro et al.,
2016) in R (R Core Team, 2015). Repeated measures were accounted for using an
autocorrelation term. This was followed by an ANOVA test for significant differences using
the MASS package (Venables and Ripley, 2002) in R (R Core Team, 2015).
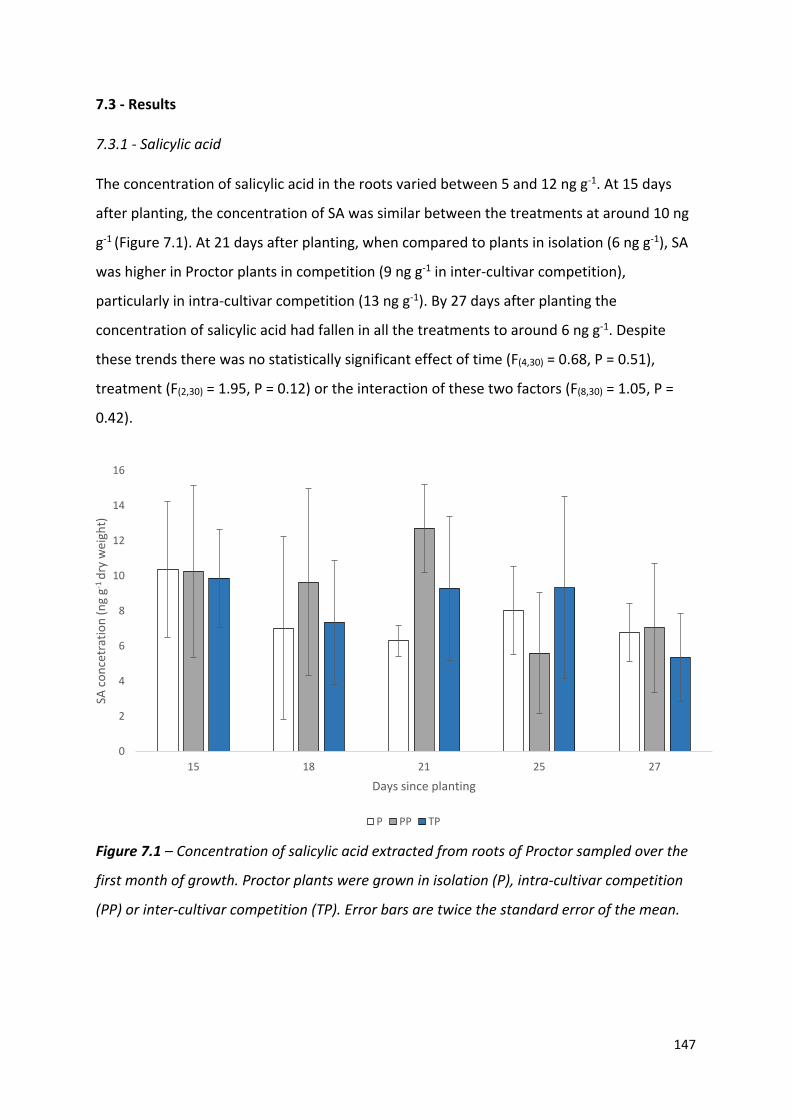
147
7.3 - Results
7.3.1 - Salicylic acid
The concentration of salicylic acid in the roots varied between 5 and 12 ng g-1. At 15 days
after planting, the concentration of SA was similar between the treatments at around 10 ng
g-1 (Figure 7.1). At 21 days after planting, when compared to plants in isolation (6 ng g-1), SA
was higher in Proctor plants in competition (9 ng g-1 in inter-cultivar competition),
particularly in intra-cultivar competition (13 ng g-1). By 27 days after planting the
concentration of salicylic acid had fallen in all the treatments to around 6 ng g-1. Despite
these trends there was no statistically significant effect of time (F(4,30) = 0.68, P = 0.51),
treatment (F(2,30) = 1.95, P = 0.12) or the interaction of these two factors (F(8,30) = 1.05, P =
0.42).
Figure 7.1 – Concentration of salicylic acid extracted from roots of Proctor sampled over the
first month of growth. Proctor plants were grown in isolation (P), intra-cultivar competition
(PP) or inter-cultivar competition (TP). Error bars are twice the standard error of the mean.
0
2
4
6
8
10
12
14
16
15 18 21 25 27
SA c
once
trat
ion
(ng
g-1 d
ry w
eigh
t)
Days since planting
P PP TP
148
7.3.2 - Jasmonic acid
Jasmonic acid was not detected in any sample at a concentration above the instrument
detection limit of 0.2 ng g-1, possibly due to the presence of isobaric compounds, which are
those with a similar mass to JA that may have increased the background signal and obscured
any JA peaks.
7.4 - Discussion
This study aimed to test how plant stress hormone (SA and JA) concentrations varied with
plant-plant competition over time. Jasmonic acid was not detected in root samples but
salicylic acid was detected in all of the samples. Salicylic acid demonstrated some temporally
dynamic trends in concentration, although these trends were non-significant, with increased
concentration at 21 days after planting and then declining, making this a potentially
interesting time point for more detailed future studies.
7.4.1 - Salicylic acid
The concentration of salicylic acid (SA) in this study ranged from 5 to 12 ng g-1. This suggests
that plants in both competition and isolation experienced some level of stress during the
study. However, direct comparisons between plant-plant competition stress and other
forms of stress are limited due to the lack of data on endogenous SA production in barley, in
particular barley roots. The majority of SA studies in the last five years which use barley
have focussed on the exogenous application of SA to improve stress tolerance (Khan et al.,
2015; Mutlu et al., 2016; Kim et al., 2017; Guo et al., 2019), with only a few studies
addressing endogenous SA concentration in response to stress (Chaman et al., 2003; Rivas-
San Vicente and Plasencia, 2011). This is therefore an important area for future work to
determine the role of SA in moderating different forms and intensities of plant stress. This
would allow plant stresses to be better characterised, and the development of plant
breeding and management to limit stress in crops, potentially improving productivity.
149
7.4.2 - Jasmonic acid
The concentration of jasmonic acid was below the detection limit of the instrument in this
study. This may be due to interference from isobaric compounds, which had the same mass
as JA present in the sample. There are thousands of metabolites in a plant at any one time
(Wang et al., 2019), which may have interfered with the detection of JA in barley. Studies of
jasmonic acid should include the development of a clean-up step prior to the solvent
exchange step to remove potential isobaric compounds.
7.4.3 - Potential link with temporal dynamism in nutrient uptake
This study indicated that SA concentration in barley may demonstrate temporally dynamic
trends during the first month of growth. Although the results were not statistically
significant, a trend towards a higher SA concentration in intra-cultivar competition
compared to inter-cultivar competition at 21 days after planting indicates that this may be a
potentially crucial time for spring barley plant-plant interactions. In order to study this
further, more power is required for statistical analysis. Increasing both the sampling
frequency to daily sampling, and the number of replicates sampled around this time point,
would provide greater temporal resolution.
A previous study (Schofield et al., 2019; Chapter 2) found that peak nitrogen
accumulation rate occurred for Proctor plants grown in isolation and inter-cultivar
competition at 19 to 22 days after planting; for plants grown in intra-cultivar competition
this occurred at 33 days. In this study, the higher concentration of SA in the intra-cultivar
competition treatment compared to the other treatments suggests a differential response
to competition mediated at a molecular level.
An observed increase in SA concentration is often considered to be a response to
oxidative stress (Verma et al., 2016). However, SA has been found to have roles in plant
processes beyond plant defence, including germination (Rajjou et al., 2006), response to
cadmium toxicity (Krantev et al., 2008), and photosynthesis regulation (Rivas-San Vicente
and Plasencia, 2011). It has been found to also have a role in plant growth and programmed
cell death (Rivas-San Vicente and Plasencia, 2011), development, and plant-microbe
150
interactions (Herrera Paredes et al., 2016; Chagas et al., 2018). Another potentially
important role of SA is in acclimatisation to stress i.e. improving plant tolerance to stress by
limiting damage. The accumulation of SA has been found to acclimatise plants to drought
through the induction of defensive and antioxidant compound production to limit reactive
oxidative stress damage (Sharma et al., 2017). Salicylic acid also promoted the accumulation
of unsaturated fatty acids and antioxidant production to protect against cold induced
cellular damage (Pál et al., 2013). Salinity stress SA mediated responses include a reduction
in photosynthetic pigments and an accumulation of carotenoids and sucrose to protect
against oxidative stress (Szepesi et al., 2009). There may therefore be a role of SA in
acclimatising plants to the stress of plant-plant competition for nutrients.
7.4.4 - Understanding the mechanism of plant-plant competition at a molecular level
The experimental approach in this study aimed to measure plant hormone concentrations
to understand plant stress responses to plant-plant competition. However, as no clear
patterns were detected, the system may be more complex and changes more subtle than
expected. It may also be the case that signalling compounds other than SA and JA are
involved in responses to plant-plant competition. Salicylic acid interacts with auxin during
vegetative growth, and with JA, abscisic acid, gibberellins and ethylene during growth and
development (Rivas-San Vicente and Plasencia, 2011). Genes that were upregulated at 19
days after planting included those involved in flavonoid production (Chapter 6). Therefore,
flavonoids may be another potential indicator of plant-plant competition. Flavonoids have a
range of roles in plants including root-rhizosphere communication, in particular root
nodulation (Liu and Murray, 2016) as well as defence against pathogens and environmental
stress (Treutter, 2005). The role of flavonoids in plant stress is of particular relevance when
studying plant-plant competition as it likely contains a stress response component.
Measuring the temporal dynamics of multiple PGRs and other metabolites
simultaneously using a metabolic screen may provide a better indication of the type of
response at a molecular level and the downstream consequences that lead to the
temporally dynamic change in nutrient uptake rate. At 21 days after planting, there is an
indication of differences between the treatments, and a metabolomic screen using either
151
mass spectrometry or NMR methods, as detailed by Balmer et al., (2013), would provide a
more comprehensive view of the response to a competitor at a molecular level. The
metabolic profiles of barley under biotic stress, specifically pest and pathogen attack, have
been characterised using HPLC-DAD (high performance liquid chromatography with diode-
array detection) (Balmer et al., 2013) and could be used to draw comparisons between
different forms of plant stress, identifying commonalities and differences.
A series of linked studies would be required to examine the effect of plant-plant
competition on gene expression, secondary metabolite production, and to then link this to
physiological changes. Experimental approaches including studies of gene expression using
microarrays or transcriptome sequencing (Liu et al., 2007) can then be combined with
proteomic and metabolomic studies using mass spectrometry (Griffiths and Wang, 2009).
This would provide an idea of the cascade of processes from detection of a neighbouring
plant to a physiological or growth response. The integration of such datasets would involve
functional analysis and topological network analysis, as well as multivariate and regression
approaches (Bartel et al., 2013; Haider and Pal, 2013; Wang et al., 2016)
There is also a need to test multiple plant tissues to identify tissue specific responses
to plant-plant competition. This study focussed on root tissue as screens in the study
allowed only interactions between roots. However, a systemic response to plant-plant
competition may involve different responses in multiple tissues which vary during growth.
Sampling multiple tissues over time would provide information about spatial and temporal
variation in plant-plant competition responses within individual plants. Such studies could
answer key questions about the role of plant hormones in plant-plant interactions.
7.5 - Conclusions
In this study I found temporally dynamic trends in the concentration of salicylic acid in
response to growth stage, particularly when in intra-specific competition, however these
trends were not statistically significant. At 21 days after planting – when SA concentrations
were higher in intra-cultivar competition compared to inter-cultivar competition – is a
potentially important time point that may be crucial for determining plant-plant
competition in spring barley, warranting future investigation. Jasmonic acid was not
152
detected above the instrument detection limit, potentially due to the presence of isobaric
compounds. This suggests that the extraction method may require a further clean-up step
to improve the detectability of JA. However, to understand the plant stress response to
plant-plant competition, measuring multiple metabolites simultaneously is a logical next
step. This would allow the detection of subtle stress signalling in response to temporally
dynamic plant-plant competition
References
Ahmad, P., Rasool, S., Gul, A., Sheikh, S. A., Akram, N. A., Ashraf, M., Kazi, A. M. and Gucel, S.
(2016) Jasmonates: Multifunctional Roles in Stress Tolerance. Frontiers in Plant Science, 7,
813.
An, C. and Mou, Z. (2011) Salicylic Acid and its Function in Plant Immunity. Journal of
Integrative Plant Biology, 53(6), 412–428.
Balmer, D., Flors, V., Glauser, G. and Mauch-Mani, B. (2013) Metabolomics of cereals under
biotic stress: current knowledge and techniques. Frontiers in Plant Science, 4, 82.
Bartel, J., Krumsiek, J. and Theis, F. J. (2013) Statistical methods for the analysis of high-
throughput metabolomics data. Computational and Structural Biotechnology Journal, 4(5),
e201301009.
Caffaro, M. M., Vivanco, J. M., Botto, J. and Rubio, G. (2013) Root architecture of
Arabidopsis is affected by competition with neighbouring plants. Plant Growth Regulation,
70(2), 141–147.
Chagas, F. O., Pessotti, R. D. C., Caraballo-Rodríguez, A. M. and Pupo, M. T. (2018) Chemical
signalling involved in plant-microbe interactions. Chemical Society Reviews, 47(5), 1652–
1704.
Chaman, M. E., Copaja, S. V and Argandoña, V. H. (2003) Relationships between salicylic acid
content, phenylalanine ammonia-lyase (PAL) activity, and resistance of barley to aphid
infestation. Journal of Agricultural and Food Chemistry, 51(8), 2227–2231.
153
Chaparro, J. M., Sheflin, A. M., Manter, D. K. and Vivanco, J. M. (2012) Manipulating the soil
microbiome to increase soil health and plant fertility. Biology and Fertility of Soils, 48, 489–
499.
van Dam, N. M. and Bouwmeester, H. J. (2016) Metabolomics in the Rhizosphere: Tapping
into Belowground Chemical Communication. Trends in Plant Science, 21(3), 256-265.
Does, D. Van der, Leon-Reyes, A., Koornneef, A., Verk, M. C. Van, Rodenburg, N., Pauwels, L.,
Goossens, A., Körbes, A. P., Memelink, J., Ritsema, T., Wees, S. C. M. Van and Pieterse, C. M.
J. (2013) Salicylic Acid Suppresses Jasmonic Acid Signaling Downstream of SCFCOI1-JAZ by
Targeting GCC Promoter Motifs via Transcription Factor ORA59. The Plant Cell, 25(2), 744–
761.
Forcat, S., Bennett, M. H., Mansfield, J. W. and Grant, M. R. (2008) A rapid and robust
method for simultaneously measuring changes in the phytohormones ABA, JA and SA in
plants following biotic and abiotic stress. Plant Methods, 4(1), 16.
Glazebrook, J. (2005) Contrasting Mechanisms of Defense against Biotrophic and
Necrotrophic Pathogens. Annual Review of Phytopathology, 43(1), 205–227.
Griffiths, W. J. and Wang, Y. (2009) Mass spectrometry: From proteomics to metabolomics
and lipidomics. Chemical Society Reviews, 38(7), 1882–1896.
Guo, B., Liu, C., Liang, Y., Li, N. and Fu, Q. (2019) Salicylic Acid Signals Plant Defence against
Cadmium Toxicity. International Journal of Molecular Sciences, 20(12), 2960.
Haider, S. and Pal, R. (2013) Integrated Analysis of Transcriptomic and Proteomic Data.
Current Genomics, 14(2), 91–110.
Herrera Paredes, S., Lebeis, S. L. and Bailey, J. K. (2016) Giving back to the community:
microbial mechanisms of plant-soil interactions. Functional Ecology, 30(7), 1043–1052.
Khan, M. I. R., Fatma, M., Per, T. S., Anjum, N. A. and Khan, N. A. (2015) Salicylic acid-
induced abiotic stress tolerance and underlying mechanisms in plants. Frontiers in Plant
Science, 6, 462.

154
Kim, Y., Kim, S. and Shim, I. S. (2017) Exogenous salicylic acid alleviates salt-stress damage in
cucumber under moderate nitrogen conditions by controlling endogenous salicylic acid
levels. Horticulture Environment and Biotechnology, 58(3), 247–253.
Krantev, A., Yordanova, R., Janda, T., Szalai, G. and Popova, L. (2008) Treatment with salicylic
acid decreases the effect of cadmium on photosynthesis in maize plants. Journal of Plant
Physiology, 165(9), 920–931.
Laliberté, E. (2016) Below-ground frontiers in trait-based plant ecology. New Phytologist,
213(4), 1597–1603.
Liu, C. W. and Murray, J. D. (2016) The role of flavonoids in nodulation host-range
specificity: An update. Plants, 5(3), 4045–4053.
Liu, F., Jenssen, T. K., Trimarchi, J., Punzo, C., Cepko, C. L., Ohno-Machado, L., Hovig, E. and
Kuo, W. P. (2007) Comparison of hybridization-based and sequencing-based gene
expression technologies on biological replicates. BMC Genomics, 8(1), 153.
Masclaux, F. G., Bruessow, F., Schweizer, F., Gouhier-Darimont, C., Keller, L., Reymond, P.,
Bowsher, A. W., Shetty, P., Anacker, B. L., Siefert, A., Strauss, S. Y., Friesen, M. L., Schmid, C.,
Bauer, S. and Bartelheimer, M. (2012) Transcriptome analysis of intraspecific competition in
Arabidopsis thaliana reveals organ-specific signatures related to nutrient acquisition and
general stress response pathways. BMC plant biology, 12(1), 227.
Mutlu, S., Atıcı, Ö., Nalbantoğlu, B. and Mete, E. (2016) Exogenous salicylic acid alleviates
cold damage by regulating antioxidative system in two barley (Hordeum vulgare L.) cultivars.
Frontiers in Life Science, 9(2), 99–109.
Ninkovic, V., Markovic, D. and Dahlin, I. (2016) Decoding neighbour volatiles in preparation
for future competition and implications for tritrophic interactions. Perspectives in Plant
Ecology, Evolution and Systematics, 23, 11–17.
Pál, M., Gondor, O. and Janda, T. (2013) Role of salicylic acid in acclimation to low
temperature. Acta Agronomica Hungarica, 61(2), 161–172.
155
Pinheiro, J., Bates, D., DebRoy, S., Sarkar, D. and Team, R. C. (2016) _nlme: Linear and
Nonlinear Mixed Effects Models_., R package version 3.1-128, [http://CRAN.R-pro.],
(Accessed 23/01/2020).
R Core Team (2015) R: A Language and Environment for Statistical Computing, R Foundation
for Statistical Computing. doi:10.1007/978-3-540-74686-7
Rajjou, L., Belghazi, M., Huguet, R., Robin, C., Moreau, A., Job, C. and Job, D. (2006)
Proteomic Investigation of the Effect of Salicylic Acid on Arabidopsis Seed Germination and
Establishment of Early Defense Mechanisms. Plant Physiology, 141(3), 910–923.
Rejeb, I., Pastor, V. and Mauch-Mani, B. (2014) Plant Responses to Simultaneous Biotic and
Abiotic Stress: Molecular Mechanisms. Plants, 3(4), 458–475.
Rivas-San Vicente, M. and Plasencia, J. (2011) Salicylic acid beyond defence: Its role in plant
growth and development. Journal of Experimental Botany, 62(10), 3321–3338.
Schofield, E. J., Rowntree, J. K., Paterson, E., Brewer, M. J., Price, E. A. C., Brearley, F. Q. and
Brooker, R. W. (2019) Cultivar differences and impact of plant-plant competition on
temporal patterns of nitrogen and biomass accumulation. Frontiers in Plant Science, 10, 215.
Schofield, E. J., Rowntree, J. K., Paterson, E. and Brooker, R. W. (2018) Temporal Dynamism
of Resource Capture: A Missing Factor in Ecology? Trends in Ecology and Evolution, 34(4),
277–286.
Sharma, M., Gupta, S. K., Majumder, B., Maurya, V. K., Deeba, F., Alam, A. and Pandey, V.
(2017) Salicylic acid mediated growth, physiological and proteomic responses in two wheat
varieties under drought stress. Journal of Proteomics, 163, 28–51.
Szepesi, Á., Csiszár, J., Gémes, K., Horváth, E., Horváth, F., Simon, M. L. and Tari, I. (2009)
Salicylic acid improves acclimation to salt stress by stimulating abscisic aldehyde oxidase
activity and abscisic acid accumulation, and increases Na+ content in leaves without toxicity
symptoms in Solanum lycopersicum L. Journal of Plant Physiology, 166(9), 914–925.
Treutter, D. (2005) Significance of flavonoids in plant resistance and enhancement of their
biosynthesis. Plant Biology, 7(6), 581–591.
156
Trewavas, A. (2002) Plant cell signal transduction: The emerging phenotype. Plant Cell, 14,
(suppl 1), S3-S4.
Trinder, C., Brooker, R., Davidson, H. and Robinson, D. (2012) Dynamic trajectories of growth
and nitrogen capture by competing plants. New Phytologist, 193(4), 948–958.
Trinder, C. J., Brooker, R. W. and Robinson, D. (2013) Plant ecology’s guilty little secret:
Understanding the dynamics of plant competition. Functional Ecology, 27(4), 918–929.
Tuteja, N. and Mahajan, S. (2011) Calcium Signaling Network in Plants. Plant Signaling &
Behavior, 2(2), 79–85.
Venables, W. N. and Ripley, B. D. I. (2002) Modern Applied Statistics with S. Fourth Edition,
Springer, New York.
Verma, V., Ravindran, P. and Kumar, P. P. (2016) Plant hormone-mediated regulation of
stress responses. BMC Plant Biology, 16(1), 86.
Wang, J., Wu, G., Chen, L. and Zhang, W. (2016) Integrated analysis of transcriptomic and
proteomic datasets reveals information on protein expressivity and factors affecting
translational efficiency. Methods in Molecular Biology, 1375, 123–136.
Wang, S., Alseekh, S., Fernie, A. R. and Luo, J. (2019) The Structure and Function of Major
Plant Metabolite Modifications. Molecular Plant, 12(7), 899–919.
Yang, H., Yu, Z., Zhang, Q., Tang, J. and Chen, X. (2013) Plant neighbor effects mediated by
rhizosphere factors along a simulated aridity gradient. Plant and Soil, 369(1–2), 165–176.
Zandalinas, S. I., Mittler, R., Balfagón, D., Arbona, V. and Gómez-Cadenas, A. (2018) Plant
adaptations to the combination of drought and high temperatures. Physiologia Plantarum,
162(1), 2–12.
Zhang, L., Zhang, F., Melotto, M., Yao, J. and He, S. Y. (2017) Jasmonate signaling and
manipulation by pathogens and insects. Journal of Experimental Botany, 68(6), 1371–1385.
Zhu, J. K. (2016) Abiotic Stress Signaling and Responses in Plants. Cell, 167(2), 313–324.
157
Chapter 8
Has temporal dynamism in resource capture been lost in modern barley
cultivars?
Contents
8.1 – Introduction
8.2 - Materials and Methods
8.2.1 - Soil characterisation
8.2.2 - Experimental setup
8.2.3 - Harvesting and sample processing
8.2.4 - Statistical analysis
8.2.4.1 - Carbon and nitrogen temporal dynamics
8.2.4.2 - Carbon to nitrogen ratio
8.3 - Results
8.3.1 -Temporal dynamics of biomass accumulation
8.3.2 - Temporal dynamics of nitrogen accumulation
8.3.3 - C:N ratio
8.4 – Discussion
8.4.1 - General patterns of temporal dynamics of nitrogen and biomass accumulation
8.4.2 - Biomass temporal dynamism cultivar differences
8.4.3 - Nitrogen temporal dynamism cultivar differences
8.4.4 - Why might this study differ from the previous study?
8.4.5 - Have shifts in temporal dynamism of nitrogen accumulation been lost in modern cultivars?
8.4.6 - Does this have consequences for future breeding and crop mixtures?
8.5 - Conclusions
158
Abstract
The timing and rate of resource capture is a potentially important factor in coexistence
within plant communities and may therefore also be an important factor in the design of
crop mixtures. The temporal dynamism of nitrogen accumulation has been found to be
affected by plant-plant competition in the Proctor cultivar of barley (Hordeum vulgare cv.
Proctor), with a delay of 14.5 days in peak nitrogen accumulation rate when in intra-cultivar
competition. There is potential to use this ability to shift the timing of peak nitrogen
accumulation in crop mixtures to improve complementarity and resource use efficiency.
However, it is not known if temporal dynamism in nitrogen and biomass accumulation have
been conserved in the modern cultivar descendants of Proctor. Three cultivars that are
descendants with increasing genetic distance from Proctor - Krona, Annabell and Chanson -
were selected and grown in isolation, inter- and intra- cultivar competition. Sampling
occurred every five days between 20 and 55 days after planting, and plant shoot biomass,
nitrogen concentration and C:N were measured at each time point. The detected temporally
dynamic trends in nitrogen accumulation of Proctor differed from the trends in a previous
study by up to 16.5 days. Proctor, Krona, Annabell and Chanson all demonstrated a 2 – 3 day
earlier peak in nitrogen accumulation rate timing when in competition compared to
isolation. All cultivars apart from Annabell also had lower total accumulated nitrogen when
in competition compared to isolation. These results demonstrate that temporal dynamism is
conserved in modern cultivars of barley, and indicates the potential to utilise the temporal
dynamics of resource capture in the development of temporally complementary crop
mixtures.
8.1 - Introduction
Intercropping and crop mixtures have been used for millennia to improve crop yield stability
and reduce inputs of fertiliser, herbicide and pesticides (Brooker et al., 2015).
Complementarity between intercrops is often based on root and shoot architecture (Postma
and Lynch, 2012; Zhu et al., 2016) and the ability of one crop to fix nitrogen (Bedoussac et
al., 2015). However, the temporal dynamics of resource capture are likely to be another
factor in intercrop complementarity. By occupying different temporal niches, plants can
159
reduce direct competition for resources whilst occupying the same spatial niche, promoting
coexistence between individuals (Schofield et al., 2018). In an agricultural system,
complementarity in the temporal dynamics of resource capture is likely to lead to increased
resource use efficiency, potentially increasing yield whilst reducing input of fertilisers
(Ghaley et al., 2005). The temporal dynamics of resource capture have been explored in
intercrops, including complementary canopy growth in relay intercropping of wheat
(Triticum aestivum) and cotton (Gossypium hirsutum L) (Zhang et al., 2008), as well as
complementary temporal dynamics of nutrient uptake in wheat (Triticum aestivum L.) and
faba bean (Vicia faba L.) (Li et al., 2014).
Complementarity has also been explored to some extent at an intra-specific level. A
recent meta-analysis found that intraspecific crop mixtures on average increase crop yield
amount and stability, whilst reducing the negative impact of pests and diseases (Reiss and
Drinkwater, 2018). However, plasticity in temporal dynamics of resource capture in
response to plant-plant competition of spring barley mixtures has yet to be explored.
Plasticity in the temporal dynamics of resource capture rate has not been actively
selected for during breeding of spring malting barley in the last 100 years, where the focus
has been on maximising yield, pest and disease resistance and malting quality (Friedt et al.,
2011). However, crop domestication has been found to increase the competitiveness of
individuals and reduce complementarity in mixtures (Milla et al., 2017). This is due to mostly
inadvertent (apart from selection for weed suppression, e.g. Benaragama et al., (2014))
selection for competitive traits in crops and against complementary behaviour (Milla et al.,
2014). The ability to shift the temporal dynamics of resource capture might therefore have
been lost as part of this selection process. This may have occurred through the
accumulation of random mutations in the protein coding regions of these genes, which were
not under selection pressure to be functionally maintained in the genome (Lahti et al.,
2009).
The temporal dynamics of nitrogen and biomass accumulation have previously been
studied in barley (Hordeum vulgare). Schofield et al. (2019) (Chapter 2) used the Tammi and
Proctor cultivars to investigate temporal dynamism of nitrogen and biomass accumulation
rate with plant-plant competition. A shift in peak nitrogen accumulation rate timing was
found in both cultivars: when in intra-cultivar competition, but not in inter-cultivar
160
competition, Tammi advanced peak nitrogen accumulation rate by 0.5 days and Proctor
delayed it by 14.5 days. As Proctor showed the greatest shift in peak nitrogen accumulation
rate timing with intra-cultivar competition, it was chosen to further investigate the potential
heredity of resource capture temporal dynamics.
Proctor is a spring malting barley cultivar developed in the 1940s and first introduced
commercially in the UK in 1955 (Hayward, 1958). This was prior to the widespread use of
recurrent selection, introduced to increase the speed of new cultivar production in barley by
using a small genetic base (McProud, 1979). Proctor was favoured due to its high yield and
malt quality (Gothard et al., 1978) and is the ancestor of many spring malting barley
cultivars (Friedt et al., 2011). This raises the question of whether the observed change in
temporal dynamics of peak nitrogen accumulation rate of Proctor in intra-cultivar
competition has been maintained in its descendants, including modern barley cultivars.
The three spring barley cultivars selected have increasing genetic distance from
Proctor as detailed in Figure 8.1. Krona is the result of a complex cross including Proctor and
at least four other cultivars (Hatz et al., 2002; von Bongsong, 2014). It is a malting cultivar
first introduced in 1989 and was popular in Germany for brewing for the period of roughly
twenty years from its introduction (Oliver, 2014). Annabell is a cross of Krona and another
cultivar, ST 900 14DH (Vratislav Psota et al., 2009), and therefore a second generation
descendent of Proctor. It was first introduced in 1999 (Xu et al., 2018), and was popular due
to the high quantity of malt produced (Friedt et al., 2011). Chanson is a seventh generation
descendent of Proctor and is also the result of a complex cross. It is a modern malting
cultivar that has been on the AHDB Recommended list since 2017 (Stein and Muehlbauer,
2018).
This study investigated if shifts in the temporal dynamics of nitrogen and biomass
accumulation rate in response to plant-plant competition have been maintained or lost in
Krona, Annabell and Chanson, three spring barley descendants of Proctor. It is expected that
as this trait has not been actively selected for, temporal shifts will be less apparent in Krona,
Annabell and Chanson compared to Proctor. Barley breeding for monocultures may have
selected against collaborative behaviours (Milla et al., 2014) such as temporally dynamic
shifts in nutrient uptake rate to promote plant community coexistence. Therefore, the
genes that control temporally dynamic shifts might have been lost during the breeding of
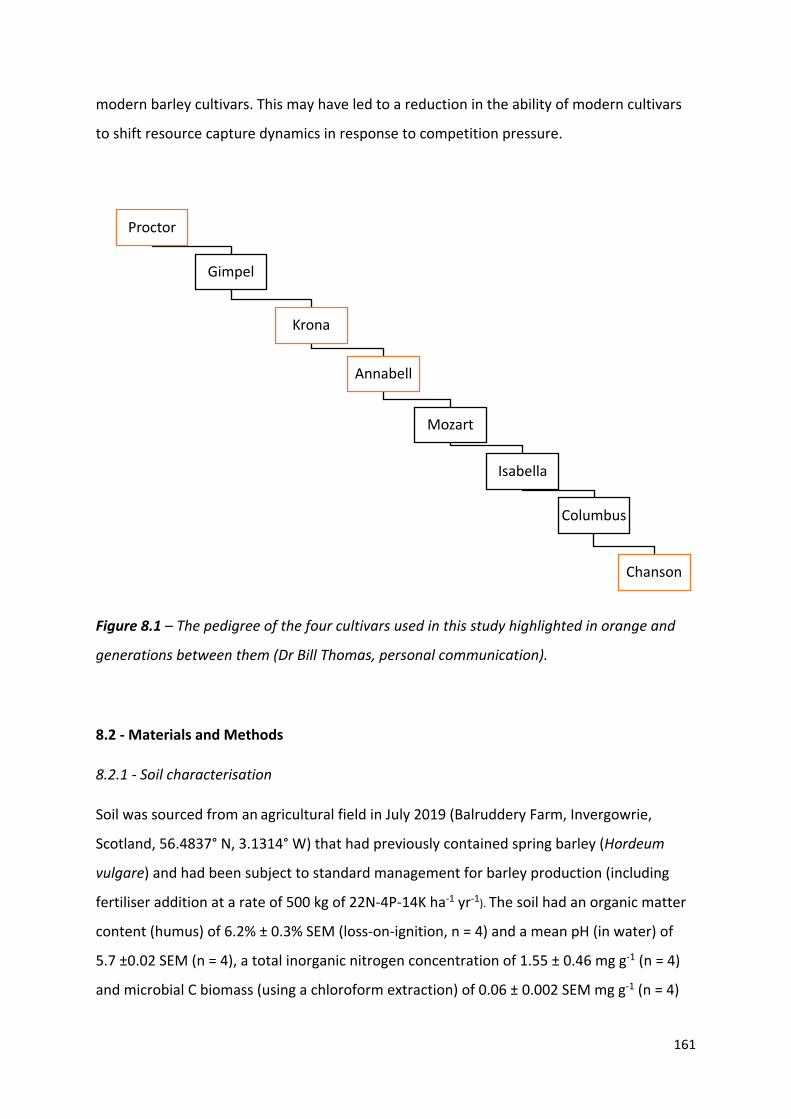
161
modern barley cultivars. This may have led to a reduction in the ability of modern cultivars
to shift resource capture dynamics in response to competition pressure.
Figure 8.1 – The pedigree of the four cultivars used in this study highlighted in orange and
generations between them (Dr Bill Thomas, personal communication).
8.2 - Materials and Methods
8.2.1 - Soil characterisation
Soil was sourced from an agricultural field in July 2019 (Balruddery Farm, Invergowrie,
Scotland, 56.4837° N, 3.1314° W) that had previously contained spring barley (Hordeum
vulgare) and had been subject to standard management for barley production (including
fertiliser addition at a rate of 500 kg of 22N-4P-14K ha-1 yr-1). The soil had an organic matter
content (humus) of 6.2% ± 0.3% SEM (loss-on-ignition, n = 4) and a mean pH (in water) of
5.7 ±0.02 SEM (n = 4), a total inorganic nitrogen concentration of 1.55 ± 0.46 mg g-1 (n = 4)
and microbial C biomass (using a chloroform extraction) of 0.06 ± 0.002 SEM mg g-1 (n = 4)
Proctor
Gimpel
Krona
Annabell
Mozart
Isabella
Columbus
Chanson
162
(analysed by Konelab Aqua 20 Discrete Analyser (Thermo Scientific, Waltham, MA USA)).
Before use, the soil was passed through a 6 mm sieve, then stored at 4°C until planting
occurred. No fertilization of the soil occurred during the experiment.
8.2.2 - Experimental setup
Pots (diameter 152 mm, height 135 mm) were planted with one of the four focal cultivars
(Proctor (P), Krona (K), Annabell (A) or Chanson (C)) in one of three treatments: isolation,
inter-cultivar competition or intra-cultivar competition. Inter-cultivar treatments were
grown in competition with Tammi (T), an early spring barley cultivar with no known shared
heritage with any of the focal cultivars, to provide a baseline competitive response to a
neighbouring plant that was not a descendent of Proctor (P, PP, TP, K, KK, TK, A, AA, TA, C,
CC, TC). Three replicates for each treatment for each of the eight planned harvests were
planted, giving a total of 288 pots. This experimental design was influenced by the statistical
analysis in Chapter 3 whilst accounting for practical constraints of space and cost. Barley
seeds were germinated in the dark on damp paper at room temperature for three days prior
to planting. Germinated seeds were planted at a depth of 2 cm and those in the competition
treatments were planted 6 cm apart. Pots were arranged randomly to avoid potential
positional effects. Mesh screens (45 x 16 cm, mesh size 0.08 mm (Harrod Horticulture,
Lowestoft, UK) were inserted between competing plants, to ensure competition only
occurred belowground. The foliage was relatively upright and would have been unlikely to
be affected by a screen, therefore screens were only inserted in competition treatments.
8.2.3 - Harvesting and sample processing
Three pots of each treatment were selected randomly at each successive harvest, every 5
days from 20 to 55 days after planting. Shoot material was cut at soil level and dried at
100°C to a constant mass. Shoots of the focal cultivars were milled and analysed for carbon
and nitrogen concentration (Flash EA 1112 Series, Thermo Scientific, Bremen, Germany).
163
8.2.4 - Statistical analysis
8.2.4.1 - Carbon and nitrogen temporal dynamics
The non-linear least squares with bootstrapping approach developed in Chapter 2 was used
to analyse the data (Schofield et al., 2019; Chapter 2). Logistic growth curves were modelled
using non-linear least squares (nls) models (R Core Team, 2015). This allowed the estimation
of peak accumulation rate timing and absolute maximum accumulated biomass and
nitrogen. Significant differences in peak rate timing and maximum accumulation were
determined from the difference in bootstrapped 95 % confidence intervals of the model
outputs.
8.2.4.2 - Carbon to nitrogen ratio
At the final harvest (55 days after planting) differences between the four cultivars and
between the competition treatments were analysed using an ANOVA test from the MASS
package (Venables and Ripley, 2002) in R (R Statistical Software, R Core Team, 2015). The
fixed factor in this analysis was treatment or cultivar, with C:N as the response variable. A
Tukey post-hoc test was carried out to compare the treatment groups.
8.3 - Results
8.3.1 -Temporal dynamics of biomass accumulation
Biomass accumulated steadily over the growing period in all the cultivars in this study
(Figure 8.2). There was a lag period until 35 days after planting, then biomass accumulation
rate increased rapidly until the end of the experiment. The biomass accumulation rate
derived from the non-linear least squares model peaked at between 50 – 65 days after
planting for all the cultivars grown in isolation. Details of the confidence interval differences
between the treatments and cultivars are detailed in Tables A1 and A2 of Appendix 4. Plant-
plant competition led to a significant shift in the timing of peak biomass accumulation rate
in Proctor. Proctor also demonstrated a significant decrease in absolute maximum biomass
accumulation in both inter- and intra- cultivar competition compared to isolation,
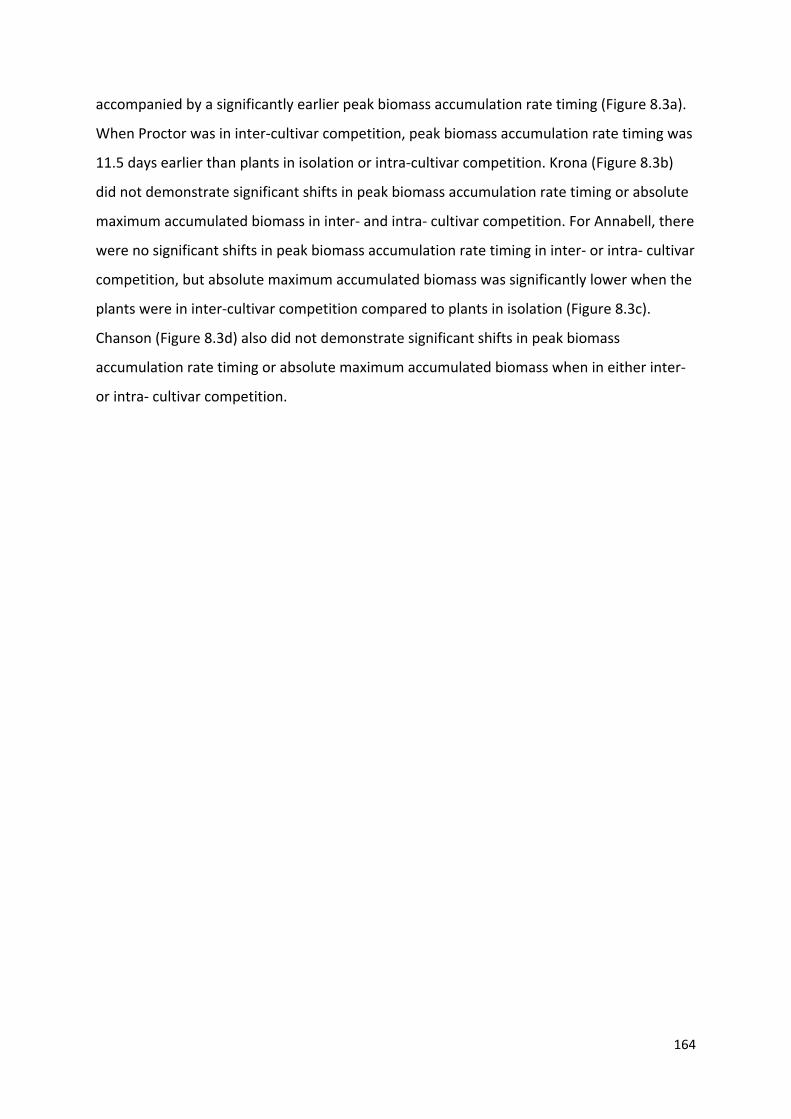
164
accompanied by a significantly earlier peak biomass accumulation rate timing (Figure 8.3a).
When Proctor was in inter-cultivar competition, peak biomass accumulation rate timing was
11.5 days earlier than plants in isolation or intra-cultivar competition. Krona (Figure 8.3b)
did not demonstrate significant shifts in peak biomass accumulation rate timing or absolute
maximum accumulated biomass in inter- and intra- cultivar competition. For Annabell, there
were no significant shifts in peak biomass accumulation rate timing in inter- or intra- cultivar
competition, but absolute maximum accumulated biomass was significantly lower when the
plants were in inter-cultivar competition compared to plants in isolation (Figure 8.3c).
Chanson (Figure 8.3d) also did not demonstrate significant shifts in peak biomass
accumulation rate timing or absolute maximum accumulated biomass when in either inter-
or intra- cultivar competition.
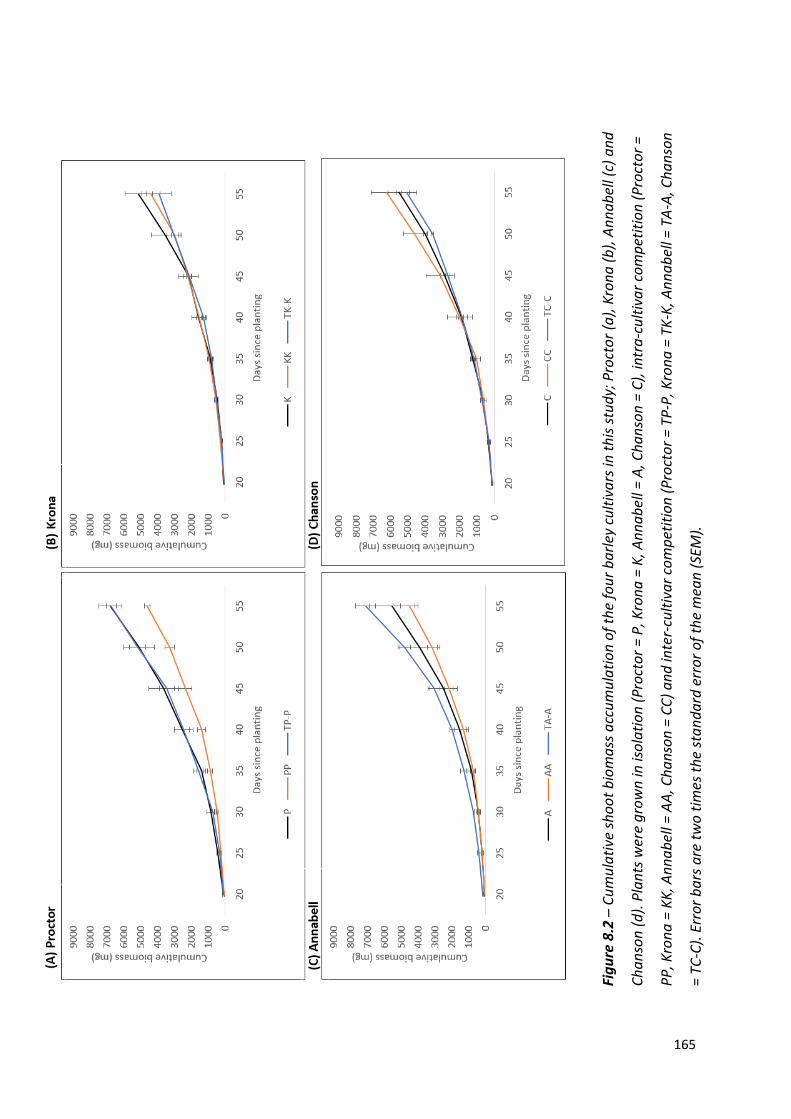
165
Figu
re 8
.2 –
Cum
ulat
ive
shoo
t bio
mas
s acc
umul
atio
n of
the
four
bar
ley
culti
vars
in th
is st
udy;
Pro
ctor
(a),
Kron
a (b
), An
nabe
ll (c
) and
Chan
son
(d).
Plan
ts w
ere
grow
n in
isol
atio
n (P
roct
or =
P, K
rona
= K
, Ann
abel
l = A
, Cha
nson
= C
), in
tra-
culti
var c
ompe
titio
n (P
roct
or =
PP, K
rona
= K
K, A
nnab
ell =
AA,
Cha
nson
= C
C) a
nd in
ter-
culti
var c
ompe
titio
n (P
roct
or =
TP-
P, K
rona
= T
K-K,
Ann
abel
l = T
A-A,
Cha
nson
= TC
-C).
Erro
r bar
s are
two
times
the
stan
dard
err
or o
f the
mea
n (S
EM).
166
Figu
re 8
.3 –
The
abs
olut
e m
axim
um b
iom
ass a
ccum
ulat
ion
and
timin
g of
pea
k bi
omas
s acc
umul
atio
n ra
te o
f Pro
ctor
(a),
Kron
a (b
),
Anna
bell
(c) a
nd C
hans
on (d
). Pl
ants
wer
e gr
own
in is
olat
ion
(Pro
ctor
= P
, Kro
na =
K, A
nnab
ell =
A a
nd C
hans
on =
C),
inte
r-cu
ltiva
r
com
petit
ion
(Pro
ctor
= P
P, K
rona
= K
K, A
nnab
ell =
AA
and
Chan
son
= CC
) and
intr
a-cu
ltiva
r com
petit
ion
(Pro
ctor
= T
P_P,
Kro
na =
TK_
K,
Anna
bell
= TA
_A a
nd C
hans
on =
TC_
C). E
rror
bar
s rep
rese
nt th
e 95
% c
onfid
ence
inte
rval
s der
ived
from
the
non-
linea
r lea
st sq
uare
s
mod
el.
(a) P
roct
or
(b) K
rona
(c) A
nnab
ell
(d) C
hans
on
167
8.3.2 - Temporal dynamics of nitrogen accumulation
Nitrogen accumulation increased rapidly until 35 days when it then began to plateau, which
then continued for the remainder of the experiment (Figure 8.4). Details of the confidence
interval differences between the treatments and cultivars can be found in Tables A1 and A2
of Appendix 4. Nitrogen accumulation rate peaked at 24.5 - 28 days after planting for all
cultivars and treatments. The absolute maximum accumulated nitrogen and the timing of
peak accumulation rate were both shifted by plant-plant competition, with differences
among the cultivars. The timing of peak nitrogen accumulation rate in Proctor was
significantly earlier in both inter- and intra- cultivar competition compared to Proctor in
isolation. When in intra-cultivar competition the timing of peak accumulation rate was
earlier by 2.5 days and 3.5 days earlier in inter-cultivar competition. There was also a
significantly lower absolute maximum accumulated nitrogen concentration in both
competition treatments compared to plants in isolation (Figure 8.5a). This trend was very
similar to Krona, which significantly shifted peak nitrogen accumulation rate timing earlier
by 2 days in response to both inter- and intra-cultivar competition. There was also a
significantly lower level of absolute maximum accumulated nitrogen when the plants were
in competition compared to isolation (Figure 8.5b).
Annabell demonstrated similar changes in nitrogen temporal dynamics compared to
the other cultivars when in competition. When in inter-cultivar competition, peak nitrogen
accumulation rate timing shifted, with a significant advancement of 3 days compared to
plants in isolation and a significantly lower absolute maximum accumulated nitrogen.
However, when in intra-cultivar competition maximum nitrogen accumulation was
significantly higher than Annabell in isolation and peak nitrogen accumulation rate timing
was 2 days earlier than plants in isolation (Figure 8.5c).
The temporal dynamics of nitrogen accumulation in Chanson, the most modern of
the cultivars, were similar to the other cultivars. When in intra-cultivar competition peak
nitrogen accumulation rate timing was significantly earlier by 2.5 days than Chanson in
isolation and 3 days earlier when in inter-cultivar competition (Figure 8.5d). The biomass
and nitrogen responses to intra- and inter- cultivar competition for each cultivar are
detailed in Table 8.1.
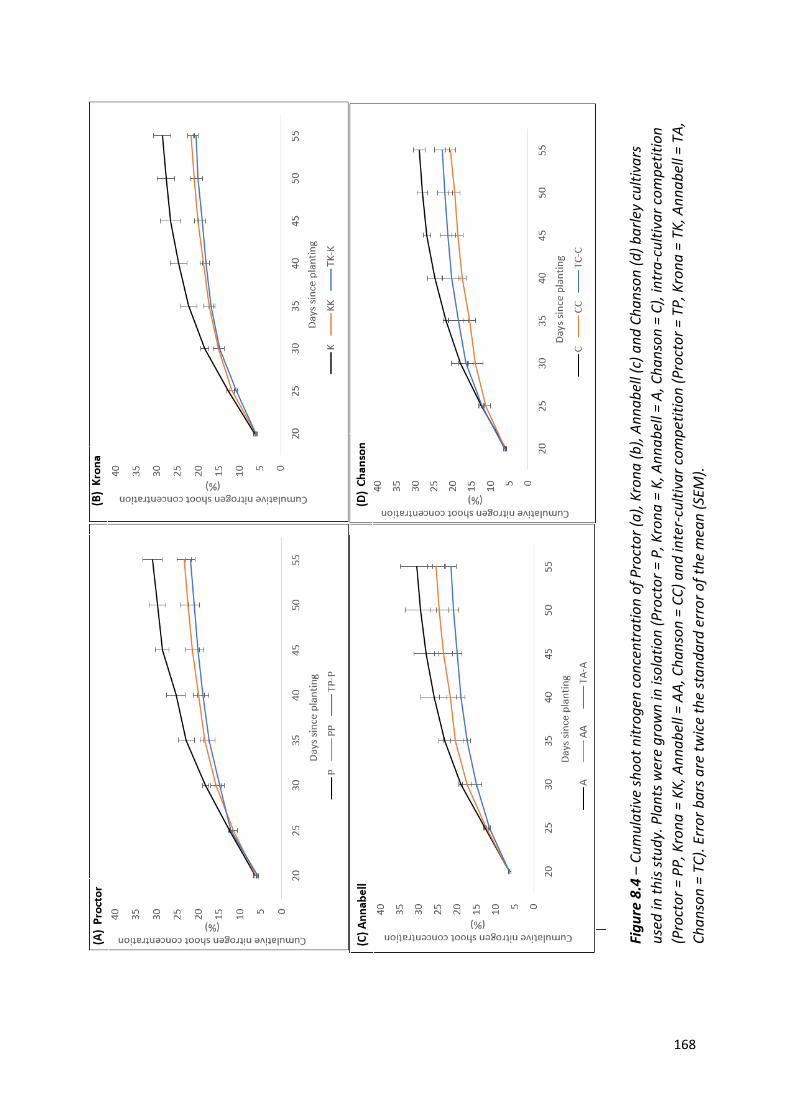
168
Figu
re 8
.4 –
Cum
ulat
ive
shoo
t nitr
ogen
con
cent
ratio
n of
Pro
ctor
(a),
Kron
a (b
), An
nabe
ll (c
) and
Cha
nson
(d) b
arle
y cu
ltiva
rs
used
in th
is st
udy.
Pla
nts w
ere
grow
n in
isol
atio
n (P
roct
or =
P, K
rona
= K
, Ann
abel
l = A
, Cha
nson
= C
), in
tra-
culti
var c
ompe
titio
n (P
roct
or =
PP,
Kro
na =
KK,
Ann
abel
l = A
A, C
hans
on =
CC)
and
inte
r-cu
ltiva
r com
petit
ion
(Pro
ctor
= T
P, K
rona
= T
K, A
nnab
ell =
TA,
Ch
anso
n =
TC).
Erro
r bar
s are
twic
e th
e st
anda
rd e
rror
of t
he m
ean
(SEM
).
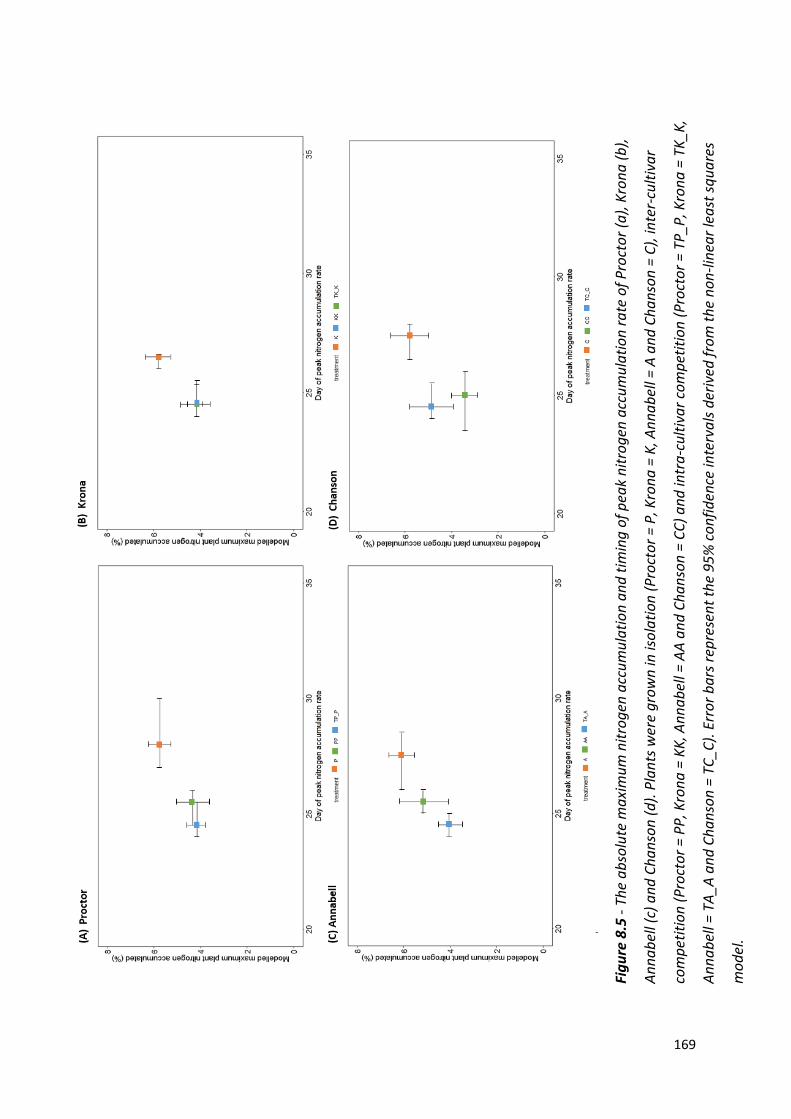
169
Figu
re 8
.5 -
The
abso
lute
max
imum
nitr
ogen
acc
umul
atio
n an
d tim
ing
of p
eak
nitr
ogen
acc
umul
atio
n ra
te o
f Pro
ctor
(a),
Kron
a (b
),
Anna
bell
(c) a
nd C
hans
on (d
). Pl
ants
wer
e gr
own
in is
olat
ion
(Pro
ctor
= P
, Kro
na =
K, A
nnab
ell =
A a
nd C
hans
on =
C),
inte
r-cu
ltiva
r
com
petit
ion
(Pro
ctor
= P
P, K
rona
= K
K, A
nnab
ell =
AA
and
Chan
son
= CC
) and
intr
a-cu
ltiva
r com
petit
ion
(Pro
ctor
= T
P_P,
Kro
na =
TK_
K,
Anna
bell
= TA
_A a
nd C
hans
on =
TC_
C). E
rror
bar
s rep
rese
nt th
e 95
% c
onfid
ence
inte
rval
s der
ived
from
the
non-
linea
r lea
st sq
uare
s
mod
el.
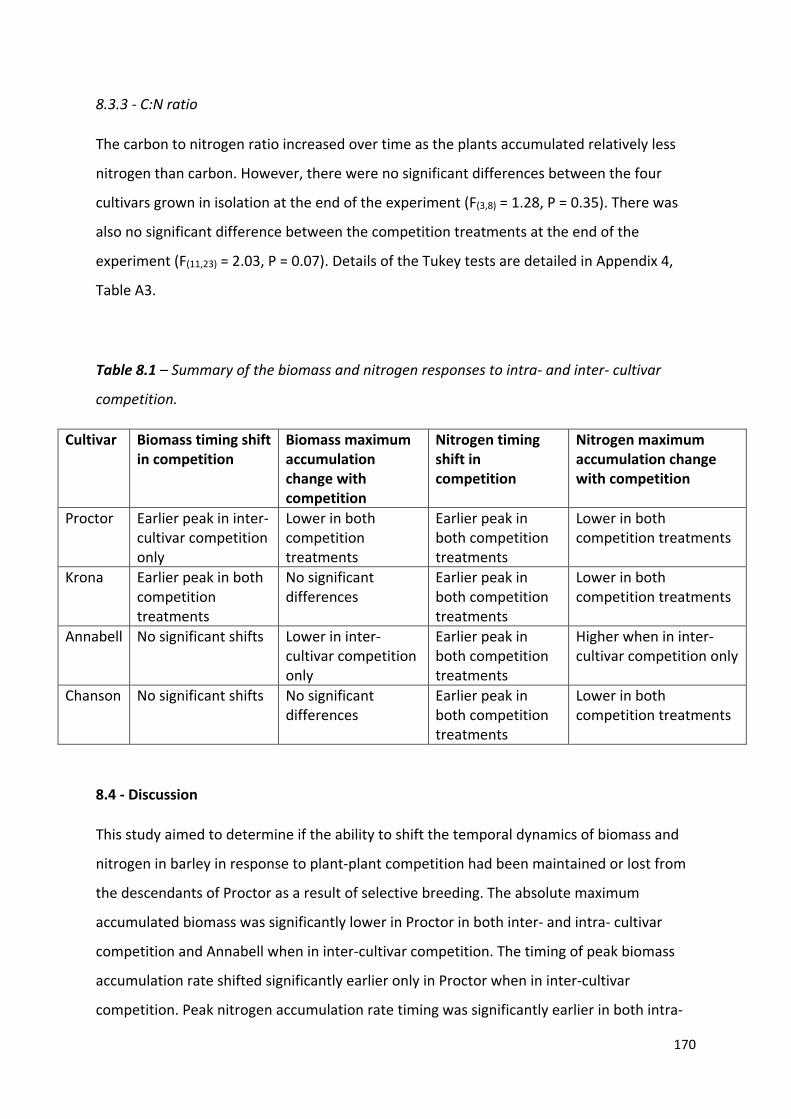
170
8.3.3 - C:N ratio
The carbon to nitrogen ratio increased over time as the plants accumulated relatively less
nitrogen than carbon. However, there were no significant differences between the four
cultivars grown in isolation at the end of the experiment (F(3,8) = 1.28, P = 0.35). There was
also no significant difference between the competition treatments at the end of the
experiment (F(11,23) = 2.03, P = 0.07). Details of the Tukey tests are detailed in Appendix 4,
Table A3.
Table 8.1 – Summary of the biomass and nitrogen responses to intra- and inter- cultivar
competition.
Cultivar Biomass timing shift in competition
Biomass maximum accumulation change with competition
Nitrogen timing shift in competition
Nitrogen maximum accumulation change with competition
Proctor Earlier peak in inter-cultivar competition only
Lower in both competition treatments
Earlier peak in both competition treatments
Lower in both competition treatments
Krona Earlier peak in both competition treatments
No significant differences
Earlier peak in both competition treatments
Lower in both competition treatments
Annabell No significant shifts Lower in inter-cultivar competition only
Earlier peak in both competition treatments
Higher when in inter-cultivar competition only
Chanson No significant shifts No significant differences
Earlier peak in both competition treatments
Lower in both competition treatments
8.4 - Discussion
This study aimed to determine if the ability to shift the temporal dynamics of biomass and
nitrogen in barley in response to plant-plant competition had been maintained or lost from
the descendants of Proctor as a result of selective breeding. The absolute maximum
accumulated biomass was significantly lower in Proctor in both inter- and intra- cultivar
competition and Annabell when in inter-cultivar competition. The timing of peak biomass
accumulation rate shifted significantly earlier only in Proctor when in inter-cultivar
competition. Peak nitrogen accumulation rate timing was significantly earlier in both intra-
171
and inter- cultivar competition in Proctor, Krona, Annabell and Chanson. Proctor, Krona and
Chanson also had significantly lower absolute maximum accumulated nitrogen in
competition treatments compared to plants in isolation. However, Annabell had a significant
increase in absolute maximum accumulated nitrogen when in intra-cultivar competition.
This demonstrates that the ability to shift the temporal dynamics of nitrogen accumulation
rate has not been lost during the breeding of modern barley cultivars, and the potential
remains for developing temporally complementary crop mixtures using modern cultivars.
8.4.1 - General patterns of temporal dynamics of nitrogen and biomass accumulation
Nitrogen accumulation rate peaked at 23 - 28 days after planting, 27 – 32 days before peak
biomass accumulation rate. However, the temporal dynamics of biomass and nitrogen
accumulation demonstrated different shifts in response to inter- and intra- cultivar
competition. This follows the trend seen in the previous temporal dynamism study, which
also found a lack of consistent responses to plant-plant competition between biomass and
nitrogen accumulation dynamics (Schofield et al., 2019; Chapter 2).
Several plant processes have been found to be closely linked during growth
including: light interception and carbon assimilation (Van Heerden et al., 2010), as well as
nutrient uptake and carbon assimilation (Lamaze et al., 2003). Although these processes are
linked most of the time, under certain conditions these processes can uncouple. For
example, cumulative intercepted solar radiation and biomass accumulation in sugar cane
(Saccharum officinarum) increase linearly but uncouple at high levels of cumulative solar
irradiation interception, when biomass accumulation is limited by a high sugar
concentration and cooler temperatures (Van Heerden et al., 2010). Nitrogen and biomass
accumulation rate have also been found to uncouple during spring growth of evergreen
shrubs to temporarily alleviate competition stress (Lamaze et al., 2003). This is one potential
explanation for the differing shifts in biomass and nitrogen accumulation dynamics in this
experiment. Plant recognition processes or competition stress early in the growth cycle of
barley may lead to a similar response, as plants temporarily uncouple these two processes
to reduce competition for resources.
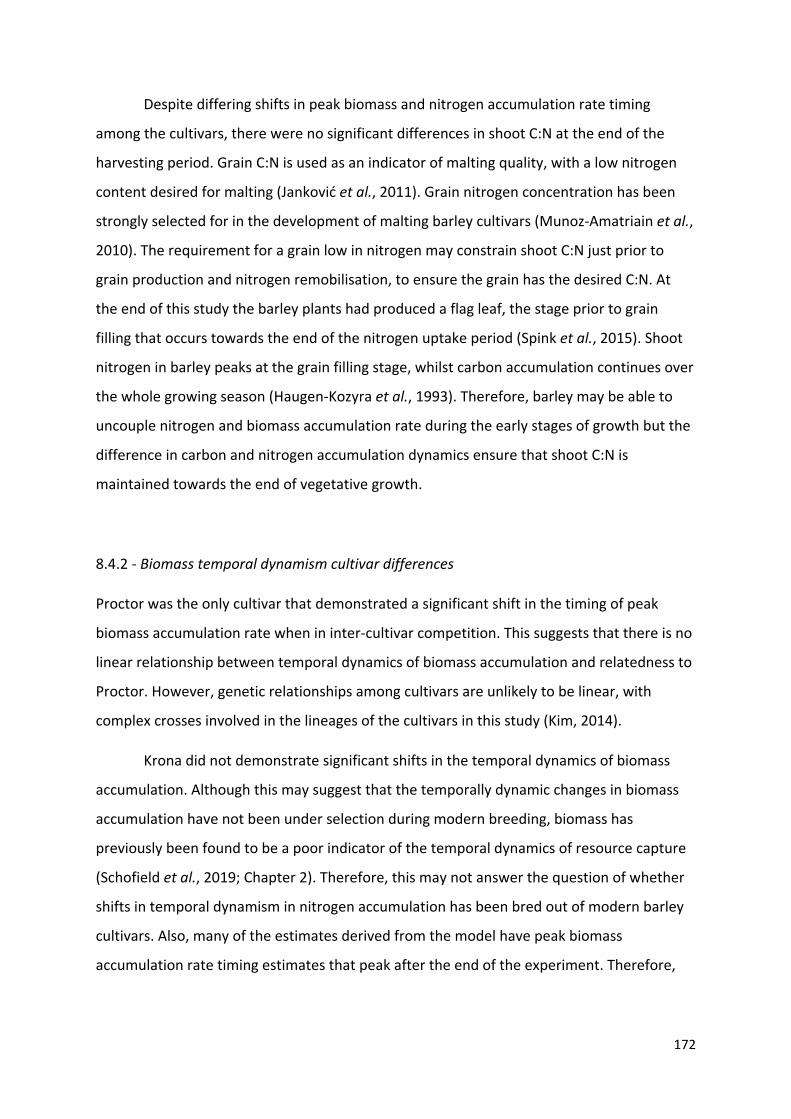
172
Despite differing shifts in peak biomass and nitrogen accumulation rate timing
among the cultivars, there were no significant differences in shoot C:N at the end of the
harvesting period. Grain C:N is used as an indicator of malting quality, with a low nitrogen
content desired for malting (Janković et al., 2011). Grain nitrogen concentration has been
strongly selected for in the development of malting barley cultivars (Munoz-Amatriain et al.,
2010). The requirement for a grain low in nitrogen may constrain shoot C:N just prior to
grain production and nitrogen remobilisation, to ensure the grain has the desired C:N. At
the end of this study the barley plants had produced a flag leaf, the stage prior to grain
filling that occurs towards the end of the nitrogen uptake period (Spink et al., 2015). Shoot
nitrogen in barley peaks at the grain filling stage, whilst carbon accumulation continues over
the whole growing season (Haugen-Kozyra et al., 1993). Therefore, barley may be able to
uncouple nitrogen and biomass accumulation rate during the early stages of growth but the
difference in carbon and nitrogen accumulation dynamics ensure that shoot C:N is
maintained towards the end of vegetative growth.
8.4.2 - Biomass temporal dynamism cultivar differences
Proctor was the only cultivar that demonstrated a significant shift in the timing of peak
biomass accumulation rate when in inter-cultivar competition. This suggests that there is no
linear relationship between temporal dynamics of biomass accumulation and relatedness to
Proctor. However, genetic relationships among cultivars are unlikely to be linear, with
complex crosses involved in the lineages of the cultivars in this study (Kim, 2014).
Krona did not demonstrate significant shifts in the temporal dynamics of biomass
accumulation. Although this may suggest that the temporally dynamic changes in biomass
accumulation have not been under selection during modern breeding, biomass has
previously been found to be a poor indicator of the temporal dynamics of resource capture
(Schofield et al., 2019; Chapter 2). Therefore, this may not answer the question of whether
shifts in temporal dynamism in nitrogen accumulation has been bred out of modern barley
cultivars. Also, many of the estimates derived from the model have peak biomass
accumulation rate timing estimates that peak after the end of the experiment. Therefore,
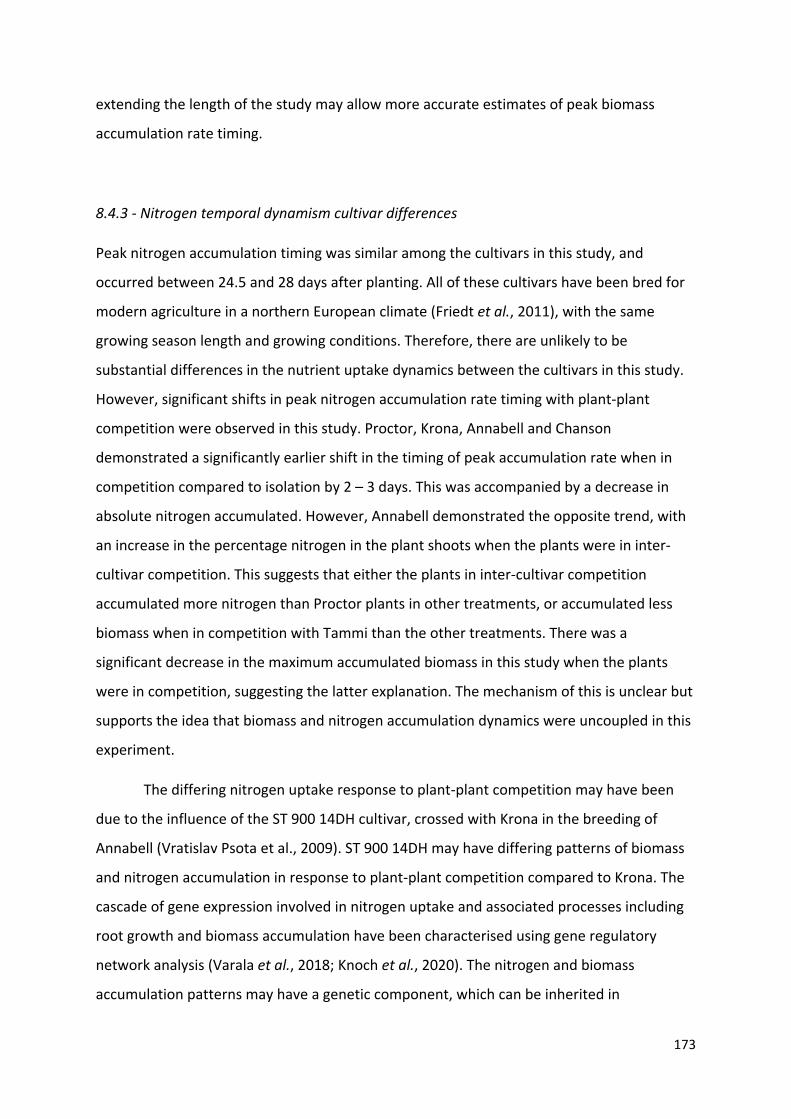
173
extending the length of the study may allow more accurate estimates of peak biomass
accumulation rate timing.
8.4.3 - Nitrogen temporal dynamism cultivar differences
Peak nitrogen accumulation timing was similar among the cultivars in this study, and
occurred between 24.5 and 28 days after planting. All of these cultivars have been bred for
modern agriculture in a northern European climate (Friedt et al., 2011), with the same
growing season length and growing conditions. Therefore, there are unlikely to be
substantial differences in the nutrient uptake dynamics between the cultivars in this study.
However, significant shifts in peak nitrogen accumulation rate timing with plant-plant
competition were observed in this study. Proctor, Krona, Annabell and Chanson
demonstrated a significantly earlier shift in the timing of peak accumulation rate when in
competition compared to isolation by 2 – 3 days. This was accompanied by a decrease in
absolute nitrogen accumulated. However, Annabell demonstrated the opposite trend, with
an increase in the percentage nitrogen in the plant shoots when the plants were in inter-
cultivar competition. This suggests that either the plants in inter-cultivar competition
accumulated more nitrogen than Proctor plants in other treatments, or accumulated less
biomass when in competition with Tammi than the other treatments. There was a
significant decrease in the maximum accumulated biomass in this study when the plants
were in competition, suggesting the latter explanation. The mechanism of this is unclear but
supports the idea that biomass and nitrogen accumulation dynamics were uncoupled in this
experiment.
The differing nitrogen uptake response to plant-plant competition may have been
due to the influence of the ST 900 14DH cultivar, crossed with Krona in the breeding of
Annabell (Vratislav Psota et al., 2009). ST 900 14DH may have differing patterns of biomass
and nitrogen accumulation in response to plant-plant competition compared to Krona. The
cascade of gene expression involved in nitrogen uptake and associated processes including
root growth and biomass accumulation have been characterised using gene regulatory
network analysis (Varala et al., 2018; Knoch et al., 2020). The nitrogen and biomass
accumulation patterns may have a genetic component, which can be inherited in
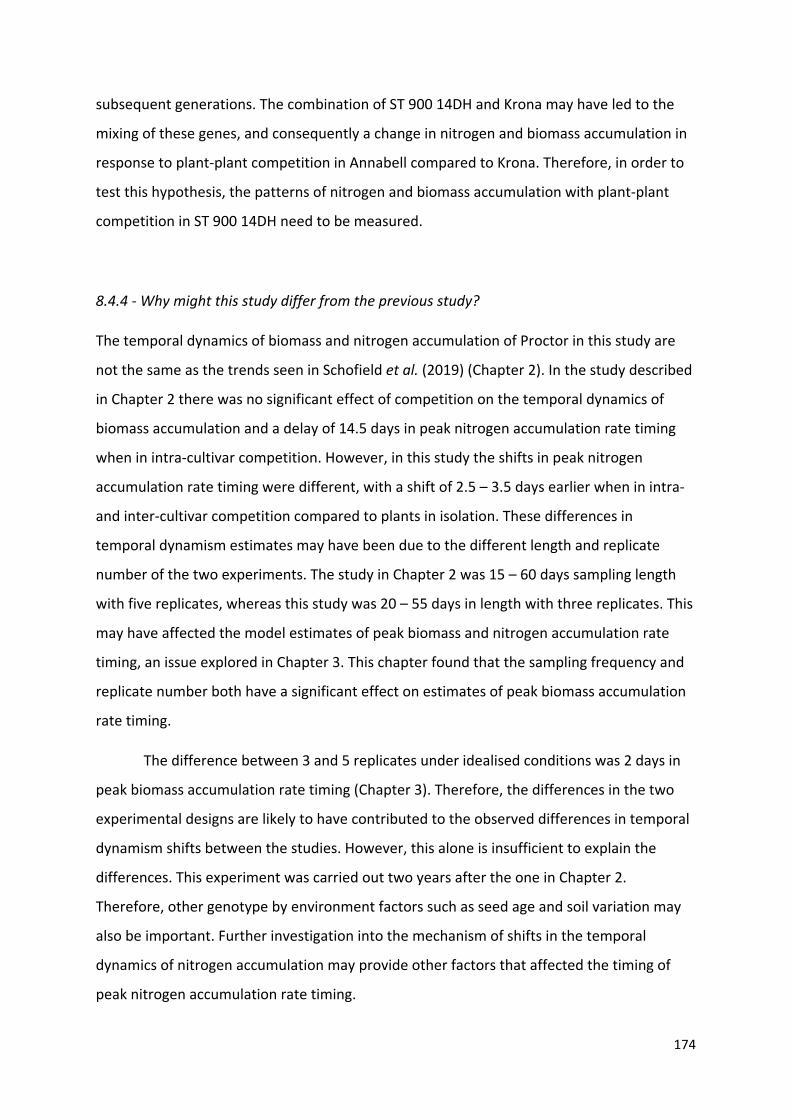
174
subsequent generations. The combination of ST 900 14DH and Krona may have led to the
mixing of these genes, and consequently a change in nitrogen and biomass accumulation in
response to plant-plant competition in Annabell compared to Krona. Therefore, in order to
test this hypothesis, the patterns of nitrogen and biomass accumulation with plant-plant
competition in ST 900 14DH need to be measured.
8.4.4 - Why might this study differ from the previous study?
The temporal dynamics of biomass and nitrogen accumulation of Proctor in this study are
not the same as the trends seen in Schofield et al. (2019) (Chapter 2). In the study described
in Chapter 2 there was no significant effect of competition on the temporal dynamics of
biomass accumulation and a delay of 14.5 days in peak nitrogen accumulation rate timing
when in intra-cultivar competition. However, in this study the shifts in peak nitrogen
accumulation rate timing were different, with a shift of 2.5 – 3.5 days earlier when in intra-
and inter-cultivar competition compared to plants in isolation. These differences in
temporal dynamism estimates may have been due to the different length and replicate
number of the two experiments. The study in Chapter 2 was 15 – 60 days sampling length
with five replicates, whereas this study was 20 – 55 days in length with three replicates. This
may have affected the model estimates of peak biomass and nitrogen accumulation rate
timing, an issue explored in Chapter 3. This chapter found that the sampling frequency and
replicate number both have a significant effect on estimates of peak biomass accumulation
rate timing.
The difference between 3 and 5 replicates under idealised conditions was 2 days in
peak biomass accumulation rate timing (Chapter 3). Therefore, the differences in the two
experimental designs are likely to have contributed to the observed differences in temporal
dynamism shifts between the studies. However, this alone is insufficient to explain the
differences. This experiment was carried out two years after the one in Chapter 2.
Therefore, other genotype by environment factors such as seed age and soil variation may
also be important. Further investigation into the mechanism of shifts in the temporal
dynamics of nitrogen accumulation may provide other factors that affected the timing of
peak nitrogen accumulation rate timing.
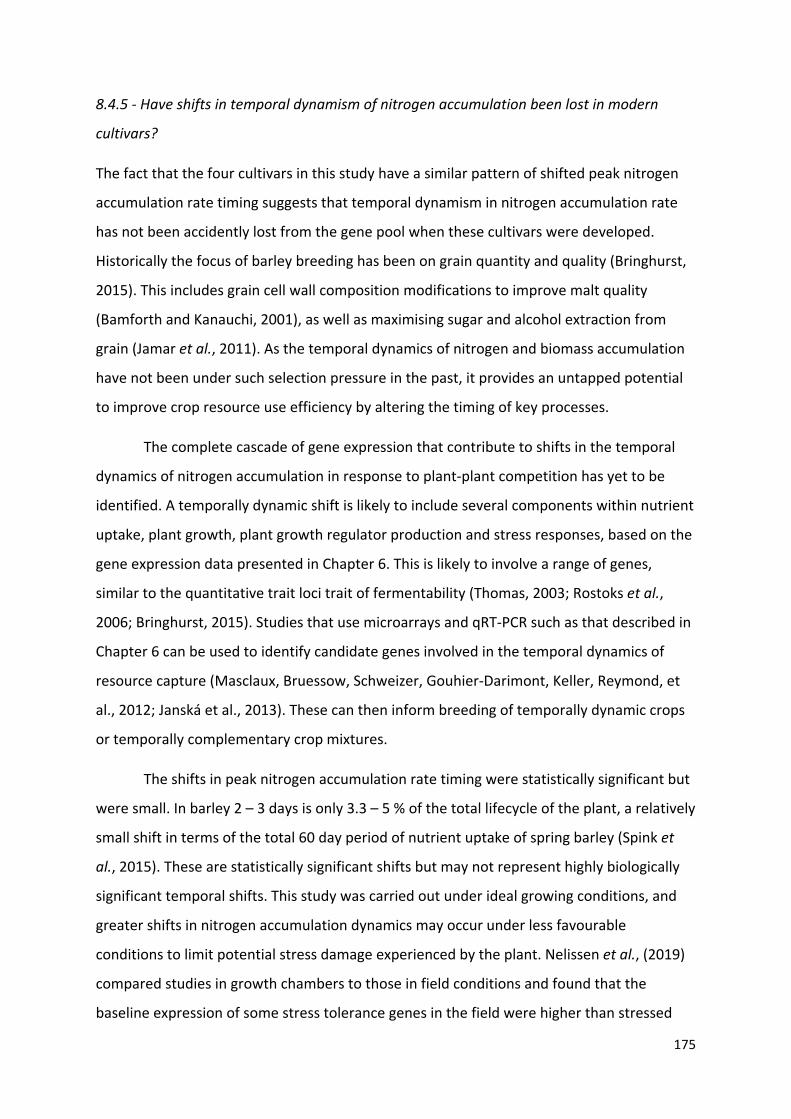
175
8.4.5 - Have shifts in temporal dynamism of nitrogen accumulation been lost in modern
cultivars?
The fact that the four cultivars in this study have a similar pattern of shifted peak nitrogen
accumulation rate timing suggests that temporal dynamism in nitrogen accumulation rate
has not been accidently lost from the gene pool when these cultivars were developed.
Historically the focus of barley breeding has been on grain quantity and quality (Bringhurst,
2015). This includes grain cell wall composition modifications to improve malt quality
(Bamforth and Kanauchi, 2001), as well as maximising sugar and alcohol extraction from
grain (Jamar et al., 2011). As the temporal dynamics of nitrogen and biomass accumulation
have not been under such selection pressure in the past, it provides an untapped potential
to improve crop resource use efficiency by altering the timing of key processes.
The complete cascade of gene expression that contribute to shifts in the temporal
dynamics of nitrogen accumulation in response to plant-plant competition has yet to be
identified. A temporally dynamic shift is likely to include several components within nutrient
uptake, plant growth, plant growth regulator production and stress responses, based on the
gene expression data presented in Chapter 6. This is likely to involve a range of genes,
similar to the quantitative trait loci trait of fermentability (Thomas, 2003; Rostoks et al.,
2006; Bringhurst, 2015). Studies that use microarrays and qRT-PCR such as that described in
Chapter 6 can be used to identify candidate genes involved in the temporal dynamics of
resource capture (Masclaux, Bruessow, Schweizer, Gouhier-Darimont, Keller, Reymond, et
al., 2012; Janská et al., 2013). These can then inform breeding of temporally dynamic crops
or temporally complementary crop mixtures.
The shifts in peak nitrogen accumulation rate timing were statistically significant but
were small. In barley 2 – 3 days is only 3.3 – 5 % of the total lifecycle of the plant, a relatively
small shift in terms of the total 60 day period of nutrient uptake of spring barley (Spink et
al., 2015). These are statistically significant shifts but may not represent highly biologically
significant temporal shifts. This study was carried out under ideal growing conditions, and
greater shifts in nitrogen accumulation dynamics may occur under less favourable
conditions to limit potential stress damage experienced by the plant. Nelissen et al., (2019)
compared studies in growth chambers to those in field conditions and found that the
baseline expression of some stress tolerance genes in the field were higher than stressed
176
plants grown in growth chamber conditions. Differences in environmental conditions in the
field can significantly impact the outcome of studies with the same setup (Nelissen et al.,
2019). Therefore, future work using plants grown in stress conditions may find that greater
plant stress induces greater temporal shifts in resource capture dynamics.
8.4.6 - Does this have consequences for future breeding and crop mixtures?
The magnitude of temporal shifts in nitrogen accumulation rate in this study are small but
demonstrate the presence of temporally dynamic shifts in response to plant-plant
competition in modern barley cultivars. Growing barley under stress conditions may lead to
greater shifts in resource accumulation dynamics with plant-plant competition. This is
important with the predicted increase in weather variability over the next 50 years
(Mahmood et al., 2019) and an increasing need for crops resilient to climate change
(Newton et al., 2011). Crops that are resilient under climatic variability are likely to produce
yield stability across a number of variable years (Powell et al., 2012). The ability to shift the
timing of key processes may therefore be an adaptive advantage in an uncertain climate.
Increasing resilience in barley using temporal dynamism of resource capture could
occur in two ways. One method involves breeding new barley cultivars that show high levels
of temporal plasticity in resource capture. Repeated crossing of elite barley lines is the
conventional method of barley breeding (Munoz-Amatriain et al., 2010). This can be guided
by gene expression and mapping studies to locate candidate genes in marker assisted
breeding (Fang et al., 2019). However, this relies on the identification and mapping of key
genes to be crossed (Ren et al., 2016). Many of the candidate genes identified in Chapter 6
had generalised functions and may have a range of functions beyond the temporal dynamics
of nitrogen accumulation. This may have consequences for breeding as there may be
unintended impacts on other stages of growth.
The other method involves the utilisation of crop mixtures. Simultaneously growing
multiple cultivars or species in an area has been found to improve crop yield and yield
stability between years (Brooker et al., 2015). Barley cultivar mixtures have been found to
improve complementarity, stress tolerance and resource use efficiency (Creissen et al.,
2016). Also, mixtures that have evolved together show greater facilitation and reduced
177
competition compared to monocultures (Schöb et al., 2018). However, the traits that
contribute to this have yet to be identified. One of these may be the ability to shift the
temporal dynamics of resource capture in response to competition. Yield stability could be
further improved by using barley cultivars with complementary patterns of resource capture
temporal dynamics. There has been much focus on enhancing complementarity using
legume intercropping to improve nitrogen and phosphorous use efficiency (Duchene et al.,
2017), but limited focus on temporal complementarity. This is a potential area to improve
crop mixture resource use efficiency, yield and yield stability.
8.5 - Conclusions
Temporally dynamic shifts in peak nitrogen accumulation rate were found to be conserved
in all the descendants of Proctor in this study. Krona, Annabell and Chanson had a similar
response to inter- and intra- cultivar competition as Proctor. As temporal dynamism of
nitrogen accumulation rate has been conserved in Chanson, a modern barley cultivar, it
demonstrates the potential for breeding barley cultivars that have highly plastic temporal
dynamics of resource capture or cultivar mixtures that are temporally complementary. The
temporal shifts in peak nitrogen accumulation rate were small, most likely due to being
grown under ideal, low stress conditions. Increased plant stress may lead to greater shifts in
peak nitrogen accumulation rate timing. Future studies using more realistic field conditions
would explore the potential for temporally complementary crop mixtures.
References
Bamforth, C. W. and Kanauchi, M. (2001) A simple model for the cell wall of the starchy
endosperm in barley. Journal of the Institute of Brewing, 107(4), 235–240.
Bedoussac, L., Journet, E. P., Hauggaard-Nielsen, H., Naudin, C., Corre-Hellou, G., Jensen, E.
S., Prieur, L. and Justes, E. (2015) Ecological principles underlying the increase of
productivity achieved by cereal-grain legume intercrops in organic farming. A review.
Agronomy for Sustainable Development, 35(3), 911–935.
Benaragama, D., Rossnagel, B. G. and Shirtliffe, S. J. (2014) Breeding for Competitive and
178
High-yielding crop cultivars. Crop Science, 54(3), 1015–1025.
Bringhurst, T. A. (2015) 125th Anniversary Review: Barley research in relation to Scotch
whisky production: A journey to new frontiers. Journal of the Institute of Brewing, 1, 1–18.
Brooker, R. W., Bennett, A. E., Cong, W. F., Daniell, T. J., George, T. S., Hallett, P. D., Hawes,
C., Iannetta, P. P. M., Jones, H. G., Karley, A. J., Li, L., Mckenzie, B. M., Pakeman, R. J.,
Paterson, E., Schöb, C., Shen, J., Squire, G., Watson, C. A., Zhang, C., Zhang, F., Zhang, J. and
White, P. J. (2015) Improving intercropping: A synthesis of research in agronomy, plant
physiology and ecology. New Phytologist, 1, 107–117.
Creissen, H. E., Jorgensen, T. H. and Brown, J. K. M. (2016) Increased yield stability of field-
grown winter barley (Hordeum vulgare L.) varietal mixtures through ecological processes.
Crop Protection, 85, 1–8.
Duchene, O., Vian, J. F. and Celette, F. (2017) Intercropping with legume for agroecological
cropping systems: Complementarity and facilitation processes and the importance of soil
microorganisms. A review. Agriculture, Ecosystems and Environment, 240, 148–161.
Fang, Y., Zhang, X. and Xue, D. (2019) Genetic Analysis and Molecular Breeding Applications
of Malting Quality QTLs in Barley. Frontiers in Genetics, 10, 352.
Friedt, W., Horsley, R. D., Harvey, B. L., Poulsen, D. M. E., Lance, R. C. M., Ceccarelli, S.,
Grando, S. and Capettini, F. (2011) Barley Breeding History, Progress, Objectives, and
Technology., In Barley: Production, Improvement, and Uses, Wiley-Blackwell, Oxford, UK,
160–220.
Ghaley, B. B., Hauggaard-Nielsen, H., Høgh-Jensen, H. and Jensen, E. S. (2005) Intercropping
of Wheat and Pea as Influenced by Nitrogen Fertilization. Nutrient Cycling in
Agroecosystems, 73(2–3), 201–212.
Gothard, P. G., Jenkins, G. and Morgan, A. G. (1978) Comparative malting performance of
old and new barley varieties. Journal of the Institute of Brewing, 84, 332–336.
Hatz, B. G., Powell, W., Russell, J. R., Macaulay, M., Fuller, J. D., Jahoor, A. and Waugh, R.
(2002) Direct comparison of levels of genetic variation among barley accessions detected by
RFLPs, AFLPs, SSRs and RAPDs. Theoretical and Applied Genetics, 95(4), 714–722.
179
Haugen-Kozyra, K., Juma, N. G. and Nyborg, M. (1993) Nitrogen partitioning and cycling in
barley-soil systems under conventional and zero tillage in central Alberta. Canadian Journal
of Soil Science, 73(2), 183–196.
Hayward, P. R. (1958) The production of barley in 1957. Journal of the Institute of Brewing.,
64(1), 13–19.
Van Heerden, P. D. R., Donaldson, R. A., Watt, D. A. and Singels, A. (2010) Biomass
accumulation in sugarcane: Unravelling the factors underpinning reduced growth
phenomena. Journal of Experimental Botany, 61(11), 2877–2887.
Jamar, C., du Jardin, P. and Fauconnier, M. L. (2011) Cell wall polysaccharides hydrolysis of
malting barley (Hordeum vulgare L.): A review. Biotechnology, Agronomy and Society and
Environment, 15(2), 301–313.
Janković, S., Glamočlija, D., Maletić, R., Rakić, S., Hristov, N. and Ikanović, J. (2011) Effects of
nitrogen fertilization on yield and grain quality in malting barley. African Journal of
Biotechnology, 10(84), 19534–19541.
Janská, A., Hodek, J., Svoboda, P., Zámečník, J., Prášil, I. T., Vlasáková, E., Milella, L. and
Ovesná, J. (2013) The choice of reference gene set for assessing gene expression in barley
(Hordeum vulgare L.) under low temperature and drought stress. Molecular Genetics and
Genomics, 288(11), 639–649.
Kim B. (2014) Genomic Prediction and Association Mapping Using Publicly Available Data of
German Variety Trials in Spring Barley., PhD thesis, University of Bonn, Accessed
24/02/2020, (http://hss.ulb.uni-bonn.de/2014/3704/3704.pdf).
Lahti, D. C., Johnson, N. A., Ajie, B. C., Otto, S. P., Hendry, A. P., Blumstein, D. T., Coss, R. G.,
Donohue, K. and Foster, S. A. (2009) Relaxed selection in the wild. Trends in Ecology and
Evolution, 24(9), 487–496.
Lamaze, T., Pasche, F. and Pornon, A. (2003) Uncoupling nitrogen requirements for spring
growth from root uptake in a young evergreen shrub (Rhododendron ferrugineum). New
Phytologist, 159(3), 637–644.
180
Li, C., Dong, Y., Li, H., Shen, J. and Zhang, F. (2014) The dynamic process of interspecific
interactions of competitive nitrogen capture between intercropped wheat (Triticum
aestivum L.) and Faba Bean (Vicia faba L.). PloS One, 9(12), 160-220.
Mahmood, R., Jia, S. and Zhu, W. (2019) Analysis of climate variability, trends, and
prediction in the most active parts of the Lake Chad basin, Africa. Scientific Reports, 9(1),
6317.
Masclaux, F. G., Bruessow, F., Schweizer, F., Gouhier-Darimont, C., Keller, L., Reymond, P.,
Bowsher, A. W., Shetty, P., Anacker, B. L., Siefert, A., Strauss, S. Y., Friesen, M. L., Schmid, C.,
Bauer, S. and Bartelheimer, M. (2012) Transcriptome analysis of intraspecific competition in
Arabidopsis thaliana reveals organ-specific signatures related to nutrient acquisition and
general stress response pathways. BMC Plant Biology, 12(1), 227.
McProud, W. L. (1979) Repetitive cycling and simple recurrent selection in traditional barley
breeding programs. Euphytica, 28(2), 473–480.
Milla, R., García-Palacios, P. and Matesanz, S. (2017) Looking at past domestication to secure
ecosystem services of future croplands. Journal of Ecology, 4, 885–889.
Milla, R., Morente-López, J., Alonso-Rodrigo, J. M., Martín-Robles, N., Chapin, S.F. (2014)
Shifts and disruptions in resource-use trait syndromes during the evolution of herbaceous
crops. Proceedings of the Royal Society B: Biological Sciences, 281(1793).
doi:10.1098/rspb.2014.1429.
Munoz-Amatriain, M., Xiong, Y., Schmitt, M. R., Bilgic, H., Budde, A. D., Chao, S., Smith, K. P.
and Muehlbauer, G. J. (2010) Transcriptome analysis of a barley breeding program examines
gene expression diversity and reveals target genes for malting quality improvement. BMC
Genomics, 11(1), 653.
Nelissen, H., Sprenger, H., Demuynck, K., De Block, J., Van Hautegem, T., De Vliegher, A. and
Inzé, D. (2019) From laboratory to field: yield stability and shade avoidance genes are
massively differentially expressed in the field. Plant Biotechnology Journal, 1467-7644
https://doi.org/10.1111/pbi.13269.
Newton, A. C., Johnson, S. N. and Gregory, P. J. (2011) Implications of climate change for
diseases, crop yields and food security. Euphytica, 179(1), 3–18.
181
Oliver, G. (2014) The Oxford Companion to Beer. Oxford University Press, Oxford, UK.
Postma, J. A. and Lynch, J. P. (2012) Complementarity in root architecture for nutrient
uptake in ancient maize/bean and maize/bean/squash polycultures. Annals of Botany, 110,
521–534.
Powell, N., Ji, X., Ravash, R., Edlington, J. and Dolferus, R. (2012) Yield stability for cereals in
a changing climate. Functional Plant Biology, 39(7), 539–552.
R Core Team (2015) R: A Language and Environment for Statistical Computing. R Foundation
for Statistical Computing, 1, 409.
Reiss, E. R. and Drinkwater, L. E. (2018) Cultivar mixtures: A meta-analysis of the effect of
intraspecific diversity on crop yield. Ecological Applications, 28(1), 62–77.
Ren, X., Wang, J., Liu, L., Sun, G., Li, C., Luo, H. and Sun, D. (2016) SNP-based high density
genetic map and mapping of btwd1 dwarfing gene in barley. Scientific Reports, 6, 31741.
Rostoks, N., Ramsay, L., MacKenzie, K., Cardle, L., Bhat, P. R., Roose, M. L., Svensson, J. T.,
Stein, N., Varshney, R. K., Marshall, D. F., Graner, A., Close, T. J. and Waugh, R. (2006) Recent
history of artificial outcrossing facilitates whole-genome association mapping in elite inbred
crop varieties. Proceedings of the National Academy of Sciences of the United States of
America, 103(49), 18656–18661.
Schöb, C., Brooker, R. W. and Zuppinger-Dingley, D. (2018) Evolution of facilitation requires
diverse communities. Nature Ecology & Evolution, 2(9), 1381–1385.
Schofield, E. J., Rowntree, J. K., Paterson, E., Brewer, M. J., Price, E. A. C., Brearley, F. Q. and
Brooker, R. W. (2019) Cultivar differences and impact of plant-plant competition on
temporal patterns of nitrogen and biomass accumulation. Frontiers in Plant Science, 10, 215.
Schofield, E. J., Rowntree, J. K., Paterson, E. and Brooker, R. W. (2018) Temporal Dynamism
of Resource Capture: A Missing Factor in Ecology? Trends in Ecology and Evolution, 33(4),
277–286.
Spink, J., Blake, J., Bingham, I., Hoad, S. and Foulkes, J. (2015) Barley growth guide Managing
barley growth. [https://cereals.ahdb.org.uk/media/186381/g67-barley-growth-guide.pdf.]
(Accessed 10/02/2020).
182
Stein, N. and Muehlbauer, G. J. (2018) Compendium of Plant Genomes: The Barley Genome.
Springer International Publishing, Cham, Switzerland.
Thomas, W. T. B. (2003) Prospects for molecular breeding of barley. Annals of Applied
Biology, 142(1), 1–12.
Venables, W. N. and Ripley, B. D. (2002) Modern Applied Statistics with S. Fourth edition,
Springer, New York.
Vratislav Psota, J., Zuzana, S. and Jiří, H. (2009) The effect of the barley variety, location and
year crop on the haze of congress wort. Czech Journal of Food Sciences, 27(3), 158–164.
Zhang, L., Werf, W. van der, Bastiaans, L., Zhang, S., Li, B. and J.H.J. Spiertz (2008) Light
interception and utilization in relay intercrops of wheat and cotton. Field Crops Research,
107(1), 29–42.
Zhu, J., van der Werf, W., Vos, J., Anten, N. P. R., van der Putten, P. E. L. and Evers, J. B. B.
(2016) High productivity of wheat intercropped with maize is associated with plant
architectural responses. Annals of Applied Biology, 168(3), 357–372.
183
General conclusions
The temporal dynamism of key processes is a potentially important missing factor in our
understanding of coexistence in plant communities. Currently, coexistence cannot be
explained in complex, species-rich ecosystems through processes such as niche
differentiation, as many plants seemingly occupy the same niches. The inclusion of temporal
dynamism allows plants to occupy the same spatial niche but different temporal niches,
promoting coexistence. One important temporally dynamic process, and the focus of this
thesis, is the temporal dynamics of nutrient uptake, specifically nitrogen. This work
demonstrates that the use of novel techniques, and refinement of previously utilised
approaches, can be used to study temporal dynamism of plant nitrogen uptake. The main
finding of this thesis is that the timing and rate of nutrient uptake is affected by intra-
specific competition between neighbouring plants and, critically, that this response depends
on the identity of the competitor.
The ability to shift the temporal dynamics of key processes such as nutrient uptake is
intrinsically linked to the concept of niche differentiation as shifting the timing of peak
accumulation of nutrients would lead to a species or genotype occupying a different
temporal niche. Therefore, temporal dynamism and temporal niche plasticity could be seen
as the same concept, as a temporal niche is the timing of an activity or behaviour (Terradas
et al., 2009). However, temporal dynamism also accounts for rate (in this case the rate of
nutrient uptake) as well as timing (Schofield et al., 2019). Therefore, temporal dynamism
can be seen as part of the concept of niche differentiation that accounts for both the timing
and rate of a process.
The studies presented in this thesis used barley (Hordeum vulgare) as a model plant,
and, as a result, the outcomes of my work have implications for both fundamental
ecological research and sustainable agriculture. Barley is an ideal model plant as its genetics
(Mayer et al., 2012b), morphology (Spink et al., 2015), physiology (Adem et al., 2014) and
growth dynamics (Neumann et al., 2017) have been well studied in an agricultural setting. In
addition, there has been an increasing cross-over between ecological and agricultural
studies (Brooker et al., 2015), with ecological principles informing sustainable agricultural
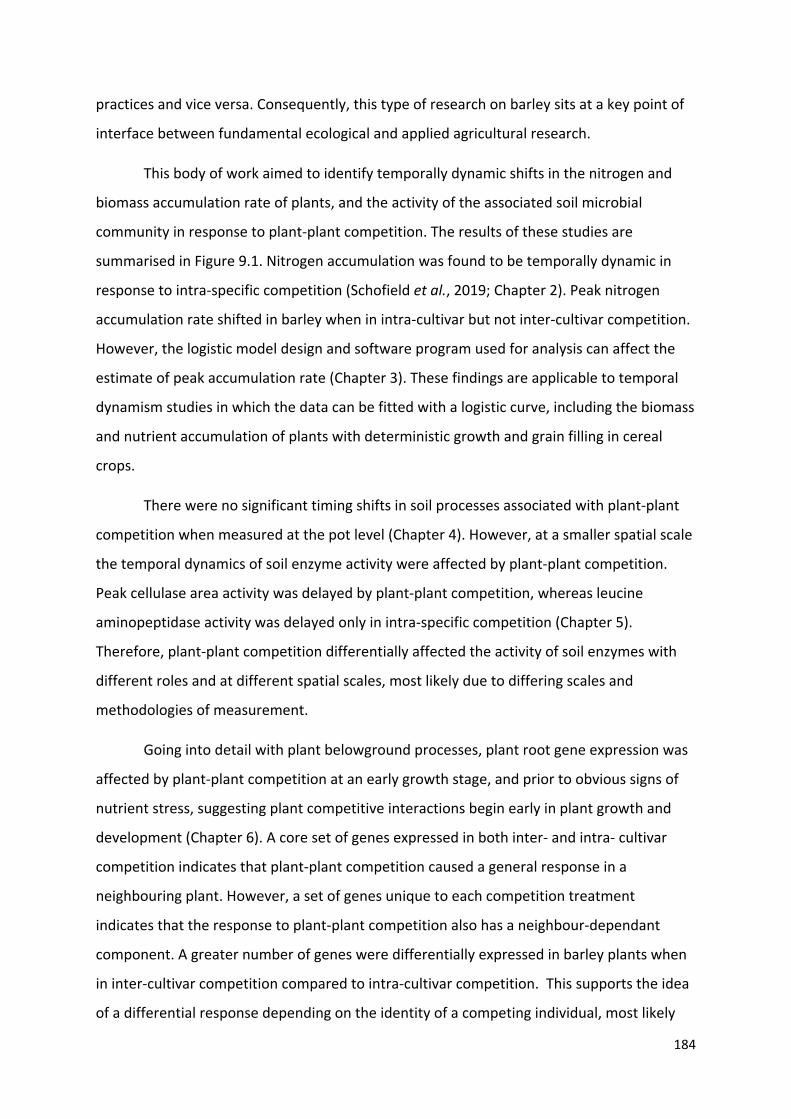
184
practices and vice versa. Consequently, this type of research on barley sits at a key point of
interface between fundamental ecological and applied agricultural research.
This body of work aimed to identify temporally dynamic shifts in the nitrogen and
biomass accumulation rate of plants, and the activity of the associated soil microbial
community in response to plant-plant competition. The results of these studies are
summarised in Figure 9.1. Nitrogen accumulation was found to be temporally dynamic in
response to intra-specific competition (Schofield et al., 2019; Chapter 2). Peak nitrogen
accumulation rate shifted in barley when in intra-cultivar but not inter-cultivar competition.
However, the logistic model design and software program used for analysis can affect the
estimate of peak accumulation rate (Chapter 3). These findings are applicable to temporal
dynamism studies in which the data can be fitted with a logistic curve, including the biomass
and nutrient accumulation of plants with deterministic growth and grain filling in cereal
crops.
There were no significant timing shifts in soil processes associated with plant-plant
competition when measured at the pot level (Chapter 4). However, at a smaller spatial scale
the temporal dynamics of soil enzyme activity were affected by plant-plant competition.
Peak cellulase area activity was delayed by plant-plant competition, whereas leucine
aminopeptidase activity was delayed only in intra-specific competition (Chapter 5).
Therefore, plant-plant competition differentially affected the activity of soil enzymes with
different roles and at different spatial scales, most likely due to differing scales and
methodologies of measurement.
Going into detail with plant belowground processes, plant root gene expression was
affected by plant-plant competition at an early growth stage, and prior to obvious signs of
nutrient stress, suggesting plant competitive interactions begin early in plant growth and
development (Chapter 6). A core set of genes expressed in both inter- and intra- cultivar
competition indicates that plant-plant competition caused a general response in a
neighbouring plant. However, a set of genes unique to each competition treatment
indicates that the response to plant-plant competition also has a neighbour-dependant
component. A greater number of genes were differentially expressed in barley plants when
in inter-cultivar competition compared to intra-cultivar competition. This supports the idea
of a differential response depending on the identity of a competing individual, most likely
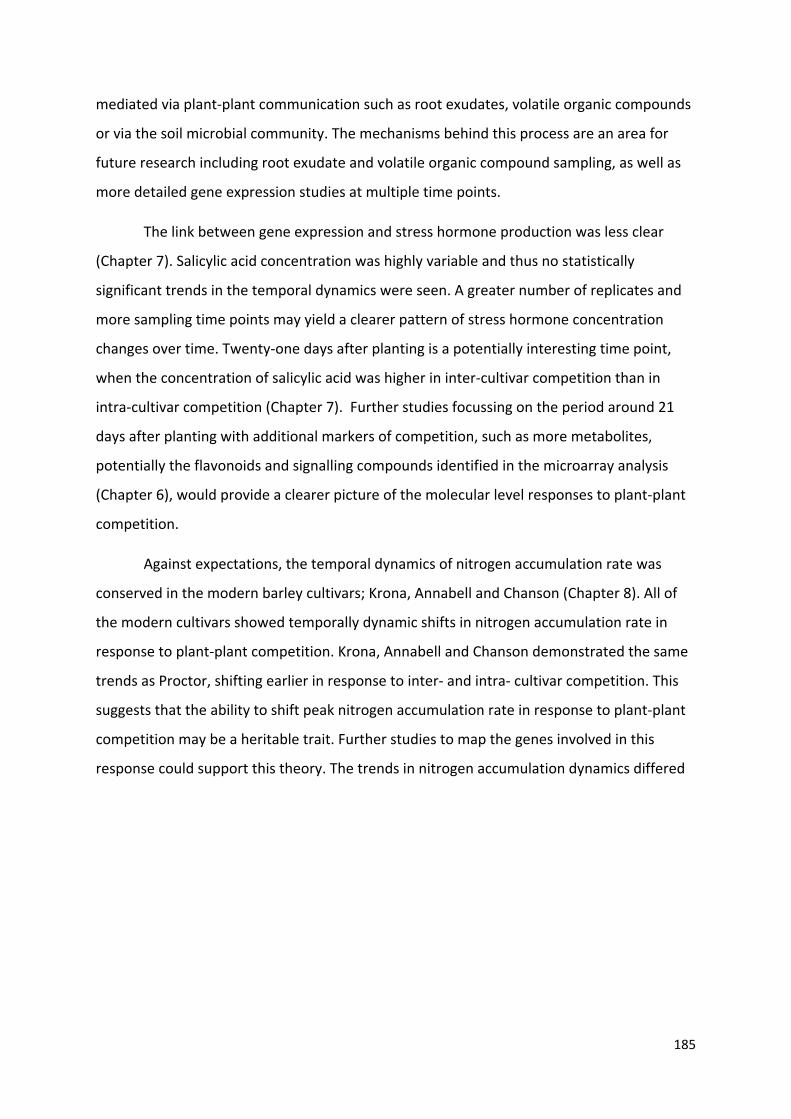
185
mediated via plant-plant communication such as root exudates, volatile organic compounds
or via the soil microbial community. The mechanisms behind this process are an area for
future research including root exudate and volatile organic compound sampling, as well as
more detailed gene expression studies at multiple time points.
The link between gene expression and stress hormone production was less clear
(Chapter 7). Salicylic acid concentration was highly variable and thus no statistically
significant trends in the temporal dynamics were seen. A greater number of replicates and
more sampling time points may yield a clearer pattern of stress hormone concentration
changes over time. Twenty-one days after planting is a potentially interesting time point,
when the concentration of salicylic acid was higher in inter-cultivar competition than in
intra-cultivar competition (Chapter 7). Further studies focussing on the period around 21
days after planting with additional markers of competition, such as more metabolites,
potentially the flavonoids and signalling compounds identified in the microarray analysis
(Chapter 6), would provide a clearer picture of the molecular level responses to plant-plant
competition.
Against expectations, the temporal dynamics of nitrogen accumulation rate was
conserved in the modern barley cultivars; Krona, Annabell and Chanson (Chapter 8). All of
the modern cultivars showed temporally dynamic shifts in nitrogen accumulation rate in
response to plant-plant competition. Krona, Annabell and Chanson demonstrated the same
trends as Proctor, shifting earlier in response to inter- and intra- cultivar competition. This
suggests that the ability to shift peak nitrogen accumulation rate in response to plant-plant
competition may be a heritable trait. Further studies to map the genes involved in this
response could support this theory. The trends in nitrogen accumulation dynamics differed
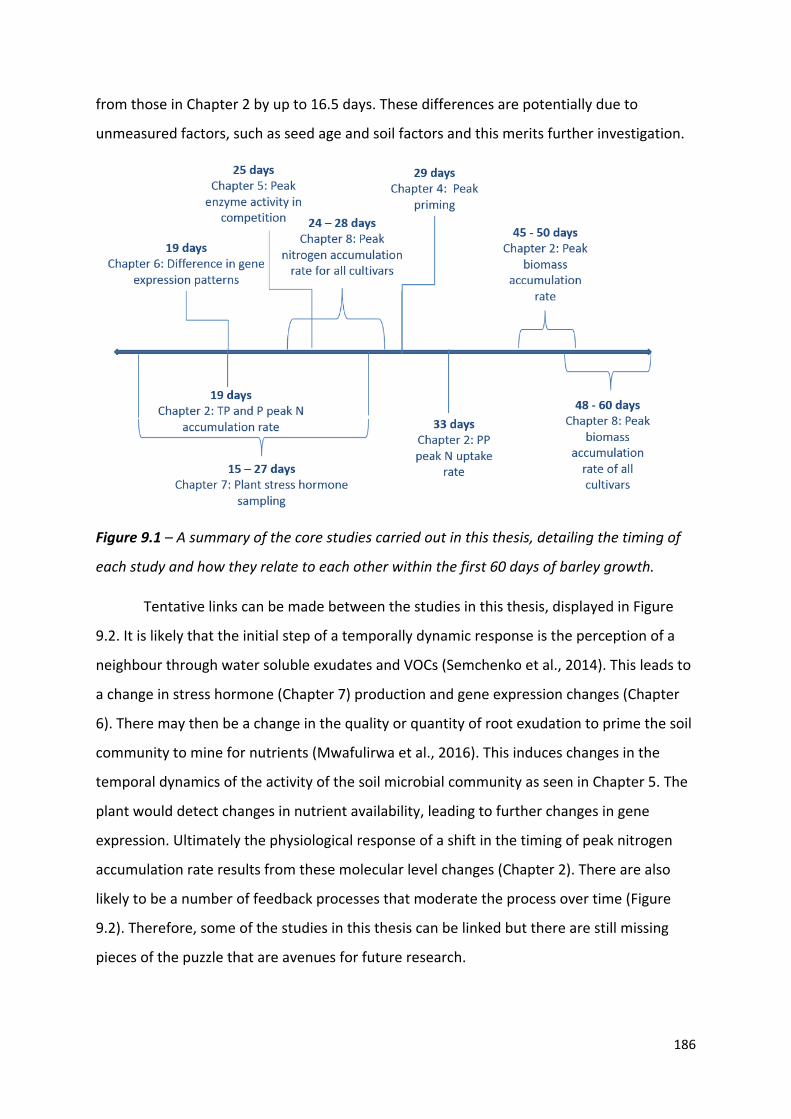
186
from those in Chapter 2 by up to 16.5 days. These differences are potentially due to
unmeasured factors, such as seed age and soil factors and this merits further investigation.
Figure 9.1 – A summary of the core studies carried out in this thesis, detailing the timing of
each study and how they relate to each other within the first 60 days of barley growth.
Tentative links can be made between the studies in this thesis, displayed in Figure
9.2. It is likely that the initial step of a temporally dynamic response is the perception of a
neighbour through water soluble exudates and VOCs (Semchenko et al., 2014). This leads to
a change in stress hormone (Chapter 7) production and gene expression changes (Chapter
6). There may then be a change in the quality or quantity of root exudation to prime the soil
community to mine for nutrients (Mwafulirwa et al., 2016). This induces changes in the
temporal dynamics of the activity of the soil microbial community as seen in Chapter 5. The
plant would detect changes in nutrient availability, leading to further changes in gene
expression. Ultimately the physiological response of a shift in the timing of peak nitrogen
accumulation rate results from these molecular level changes (Chapter 2). There are also
likely to be a number of feedback processes that moderate the process over time (Figure
9.2). Therefore, some of the studies in this thesis can be linked but there are still missing
pieces of the puzzle that are avenues for future research.
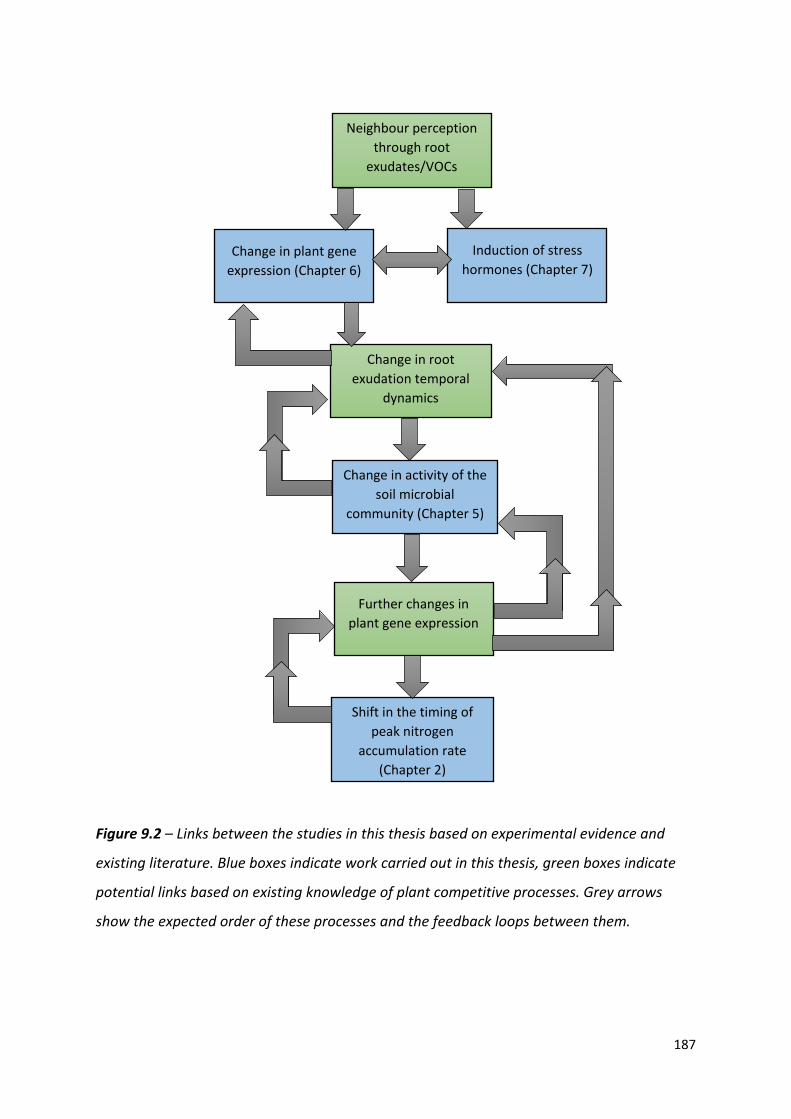
187
Figure 9.2 – Links between the studies in this thesis based on experimental evidence and
existing literature. Blue boxes indicate work carried out in this thesis, green boxes indicate
potential links based on existing knowledge of plant competitive processes. Grey arrows
show the expected order of these processes and the feedback loops between them.
Shift in the timing of peak nitrogen
accumulation rate (Chapter 2)
Neighbour perception through root
exudates/VOCs
Change in plant gene expression (Chapter 6)
Induction of stress hormones (Chapter 7)
Change in root exudation temporal
dynamics
Change in activity of the soil microbial
community (Chapter 5)
Further changes in plant gene expression
188
Future work
Using barley as a model plant creates two future avenues of research: the development of
both sustainable agriculture and our understanding of plant community coexistence.
There has been much focus on the role of plant mixtures in sustainable agriculture.
Mixtures have been found to improve crop yield, quality and maintain overall yield between
years i.e. improve yield stability (Brooker et al., 2015). Sustainable agriculture has previously
explored spatial complementarity between intercrops (Postma et al., 2014; Zhu et al., 2016)
and the inclusion of legumes in crop mixtures (Ghaley et al., 2005; Bedoussac and Justes,
2010), identifying these as important for sustainable production. The data in this thesis
demonstrates that the temporal dynamics of plant nutrient uptake is another mechanism
with potential for exploitation in sustainable agriculture. By understanding the effect of
plant-plant competition on the temporal dynamics of nutrient uptake, temporally
complementary crop mixtures can be developed. Although this thesis has focussed on intra-
specific plant interactions, the same principles can be applied to inter-specific crop mixtures.
For example, the successive harvesting experimental setup used in this thesis can be applied
to a range of agricultural and ecological studies using different species and time periods.
The experimental design can also be adapted to specific circumstances using the sampling
frequency and replicate number framework developed in Chapter 3. However, if these
studies are to be carried out on a large scale, this form of nitrogen analysis is destructive,
requiring large scale studies with multiple samples, increasing experimental costs.
Therefore, the development of a non-destructive proxy measure of plant nitrogen content
such as leaf spectrometry using a chlorophyll meter would make these studies more
feasible, as well as being useful for field-based plant nitrogen measurements.
Many of the studies in this thesis could be extended in order to further understand
the link between the plant and soil components of the temporal dynamics of resource
capture. This forms a vital missing factor in plant community coexistence theory. The
microarrays used in the gene expression study of Chapter 6 only captured one time point.
Future work to expand on this would include sampling gene expression at multiple time
points during the growth cycle. This would indicate how gene expression in response to
plant-plant interactions changes over time. It may be found that over time expression of
genes associated with nutrient deficiency increases, as has been found in Arabidopsis
189
thaliana (Masclaux, Bruessow, Schweizer, Gouhier-Darimont, Keller, Reymond, et al., 2012).
The characterisation of differences in gene expression may provide information about the
mechanism of temporally dynamic shifts in resource accumulation. This could also generate
target genes for future marker assisted breeding programs. Another important factor to
consider is if the pattern of gene expression changes with different cultivars of barley. This
may be detected at a gene expression level by characterising the expression patterns
associated with differing nitrogen accumulation dynamics.
Root exudation quality and quantity is known to vary depending on location within
the root zone, with greater exudation near the root tip and in the zone of elongation (Travis
S. Walker et al., 2003). This is impacted by, and impacts on, the activity of the soil microbial
community (Canarini et al., 2019). The zymography sampling in Chapter 5 only sampled at
one root zone location, i.e. in the zone of maturation. The temporal dynamics of soil enzyme
activity associated with plant roots in the zone of elongation or at the root tip may differ
from the zone of maturation. Therefore, sampling the activity of multiple enzyme classes
across the root zones would provide a view of both the temporal and spatial dynamics of
soil enzyme activity, allowing further understanding the fundamental link between the soil
and plant dynamics in plant community coexistence.
The focus on salicylic acid and jasmonic acid in Chapter 7 could be expanded to
include a full metabolomic screen using a method such as mass spectrometry. Twenty one
days after planting has been identified as a potentially interesting time point for further
studies. By investigating other potentially important compounds, molecular indicators of
plant-plant competition could be identified and used to track plant competition stress over
time. Combined with the gene expression data from a time series of microarrays this can be
used to characterise plant-plant competition responses over time, linking the observed
physiological and molecular level responses.
The work in Chapter 8 illustrates the conservation of a temporally dynamic nitrogen
accumulation rate in response to plant-plant competition in the descendants of Proctor. The
next step in future work would be to examine the temporal dynamics of resource capture
under field and stress conditions to determine the potential benefit of temporally dynamics
shifts in these circumstances. This can then be used to develop crop mixtures with
190
temporally complementary resource capture dynamics, which can then be tested under
field conditions.
Initial steps
The previous section details a large number of potential future avenues for research. The
work in this thesis has demonstrated methods to detect temporally dynamic shifts in
processes associated with nutrient uptake in response to plant-plant competition. It also
addresses the interactions between the plant and soil processes involved in temporally
dynamic shifts of key processes. However, in order to add temporal dynamism as a factor in
models of coexistence in complex plant communities and crop mixtures, I suggest focusing
on understanding the mechanisms of temporally dynamic responses to plant-plant
competition. This would initially involve expanding the gene expression study to include
multiple time points, covering the barley lifecycle. The gene expression data would provide
information about how plant responses to competition for nutrients vary over time. This
type of study would need to be combined with a metabolome study to begin linking gene
expression to physiological and biochemical responses to plant-plant competition. These
studies would form the basis for a mechanistic approach to understanding plant-plant
interactions at a molecular level and link it to the physiological changes detailed in this
thesis.
References
Adem, G. D., Roy, S. J., Zhou, M., Bowman, J. P. Shabala, S. (2014) Evaluating contribution of
ionic, osmotic and oxidative stress components towards salinity tolerance in barley. BMC
Plant Biology, 14(4), 113. doi: 10.1186/1471-2229-14-113.
Bedoussac, L. and Justes, E. (2010) Dynamic analysis of competition and complementarity
for light and N use to understand the yield and the protein content of a durum wheat--
winter pea intercrop. Plant and Soil, 330(1), 37–54. doi: 10.1007/s11104-010-0303-8.
Brooker, R. W., Bennett, A. E., Cong, W-F., Daniell, T. J., George, Timothy S., Hallett, P. D.,
Hawes, C., Iannetta, P. M., Jones, H. G., Karley, A. J., Li, L., McKenzie, B. M., Pakeman, R. J.,
191
Paterson, E., Schöb, C., Shen, J., Squire, G., Watson, C. A., Zhang, C., Zhang, F., Zhang, J.,
White, P. J. (2015) Improving intercropping: a synthesis of research in agronomy, plant
physiology and ecology. New Phytologist, 206(1), 107–117. doi: 10.1111/nph.13132.
Canarini, A., Kaiser, C., Merchant, A., Richter, A., Wanek, W. (2019) Root exudation of
primary metabolites: Mechanisms and their roles in plant responses to environmental
stimuli. Frontiers in Plant Science, 10, 157. doi: 10.3389/fpls.2019.00157.
Ghaley, B. B., Hauggaard-Nielsen, H., Høgh-Jensen, H., Jensen, E. S. (2005) Intercropping of
Wheat and Pea as Influenced by Nitrogen Fertilization. Nutrient Cycling in Agroecosystems,
73(2–3), 201–212. doi: 10.1007/s10705-005-2475-9.
Masclaux, F. G., Bruessow, F., Schweizer, F., Gouhier-Darimont, C., Keller, L., Reymond, P.
(2012) Transcriptome analysis of intraspecific competition in Arabidopsis thaliana reveals
organ-specific signatures related to nutrient acquisition and general stress response
pathways. BMC Plant Biology, 12(1), 227. doi: 10.1186/1471-2229-12-227.
Mayer, K. F. X., Waugh, R., Langridge, P., Close, T. J., Wise, R. P., Graner, A., Matsumoto, T.,
Sato, K., Schulman, A., Ariyadasa, R., Schulte, D., Poursarebani, N., Zhou, R., Steuernagel, B.,
Mascher, M., Scholz, U., Shi, B., Madishetty, K., Svensson, J. T., Bhat, P., Moscou, M., Resnik,
J., Muehlbauer, G. J., Hedley, P., Liu, H., Morris, J., Frenkel, Z., Korol, A., Bergès, H., Taudien,
S., Felder, M., Groth, M., Platzer, M., Himmelbach, A., Lonardi, S., Duma, D., lpert, M.,
Cordero, F., Beccuti, M., Ciardo, G., Ma, Y., Wanamaker, S., Cattonaro, F., Vendramin, V.,
Scalabrin, S., Radovic, S., Wing, R., Morgante, M., Nussbaumer, T., Gundlach, H., Martis, M.,
Poland, J., Pfeifer, M., Moisy, C., Tanskanen, J., Zuccolo, A., Spannagl, M., Russell, J., Druka,
A., Marshall, D., Bayer, M., Swarbreck, D., Sampath, D., Ayling, S., Febrer, M., Caccamo, M.,
Tanaka, T., Wannamaker, S., Schmutzer, T., Brown, John W.S., Fincher, G. B., Stein, N. (2012)
A physical, genetic and functional sequence assembly of the barley genome. Nature,
491(7426), 711–716. doi: 10.1038/nature11543.
Neumann, K., Zhao, Y., Chu, J., Keilwagen, J., Reif, J. C., Kilian, B., Graner, A. (2017) Genetic
architecture and temporal patterns of biomass accumulation in spring barley revealed by
image analysis. BMC Plant Biology, 17(1), 137. doi: 10.1186/s12870-017-1085-4.
192
Postma, J. A., Schurr, U. and Fiorani, F. (2014) Dynamic root growth and architecture
responses to limiting nutrient availability: Linking physiological models and
experimentation. Biotechnology Advances, 110(2), 53–65. doi:
10.1016/j.biotechadv.2013.08.019.
Schofield, E. J., Rowntree, J. K., Paterson, E., Brewer, M. J., Price, E. A.C., Brearley, F. Q.,
Brooker, R. W. (2019) Cultivar differences and impact of plant-plant competition on
temporal patterns of nitrogen and biomass accumulation. Frontiers in Plant Science, 10, 215.
doi: 10.3389/FPLS.2019.00215.
Spink, J., Blake, J., Bingham, I., Hoad, S., Foulkes, J. (2015) Barley growth guide Managing
barley growth, [https://cereals.ahdb.org.uk/media/186381/g67-barley-growth-guide.pdf.]
(Accessed 15/01/2020).
Terradas, J., Peñuelas, J. and Lloret, F. (2009) The Fluctuation Niche in Plants. International
Journal of Ecology (2009), 959702.
Walker, T. S., Bais, H. P., Grotewold, E., Vivanco, J. M. (2003) Root exudation and
rhizosphere biology. Plant Physiology, 132(1), 44–51. doi: 10.1104/pp.102.019661.
Zhu, J., van der Werf, W., Vos, J., Anten, N.P.R., van der Putten, P.E.L., Evers, J.B. (2016) High
productivity of wheat intercropped with maize is associated with plant architectural
responses. Annals of Applied Biology, 168(3), 357–372. doi: 10.1111/aab.12268.
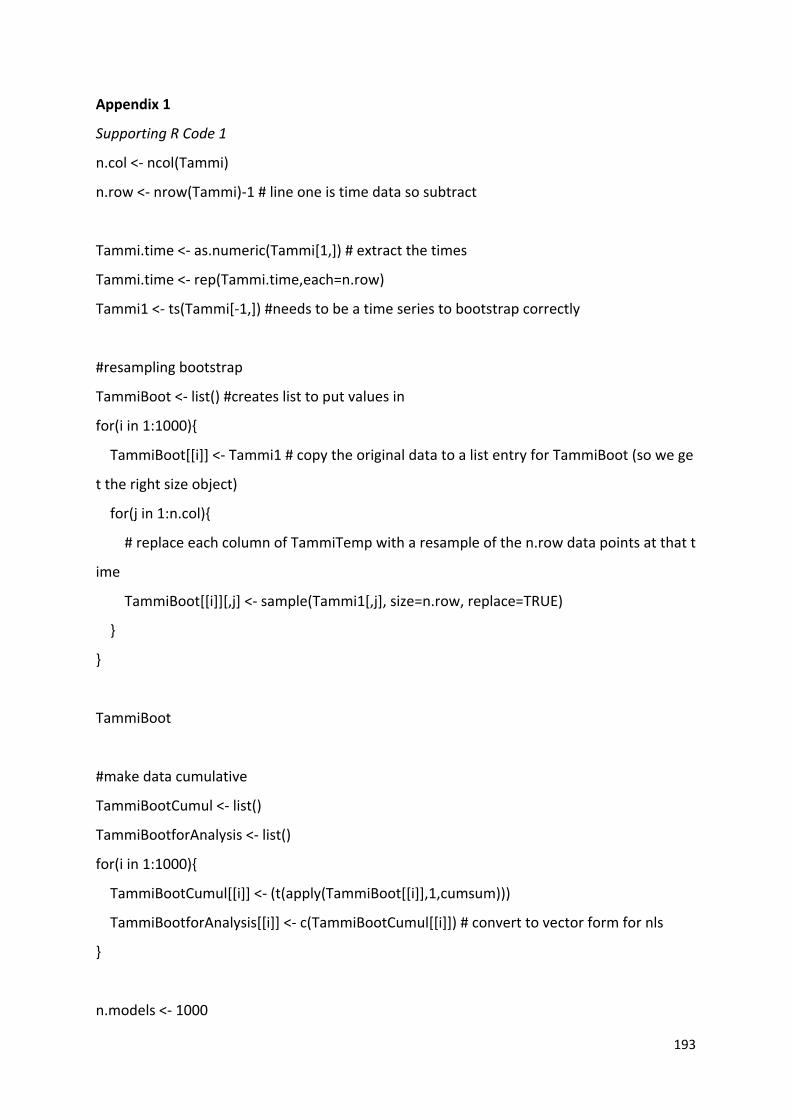
193
Appendix 1
Supporting R Code 1
n.col <- ncol(Tammi)
n.row <- nrow(Tammi)-1 # line one is time data so subtract
Tammi.time <- as.numeric(Tammi[1,]) # extract the times
Tammi.time <- rep(Tammi.time,each=n.row)
Tammi1 <- ts(Tammi[-1,]) #needs to be a time series to bootstrap correctly
#resampling bootstrap
TammiBoot <- list() #creates list to put values in
for(i in 1:1000){
TammiBoot[[i]] <- Tammi1 # copy the original data to a list entry for TammiBoot (so we ge
t the right size object)
for(j in 1:n.col){
# replace each column of TammiTemp with a resample of the n.row data points at that t
ime
TammiBoot[[i]][,j] <- sample(Tammi1[,j], size=n.row, replace=TRUE)
}
}
TammiBoot
#make data cumulative
TammiBootCumul <- list()
TammiBootforAnalysis <- list()
for(i in 1:1000){
TammiBootCumul[[i]] <- (t(apply(TammiBoot[[i]],1,cumsum)))
TammiBootforAnalysis[[i]] <- c(TammiBootCumul[[i]]) # convert to vector form for nls
}
n.models <- 1000
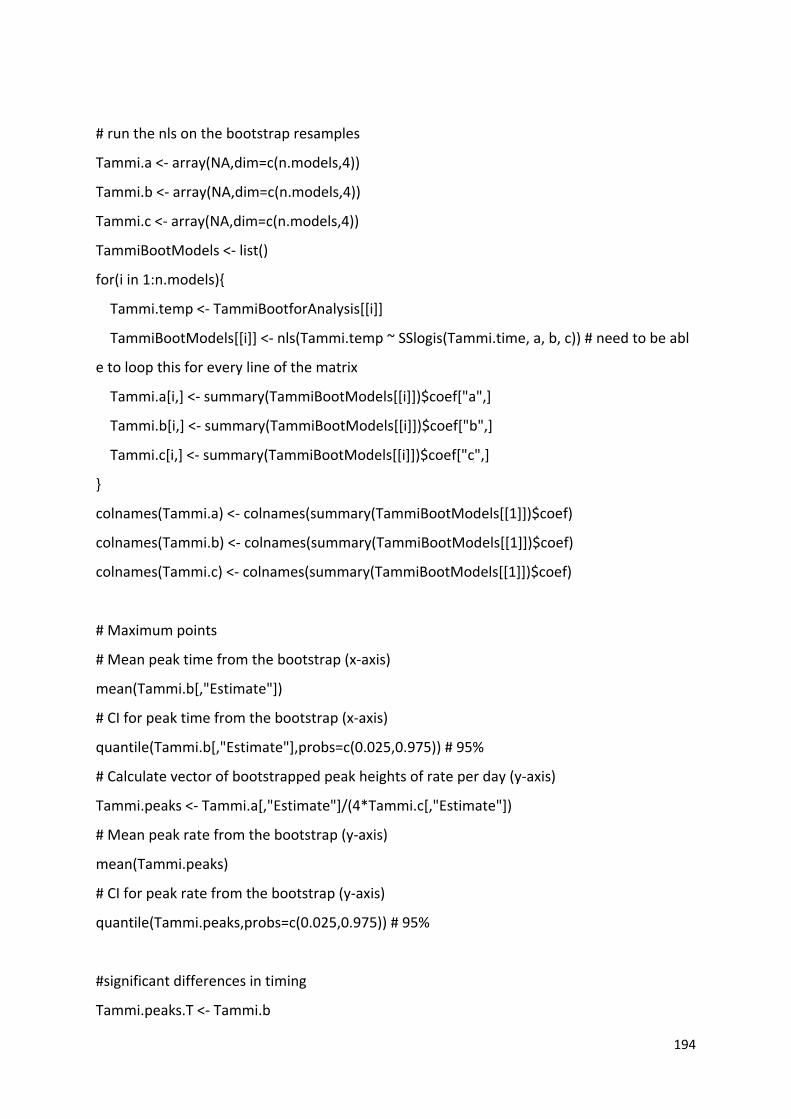
194
# run the nls on the bootstrap resamples
Tammi.a <- array(NA,dim=c(n.models,4))
Tammi.b <- array(NA,dim=c(n.models,4))
Tammi.c <- array(NA,dim=c(n.models,4))
TammiBootModels <- list()
for(i in 1:n.models){
Tammi.temp <- TammiBootforAnalysis[[i]]
TammiBootModels[[i]] <- nls(Tammi.temp ~ SSlogis(Tammi.time, a, b, c)) # need to be abl
e to loop this for every line of the matrix
Tammi.a[i,] <- summary(TammiBootModels[[i]])$coef["a",]
Tammi.b[i,] <- summary(TammiBootModels[[i]])$coef["b",]
Tammi.c[i,] <- summary(TammiBootModels[[i]])$coef["c",]
}
colnames(Tammi.a) <- colnames(summary(TammiBootModels[[1]])$coef)
colnames(Tammi.b) <- colnames(summary(TammiBootModels[[1]])$coef)
colnames(Tammi.c) <- colnames(summary(TammiBootModels[[1]])$coef)
# Maximum points
# Mean peak time from the bootstrap (x-axis)
mean(Tammi.b[,"Estimate"])
# CI for peak time from the bootstrap (x-axis)
quantile(Tammi.b[,"Estimate"],probs=c(0.025,0.975)) # 95%
# Calculate vector of bootstrapped peak heights of rate per day (y-axis)
Tammi.peaks <- Tammi.a[,"Estimate"]/(4*Tammi.c[,"Estimate"])
# Mean peak rate from the bootstrap (y-axis)
mean(Tammi.peaks)
# CI for peak rate from the bootstrap (y-axis)
quantile(Tammi.peaks,probs=c(0.025,0.975)) # 95%
#significant differences in timing
Tammi.peaks.T <- Tammi.b
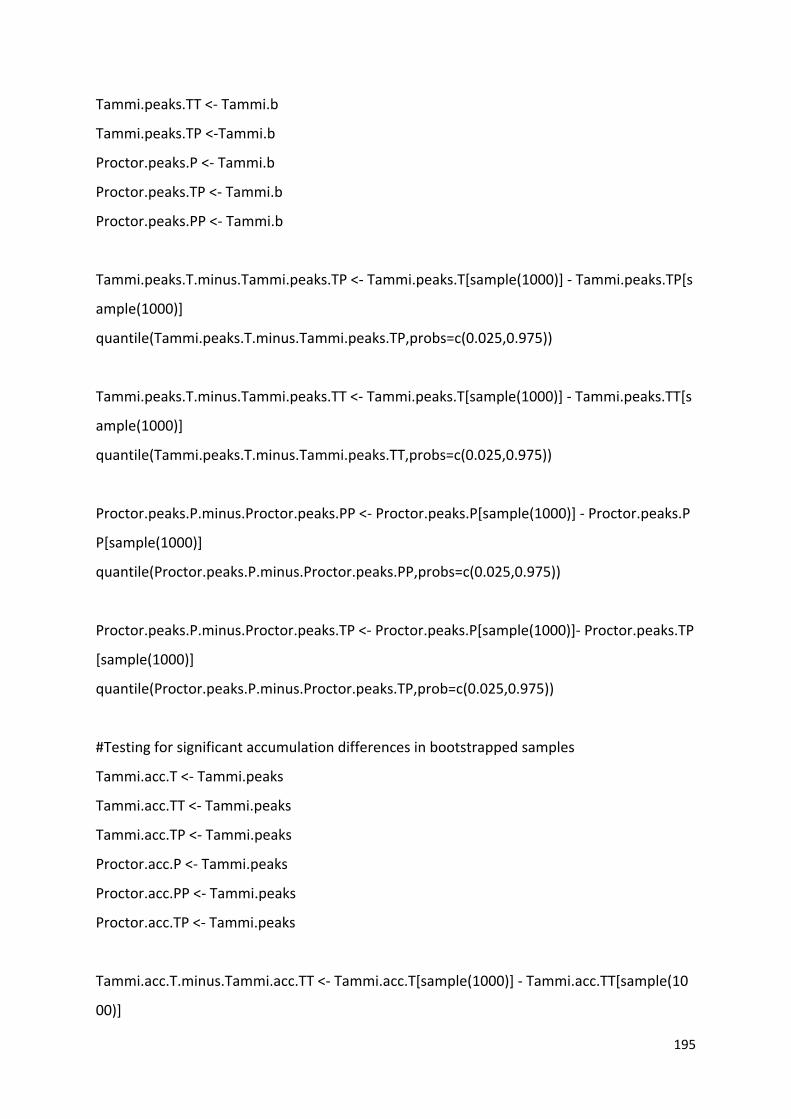
195
Tammi.peaks.TT <- Tammi.b
Tammi.peaks.TP <-Tammi.b
Proctor.peaks.P <- Tammi.b
Proctor.peaks.TP <- Tammi.b
Proctor.peaks.PP <- Tammi.b
Tammi.peaks.T.minus.Tammi.peaks.TP <- Tammi.peaks.T[sample(1000)] - Tammi.peaks.TP[s
ample(1000)]
quantile(Tammi.peaks.T.minus.Tammi.peaks.TP,probs=c(0.025,0.975))
Tammi.peaks.T.minus.Tammi.peaks.TT <- Tammi.peaks.T[sample(1000)] - Tammi.peaks.TT[s
ample(1000)]
quantile(Tammi.peaks.T.minus.Tammi.peaks.TT,probs=c(0.025,0.975))
Proctor.peaks.P.minus.Proctor.peaks.PP <- Proctor.peaks.P[sample(1000)] - Proctor.peaks.P
P[sample(1000)]
quantile(Proctor.peaks.P.minus.Proctor.peaks.PP,probs=c(0.025,0.975))
Proctor.peaks.P.minus.Proctor.peaks.TP <- Proctor.peaks.P[sample(1000)]- Proctor.peaks.TP
[sample(1000)]
quantile(Proctor.peaks.P.minus.Proctor.peaks.TP,prob=c(0.025,0.975))
#Testing for significant accumulation differences in bootstrapped samples
Tammi.acc.T <- Tammi.peaks
Tammi.acc.TT <- Tammi.peaks
Tammi.acc.TP <- Tammi.peaks
Proctor.acc.P <- Tammi.peaks
Proctor.acc.PP <- Tammi.peaks
Proctor.acc.TP <- Tammi.peaks
Tammi.acc.T.minus.Tammi.acc.TT <- Tammi.acc.T[sample(1000)] - Tammi.acc.TT[sample(10
00)]
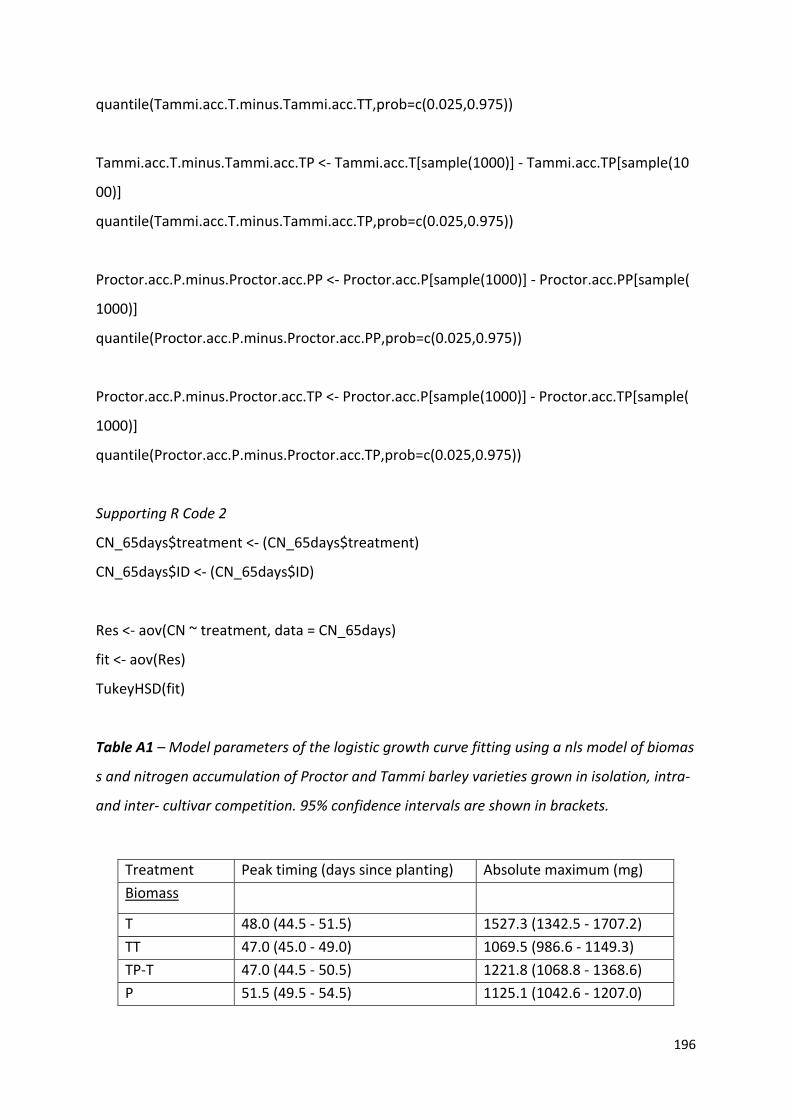
196
quantile(Tammi.acc.T.minus.Tammi.acc.TT,prob=c(0.025,0.975))
Tammi.acc.T.minus.Tammi.acc.TP <- Tammi.acc.T[sample(1000)] - Tammi.acc.TP[sample(10
00)]
quantile(Tammi.acc.T.minus.Tammi.acc.TP,prob=c(0.025,0.975))
Proctor.acc.P.minus.Proctor.acc.PP <- Proctor.acc.P[sample(1000)] - Proctor.acc.PP[sample(
1000)]
quantile(Proctor.acc.P.minus.Proctor.acc.PP,prob=c(0.025,0.975))
Proctor.acc.P.minus.Proctor.acc.TP <- Proctor.acc.P[sample(1000)] - Proctor.acc.TP[sample(
1000)]
quantile(Proctor.acc.P.minus.Proctor.acc.TP,prob=c(0.025,0.975))
Supporting R Code 2
CN_65days$treatment <- (CN_65days$treatment)
CN_65days$ID <- (CN_65days$ID)
Res <- aov(CN ~ treatment, data = CN_65days)
fit <- aov(Res)
TukeyHSD(fit)
Table A1 – Model parameters of the logistic growth curve fitting using a nls model of biomas
s and nitrogen accumulation of Proctor and Tammi barley varieties grown in isolation, intra-
and inter- cultivar competition. 95% confidence intervals are shown in brackets.
Treatment Peak timing (days since planting) Absolute maximum (mg) Biomass
T 48.0 (44.5 - 51.5) 1527.3 (1342.5 - 1707.2) TT 47.0 (45.0 - 49.0) 1069.5 (986.6 - 1149.3) TP-T 47.0 (44.5 - 50.5) 1221.8 (1068.8 - 1368.6) P 51.5 (49.5 - 54.5) 1125.1 (1042.6 - 1207.0)
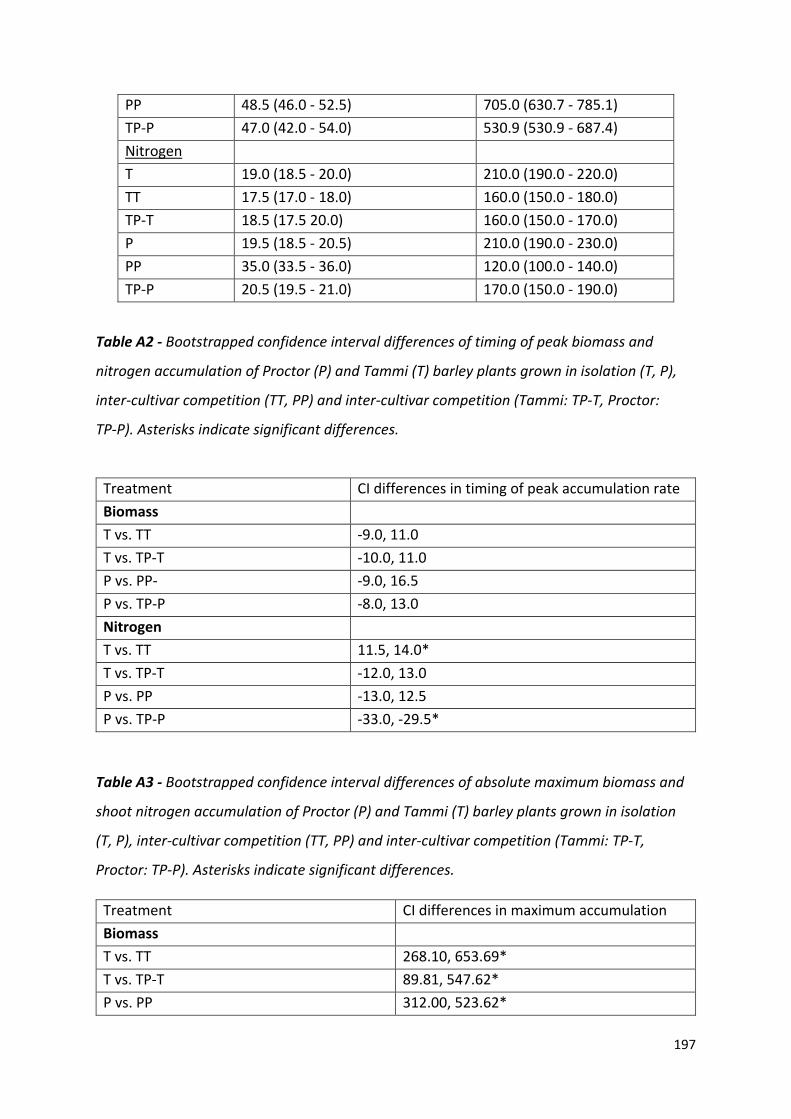
197
Table A2 - Bootstrapped confidence interval differences of timing of peak biomass and
nitrogen accumulation of Proctor (P) and Tammi (T) barley plants grown in isolation (T, P),
inter-cultivar competition (TT, PP) and inter-cultivar competition (Tammi: TP-T, Proctor:
TP-P). Asterisks indicate significant differences.
Treatment CI differences in timing of peak accumulation rate Biomass T vs. TT -9.0, 11.0 T vs. TP-T -10.0, 11.0 P vs. PP- -9.0, 16.5 P vs. TP-P -8.0, 13.0 Nitrogen T vs. TT 11.5, 14.0* T vs. TP-T -12.0, 13.0 P vs. PP -13.0, 12.5 P vs. TP-P -33.0, -29.5*
Table A3 - Bootstrapped confidence interval differences of absolute maximum biomass and
shoot nitrogen accumulation of Proctor (P) and Tammi (T) barley plants grown in isolation
(T, P), inter-cultivar competition (TT, PP) and inter-cultivar competition (Tammi: TP-T,
Proctor: TP-P). Asterisks indicate significant differences.
Treatment CI differences in maximum accumulation Biomass T vs. TT 268.10, 653.69* T vs. TP-T 89.81, 547.62* P vs. PP 312.00, 523.62*
PP 48.5 (46.0 - 52.5) 705.0 (630.7 - 785.1) TP-P 47.0 (42.0 - 54.0) 530.9 (530.9 - 687.4) Nitrogen T 19.0 (18.5 - 20.0) 210.0 (190.0 - 220.0) TT 17.5 (17.0 - 18.0) 160.0 (150.0 - 180.0) TP-T 18.5 (17.5 20.0) 160.0 (150.0 - 170.0) P 19.5 (18.5 - 20.5) 210.0 (190.0 - 230.0) PP 35.0 (33.5 - 36.0) 120.0 (100.0 - 140.0) TP-P 20.5 (19.5 - 21.0) 170.0 (150.0 - 190.0)
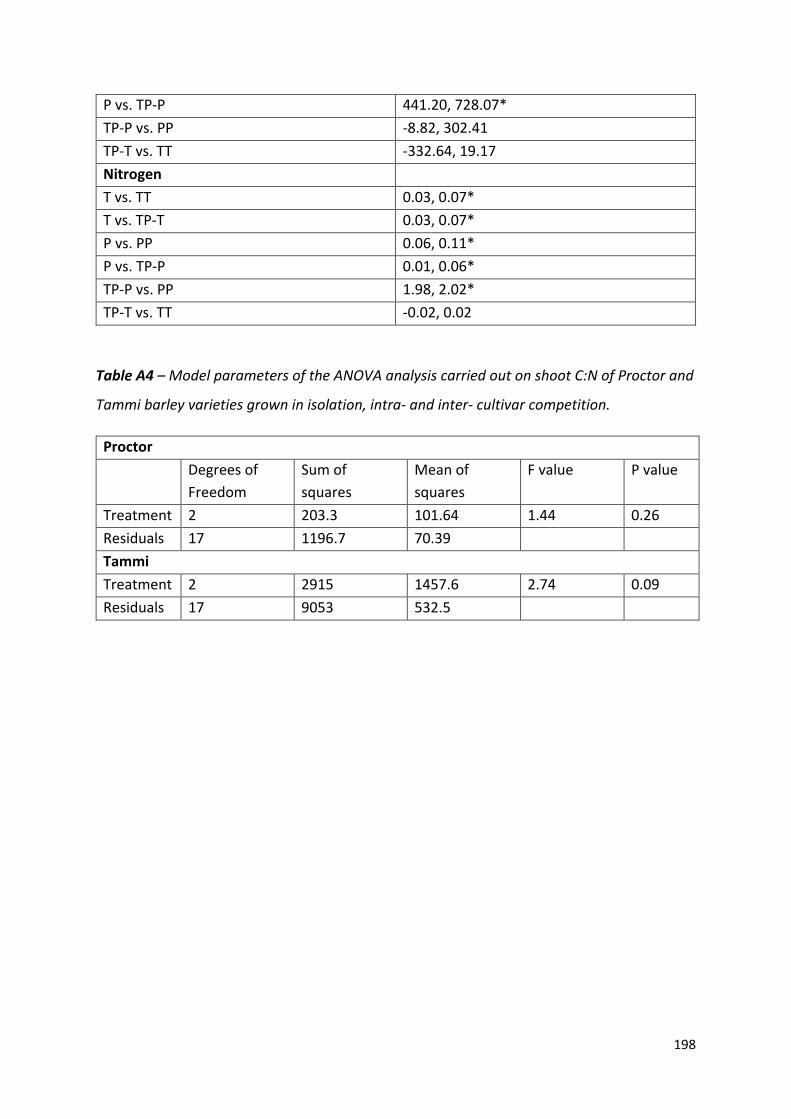
198
P vs. TP-P 441.20, 728.07* TP-P vs. PP -8.82, 302.41 TP-T vs. TT -332.64, 19.17 Nitrogen T vs. TT 0.03, 0.07* T vs. TP-T 0.03, 0.07* P vs. PP 0.06, 0.11* P vs. TP-P 0.01, 0.06* TP-P vs. PP 1.98, 2.02* TP-T vs. TT -0.02, 0.02
Table A4 – Model parameters of the ANOVA analysis carried out on shoot C:N of Proctor and
Tammi barley varieties grown in isolation, intra- and inter- cultivar competition.
Proctor Degrees of
Freedom Sum of squares
Mean of squares
F value P value
Treatment 2 203.3 101.64 1.44 0.26 Residuals 17 1196.7 70.39 Tammi Treatment 2 2915 1457.6 2.74 0.09 Residuals 17 9053 532.5
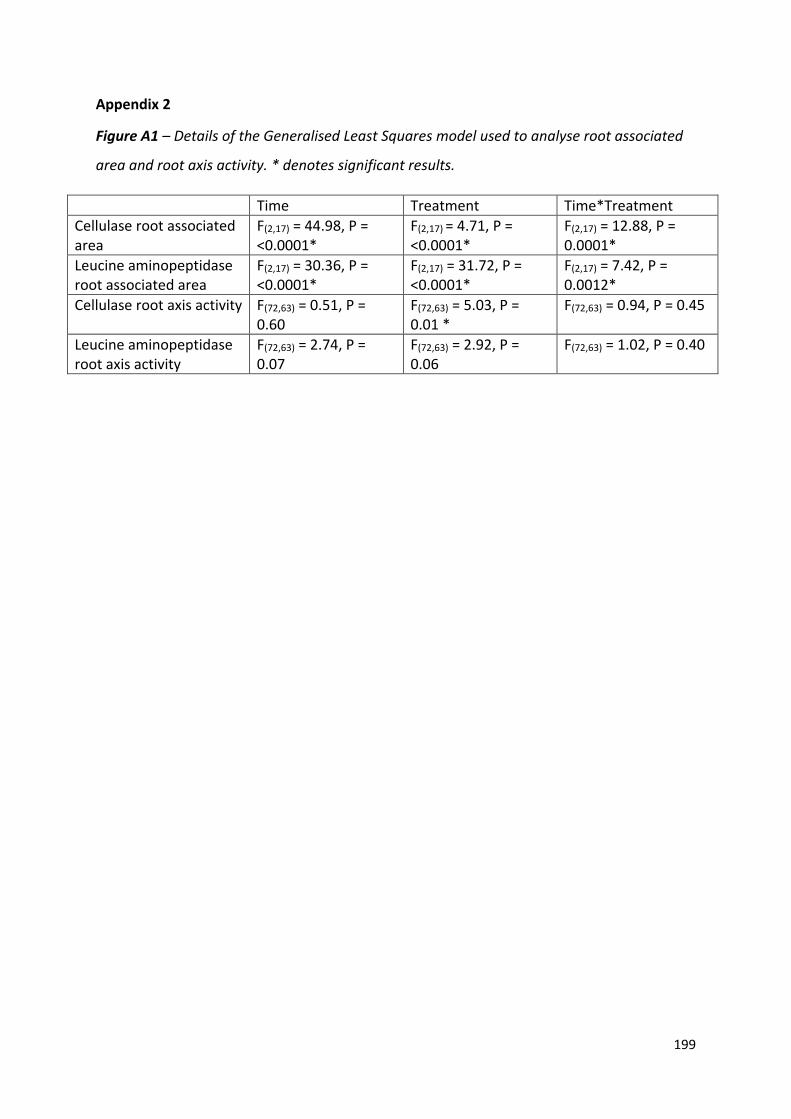
199
Appendix 2
Figure A1 – Details of the Generalised Least Squares model used to analyse root associated
area and root axis activity. * denotes significant results.
Time Treatment Time*Treatment Cellulase root associated area
F(2,17) = 44.98, P = <0.0001*
F(2,17) = 4.71, P = <0.0001*
F(2,17) = 12.88, P = 0.0001*
Leucine aminopeptidase root associated area
F(2,17) = 30.36, P = <0.0001*
F(2,17) = 31.72, P = <0.0001*
F(2,17) = 7.42, P = 0.0012*
Cellulase root axis activity F(72,63) = 0.51, P = 0.60
F(72,63) = 5.03, P = 0.01 *
F(72,63) = 0.94, P = 0.45
Leucine aminopeptidase root axis activity
F(72,63) = 2.74, P = 0.07
F(72,63) = 2.92, P = 0.06
F(72,63) = 1.02, P = 0.40
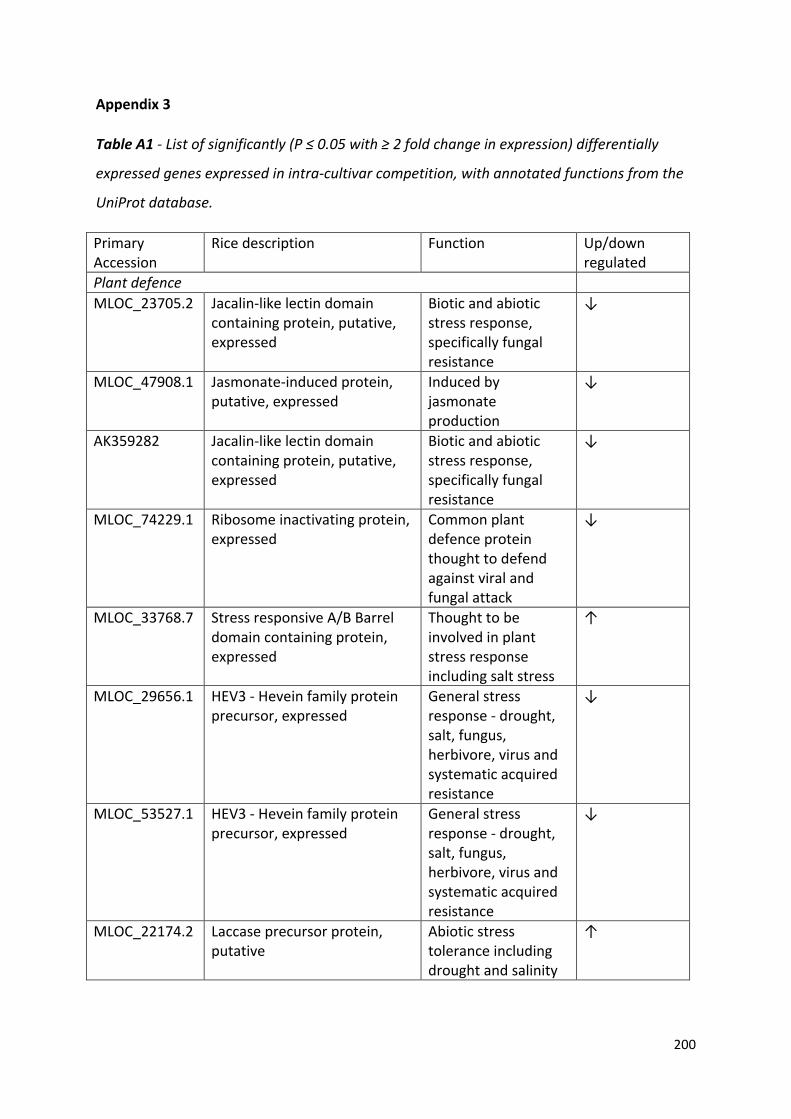
200
Appendix 3
Table A1 - List of significantly (P ≤ 0.05 with ≥ 2 fold change in expression) differentially
expressed genes expressed in intra-cultivar competition, with annotated functions from the
UniProt database.
Primary Accession
Rice description Function Up/down regulated
Plant defence MLOC_23705.2 Jacalin-like lectin domain
containing protein, putative, expressed
Biotic and abiotic stress response, specifically fungal resistance
↓
MLOC_47908.1 Jasmonate-induced protein, putative, expressed
Induced by jasmonate production
↓
AK359282 Jacalin-like lectin domain containing protein, putative, expressed
Biotic and abiotic stress response, specifically fungal resistance
↓
MLOC_74229.1 Ribosome inactivating protein, expressed
Common plant defence protein thought to defend against viral and fungal attack
↓
MLOC_33768.7 Stress responsive A/B Barrel domain containing protein, expressed
Thought to be involved in plant stress response including salt stress
↑
MLOC_29656.1 HEV3 - Hevein family protein precursor, expressed
General stress response - drought, salt, fungus, herbivore, virus and systematic acquired resistance
↓
MLOC_53527.1 HEV3 - Hevein family protein precursor, expressed
General stress response - drought, salt, fungus, herbivore, virus and systematic acquired resistance
↓
MLOC_22174.2 Laccase precursor protein, putative
Abiotic stress tolerance including drought and salinity
↑
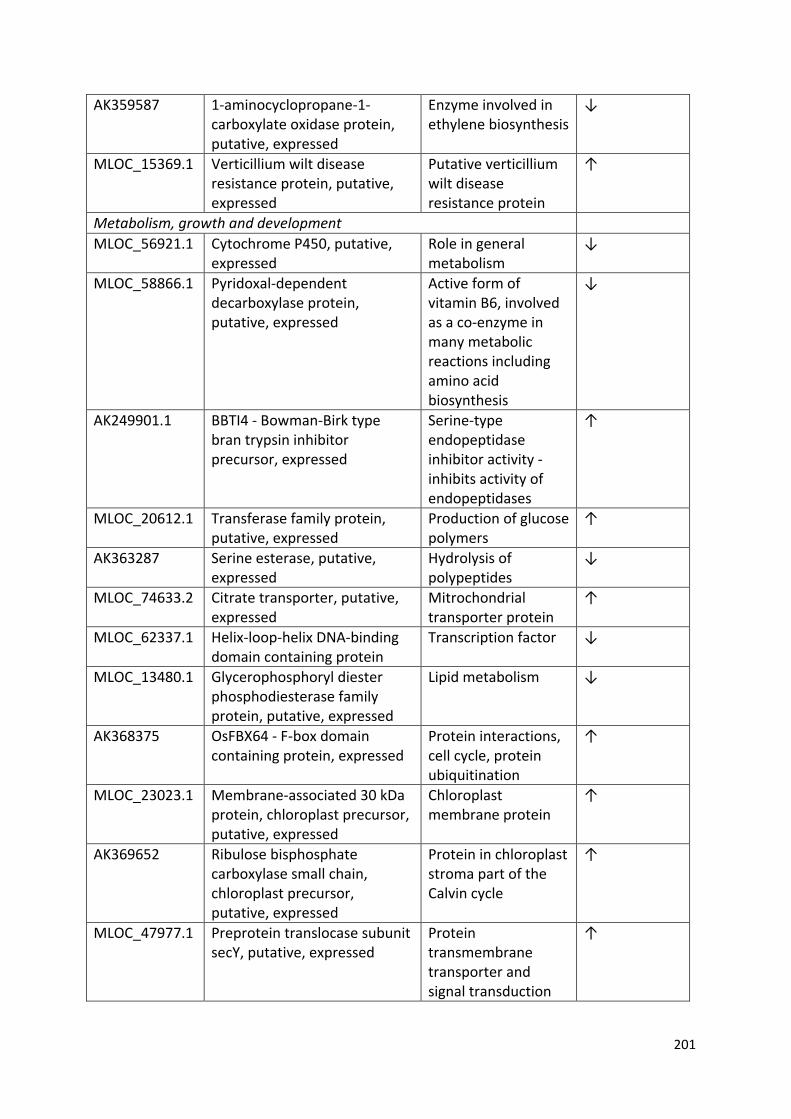
201
AK359587 1-aminocyclopropane-1-carboxylate oxidase protein, putative, expressed
Enzyme involved in ethylene biosynthesis
↓
MLOC_15369.1 Verticillium wilt disease resistance protein, putative, expressed
Putative verticillium wilt disease resistance protein
↑
Metabolism, growth and development MLOC_56921.1 Cytochrome P450, putative,
expressed Role in general metabolism
↓
MLOC_58866.1 Pyridoxal-dependent decarboxylase protein, putative, expressed
Active form of vitamin B6, involved as a co-enzyme in many metabolic reactions including amino acid biosynthesis
↓
AK249901.1 BBTI4 - Bowman-Birk type bran trypsin inhibitor precursor, expressed
Serine-type endopeptidase inhibitor activity - inhibits activity of endopeptidases
↑
MLOC_20612.1 Transferase family protein, putative, expressed
Production of glucose polymers
↑
AK363287 Serine esterase, putative, expressed
Hydrolysis of polypeptides
↓
MLOC_74633.2 Citrate transporter, putative, expressed
Mitrochondrial transporter protein
↑
MLOC_62337.1 Helix-loop-helix DNA-binding domain containing protein
Transcription factor ↓
MLOC_13480.1 Glycerophosphoryl diester phosphodiesterase family protein, putative, expressed
Lipid metabolism ↓
AK368375 OsFBX64 - F-box domain containing protein, expressed
Protein interactions, cell cycle, protein ubiquitination
↑
MLOC_23023.1 Membrane-associated 30 kDa protein, chloroplast precursor, putative, expressed
Chloroplast membrane protein
↑
AK369652 Ribulose bisphosphate carboxylase small chain, chloroplast precursor, putative, expressed
Protein in chloroplast stroma part of the Calvin cycle
↑
MLOC_47977.1 Preprotein translocase subunit secY, putative, expressed
Protein transmembrane transporter and signal transduction
↑
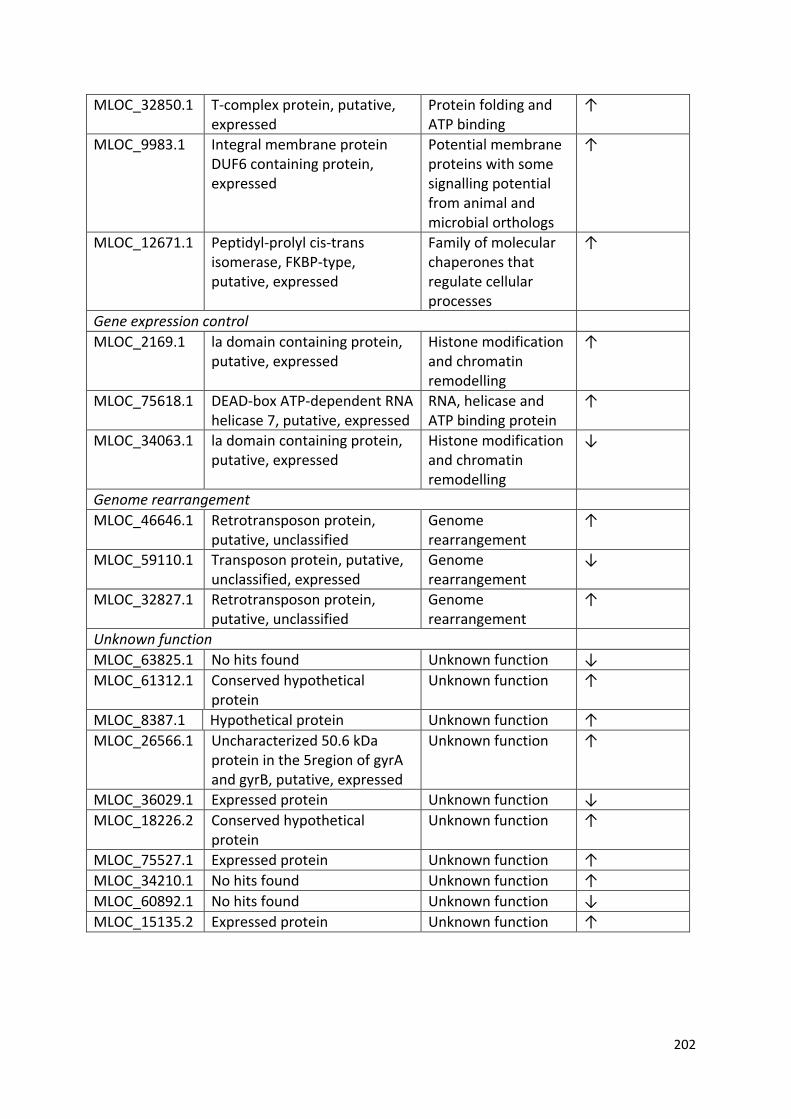
202
MLOC_32850.1 T-complex protein, putative, expressed
Protein folding and ATP binding
↑
MLOC_9983.1 Integral membrane protein DUF6 containing protein, expressed
Potential membrane proteins with some signalling potential from animal and microbial orthologs
↑
MLOC_12671.1 Peptidyl-prolyl cis-trans isomerase, FKBP-type, putative, expressed
Family of molecular chaperones that regulate cellular processes
↑
Gene expression control MLOC_2169.1 la domain containing protein,
putative, expressed Histone modification and chromatin remodelling
↑
MLOC_75618.1 DEAD-box ATP-dependent RNA helicase 7, putative, expressed
RNA, helicase and ATP binding protein
↑
MLOC_34063.1 la domain containing protein, putative, expressed
Histone modification and chromatin remodelling
↓
Genome rearrangement MLOC_46646.1 Retrotransposon protein,
putative, unclassified Genome rearrangement
↑
MLOC_59110.1 Transposon protein, putative, unclassified, expressed
Genome rearrangement
↓
MLOC_32827.1 Retrotransposon protein, putative, unclassified
Genome rearrangement
↑
Unknown function MLOC_63825.1 No hits found Unknown function ↓ MLOC_61312.1 Conserved hypothetical
protein Unknown function ↑
MLOC_8387.1 Hypothetical protein Unknown function ↑ MLOC_26566.1 Uncharacterized 50.6 kDa
protein in the 5region of gyrA and gyrB, putative, expressed
Unknown function ↑
MLOC_36029.1 Expressed protein Unknown function ↓ MLOC_18226.2 Conserved hypothetical
protein Unknown function ↑
MLOC_75527.1 Expressed protein Unknown function ↑ MLOC_34210.1 No hits found Unknown function ↑ MLOC_60892.1 No hits found Unknown function ↓ MLOC_15135.2 Expressed protein Unknown function ↑
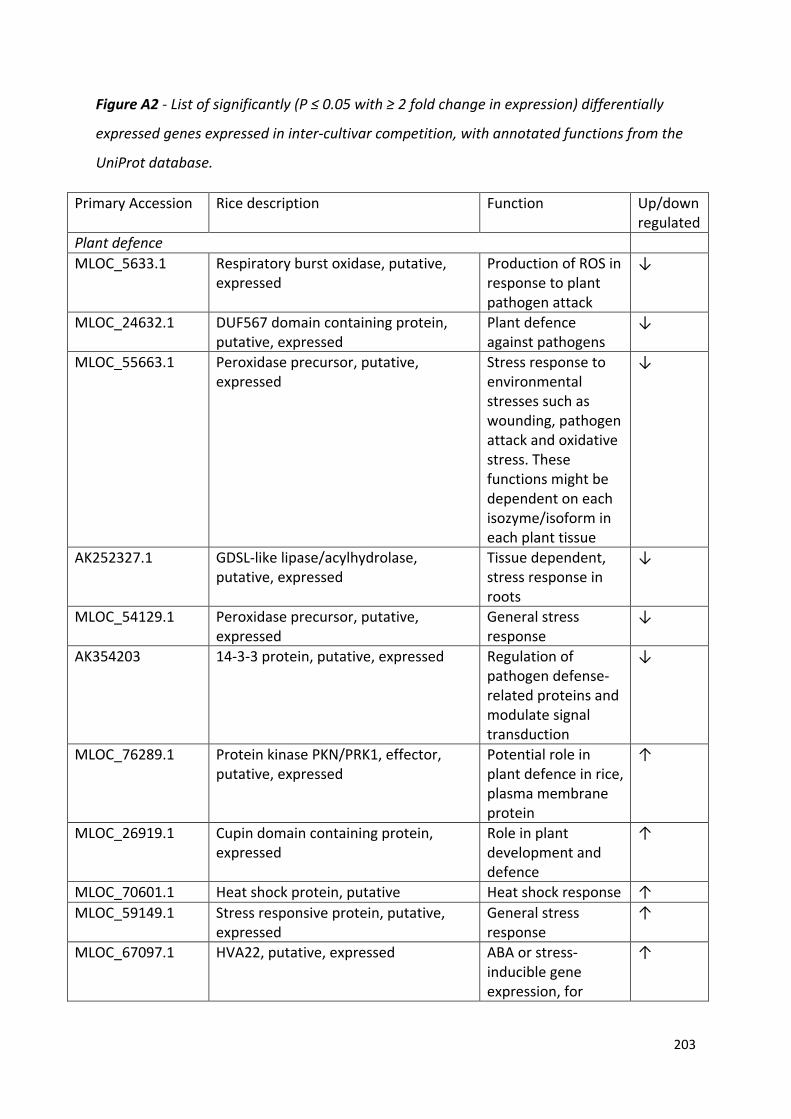
203
Figure A2 - List of significantly (P ≤ 0.05 with ≥ 2 fold change in expression) differentially
expressed genes expressed in inter-cultivar competition, with annotated functions from the
UniProt database.
Primary Accession Rice description Function Up/down regulated
Plant defence MLOC_5633.1 Respiratory burst oxidase, putative,
expressed Production of ROS in response to plant pathogen attack
↓
MLOC_24632.1 DUF567 domain containing protein, putative, expressed
Plant defence against pathogens
↓
MLOC_55663.1 Peroxidase precursor, putative, expressed
Stress response to environmental stresses such as wounding, pathogen attack and oxidative stress. These functions might be dependent on each isozyme/isoform in each plant tissue
↓
AK252327.1 GDSL-like lipase/acylhydrolase, putative, expressed
Tissue dependent, stress response in roots
↓
MLOC_54129.1 Peroxidase precursor, putative, expressed
General stress response
↓
AK354203 14-3-3 protein, putative, expressed Regulation of pathogen defense-related proteins and modulate signal transduction
↓
MLOC_76289.1 Protein kinase PKN/PRK1, effector, putative, expressed
Potential role in plant defence in rice, plasma membrane protein
↑
MLOC_26919.1 Cupin domain containing protein, expressed
Role in plant development and defence
↑
MLOC_70601.1 Heat shock protein, putative Heat shock response ↑ MLOC_59149.1 Stress responsive protein, putative,
expressed General stress response
↑
MLOC_67097.1 HVA22, putative, expressed ABA or stress-inducible gene expression, for
↑
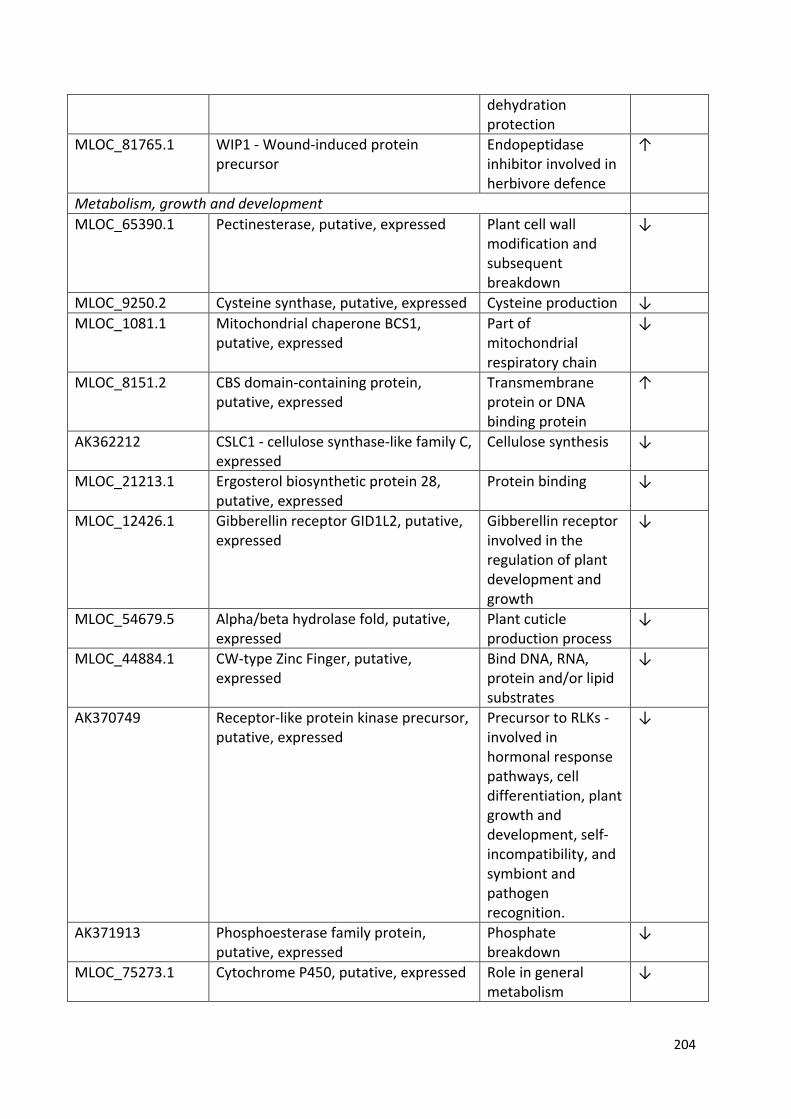
204
dehydration protection
MLOC_81765.1 WIP1 - Wound-induced protein precursor
Endopeptidase inhibitor involved in herbivore defence
↑
Metabolism, growth and development MLOC_65390.1 Pectinesterase, putative, expressed Plant cell wall
modification and subsequent breakdown
↓
MLOC_9250.2 Cysteine synthase, putative, expressed Cysteine production ↓ MLOC_1081.1 Mitochondrial chaperone BCS1,
putative, expressed Part of mitochondrial respiratory chain
↓
MLOC_8151.2 CBS domain-containing protein, putative, expressed
Transmembrane protein or DNA binding protein
↑
AK362212 CSLC1 - cellulose synthase-like family C, expressed
Cellulose synthesis ↓
MLOC_21213.1 Ergosterol biosynthetic protein 28, putative, expressed
Protein binding ↓
MLOC_12426.1 Gibberellin receptor GID1L2, putative, expressed
Gibberellin receptor involved in the regulation of plant development and growth
↓
MLOC_54679.5 Alpha/beta hydrolase fold, putative, expressed
Plant cuticle production process
↓
MLOC_44884.1 CW-type Zinc Finger, putative, expressed
Bind DNA, RNA, protein and/or lipid substrates
↓
AK370749 Receptor-like protein kinase precursor, putative, expressed
Precursor to RLKs - involved in hormonal response pathways, cell differentiation, plant growth and development, self-incompatibility, and symbiont and pathogen recognition.
↓
AK371913 Phosphoesterase family protein, putative, expressed
Phosphate breakdown
↓
MLOC_75273.1 Cytochrome P450, putative, expressed Role in general metabolism
↓

205
MLOC_75265.1 OsIAA27 - Auxin-responsive Aux/IAA gene family member, expressed
Regulation of Auxin production
↓
AK365257 Receptor-like kinase ARK1AS, putative, expressed
ATP, polysaccharide binding and protein kinase activity
↓
MLOC_75041.1 COBRA, putative, expressed Key regulator of the orientation of cell expansion in the root
↓
MLOC_44152.1 Serine/threonine-protein kinase receptor precursor, putative, expressed
Precursor to receptors involved in protein phosphorylation
↓
MLOC_71416.1 BBTI12 - Bowman-Birk type bran trypsin inhibitor precursor, expressed
Stops endopeptidase activity
↓
MLOC_36591.3 Resistance protein LR10, putative ADP binding protein ↓ MLOC_3978.1 OsSub3 - Putative Subtilisin
homologue, expressed Protease activity ↓
AK357656 OsPOP8 - Putative Prolyl Oligopeptidase homologue, expressed
Peptidase activity ↓
MLOC_39668.1 BBTI8 - Bowman-Birk type bran trypsin inhibitor precursor, expressed
Stops endopeptidase activity
↓
MLOC_56507.3 MLO domain containing protein, putative, expressed
Plant integral membrane proteins, Mlo proteins function as G-protein coupled receptors in plants
↓
MLOC_60267.2 Kelch repeat protein, putative, expressed
Protein degradation ↓
MLOC_78778.1 Cytokinin-N-glucosyltransferase 1, putative, expressed
glucose transferase ↓
AK365385 Hydrolase, alpha/beta fold family domain containing protein, expressed
Hydrogen removal from molecules, diverse role in plant metabolism
↓
MLOC_73656.2 BBTI13 - Bowman-Birk type bran trypsin inhibitor precursor, expressed
Stops endopeptidase activity
↓
MLOC_69485.1 S-locus-like receptor protein kinase, putative, expressed
ATP, polysaccharide binding and protein kinase activity
↓
AK363181 Cytochrome P450, putative, expressed General role in metabolism
↑
AK370360 BBTI13 - Bowman-Birk type bran trypsin inhibitor precursor, expressed
Stops endopeptidase activity
↑
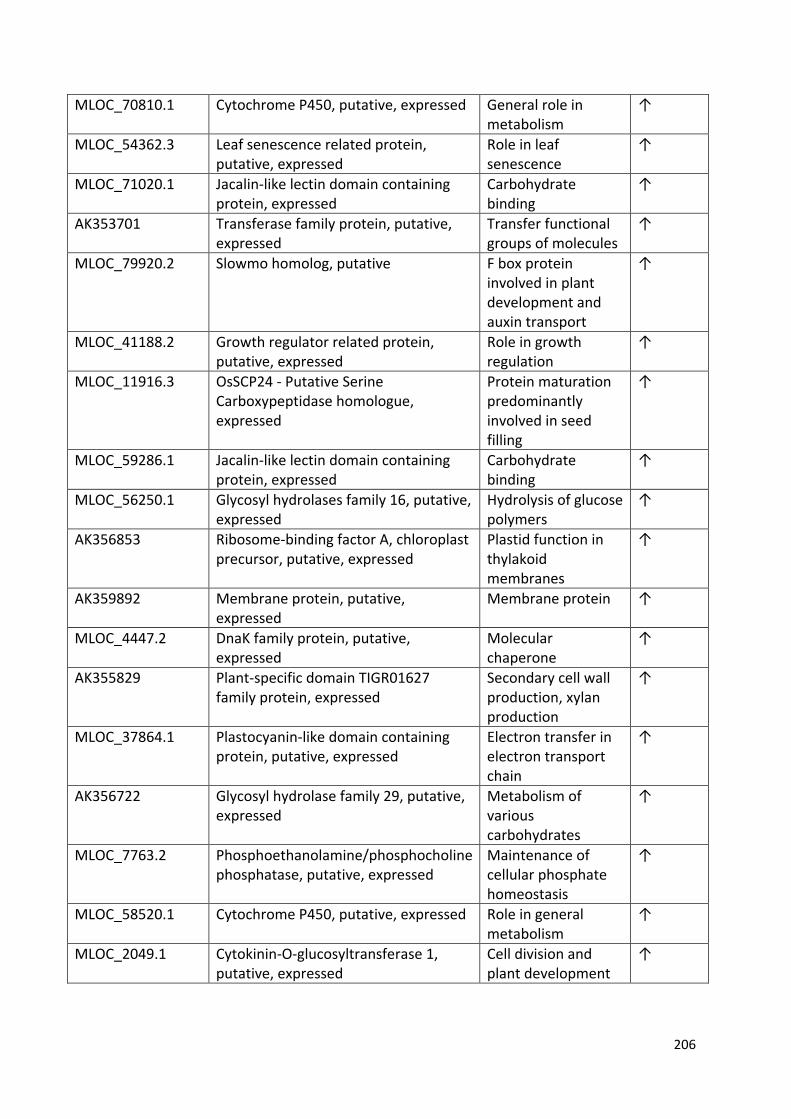
206
MLOC_70810.1 Cytochrome P450, putative, expressed General role in metabolism
↑
MLOC_54362.3 Leaf senescence related protein, putative, expressed
Role in leaf senescence
↑
MLOC_71020.1 Jacalin-like lectin domain containing protein, expressed
Carbohydrate binding
↑
AK353701 Transferase family protein, putative, expressed
Transfer functional groups of molecules
↑
MLOC_79920.2 Slowmo homolog, putative F box protein involved in plant development and auxin transport
↑
MLOC_41188.2 Growth regulator related protein, putative, expressed
Role in growth regulation
↑
MLOC_11916.3 OsSCP24 - Putative Serine Carboxypeptidase homologue, expressed
Protein maturation predominantly involved in seed filling
↑
MLOC_59286.1 Jacalin-like lectin domain containing protein, expressed
Carbohydrate binding
↑
MLOC_56250.1 Glycosyl hydrolases family 16, putative, expressed
Hydrolysis of glucose polymers
↑
AK356853 Ribosome-binding factor A, chloroplast precursor, putative, expressed
Plastid function in thylakoid membranes
↑
AK359892 Membrane protein, putative, expressed
Membrane protein ↑
MLOC_4447.2 DnaK family protein, putative, expressed
Molecular chaperone
↑
AK355829 Plant-specific domain TIGR01627 family protein, expressed
Secondary cell wall production, xylan production
↑
MLOC_37864.1 Plastocyanin-like domain containing protein, putative, expressed
Electron transfer in electron transport chain
↑
AK356722 Glycosyl hydrolase family 29, putative, expressed
Metabolism of various carbohydrates
↑
MLOC_7763.2 Phosphoethanolamine/phosphocholine phosphatase, putative, expressed
Maintenance of cellular phosphate homeostasis
↑
MLOC_58520.1 Cytochrome P450, putative, expressed Role in general metabolism
↑
MLOC_2049.1 Cytokinin-O-glucosyltransferase 1, putative, expressed
Cell division and plant development
↑
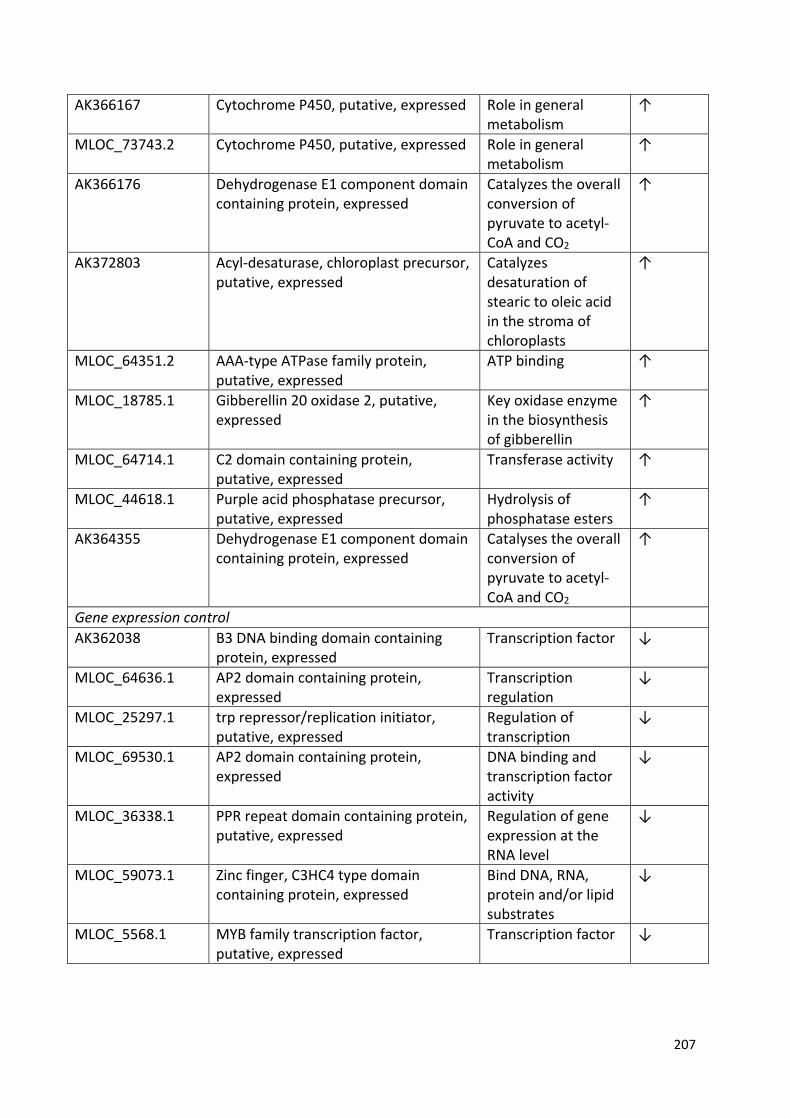
207
AK366167 Cytochrome P450, putative, expressed Role in general metabolism
↑
MLOC_73743.2 Cytochrome P450, putative, expressed Role in general metabolism
↑
AK366176 Dehydrogenase E1 component domain containing protein, expressed
Catalyzes the overall conversion of pyruvate to acetyl-CoA and CO2
↑
AK372803 Acyl-desaturase, chloroplast precursor, putative, expressed
Catalyzes desaturation of stearic to oleic acid in the stroma of chloroplasts
↑
MLOC_64351.2 AAA-type ATPase family protein, putative, expressed
ATP binding ↑
MLOC_18785.1 Gibberellin 20 oxidase 2, putative, expressed
Key oxidase enzyme in the biosynthesis of gibberellin
↑
MLOC_64714.1 C2 domain containing protein, putative, expressed
Transferase activity ↑
MLOC_44618.1 Purple acid phosphatase precursor, putative, expressed
Hydrolysis of phosphatase esters
↑
AK364355 Dehydrogenase E1 component domain containing protein, expressed
Catalyses the overall conversion of pyruvate to acetyl-CoA and CO2
↑
Gene expression control AK362038 B3 DNA binding domain containing
protein, expressed Transcription factor ↓
MLOC_64636.1 AP2 domain containing protein, expressed
Transcription regulation
↓
MLOC_25297.1 trp repressor/replication initiator, putative, expressed
Regulation of transcription
↓
MLOC_69530.1 AP2 domain containing protein, expressed
DNA binding and transcription factor activity
↓
MLOC_36338.1 PPR repeat domain containing protein, putative, expressed
Regulation of gene expression at the RNA level
↓
MLOC_59073.1 Zinc finger, C3HC4 type domain containing protein, expressed
Bind DNA, RNA, protein and/or lipid substrates
↓
MLOC_5568.1 MYB family transcription factor, putative, expressed
Transcription factor ↓
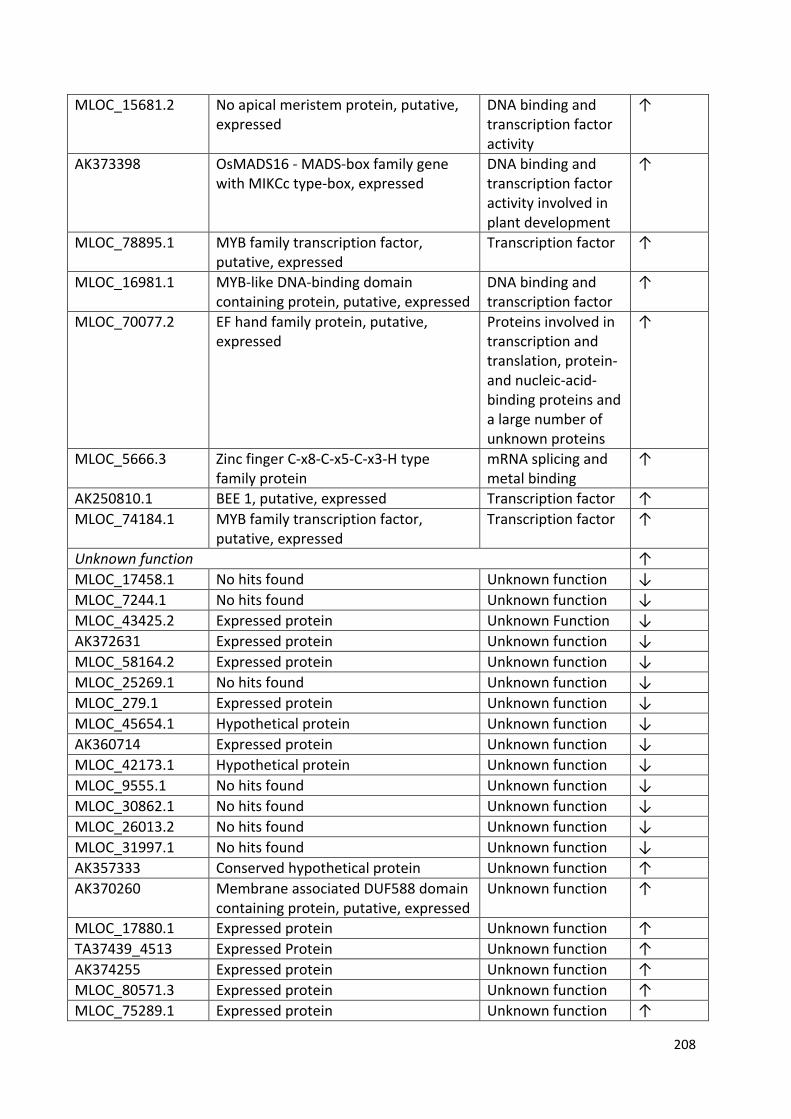
208
MLOC_15681.2 No apical meristem protein, putative, expressed
DNA binding and transcription factor activity
↑
AK373398 OsMADS16 - MADS-box family gene with MIKCc type-box, expressed
DNA binding and transcription factor activity involved in plant development
↑
MLOC_78895.1 MYB family transcription factor, putative, expressed
Transcription factor ↑
MLOC_16981.1 MYB-like DNA-binding domain containing protein, putative, expressed
DNA binding and transcription factor
↑
MLOC_70077.2 EF hand family protein, putative, expressed
Proteins involved in transcription and translation, protein- and nucleic-acid-binding proteins and a large number of unknown proteins
↑
MLOC_5666.3 Zinc finger C-x8-C-x5-C-x3-H type family protein
mRNA splicing and metal binding
↑
AK250810.1 BEE 1, putative, expressed Transcription factor ↑ MLOC_74184.1 MYB family transcription factor,
putative, expressed Transcription factor ↑
Unknown function ↑ MLOC_17458.1 No hits found Unknown function ↓ MLOC_7244.1 No hits found Unknown function ↓ MLOC_43425.2 Expressed protein Unknown Function ↓ AK372631 Expressed protein Unknown function ↓ MLOC_58164.2 Expressed protein Unknown function ↓ MLOC_25269.1 No hits found Unknown function ↓ MLOC_279.1 Expressed protein Unknown function ↓ MLOC_45654.1 Hypothetical protein Unknown function ↓ AK360714 Expressed protein Unknown function ↓ MLOC_42173.1 Hypothetical protein Unknown function ↓ MLOC_9555.1 No hits found Unknown function ↓ MLOC_30862.1 No hits found Unknown function ↓ MLOC_26013.2 No hits found Unknown function ↓ MLOC_31997.1 No hits found Unknown function ↓ AK357333 Conserved hypothetical protein Unknown function ↑ AK370260 Membrane associated DUF588 domain
containing protein, putative, expressed Unknown function ↑
MLOC_17880.1 Expressed protein Unknown function ↑ TA37439_4513 Expressed Protein Unknown function ↑ AK374255 Expressed protein Unknown function ↑ MLOC_80571.3 Expressed protein Unknown function ↑ MLOC_75289.1 Expressed protein Unknown function ↑
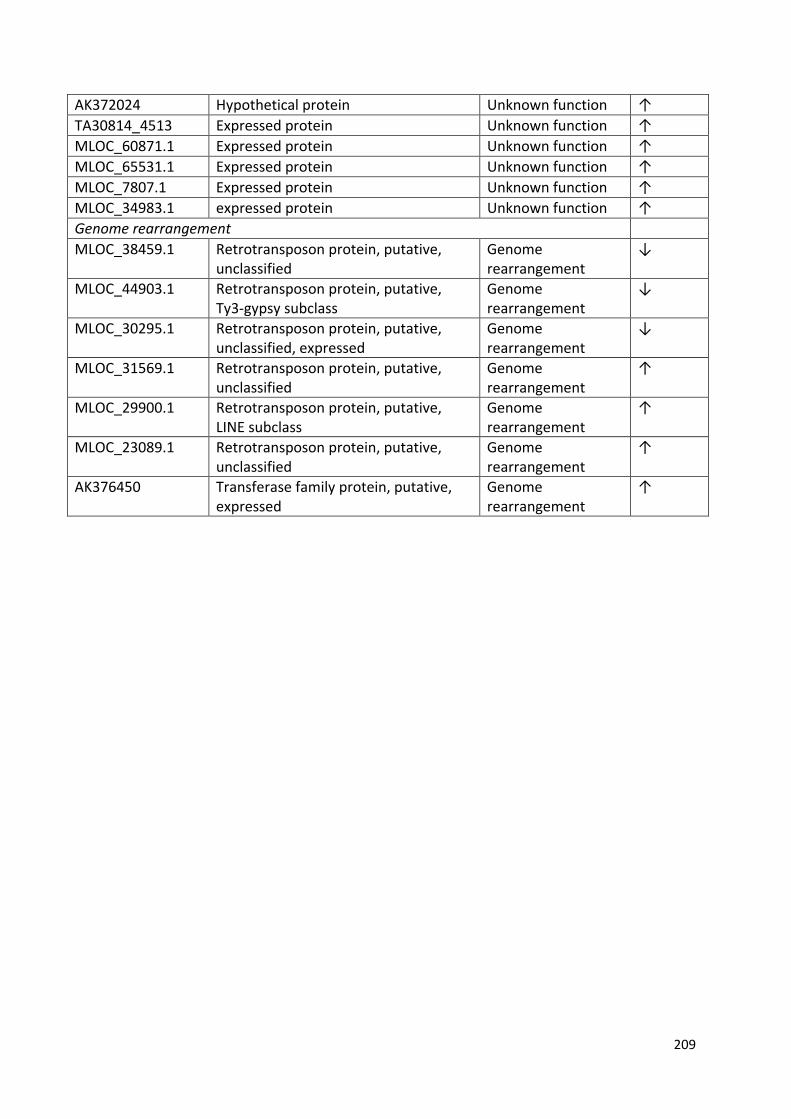
209
AK372024 Hypothetical protein Unknown function ↑ TA30814_4513 Expressed protein Unknown function ↑ MLOC_60871.1 Expressed protein Unknown function ↑ MLOC_65531.1 Expressed protein Unknown function ↑ MLOC_7807.1 Expressed protein Unknown function ↑ MLOC_34983.1 expressed protein Unknown function ↑ Genome rearrangement MLOC_38459.1 Retrotransposon protein, putative,
unclassified Genome rearrangement
↓
MLOC_44903.1 Retrotransposon protein, putative, Ty3-gypsy subclass
Genome rearrangement
↓
MLOC_30295.1 Retrotransposon protein, putative, unclassified, expressed
Genome rearrangement
↓
MLOC_31569.1 Retrotransposon protein, putative, unclassified
Genome rearrangement
↑
MLOC_29900.1 Retrotransposon protein, putative, LINE subclass
Genome rearrangement
↑
MLOC_23089.1 Retrotransposon protein, putative, unclassified
Genome rearrangement
↑
AK376450 Transferase family protein, putative, expressed
Genome rearrangement
↑
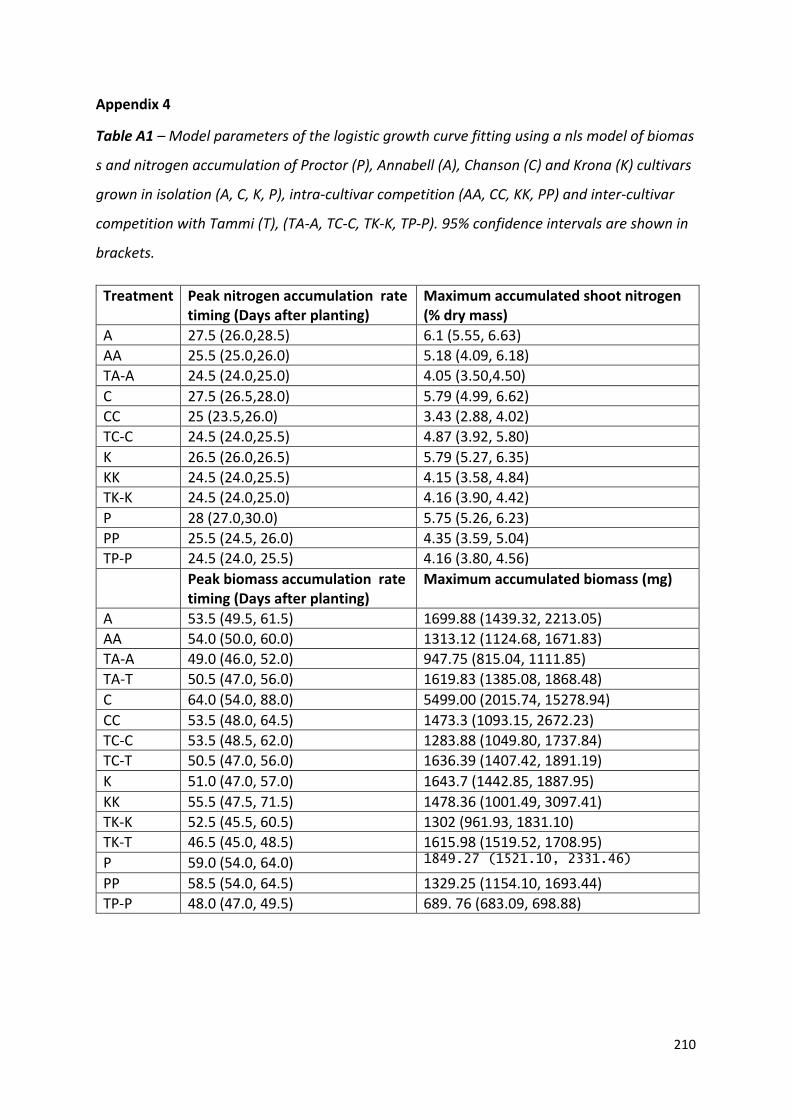
210
Appendix 4
Table A1 – Model parameters of the logistic growth curve fitting using a nls model of biomas
s and nitrogen accumulation of Proctor (P), Annabell (A), Chanson (C) and Krona (K) cultivars
grown in isolation (A, C, K, P), intra-cultivar competition (AA, CC, KK, PP) and inter-cultivar
competition with Tammi (T), (TA-A, TC-C, TK-K, TP-P). 95% confidence intervals are shown in
brackets.
Treatment Peak nitrogen accumulation rate timing (Days after planting)
Maximum accumulated shoot nitrogen (% dry mass)
A 27.5 (26.0,28.5) 6.1 (5.55, 6.63) AA 25.5 (25.0,26.0) 5.18 (4.09, 6.18) TA-A 24.5 (24.0,25.0) 4.05 (3.50,4.50) C 27.5 (26.5,28.0) 5.79 (4.99, 6.62) CC 25 (23.5,26.0) 3.43 (2.88, 4.02) TC-C 24.5 (24.0,25.5) 4.87 (3.92, 5.80) K 26.5 (26.0,26.5) 5.79 (5.27, 6.35) KK 24.5 (24.0,25.5) 4.15 (3.58, 4.84) TK-K 24.5 (24.0,25.0) 4.16 (3.90, 4.42) P 28 (27.0,30.0) 5.75 (5.26, 6.23) PP 25.5 (24.5, 26.0) 4.35 (3.59, 5.04) TP-P 24.5 (24.0, 25.5) 4.16 (3.80, 4.56)
Peak biomass accumulation rate timing (Days after planting)
Maximum accumulated biomass (mg)
A 53.5 (49.5, 61.5) 1699.88 (1439.32, 2213.05) AA 54.0 (50.0, 60.0) 1313.12 (1124.68, 1671.83) TA-A 49.0 (46.0, 52.0) 947.75 (815.04, 1111.85) TA-T 50.5 (47.0, 56.0) 1619.83 (1385.08, 1868.48) C 64.0 (54.0, 88.0) 5499.00 (2015.74, 15278.94) CC 53.5 (48.0, 64.5) 1473.3 (1093.15, 2672.23) TC-C 53.5 (48.5, 62.0) 1283.88 (1049.80, 1737.84) TC-T 50.5 (47.0, 56.0) 1636.39 (1407.42, 1891.19) K 51.0 (47.0, 57.0) 1643.7 (1442.85, 1887.95) KK 55.5 (47.5, 71.5) 1478.36 (1001.49, 3097.41) TK-K 52.5 (45.5, 60.5) 1302 (961.93, 1831.10) TK-T 46.5 (45.0, 48.5) 1615.98 (1519.52, 1708.95) P 59.0 (54.0, 64.0) 1849.27 (1521.10, 2331.46)
PP 58.5 (54.0, 64.5) 1329.25 (1154.10, 1693.44) TP-P 48.0 (47.0, 49.5) 689. 76 (683.09, 698.88)
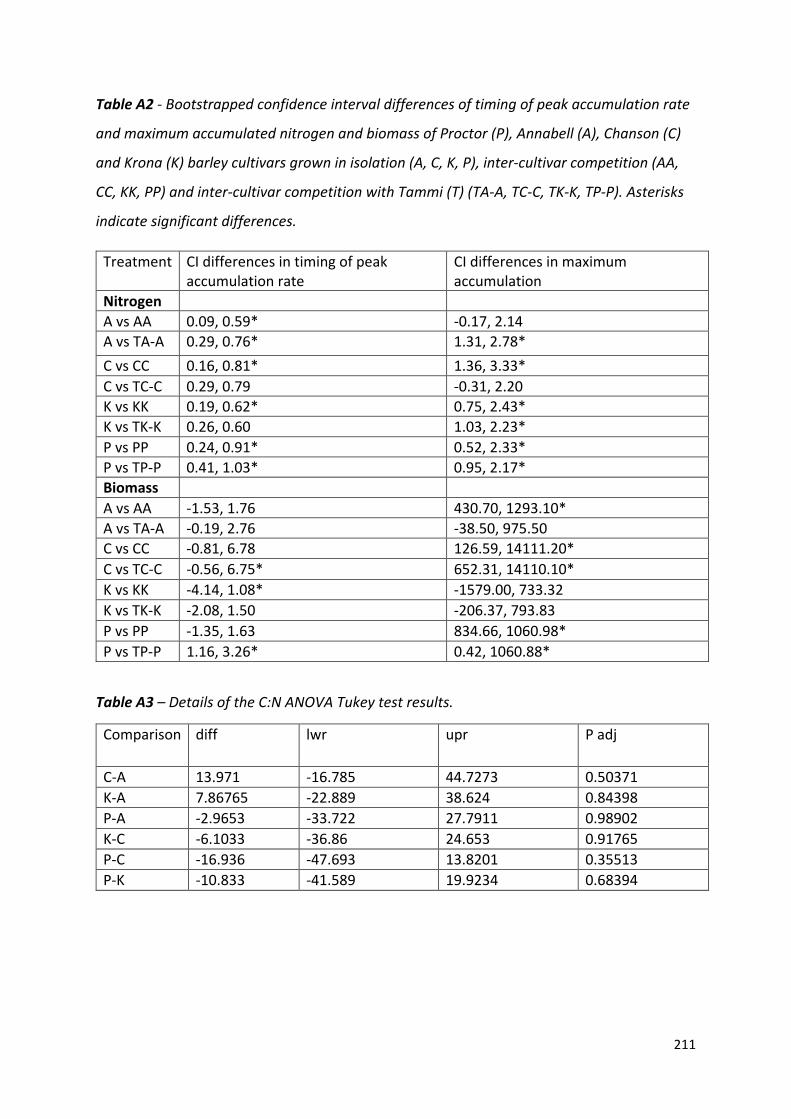
211
Table A2 - Bootstrapped confidence interval differences of timing of peak accumulation rate
and maximum accumulated nitrogen and biomass of Proctor (P), Annabell (A), Chanson (C)
and Krona (K) barley cultivars grown in isolation (A, C, K, P), inter-cultivar competition (AA,
CC, KK, PP) and inter-cultivar competition with Tammi (T) (TA-A, TC-C, TK-K, TP-P). Asterisks
indicate significant differences.
Treatment CI differences in timing of peak accumulation rate
CI differences in maximum accumulation
Nitrogen A vs AA 0.09, 0.59* -0.17, 2.14 A vs TA-A 0.29, 0.76* 1.31, 2.78* C vs CC 0.16, 0.81* 1.36, 3.33* C vs TC-C 0.29, 0.79 -0.31, 2.20 K vs KK 0.19, 0.62* 0.75, 2.43* K vs TK-K 0.26, 0.60 1.03, 2.23* P vs PP 0.24, 0.91* 0.52, 2.33* P vs TP-P 0.41, 1.03* 0.95, 2.17* Biomass
A vs AA -1.53, 1.76 430.70, 1293.10* A vs TA-A -0.19, 2.76 -38.50, 975.50 C vs CC -0.81, 6.78 126.59, 14111.20* C vs TC-C -0.56, 6.75* 652.31, 14110.10* K vs KK -4.14, 1.08* -1579.00, 733.32 K vs TK-K -2.08, 1.50 -206.37, 793.83 P vs PP -1.35, 1.63 834.66, 1060.98* P vs TP-P 1.16, 3.26* 0.42, 1060.88*
Table A3 – Details of the C:N ANOVA Tukey test results.
Comparison diff lwr upr P adj
C-A 13.971 -16.785 44.7273 0.50371 K-A 7.86765 -22.889 38.624 0.84398 P-A -2.9653 -33.722 27.7911 0.98902 K-C -6.1033 -36.86 24.653 0.91765 P-C -16.936 -47.693 13.8201 0.35513 P-K -10.833 -41.589 19.9234 0.68394

212
Published papers
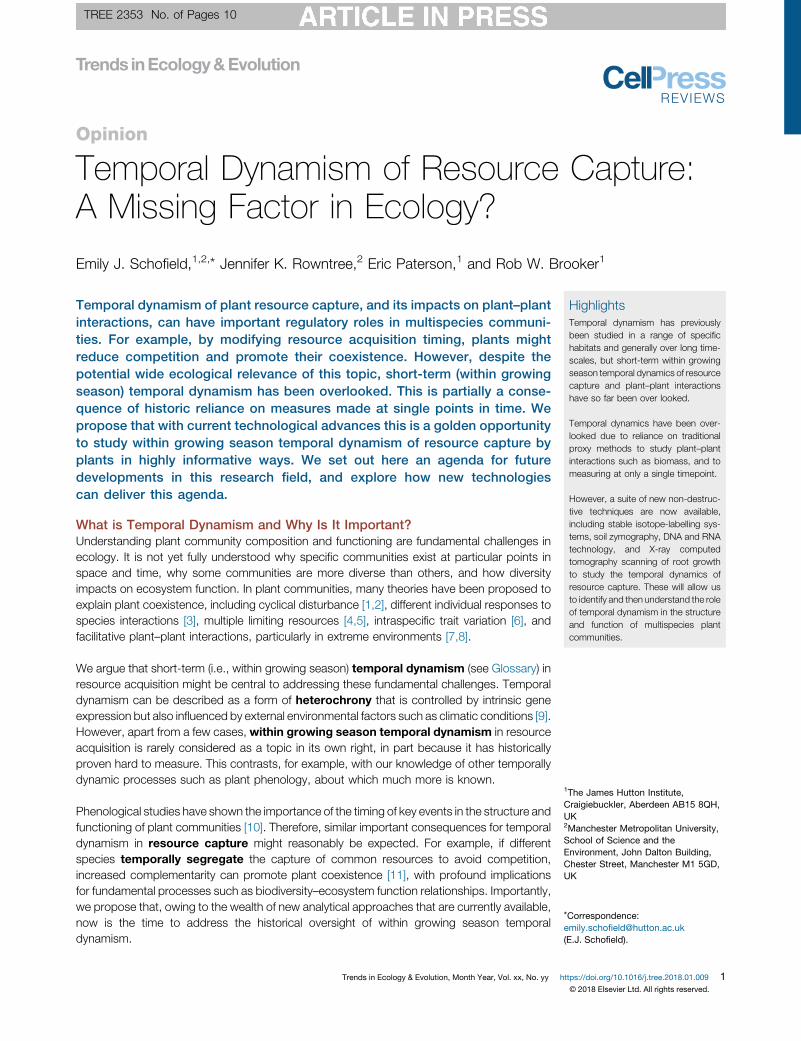
TREE 2353 No. of Pages 10
Opinion
Temporal Dynamism of Resource Capture:A Missing Factor in Ecology?
Emily J. Schofield,1,2,* Jennifer K. Rowntree,2 Eric Paterson,1 and Rob W. Brooker1
HighlightsTemporal dynamism has previouslybeen studied in a range of specifichabitats and generally over long time-scales, but short-term within growingseason temporal dynamics of resourcecapture and plant–plant interactionshave so far been over looked.
Temporal dynamics have been over-looked due to reliance on traditionalproxy methods to study plant–plantinteractions such as biomass, and tomeasuring at only a single timepoint.
However, a suite of new non-destruc-tive techniques are now available,including stable isotope-labelling sys-tems, soil zymography, DNA and RNAtechnology, and X-ray computedtomography scanning of root growthto study the temporal dynamics ofresource capture. These will allow usto identify and then understand the roleof temporal dynamism in the structureand function of multispecies plantcommunities.
1The James Hutton Institute,Craigiebuckler, Aberdeen AB15 8QH,UK2Manchester Metropolitan University,School of Science and theEnvironment, John Dalton Building,Chester Street, Manchester M1 5GD,UK
*Correspondence:[email protected](E.J. Schofield).
Temporal dynamism of plant resource capture, and its impacts on plant–plantinteractions, can have important regulatory roles in multispecies communi-ties. For example, by modifying resource acquisition timing, plants mightreduce competition and promote their coexistence. However, despite thepotential wide ecological relevance of this topic, short-term (within growingseason) temporal dynamism has been overlooked. This is partially a conse-quence of historic reliance on measures made at single points in time. Wepropose that with current technological advances this is a golden opportunityto study within growing season temporal dynamism of resource capture byplants in highly informative ways. We set out here an agenda for futuredevelopments in this research field, and explore how new technologiescan deliver this agenda.
What is Temporal Dynamism and Why Is It Important?Understanding plant community composition and functioning are fundamental challenges inecology. It is not yet fully understood why specific communities exist at particular points inspace and time, why some communities are more diverse than others, and how diversityimpacts on ecosystem function. In plant communities, many theories have been proposed toexplain plant coexistence, including cyclical disturbance [1,2], different individual responses tospecies interactions [3], multiple limiting resources [4,5], intraspecific trait variation [6], andfacilitative plant–plant interactions, particularly in extreme environments [7,8].
We argue that short-term (i.e., within growing season) temporal dynamism (see Glossary) inresource acquisition might be central to addressing these fundamental challenges. Temporaldynamism can be described as a form of heterochrony that is controlled by intrinsic geneexpression but also influenced by external environmental factors such as climatic conditions [9].However, apart from a few cases,within growing season temporal dynamism in resourceacquisition is rarely considered as a topic in its own right, in part because it has historicallyproven hard to measure. This contrasts, for example, with our knowledge of other temporallydynamic processes such as plant phenology, about which much more is known.
Phenological studies have shown the importance of the timing of key events in the structure andfunctioning of plant communities [10]. Therefore, similar important consequences for temporaldynamism in resource capture might reasonably be expected. For example, if differentspecies temporally segregate the capture of common resources to avoid competition,increased complementarity can promote plant coexistence [11], with profound implicationsfor fundamental processes such as biodiversity–ecosystem function relationships. Importantly,we propose that, owing to the wealth of new analytical approaches that are currently available,now is the time to address the historical oversight of within growing season temporaldynamism.
Trends in Ecology & Evolution, Month Year, Vol. xx, No. yy https://doi.org/10.1016/j.tree.2018.01.009 1© 2018 Elsevier Ltd. All rights reserved.
TREE 2353 No. of Pages 10
GlossaryHeterochrony: a change in thetiming and rate of a developmentalprocess within an organismcompared to an ancestral species,including the onset and duration offlowering, leaf production, andinternodal length [9].Resource capture: the acquisitionof resources, including nutrient,water, and light, by a plant. This iscommonly expressed as a rate,namely units of resource captureover a period of time.Soil zymography: non-destructivemethod to measure chitinase,cellulase, or nitrogen mineralisationhotspots at a fine spatial resolution inthe soil. Useful for studying changesin the location and intensity ofenzymatic activity over time.Temporal dynamism: variationthrough time in the rate or effect of aparticular process. For example, thiscould be variation in the per unitbiomass capture by a plant of soilnutrients or water, or the extent towhich neighbouring plants competewith each other (which might itselfresult from temporal dynamism inresource capture by individuals).Such temporal dynamism can bedriven by external factors (changesthrough time in climate or resourceavailability) or intrinsic factors (e.g.,plant developmental stage).Temporal segregation: a shift inthe timing of a process in responseto a neighbouring individual.Commonly observed in animalfeeding, it limits niche overlap andpromotes coexistence. Some nicheoverlap is still to be expected, butdirect resource competition isreduced.Within growing season temporaldynamism: variation through time,but within a given growing season, inthe rate or effect of a particularprocess. Such variation is distinctfrom interannual variation, whichmight be caused by factors such asvariation in climate between growingseasons.
Before considering these new opportunities, we examine previous studies of temporal dyna-mism, with a focus on resource capture. We discuss the limitations of, and lessons learnedfrom, previous studies and how they can form the basis of a future research agenda. We thenfocus on new experimental approaches, considering how these can address current knowl-edge gaps, and discuss the wider relevance of this subject area to ecology.
Past Studies of Temporal Dynamism in Plant CommunitiesPrevious research provides clear examples of how temporal dynamism of ecological processescan regulate thestructureand functioningofplant communities.Arguably, oneof thebest-studiedexamples is plant–pollinator interaction dynamics. Pollinators vary the plant species visitedinterannually, which promotes coexistence in species-rich communities [12,13]. Other examplesinvolve temporally dynamic resourcecapture; in arid environments, temporal dynamismhasbeenfound in thegrowth responseof plants to erratic inputs ofwater [14], dependingonboth the timingof thewater input in the growing season and the time since the previouswater input [15]. In alpinesystems, nutrient turnover is temporally dynamic, withmineralisation occurring throughoutwinter[16], and spring microbial turnover then providing nutrients to plants [17].
Such temporal dynamics are not only of academic interest – they can play a central role inregulating the impacts of key environmental change drivers. For example, one way non-nativespecies can become invasive is by occupying a vacant niche [18]. Occupying a temporal nicheleft vacant by the native plant community could allow the invasive species to capture nutrients ata time of reduced competition. It may appear that in some cases invasive species take over aniche from native species. However, it is unclear whether invasive species establishmentdepends on the exploitation of a temporal niche gap. Although phenological differencesbetween native and invasive species have been shown [16], the underlying role of withingrowing season temporal dynamism in nutrient capture has yet to be demonstrated (probablyfor the reasons we discuss below). A similar example is the phenology of hemiparasitic plants.The life cycle of many hemiparasites is shortened relative to its hosts, influencing nitrogencycling with earlier leaf fall than the host community [19,20]. Early leaf fall provides an input ofnitrogen to the host community when it becomes limited [21]. Here the rate of water andnitrogen uptake by R. minor parasitizing Hordeum vulgare (barley) has received attention [22],but the temporal dynamics of this interaction have yet to be explored.
These examples, only a selection from the many that could be listed, demonstrate the likelyimportance of temporal dynamism of resource capture by plants. Far fewer studies have soughtto measure this process directly. An important example is the work by Trinder et al. which useda series of destructive harvests to examine the temporal dynamics of nitrogen capture andbiomass accumulation of Dactylis glomerata (cock’s foot) and Plantago lanceolata (ribwortplantain). Trinder et al. found that, in response to interspecific competition, both species shiftedthe timing of themaximum rate of biomass accumulation and nitrogen capture by up to 17 days[23]. The species diverged the timing of these resource capture processes in ways that possiblyreduce direct competition. However, it is notable that this type of study, looking explicitly at thetemporal dynamism of resource capture, is to the best of our knowledge extremely rare.
Why Does It Matter that Temporal Dynamism Has Been Overlooked?Many of the fundamental processes and properties of terrestrial communities are governed bythe outcome of plant–plant interactions [24]. However, despite a huge amount of work onplant–plant interactions, especially competition, there are still unanswered questions about therole of plant–plant interactions in governing plant community composition.
2 Trends in Ecology & Evolution, Month Year, Vol. xx, No. yy
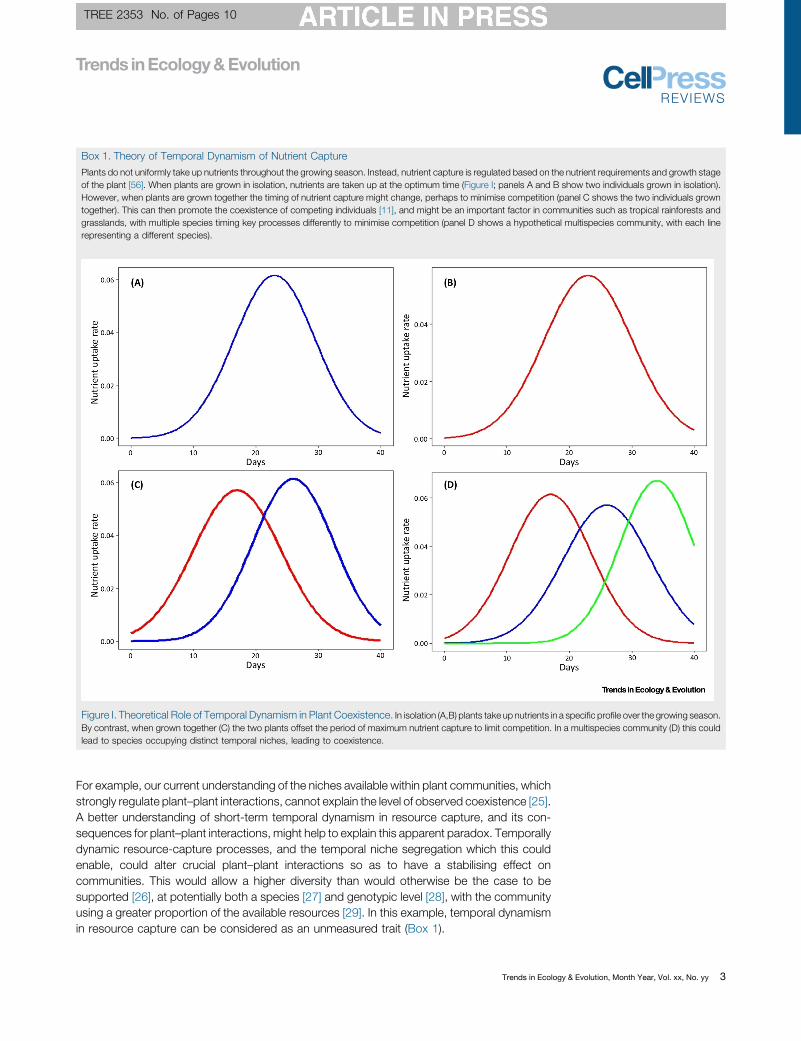
TREE 2353 No. of Pages 10
Box 1. Theory of Temporal Dynamism of Nutrient Capture
Plants do not uniformly take up nutrients throughout the growing season. Instead, nutrient capture is regulated based on the nutrient requirements and growth stageof the plant [56]. When plants are grown in isolation, nutrients are taken up at the optimum time (Figure I; panels A and B show two individuals grown in isolation).However, when plants are grown together the timing of nutrient capture might change, perhaps to minimise competition (panel C shows the two individuals growntogether). This can then promote the coexistence of competing individuals [11], and might be an important factor in communities such as tropical rainforests andgrasslands, with multiple species timing key processes differently to minimise competition (panel D shows a hypothetical multispecies community, with each linerepresenting a different species).
Figure I. Theoretical Role of Temporal Dynamism in Plant Coexistence. In isolation (A,B) plants take up nutrients in a specific profile over the growing season.By contrast, when grown together (C) the two plants offset the period of maximum nutrient capture to limit competition. In a multispecies community (D) this couldlead to species occupying distinct temporal niches, leading to coexistence.
For example, our current understanding of the niches available within plant communities, whichstrongly regulate plant–plant interactions, cannot explain the level of observed coexistence [25].A better understanding of short-term temporal dynamism in resource capture, and its con-sequences for plant–plant interactions, might help to explain this apparent paradox. Temporallydynamic resource-capture processes, and the temporal niche segregation which this couldenable, could alter crucial plant–plant interactions so as to have a stabilising effect oncommunities. This would allow a higher diversity than would otherwise be the case to besupported [26], at potentially both a species [27] and genotypic level [28], with the communityusing a greater proportion of the available resources [29]. In this example, temporal dynamismin resource capture can be considered as an unmeasured trait (Box 1).
Trends in Ecology & Evolution, Month Year, Vol. xx, No. yy 3
TREE 2353 No. of Pages 10
Why Has Temporal Dynamism in Resource Capture Been Overlooked?Given the general importance of the temporal dynamism of ecological processes, and thelikelihood that in many cases this is related also to temporally dynamic resource capture within agrowing season, why have so few studies explicitly addressed this latter topic?
Plant ecology has traditionally relied on one final biomass measurement to assess the con-sequences of plant–plant interactions. Biomass is a relatively cheap and easy measure of plantresponse, making large-scale greenhouse and field studies possible [26]. However, there aresome drawbacks to using single timepoint measurements of biomass to assess plant–plantinteractions, and especially the short-term temporal dynamism of these processes. First, owingto the influence of other external environmental factors, the accumulation of biomass is rarelyinfluenced by competition alone [23]. This makes it an unreliable direct measure of the outcomeof competition. The use of only single harvesting to assess the outcome of plant–plantinteractions is clearly inappropriate for measuring short-term temporal dynamism in resourcecapture. In addition, the precise timing of biomass harvest and measurement within a growingseason can influence the perceived outcome of the plant–plant interaction because plants growand develop at different times throughout the year [26]. The same criticisms can also be madeof other common annual, single timepoint measurements, for example, flower production andseed set. To understand the role of temporal dynamism of resource capture in regulatingcommunity dynamics, repeated measures of resource capture are required. However, to takethis step we need first to realise and accept the limitations of single timepoint studies, andmoveto more detailed studies of the competitive process itself.
Traditional approaches, for example plant biomass and tissue nutrient-content analysis, can beused to explore issues of temporal dynamism in plant–plant interactions. However, they need tobe coupled to multiple harvesting points through time, as used by Trinder et al. to examine thetemporal dynamics of resource capture in Plantago lanceolata and Dactylis glomerata [23].Although the multiple-harvest approach is a valuable tool, it is destructive and requires large-scale and labour-intensive studies. The inclusion in a study of multiple harvests to tracktemporal dynamism of resource capture and plant–plant interactions through time increasesthe size and complexity of an experiment, and therefore reduces the complexity of thequestions that can be asked [11,29]. In addition, multiple harvesting means that responsesare averaged over many plants, potentially masking subtle dynamic individual-level responsesin resource capture and growth. Non-destructive methods would instead allow the responsesof an individual plant to be studied over time.
Such drivers of the historical oversight support a case for the use of innovative new technolo-gies, particularly non-destructive and direct measures of resource capture, such that temporaldynamism of resource capture can be given the attention it deserves.
Setting and Addressing a New Research AgendaFrom the above discussions, and consideration of well-known ecological concepts, a seriesof questions can be presented (see Outstanding Questions) in a clear research agenda. Ifaddressed, this agenda could advance the study of temporal dynamism of resource capture.Importantly, this research agenda is not only of relevance to plant ecophysiologists orcommunity ecologists. By influencing, for example, the temporal availability of resourcesto other groups such as soil organisms, pollinators, and herbivores, the study of temporaldynamism in plant resource capture will likely have wide-reaching consequences for eco-logical research.
4 Trends in Ecology & Evolution, Month Year, Vol. xx, No. yy
TREE 2353 No. of Pages 10
As discussed, although temporal dynamism in resource capture can itself be detected usingdestructive harvesting techniques [59_TD$DIFF][23], new technological approaches will be necessary to lookat the complex series of processes involved in the dynamics of plant nutrient capture and its rolein community composition. Below, we provide examples of how these advances might enablesome of the key questions of the research agenda to be addressed.
What Is the Interaction Between Temporal Dynamism of Resource Capture with PlantPhysiology and Morphology?The plasticity of plant root traits may facilitate the temporal dynamics of resource capture, whileat the same time root physiology and morphology could be influenced by changes in thetemporal dynamics of nutrient uptake. Therefore, the relationship between temporal dynamismof resource capture and root traits is a key topic because roots are the organs of nutrientuptake.
Microrhizotrons – small cameras inserted into the soil to record root foraging and fine rootdeveloping [30,31] – allow the study of root foraging activity. However, they are limited in notgiving a view of the whole root system.Whole root system growth dynamics can be studiedwithautomated root phenotyping facilities, using high-definition cameras to photograph rootdevelopment of plants grown in Perspex boxes [32]. Changes in root morphology and foragingcan then be related to the location of soil microbial activity (soil zymography, see below) andplant nutrient capture.
For a 3D view of root growth dynamics, X-ray computed tomography (CT) scanning can beused to visualise plant roots grown in soil. Root architectural development can then be relatedto resource capture. The development of specialist root-tracking software and facilities [33] willallowmuch larger andmore complex experiments to be carried out on dynamic competition forsoil resources between the roots of multiple individuals. This approach has already been usedto study root growth in response to competition between Populus tremuloides (quaking aspen)and Picea mariana (black spruce) seedlings. Both species increased rooting depth and alteredroot architecture in response to a competitor [34], but this study did not simultaneously assesssoil resource capture. By combining successive scanning of root growth and successivedestructive harvesting to look at the temporal dynamics of nutrient uptake, the relationshipbetween root growth and nutrient uptake can begin to be addressed.
Is Temporal Dynamism in Nutrient Capture Moderated in Response to Neighbours Simplyby Overlapping Depletion Zones or by More Complex Signalling Pathways?Traditionally plant competitive responses to a neighbour have been thought to occur when thezones of nutrient depletion in the soil overlap [35]. As the complexities of plant–plant commu-nication are revealed [36], it is becoming clear that plant–plant competitive interactions mightnot occur solely based on nutrient availability. RNA sequencing, which enables us to examinethe genes upregulated in specific circumstances in tissue samples, is one way to look atdynamic plant responses to the presence of a neighbour.
Studies inArabidopsis thaliana have identified that common stress-response pathways such asjasmonate production are activated in response to a competitor [37]. Detection of the upre-gulation of stress-associated genes can indicate when a target plant detects the presence of aneighbour, whether the response differs depending on the identity of the neighbour, and thelength of time between neighbour detection and any form of additional physiological responseby the target plant (e.g., priming of soil microbes; see below).
Trends in Ecology & Evolution, Month Year, Vol. xx, No. yy 5
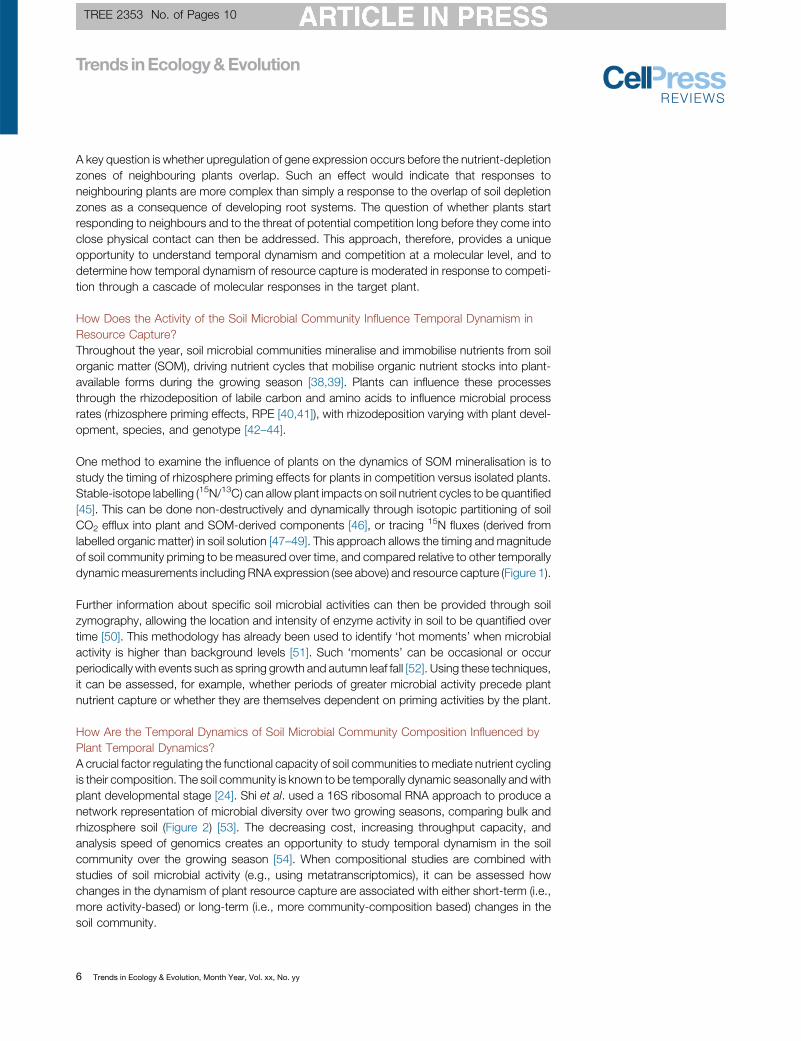
TREE 2353 No. of Pages 10
A key question is whether upregulation of gene expression occurs before the nutrient-depletionzones of neighbouring plants overlap. Such an effect would indicate that responses toneighbouring plants are more complex than simply a response to the overlap of soil depletionzones as a consequence of developing root systems. The question of whether plants startresponding to neighbours and to the threat of potential competition long before they come intoclose physical contact can then be addressed. This approach, therefore, provides a uniqueopportunity to understand temporal dynamism and competition at a molecular level, and todetermine how temporal dynamism of resource capture is moderated in response to competi-tion through a cascade of molecular responses in the target plant.
How Does the Activity of the Soil Microbial Community Influence Temporal Dynamism inResource Capture?Throughout the year, soil microbial communities mineralise and immobilise nutrients from soilorganic matter (SOM), driving nutrient cycles that mobilise organic nutrient stocks into plant-available forms during the growing season [38,39]. Plants can influence these processesthrough the rhizodeposition of labile carbon and amino acids to influence microbial processrates (rhizosphere priming effects, RPE [40,41]), with rhizodeposition varying with plant devel-opment, species, and genotype [42–44].
One method to examine the influence of plants on the dynamics of SOM mineralisation is tostudy the timing of rhizosphere priming effects for plants in competition versus isolated plants.Stable-isotope labelling (15 [58_TD$DIFF]N/13C) can allow plant impacts on soil nutrient cycles to be quantified[45]. This can be done non-destructively and dynamically through isotopic partitioning of soilCO2 efflux into plant and SOM-derived components [46], or tracing 15N fluxes (derived fromlabelled organic matter) in soil solution [47–49]. This approach allows the timing and magnitudeof soil community priming to be measured over time, and compared relative to other temporallydynamicmeasurements including RNA expression (see above) and resource capture (Figure 1).
Further information about specific soil microbial activities can then be provided through soilzymography, allowing the location and intensity of enzyme activity in soil to be quantified overtime [50]. This methodology has already been used to identify ‘hot moments’ when microbialactivity is higher than background levels [51][61_TD$DIFF]. Such ‘moments’ can be occasional or occurperiodically with events such as spring growth and autumn leaf fall [52]. Using these techniques,it can be assessed, for example, whether periods of greater microbial activity precede plantnutrient capture or whether they are themselves dependent on priming activities by the plant.
How Are the Temporal Dynamics of Soil Microbial Community Composition Influenced byPlant Temporal Dynamics?A crucial factor regulating the functional capacity of soil communities to mediate nutrient cyclingis their composition. The soil community is known to be temporally dynamic seasonally andwithplant developmental stage [24]. Shi et al. used a 16S ribosomal RNA approach to produce anetwork representation of microbial diversity over two growing seasons, comparing bulk andrhizosphere soil (Figure 2) [53]. The decreasing cost, increasing throughput capacity, andanalysis speed of genomics creates an opportunity to study temporal dynamism in the soilcommunity over the growing season [54]. When compositional studies are combined withstudies of soil microbial activity (e.g., using metatranscriptomics), it can be assessed howchanges in the dynamism of plant resource capture are associated with either short-term (i.e.,more activity-based) or long-term (i.e., more community-composition based) changes in thesoil community.
6 Trends in Ecology & Evolution, Month Year, Vol. xx, No. yy
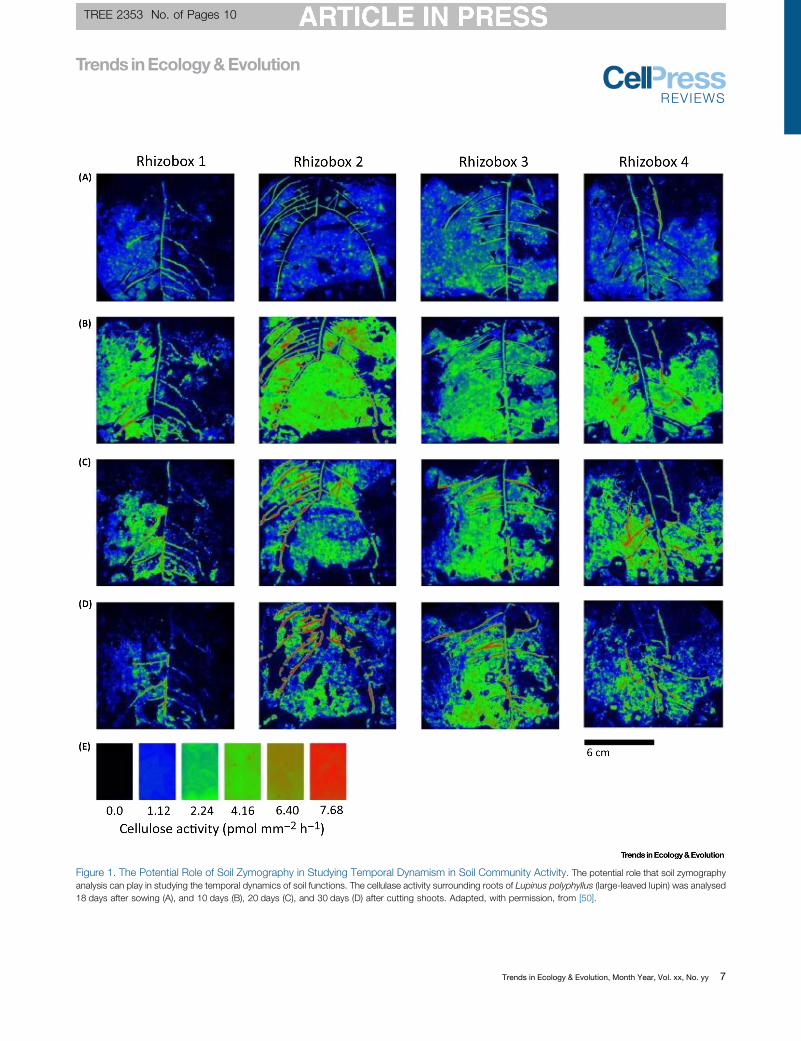
TREE 2353 No. of Pages 10
Figure 1. The Potential Role of Soil Zymography in Studying Temporal Dynamism in Soil Community Activity. The potential role that soil zymographyanalysis can play in studying the temporal dynamics of soil functions. The cellulase activity surrounding roots of Lupinus polyphyllus (large-leaved lupin) was analysed18 days after sowing (A), and 10 days (B), 20 days (C [56_TD$DIFF]), and 30 days (D) after cutting shoots. [57_TD$DIFF]Adapted, with permission, from [50].
Trends in Ecology & Evolution, Month Year, Vol. xx, No. yy 7
TREE 2353 No. of Pages 10
Figure 2. Temporal Dynamics of the Plant-Associated Soil Community. The figure shows the potential role of soil community characterisation and networkanalysis in studying the temporal dynamics of the soil community associated with resource capture. (A,B) Differences in the rhizosphere and bulk soil community ofAvena fatua were compared over two growing seasons. Samples were taken every 3 weeks (w) for two seasons. Shi et al. looked at the difference in the diversity andlevel of interconnection between bulk and rhizosphere soil. Nodes represent operational taxonomic units (OTUs), and lines represent the linkages between them. Therhizosphere soil becomes more interconnected but less diverse over time because the plant exerted a selection pressure on the soil community. [57_TD$DIFF]Adapted, withpermission, from [53].
What Is the Future Strategy To Study Temporal Dynamism?Temporal dynamism is an overlooked factor in ecology and could be a vital central mechanismby which plants coexist in complex communities. Although studying temporal dynamism ofresource capture will not be straightforward, the potential benefit to the understanding ofecosystem functioning is likely to be considerable. There is now an ideal opportunity tounderstand the within growing season temporal dynamics of resource capture as part ofbroader ecological system dynamics.
8 Trends in Ecology & Evolution, Month Year, Vol. xx, No. yy
TREE 2353 No. of Pages 10
Outstanding QuestionsA Research Agenda for TemporalDynamism in Plant Resource Capture
The following are key research ques-tions which set out a clear researchagenda for linking the issue of temporaldynamism in resource capture to cen-tral aspects of plant ecophysiology,plant community ecology, and com-munity ecology more widely. We haveordered them such that they run fromstudies which might be conducted onindividual plants to studies withincreasing complexity in terms of bioticinteractions – initially interactions withother plants, then with soil organisms,then with other elements of the widercommunity (for example pollinatorsand herbivores).
(i) What is the interaction of temporaldynamism of resource capture withplant physiology and morphology?
(ii) Is temporal dynamism in phenologymatched by patterns of temporaldynamism in nutrient uptake?
To understand the role of temporal dynamism of resource capture in plant coexistence it needsto be understood how plants coordinate temporally dynamic responses, the intermediary roleof the soil microbial community, and the consequences at the individual plant and plantcommunity level. Therefore, to study these distinct but interconnected processes, an inte-grated approach is required [55]. From the examples we have discussed above it is clear that avast amount of knowledge can be gained about temporal dynamism in resource capture fromusing these cutting-edge technologies. Once the fundamental questions about temporaldynamism of resource capture have been addressed, the wider community-level consequen-ces can then be considered, building upon these fundamental studies.
The ultimate goal of this research should be to integrate temporal dynamism as a factor intoexisting models, to define new niche space, and aid the explanation of coexistence in complexcommunities. Only then can the question of whether temporal dynamism in resource captureleads to coexistence of neighbouring plants can begin to be addressed. This approach canthen be applied to other temporally dynamic processes, answering other fundamental ques-tions about ecosystem functioning.
[62_TD$DIFF]AcknowledgmentsWe thank [63_TD$DIFF]Elizabeth Price and Francis Brearley for their valuable comments on the draft manuscript. E.J.S. was funded by
Manchester Metropolitan University and the James Hutton Institute, R.W.B. and E.P. were funded by the Rural and
Environment Science and Analytical Services Division of the Scottish Government through the Strategic Research
Programme 2016–2021.
References
(iii) Is temporal dynamism in nutrientuptake moderated in response toneighbours simply by overlappingdepletion zones or by more complexsignalling pathways?
(iv) How do interactions with soil organ-isms influence temporal dynamism inresource capture?
(v) Is temporal dynamism in resourcecapture widespread, or is it associatedwith particular plant strategy types?
(vi) Does temporal dynamism inresource capture lead to a reductionin competition, and contribute to plantcoexistence and the development ofmultispecies plant communities?
(vii) What are the wider consequencesof temporal dynamism for communitystructure and function at other trophiclevels?
1. Grime, J.P. (1977) Evidence for the existence of three primarystrategies in plants and its relevance to ecological and evolution-ary theory on JSTOR. Am. Nat. 111, 1169–1194
2. Bongers, F. et al. (2009) The intermediate disturbance hypothesisapplies to tropical forests, but disturbance contributes little to treediversity. Ecol. Lett. 12, 798–805
3. Rowntree, J.K. et al. (2011) Genetic variation changes the interac-tions between the parasitic plant-ecosystem engineer Rhinanthusand its hosts. Philos. Trans. R. Soc. B Biol. Sci. 366, 1380–1388
4. Tilman, D. (1982) Resource Competition and Community Struc-ture, Princeton University Press
5. Valladares, F. et al. (2015) Species coexistence in a changingworld. Front. Plant Sci. 6, 1–16
6. Mitchell, R.M. and Bakker, J.D. (2014) Quantifying and comparingintraspecific functional trait variability: a case study with Hypo-chaeris radicata. Funct. Ecol. 28, 258–269
7. Brooker, R.W. et al. (2007) Facilitation in plant communities: thepast, the present, and the future. J. Ecol. 96, 18–34
8. Butterfield, B.J. et al. (2013) Alpine cushion plants inhibit the lossof phylogenetic diversity in severe environments. Ecol. Lett. 16,478–486
9. Geuten, K. and Coenen, H. (2013) Heterochronic genes in plantevolution and development. Front. Plant Sci. 4, 381
10. Tang, J. et al. (2016) Special feature: international LTER emergingopportunities and challenges in phenology: a review. Ecosphere7, e01436
11. Li, C. et al. (2014) The dynamic process of interspecific interac-tions of competitive nitrogen capture between intercroppedwheat (Triticum aestivum L.) and Faba bean (Vicia faba L.). PLoSOne 9, e115804
12. MacLeod, M. et al. (2016) Measuring partner choice in plant–pollinator networks: using null models to separate rewiring andfidelity from chance. Ecology 97, 2925–2931
13. Kipling, R.P. and Warren, J. (2014) An investigation of temporalflowering segregation in species-rich grasslands. Ecol. Res. 29,213–224
14. Thompson, K. and Gilbert, F. (2014) Spatiotemporal variation inthe endangered Thymus decussatus in a hyper-arid environment.J. Plant Ecol. 8, 79–90
15. Schwinning, S. et al. (2004) Thresholds, memory, and seasonal-ity: understanding pulse dynamics in arid/semi-arid ecosystems.Oecologia 141, 191–193
16. Jaeger, C.H. et al. (1999) Seasonal partitioning of nitrogen byplants and soil microorganisms in an alpine ecosystem. America80, 1883–1891
17. Bardgett, R.D. et al. (2005) A temporal approach to linkingaboveground and belowground ecology. Trends Ecol. Evol. 20,634–641
18. Wolkovich, E.M. and Cleland, E.E. (2014) Phenological nichesand the future of invaded ecosystems with climate change. AoBPlants 6, 1–16
19. Mudrák, O. et al. (2016) Changes in the functional trait composi-tion and diversity of meadow communities induced byRhinanthusminor L. Folia Geobot. 51, 1–11
20. March, W.A. and Watson, D.M. (2007) Parasites boost produc-tivity: effects of mistletoe on litterfall dynamics in a temperateAustralian forest. Oecologia 154, 339–347
21. Quested, H.M. (2008) Parasitic plants – impacts on nutrientcycling. Plant Soil 311, 269–272
22. Jiang, F. et al. (2010) Interactions between Rhinanthus minor andits hosts: a review of water, mineral nutrient and hormone flowsand exchanges in the hemiparasitic association. Folia Geobot.45, 369–385
23. Trinder, C. et al. (2012) Dynamic trajectories of growth andnitrogen capture by competing plants.NewPhytol. 193, 948–958
24. Lortie, C.J. et al. (2004) Rethinking plant community theory.Oikos107, 433–438
25. Clark, J.S. (2010) Individuals and the variation needed for highspecies diversity in forest trees. Science 327, 1129–1132
26. Trinder, C.J. et al. (2013) Plant ecology’s guilty little secret:understanding the dynamics of plant competition. Funct. Ecol.27, 918–929
Trends in Ecology & Evolution, Month Year, Vol. xx, No. yy 9
TREE 2353 No. of Pages 10
27. Proulx, R. et al. (2010) Diversity promotes temporal stabilityacross levels of ecosystem organization in experimental grass-lands. PLoS One 5, 1–8
28. Fridley, J.D. et al. (2007) Genetic identity of interspecific neigh-bours mediates plant responses to competition and environ-mental variation in a species-rich grassland. J. Ecol. 95,908–915
29. Allan, E. et al. (2011) More diverse plant communities have higherfunctioning over time due to turnover in complementary dominantspecies. Proc. Natl. Acad. Sci. U. S. A. 108, 17034–17039
30. Warren, J.M. et al. (2015) Root structural and functional dynamicsin terrestrial biosphere models – evaluation and recommenda-tions. New Phytol. 205, 59–78
31. McCormack, M.L. et al. (2015) Redefining fine roots improvesunderstanding of below-ground contributions to terrestrial bio-sphere processes. New Phytol. 207, 505–518
32. Marshall, A.H. et al. (2016) A new emphasis on root traits forperennial grass and legume varieties with environmental andecological benefits. Food Energy Secur. 5, 26–39
33. Mairhofer, S. et al. (2015) Extracting multiple interacting rootsystems using X-ray microcomputed tomography. Plant J. 84,1034–1043
34. Dutilleul, P. et al. (2015) X-ray computed tomography uncoversroot–root interactions: quantifying spatial relationships betweeninteracting root systems in three dimensions. Front. Plant Sci. 6
35. Ge, Z. et al. (2000) The importance of root gravitropism for inter-root competition and phosphorus acquisition efficiency: resultsfrom a geometric simulation model. Plant Soil 218, 159–171
36. Babikova, Z. et al. (2013) Underground signals carried throughcommon mycelial networks warn neighbouring plants of aphidattack. Ecol. Lett. 16, 835–843
37. Masclaux, F.G. et al. (2012) Transcriptome analysis of intraspe-cific competition in Arabidopsis thaliana reveals organ-specificsignatures related to nutrient acquisition and general stressresponse pathways. BMC Plant Biol. 12, 227
38. Laliberté, E. (2016) Below-ground frontiers in trait-based plantecology. New Phytol. 213, 1597–1603
39. de Vries, F.T. and Caruso, T. (2016) Eating from the same plate?Revisiting the role of labile carbon inputs in the soil food web. Soil.Biol. Biochem. 102, 4–9
40. Kuzyakov, Y. (2010) Priming effects: interactions between livingand dead organic matter. Soil. Biol. Biochem. 42, 1363–1371
41. Mommer, L. et al. (2016) Root–root interactions: towards a rhi-zosphere framework. Trends Plant Sci. 21, 209–217
42. Chaparro, J.M. et al. (2013) Root exudation of phytochemicals inArabidopsis follows specific patterns that are developmentally
10 Trends in Ecology & Evolution, Month Year, Vol. xx, No. yy
programmed and correlate with soil microbial functions. PLoSOne 8, e55731
43. Bardgett, R.D. et al. (2014) Going underground: root traits asdrivers of ecosystem processes. Trends Ecol. Evol. 29, 692–699
44. Mwafulirwa, L. et al. (2016) Barley genotype influences stabiliza-tion of rhizodeposition-derived C and soil organic matter minerali-zation. Soil Biol. Biochem. 95, 60–69
45. McKane, R.B. et al. (1990) Spatiotemporal differences in 15Nuptake and the organization of an old-field plant community.Ecology 71, 1126–1132
46. Lloyd, D.A. et al. (2016) Effects of soil type and composition ofrhizodeposits on rhizosphere priming phenomena. Soil Biol. Bio-chem. 103, 512–521
47. Yang, H. et al. (2013) Plant neighbor effects mediated by rhizo-sphere factors along a simulated aridity gradient. Plant Soil 369,165–176
48. Studer, M.S. et al. (2014) Carbon transfer, partitioning and resi-dence time in the plant–soil system: a comparison of two 13CO2
labelling techniques. Biogeosciences 11, 1637–1648
49. Zambrosi, F.C.B. et al. (2012) Contribution of phosphorus (32P)absorption and remobilization for citrus growth. Plant Soil 355,353–362
50. Spohn, M. and Kuzyakov, Y. (2014) Spatial and temporaldynamics of hotspots of enzyme activity in soil as affected byliving and dead roots – a soil zymography analysis. Plant Soil379, 67–77
51. Kuzyakov, Y. and Blagodatskaya, E. (2015) Microbial hotspotsand hot moments in soil: concept & review. Soil Biol. Biochem.83, 184–199
52. Philippot, L. et al. (2009) Biochemical cycling in the rhizospherehaving an impact on global change. Plant Soil 321, 61–81
53. Shi, S. et al. (2016) The interconnected rhizosphere: high networkcomplexity dominates rhizosphere assemblages. Ecol. Lett. 19,926–936
54. Prosser, J.I. (2015) Dispersing misconceptions and identifyingopportunities for the use of “omics” in soil microbial ecology.Nat. Rev. Microbiol. 13, 439–446
55. Harris, G.A. (1967) Some competitive relationships betweenAgropyron spicatum and Bromus tectorum. Ecol. Monogr. 37,89–111
56. Herrera Paredes, S. et al. (2016) Giving back to the community:microbial mechanisms of plant–soil interactions. Funct. Ecol. 30,1043–1052
fpls-10-00215 February 21, 2019 Time: 19:27 # 1
ORIGINAL RESEARCHpublished: 25 February 2019
doi: 10.3389/fpls.2019.00215
Edited by:Massimiliano Tattini,
Italian National Research Council(CNR), Italy
Reviewed by:Alessio Fini,
University of Milan, ItalyLucia Guidi,
University of Pisa, Italy
*Correspondence:Emily Jane Schofield
[email protected];[email protected]
Specialty section:This article was submitted to
Functional Plant Ecology,a section of the journal
Frontiers in Plant Science
Received: 23 October 2018Accepted: 08 February 2019Published: 25 February 2019
Citation:Schofield EJ, Rowntree JK,
Paterson E, Brewer MJ, Price EAC,Brearley FQ and Brooker RW (2019)
Cultivar Differences and Impactof Plant-Plant Competition onTemporal Patterns of Nitrogen
and Biomass Accumulation.Front. Plant Sci. 10:215.
doi: 10.3389/fpls.2019.00215
Cultivar Differences and Impactof Plant-Plant Competition onTemporal Patterns of Nitrogen andBiomass AccumulationEmily Jane Schofield1,2* , Jennifer K. Rowntree2, Eric Paterson1, Mark J. Brewer3,Elizabeth A. C. Price2, Francis Q. Brearley2 and Rob W. Brooker1
1 The James Hutton Institute, Aberdeen, United Kingdom, 2 School of Science and the Environment, ManchesterMetropolitan University, Manchester, United Kingdom, 3 Biomathematics and Statistics Scotland, Aberdeen, United Kingdom
Current niche models cannot explain multi-species plant coexistence in complexecosystems. One overlooked explanatory factor is within-growing season temporaldynamism of resource capture by plants. However, the timing and rate of resourcecapture are themselves likely to be mediated by plant-plant competition. This studyused Barley (Hordeum sp.) as a model species to examine the impacts of intra-specific competition, specifically inter- and intra-cultivar competition on the temporaldynamics of resource capture. Nitrogen and biomass accumulation of an early and latecultivar grown in isolation, inter- or intra- cultivar competition were investigated usingsequential harvests. We did not find changes in the temporal dynamics of biomassaccumulation in response to competition. However, peak nitrogen accumulation ratewas significantly delayed for the late cultivar by 14.5 days and advanced in the earlycultivar by 0.5 days when in intra-cultivar competition; there were no significant changeswhen in inter-cultivar competition. This may suggest a form of kin recognition as thetarget plants appeared to identify their neighbors and only responded temporally tointra-cultivar competition. The Relative Intensity Index found competition occurred inboth the intra- and inter- cultivar mixtures, but a positive Land Equivalence Ratiovalue indicated complementarity in the inter-cultivar mixtures compared to intra-cultivarmixtures. The reason for this is unclear but may be due to the timing of the final harvestand may not be representative of the relationship between the competing plants. Thisstudy demonstrates neighbor-identity-specific changes in temporal dynamism in nutrientuptake. This contributes to our fundamental understanding of plant nutrient dynamicsand plant-plant competition whilst having relevance to sustainable agriculture. Improvedunderstanding of within-growing season temporal dynamism would also improve ourunderstanding of coexistence in complex plant communities.
Keywords: Hordeum sp. (Barley), nitrogen, nutrient uptake, peak accumulation rate, plant-plant competition,plant community coexistence, temporal dynamism
INTRODUCTION
Niche differentiation is suggested to lead to coexistence of plants by reducing competition,either for a specific form of a resource or simultaneous demand for the same resource(Silvertown, 2004). However, in complex plant communities such as rain forests andgrasslands there are seemingly insufficient niches to explain coexistence of the many species
Frontiers in Plant Science | www.frontiersin.org 1 February 2019 | Volume 10 | Article 215
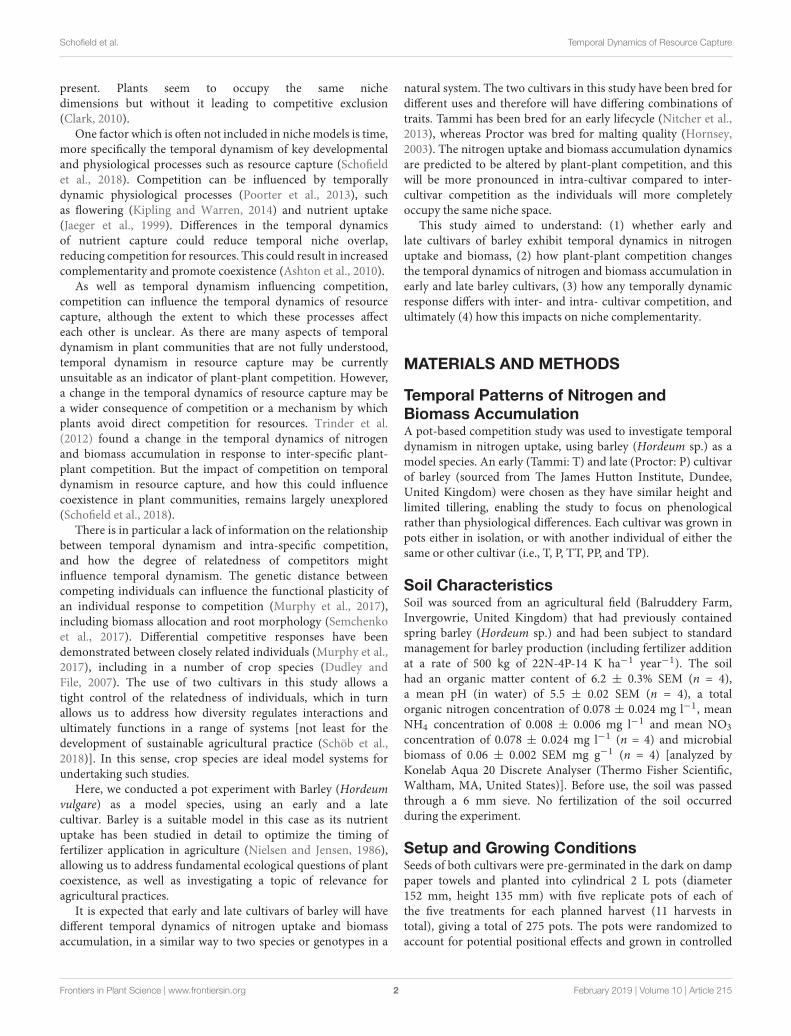
fpls-10-00215 February 21, 2019 Time: 19:27 # 2
Schofield et al. Temporal Dynamics of Resource Capture
present. Plants seem to occupy the same nichedimensions but without it leading to competitive exclusion(Clark, 2010).
One factor which is often not included in niche models is time,more specifically the temporal dynamism of key developmentaland physiological processes such as resource capture (Schofieldet al., 2018). Competition can be influenced by temporallydynamic physiological processes (Poorter et al., 2013), suchas flowering (Kipling and Warren, 2014) and nutrient uptake(Jaeger et al., 1999). Differences in the temporal dynamicsof nutrient capture could reduce temporal niche overlap,reducing competition for resources. This could result in increasedcomplementarity and promote coexistence (Ashton et al., 2010).
As well as temporal dynamism influencing competition,competition can influence the temporal dynamics of resourcecapture, although the extent to which these processes affecteach other is unclear. As there are many aspects of temporaldynamism in plant communities that are not fully understood,temporal dynamism in resource capture may be currentlyunsuitable as an indicator of plant-plant competition. However,a change in the temporal dynamics of resource capture may bea wider consequence of competition or a mechanism by whichplants avoid direct competition for resources. Trinder et al.(2012) found a change in the temporal dynamics of nitrogenand biomass accumulation in response to inter-specific plant-plant competition. But the impact of competition on temporaldynamism in resource capture, and how this could influencecoexistence in plant communities, remains largely unexplored(Schofield et al., 2018).
There is in particular a lack of information on the relationshipbetween temporal dynamism and intra-specific competition,and how the degree of relatedness of competitors mightinfluence temporal dynamism. The genetic distance betweencompeting individuals can influence the functional plasticity ofan individual response to competition (Murphy et al., 2017),including biomass allocation and root morphology (Semchenkoet al., 2017). Differential competitive responses have beendemonstrated between closely related individuals (Murphy et al.,2017), including in a number of crop species (Dudley andFile, 2007). The use of two cultivars in this study allows atight control of the relatedness of individuals, which in turnallows us to address how diversity regulates interactions andultimately functions in a range of systems [not least for thedevelopment of sustainable agricultural practice (Schöb et al.,2018)]. In this sense, crop species are ideal model systems forundertaking such studies.
Here, we conducted a pot experiment with Barley (Hordeumvulgare) as a model species, using an early and a latecultivar. Barley is a suitable model in this case as its nutrientuptake has been studied in detail to optimize the timing offertilizer application in agriculture (Nielsen and Jensen, 1986),allowing us to address fundamental ecological questions of plantcoexistence, as well as investigating a topic of relevance foragricultural practices.
It is expected that early and late cultivars of barley will havedifferent temporal dynamics of nitrogen uptake and biomassaccumulation, in a similar way to two species or genotypes in a
natural system. The two cultivars in this study have been bred fordifferent uses and therefore will have differing combinations oftraits. Tammi has been bred for an early lifecycle (Nitcher et al.,2013), whereas Proctor was bred for malting quality (Hornsey,2003). The nitrogen uptake and biomass accumulation dynamicsare predicted to be altered by plant-plant competition, and thiswill be more pronounced in intra-cultivar compared to inter-cultivar competition as the individuals will more completelyoccupy the same niche space.
This study aimed to understand: (1) whether early andlate cultivars of barley exhibit temporal dynamics in nitrogenuptake and biomass, (2) how plant-plant competition changesthe temporal dynamics of nitrogen and biomass accumulation inearly and late barley cultivars, (3) how any temporally dynamicresponse differs with inter- and intra- cultivar competition, andultimately (4) how this impacts on niche complementarity.
MATERIALS AND METHODS
Temporal Patterns of Nitrogen andBiomass AccumulationA pot-based competition study was used to investigate temporaldynamism in nitrogen uptake, using barley (Hordeum sp.) as amodel species. An early (Tammi: T) and late (Proctor: P) cultivarof barley (sourced from The James Hutton Institute, Dundee,United Kingdom) were chosen as they have similar height andlimited tillering, enabling the study to focus on phenologicalrather than physiological differences. Each cultivar was grown inpots either in isolation, or with another individual of either thesame or other cultivar (i.e., T, P, TT, PP, and TP).
Soil CharacteristicsSoil was sourced from an agricultural field (Balruddery Farm,Invergowrie, United Kingdom) that had previously containedspring barley (Hordeum sp.) and had been subject to standardmanagement for barley production (including fertilizer additionat a rate of 500 kg of 22N-4P-14 K ha−1 year−1). The soilhad an organic matter content of 6.2 ± 0.3% SEM (n = 4),a mean pH (in water) of 5.5 ± 0.02 SEM (n = 4), a totalorganic nitrogen concentration of 0.078 ± 0.024 mg l−1, meanNH4 concentration of 0.008 ± 0.006 mg l−1 and mean NO3concentration of 0.078 ± 0.024 mg l−1 (n = 4) and microbialbiomass of 0.06 ± 0.002 SEM mg g−1 (n = 4) [analyzed byKonelab Aqua 20 Discrete Analyser (Thermo Fisher Scientific,Waltham, MA, United States)]. Before use, the soil was passedthrough a 6 mm sieve. No fertilization of the soil occurredduring the experiment.
Setup and Growing ConditionsSeeds of both cultivars were pre-germinated in the dark on damppaper towels and planted into cylindrical 2 L pots (diameter152 mm, height 135 mm) with five replicate pots of each ofthe five treatments for each planned harvest (11 harvests intotal), giving a total of 275 pots. The pots were randomized toaccount for potential positional effects and grown in controlled
Frontiers in Plant Science | www.frontiersin.org 2 February 2019 | Volume 10 | Article 215
fpls-10-00215 February 21, 2019 Time: 19:27 # 3
Schofield et al. Temporal Dynamics of Resource Capture
environment rooms (Conviron, Isleham, United Kingdom) ata constant 15◦C with an 8/16 (day/night) hour photoperiod(irradiance of 100–150 µmol m−2 s−1) and 65% relativehumidity, to mimic local spring-time conditions. The pots werewatered twice weekly and the soil was kept moist to avoidcompetition for water. Mesh screens [45 cm × 16 cm, mesh size0.08 mm (Harrod Horticulture, Lowestoft, United Kingdom)]were inserted in those pots containing two plants to separate theplants above ground, and ensure competitive interactions onlyoccurred below ground. Foliage was relatively upright withoutsupport and the presence of a screen – although importantin ensuring above-ground competition was minimized – wasunlikely to have resulted in differences in shoot development inpots with two plants compared to one.
Sequential HarvestingFive randomly selected pots of each treatment were harvestedevery 5 days until ear formation (when grain begins to form)was observed on the early Tammi cultivar (60 days). Duringthis period both cultivars produced flag leaves, the stage prior tograin production, when most nitrogen has already been absorbed(Spink et al., 2015). This covered the period most likely tocontain the peak nitrogen and biomass accumulation rate forboth cultivars, the focus of this study. The plants were thenremoved from the pots, the roots washed, and individual shootand root material separated. The root and shoot material of eachplant were dried at 30◦C until a stable weight was reached andweighed. Milled shoot samples were analyzed for carbon andnitrogen concentration (Flash EA 1112 Series, Thermo FisherScientific, Bremen, Germany).
Data AnalysisTemporal Patterns of Nitrogen and BiomassAccumulationTo analyze temporal changes in biomass and nitrogenaccumulation, the rate of each was modeled with logisticgrowth curves using non-linear least squares (nls) models(R Core Team, 2015). A cumulative time series data set ofbiomass accumulation was bootstrapped using resampling withreplacement 1000 times to estimate variability and confidenceintervals. A logistic growth curve was used as the nls model andthis was fitted to each of the bootstrapped data sets to producea set of logistic instantaneous uptake rate curves for eachtreatment, as well as sets of modeled maximum accumulationvalues. This was then repeated for the nitrogen accumulationdata set. A non-linear model was used as the growth dynamics ofplants with determinate growth such as barley (Yin et al., 2003)are mostly sigmoidal, making a linear growth model unsuitable(Robinson et al., 2010). Therefore, the use of the non-linear leastsquares model with bootstrapping is a robust method to examinethe temporal dynamism of resource capture of annual speciesand to properly account for uncertainty. Significant differencesbetween the timing of peak accumulation and final maximumaccumulation between treatments were determined from thedifference in bootstrapped 95% confidence intervals of the modeloutputs (Supplementary R Code 1).
Shoot C:NC:N ratio at the final harvest (65 days after planting) was analyzedusing an ANOVA test from the MASS package in R (R StatisticalSoftware, R Core Team, 2015) as the residuals were normallydistributed, with treatment as the fixed factor and C:N as theresponse variable (Supplementary R Code 2). A Tukey post hoctest was carried out to compare the individual treatment groups.
Neighbor EffectsThe effect of a neighboring plant on a target plant’s biomass wasquantified using the Relative Intensity Index (RII; Eq. 1), an indexthat accounts for both competitive and facilitative interactionsbetween neighboring plants (Díaz-Sierra et al., 2017). RII wascalculated using the final harvest biomass data. For each cultivar,RII was calculated separately for plants grown in intra- and inter-specific competition. The mean total biomass of each cultivargrown in isolation was used for the Isolation value, and theindividual RII value was then calculated for each plant of thatcultivar experiencing competition.
RII =(Competition − Isolation
)(Competition + Isolation
) (1)
Competition = Biomass of plant when in competition,Isolation = Mean biomass of plant in isolation.
The land equivalent ratio (LER; Eq. 2) was used to determineif the inter-cultivar mixture (TP) overyielded when comparedto intra-cultivar competition (TT or PP) (Mead and Willey,1980). The mean LER value was calculated by randomly pairinginter- and intra- cultivar competition treatments using a randomnumber generator. A LER value was calculated for each pairing,from which a mean and SEM was calculated. A mean LERvalue above 1 indicates that inter-cultivar pairings producedmore biomass than to intra-cultivar combinations. As theresiduals were normally distributed, the LER and RII values werecompared between competition treatments using an ANOVA testas above, with treatment as the fixed factor and either LER or RIIas the response variable (Supplementary R Code 2).
LER =Tammi mixture biomass
Tammi own cultivar biomass+
Proctor mixture biomassProctor own cultivar biomass
(2)
Tammi mixture biomass = Tammi biomass when in competitionwith Proctor, Tammi own cultivar biomass = Tammi biomassof the focal plant when in competition with another Tammi.Proctor mixture biomass = Proctor yield when in competitionwith Tammi, Proctor own cultivar biomass = Proctor biomasswhen in competition with another Proctor.
RESULTS
Nitrogen (Figure 1A) and biomass (Figure 1B) accumulationwere temporally distinct for both cultivars. The peak rate ofnitrogen accumulation occurred between 17.5 and 19.0 days afterplanting for Tammi and 19.5–35.0 days for Proctor. The peak rate
Frontiers in Plant Science | www.frontiersin.org 3 February 2019 | Volume 10 | Article 215
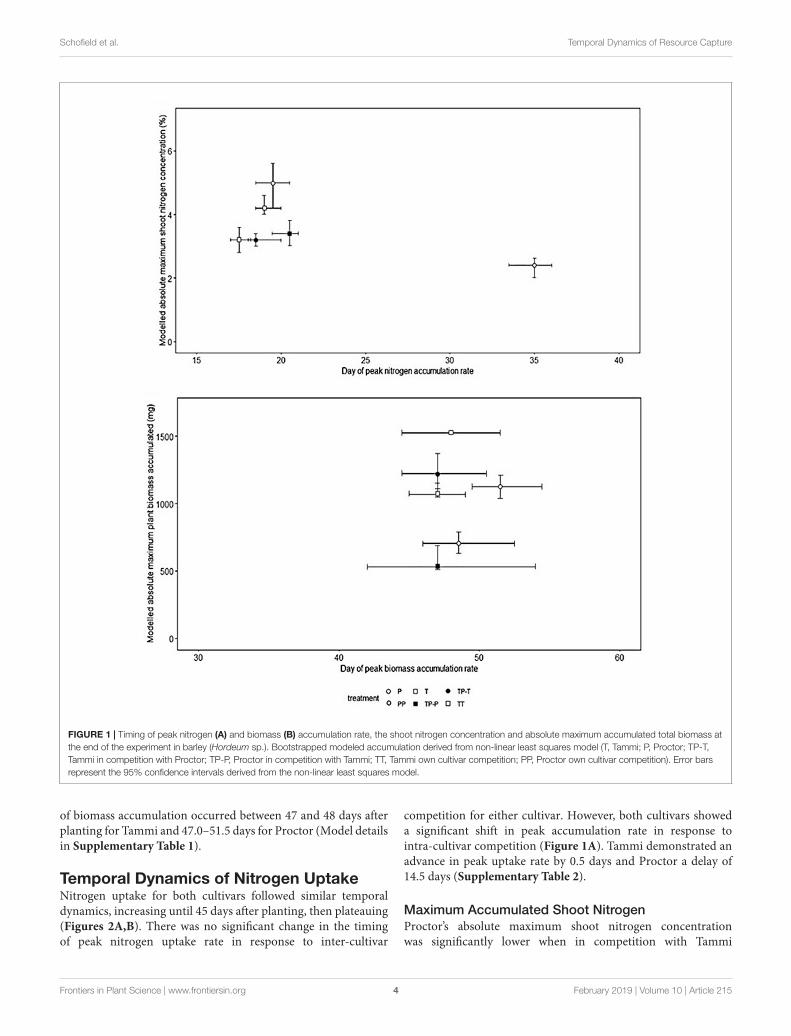
fpls-10-00215 February 21, 2019 Time: 19:27 # 4
Schofield et al. Temporal Dynamics of Resource Capture
FIGURE 1 | Timing of peak nitrogen (A) and biomass (B) accumulation rate, the shoot nitrogen concentration and absolute maximum accumulated total biomass atthe end of the experiment in barley (Hordeum sp.). Bootstrapped modeled accumulation derived from non-linear least squares model (T, Tammi; P, Proctor; TP-T,Tammi in competition with Proctor; TP-P, Proctor in competition with Tammi; TT, Tammi own cultivar competition; PP, Proctor own cultivar competition). Error barsrepresent the 95% confidence intervals derived from the non-linear least squares model.
of biomass accumulation occurred between 47 and 48 days afterplanting for Tammi and 47.0–51.5 days for Proctor (Model detailsin Supplementary Table 1).
Temporal Dynamics of Nitrogen UptakeNitrogen uptake for both cultivars followed similar temporaldynamics, increasing until 45 days after planting, then plateauing(Figures 2A,B). There was no significant change in the timingof peak nitrogen uptake rate in response to inter-cultivar
competition for either cultivar. However, both cultivars showeda significant shift in peak accumulation rate in response tointra-cultivar competition (Figure 1A). Tammi demonstrated anadvance in peak uptake rate by 0.5 days and Proctor a delay of14.5 days (Supplementary Table 2).
Maximum Accumulated Shoot NitrogenProctor’s absolute maximum shoot nitrogen concentrationwas significantly lower when in competition with Tammi
Frontiers in Plant Science | www.frontiersin.org 4 February 2019 | Volume 10 | Article 215
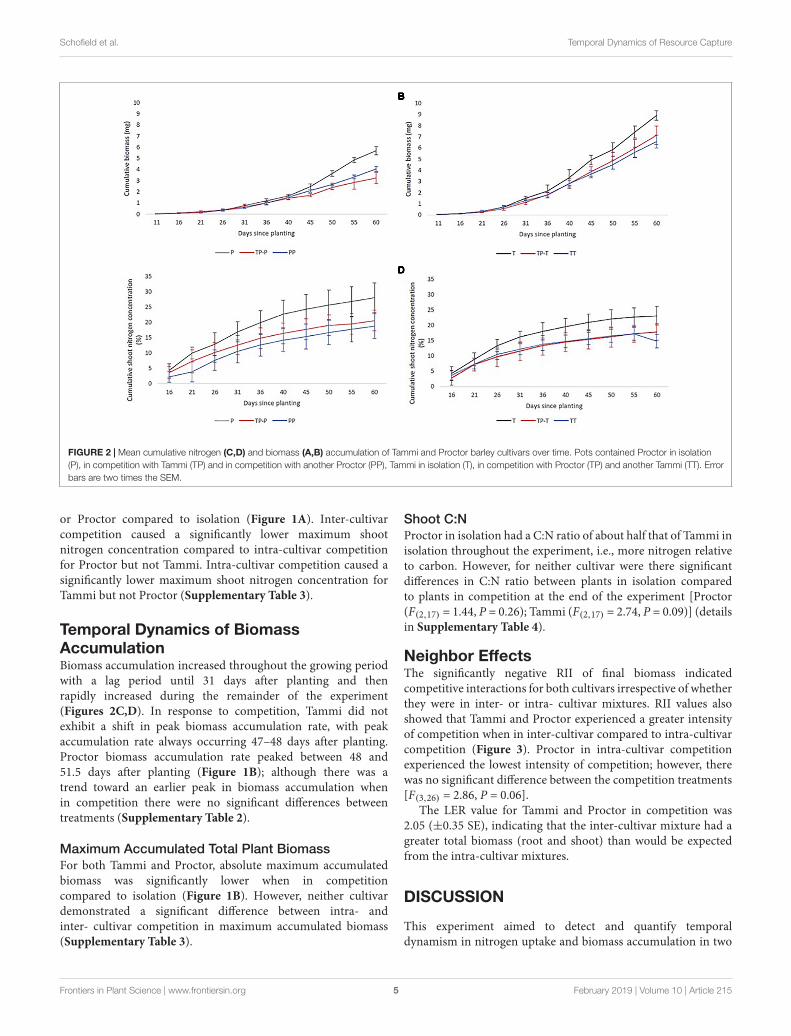
fpls-10-00215 February 21, 2019 Time: 19:27 # 5
Schofield et al. Temporal Dynamics of Resource Capture
FIGURE 2 | Mean cumulative nitrogen (C,D) and biomass (A,B) accumulation of Tammi and Proctor barley cultivars over time. Pots contained Proctor in isolation(P), in competition with Tammi (TP) and in competition with another Proctor (PP), Tammi in isolation (T), in competition with Proctor (TP) and another Tammi (TT). Errorbars are two times the SEM.
or Proctor compared to isolation (Figure 1A). Inter-cultivarcompetition caused a significantly lower maximum shootnitrogen concentration compared to intra-cultivar competitionfor Proctor but not Tammi. Intra-cultivar competition caused asignificantly lower maximum shoot nitrogen concentration forTammi but not Proctor (Supplementary Table 3).
Temporal Dynamics of BiomassAccumulationBiomass accumulation increased throughout the growing periodwith a lag period until 31 days after planting and thenrapidly increased during the remainder of the experiment(Figures 2C,D). In response to competition, Tammi did notexhibit a shift in peak biomass accumulation rate, with peakaccumulation rate always occurring 47–48 days after planting.Proctor biomass accumulation rate peaked between 48 and51.5 days after planting (Figure 1B); although there was atrend toward an earlier peak in biomass accumulation whenin competition there were no significant differences betweentreatments (Supplementary Table 2).
Maximum Accumulated Total Plant BiomassFor both Tammi and Proctor, absolute maximum accumulatedbiomass was significantly lower when in competitioncompared to isolation (Figure 1B). However, neither cultivardemonstrated a significant difference between intra- andinter- cultivar competition in maximum accumulated biomass(Supplementary Table 3).
Shoot C:NProctor in isolation had a C:N ratio of about half that of Tammi inisolation throughout the experiment, i.e., more nitrogen relativeto carbon. However, for neither cultivar were there significantdifferences in C:N ratio between plants in isolation comparedto plants in competition at the end of the experiment [Proctor(F(2,17) = 1.44, P = 0.26); Tammi (F(2,17) = 2.74, P = 0.09)] (detailsin Supplementary Table 4).
Neighbor EffectsThe significantly negative RII of final biomass indicatedcompetitive interactions for both cultivars irrespective of whetherthey were in inter- or intra- cultivar mixtures. RII values alsoshowed that Tammi and Proctor experienced a greater intensityof competition when in inter-cultivar compared to intra-cultivarcompetition (Figure 3). Proctor in intra-cultivar competitionexperienced the lowest intensity of competition; however, therewas no significant difference between the competition treatments[F(3,26) = 2.86, P = 0.06].
The LER value for Tammi and Proctor in competition was2.05 (±0.35 SE), indicating that the inter-cultivar mixture had agreater total biomass (root and shoot) than would be expectedfrom the intra-cultivar mixtures.
DISCUSSION
This experiment aimed to detect and quantify temporaldynamism in nitrogen uptake and biomass accumulation in two
Frontiers in Plant Science | www.frontiersin.org 5 February 2019 | Volume 10 | Article 215
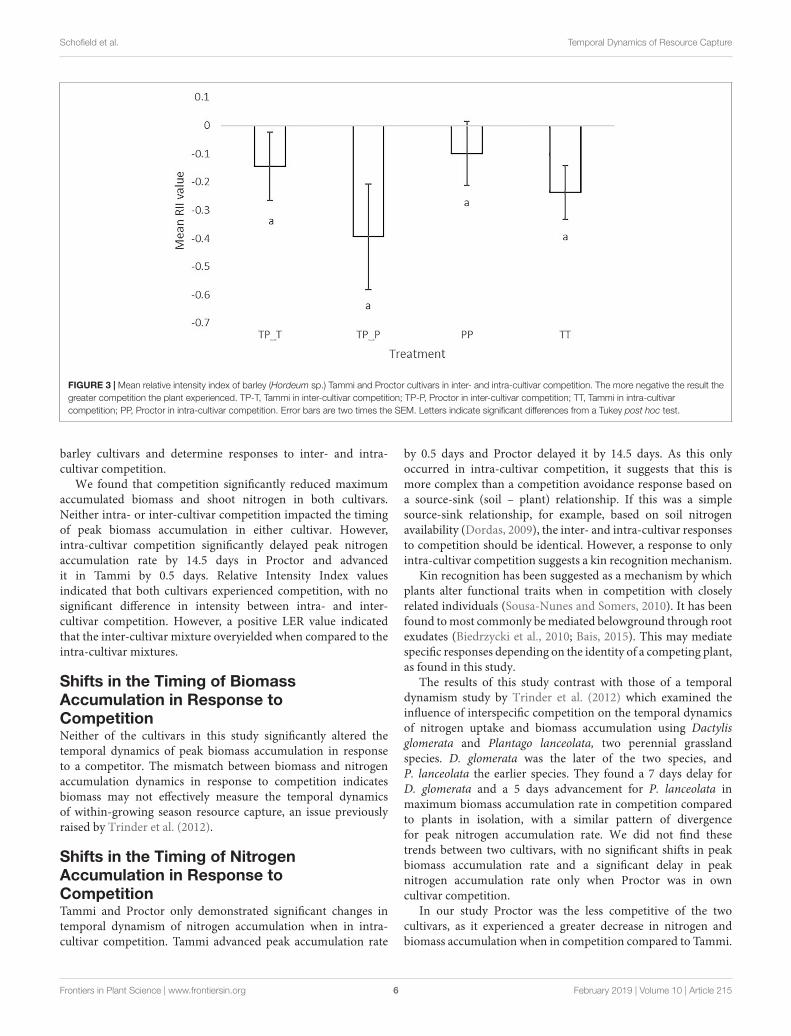
fpls-10-00215 February 21, 2019 Time: 19:27 # 6
Schofield et al. Temporal Dynamics of Resource Capture
FIGURE 3 | Mean relative intensity index of barley (Hordeum sp.) Tammi and Proctor cultivars in inter- and intra-cultivar competition. The more negative the result thegreater competition the plant experienced. TP-T, Tammi in inter-cultivar competition; TP-P, Proctor in inter-cultivar competition; TT, Tammi in intra-cultivarcompetition; PP, Proctor in intra-cultivar competition. Error bars are two times the SEM. Letters indicate significant differences from a Tukey post hoc test.
barley cultivars and determine responses to inter- and intra-cultivar competition.
We found that competition significantly reduced maximumaccumulated biomass and shoot nitrogen in both cultivars.Neither intra- or inter-cultivar competition impacted the timingof peak biomass accumulation in either cultivar. However,intra-cultivar competition significantly delayed peak nitrogenaccumulation rate by 14.5 days in Proctor and advancedit in Tammi by 0.5 days. Relative Intensity Index valuesindicated that both cultivars experienced competition, with nosignificant difference in intensity between intra- and inter-cultivar competition. However, a positive LER value indicatedthat the inter-cultivar mixture overyielded when compared to theintra-cultivar mixtures.
Shifts in the Timing of BiomassAccumulation in Response toCompetitionNeither of the cultivars in this study significantly altered thetemporal dynamics of peak biomass accumulation in responseto a competitor. The mismatch between biomass and nitrogenaccumulation dynamics in response to competition indicatesbiomass may not effectively measure the temporal dynamicsof within-growing season resource capture, an issue previouslyraised by Trinder et al. (2012).
Shifts in the Timing of NitrogenAccumulation in Response toCompetitionTammi and Proctor only demonstrated significant changes intemporal dynamism of nitrogen accumulation when in intra-cultivar competition. Tammi advanced peak accumulation rate
by 0.5 days and Proctor delayed it by 14.5 days. As this onlyoccurred in intra-cultivar competition, it suggests that this ismore complex than a competition avoidance response based ona source-sink (soil – plant) relationship. If this was a simplesource-sink relationship, for example, based on soil nitrogenavailability (Dordas, 2009), the inter- and intra-cultivar responsesto competition should be identical. However, a response to onlyintra-cultivar competition suggests a kin recognition mechanism.
Kin recognition has been suggested as a mechanism by whichplants alter functional traits when in competition with closelyrelated individuals (Sousa-Nunes and Somers, 2010). It has beenfound to most commonly be mediated belowground through rootexudates (Biedrzycki et al., 2010; Bais, 2015). This may mediatespecific responses depending on the identity of a competing plant,as found in this study.
The results of this study contrast with those of a temporaldynamism study by Trinder et al. (2012) which examined theinfluence of interspecific competition on the temporal dynamicsof nitrogen uptake and biomass accumulation using Dactylisglomerata and Plantago lanceolata, two perennial grasslandspecies. D. glomerata was the later of the two species, andP. lanceolata the earlier species. They found a 7 days delay forD. glomerata and a 5 days advancement for P. lanceolata inmaximum biomass accumulation rate in competition comparedto plants in isolation, with a similar pattern of divergencefor peak nitrogen accumulation rate. We did not find thesetrends between two cultivars, with no significant shifts in peakbiomass accumulation rate and a significant delay in peaknitrogen accumulation rate only when Proctor was in owncultivar competition.
In our study Proctor was the less competitive of the twocultivars, as it experienced a greater decrease in nitrogen andbiomass accumulation when in competition compared to Tammi.
Frontiers in Plant Science | www.frontiersin.org 6 February 2019 | Volume 10 | Article 215
fpls-10-00215 February 21, 2019 Time: 19:27 # 7
Schofield et al. Temporal Dynamics of Resource Capture
This contrasts with the Trinder et al. (2012) study which foundthat D. glomerata took up the most nitrogen and it could beargued was therefore the most competitive, despite being thelater species for peak nitrogen and biomass accumulation rate.Therefore, it should not be assumed that the earlier species orcultivar is automatically the most competitive.
Trinder et al. (2012) also found that competition reducedthe period between peak nitrogen and biomass accumulationrate compared to plants in isolation, from 10 to 1 days forD. glomerata, and from fourteen to 3 days for P. lanceolata. Wealso found this effect, but only when Proctor was in competition,which caused a shortening of the period between peak rateof nitrogen uptake and biomass accumulation by 18.5 days inintra-cultivar competition and 5.5 days when in inter-cultivarcompetition. However, the reason for this response is unclear.It could be a phenological change in response to competition, apattern previously observed in cases of abiotic stress (Kazan andLyons, 2016) and pathogen attack (Korves and Bergelson, 2003).
Temporal Segregation of Nitrogen and BiomassAccumulationThe processes of nitrogen and biomass accumulation weretemporally distinct for both cultivars. The peak rate ofnitrogen accumulation was 29.0–29.5 days before peak biomassaccumulation for Tammi and 16.5–27.5 days for Proctor(Figure 1). The gap between peak nitrogen and biomassaccumulation was less variable for Tammi compared to Proctor.Tammi was specifically bred for an early phenotype (Nitcher et al.,2013), whereas Proctor was bred for malting quality (Hornsey,2003). This selection pressure for phenology in Tammi maygo some way to explaining the lack of variability in the gapbetween peak nitrogen and biomass accumulation in responseto competition. Future studies could investigate whether similarresponse patterns are found in the genotypes of wild species or inwild species with contrasting phenologies.
Barley has been found to have temporally distinct nitrogenand biomass accumulation with a 23–24 day gap betweenpeak nitrogen and biomass accumulation in field studies(Malhi et al., 2006). The gap between the peak nitrogen andbiomass accumulation rate was shortened when Proctor was incompetition, indicating the impact of plant-plant competition onthe temporal dynamics of nitrogen accumulation. The greatestreduction in the gap between peak nitrogen and biomassaccumulation rate occurred when Proctor was in intra-cultivarcompetition. This was also the treatment with the lowest absoluteshoot nitrogen concentration, suggesting delaying peak rate ofnitrogen accumulation for this cultivar is a response to intra-cultivar competition.
Impact of Competition on Final Nitrogenand Biomass AccumulationCompetition significantly reduced the final maximum nitrogenconcentration and biomass that both Proctor and Tammi wereable to accumulate in intra- or inter-cultivar competition.A Proctor competitor caused a significant decrease inTammi maximum biomass accumulation and nitrogen shootconcentration, despite not achieving the greatest biomass above
or below ground. This suggests that another factor influencedthe rate of nitrogen uptake. Signaling through root volatilecompounds or root exudates has been found in a number ofspecies including legumes and grasses (Pierik et al., 2013) andmay be acting here. Plant root exudates select for a specificmicrobial community (Shi et al., 2016) and have been foundto affect the rate of microbial soil organic matter turnover(Mergel et al., 1998). Therefore, plants may influence the timingof soil microbial community activity in order to reduce directcompetition for resources. However, as we are only starting tounderstand the role of short term-temporal dynamism in plantinteractions (Schofield et al., 2018) it is not surprising that furtherstudies are required to determine the role of the root exudatesin neighbor recognition and temporally dynamic responses,and why this response is greater for intra- compared to inter-specific competition.
Shoot C:N in Response to Identity of aCompeting IndividualThe two cultivars differed in their C:N ratio by the end of theexperiment. This is likely due to the earlier cultivar Tammi beingmore advanced developmentally than Proctor. By the end ofthe experiment, Tammi had begun grain production, whereasProctor had produced a flag leaf, the stage before grain formation.However, there was no significant increase in C:N in eithercultivar in response to competition. Due to selective breeding fora specific seed C:N (grain nitrogen content) with known mappedgenes (Cai et al., 2013) it is unlikely that C:N is highly plastic inbarley, making it a poor measure of competition in this case.
Is Greater Complementarity Achieved?The negative RII indicated both cultivars experiencedcompetition when grown with a neighboring plant, butno significant difference depending on the identity of thecompetitor. This contrasts with the positive LER value whichindicated overyielding of the two cultivars when grown in inter-cultivar competition compared to intra-cultivar competition.The reason for this is unclear and may be due to the timing of thefinal harvest, before both cultivars had set seed. This highlightsthe difficulty of using multiple metrics to measure the outcomeof competition, especially as the measurements were only takenat the end of the experiment, i.e., at a single timepoint. Therefore,single timepoint competition indices should be used with cautionwhen examining the consequences of temporal dynamism ofresource capture.
There is a need to understand the extent to which a speciesor genotype is temporally dynamic and the factors that leadto temporal dynamism in resource capture. This will allowtemporal dynamism in resource capture to be included in modelsof coexistence, furthering our understanding of coexistence incomplex plant communities.
CONCLUSION
This study demonstrates how a previously overlooked factor inplant community coexistence, within-growing season temporal
Frontiers in Plant Science | www.frontiersin.org 7 February 2019 | Volume 10 | Article 215
fpls-10-00215 February 21, 2019 Time: 19:27 # 8
Schofield et al. Temporal Dynamics of Resource Capture
dynamism of resource capture, can be measured throughsuccessive harvesting and the novel application of commonlyused statistical approaches. Only peak nitrogen accumulationrate was temporally dynamic in response to competition, notbiomass peak accumulation rate or shoot C:N. Therefore, wesuggest that to understand the temporal dynamics of resourcecapture within a growing season, direct measures of mineralresources accumulated (e.g., nitrogen uptake) are important tounderstand the mechanisms of temporally dynamic responsesto competition. By measuring shoot nitrogen accumulation rateover time, intra-cultivar competition was found to advancepeak nitrogen accumulation rate in Tammi and delay it inProctor. This suggests that temporally dynamic nitrogen uptakeresponses are greater in intra-cultivar competition and maybe due to kin recognition. This may be mediated throughroot exudates and the soil microbial community, an area thatrequires further investigation and extension to semi-naturaland natural ecosystems. Ultimately understanding the role oftemporal dynamism in plant communities will lead to improvedniche models of coexistence in plant communities.
DATA AVAILABILITY
The datasets generated for this study can be found in the DryadDigital Repository.
AUTHOR CONTRIBUTIONS
ES, RB, JR, EP, FQB, and EACP conceived the experimentaldesign. ES collected the data. RB, MB, JR, and ES analyzed thedata. All authors wrote and/or edited the manuscript.
FUNDING
ES was funded by Manchester Metropolitan University and theJames Hutton Institute, RB, MB, and EP were funded by theRural and Environment Science and Analytical Services Divisionof the Scottish Government through the Strategic ResearchProgramme 2016–2021.
ACKNOWLEDGMENTS
We would like to thank Adrian Newton for his advice about thetraits of the barley cultivars used in this study.
SUPPLEMENTARY MATERIAL
The Supplementary Material for this article can be found onlineat: https://www.frontiersin.org/articles/10.3389/fpls.2019.00215/full#supplementary-material
REFERENCESAshton, I. W., Miller, A. E., Bowman, W. D., and Suding, K. N. (2010).
Niche complementarity due to plasticity in resource use: plantpartitioning of chemical N forms. Ecology 91, 3252–3260. doi: 10.1890/09-1849.1
Bais, H. P. (2015). Shedding light on kin recognition response in plants. New Phytol.205, 4–6. doi: 10.1111/nph.13155
Biedrzycki, M. L., Jilany, T. A., Dudley, S. A., and Bais, H. P. (2010). Root exudatesmediate kin recognition in plants. Commun. Integr. Biol. 3, 28–35. doi: 10.4161/cib.3.1.10118
Cai, S., Yu, G., Chen, X., Huang, Y., Jiang, X., Zhang, G., et al. (2013). Grain proteincontent variation and its association analysis in barley. BMC Plant Biol. 13:35.doi: 10.1186/1471-2229-13-35
Clark, J. S. (2010). Individuals and the variation needed for high speciesdiversity in forest trees. Science 327, 1129–1132. doi: 10.1126/science.1183506
Díaz-Sierra, R., Verwijmeren, M., Rietkerk, M., de Dios, V. R., and Baudena, M.(2017). A new family of standardized and symmetric indices for measuringthe intensity and importance of plant neighbour effects. Methods Ecol. Evol. 8,580–591. doi: 10.1111/2041-210X.12706
Dordas, C. (2009). Dry matter, nitrogen and phosphorus accumulation,partitioning and remobilization as affected by N and P fertilization andsource-sink relations. Eur. J. Agron. 30, 129–139. doi: 10.1016/j.eja.2008.09.001
Dudley, S. A., and File, A. L. (2007). Kin recognition in an annual plant. Biol. Lett.3, 435–438. doi: 10.1098/rsbl.2007.0232
Hornsey, I. S. (2003). History of Beer and Brewing. London: Royal Society ofChemistry.
Jaeger, C. H., Monson, R. K., Fisk, M. C., and Schmidt, S. K. (1999). Seasonalpartitioning of nitrogen by plants and soil microorganisms in an alpineecosystem. America 80, 1883–1891.
Kazan, K., and Lyons, R. (2016). The link between flowering time and stresstolerance. J. Exp. Bot. 67, 47–60. doi: 10.1093/jxb/erv441
Kipling, R. P., and Warren, J. (2014). An investigation of temporal floweringsegregation in species-rich grasslands. Ecol. Res. 29, 213–224. doi: 10.1007/s11284-013-1116-z
Korves, T. M., and Bergelson, J. (2003). A developmental response to pathogeninfection in Arabidopsis. Plant Physiol. 133, 339–347. doi: 10.1104/PP.103.027094
Malhi, S. S., Johnston, A. M., Schoenau, J. J., Wang, Z. L., and Vera, C. L. (2006).Seasonal biomass accumulation and nutrient uptake of wheat, barley and oaton a black chernozem soil in Saskatchewan. Can. J. Plant Sci. 86, 1005–1014.doi: 10.4141/P05-116
Mead, R., and Willey, R. W. (1980). The concept of a ‘land equivalent ratio’ andadvantages in yields from intercropping. Exp. Agric. 16, 217–228. doi: 10.1017/S0014479700010978
Mergel, A., Timchenko, A., and Kudeyarov, V. (1998). “Role of plant root exudatesin soil carbon and nitrogen transformation,” in Root Demographics and TheirEfficiencies in Sustainable Agriculture, Grasslands and Forest Ecosystems, ed. J. E.Box Jr. (Dordrecht: Springer), 43–54.
Murphy, G. P., Swanton, C. J., Van Acker, R. C., and Dudley, S. A. (2017). Kinrecognition, multilevel selection and altruism in crop sustainability. J. Ecol. 105,930–934. doi: 10.1111/1365-2745.12787
Nielsen, N. E., and Jensen, H. E. (1986). The course of nitrogen uptake by springbarley from soil and fertilizer nitrogen. Plant Soil 91, 391–395. doi: 10.1007/BF02198130
Nitcher, R., Distelfeld, A., Tan, C., Yan, L., and Dubcovsky, J. (2013). Increasedcopy number at the HvFT1 locus is associated with accelerated floweringtime in barley. Mol. Genet. Genomics 288, 261–275. doi: 10.1007/s00438-013-0746-8
Pierik, R., Mommer, L., and Voesenek, L. A. (2013). Molecular mechanisms ofplant competition: neighbour detection and response strategies. Funct. Ecol. 27,841–853. doi: 10.1111/1365-2435.12010
Poorter, H., Anten, N. P. R., and Marcelis, L. F. M. (2013). Physiologicalmechanisms in plant growth models: do we need a supra-cellular systemsbiology approach? Plant. Cell Environ. 36, 1673–1690. doi: 10.1111/pce.12123
Frontiers in Plant Science | www.frontiersin.org 8 February 2019 | Volume 10 | Article 215
fpls-10-00215 February 21, 2019 Time: 19:27 # 9
Schofield et al. Temporal Dynamics of Resource Capture
R Core Team (2015). R: A language and Environment for Statistical Computing.Vienna: R Foundation for Statistical Computing.
Robinson, D., Davidson, H., Trinder, C., and Brooker, R. (2010). Root-shoot growth responses during interspecific competition quantifiedusing allometric modelling. Ann. Bot. 106, 921–926. doi: 10.1093/aob/mcq186
Schöb, C., Brooker, R. W., and Zuppinger-Dingley, D. (2018). Evolution offacilitation requires diverse communities. Nat. Ecol. Evol. 2, 1381–1385. doi:10.1038/s41559-018-0623-2
Schofield, E. J., Rowntree, J. K., Paterson, E., and Brooker, R. W. (2018). Temporaldynamism of resource capture: a missing factor in ecology? Trends Ecol. Evol.33, 277–286. doi: 10.1016/j.tree.2018.01.009
Semchenko, M., Saar, S., and Lepik, A. (2017). Intraspecific genetic diversitymodulates plant-soil feedback and nutrient cycling. New Phytol. 216, 90–98.doi: 10.1111/nph.14653
Shi, S., Nuccio, E. E., Shi, Z. J., He, Z., Zhou, J., and Firestone, M. K. (2016).The interconnected rhizosphere: high network complexity dominatesrhizosphere assemblages. Ecol. Lett. 19, 926–936. doi: 10.1111/ele.12630
Silvertown, J. (2004). Plant coexistence and the niche. Trends Ecol. Evol. 19,605–611. doi: 10.1016/j.tree.2004.09.003
Sousa-Nunes, R., and Somers, W. G. (2010). Phosphorylation anddephosphorylation events allow for rapid segregation of fate determinants
during Drosophila neuroblast asymmetric divisions. Commun. Integr. Biol. 3,28–35. doi: 10.4161/cib.3.1.10118
Spink, J., Blake, J., Bingham, I., Hoad, S., and Foulkes, J. (2015). Barley GrowthGuide: Managing Barley Growth. Available at: https://cereals.ahdb.org.uk/media/186381/g67-barley-growth-guide.pdf.
Trinder, C., Brooker, R., Davidson, H., and Robinson, D. (2012). Dynamictrajectories of growth and nitrogen capture by competing plants. New Phytol.193, 948–958. doi: 10.1111/j.1469-8137.2011.04020.x
Yin, X., Goudriaan, J., Lantinga, E. A., Vos, J., and Spiertz, H. J. (2003). A flexiblesigmoid function of determinate growth. Ann. Bot. 91, 361–371. doi: 10.1093/aob/mcg029
Conflict of Interest Statement: The authors declare that the research wasconducted in the absence of any commercial or financial relationships that couldbe construed as a potential conflict of interest.
Copyright © 2019 Schofield, Rowntree, Paterson, Brewer, Price, Brearley and Brooker.This is an open-access article distributed under the terms of the Creative CommonsAttribution License (CC BY). The use, distribution or reproduction in other forumsis permitted, provided the original author(s) and the copyright owner(s) are creditedand that the original publication in this journal is cited, in accordance with acceptedacademic practice. No use, distribution or reproduction is permitted which does notcomply with these terms.
Frontiers in Plant Science | www.frontiersin.org 9 February 2019 | Volume 10 | Article 215
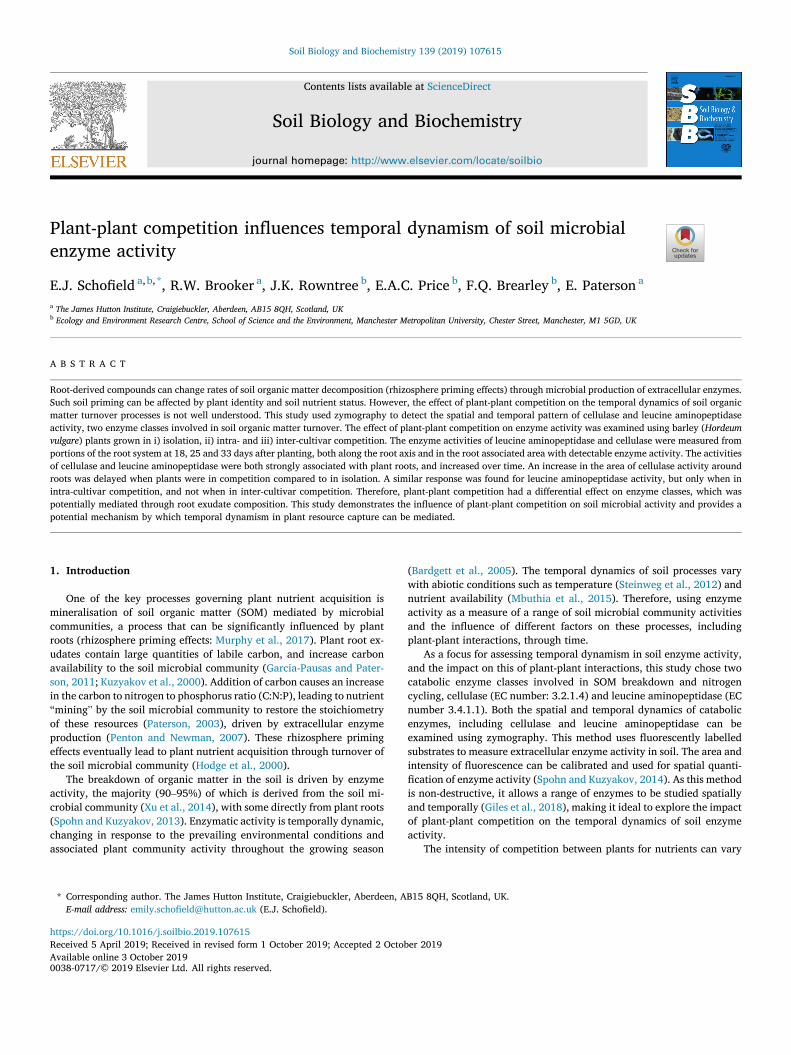
Soil Biology and Biochemistry 139 (2019) 107615
Available online 3 October 20190038-0717/© 2019 Elsevier Ltd. All rights reserved.
Plant-plant competition influences temporal dynamism of soil microbial enzyme activity
E.J. Schofield a,b,*, R.W. Brooker a, J.K. Rowntree b, E.A.C. Price b, F.Q. Brearley b, E. Paterson a
a The James Hutton Institute, Craigiebuckler, Aberdeen, AB15 8QH, Scotland, UK b Ecology and Environment Research Centre, School of Science and the Environment, Manchester Metropolitan University, Chester Street, Manchester, M1 5GD, UK
A B S T R A C T
Root-derived compounds can change rates of soil organic matter decomposition (rhizosphere priming effects) through microbial production of extracellular enzymes. Such soil priming can be affected by plant identity and soil nutrient status. However, the effect of plant-plant competition on the temporal dynamics of soil organic matter turnover processes is not well understood. This study used zymography to detect the spatial and temporal pattern of cellulase and leucine aminopeptidase activity, two enzyme classes involved in soil organic matter turnover. The effect of plant-plant competition on enzyme activity was examined using barley (Hordeum vulgare) plants grown in i) isolation, ii) intra- and iii) inter-cultivar competition. The enzyme activities of leucine aminopeptidase and cellulase were measured from portions of the root system at 18, 25 and 33 days after planting, both along the root axis and in the root associated area with detectable enzyme activity. The activities of cellulase and leucine aminopeptidase were both strongly associated with plant roots, and increased over time. An increase in the area of cellulase activity around roots was delayed when plants were in competition compared to in isolation. A similar response was found for leucine aminopeptidase activity, but only when in intra-cultivar competition, and not when in inter-cultivar competition. Therefore, plant-plant competition had a differential effect on enzyme classes, which was potentially mediated through root exudate composition. This study demonstrates the influence of plant-plant competition on soil microbial activity and provides a potential mechanism by which temporal dynamism in plant resource capture can be mediated.
1. Introduction
One of the key processes governing plant nutrient acquisition is mineralisation of soil organic matter (SOM) mediated by microbial communities, a process that can be significantly influenced by plant roots (rhizosphere priming effects: Murphy et al., 2017). Plant root ex-udates contain large quantities of labile carbon, and increase carbon availability to the soil microbial community (Garcia-Pausas and Pater-son, 2011; Kuzyakov et al., 2000). Addition of carbon causes an increase in the carbon to nitrogen to phosphorus ratio (C:N:P), leading to nutrient “mining” by the soil microbial community to restore the stoichiometry of these resources (Paterson, 2003), driven by extracellular enzyme production (Penton and Newman, 2007). These rhizosphere priming effects eventually lead to plant nutrient acquisition through turnover of the soil microbial community (Hodge et al., 2000).
The breakdown of organic matter in the soil is driven by enzyme activity, the majority (90–95%) of which is derived from the soil mi-crobial community (Xu et al., 2014), with some directly from plant roots (Spohn and Kuzyakov, 2013). Enzymatic activity is temporally dynamic, changing in response to the prevailing environmental conditions and associated plant community activity throughout the growing season
(Bardgett et al., 2005). The temporal dynamics of soil processes vary with abiotic conditions such as temperature (Steinweg et al., 2012) and nutrient availability (Mbuthia et al., 2015). Therefore, using enzyme activity as a measure of a range of soil microbial community activities and the influence of different factors on these processes, including plant-plant interactions, through time.
As a focus for assessing temporal dynamism in soil enzyme activity, and the impact on this of plant-plant interactions, this study chose two catabolic enzyme classes involved in SOM breakdown and nitrogen cycling, cellulase (EC number: 3.2.1.4) and leucine aminopeptidase (EC number 3.4.1.1). Both the spatial and temporal dynamics of catabolic enzymes, including cellulase and leucine aminopeptidase can be examined using zymography. This method uses fluorescently labelled substrates to measure extracellular enzyme activity in soil. The area and intensity of fluorescence can be calibrated and used for spatial quanti-fication of enzyme activity (Spohn and Kuzyakov, 2014). As this method is non-destructive, it allows a range of enzymes to be studied spatially and temporally (Giles et al., 2018), making it ideal to explore the impact of plant-plant competition on the temporal dynamics of soil enzyme activity.
The intensity of competition between plants for nutrients can vary
* Corresponding author. The James Hutton Institute, Craigiebuckler, Aberdeen, AB15 8QH, Scotland, UK. E-mail address: [email protected] (E.J. Schofield).
Contents lists available at ScienceDirect
Soil Biology and Biochemistry
journal homepage: http://www.elsevier.com/locate/soilbio
https://doi.org/10.1016/j.soilbio.2019.107615 Received 5 April 2019; Received in revised form 1 October 2019; Accepted 2 October 2019
Soil Biology and Biochemistry 139 (2019) 107615
2
spatiotemporally (Caffaro et al., 2013); this can alter the temporal dy-namics of nitrogen accumulation (Schofield et al., 2019) when plants are in competition compared to isolation, with potential consequences for the temporal dynamics of soil microbial community enzyme activity. The temporal dynamics of nitrogen and biomass accumulation have been studied in barley (Hordeum vulgare) (Schofield et al., 2019). A delay in peak nitrogen uptake was found when the Proctor cultivar was grown in intra-cultivar competition but not inter-cultivar competition. This response may be due to a change in the temporal dynamics of root associated soil enzyme activity influencing nutrient availability for plants. Therefore, to explore whether such changes in the timing of soil processes do occur, Proctor was chosen as the focal cultivar of this study.
Two main approaches for analysing zymography images have emerged in the last decade. Spohn and Kuzyakov (2014) measured the root associated area of cellulase activity as a percentage of the total sampled area (root associated area) when assessing the activity of cel-lulases, chitinases and phosphatases in the presence of living and dead Lupinus polyphyllus roots. Alternatively, Giles et al. (2018) took a root-centric approach, measuring phosphatase activity along Hordeum vulgare root axis (root axis). The Spohn and Kuzyakov (2014) method takes a subsection of the greyscale values, excluding the lightest and darkest pixels; in contrast Giles et al. (2018) used the total pixel range. The Spohn and Kuzyakov (2014) method excludes pixels that are extremely bright, which may skew the total dataset. However, by focussing on the extent of activity in terms of area instead of intensity of activity along the root axis, a relatively small proportion of the soil volume, subtle temporal dynamics of enzyme activity may be more easily detected.
This study aimed to determine the influence of plant-plant compe-tition on the soil microbial community while keeping other environ-mental factors constant. We also took the opportunity to use both approaches for analysing zymography images. Our aim was to deter-mine the effect of plant-plant competition on the temporal activity dy-namics of the two enzyme classes, outside of the zone of most intense competition. Plant root architecture can demonstrate a compensatory response to plant-plant competition (Caffaro et al., 2013). It is expected that enzyme activity surrounding plant roots will show similar trends to root architecture, with increased enzyme activity surrounding roots outside the zone of most intense competition when the plants are in competition compared to isolation. As competition can be less intense between more closely related individual plants, due to changes in the temporal dynamics of resource capture, it is expected that interactions between more closely related individuals will promote less intense enzyme activity than inter-cultivar competition.
2. Materials and methods
2.1. Soil characterisation
Soil was collected from an agricultural field that had previously been cropped with spring barley (Hordeum sp.) and had been subject to standard fertilisation conditions (500 kg of N ha� 1 yr� 1 in the ratio of N 22: P 4: K 14) (Balruddery Farm, Invergowrie, Scotland, 56.4837� N, 3.1314� W). The soil was then passed through a 3 mm sieve to homog-enise the substrate. The soil had an organic matter content (humus) of 6.2% � 0.3% SEM (loss-on-ignition, n ¼ 4) and a mean pH (in water) of 5.7 � 0.02 SEM (n ¼ 4), a total inorganic nitrogen concentration of 1.55 � 0.46 mg g� 1 (n ¼ 4) and microbial C biomass (using a chloroform extraction) of 0.06 � 0.002 SEM mg g� 1 (n ¼ 4). No fertilisation occurred during the experiment.
2.2. Rhizobox preparation
Rhizoboxes (150 mm � 150 mm x 10 mm Perspex boxes with a removable side for access to roots) were packed to a bulk density of 1.26 g cm� 3, ensuring the soil was level with the edge of each box. Seeds
of Proctor and Tammi barley (Hordeum sp.) cultivars were pre- germinated on damp tissue paper in the dark at room temperature for two days before planting. Three replicates of each treatment: Proctor alone (P), Proctor in intra-cultivar competition (PP) and Proctor in inter- cultivar competition with Tammi (TP) were planted, as well as a bare soil control, giving 12 rhizoboxes in total. In the planted treatments, the germinated seeds were placed on the surface of the soil, ensuring contact between the emerging roots and soil surface, and then the side of the box was replaced and secured. In the planted treatments containing two plants, the germinated seeds were placed 2.5 cm apart to ensure no aboveground interaction between the two plants.
The rhizoboxes were wrapped in foil to exclude light from the roots and placed at a 45� angle to encourage root growth over the soil surface. The rhizoboxes were kept in a controlled environment cabinet (Jumo IMAGO 3000, Harlow, Essex, UK) at a constant 15 �C, 65% relative humidity and a 16/8 (day/night) (light intensity: 200 μmol m� 2 s� 1) photoperiod for the duration of the experiment to mimic local spring-time conditions. Each rhizobox was watered weekly with sufficient water to maintain soil moisture at field capacity and prevent root desiccation.
2.3. Soil zymography
Enzyme activity was measured three times at weekly intervals be-tween 18 and 39 days after planting. This is the period prior to peak barley nitrogen accumulation rate found in our previous study (Scho-field et al., 2019). Areas away from the competition zone between the two plants were visually identified and labelled on the rhizobox rim to ensure measurements of soil enzyme activity occurred at a consistent location throughout the study. These were roots of the focal individual that consistently did not encounter roots of the other individual within the system. This setup was used to indicate whether a compensatory or systemic response to plant-plant competition could be detected in soil enzyme activity.
Two fluorescently labelled substrates were selected for this study; 4- methylumbellferyl ß-D-cellobioside, a substrate of cellulase which was imaged at 365 nm (excitation at 365 nm, emission at 455 nm) and L- leucine-7-amido-methylcoumarin hydrochloride, a substrate of leucine aminopeptidase that was imaged at 302 nm (excitation at 327 nm, emission at 349 nm) (Sigma-Aldrich, Reading, UK). Both substrates were diluted to a 6 mM concentration, the concentration used in previous studies using methylumbellferyl ß-D-cellobioside (Spohn and Kuzyakov, 2014) and the optimum concentration found during preliminary ex-periments (results not shown). A 47 mm diameter polyamide membrane (Whatman, GE Healthcare, Buckinghamshire, UK) was soaked in 300 μl of 6 mM of 4-methylumbellferyl ß-D-cellobioside or L-leucine-7-ami-do-methylcoumarin hydrochloride. On sampling days, the side of each rhizobox was removed and a 1% agarose (Invitrogen, Carlsbad, CA, USA) gel of 1 mm thickness was placed on the soil surface to protect the membrane from soil particles which could adhere to it and disrupt the final image, whilst allowing the diffusion of extracellular enzymes (Spohn and Kuzyakov, 2014). The membrane was then placed on top of the gel and the foil was replaced over the top to exclude light and minimise moisture loss during enzyme assays.
Previous studies have incubated similar substrate soaked membranes for between 30 min and 3 h (Giles et al., 2018; Spohn and Kuzyakov, 2014). Therefore, a preliminary study was carried out which found that, for this system, an incubation of 1 h gave a good level of resolution and UV intensity when viewed (results not shown). Following incubation (1 h), the membrane was placed onto a fresh 1% agarose gel to minimise bubbling of the membrane during imaging. The membrane and gel were then placed in an UV imaging box (BioDoc-It2 Imager, Analytik Jena, Upland, CA) and imaged at 365 nm (Spohn and Kuzyakov, 2014). This was repeated for L-leucine-7-amido-methylcoumarin hydrochloride, which was imaged at 302 nm (Ma et al., 2018). This order of substrate sampling was maintained throughout the experimental period (Spohn
E.J. Schofield et al.
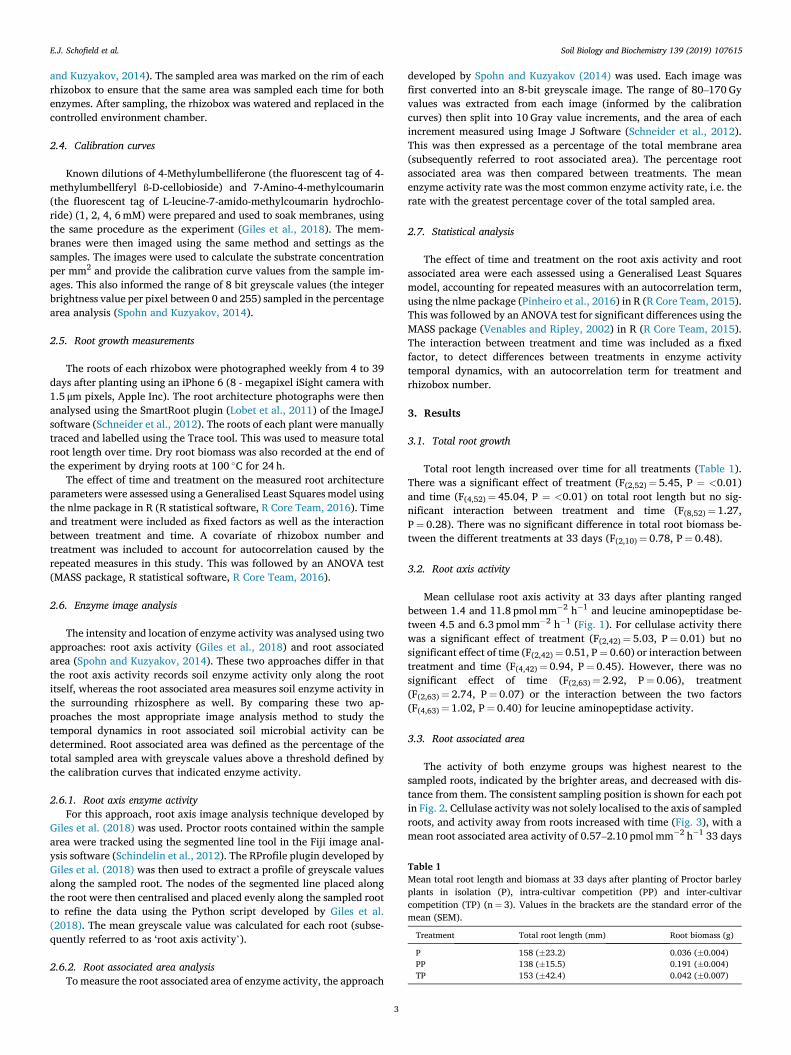
Soil Biology and Biochemistry 139 (2019) 107615
3
and Kuzyakov, 2014). The sampled area was marked on the rim of each rhizobox to ensure that the same area was sampled each time for both enzymes. After sampling, the rhizobox was watered and replaced in the controlled environment chamber.
2.4. Calibration curves
Known dilutions of 4-Methylumbelliferone (the fluorescent tag of 4- methylumbellferyl ß-D-cellobioside) and 7-Amino-4-methylcoumarin (the fluorescent tag of L-leucine-7-amido-methylcoumarin hydrochlo-ride) (1, 2, 4, 6 mM) were prepared and used to soak membranes, using the same procedure as the experiment (Giles et al., 2018). The mem-branes were then imaged using the same method and settings as the samples. The images were used to calculate the substrate concentration per mm2 and provide the calibration curve values from the sample im-ages. This also informed the range of 8 bit greyscale values (the integer brightness value per pixel between 0 and 255) sampled in the percentage area analysis (Spohn and Kuzyakov, 2014).
2.5. Root growth measurements
The roots of each rhizobox were photographed weekly from 4 to 39 days after planting using an iPhone 6 (8 - megapixel iSight camera with 1.5 μm pixels, Apple Inc). The root architecture photographs were then analysed using the SmartRoot plugin (Lobet et al., 2011) of the ImageJ software (Schneider et al., 2012). The roots of each plant were manually traced and labelled using the Trace tool. This was used to measure total root length over time. Dry root biomass was also recorded at the end of the experiment by drying roots at 100 �C for 24 h.
The effect of time and treatment on the measured root architecture parameters were assessed using a Generalised Least Squares model using the nlme package in R (R statistical software, R Core Team, 2016). Time and treatment were included as fixed factors as well as the interaction between treatment and time. A covariate of rhizobox number and treatment was included to account for autocorrelation caused by the repeated measures in this study. This was followed by an ANOVA test (MASS package, R statistical software, R Core Team, 2016).
2.6. Enzyme image analysis
The intensity and location of enzyme activity was analysed using two approaches: root axis activity (Giles et al., 2018) and root associated area (Spohn and Kuzyakov, 2014). These two approaches differ in that the root axis activity records soil enzyme activity only along the root itself, whereas the root associated area measures soil enzyme activity in the surrounding rhizosphere as well. By comparing these two ap-proaches the most appropriate image analysis method to study the temporal dynamics in root associated soil microbial activity can be determined. Root associated area was defined as the percentage of the total sampled area with greyscale values above a threshold defined by the calibration curves that indicated enzyme activity.
2.6.1. Root axis enzyme activity For this approach, root axis image analysis technique developed by
Giles et al. (2018) was used. Proctor roots contained within the sample area were tracked using the segmented line tool in the Fiji image anal-ysis software (Schindelin et al., 2012). The RProfile plugin developed by Giles et al. (2018) was then used to extract a profile of greyscale values along the sampled root. The nodes of the segmented line placed along the root were then centralised and placed evenly along the sampled root to refine the data using the Python script developed by Giles et al. (2018). The mean greyscale value was calculated for each root (subse-quently referred to as ‘root axis activity’).
2.6.2. Root associated area analysis To measure the root associated area of enzyme activity, the approach
developed by Spohn and Kuzyakov (2014) was used. Each image was first converted into an 8-bit greyscale image. The range of 80–170 Gy values was extracted from each image (informed by the calibration curves) then split into 10 Gray value increments, and the area of each increment measured using Image J Software (Schneider et al., 2012). This was then expressed as a percentage of the total membrane area (subsequently referred to root associated area). The percentage root associated area was then compared between treatments. The mean enzyme activity rate was the most common enzyme activity rate, i.e. the rate with the greatest percentage cover of the total sampled area.
2.7. Statistical analysis
The effect of time and treatment on the root axis activity and root associated area were each assessed using a Generalised Least Squares model, accounting for repeated measures with an autocorrelation term, using the nlme package (Pinheiro et al., 2016) in R (R Core Team, 2015). This was followed by an ANOVA test for significant differences using the MASS package (Venables and Ripley, 2002) in R (R Core Team, 2015). The interaction between treatment and time was included as a fixed factor, to detect differences between treatments in enzyme activity temporal dynamics, with an autocorrelation term for treatment and rhizobox number.
3. Results
3.1. Total root growth
Total root length increased over time for all treatments (Table 1). There was a significant effect of treatment (F(2,52) ¼ 5.45, P ¼ <0.01) and time (F(4,52) ¼ 45.04, P ¼ <0.01) on total root length but no sig-nificant interaction between treatment and time (F(8,52) ¼ 1.27, P ¼ 0.28). There was no significant difference in total root biomass be-tween the different treatments at 33 days (F(2,10) ¼ 0.78, P ¼ 0.48).
3.2. Root axis activity
Mean cellulase root axis activity at 33 days after planting ranged between 1.4 and 11.8 pmol mm� 2 h� 1 and leucine aminopeptidase be-tween 4.5 and 6.3 pmol mm� 2 h� 1 (Fig. 1). For cellulase activity there was a significant effect of treatment (F(2,42) ¼ 5.03, P ¼ 0.01) but no significant effect of time (F(2,42) ¼ 0.51, P ¼ 0.60) or interaction between treatment and time (F(4,42) ¼ 0.94, P ¼ 0.45). However, there was no significant effect of time (F(2,63) ¼ 2.92, P ¼ 0.06), treatment (F(2,63) ¼ 2.74, P ¼ 0.07) or the interaction between the two factors (F(4,63) ¼ 1.02, P ¼ 0.40) for leucine aminopeptidase activity.
3.3. Root associated area
The activity of both enzyme groups was highest nearest to the sampled roots, indicated by the brighter areas, and decreased with dis-tance from them. The consistent sampling position is shown for each pot in Fig. 2. Cellulase activity was not solely localised to the axis of sampled roots, and activity away from roots increased with time (Fig. 3), with a mean root associated area activity of 0.57–2.10 pmol mm� 2 h� 1 33 days
Table 1 Mean total root length and biomass at 33 days after planting of Proctor barley plants in isolation (P), intra-cultivar competition (PP) and inter-cultivar competition (TP) (n ¼ 3). Values in the brackets are the standard error of the mean (SEM).
Treatment Total root length (mm) Root biomass (g)
P 158 (�23.2) 0.036 (�0.004) PP 138 (�15.5) 0.191 (�0.004) TP 153 (�42.4) 0.042 (�0.007)
E.J. Schofield et al.
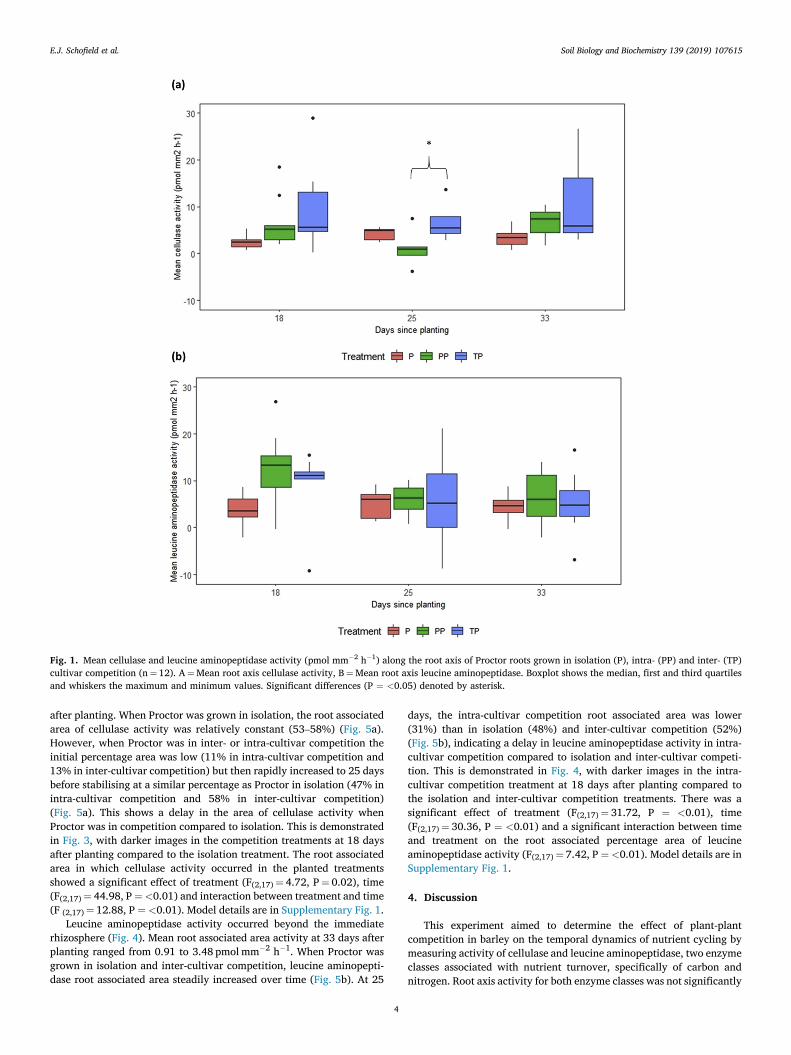
Soil Biology and Biochemistry 139 (2019) 107615
4
after planting. When Proctor was grown in isolation, the root associated area of cellulase activity was relatively constant (53–58%) (Fig. 5a). However, when Proctor was in inter- or intra-cultivar competition the initial percentage area was low (11% in intra-cultivar competition and 13% in inter-cultivar competition) but then rapidly increased to 25 days before stabilising at a similar percentage as Proctor in isolation (47% in intra-cultivar competition and 58% in inter-cultivar competition) (Fig. 5a). This shows a delay in the area of cellulase activity when Proctor was in competition compared to isolation. This is demonstrated in Fig. 3, with darker images in the competition treatments at 18 days after planting compared to the isolation treatment. The root associated area in which cellulase activity occurred in the planted treatments showed a significant effect of treatment (F(2,17) ¼ 4.72, P ¼ 0.02), time (F(2,17) ¼ 44.98, P ¼<0.01) and interaction between treatment and time (F (2,17) ¼ 12.88, P ¼ <0.01). Model details are in Supplementary Fig. 1.
Leucine aminopeptidase activity occurred beyond the immediate rhizosphere (Fig. 4). Mean root associated area activity at 33 days after planting ranged from 0.91 to 3.48 pmol mm� 2 h� 1. When Proctor was grown in isolation and inter-cultivar competition, leucine aminopepti-dase root associated area steadily increased over time (Fig. 5b). At 25
days, the intra-cultivar competition root associated area was lower (31%) than in isolation (48%) and inter-cultivar competition (52%) (Fig. 5b), indicating a delay in leucine aminopeptidase activity in intra- cultivar competition compared to isolation and inter-cultivar competi-tion. This is demonstrated in Fig. 4, with darker images in the intra- cultivar competition treatment at 18 days after planting compared to the isolation and inter-cultivar competition treatments. There was a significant effect of treatment (F(2,17) ¼ 31.72, P ¼ <0.01), time (F(2,17) ¼ 30.36, P ¼ <0.01) and a significant interaction between time and treatment on the root associated percentage area of leucine aminopeptidase activity (F(2,17) ¼ 7.42, P ¼ <0.01). Model details are in Supplementary Fig. 1.
4. Discussion
This experiment aimed to determine the effect of plant-plant competition in barley on the temporal dynamics of nutrient cycling by measuring activity of cellulase and leucine aminopeptidase, two enzyme classes associated with nutrient turnover, specifically of carbon and nitrogen. Root axis activity for both enzyme classes was not significantly
Fig. 1. Mean cellulase and leucine aminopeptidase activity (pmol mm� 2 h� 1) along the root axis of Proctor roots grown in isolation (P), intra- (PP) and inter- (TP) cultivar competition (n ¼ 12). A ¼Mean root axis cellulase activity, B ¼Mean root axis leucine aminopeptidase. Boxplot shows the median, first and third quartiles and whiskers the maximum and minimum values. Significant differences (P ¼ <0.05) denoted by asterisk.
E.J. Schofield et al.
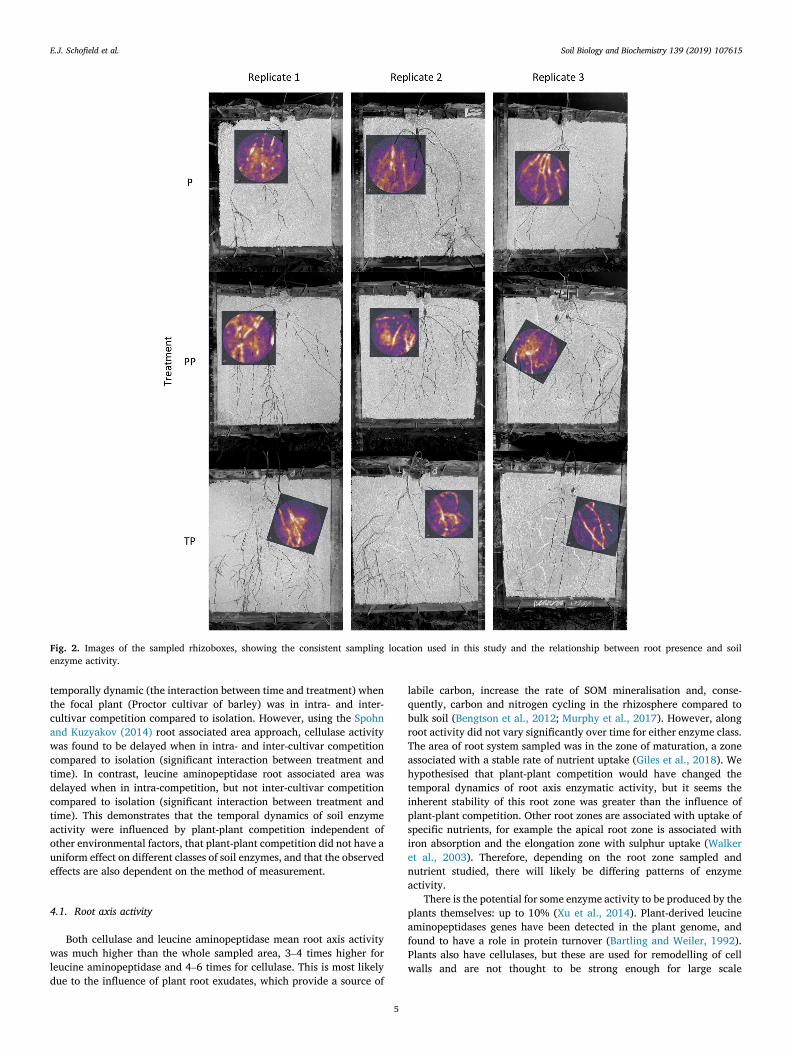
Soil Biology and Biochemistry 139 (2019) 107615
5
temporally dynamic (the interaction between time and treatment) when the focal plant (Proctor cultivar of barley) was in intra- and inter- cultivar competition compared to isolation. However, using the Spohn and Kuzyakov (2014) root associated area approach, cellulase activity was found to be delayed when in intra- and inter-cultivar competition compared to isolation (significant interaction between treatment and time). In contrast, leucine aminopeptidase root associated area was delayed when in intra-competition, but not inter-cultivar competition compared to isolation (significant interaction between treatment and time). This demonstrates that the temporal dynamics of soil enzyme activity were influenced by plant-plant competition independent of other environmental factors, that plant-plant competition did not have a uniform effect on different classes of soil enzymes, and that the observed effects are also dependent on the method of measurement.
4.1. Root axis activity
Both cellulase and leucine aminopeptidase mean root axis activity was much higher than the whole sampled area, 3–4 times higher for leucine aminopeptidase and 4–6 times for cellulase. This is most likely due to the influence of plant root exudates, which provide a source of
labile carbon, increase the rate of SOM mineralisation and, conse-quently, carbon and nitrogen cycling in the rhizosphere compared to bulk soil (Bengtson et al., 2012; Murphy et al., 2017). However, along root activity did not vary significantly over time for either enzyme class. The area of root system sampled was in the zone of maturation, a zone associated with a stable rate of nutrient uptake (Giles et al., 2018). We hypothesised that plant-plant competition would have changed the temporal dynamics of root axis enzymatic activity, but it seems the inherent stability of this root zone was greater than the influence of plant-plant competition. Other root zones are associated with uptake of specific nutrients, for example the apical root zone is associated with iron absorption and the elongation zone with sulphur uptake (Walker et al., 2003). Therefore, depending on the root zone sampled and nutrient studied, there will likely be differing patterns of enzyme activity.
There is the potential for some enzyme activity to be produced by the plants themselves: up to 10% (Xu et al., 2014). Plant-derived leucine aminopeptidases genes have been detected in the plant genome, and found to have a role in protein turnover (Bartling and Weiler, 1992). Plants also have cellulases, but these are used for remodelling of cell walls and are not thought to be strong enough for large scale
Fig. 2. Images of the sampled rhizoboxes, showing the consistent sampling location used in this study and the relationship between root presence and soil enzyme activity.
E.J. Schofield et al.
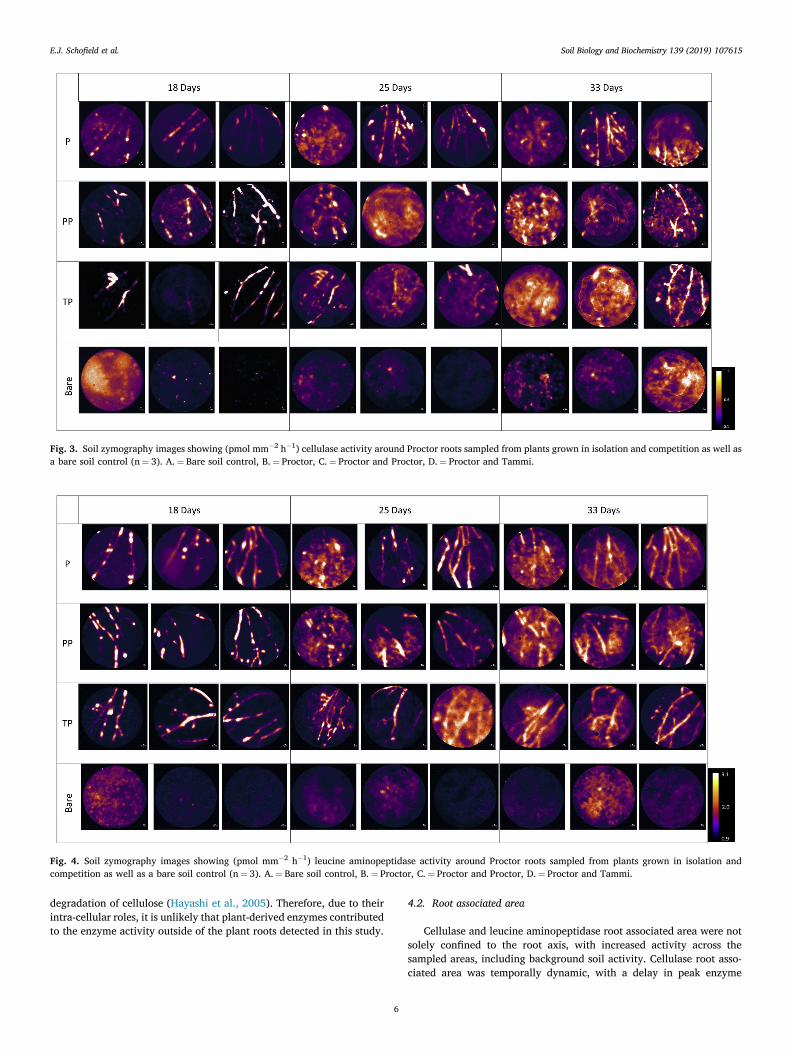
Soil Biology and Biochemistry 139 (2019) 107615
6
degradation of cellulose (Hayashi et al., 2005). Therefore, due to their intra-cellular roles, it is unlikely that plant-derived enzymes contributed to the enzyme activity outside of the plant roots detected in this study.
4.2. Root associated area
Cellulase and leucine aminopeptidase root associated area were not solely confined to the root axis, with increased activity across the sampled areas, including background soil activity. Cellulase root asso-ciated area was temporally dynamic, with a delay in peak enzyme
Fig. 3. Soil zymography images showing (pmol mm� 2 h� 1) cellulase activity around Proctor roots sampled from plants grown in isolation and competition as well as a bare soil control (n ¼ 3). A. ¼ Bare soil control, B. ¼ Proctor, C. ¼ Proctor and Proctor, D. ¼ Proctor and Tammi.
Fig. 4. Soil zymography images showing (pmol mm� 2 h� 1) leucine aminopeptidase activity around Proctor roots sampled from plants grown in isolation and competition as well as a bare soil control (n ¼ 3). A. ¼ Bare soil control, B. ¼ Proctor, C. ¼ Proctor and Proctor, D. ¼ Proctor and Tammi.
E.J. Schofield et al.
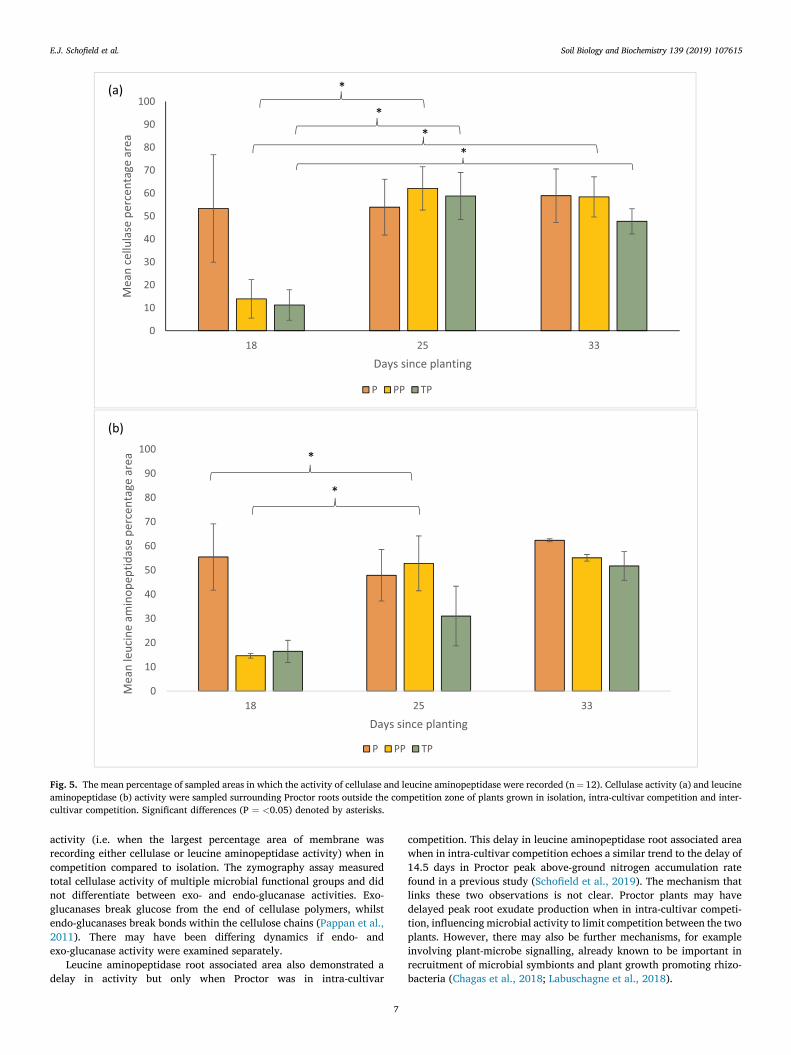
Soil Biology and Biochemistry 139 (2019) 107615
7
activity (i.e. when the largest percentage area of membrane was recording either cellulase or leucine aminopeptidase activity) when in competition compared to isolation. The zymography assay measured total cellulase activity of multiple microbial functional groups and did not differentiate between exo- and endo-glucanase activities. Exo- glucanases break glucose from the end of cellulase polymers, whilst endo-glucanases break bonds within the cellulose chains (Pappan et al., 2011). There may have been differing dynamics if endo- and exo-glucanase activity were examined separately.
Leucine aminopeptidase root associated area also demonstrated a delay in activity but only when Proctor was in intra-cultivar
competition. This delay in leucine aminopeptidase root associated area when in intra-cultivar competition echoes a similar trend to the delay of 14.5 days in Proctor peak above-ground nitrogen accumulation rate found in a previous study (Schofield et al., 2019). The mechanism that links these two observations is not clear. Proctor plants may have delayed peak root exudate production when in intra-cultivar competi-tion, influencing microbial activity to limit competition between the two plants. However, there may also be further mechanisms, for example involving plant-microbe signalling, already known to be important in recruitment of microbial symbionts and plant growth promoting rhizo-bacteria (Chagas et al., 2018; Labuschagne et al., 2018).
Fig. 5. The mean percentage of sampled areas in which the activity of cellulase and leucine aminopeptidase were recorded (n ¼ 12). Cellulase activity (a) and leucine aminopeptidase (b) activity were sampled surrounding Proctor roots outside the competition zone of plants grown in isolation, intra-cultivar competition and inter- cultivar competition. Significant differences (P ¼ <0.05) denoted by asterisks.
E.J. Schofield et al.
Soil Biology and Biochemistry 139 (2019) 107615
8
As the same area was sampled consistently over the experiment, the sampled area became increasingly far from the root tip, a known hotspot of soil microbial community enzyme activity. This may have influenced the activity of the two enzyme classes. Phosphatase activity has previ-ously been found to vary with distance from the root tip (Giles et al., 2018), which may have influenced the results presented. However, there was no significant difference in root biomass or total root length be-tween any of the treatments (Table 1), indicating that the relative sampling position remained consistent across treatments in this study. One benefit of sampling in the mature root zone is that it allows com-parisons among treatments as the sampled areas were all a similar dis-tance from the root tip at each time point. The zone of maturation is a region of the root with less exudation compared to the zone of elonga-tion (Badri and Vivanco, 2009), but with root hairs that provide greater surface area for nutrient absorption (Gilroy and Jones, 2000). There may have also been an influence of root branching which occurred in some of the sampled areas due to plant foraging for nutrients (Forde, 2014). This hypothesis requires further sampling of a greater proportion of the root system for a high resolution of spatiotemporal trends in microbial enzyme activity with root branching.
4.3. What role could root exudates have in the temporal dynamics of enzyme activity?
The different patterns of soil enzyme activity associated with the three treatments may have been driven by differences in root exudation, with changes in root exudate composition then affecting microbial ac-tivity. Plants select for a specific microbial community through root exudates (Hu et al., 2018; Shi et al., 2011). Therefore, root exudates may do more than simply increase the rate of nitrogen mineralisation (Mergel et al., 1998), and may also influence the timing of mineralisation by influencing soil microbial community composition.
Root exudation quality and quantity is known to change over time (van Dam and Bouwmeester, 2016) with root exudates increasing the carbon to nitrogen ratio in the rhizosphere, regulating mining of SOM by the soil microbial community (Chaparro et al., 2012; Meier et al., 2017). Exudates also act as a form of signalling between plants (van Dam and Bouwmeester, 2016), eliciting a change in root architecture (Caffaro et al., 2013), branching (Forde, 2014) and biomass allocation (Schmid et al., 2015). Therefore, the observed delay in soil enzyme activity could be regulated by temporally dynamic root exudation. Root branching would have also increased the total root area within the measurement areas, potentially increasing the total exudates available to the soil mi-crobial community and promoting greater enzymatic activity. Conse-quently, the active control of root exudates instead of root biomass or surface area alone may be an important part of the mechanism behind the observed shifts in soil microbial community activity. This is an exciting avenue for future research.
4.4. Temporal dynamics of enzyme activity in response to plant-plant competition
The soil enzyme classes in this study demonstrated different tem-poral patterns in activity in response to changes in plant-plant compe-tition. Relative to the isolated-plant control, the temporal dynamics of cellulase root associated area were influenced by both intra- and inter- cultivar competition, whereas leucine aminopeptidase dynamics were only significantly influenced by intra-cultivar competition.
The influence of plant-plant competition on the temporal dynamics of root associated enzyme area occurred beyond the immediate zone surrounding the root. This contrasts with the results of Ma et al. (2018), who found a strong localisation of leucine aminopeptidase and cellulase activity close to plant roots across the whole root system. Furthermore, they found that the root associated area did not increase over time around lentil roots (Lens culinaris) and only began to increase around Lupin (Lupinus albus) roots eight weeks into the study (Ma et al., 2018).
This is much later than the barley in our study, where sampling occurred in the first month of growth, the period prior to peak nitrogen accu-mulation rate in these barley cultivars (Schofield et al., 2019). This is likely to be a period of soil microbial community priming to mine for nitrogen within soil organic matter and may account for the differences between Ma et al.’s and our study. In our study the extent of the rhizosphere and therefore activity of leucine aminopeptidase and cellulase may have increased over time, as labile carbon in root exudates diffused away from roots and the zone of nutrient depletion surrounding roots enlarged.
Our study does however have its limitations. The rhizobox system is a very artificial setup with roots growing in a single plane, which would influence root growth and development. This does not account for the 3D nature of root growth and interactions with the soil particles and the soil microbial community. More complex interactions and temporally dynamic responses may be occurring in a 3D system through localised changes in the soil microbial community. Therefore, development of the zymography method in order to sample 3D root systems is a natural avenue for future research.
The temporal dynamics of enzyme activity are likely to be strongly influenced by environmental conditions including temperature (Stein-weg et al., 2012), soil moisture (Barros et al., 1995) and soil nutrient concentration (Mbuthia et al., 2015). This study demonstrates that the temporal dynamics of the two groups of enzymes, both involved in nutrient turnover, were affected differently by plant-plant competition when grown in constant environmental conditions. This could be due to the composition of root exudates and concentration of secondary me-tabolites that selected for a soil microbial community with specific functions (Hu et al., 2018; Shi et al., 2016). Plants could have therefore regulated soil microbial community activity through the differing sensitivity of microbial taxa to root exudates (Shi et al., 2011; Zhang et al., 2017).
5. Conclusions
Root axis activity of leucine aminopeptidase and cellulase was not temporally dynamic in response to plant-plant competition. Plant-plant competition influenced the root associated area of the two enzymes in this study differently. The extent of root associated cellulase area was delayed by inter- and intra-cultivar competition, whilst leucine amino-peptidase root associated area was only delayed by intra-cultivar competition. This may have been mediated through root exudates selecting for specific microbial functions. Therefore, conclusions con-cerning the temporal dynamics of nutrient cycling are likely to be dependent on the enzyme class being studied and method of image analysis used. Changes in these temporal dynamics may have been mediated through changes in the quantity and composition of root ex-udates by plants in competition, leading to a delay in peak soil enzyme activity. The extent of plant root influence was found to increase over time as exudates diffused away from roots, an important factor in studies of the soil microbial community activity. This study therefore demon-strates the close link between the temporal dynamics of plant and mi-crobial resource capture and the influence each process has on the other.
Funding statement
E.J. Schofield was funded by Manchester Metropolitan University and the James Hutton Institute, R. Brooker and E. Paterson were funded by the Rural and Environment Science and Analytical Services Division of the Scottish Government through the Strategic Research Programme 2016–2021.
Declaration of competing interest
The authors declare that they have no known competing financial interests or personal relationships that could have appeared to influence
E.J. Schofield et al.
Soil Biology and Biochemistry 139 (2019) 107615
9
the work reported in this paper.
Appendix A. Supplementary data
Supplementary data to this article can be found online at https://doi. org/10.1016/j.soilbio.2019.107615.
References
Badri, D.V., Vivanco, J.M., 2009. Regulation and function of root exudates. Plant, Cell and Environment 32, 666–681. https://doi.org/10.1111/j.1365-3040.2009.01926. x.
Bardgett, R.D., Bowman, W.D., Kaufmann, R., Schmidt, S.K., 2005. A temporal approach to linking aboveground and belowground ecology. Trends in Ecology & Evolution 20, 634–641. https://doi.org/10.1016/j.tree.2005.08.005.
Barros, N., Gomez-Orellana, I., Feij�oo, S., Balsa, R., 1995. The effect of soil moisture on soil microbial activity studied by microcalorimetry. Thermochimica Acta 249, 161–168. https://doi.org/10.1016/0040-6031(95)90686-X.
Bartling, D., Weiler, E.W., 1992. Leucine aminopeptidase from Arabidopsis thaliana. Molecular evidence for a phylogenetically conserved enzyme of protein turnover in higher plants. European Journal of Biochemistry 205, 425–431. https://doi.org/ 10.1111/j.1432-1033.1992.tb16796.x.
Bengtson, P., Barker, J., Grayston, S.J., 2012. Evidence of a strong coupling between root exudation, C and N availability, and stimulated SOM decomposition caused by rhizosphere priming effects. Ecology and Evolution 2, 1843–1852. https://doi.org/ 10.1002/ece3.311.
Caffaro, M.M., Vivanco, J.M., Botto, J., Rubio, G., 2013. Root architecture of Arabidopsis is affected by competition with neighbouring plants. Plant Growth Regulation 70, 141–147. https://doi.org/10.1007/s10725-013-9786-7.
Chagas, F.O., Pessotti, R.D.C., Caraballo-Rodríguez, A.M., Pupo, M.T., 2018. Chemical signaling involved in plant-microbe interactions. Chemical Society Reviews 47, 1652–1704. https://doi.org/10.1039/c7cs00343a.
Chaparro, J.M., Sheflin, A.M., Manter, D.K., Vivanco, J.M., 2012. Manipulating the soil microbiome to increase soil health and plant fertility. Biology and Fertility of Soils 48, 489–499. https://doi.org/10.1007/s00374-012-0691-4.
Forde, B.G., 2014. Nitrogen signalling pathways shaping root system architecture: an update. Current Opinion in Plant Biology 30–36. https://doi.org/10.1016/j. pbi.2014.06.004.
Garcia-Pausas, J., Paterson, E., 2011. Microbial community abundance and structure are determinants of soil organic matter mineralisation in the presence of labile carbon. Soil Biology and Biochemistry 43, 1705–1713. https://doi.org/10.1016/j. soilbio.2011.04.016.
Giles, C.D., Dupuy, L., Boitt, G., Brown, L.K., Condron, L.M., Darch, T., Blackwell, M.S.A., Menezes-Blackburn, D., Shand, C.A., Stutter, M.I., Lumsdon, D.G., Wendler, R., Cooper, P., Wearing, C., Zhang, H., Haygarth, P.M., George, T.S., 2018. Root development impacts on the distribution of phosphatase activity: improvements in quantification using soil zymography. Soil Biology and Biochemistry 116, 158–166. https://doi.org/10.1016/j.soilbio.2017.08.011.
Gilroy, S., Jones, D.L., 2000. Through form to function: root hair development and nutrient uptake. Trends in Plant Science 56–60. https://doi.org/10.1016/S1360- 1385(99)01551-4.
Hayashi, T., Yoshida, K., Woo Park, Y., Konishi, T., Baba, K., 2005. Cellulose metabolism in plants. International Review of Cytology 279–292. https://doi.org/10.1016/ S0074-7696(05)47001-1.
Hodge, A., Robinson, D., Fitter, A., 2000. Are microorganisms more effective than plants at competing for nitrogen? Trends in Plant Science 5, 304–308. https://doi.org/ 10.1016/S1360-1385(00)01656-3.
Hu, L., Robert, C.A.M., Cadot, S., Zhang, X., Ye, M., Li, B., Manzo, D., Chervet, N., Steinger, T., van der Heijden, M.G.A., Schlaeppi, K., Erb, M., 2018. Root exudate metabolites drive plant-soil feedbacks on growth and defense by shaping the rhizosphere microbiota. Nature Communications 9, 2738. https://doi.org/10.1038/ s41467-018-05122-7.
Kuzyakov, Y., Friedel, J., Stahr, K., 2000. Review of mechanisms and quantification of priming effects. Soil Biology and Biochemistry 32, 1485–1498. https://doi.org/ 10.1016/S0038-0717(00)00084-5.
Labuschagne, N., Madala, N.E., Piater, L.A., Mhlongo, M.I., Dubery, I.A., 2018. The chemistry of plant–microbe interactions in the rhizosphere and the potential for metabolomics to reveal signaling related to defense priming and induced systemic resistance. Frontiers of Plant Science 9, 1–17. https://doi.org/10.3389/ fpls.2018.00112.
Lobet, G., Pag�es, L., Draye, X., 2011. A novel image-analysis toolbox enabling quantitative analysis of root system Architecture. Plant Physiol. 157, 29–39. https:// doi.org/10.1104/pp.111.179895.
Ma, X., Zarebanadkouki, M., Kuzyakov, Y., Blagodatskaya, E., Pausch, J., Razavi, B.S., 2018. Spatial patterns of enzyme activities in the rhizosphere: effects of root hairs and root radius. Soil Biology and Biochemistry 118, 69–78. https://doi.org/ 10.1016/j.soilbio.2017.12.009.
Mbuthia, L.W., Acosta-Martínez, V., DeBruyn, J., Schaeffer, S., Tyler, D., Odoi, E., Mpheshea, M., Walker, F., Eash, N., 2015. Long term tillage, cover crop, and fertilization effects on microbial community structure, activity: implications for soil quality. Soil Biology and Biochemistry 89, 24–34. https://doi.org/10.1016/j. soilbio.2015.06.016.
Meier, I.C., Finzi, A.C., Philiips, R.P., 2017. Root exudates increase N availability by stimulating microbial turnover of fast-cycling N pools. Soil Biology and Biochemistry 106, 119–128. https://doi.org/10.1016/j.soilbio.2016.12.004.
Mergel, A., Timchenko, A., Kudeyarov, V., 1998. Role of plant root exudates in soil carbon and nitrogen transformation. In: Box, J.E. (Ed.), Root Demographics and Their Efficiencies in Sustainable Agriculture, Grasslands and Forest Ecosystems. Developments in Plant and Soil Sciences, vol. 82. Springer, Dordrecht, pp. 43–54. https://doi.org/10.1007/978-94-011-5270-9_3.
Murphy, C.J., Baggs, E.M., Morley, N., Wall, D.P., Paterson, E., 2017. Nitrogen availability alters rhizosphere processes mediating soil organic matter mineralisation. Plant and Soil 417, 499–510. https://doi.org/10.1007/s11104-017- 3275-0.
Pappan, K., Wang, H., Prade, R., Segato, F., Mort, A., Lee, D., Squina, F., 2011. High- temperature enzymatic breakdown of cellulose. Applied and Environmental Microbiology 77, 5199–5206. https://doi.org/10.1128/aem.00199-11.
Paterson, E., 2003. Importance of rhizodeposition in the coupling of plant and microbial productivity. European Journal of Soil Science 741–750. https://doi.org/10.1046/ j.1351-0754.2003.0557.x.
Penton, C.R., Newman, S., 2007. Enzyme activity responses to nutrient loading in subtropical wetlands. Biogeochemistry 84, 83–98. https://doi.org/10.1007/s10533- 007-9106-2.
Pinheiro, J., Bates, D., DebRoy, S., Sarkar, D., Team, R.C., 2016. Nlme: Linear and Nonlinear Mixed Effects Models.
R Core Team, 2015. R: A Language and Environment for Statistical Computing. R Foundation for Statistical Computing. https://doi.org/10.1007/978-3-540-74686-7.
Schindelin, J., Arganda-Carreras, I., Frise, E., Kaynig, V., Longair, M., Pietzsch, T., Preibisch, S., Rueden, C., Saalfeld, S., Schmid, B., Tinevez, J.-Y., White, D.J., Hartenstein, V., Eliceiri, K., Tomancak, P., Cardona, A., 2012. Fiji: an open-source platform for biological-image analysis. Nature Methods 9, 676–682. https://doi.org/ 10.1038/nmeth.2019.
Schmid, C., Bauer, S., Bartelheimer, M., 2015. Should I stay or should I go? Roots segregate in response to competition intensity. Plant and Soil 391, 283–291. https:// doi.org/10.1007/s11104-015-2419-3.
Schneider, C.A., Rasband, W.S., Eliceiri, K.W., 2012. NIH Image to ImageJ: 25 years of image analysis. Nature Methods 9, 671–675. https://doi.org/10.1038/nmeth.2089.
Schofield, E.J., Rowntree, J.K., Paterson, E., Brewer, M.J., Price, E.A.C., Brearley, F.Q., Brooker, R.W., 2019. Cultivar differences and impact of plant-plant competition on temporal patterns of nitrogen and biomass accumulation. Frontiers of Plant Science 10, 215. https://doi.org/10.3389/FPLS.2019.00215.
Shi, S., Richardson, A.E., O’Callaghan, M., DeAngelis, K.M., Jones, E.E., Stewart, A., Firestone, M.K., Condron, L.M., 2011. Effects of selected root exudate components on soil bacterial communities. FEMS Microbiology Ecology 77, 600–610. https://doi. org/10.1111/j.1574-6941.2011.01150.x.
Shi, S., Nuccio, E.E., Shi, Z.J., He, Z., Zhou, J., Firestone, M.K., 2016. The interconnected rhizosphere: high network complexity dominates rhizosphere assemblages. Ecology Letters 19, 926–936. https://doi.org/10.1111/ele.12630.
Spohn, M., Kuzyakov, Y., 2013. Distribution of microbial- and root-derived phosphatase activities in the rhizosphere depending on P availability and C allocation - coupling soil zymography with 14C imaging. Soil Biology and Biochemistry 67, 106–113. https://doi.org/10.1016/j.soilbio.2013.08.015.
Spohn, M., Kuzyakov, Y., 2014. Spatial and temporal dynamics of hotspots of enzyme activity in soil as affected by living and dead roots-a soil zymography analysis. Plant and Soil 379, 67–77. https://doi.org/10.1007/s11104-014-2041-9.
Steinweg, J.M., Dukes, J.S., Wallenstein, M.D., 2012. Modeling the effects of temperature and moisture on soil enzyme activity: linking laboratory assays to continuous field data. Soil Biology and Biochemistry 55, 85–92. https://doi.org/10.1016/j. soilbio.2012.06.015.
van Dam, N.M., Bouwmeester, H.J., 2016. Metabolomics in the rhizosphere: tapping into belowground chemical communication. Trends in Plant Science 256–265. https:// doi.org/10.1016/j.tplants.2016.01.008.
Venables, W.N., Ripley, B.D., 2002. Modern Applied Statistics with S, Fourth. ed, ISBN 0- 387-95457-0. New York.
Walker, T.S., Bais, H.P., Grotewold, E., Vivanco, J.M., 2003. Root exudation and rhizosphere biology. Plant Physiology 132, 44–51. https://doi.org/10.1104/ pp.102.019661.
Xu, Z., Yu, G., Zhang, X., Ge, J., He, N., Wang, Q., Wang, D., 2014. The variations in soil microbial communities, enzyme activities and their relationships with soil organic matter decomposition along the northern slope of Changbai Mountain. Applied Soil Ecology 86, 19–29. https://doi.org/10.1016/j.apsoil.2014.09.015.
Zhang, R., Vivanco, J.M., Shen, Q., 2017. The unseen rhizosphere root–soil–microbe interactions for crop production. Current Opinion in Microbiology 469–479. https:// doi.org/10.1016/j.mib.2017.03.008.
E.J. Schofield et al.
Related Documents