Current Biology, Volume 19 Supplemental Data Dynein Antagonizes Eg5 by Crosslinking and Sliding Antiparallel Microtubules Nick P. Ferenz, Raja Paul, Carey Fagerstrom, Alex Mogilner, and Patricia Wadsworth Supplemental Experimental Procedures Mathematical Model Force Balance with Steady Chromosomal Configuration The parameters and variables of the model can be found in Table S2. We assume that MTs nucleated at centrosomes display an exponential length distribution in accordance with a simple phenomenological model of dynamic instability [1]: ( ) / lL Nl e − ∝ , where L is the average MT length. Placing the centrosomes at x ± , we can count the antiparallel MT numbers overlapping at distance s from the spindle equator (Figure S6A). To overlap, MTs from the right and left have to be longer than l x s = − and ( ) l s x s x = −− = + , respectively. The probability of such overlapping MTs is proportional to ( ) ( ) / / x s L x s L e e − − − + × and the total overlap length is proportional to the integral over the spindle length: ( ) ( ) / / 2 / 2 / 2 x x x s L x s L x L xL x x e e ds e ds xe − − − + − − − − × = = ∫ ∫ . The corresponding motor force on overlapping MTs is 2 / 2 x L Bxe − − , where B is the net force (its positive sign corresponds to the inward force) that takes into account both inward (dynein-generated, dyn B ) and outward (Eg5-generated, 5 eg B ) forces: 5 dyn eg B B B = − . Assuming that dynein motors are localized at or near the MT plus ends (not along the whole overlap length) re-scales the constant B but does not change the functional dependence of the integral on x. Calculating the distance-dependence of the chromosome arm force is even simpler. The maximal force, A, when the centrosome is immediately opposite to the

Welcome message from author
This document is posted to help you gain knowledge. Please leave a comment to let me know what you think about it! Share it to your friends and learn new things together.
Transcript
Current Biology, Volume 19
Supplemental Data
Dynein Antagonizes Eg5
by Crosslinking and Sliding
Antiparallel Microtubules Nick P. Ferenz, Raja Paul, Carey Fagerstrom, Alex Mogilner, and Patricia Wadsworth
Supplemental Experimental Procedures
Mathematical Model
Force Balance with Steady Chromosomal Configuration
The parameters and variables of the model can be found in Table S2. We assume that
MTs nucleated at centrosomes display an exponential length distribution in accordance
with a simple phenomenological model of dynamic instability [1]: ( ) /l LN l e−∝ , where L
is the average MT length. Placing the centrosomes at x± , we can count the antiparallel
MT numbers overlapping at distance s from the spindle equator (Figure S6A). To
overlap, MTs from the right and left have to be longer than l x s= − and
( )l s x s x= − − = + , respectively. The probability of such overlapping MTs is
proportional to ( ) ( )/ /x s L x s Le e− − − +× and the total overlap length is proportional to the
integral over the spindle length: ( ) ( )/ / 2 / 2 /2x xx s L x s L x L x L
x xe e ds e ds xe− − − + − −
− −× = =∫ ∫ . The
corresponding motor force on overlapping MTs is 2 /2 x LBxe−− , where B is the net force
(its positive sign corresponds to the inward force) that takes into account both inward
(dynein-generated, dynB ) and outward (Eg5-generated, 5egB ) forces: 5dyn egB B B= − .
Assuming that dynein motors are localized at or near the MT plus ends (not along the
whole overlap length) re-scales the constant B but does not change the functional
dependence of the integral on x.
Calculating the distance-dependence of the chromosome arm force is even
simpler. The maximal force, A, when the centrosome is immediately opposite to the
chromosome should decrease with distance as the number of MTs longer than this
distance: /x LAe− . Assuming for simplicity that there is a functional kinetochore fiber
with motors at the kinetochore generating a force-independent tension, C, the total force
on the centrosomes symmetrically placed at distance x around a single chromosome has
the form:
( ) / 2 /2x L x LF x Ae Bxe C− −= − − (Eq. 1)
We plotted this force-distance dependence in Figure S3B and found that for some values
of parameters, the non-monotonic force-distance behavior causing instability is possible.
Eq. 1 has to be generalized to account for the interactions of centrosomes with
multiple chromosomes. The images shown in Figure S2A suggest that chromosomes
distribute within a disc at the spindle midplane. Thus, we used a random number
generator to spread N = 38 chromosomes uniformly and randomly inside a cylindrical
disc of width equal to 2μm and radius equal to 3.5μm (Figure S6B; average inter-
chromosomal distance for such packing is ~2μm). Assuming additive action of the
chromosomes, the total force on the centrosomes symmetrically placed at distance x
around the spindle equator is:
( ) ( )( ) ( )22 / 21
2 exp / ,N jx Lcent j j j jj
j
x xF x Bxe A R L C R x x r
R−
=
⎡ ⎤−= − + − − = − +⎢ ⎥
⎢ ⎥⎣ ⎦∑ (Eq. 2)
This is the x-component of the force; on average, the component of the force normal to
the spindle axis is negligible. We used Eq. 2 to plot the force-distance relationship in
Figure 4B. Note that in such a chromosomal configuration, where most of the
chromosomes are not exactly at the pole-pole axis, the repulsive forces from the
chromosome arms do not effectively push the centrosomes in the x-direction when
centrosomes approach the equator: these repulsive forces become almost perpendicular to
the pole-pole axis. This is the reason for the force on the centrosome dropping almost to
zero when x decreases.
Calibrating the Model Parameters
The orders of magnitude of the model parameters can be approximated based on the
following considerations. Indirect estimates based, for example, on Grill et al. [2] and
Mastronarde et al. [3], but in fact on the vast number of guesses in the literature, suggest
that there are of the order of hundred(s) of MTs per centrosome. Assuming that a
maximum of ~5 MTs reaches for each chromosomal arm (adding up to 150-200 MTs),
and that the MT pushing force is ~5pN [4-6], we estimate that the maximal chromosome
arm force A = 25pN. Based on measured and estimated MT dynamic instability
parameters [7-9], the average MT length is of the order of a few microns.
When L = 2.5μm, the model predicts that about 15% of the MTs can reach the
spindle equator and overlap, so we can assume that on the order of 10 pairs of interpolar
MTs overlap at the spindle equator. EM data [10] agree with this estimate. Assuming
that a few motors of each kind act on one micron of the overlap, and that each motor
generates pN-range force [11], we estimate roughly 25pN/μm force per unit length at the
interpolar MT overlap. Assuming that ~10 pairs of interpolar MTs overlap at the spindle
equator, we estimate maximal parameter B as 250pN/μm. In fact, it is a sum of the Eg5-
generated outward motor force, 5egB , the dynein-generated inward motor force, dynB , and
possible additional inward motor force (e.g., kinesin-14 motors), each of which is thus
~100pN/μm.
More precisely, the force-related model parameters can be calibrated using
quantitative restrictions from the observations. First, when centrosomes are collapsed,
chromosomes arrange themselves roughly on a surface of a sphere of radius R ~7μm
around the collapsed centrosomes. When N = 38, chromosomes are uniformly radially
distributed, the average distance between two adjacent chromosomes is ~
24 / 3 ~ 2 / ~ 2R N R Nπ μm, and the inter-chromosome interactions can be neglected
(see below). The condition of the balance between the repulsive chromosomal arm force
and the attractive kinetochore force per chromosome is ( )exp / 0A R L C− − = , thus:
( )exp /C A R L= − (Eq. 3)
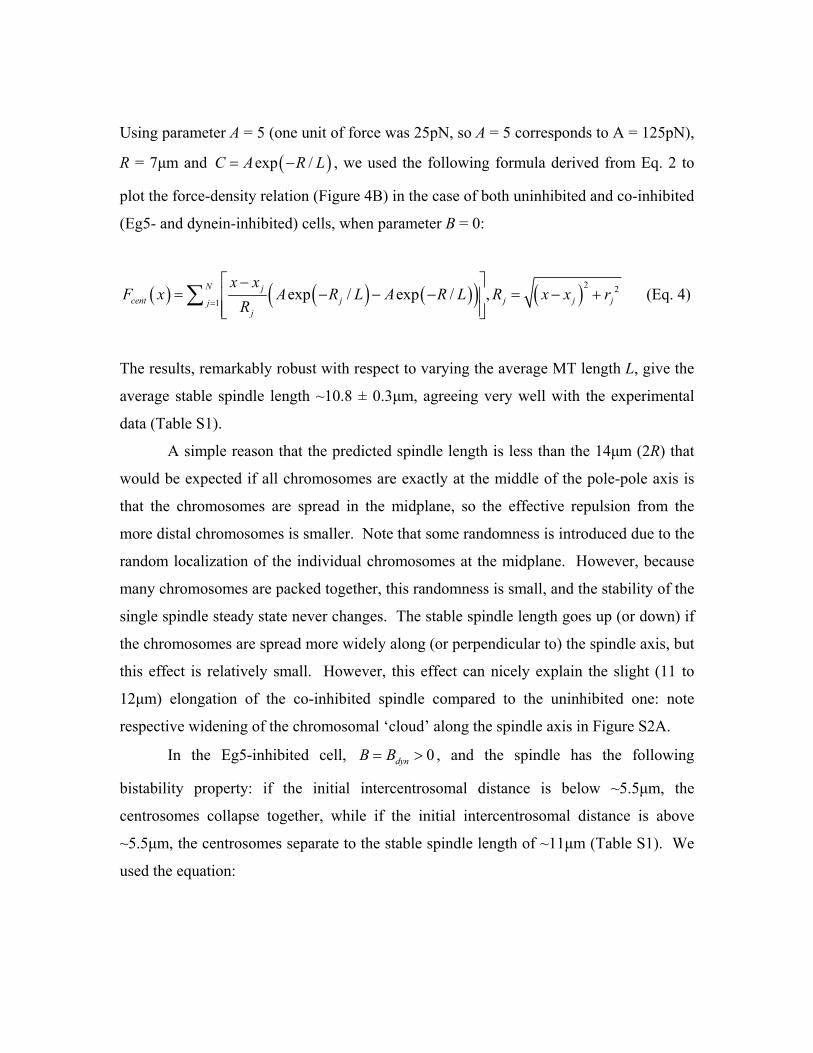
Using parameter A = 5 (one unit of force was 25pN, so A = 5 corresponds to A = 125pN),
R = 7μm and ( )exp /C A R L= − , we used the following formula derived from Eq. 2 to
plot the force-density relation (Figure 4B) in the case of both uninhibited and co-inhibited
(Eg5- and dynein-inhibited) cells, when parameter B = 0:
( ) ( ) ( )( ) ( )2 21
exp / exp / ,N jcent j j j jj
j
x xF x A R L A R L R x x r
R=
⎡ ⎤−= − − − = − +⎢ ⎥
⎢ ⎥⎣ ⎦∑ (Eq. 4)
The results, remarkably robust with respect to varying the average MT length L, give the
average stable spindle length ~10.8 ± 0.3μm, agreeing very well with the experimental
data (Table S1).
A simple reason that the predicted spindle length is less than the 14μm (2R) that
would be expected if all chromosomes are exactly at the middle of the pole-pole axis is
that the chromosomes are spread in the midplane, so the effective repulsion from the
more distal chromosomes is smaller. Note that some randomness is introduced due to the
random localization of the individual chromosomes at the midplane. However, because
many chromosomes are packed together, this randomness is small, and the stability of the
single spindle steady state never changes. The stable spindle length goes up (or down) if
the chromosomes are spread more widely along (or perpendicular to) the spindle axis, but
this effect is relatively small. However, this effect can nicely explain the slight (11 to
12μm) elongation of the co-inhibited spindle compared to the uninhibited one: note
respective widening of the chromosomal ‘cloud’ along the spindle axis in Figure S2A.
In the Eg5-inhibited cell, 0dynB B= > , and the spindle has the following
bistability property: if the initial intercentrosomal distance is below ~5.5μm, the
centrosomes collapse together, while if the initial intercentrosomal distance is above
~5.5μm, the centrosomes separate to the stable spindle length of ~11μm (Table S1). We
used the equation:
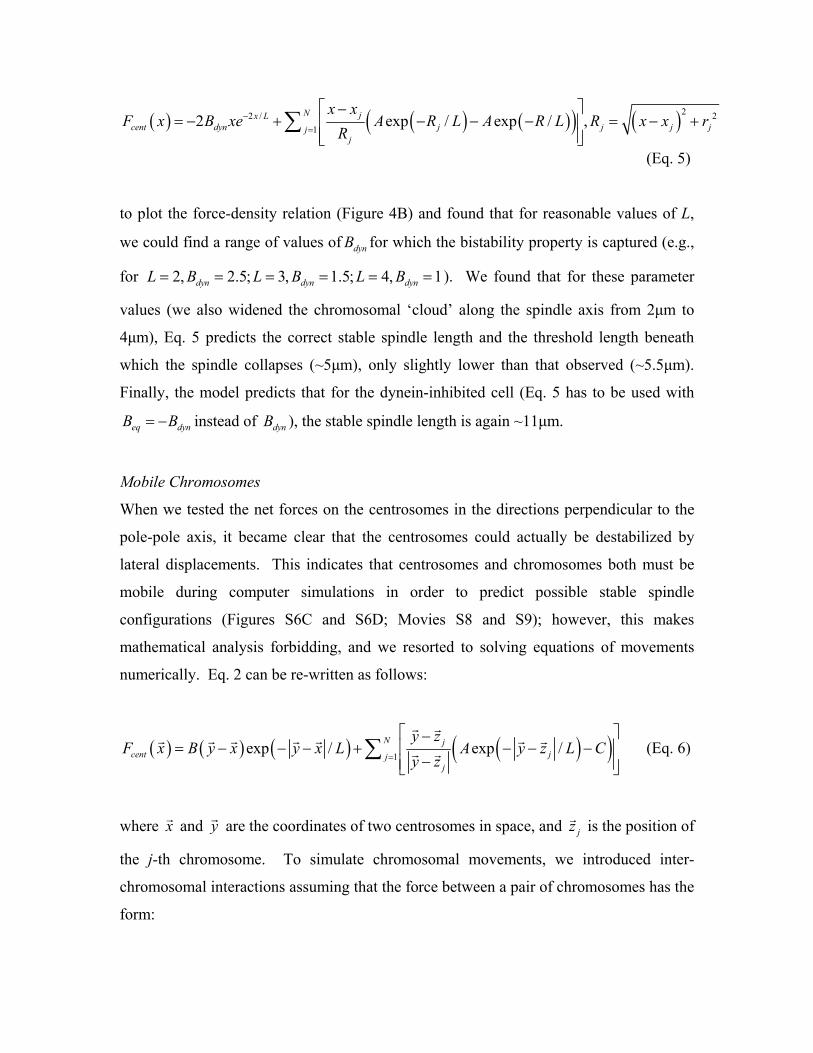
( ) ( ) ( )( ) ( )22 / 21
2 exp / exp / ,N jx Lcent dyn j j j jj
j
x xF x B xe A R L A R L R x x r
R−
=
⎡ ⎤−= − + − − − = − +⎢ ⎥
⎢ ⎥⎣ ⎦∑
(Eq. 5)
to plot the force-density relation (Figure 4B) and found that for reasonable values of L,
we could find a range of values of dynB for which the bistability property is captured (e.g.,
for 2, 2.5; 3, 1.5; 4, 1dyn dyn dynL B L B L B= = = = = = ). We found that for these parameter
values (we also widened the chromosomal ‘cloud’ along the spindle axis from 2μm to
4μm), Eq. 5 predicts the correct stable spindle length and the threshold length beneath
which the spindle collapses (~5μm), only slightly lower than that observed (~5.5μm).
Finally, the model predicts that for the dynein-inhibited cell (Eq. 5 has to be used with
eq dynB B= − instead of dynB ), the stable spindle length is again ~11μm.
Mobile Chromosomes
When we tested the net forces on the centrosomes in the directions perpendicular to the
pole-pole axis, it became clear that the centrosomes could actually be destabilized by
lateral displacements. This indicates that centrosomes and chromosomes both must be
mobile during computer simulations in order to predict possible stable spindle
configurations (Figures S6C and S6D; Movies S8 and S9); however, this makes
mathematical analysis forbidding, and we resorted to solving equations of movements
numerically. Eq. 2 can be re-written as follows:
( ) ( ) ( ) ( )( )1exp / exp /N j
cent jjj
y zF x B y x y x L A y z L C
y z=
⎡ ⎤−= − − − + − − −⎢ ⎥
−⎢ ⎥⎣ ⎦∑
r rr r r r r r r
r r (Eq. 6)
where xr and yr are the coordinates of two centrosomes in space, and jzr is the position of
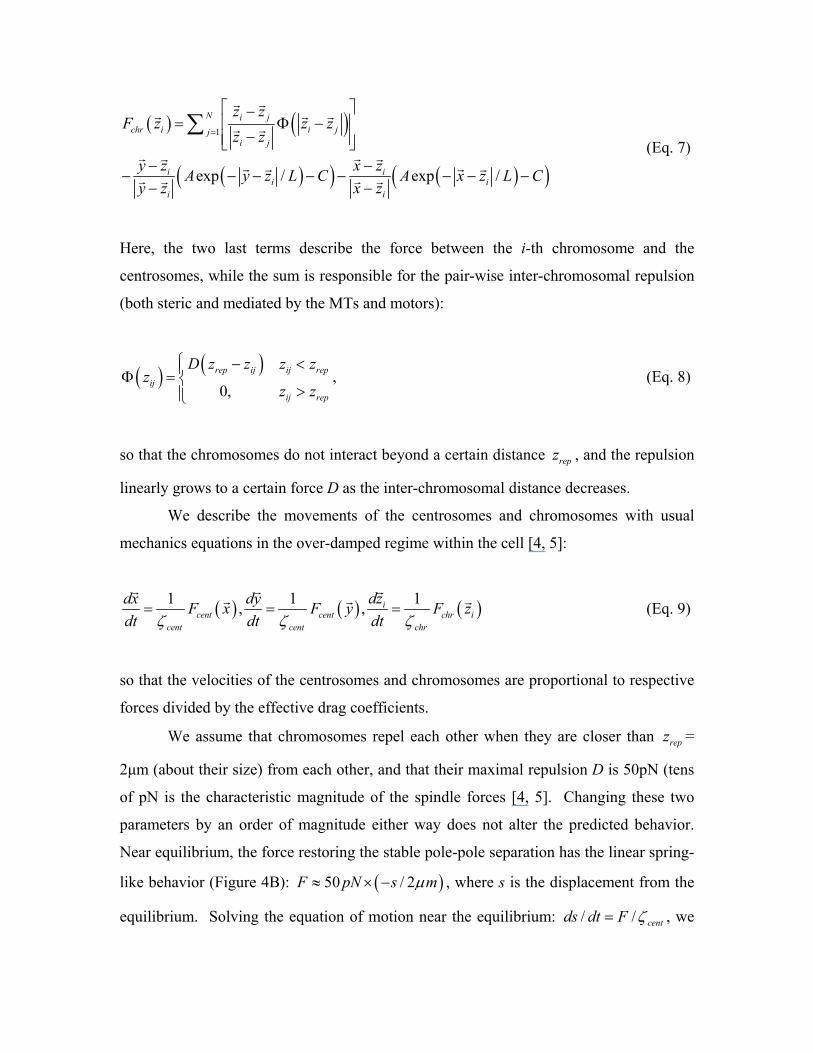
the j-th chromosome. To simulate chromosomal movements, we introduced inter-
chromosomal interactions assuming that the force between a pair of chromosomes has the
form:
( ) ( )
( )( ) ( )( )
1
exp / exp /
N i jchr i i jj
i j
i ii i
i i
z zF z z z
z z
y z x zA y z L C A x z L Cy z x z
=
⎡ ⎤−= Φ −⎢ ⎥
−⎢ ⎥⎣ ⎦− −
− − − − − − − −− −
∑r r
r r rr r
r rr rr rr r
r rr r
(Eq. 7)
Here, the two last terms describe the force between the i-th chromosome and the
centrosomes, while the sum is responsible for the pair-wise inter-chromosomal repulsion
(both steric and mediated by the MTs and motors):
( ) ( )0,
rep ij ij repij
ij rep
D z z z zz
z z
⎧ − <⎪Φ = ⎨>⎪⎩
, (Eq. 8)
so that the chromosomes do not interact beyond a certain distance repz , and the repulsion
linearly grows to a certain force D as the inter-chromosomal distance decreases.
We describe the movements of the centrosomes and chromosomes with usual
mechanics equations in the over-damped regime within the cell [4, 5]:
( ) ( ) ( )1 1 1, , icent cent chr i
cent cent chr
dzdx dyF x F y F zdt dt dtζ ζ ζ
= = =r r r
r r r (Eq. 9)
so that the velocities of the centrosomes and chromosomes are proportional to respective
forces divided by the effective drag coefficients.
We assume that chromosomes repel each other when they are closer than repz =
2μm (about their size) from each other, and that their maximal repulsion D is 50pN (tens
of pN is the characteristic magnitude of the spindle forces [4, 5]. Changing these two
parameters by an order of magnitude either way does not alter the predicted behavior.
Near equilibrium, the force restoring the stable pole-pole separation has the linear spring-
like behavior (Figure 4B): ( )50 / 2F pN s mμ≈ × − , where s is the displacement from the
equilibrium. Solving the equation of motion near the equilibrium: / / centds dt F ζ= , we
obtain ( )exp /s t τ∝ − and calculate the relaxation time 2 / 50cent m pNτ ζ μ= × . Our
observations of the rate of the spindle length change near the equilibrium suggest that the
characteristic relaxation time is ~ 100secτ , which gives the estimate for the centrosome
drag coefficient: ~ 2500 sec/cent pN mζ μ× . Assuming that because of the smaller size of
the chromosome, its drag coefficient is 10 times smaller than that of the centrosomal MT
aster [4, 5], we estimate ~ 250 sec/chr pN mζ μ× . These estimates are higher, but of the
same order of magnitude as those made for the Drosophila spindles [4, 5]. Interestingly,
we found that chromosomes actually do have to be much more mobile (less resistant to
force) than the centrosomes in order for the simulations to predict non-collapse of well-
separated centrosomes in Eg5-inhibited cells. Otherwise, the centrosomes collapse
before chromosomes converge to the spindle equator and generate enough repulsion.
We solved Eqs. 6-9 numerically in 2D with parameters L = 4-6μm,
1, 0.06,A C= = 5 0.7 1eg dynB B= = − and obtained the behavior semi-quantitatively
mimicking the observations (Figures S6C and S6D; Movies S8 and S9) and agreeing with
the predictions of the simplified force-distance calculations with the immobile
chromosomes.
Model Limitations and Simplifications
Our model makes a number of significant simplifications: (i) we assume that all
kinetochore fibers and interpolar MT bundles are assembled at once, while in reality this
process takes time, during which the centrosomes and chromosomes start to move; (ii) we
neglect the geometric effects of chromosomes ‘screening’ each other out (in fact, clearly,
not all chromosomes interact with the centrosomes equally); (iii) we assume that MT
dynamics are fast, and so are in quasi-equilibrium with current centromes’ and
chromosomes’ positions; (iv) we neglect stochastic fluctuations of forces due to
significant randomness of the relatively small MT number; (v) it is not clear whether
kinetochore fiber tension is length-independent; (vi) there are likely deviations from the
exponential MT length distribution, and we ignore the geometric effect of the MT density
decrease in 3D; (vii) we simulate the movements in 2D, because in 3D the numerical
simulations become too time-consuming; and (viii) we include only active, force
generating motor proteins at the MT overlap, not passive crosslinking proteins.
These limitations do not change the model’s conclusions qualitatively. A number
of simulations (not systematic ones) showed that changing assumptions i, ii, v, vii and
viii do not change qualitative model predictions. Likewise, spreading the MT bundle
assembly in time, prohibiting some chromosomes in the middle from interacting with
centrosomes, assuming that the kinetochore fiber tension is spring-like, trying different
MT length distributions (i.e., piece-wise linear), adding viscous-like ‘protein friction’
generated by passive crosslinkers at the MT overlap and allowing centrosomes to move
in 3D (keeping fixed ‘spherical cloud-like’ 3D chromosomal arrays) did not make a
qualitative difference for the stability conditions of the centrosomal separation.
Assumption (iii) is supported by the argument that the characteristic time for the MT
dynamic cycle, ~25sec, estimated as the characteristic MT length (~5μm) divided by the
growth/shrinkage rate (~0.2μm/sec) [7], is much shorter than the characteristic time of
the spindle dynamics that is in a few minutes range. We discuss how the results could
change if assumption (vi) is altered below. Finally, our previous experience with
introducing stochastic dynamics [4, 5, 8] suggests that though it can significantly change
the transient behavior, it is unlikely to alter the stability of the steady states qualitatively.
Mathematical Argument for Dynein Acting at Interpolar MT Overlap
The model has to account for the observation that when Eg5 is inhibited, the spindle is
bistable. Assuming in this case that the dominant forces acting on the centrosomes are
kinetochore MT tension (Force C), effective repulsion through MTs interacting with
chromosomal arms (Force A), and force generated by dynein motors on chromosome-
associated structures interacting with centrosomal MTs, the force on the centrosomes as a
function of the spindle pole-equator distance x has the form:
( ) ( ) ( )dynF x Af x B f x C= − − , where ( )f x is the distance dependence of the force, which
in our case is proportional to the number of centrosomal MTs reaching the chromosomal
arms. But if dynein is on the chromosome-associated structures, then a proportional
number of MTs would reach for these dynein motors (and generate attraction) and for
either chromokinesins, or simply chromosome arms (and generate repulsion), so the
( )f x factor is the same for the repulsive and dynein forces. Thus,
( ) ( ) ( )dynF x A B f x C= − − , and the only way such force-distance dependence can
account for the bistability is if function ( )f x has a maximum at a finite distance x. This
is highly unlikely, as the number of MTs that can reach from the centrosome to the
chromosomes surely increases when the centrosome-chromosome distance decreases.
One can imagine that the repulsive force is not MT-number limited, but rather
motor(chromokinesin)-number limited, in which case the bistability can be achieved
without Eg5 and with dynein on the chromosomes. This is unlikely though because of
the polymerization force, which has to be MT-number limited. Thus, it is unlikely that
the data can be explained based on the force-balance model without dynein acting from
the interpolar MT overlaps.
Effects of Various MT Length and Overlap Distributions
We assume that the overlapping interpolar MTs are scarce, even for the majority
population of MTs from the proximal pole, and so the probability of the encounter of two
MTs of opposite polarity is proportional to the product of the densities, rather than to the
minority density from the distal pole. One argument for this assumption is that if the
average MT length is significantly smaller than the spindle length, then near the equator
the MT numbers are small enough. Besides, EM data from [10] shows that the
overlapping MT bundles are not noticed far from the equator, and at the equator they
consist of rarified bundles consisting of 2-4 MTs. All this said, it is indeed possible that
if the MT populations are great, then the overlapping density is proportional to that of just
minority population.
In that case, we cannot have bistability providing exponential decrease of the
chromosomal MT lengths. Indeed, it is easy to compute that if the overlap is proportional
to ( ) ( ) ( ){ }/ /, min ,x s L x s LG x s e e− − − += , then the total overlap length is proportional to the
integral over the spindle length: ( )/ /( , ) ~ 1x x L x L
xG x s ds Le e− −
−−∫ . This function decreases
exponentially with approximately the same speed as the effective centrosomal-
chromosomal repulsion /~ x Le− , and under these conditions the bistability is impossible.
However, if the chromosomal MTs are much longer than the interpolar MTs, then the
effective centrosomal-chromosomal repulsion 2~ 1/ x . In that case, the force-distance
dependence has the form: ( ) 2 // x LF x A x Be C−= − − , and the bistability is possible. The
general necessary condition for the spindle bistability is that the distance dependence of
the effective repulsive centrosomal-chromosomal forces is different from that of the
overlap length, so that the overlap distance-dependence function decreases faster than the
effective repulsion at large distances, but can be greater than the repulsion at moderate
distances.
It is also possible that the MT length distribution is not exponential. In fact, short
MT depletion in the spindle was observed [11]. This property does not change the model
conclusion: the reason is that the key feature guaranteeing the bistability is that the
overlapping interpolar MT density decreases faster than the density of the
astral/chromosomal MTs, which is the property of the longer MTs in the populations.
Indeed, the MT length distribution observed in [11] can be approximated by the function
( )/ /~ x L x le e− −− , where L l> . In this case, the overlap is proportional to
( ) ( ) ( )( ) ( ) ( )( )/ / / /, x s L x s l x s L x s lG x s e e e e− − − − − + − += − × − , then the total overlap length is
proportional to the integral over the spindle length:
( ) 2 / 2 /( , ) ~ 2 2x x L x l
x
Ll LlH x G x s ds x e x eL l L l
− −
−
⎛ ⎞ ⎛ ⎞= − + +⎜ ⎟ ⎜ ⎟− −⎝ ⎠ ⎝ ⎠∫ , and it is easy to check that
the function ( ) ( )/x LF x Ae BH x C−= − − has one stable zero for negative and small
positive values of B, and also predicts the bistable spindle property for moderate positive
values of B.
Other Possible Force-Generating Motors
Kinesin-14 (Ncd) motors, as noted in the text, can also contribute to the force generation
at the antiparallel MT overlaps [4, 5]. This does not change the model predictions:
adding such motors would add one additional parameter ( ncdB ) to the net force density
parameter 5dyn ncd egB B B B= + − . Fitting the data with one additional parameter becomes
easier, of course. We observed that we can reasonably fit all observations with 0B ≈ and
having values of ,dyn ncdB B of the same order of magnitude.
Effects of Shorter and/or Parallel Overlapping MTs
On parallel MTs, multiple dynein motors would probably bind in such a way that about
half of the motors have their binding domain on one MT and motor domain pulling on
another, and another half in the opposite order. Both sub-populations would pull toward
their respective minus ends thus generating forces in the opposite directions. As a result,
these two motors’ sub-populations cancel each other’s forces, effectively just
crosslinking the MTs and not generating any significant sliding force. The Eg5 motors,
with motor domains on both ends, would simply ‘walk’ to the parallel plus ends. These
motors would not generate any force if there is no relative sliding of the crosslinked pair
of MTs. If there is such sliding, the motors on the parallel MTs would exert an ‘anti-
shearing’ force trying to stop the sliding (and so will dynein motors).
If many parallel and antiparallel MTs are densely crosslinked by various motors,
then these anti-shearing forces effectively ‘lock’ the parallel MTs together [12]. In this
case our model holds, as far as the distribution of MT length density decreases
monotonically from the poles to the equator of the spindle, and other assumptions about
the overlap lengths and effective repulsive forces are valid. Finally, if the spindle is
organized in a ‘barrel’-like fashion [13] (Figure S6E), then force balance calculations
reported in [14] predict that the parallel MT overlaps closer to the poles result in minus
ends of the antiparallel MTs at the equator sliding outward toward respective poles. This
MT flux partially (up to a few tens of percent) dampens the forces generated by the
motors at the antiparallel MT overlaps at the equator, but does not change the distance
dependence of the forces in Eq. 1, and so all model conclusions remain valid.
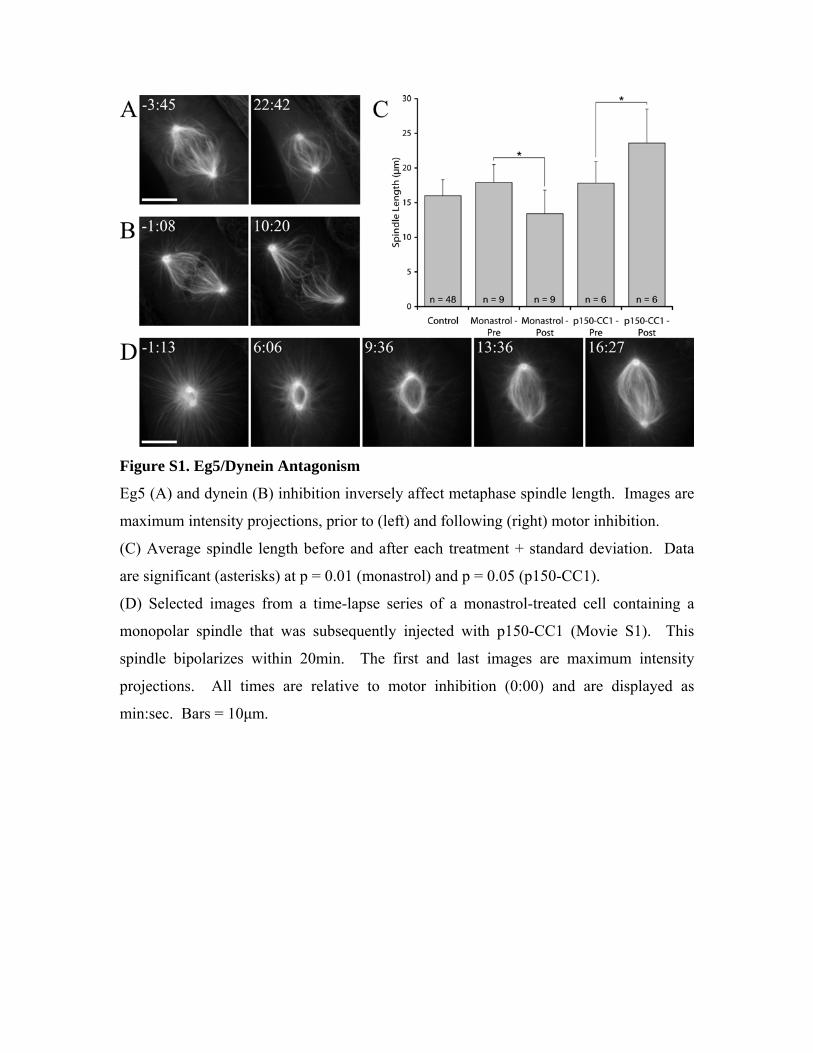
Figure S1. Eg5/Dynein Antagonism
Eg5 (A) and dynein (B) inhibition inversely affect metaphase spindle length. Images are
maximum intensity projections, prior to (left) and following (right) motor inhibition.
(C) Average spindle length before and after each treatment + standard deviation. Data
are significant (asterisks) at p = 0.01 (monastrol) and p = 0.05 (p150-CC1).
(D) Selected images from a time-lapse series of a monastrol-treated cell containing a
monopolar spindle that was subsequently injected with p150-CC1 (Movie S1). This
spindle bipolarizes within 20min. The first and last images are maximum intensity
projections. All times are relative to motor inhibition (0:00) and are displayed as
min:sec. Bars = 10μm.
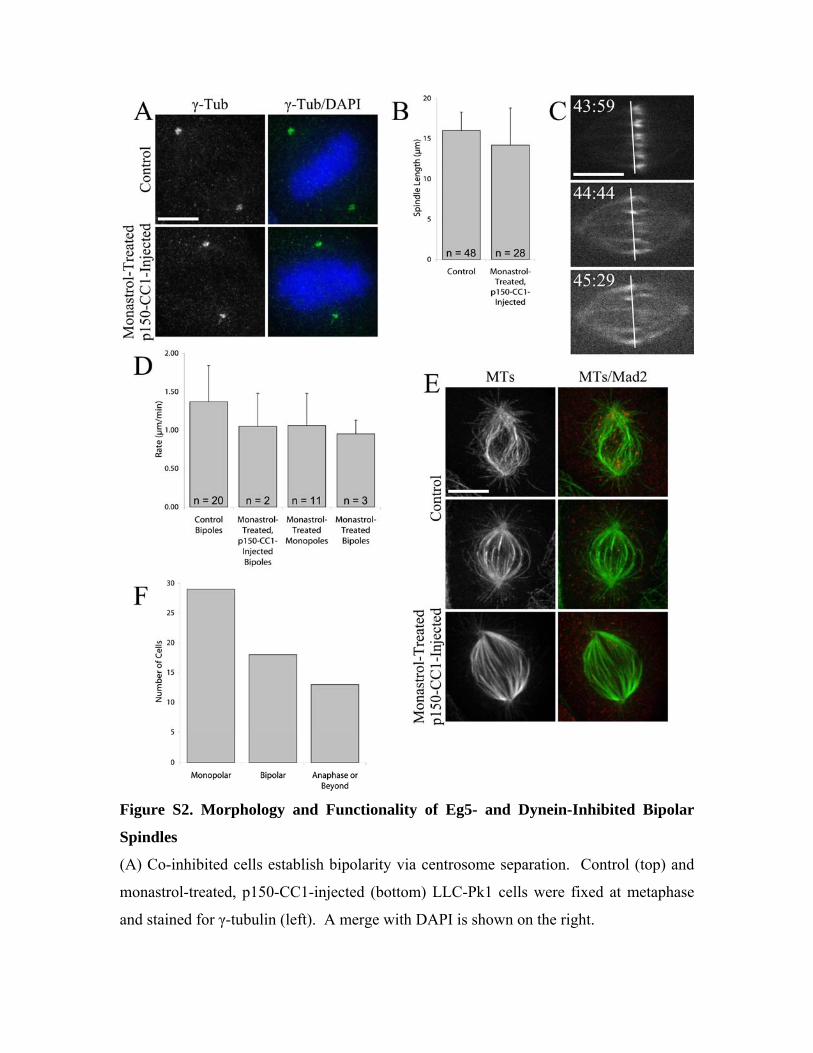
Figure S2. Morphology and Functionality of Eg5- and Dynein-Inhibited Bipolar
Spindles
(A) Co-inhibited cells establish bipolarity via centrosome separation. Control (top) and
monastrol-treated, p150-CC1-injected (bottom) LLC-Pk1 cells were fixed at metaphase
and stained for γ-tubulin (left). A merge with DAPI is shown on the right.
(B) Average spindle length + standard deviation after the indicated treatments. Data are
not statistically different.
(C and D) Co-inhibited spindles undergo MT flux at rates consistent with the inactivation
of Eg5.
(C) Selected images from a time-lapse series of a monastrol-treated and p150-CC1-
injected LLC-Pk1-PAα cell photoactivated parallel to the metaphase plate. The white
lines serve as a fiduciary mark. Times are relative to injection (0:00) and are displayed as
min:sec.
(D) Average rate of poleward flux + standard deviation after the indicated treatments.
Values for control bipoles, monastrol-treated monopoles and monastrol-treated bipoles
are from Ferenz and Wadsworth (2007).
(E) Co-inhibited spindles remove Mad2 from metaphase kinetochores. Control
prometaphase (top), metaphase (middle) and monastrol-treated, p150-CC1-injected
metaphase (bottom) LLC-Pk1 cells were fixed and stained for MTs (left). A merge with
Mad2 is shown on the right.
(F) Mitotic fate of monastrol-treated and p150-CC1-injected monopoles. LLC-Pk1 cells
were treated with monastrol, injected with p150-CC1, and then fixed and stained 1-5hrs
post-injection. Cells that had previously been injected were located, and the mitotic stage
of these cells was scored. Bars = 10μm.
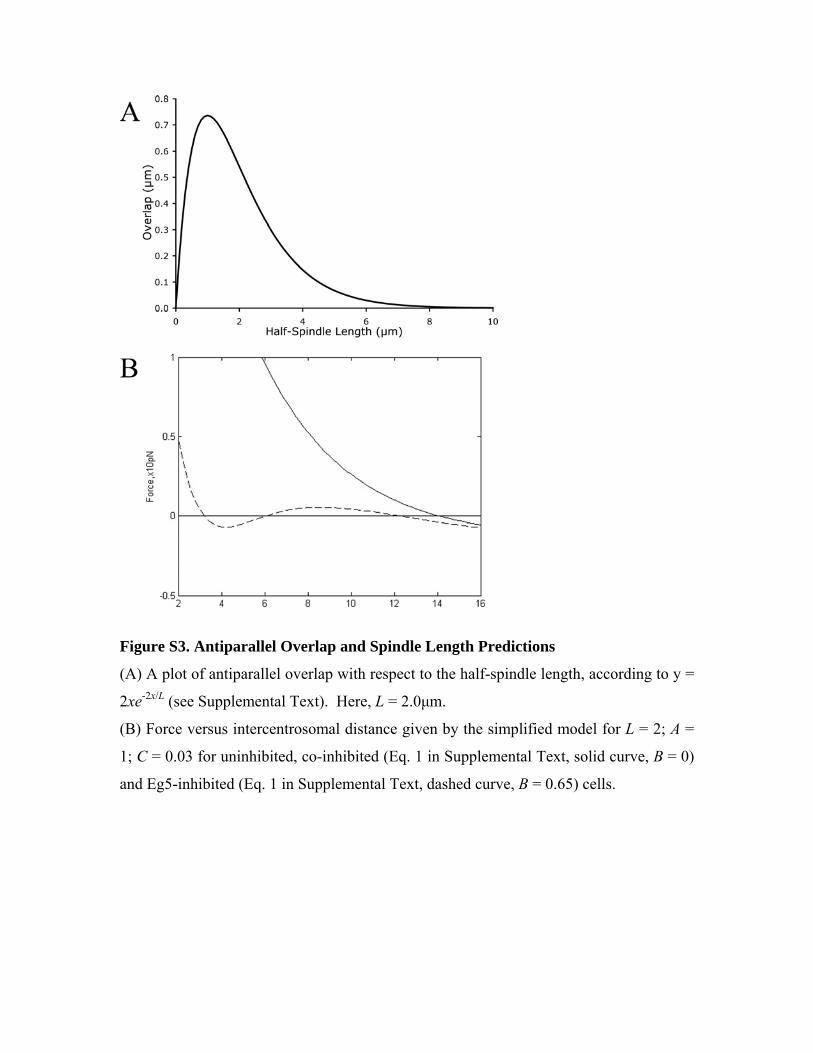
Figure S3. Antiparallel Overlap and Spindle Length Predictions
(A) A plot of antiparallel overlap with respect to the half-spindle length, according to y =
2xe-2x/L (see Supplemental Text). Here, L = 2.0μm.
(B) Force versus intercentrosomal distance given by the simplified model for L = 2; A =
1; C = 0.03 for uninhibited, co-inhibited (Eq. 1 in Supplemental Text, solid curve, B = 0)
and Eg5-inhibited (Eq. 1 in Supplemental Text, dashed curve, B = 0.65) cells.
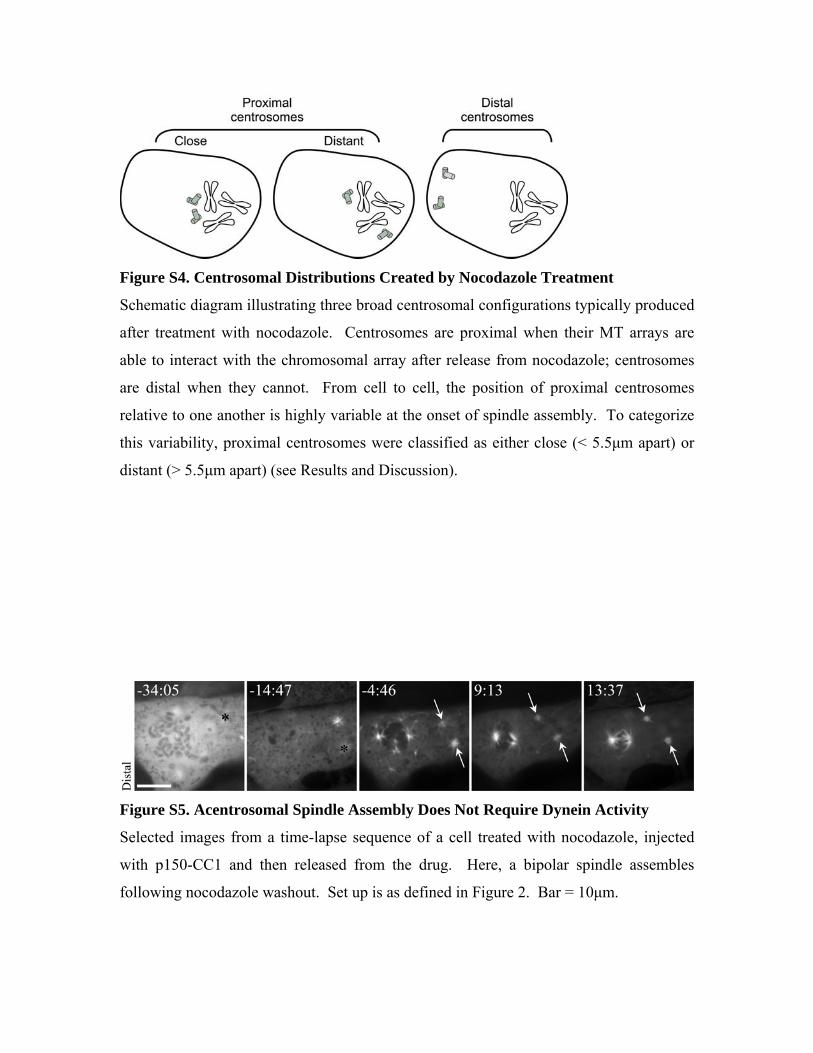
Figure S4. Centrosomal Distributions Created by Nocodazole Treatment
Schematic diagram illustrating three broad centrosomal configurations typically produced
after treatment with nocodazole. Centrosomes are proximal when their MT arrays are
able to interact with the chromosomal array after release from nocodazole; centrosomes
are distal when they cannot. From cell to cell, the position of proximal centrosomes
relative to one another is highly variable at the onset of spindle assembly. To categorize
this variability, proximal centrosomes were classified as either close (< 5.5μm apart) or
distant (> 5.5μm apart) (see Results and Discussion).
Figure S5. Acentrosomal Spindle Assembly Does Not Require Dynein Activity
Selected images from a time-lapse sequence of a cell treated with nocodazole, injected
with p150-CC1 and then released from the drug. Here, a bipolar spindle assembles
following nocodazole washout. Set up is as defined in Figure 2. Bar = 10μm.
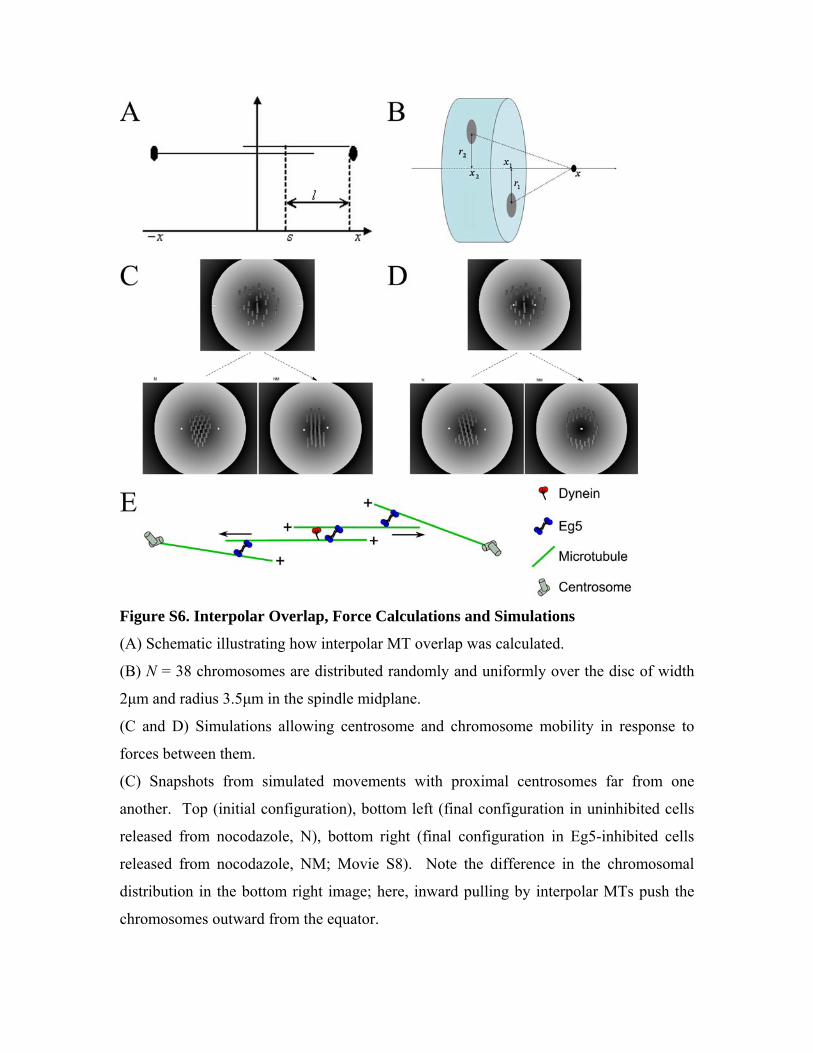
Figure S6. Interpolar Overlap, Force Calculations and Simulations
(A) Schematic illustrating how interpolar MT overlap was calculated.
(B) N = 38 chromosomes are distributed randomly and uniformly over the disc of width
2μm and radius 3.5μm in the spindle midplane.
(C and D) Simulations allowing centrosome and chromosome mobility in response to
forces between them.
(C) Snapshots from simulated movements with proximal centrosomes far from one
another. Top (initial configuration), bottom left (final configuration in uninhibited cells
released from nocodazole, N), bottom right (final configuration in Eg5-inhibited cells
released from nocodazole, NM; Movie S8). Note the difference in the chromosomal
distribution in the bottom right image; here, inward pulling by interpolar MTs push the
chromosomes outward from the equator.
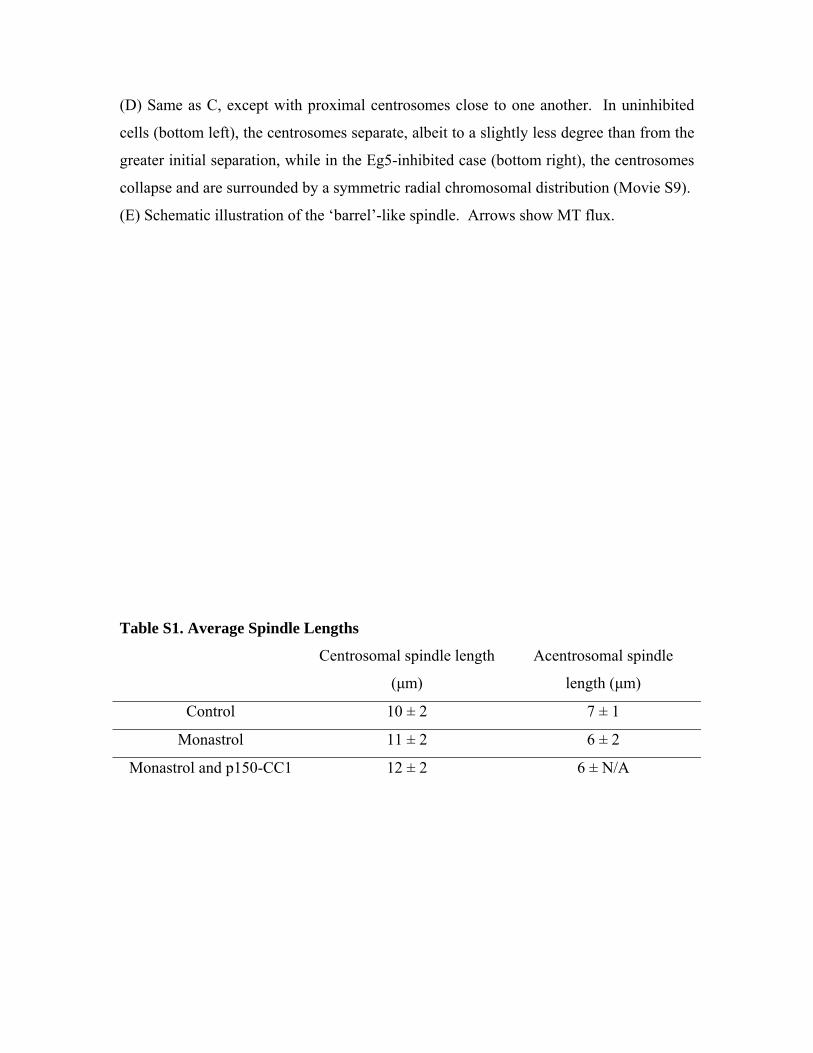
(D) Same as C, except with proximal centrosomes close to one another. In uninhibited
cells (bottom left), the centrosomes separate, albeit to a slightly less degree than from the
greater initial separation, while in the Eg5-inhibited case (bottom right), the centrosomes
collapse and are surrounded by a symmetric radial chromosomal distribution (Movie S9).
(E) Schematic illustration of the ‘barrel’-like spindle. Arrows show MT flux.
Table S1. Average Spindle Lengths
Centrosomal spindle length
(μm)
Acentrosomal spindle
length (μm)
Control 10 ± 2 7 ± 1
Monastrol 11 ± 2 6 ± 2
Monastrol and p150-CC1 12 ± 2 6 ± N/A
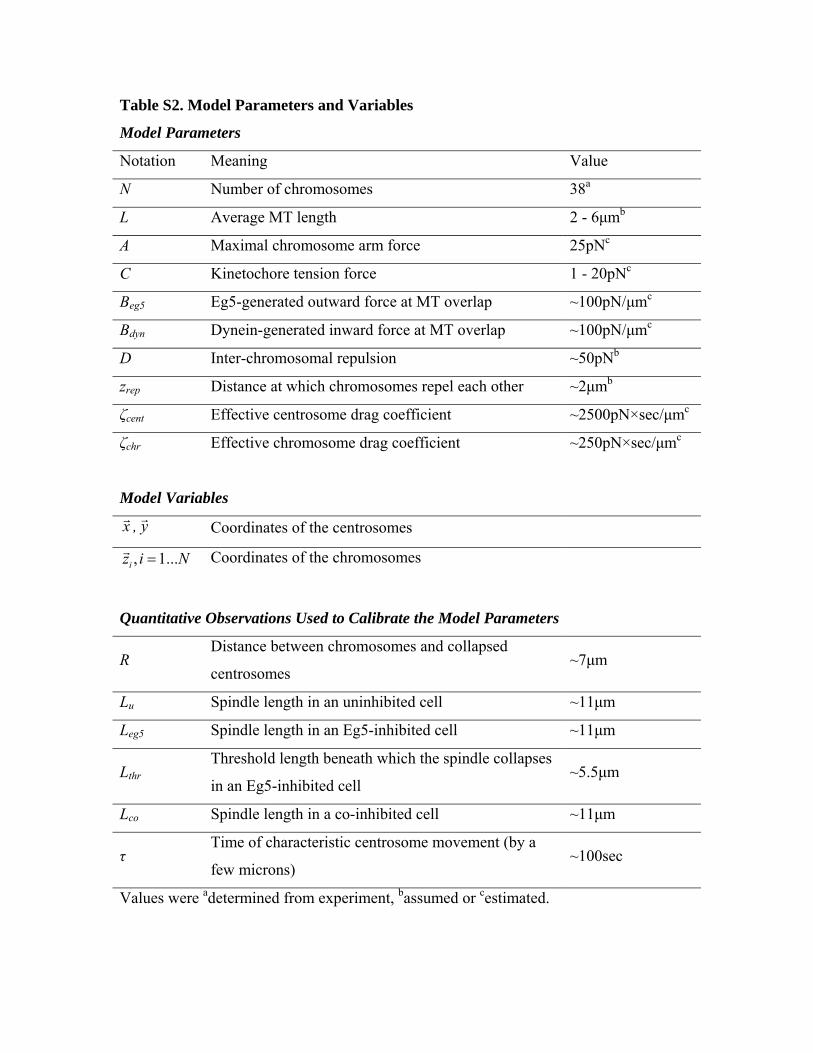
Table S2. Model Parameters and Variables
Model Parameters
Notation Meaning Value
N Number of chromosomes 38a
L Average MT length 2 - 6μmb
A Maximal chromosome arm force 25pNc
C Kinetochore tension force 1 - 20pNc
Beg5 Eg5-generated outward force at MT overlap ~100pN/μmc
Bdyn Dynein-generated inward force at MT overlap ~100pN/μmc
D Inter-chromosomal repulsion ~50pNb
zrep Distance at which chromosomes repel each other ~2μmb
ζcent Effective centrosome drag coefficient ~2500pN×sec/μmc
ζchr Effective chromosome drag coefficient ~250pN×sec/μmc
Model Variables
xr , yr Coordinates of the centrosomes
, 1...iz i N=r Coordinates of the chromosomes
Quantitative Observations Used to Calibrate the Model Parameters
R Distance between chromosomes and collapsed
centrosomes ~7μm
Lu Spindle length in an uninhibited cell ~11μm
Leg5 Spindle length in an Eg5-inhibited cell ~11μm
Lthr Threshold length beneath which the spindle collapses
in an Eg5-inhibited cell ~5.5μm
Lco Spindle length in a co-inhibited cell ~11μm
τ Time of characteristic centrosome movement (by a
few microns) ~100sec
Values were adetermined from experiment, bassumed or cestimated.
Supplemental References
1. Dogterom, M., and Leibler, S. (1993). Physical aspects of the growth and regulation
of microtubule structures. Phys. Rev. Lett. 70, 1347-1350.
2. Grill, S.W., Howard, J., Schäffer, E., Stelzer, E.H., and Hyman, A.A. (2003). The
distribution of active force generators controls mitotic spindle position. Science. 301,
518-521.
3. Mastronarde, D.N., McDonald, K.L., Ding, R., and McIntosh, J.R.. 1993. Interpolar
spindle microtubules in PtK cells. J. Cell Biol. 123, 1475-1489.
4. Cytrynbaum, E.N., Scholey, J.M., and Mogilner, A. (2003). A force balance model of
early spindle pole separation in Drosophila embryos. Biophys. J. 84, 757-769.
5. Wollman, R., Civelekoglu-Scholey, G., Scholey, J.M., and Mogilner, A. (2008).
Reverse engineering of force integration during mitosis in the Drosophila embryo.
Mol. Syst. Biol. 4, 195.
6. Dogterom, M., and Yurke, B. (1997). Measurement of the force-velicity relation for
growing microtubules. Science. 278, 856-860.
7. Rusan, N.M., Tulu, U.S., Fagerstrom, C., and Wadsworth, P. (2002). Reorganization
of the microtubule array in prophase/prometaphase requires cytoplasmic dynein-
dependent microtubule transport. J. Cell Biol. 158, 997-1003.
8. Wollman, R., Cytrynbaum, E.N., Jones, J.T., Meyer, T., Scholey, J.M., and Mogilner,
A. (2005). Effeicient chromosome capture requires a bias in the ‘search-and-capture’
process during mitotic spindle assembly. Curr. Biol. 15, 828-832.
9. Cheerambathur, D.K., Civelekoglu-Scholey, G., Brust-Mascher, I., Sommi, P.,
Mogilner, A., and Scholey, J.M. (2007). Quantitative analysis of an anaphase B
switch: predicted role for a microtubule catastrophe gradient. J. Cell Biol. 177, 995-
1004.
10. Sharp, D.J., McDonald, K.L., Brown, H.M., Matthies, H.J., Walczak, C., Vale, R.D.,
Mitchison, T.J., and Scholey, J.M. (1999). The bipolar kinesin, KLP61F, cross-links
microtubules within interpolar microtubule bundles of Drosophila embryonic mitotic
spindles. J. Cell Biol. 144, 125-138.
11. Yang, G., Houghtaling, B.R., Gaetz, J., Liu, J.Z., Danuser, G., and Kapoor, T.M.
(2007). Architectural dynamics of the meiotic spindle revealed by single-fluorophore
imaging. Nat. Cell Biol. 9:1233-1242.
12. Zemel, A., Mogilner, A. (2009). Motor-induced sliding of microtubule and actin
bundles. Phys. Chem. Chem. Phys. 11:4821-4833.
13. Yang, G., Cameron, L.A., Maddox, P.S., Salmon, E.D., and Danuser, G. (2008).
Regional variation of microtubule flux reveals microtubule organization in the
metaphase meiotic spindle. J. Cell Biol. 182:631-639.
14. Brust-Mascher, I., Civelekoglu-Scholey, G., Kwon, M., Mogilner, A., and Scholey,
J.M. (2004). Model for anaphase B: Role of three mitotic motors in a switch from
poleward flux to spindle elongation. Proc. Natl. Acad. Sci. 101:15938-15943.
Related Documents


![Inhibition of Eg5 Acts Synergistically with Checkpoint ...Eg5 [kinesin spindle protein (KSP), HKSP, KNSL1, TRIP5, or kinesin family member 11 (KIF11)] is a plus-end directed Authors'](https://static.cupdf.com/doc/110x72/606c1b0397e9f26c261c3873/inhibition-of-eg5-acts-synergistically-with-checkpoint-eg5-kinesin-spindle.jpg)