Discussion Paper | Discussion Paper | Discussion Paper | Discussion Paper | Biogeosciences Discuss., 10, 7641–7676, 2013 www.biogeosciences-discuss.net/10/7641/2013/ doi:10.5194/bgd-10-7641-2013 © Author(s) 2013. CC Attribution 3.0 License. Open Access Biogeosciences Discussions This discussion paper is/has been under review for the journal Biogeosciences (BG). Please refer to the corresponding final paper in BG if available. Dynamics of seawater carbonate chemistry, production, and calcification of a coral reef flat, Central Great Barrier Reef R. Albright 1 , C. Langdon 2 , and K. R. N. Anthony 1 1 Australian Institute of Marine Science, Townsville MC, Townsville QLD 4810, Australia 2 Rosenstiel School of Marine and Atmospheric Science, University of Miami, 4600 Rickenbacker Causeway, Miami, FL 33149, USA Received: 31 March 2013 – Accepted: 9 April 2013 – Published: 3 May 2013 Correspondence to: R. Albright ([email protected]) Published by Copernicus Publications on behalf of the European Geosciences Union. 7641 Discussion Paper | Discussion Paper | Discussion Paper | Discussion Paper | Abstract Ocean acidification is projected to shift coral reefs from a state of net accretion to one of net dissolution this century. Presently, our ability to predict global-scale changes to coral reef calcification is limited by insufficient data relating seawater carbonate chem- istry parameters to in situ rates of reef calcification. Here, we investigate natural trends 5 in carbonate chemistry of the Davies Reef flat in the central Great Barrier Reef on diel and seasonal timescales and relate these trends to benthic carbon fluxes by quanti- fying net ecosystem calcification (nec) and net community production (ncp). Results show that seawater carbonate chemistry of the Davies Reef flat is highly variable over both diel and seasonal timescales. pH (total scale) ranged from 7.92 to 8.17, pCO 2 10 ranged from 272 to 542 μatm, and aragonite saturation state (Ω arag ) ranged from 2.9 to 4.1. Diel cycles in carbonate chemistry were primarily driven by ncp, and warming explained 35 % and 47 % of the seasonal shifts in pCO 2 and pH, respectively. Day- time ncp averaged 36 ± 19 mmol C m -2 h -1 in summer and 33 ± 13 mmol C m -2 h -1 in winter; nighttime ncp averaged -22 ± 20 and -7 ± 6 mmol C m -2 h -1 in summer and 15 winter, respectively. Daytime nec averaged 11 ± 4 mmol CaCO 3 m -2 h -1 in summer and 8 ± 3 mmol CaCO 3 m -2 h -1 in winter, whereas nighttime nec averaged 2 ± 4 mmol and -1 ± 3 mmol CaCO 3 m -2 h -1 in summer and winter, respectively. Net ecosystem calci- fication was positively correlated with Ω arag for both seasons. Linear correlations of nec and Ω arag indicate that the Davies Reef flat may transition from a state of net calcifica- 20 tion to net dissolution at Ω arag values of 3.4 in summer and 3.2 in winter. Diel trends in Ω arag indicate that the reef flat is currently below this calcification threshold 29.6 % of the time in summer and 14.1 % of the time in winter. 7642

Welcome message from author
This document is posted to help you gain knowledge. Please leave a comment to let me know what you think about it! Share it to your friends and learn new things together.
Transcript
Discussion
Paper
|D
iscussionP
aper|
Discussion
Paper
|D
iscussionP
aper|
Biogeosciences Discuss., 10, 7641–7676, 2013www.biogeosciences-discuss.net/10/7641/2013/doi:10.5194/bgd-10-7641-2013© Author(s) 2013. CC Attribution 3.0 License.
EGU Journal Logos (RGB)
Advances in Geosciences
Open A
ccess
Natural Hazards and Earth System
Sciences
Open A
ccess
Annales Geophysicae
Open A
ccess
Nonlinear Processes in Geophysics
Open A
ccess
Atmospheric Chemistry
and Physics
Open A
ccess
Atmospheric Chemistry
and Physics
Open A
ccess
Discussions
Atmospheric Measurement
Techniques
Open A
ccess
Atmospheric Measurement
Techniques
Open A
ccess
Discussions
Biogeosciences
Open A
ccess
Open A
ccess
BiogeosciencesDiscussions
Climate of the Past
Open A
ccess
Open A
ccess
Climate of the Past
Discussions
Earth System Dynamics
Open A
ccess
Open A
ccess
Earth System Dynamics
Discussions
GeoscientificInstrumentation
Methods andData Systems
Open A
ccess
GeoscientificInstrumentation
Methods andData Systems
Open A
ccess
Discussions
GeoscientificModel Development
Open A
ccess
Open A
ccess
GeoscientificModel Development
Discussions
Hydrology and Earth System
SciencesO
pen Access
Hydrology and Earth System
Sciences
Open A
ccess
Discussions
Ocean Science
Open A
ccess
Open A
ccess
Ocean ScienceDiscussions
Solid Earth
Open A
ccess
Open A
ccess
Solid EarthDiscussions
The Cryosphere
Open A
ccess
Open A
ccess
The CryosphereDiscussions
Natural Hazards and Earth System
Sciences
Open A
ccess
Discussions
This discussion paper is/has been under review for the journal Biogeosciences (BG).Please refer to the corresponding final paper in BG if available.
Dynamics of seawater carbonatechemistry, production, and calcification ofa coral reef flat, Central Great Barrier ReefR. Albright1, C. Langdon2, and K. R. N. Anthony1
1Australian Institute of Marine Science, Townsville MC, Townsville QLD 4810, Australia2Rosenstiel School of Marine and Atmospheric Science, University of Miami,4600 Rickenbacker Causeway, Miami, FL 33149, USA
Received: 31 March 2013 – Accepted: 9 April 2013 – Published: 3 May 2013
Correspondence to: R. Albright ([email protected])
Published by Copernicus Publications on behalf of the European Geosciences Union.
7641
Discussion
Paper
|D
iscussionP
aper|
Discussion
Paper
|D
iscussionP
aper|
Abstract
Ocean acidification is projected to shift coral reefs from a state of net accretion to oneof net dissolution this century. Presently, our ability to predict global-scale changes tocoral reef calcification is limited by insufficient data relating seawater carbonate chem-istry parameters to in situ rates of reef calcification. Here, we investigate natural trends5
in carbonate chemistry of the Davies Reef flat in the central Great Barrier Reef on dieland seasonal timescales and relate these trends to benthic carbon fluxes by quanti-fying net ecosystem calcification (nec) and net community production (ncp). Resultsshow that seawater carbonate chemistry of the Davies Reef flat is highly variable overboth diel and seasonal timescales. pH (total scale) ranged from 7.92 to 8.17, pCO210
ranged from 272 to 542 µatm, and aragonite saturation state (Ωarag) ranged from 2.9to 4.1. Diel cycles in carbonate chemistry were primarily driven by ncp, and warmingexplained 35 % and 47 % of the seasonal shifts in pCO2 and pH, respectively. Day-time ncp averaged 36±19 mmol C m−2 h−1 in summer and 33±13 mmol C m−2 h−1 inwinter; nighttime ncp averaged −22±20 and −7±6 mmol C m−2 h−1 in summer and15
winter, respectively. Daytime nec averaged 11±4 mmol CaCO3 m−2 h−1 in summer and8±3 mmol CaCO3 m−2 h−1 in winter, whereas nighttime nec averaged 2±4 mmol and−1±3 mmol CaCO3 m−2 h−1 in summer and winter, respectively. Net ecosystem calci-fication was positively correlated with Ωarag for both seasons. Linear correlations of necand Ωarag indicate that the Davies Reef flat may transition from a state of net calcifica-20
tion to net dissolution at Ωarag values of 3.4 in summer and 3.2 in winter. Diel trends inΩarag indicate that the reef flat is currently below this calcification threshold 29.6 % ofthe time in summer and 14.1 % of the time in winter.
7642
Discussion
Paper
|D
iscussionP
aper|
Discussion
Paper
|D
iscussionP
aper|
1 Introduction
Atmospheric carbon dioxide (pCO2) has increased from approximately 280 ppm to390 ppm since the start of the industrial revolution due to anthropogenic activities suchas the burning of fossil fuels, cement production, and land use changes (IPCC, 2007).Approximately 30 % of the carbon dioxide emitted each year into the atmosphere is5
absorbed by the world’s surface oceans, causing a shift in the seawater carbonatechemistry (Canadell et al., 2007; Sabine et al., 2011). On entry into the ocean, CO2reacts with seawater via the following net chemical reaction:
H2O+ (CO2)aq+CO2−3 → 2HCO−
3 . (1)
As a result, concentrations of aqueous carbon dioxide, [CO2]aq, and bicarbonate,10
[HCO−3 ], increase, while the concentration of carbonate, [CO2−
3 ], and the pH of seawaterdecrease (Broecker et al., 1979; Caldeira and Wickett, 2003; Sabine et al., 2004); thisprocess is referred to as ocean acidification. Since preindustrial times, CO2 uptake bythe surface ocean waters has lowered seawater pH by approximately 0.1 units, whichequates to an increase in acidity (i.e., the hydrogen ion concentration) of approximately15
30 %. Carbonate ion concentrations in surface waters have simultaneously decreasedby 11 % and 15 % in the tropics and Southern Ocean respectively (Orr et al., 2005).Further reductions in pH of 0.3–0.5 units are projected by the end of this century asthe oceans continue to absorb anthropogenic CO2 (Sabine et al., 2004; IPCC, 2007).
A decrease in [CO2−3 ] results in a decrease in the saturation state of calcium carbon-20
ate (CaCO3), defined as:
Ω= [Ca2+][CO2−3 ]/K ′sp, (2)
where K ′sp is the solubility product for a particular mineral phase of CaCO3 (e.g. arag-onite, calcite). Aragonite is the dominant biogenic form of CaCO3 secreted by manyreef-building organisms, including corals. If Ω> 1, seawater is supersaturated with re-25
spect to CaCO3, and conditions are favorable for CaCO3 precipitation; conversely, if7643
Discussion
Paper
|D
iscussionP
aper|
Discussion
Paper
|D
iscussionP
aper|
Ω< 1, seawater is undersaturated with respect to CaCO3 and the dissolution of CaCO3is favored. The surface waters of the tropical oceans are currently supersaturated withrespect to aragonite (Ωarag =4.0±0.2, mean±SD); however, Ωarag has steadily de-clined from a calculated 4.6 ±0.2 one-hundred years ago and is expected to continuedeclining to 3.1±0.2 by the year 2065 and 2.8±0.2 by 2100 (Kleypas et al., 1999).5
Experimental results and models suggest that increases in atmospheric CO2 and theassociated declines in [CO2−
3 ] and Ωarag of the ocean’s surface waters will reduce ratesof calcification on coral reefs (Gattuso et al., 1999; Langdon et al., 2000; Langdon andAtkinson, 2005; Anthony et al., 2008). Simultaneously, rates of bioerosion (Tribollet etal., 2009) and dissolution (Halley and Yates, 2000) are expected to increase. Because10
reef growth ultimately depends on the balance between constructive (e.g. CaCO3 de-position) and destructive (e.g. bioerosion, dissolution, etc.) processes, there is concernthat corals may be approaching a critical threshold, beyond which their ability to effec-tively form reefs will be severely compromised. Presently, our ability to predict global-scale changes to coral reef calcification is limited by insufficient data relating pCO2,15
pH, [CO2−3 ], and/or Ω to in situ rates of reef calcification.
Ocean acidification projections are based on trends from data collected in openocean environments (Doney et al., 2009; Feely et al., 2009; Zeebe et al., 2012) andtheir implications for shallow, near-shore environments, such as coral reefs, are poorlyunderstood. Coral reefs can naturally experience large fluctuations in seawater carbon-20
ate chemistry on both diurnal (Ohde and van Woesik, 1999; Shamberger et al., 2011;Shaw et al., 2012) and seasonal (Bates et al., 2010; Gray et al., 2012) timescales. Thecoral reef carbon cycle is mainly driven by two biological processes, organic carbonmetabolism (photosynthesis and respiration) and inorganic carbon metabolism (cal-cification and dissolution). The extent to which these processes alter the carbonate25
chemistry of the overlying water column is a function of numerous environmental fac-tors, including benthic community composition (Anthony et al., 2011), biological activity(which can vary with temperature, light and nutrient availability), physical forcing (e.g.temperature, salinity), tidal regime, water depth, and residence time (Falter et al., 2008,
7644
Discussion
Paper
|D
iscussionP
aper|
Discussion
Paper
|D
iscussionP
aper|
2013). As a result, chemical conditions can vary from reef to reef and often differ fromopen ocean conditions. For example, Shaw et al. (2012) demonstrated that pCO2 andpH values on the Lady Elliot Island reef flat (Great Barrier Reef, Australia) can rangefrom preindustrial values (∼100 µatm pCO2 and pH 8.6) to future ocean acidificationscenarios (∼1300 µatm pCO2 and pH 7.6) over the course of a day. Understanding the5
significance of ocean acidification projections in the context of this background variabil-ity is imperative to gauging the susceptibility of reef ecosystems to projected changesin ocean chemistry.
An increasing number of studies are characterizing in situ trends in seawater car-bonate chemistry and calcification rates in natural reef communities to develop rela-10
tionships between carbonate parameters and biological processes; these relationshipsare used to estimate ‘thresholds’ at which reef systems transition from net accretion tonet dissolution. To date, studies indicate that thresholds vary between reefs (Silvermanet al., 2009; Shamberger et al., 2011), substrate types (Yates and Halley, 2006), andyears (Yates and Halley, 2006), complicating our ability to predict global trends. pCO215
thresholds for the Eilat Reef in the Red Sea are estimated to be as low as 560 ppm(Silverman et al., 2009) while reefs in Kaneohe Bay, Hawaii are not expected to dis-solve until pCO2 reaches nearly 900 µatm (Shamberger et al., 2011). More studiesinvestigating natural community responses and relationships between in situ carbon-ate chemistry and fundamental biological processes are required to develop accurate20
predictions of the effects of ocean acidification on coral reef ecosystems.Here, we investigate natural trends in carbonate chemistry of the Davies Reef flat
(central Great Barrier Reef) on both diel and seasonal timescales. We relate thesetrends to benthic carbon fluxes by quantifying net ecosystem calcification (nec) and netcommunity production (ncp). Automated water samplers were deployed to document25
diel cycling in reef carbonate chemistry, and nec and ncp were measured using aLagrangian approach. Relationships between nec and Ωarag are calculated to estimatethe threshold Ωarag value at which the Davies Reef flat transitions from net calcificationto net dissolution.
7645
Discussion
Paper
|D
iscussionP
aper|
Discussion
Paper
|D
iscussionP
aper|
2 Methods
2.1 Study site
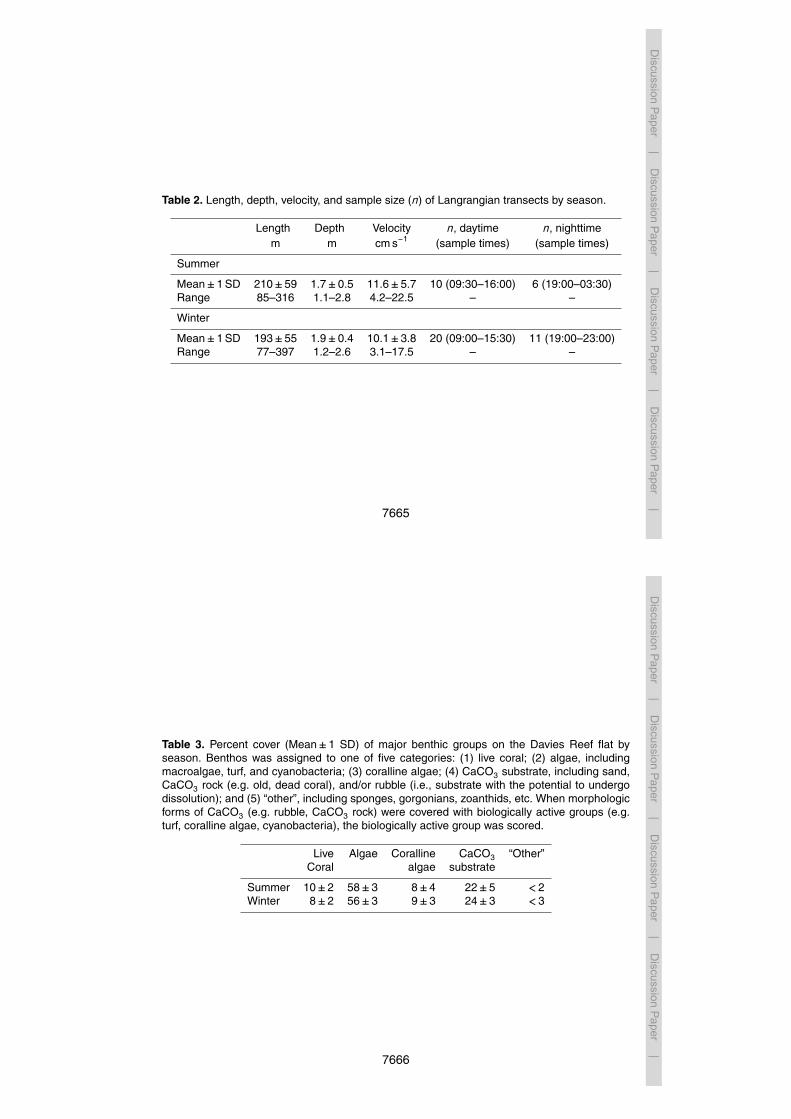
Davies Reef (1850′ S, 147 38′ E) is an open, lagoonal reef located in the mid-shelf ofthe central Great Barrier Reef, Australia (Fig. 1). The reef is located approximately 90–100 km Northeast of Townsville, Queensland. Davies Reef is approximately 6 km long5
and 2.7 km wide; the reef flat faces the SE direction, and is approximately 300 m wide.The prevailing wind direction is from the southeast, and the tidal regime is semidiurnal.Current behaviour on the reef flat is determined by the interaction of wind, tide andsurface slope (Frith, 1983). Water flow across the reef flat is tidally dominated whenthe wind speed falls below ∼10 knots. Tidal reversals occur such that reef flat currents10
flood from the lagoon to the reef crest and ebb from the crest to the lagoon (Frith,1983). There is a wet season during summer from approximately November throughApril and a dry season during winter from approximately May through October.
2.2 Water sampling and analysis
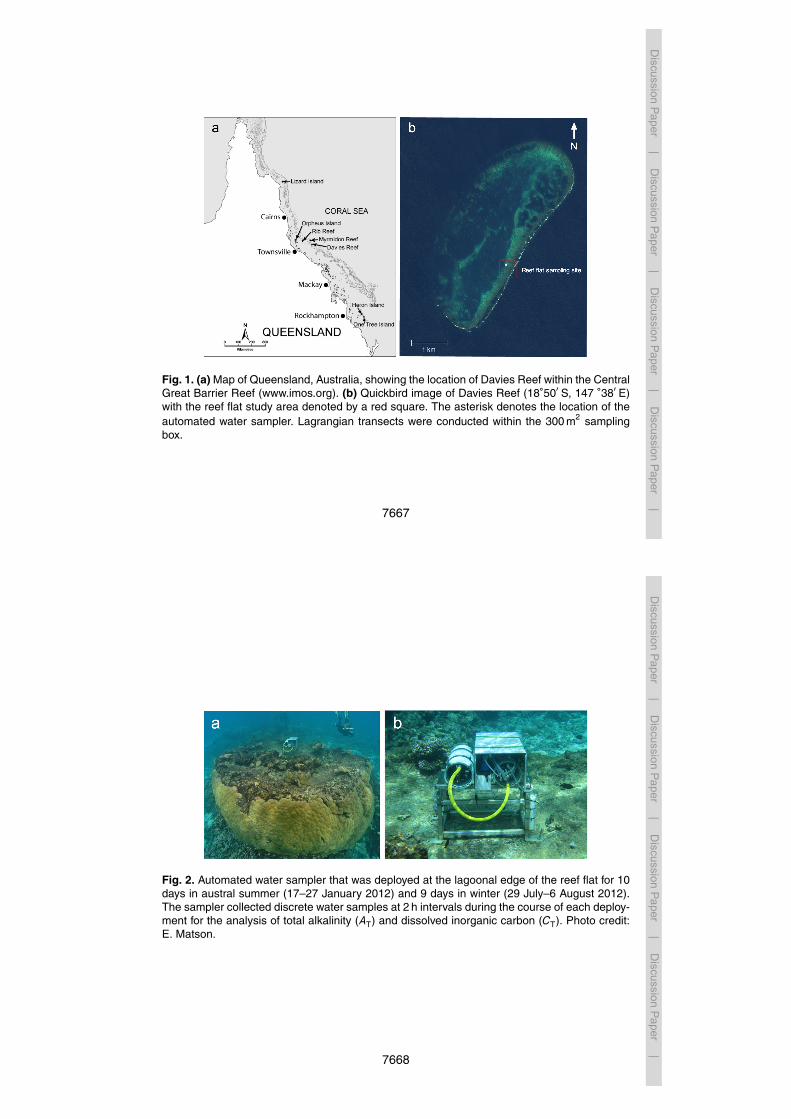
2.2.1 Fixed stations15
An automated water sampler (Fig. 2) was deployed on the protected (lagoonal) side ofthe reef flat (Fig. 1) to document diurnal variability in reef flat carbonate chemistry. Theapproximate depth of the water sampler was 0.5 m but varied with tides. The samplerwas programmed to collect discrete water samples at 2 h intervals, by pumping reefwater into pre-poisoned (0.05 % HgCl2 by volume to inhibit biological activity; Dickson,20
2007) 250 mL borosilicate bottles. Bottles were filled with reef water at a flow rate of∼2 mL s−1 (∼2 min per sample). The sampler was programmed to flush the lines for30 s prior to filling a new sample bottle to avoid contamination of new samples with “old”water. Bottles were retrieved every 12 h and new, pre-poisoned bottles were deployed.
7646
Discussion
Paper
|D
iscussionP
aper|
Discussion
Paper
|D
iscussionP
aper|
The sampler was deployed from 17–27 January 2012 in austral summer and 29 July–6 August 2012 in austral winter.
2.2.2 Transects
Net ecosystem calcification (nec) and net community production (ncp) of the Daviesreef flat were measured using a Lagrangian approach. This method involves measuring5
total alkalinity (AT) and dissolved inorganic carbon (CT) immediately before a parcelof water traverses the reef flat and immediately downstream of the reef community.The change in AT and CT was corrected for the transit time and water depth profileto produce a net rate at which the community altered the chemistry of the overlyingwater column (Eqs. 3, 4, 5). This method is limited to environments that experience10
unidirectional flow of water, and it has been widely applied to reef flats that experienceunidirectional flow during incoming/outgoing tides or due to waves breaking across areef crest (Langdon et al., 2010). If the study site consists of biological zones that arebroad and perpendicular to the direction of water flow, lateral mixing is considered aninsignificant source of error (Langdon et al., 2010).15
Lagrangian transport was measured by following water parcels using a small boatand a hand-held GPS (2–5 m precision) to record the location of the parcel as it tra-versed the reef flat. Water parcels were identified using fluorescein dye during the dayand drifters (60 cm tall and 75 cm wide) at night. Discrete water samples were takenin duplicate at the beginning and end of each transect. Samples were taken in 250 mL20
borosilicate bottles filled at the water’s surface and immediately poisoned with 125 µLHgCl2 (0.05 % by volume) to inhibit biological activity. Water depth was measured usinga hand-held depth sounder alongside of the dye patch/drifter at regular intervals alongeach transect and averaged. Transects were repeated many times over the course ofseveral days in order to develop a composite diel curve of calcification and production.25
7647
Discussion
Paper
|D
iscussionP
aper|
Discussion
Paper
|D
iscussionP
aper|
2.2.3 Carbonate Chemistry
Water samples were transported to the Australian Institute of Marine Science (AIMS)where they were analyzed for total alkalinity (AT) and dissolved inorganic carbon (CT)
using a VINDTA 3C® (Versatile INstrument for the Determination of Total dissolvedinorganic carbon and Alkalinity, Marianda, Kiel, Germany) and a UIC CO2 coulometer5
detector (UIC Inc., Joliet, USA). Accuracy was checked against certified seawater refer-ence material (from A. Dickson, Scripps Institute of Oceanography, Batch 106). pCO2,pHT (total scale), and aragonite saturation state (Ωarag) were calculated as a functionof the measured salinity, temperature, AT, and CT using the program CO2SYS (fromE. Lewis, Brookhaven National Laboratory/Lewis and Wallace, 1998); dissociation con-10
stants for carbonate and boric acid determined by Mehrbach et al. (1973) as refit byDickson and Millero (1987), and the dissociation constant for boric acid determined byDickson (1990).
2.2.4 Physical conditions
Temperature, light (PAR at 0.8 m depth), and wind data were obtained from the AIMS15
Weather Station at Davies Reef (http://data.aims.gov.au/), and salinity data were ob-tained from the Integrated Marine Observing System (IMOS 2012).
2.3 Calculations
Changes in seawater carbon chemistry between upstream and downstream samplingpoints can be used to calculate net ecosystem calcification (nec) and net community20
production (ncp) rates. In most coral reef systems, changes in total alkalinity (AT) arecaused primarily by calcification and dissolution of CaCO3 whereby two moles of ATare consumed (produced) for every mole of CaCO3 produced (dissolved). Accordingly,
7648

Discussion
Paper
|D
iscussionP
aper|
Discussion
Paper
|D
iscussionP
aper|
net ecosystem calcification, nec, (mmol CaCO3 m−2 h−1) can be calculated as:
nec = −0.5ρh∆AT
∆t(3)
where ∆AT is the change in total alkalinity between the upstream and downstreamlocations (mmol kg−1), ρ is the seawater density (kg m−3), h is the water depth (m), and∆t is the duration of the transect (h).5
CT is affected by calcification, dissolution, photosynthesis, respiration. Net commu-nity production, ncp, (mmol C m−2 h−1) can be calculated using changes in CT aftertaking into account nec and gas exchange:
ncp = −hρ(∆CT −0.5∆AT)
∆t−kS (pCO2w−pCO2a) (4)
where ∆CT is the change in dissolved inorganic carbon between the upstream and10
downstream locations (mmol kg−1), and the term kS(pCO2w−pCO2a) approximatesgas exchange where k is the gas transfer velocity, S is the solubility of CO2 calcu-lated as a function of salinity and temperature, and (pCO2w−pCO2a) is the differencein pCO2 between the surface ocean and the atmosphere. All other parameters aredefined as above. The wind speed parameterization of Ho et al. (2006) was used to15
calculate k, which ranged from 5.8 to 16.7 cm h−1, with a mean of 10.3 cm h−1. Result-ing gas exchange estimates were small in comparison to ncp, ranging from −0.11 to0.13 mmol C m−2 h−1. Because gas exchange averaged 0.32 % of ncp (ranging from0 % to 1.9 %), this term was treated as negligible, simplifying the equation to the follow-ing:20
ncp = −hρ(∆CT −0.5∆AT)
∆t(5)
Pearson’s correlations were computed to assess the relationship between nec andaragonite saturation state (Ωarag).
7649
Discussion
Paper
|D
iscussionP
aper|
Discussion
Paper
|D
iscussionP
aper|
2.4 Light response curves
Productivity- and calcification-irradiance curves were fitted to data using linear or non-linear curve fitting (Graphpad Prism 5.0 for Mac OS X) (Gattuso et al., 1996). Theexponential function y =a[1-exp(−x / b)]+ c] produced the best fit for the productivity-irradiance curve, and the calcification-irradiance curve was modeled using a linear5
function.
2.5 Benthic community structure
Benthic surveys were conducted in both summer and winter to characterize the under-lying community structure of the reef flat site. Five, 200 m transects were laid on thereef flat perpendicular to the reef front, spaced 50 m apart. Photographs were taken of10
0.5 m2 quadrats at 5 m intervals (40 photos per transect). Photos were analyzed usingCoral Point Count software with excel extensions (CPCe) using 20 random points perquadrat. The benthos was assigned to one of five main categories: (1) live coral; (2)algae (including macroalgae, turf, and cyanobacteria); (3) coralline algae (CCA); (4)CaCO3 substrate including sand, CaCO3 rock (e.g. old, dead coral), and/or rubble (i.e.,15
substrate with the potential to undergo dissolution); (5) and “other”, including sponges,gorgonians, zoanthids, giant clams, etc. Where morphologic forms of CaCO3 (e.g. rub-ble, CaCO3 rock) were covered with biologically active groups (e.g. turf, coralline algae,cyanobacteria), the biologically active group was scored.
7650
Discussion
Paper
|D
iscussionP
aper|
Discussion
Paper
|D
iscussionP
aper|
3 Results
3.1 Physical conditions
3.1.1 Summer
Noontime irradiance, as measured at 0.8 m depth, ranged from 563–1240 µmol m−2 s−1, averaging 1099±186 µmol m−2 s−1. Winds were predominantly5
from the East/Southeast and averaged 12±3 knots (ranging from 3–24 knots). Thetidal height ranged from 0.5–3.5 m. Average temperature was 28.5±0.2 C (rangingfrom 28.1 C to 28.9 C) and salinity was 35.0±0.1. All values are mean ±1 SD.
3.1.2 Winter
Noontime irradiance ranged from 772–1023 µ mol m−2 s−1, averaging10
908±99 µmol m−2 s−1. Winds were predominantly from the East/Southeast andaveraged 12±3 knots (ranging from 4–19 knots). The tidal height ranged from 0.5–3.4 m. Average temperature 22.4±0.1 C (ranging from 22.1 C to 22.7 C) and salinitywas 35.6±0.1. All values are mean ±1 SD.
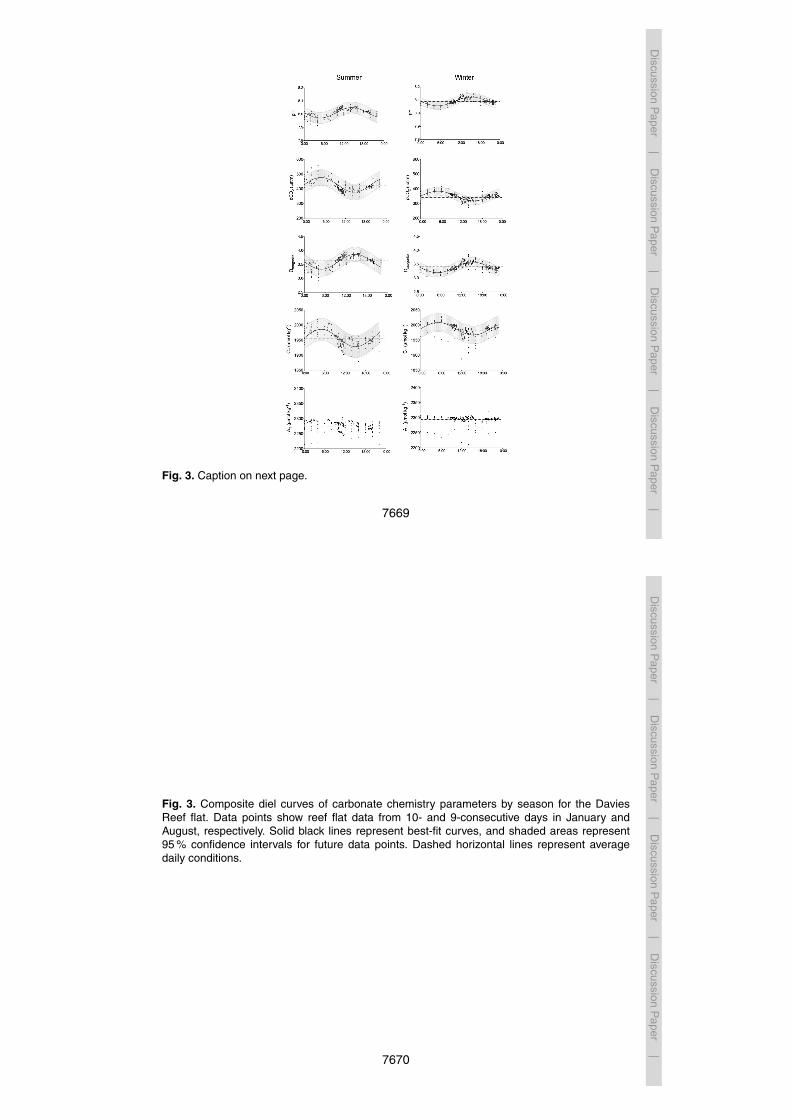
3.2 Diel patterns in seawater carbonate chemistry15
CT and pCO2 were highest just before dawn, following a steady increase through-out the night and lowest just before dusk following a steady decrease during the day(Fig. 3). Diel patterns in pHT and aragonite saturation state (Ωarag) mirrored those forCT and pCO2 but with highs at dusk and lows at dawn (Fig. 3). Tides resulted in smalldiel changes in temperature and salinity of approximately 1 C and <0.1 units, respec-20
tively. All measured and calculated physical and chemical parameters are presented inTable 1.
7651
Discussion
Paper
|D
iscussionP
aper|
Discussion
Paper
|D
iscussionP
aper|
3.3 Biological activity
A total of 47 net ecosystem calcification (nec) and net community production (ncp)rates were calculated over both seasons. Details of Lagrangian transects are given inTable 2.
3.3.1 Summer5
Net ecosystem calcification (nec) ranged from 5 to 17 mmol CaCO3 m−2 h−1 during theday, averaging 11±4 mmol CaCO3 m−2 h−1. At night, nec ranged from −3 to 7 mmolCaCO3 m−2 h−1, averaging 2±4 mmol CaCO3 m−2 h−1. There was a positive correla-tion between nec and Ωarag, Pearson r = 0.522, n = 16, p = 0.038 (Fig. 8). Average net
daily calcification, based on a 12 : 12 light dark cycle, was 6.5 mmol CaCO3 m−2 h−1.10
Net community production (ncp) ranged from 9 to 62 mmol C m−2 h−1 during the day,averaging 36±19 mmol C m−2 h−1. At night, ncp ranged from −50 to 1 mmol C m−2 h−1,averaging −22±20 mmol C m−2 h−1 (i.e., net respiring).
3.3.2 Winter
Net ecosystem calcification (nec) ranged from 2 to 14 mmol CaCO3 m−2 h−1 during the15
day, averaging 8±3 mmol CaCO3 m−2 h−1. At night, nec ranged from −4 to 4 mmolCaCO3 m−2 h−1, averaging −1±3 mmol CaCO3 m−2 h−1 (i.e. net dissolution). Therewas a strong positive correlation between nec and Ωarag, Pearson r = 0.497, n = 29,p = 0.006 (Fig. 8). Average net daily calcification, based on a 12 : 12 light dark cycle,was 3.5 mmol CaCO3 m−2 h−1, approximately half that of summer.20
Net community production (ncp) ranged from 1 to 52 mmol C m−2 h−1 during the day,averaging 33±13 mmol C m−2 h−1. At night, ncp ranged from −14 to 5 mmol C m−2 h−1,averaging −7±6 mmol C m−2 h−1 (i.e. net respiring), and approximately a third of thesummer rate.
7652
Discussion
Paper
|D
iscussionP
aper|
Discussion
Paper
|D
iscussionP
aper|
3.4 Light response curves
Best fits for productivity- and calcification-irradiance curves are presented in Fig. 9.
3.5 Benthic surveys
Percent cover of major benthic groups did not change significantly from summer towinter (Table 3).5
4 Discussion
4.1 Trends in carbonate chemistry
Seawater carbonate chemistry observed at the Davies Reef flat was highly variableover both diel and seasonal timescales. pHT ranged from 7.92 to 8.17, pCO2 rangedfrom 272 to 542 µatm, and Ωarag ranged from 2.9 to 4.1. These ranges are consistent10
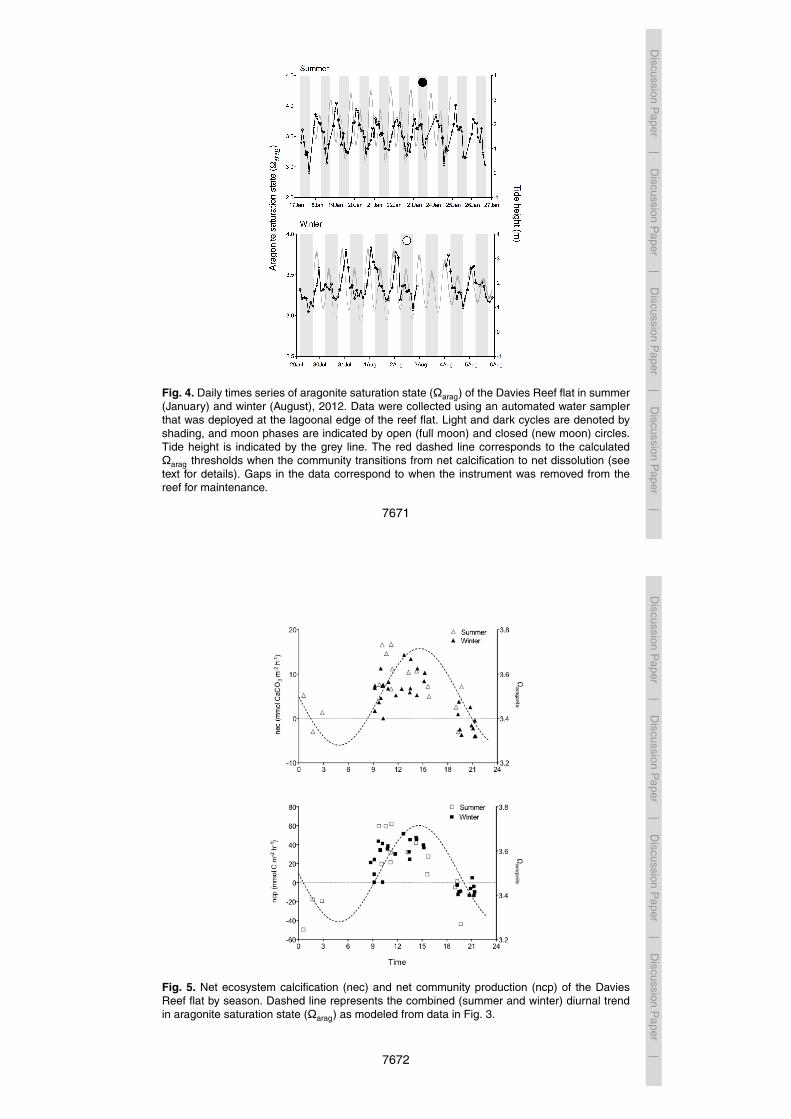
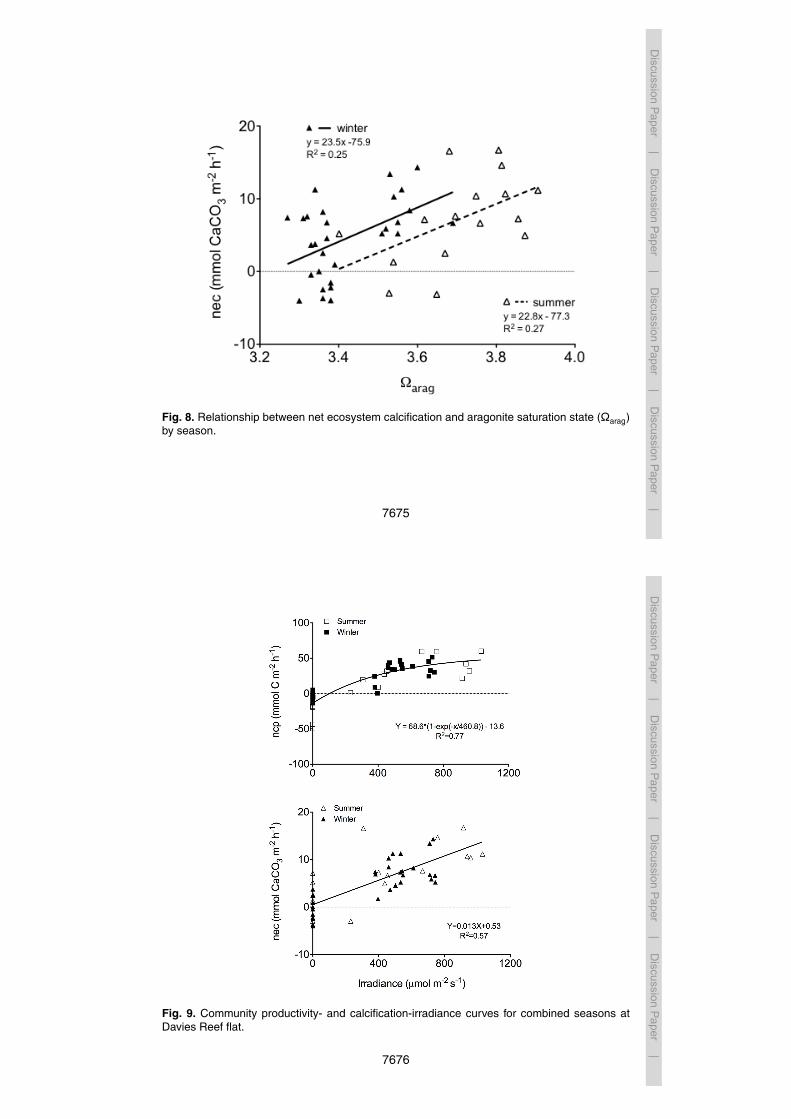
with those reported for other studies of extensive shallow-water reef flat systems (Shawet al., 2012, Table 3). Diel cycles of pCO2 and Ωarag are largely driven by rates ofprimary production (Anthony et al., 2011; Kleypas et al., 2011; Shamberger et al., 2011;Shaw et al., 2011) such that photosynthetic uptake of CO2 during the day results inan elevated saturation state when calcification is at its highest (Fig. 5). This coupling15
of primary production and calcification is shown in Fig. 7. While the light-dark cyclefundamentally controls the phase of the diel carbonate cycle via primary production, theamplitude of the cycle is influenced by a variety of factors including benthic communitycomposition, tidal regimes, water depth, and residence time. The effect of tides on theamplitude of diel cycling is highly visible in Fig. 4b. The larger of the two mixed diurnal20
tides resulted in greater changes in Ωarag, while the smaller diurnal tide resulted in adampened signal.
Seasonal variability in pHT, pCO2, and Ωarag is the result of both physical pro-cesses (e.g. temperature forcing) and biological processes driving variation in nec and
7653
Discussion
Paper
|D
iscussionP
aper|
Discussion
Paper
|D
iscussionP
aper|
ncp. Temperature effects were examined using sensitivity analyses whereby in situpHT, pCO2, temperature, and salinity were used as input parameters to the programCO2SYS (Lewis and Wallace, 1998), and pHT and pCO2 were recorded as outputsat the mean seasonal temperature (see Gray et al., 2012). Temperature-adjusted dataindicate that 0.03 units of the 0.06 pHT unit seasonal change (47 %) (Table 1) and 19 µ5
atm of the 56 µatm seasonal pCO2 change (35 %) were due to cooling from 28.5 C insummer to 22.3 C in winter.
4.2 Diel and seasonal variation in biological activity
In general, nec and ncp increased throughout the day and decreased into the evening(Fig. 5). The reef flat generally showed positive nec during the day and negative nec10
at night. Daytime nec and ncp were slightly higher in summer than in winter, a findingthat is consistent with numerous prior studies (e.g. Shamberger et al., 2011, Table 2).Net calcification continued at low rates at night in summer, but net dissolution occurredat low rates at night in winter.
Net ecosystem calcification was positively correlated to Ωarag with similar relation-15
ships observed for both summer and winter (Fig. 8). These findings are consistent withprevious studies that report no seasonal effect on the relationship between nec andΩarag (Langdon and Atkinson, 2005; Shaw et al., 2012). Ωarag explains 25–27 % of thevariance in nec (Fig. 8). While we did not observe values of Ωarag lower than 2.9, disso-lution occurred at night in waters that remained supersaturated with respect to calcium20
carbonate. Dissolution in supersaturated waters has been reported previously in otherreef systems (Yates and Halley, 2006) and is believed to be the result of undersatura-tion in pore waters, bioerosion of sediments by endolithic microbes and boring forams,and/or dissolution of more soluble forms of calcium carbonate (e.g. high-Mg calcite)(Yates and Halley, 2006; Santos et al., 2012).25
Average nighttime respiration in summer (-22±20 mmol C m−2 h−1) was approxi-mately 3-fold higher than in winter (−7±6 mmol C m−2 h−1). This difference was primar-ily driven by two night transects in summer that yielded anomalously high respiration
7654
Discussion
Paper
|D
iscussionP
aper|
Discussion
Paper
|D
iscussionP
aper|
rates (>40 mmol C m−2 h−1). One of these transects was conducted at approximately00:30 h, and the other was conducted at approximately 19:40 h (Fig. 5b). While theserates are high in comparison to the other nighttime data from this study, comparablerates of nighttime respiration have been reported for the Kaneohe Bay barrier reef(Shamberger et al., 2011), and we have little reason to believe that these transects are5
unrepresentative. By omitting the two anomalous transects, summer nighttime respira-tion ranged from −19 to 1 mmol C m−2 h−1, averaging −10 mmol C m−2 h−1, which arecomparable to winter values.
Assuming a 12 : 12 light dark cycle, the average net daily nec was 6.5 mmolCaCO3 m−2 h−1 in summer and 3.5 mmol CaCO3 m−2 h−1 in winter. When scaled up,10
these values yield a net daily calcification rate of 156 mmol (15.6 g) CaCO3 m−2 d−1 insummer and 84 mmol (8.4 g) CaCO3 m−2 d−1 in winter and an annual calcification rateof 4.27 kg CaCO3 m−2 yr−1 (assuming 0.5 yr or 178 days at each net rate). This an-nual calcification rate is consistent with the average calcification rate of 4±0.7 kg m−2
CaCO3 yr−1 reported to occur widely in Indo-Pacific coral reef flat environments (Kin-15
sey, 1985). The average summer daytime net calcification in this study, 11±4 mmolCaCO3 m−2 h−1, is also similar to values reported for GBR sites with comparable coralcover during similar times of year; Silverman et al. (2012) reported average sum-mer daytime net calcification for the One Tree Island reef flat (13.7 % coral cover) as11.4±7.4 mmol CaCO3 m−2 h−1.20
4.3 Historical comparisons
Assessing historical trends in reef community metabolism is often complicated by alack of baseline data, including data on changes in benthic community composition.Nonetheless, at least two recent studies conducted on the Great Barrier Reef addresslong-term trends in carbon cycling on coral reefs. Carbon turnover rates of the One25
Tree Island reef were originally studied in the 1970s and 1980s (Kinsey, 1978, 1979)and more recently by Silverman et al. (2012). Silverman et al. (2012) report drastic
7655
Discussion
Paper
|D
iscussionP
aper|
Discussion
Paper
|D
iscussionP
aper|
reductions in net calcification (∼44 %) that are primarily attributed to a threefold in-crease in nighttime dissolution rates. In contrast, Shamberger et al. (2011) report ratesof net ecosystem calcification for reefs in Kaneohe Bay that are comparable to valuesreported from the 1970s. These findings were surprising given that pCO2 was substan-tially lower and Ωarag was higher in the 1970s (Kinsey, 1985).5
The results of this study are partly consistent with the results of Barnes (1983,1988) whereby seasonality in community productivity and calcification were evalu-ated by floating an instrument package carrying pH and oxygen electrodes acrossthe Davies Reef flat. Barnes reported seasonal variations in productivity and calcifi-cation of the Davies Reef flat, with net productivity averaging 45 % higher, and net10
calcification averaging 30–40 % higher in summer than in winter (Barnes, 1988). Dailynet calcification rates of the reef flat were 16 g CaCO3 m−2 d−1 in summer (1981) and11.9 g CaCO3 m−2 d−1 in winter (1984), compared to 15.6 g (summer) and 8.4 g (winter)CaCO3 m−2 d−1 in the present study. Barnes also reported higher rates of respirationin summer, an observation that is consistent with the present study. Barnes attributed15
the seasonality in community productivity to seasonal shifts in community composition,whereby epilithic algal blooms occurred in summer and died in winter. Seasonal shiftsin algal biomass (or other benthic community groups) were not observed in the presentstudy. The seasonal differences in community metabolism measured here are likely dueto the warmer temperatures in summer driving higher rates of calcification and produc-20
tivity. Other contributing factors may have been light and/or nutrients; in the presentstudy, average noontime irradiance was slightly higher in summer (1099 µmol m−2 s−1)than winter (908 µmol m−2 s−1). Nutrient levels were not measured, however, and can-not be excluded as a source of seasonal differences. In Barnes’ study, both light andtemperature were elevated in summer and may have also been a contributing factor to25
the seasonal differences that were reported; however, the influence of these factors onseasonal differences was not addressed.
Differences in methodology and technology preclude a robust assessment ofchanges in reef metabolism over time. However, these studies indicate that while some
7656
Discussion
Paper
|D
iscussionP
aper|
Discussion
Paper
|D
iscussionP
aper|
reefs (One Tree Island) may have experienced drastic changes in net calcification overtime, others, including Kaneohe Bay and Davies Reef, may have been less heavilyaffected.
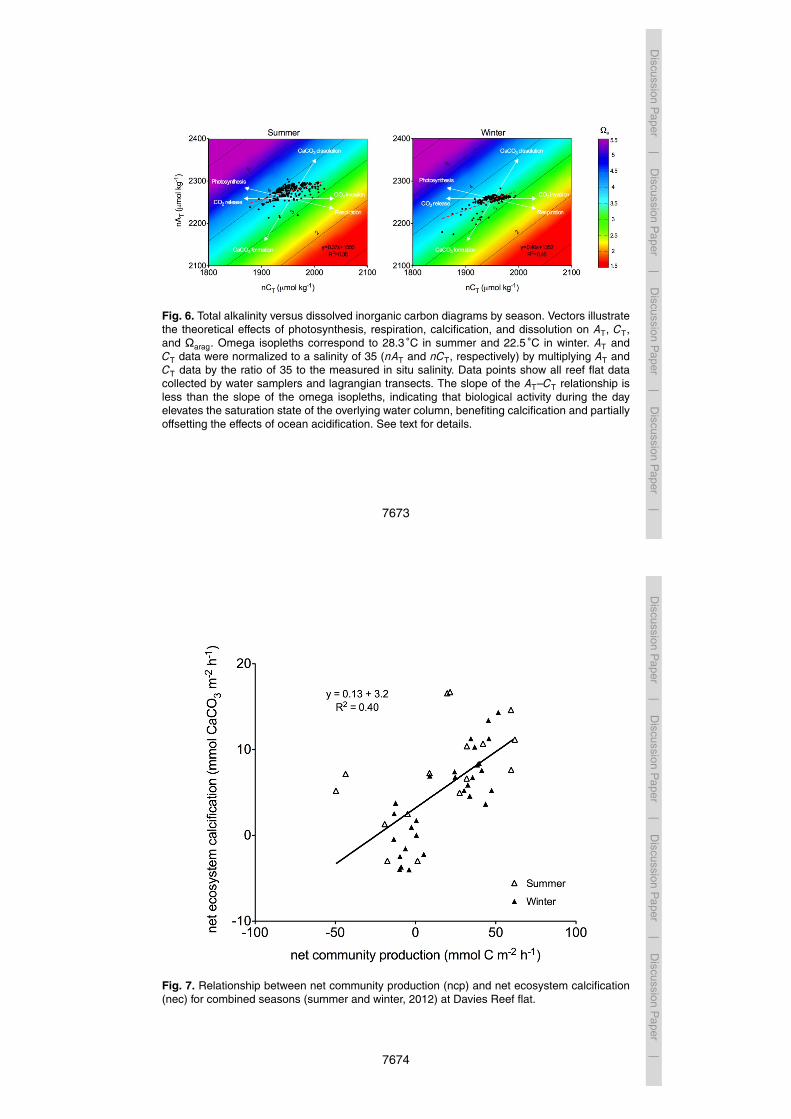
4.4 Implications of the AT-CT relationship
The effect of community metabolism on the saturation state of the overlying wa-5
ter column can be observed in Fig. 6. Vectors indicate the theoretical effects ofphotosynthesis-respiration and calcification-dissolution on AT and CT: for every molof organic carbon produced (via photosynthesis), one mol of CT is consumed, and ATremains unchanged; for every mol of CaCO3 produced (calcification), AT decreasesby 2 mol and CT decreases by 1 mol. Because photosynthesis-respiration (ncp) and10
calcification-dissolution (nec) affect AT and CT differently, the slope of the AT–CT re-lationship indicates the balance between these two processes (i.e. the nec:ncp ratio).The nec : ncp ratio is given by 1
[(2/m)−1], where m is the slope of the AT–CT line. The
slope of the omega isopleths in Figure 6 is approximately 0.93 in AT–CT space, whichcorresponds to a nec:ncp ratio of 0.87. Generally, if the slope of the AT–CT relationship15
approximates the slope of the omega isopleths, biological activity shifts points alonga given isopleth and does not alter the saturation state of the overlying water column.Alternatively, if the AT–CT relationship crosses the isopleths (i.e. the slope of the AT–CTrelationship is less than the slope of the isopleths), biological activity will increase thesaturation state during the day and decrease the saturation state during the night. The20
slopes of the AT–CT relationships for Davies Reef are 0.37 and 0.46 for summer andwinter, respectively, which correspond to nec:ncp ratios of 0.23 for summer and 0.30for winter, indicating that daytime biological activity increases the saturation state ofthe water with time. The slope of the AT–CT relationship may prove a valuable indictorof reef function because it reflects the balance between calcification and production;25
phase shifts (e.g. from coral-dominated to algal-dominated systems) and/or significant
7657
Discussion
Paper
|D
iscussionP
aper|
Discussion
Paper
|D
iscussionP
aper|
stress events (e.g. bleaching) would be expected to be reflected in this slope, possiblyrendering it a useful parameter for broad-scale reef monitoring programs.
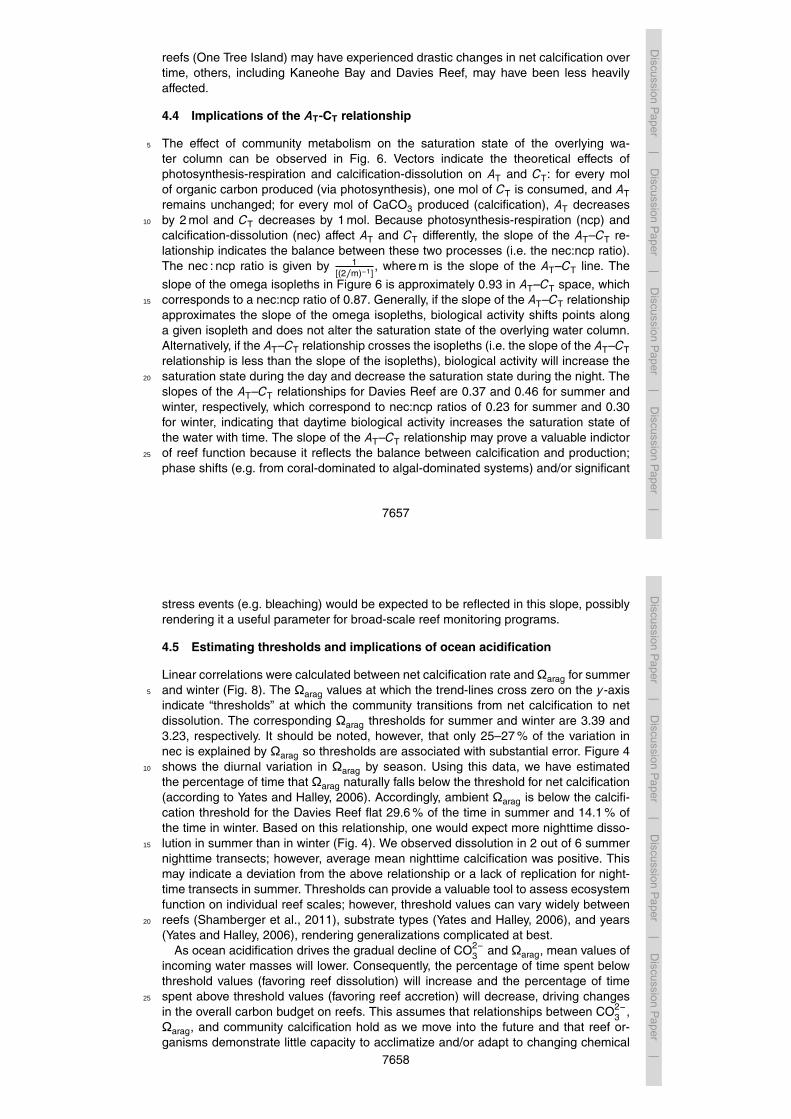
4.5 Estimating thresholds and implications of ocean acidification
Linear correlations were calculated between net calcification rate and Ωarag for summerand winter (Fig. 8). The Ωarag values at which the trend-lines cross zero on the y-axis5
indicate “thresholds” at which the community transitions from net calcification to netdissolution. The corresponding Ωarag thresholds for summer and winter are 3.39 and3.23, respectively. It should be noted, however, that only 25–27 % of the variation innec is explained by Ωarag so thresholds are associated with substantial error. Figure 4shows the diurnal variation in Ωarag by season. Using this data, we have estimated10
the percentage of time that Ωarag naturally falls below the threshold for net calcification(according to Yates and Halley, 2006). Accordingly, ambient Ωarag is below the calcifi-cation threshold for the Davies Reef flat 29.6 % of the time in summer and 14.1 % ofthe time in winter. Based on this relationship, one would expect more nighttime disso-lution in summer than in winter (Fig. 4). We observed dissolution in 2 out of 6 summer15
nighttime transects; however, average mean nighttime calcification was positive. Thismay indicate a deviation from the above relationship or a lack of replication for night-time transects in summer. Thresholds can provide a valuable tool to assess ecosystemfunction on individual reef scales; however, threshold values can vary widely betweenreefs (Shamberger et al., 2011), substrate types (Yates and Halley, 2006), and years20
(Yates and Halley, 2006), rendering generalizations complicated at best.As ocean acidification drives the gradual decline of CO2−
3 and Ωarag, mean values ofincoming water masses will lower. Consequently, the percentage of time spent belowthreshold values (favoring reef dissolution) will increase and the percentage of timespent above threshold values (favoring reef accretion) will decrease, driving changes25
in the overall carbon budget on reefs. This assumes that relationships between CO2−3 ,
Ωarag, and community calcification hold as we move into the future and that reef or-ganisms demonstrate little capacity to acclimatize and/or adapt to changing chemical
7658
Discussion
Paper
|D
iscussionP
aper|
Discussion
Paper
|D
iscussionP
aper|
conditions (thereby altering the relationship between CO2−3 , Ωarag, and calcification).
Presently, our understanding of the ability of reef organisms to acclimatize and/or adaptto ocean acidification is poorly developed. Additional field studies are needed that re-late trends in reef carbonate chemistry to rates of calcification in natural settings; suchstudies will help establish ocean carbon chemistry baselines that will inform future5
change and will assist the development of predictive capabilities to assess the futureof coral reefs in a changing environment.
Supplementary material related to this article is available online at:http://www.biogeosciences-discuss.net/10/7641/2013/bgd-10-7641-2013-supplement.zip.10
Acknowledgements. The authors are grateful to D. Kinsey for discussion that greatly improvedthe design of this study. We are indebted to E. Clarkin, B. Mason, C. Huete-Stauffer, N. Cantin,P. Kaniewska, E. Matson, and the staff of the RV Cape Ferguson for field support, and toS. Boyle for laboratory assistance. Temperature, salinity, light, and wind data were sourcedfrom the Integrated Marine Observing System (IMOS). IMOS is supported by the Australian15
Government through the National Collaborative Research Infrastructure Strategy and the Su-per Science Initiative. This project was funded by an Australian Research Council ARC SuperScience Fellowship awarded to RA.
References
Anthony, K. R. N., Kline, D. I., Diaz-Pulido, G., Dove, S., and Hoegh-Guldberg, O.: Ocean20
acidification causes bleaching and productivity loss in coral reef builders, Proc. Natl. Acad.Sci. USA, 105, 17442–17446, 2008.
Anthony, K., Kleypas, J. A., and Gattuso, J.-P.: Coral reefs modify their seawater carbon chem-istry – implications for impacts of ocean acidification, Glob. Change Biol., 17, 3655–3666,2011.25
7659
Discussion
Paper
|D
iscussionP
aper|
Discussion
Paper
|D
iscussionP
aper|
Bates, N. R., Amat, A., and Andersson, A. J.: Feedbacks and responses of coral calcificationon the Bermuda reef system to seasonal changes in biological processes and ocean acidifi-cation, Biogeosciences, 7, 2509–2530, doi:10.5194/bg-7-2509-2010, 2010.
Barnes, D. J.: Profiling coral reef productivity and calcification using pH and oxygen electrodes,J. Exp. Mar. Biol. Ecol., 66, 149–161, 1983.5
Barnes, D. J.: Seasonality in community productivity and calcification at Davies reef, CentralGreat Barrier Reef, Proceedings of the 6th International Coral Reef Symposium., Australia,2, 521–527, 1988.
Broecker, W. S., Takahashi, T., Simpson, H. J., and Peng, T. H.: Fate of fossil fuel carbon dioxideand the global carbon budget, Science, 206, 409–418, 1979.10
Caldeira, K. and Wickett, M. F.: Anthropogenic carbon and ocean pH, Nature, 425, p. 365,2003.
Canadell, J. G., La Quere, C., Raupach, M. R., Field, C. B., Buitenhuis, E. T., Ciais, P., Conway,T. J., Gillett, N. P., Houghton, R. A., and Marland, G.: Contributions to accelerating atmo-spheric CO2 growth from economic activity, carbon intensity, and efficiency of natural sinks,15
Proc. Natl. Acad. Sci. USA, 104, 18866–18870, 2007.Dickson, A. G.: Thermodynamics of the dissociation of boric acid in synthetic seawater from
273.15 to 318.15 K, Deep-Sea Res., 37, 755–766, 1990.Dickson, A. G. and Millero, F. J.: A comparison of the equilibrium constants for the dissociation
of carbonic acid in seawater media, Deep-Sea Res., 34, 1733–1743, 1987.20
Dickson, A. G., Sabine, C. L., and Christian, J. R. (Eds.): Guide to best practices for ocean CO2measurements, PICES Special Publication 3, North Pacific Marine Science Organization,2007.
Doney, S., Fabry, V., Feely, R., and Kleypas, J.: Ocean acidification: the other CO2 problem,Ann. Rev. Mar. Sci., 1, 169–192, 2009.25
Feely, R. A., Doney, S. C., and Cooley, S. R.: Ocean acidification: present conditions and futurechanges in a high-CO2 world, Oceanography, 22, 36–47, 2009.
IMOS 2012: Davies Reef Salinity, www.data.aims.gov.au (last accessed date: 16 January),2013.
Falter, J. L., Lowe, R. J., Atkinson, M. J., Monismith, S. G., and Schar, D. W.: Continuous30
measurements of net production over a shallow reef community using a modified Eulerianapproach, J. Geophys. Res., 113, C07035, doi:10.1029/2007JC004663, 2008.
7660
Discussion
Paper
|D
iscussionP
aper|
Discussion
Paper
|D
iscussionP
aper|
Falter, J. L., Lowe, R. J., Zhang, Z., and McCulloch, M.: Physical and biological controls on thecarbonate chemistry of coral reef waters: effects of metabolism, wave forcing, sea level, andgeomorphology, PLoS One, 8, e53303, doi:10.1371/journal.pone.0053303, 2013.
Frith, C. A.: Windward reef circulation, Davies Reef, central Great Barrier Reef, in: Proceed-ings of the Inaugural Great Barrier Reef Conference, edited by: Baker, J. T., Carter, R. M.,5
Sammarco, P. W., and Stark, K. P., James Cook University, Townsville, 435–440, 1983.Gattuso, J.-P., Pichon, M., Delesalle, B., Canon, C., and Frankignoulle, M.: Carbon fluxes in
coral reefs. I. Lagrangian measurement of community metabolism and resulting air-sea CO2disequilibrium, Mar. Ecol. Prog. Ser., 145, 109–121, 1996.
Gattuso, J.-P., Allemand, D., and Frankignoulle, M.: Photosynthesis and calcification at cellu-10
lar, organismal and community levels in coral reefs: a review on interactions and control bycarbonate chemistry, Am. Zool., 39, 160–183, 1999.
Gray, S. E. C., DeGrandpre, M. D., Langdon, C., and Corredor, J. E.: Short-term and seasonalpH, pCO2 and saturation state variability in a coral-reef ecosystem, Global Biogeochem.Cycles, 26, GB3012, doi:10.1029/2011GB004114, 2012.15
Halley, R. B. and Yates, K. K.: Will reef sediments buffer corals from increased global CO2?,in: Proceedings of the 9th International Coral Reef Symposium, Abstracts: Indonesia, StateMinistry for the Environment, 2000.
Ho, D. T., Law, C. S., Smith, M. J., Schlosser, P., Harvey, M., and Hill, P.: Measurements ofair-sea gas exchange at high wind speeds in the Southern Ocean: Implications for global20
parameterizations, Geophys. Res. Lett., 33, L16611, doi:10.1029/2006GL026817, 2006.IPCC: Climate Change 2007: The Physical Science Basis, Contribution of Working Group I to
the Fourth Assessment Report of the Intergovernmental Panel on Climate Change, editedby: Solomon, S., D. Qin, M. Manning, Z. Chen, M. Marquis, K. B. Averyt, M. Tignor, and H.L. Miller, Cambridge University Press, Cambridge, United Kingdom and New York, NY, USA,25
996 pp., 2007.Kinsey, D. W.: Productivity and calcification estimates using slack-water period and field en-
closures, in: Coral Reef Research Methods, Monogr. On Oceanogr. Methodol., 5, edited by:Stoddart, D. R. and Johannes, R. G., UNESCO, Paris, 439–468, 1978.
Kinsey, D. W.: Carbon turnover and accumulation by coral reefs, PhD thesis, University of30
Hawaii, Honolulu, 248 pp., 1979.Kinsey, D. W.: Metabolism, calcification, and carbon production: system level studies, in: Pro-
ceedings of the 5th International Coral Reef Congress, Tahiti, 4, 505–526, 1985.
7661
Discussion
Paper
|D
iscussionP
aper|
Discussion
Paper
|D
iscussionP
aper|
Kleypas, J. A., Buddemeier, R. W., Archer, D., Gattuso, J.-P., Langdon, C., and Opdyke, B. N.:Increased atmospheric carbon dioxide on coral reefs, Science, 284, 118–120, 1999.
Kleypas, J. A., Anthony, K. R. A., and Gattuso, J.–P.: Coral reefs modify their seawater carbonchemistry – case study from a barrier reef (Moorea, French Polynesia), Glob. Change Biol.,17, 3667–3678, 2011.5
Langdon, C. and Atkinson, M. J.: Effect of elevated pCO2 on photosynthesis and calcificationof corals and interactions with seasonal change in temperature/irradiance and nutrient en-richment, J. Geophys. Res., 110, C09S07, doi:10.1029/2004JC002576, 2005.
Langdon, C., Takahashi, T., Sweeney, C., Chipman, D., Goddard, J., Marubini, F., Aceves, H.,Barnett, H., and Atkinson, M. J.: Effect of calcium carbonate saturation state on the calcifica-10
tion rate of an experimental coral reef, Global Biogeochem. Cy., 14, 639–654, 2000.Langdon, C., Gattuso, J.-P., and Andresson, A.: Measurements of calcification and dissolution
of benthic organisms and communities, in: Guide to Best Practices for Ocean AcidificationResearch and Data Reporting, edited by: Riebesell, U., Fabry, V. J., Hansson, L., and Gat-tuso, J. P., Eur. Union, Luxembourg, 213–232, 2010.15
Lewis, E. and Wallace, D. W. R.: Program developed for CO2 system calculations, in:ORNL/CDIAC-105, (1st Edn.), Carbon Dioxide Information Analysis Center, Oak Ridge Na-tional Laboratory, US Department of Energy, Oak Ridge, TN, 1998.
Mehrbach, C., Culberson, C. H., Hawley, J. E., and Pytkowicz, R. M.: Measurement of the ap-parent dissociation constants of carbonic acid in seawater at atmospheric pressure, Limnol.20
Oceanogr., 18, 897–907, 1973.Ohde, S. and van Woesik, R.: Carbon dioxide flux and metabolic processes of a coral reef,
Okinawa, Bull. Mar. Sci., 65, 559–576, 1999.Orr, J. C., Fabry, V. J., Aumont, O., Bopp, L., Doney, S. C., Feely, R. A., Gnanadesikan, A.,
Gruber, N., Ishida, A., Joos, F., Key, R. M., Lindsay, K., Maier-Reimer, E., Matear, R., Monfray,25
P., Mouchet, A., Najjar, R. G., Plattner, G. K., Rodgers, K. B., Sabine, C. L., Sarmiento, J.L., Schlitzer, R., Slater, R. D., Totterdell, I. J., Weirig, M. F., Yamanaka, Y., and Yool, A.:Anthropogenic ocean acidification over the twenty-first century and its impacts on calcifyingorganisms, Nature, 437, 681–686, 2005.
Sabine, C. L., Feely, R. A., Gruber, N., Key, R. M., Lee, K., Bullister, J. L., Wanninkhof, R.,30
Wong, C. S., Wallace, D. W. R., Tilbrook, B., Millero, F. J., Peng, T. H., Kozyr, A., Ono, T., andRios, A. F.: The oceanic sink for anthropogenic CO2, Science, 305, 367–371, 2004.
7662
Discussion
Paper
|D
iscussionP
aper|
Discussion
Paper
|D
iscussionP
aper|
Sabine, C. L., Feely, R. A., Wanninkhof, R. Takahashi, T., Khatiwala, S., and Park, G.: Globaloceans [The Global Ocean Carbon Cycle] in State of the Climate in 2010, Bull. Am. Meteorol.Soc., 92, S100–S105, 2011.
Santos, I. R., Cook, P. L. M., Rogers, L., de Weys, J., and Eyre, B. D.: The “salt wedge pump”:convection-driven pore-water exchange as a source of dissolved organic and inorganic car-5
bon and nitrogen to an estuary, Limnol. Oceanogr., 57, 1415–1426, 2012.Shamberger, K. E. F., Feely, R. A., Sabine, C. L., Atkinson, M. J., DeCarlo, E. H., Mackenzie,
F. T., Drupp, P. S., and Butterfield, D. A.: Calcification and organic production on a Hawaiiancoral reef, Mar. Chem., 127, 64–75, doi:10.1016/j.marchem.2011.08.003, 2011.
Shaw, E. C., McNeil, B. I., and Tilbrook, B.: Impacts of ocean acidification in naturally vari-10
able coral reef flat ecosystems, J. Geophys. Res., 117, C03038, doi:10.1029/2011JC007655,2012.
Silverman, J., Lazar, B., Cao, L., Caldeira, K., and Erez, J.: Coral reefs maystart dissolving when atmospheric CO2 doubles, Geophys. Res. Lett. 36, L05606,doi:10.1029/2008GL036282, 2009.15
Silverman, J., Kline, D. I., Johnson, L., Rivlin, T., Schneider, K., Erez, J., Lazar, B., and Caldeira,K.: Carbon turnover rates in the One Tree Island reef: A 40-year perspective, J. Geophys.Res., 117, G03023, doi:10.1029/2012JG001974, 2012.
Tribollet, A., Godinot, C., Atkinson, M., and Langdon, C.: Effects of elevated pCO2 on disso-lution of coral carbonates by microbial euendoliths, Glob. Biogeochem. Cy., 23, GB3008,20
doi:10.1029/2008GB003286, 2009.Yates, K. K. and Halley, R. B.: CO2−
3 concentration and pCO2 thresholds for calcification anddissolution on the Molokai reef flat, Hawaii, Biogeosciences, 3, 357–369, doi:10.5194/bg-3-357-2006, 2006.
Zeebe, R. E.: History of seawater carbonate chemistry, atmospheric CO2, and ocean acidifica-25
tion, Ann. Rev. Earth Planetary Sci., 40, 141–165, 2012.
7663
Discussion
Paper
|D
iscussionP
aper|
Discussion
Paper
|D
iscussionP
aper|
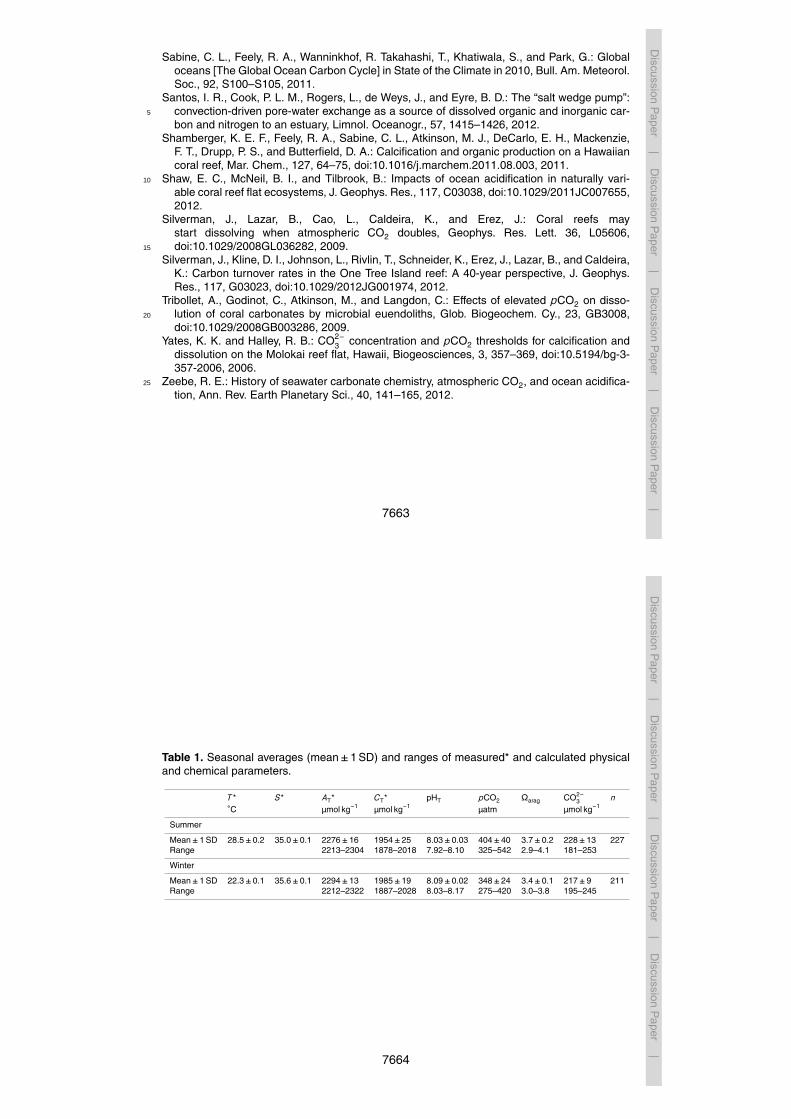
Table 1. Seasonal averages (mean±1 SD) and ranges of measured* and calculated physicaland chemical parameters.
T * S* AT* CT* pHT pCO2 Ωarag CO2−3 n
C µmol kg−1 µmol kg−1 µatm µmol kg−1
Summer
Mean±1 SD 28.5±0.2 35.0±0.1 2276±16 1954±25 8.03±0.03 404±40 3.7±0.2 228±13 227Range 2213–2304 1878–2018 7.92–8.10 325–542 2.9–4.1 181–253
Winter
Mean±1 SD 22.3±0.1 35.6±0.1 2294±13 1985±19 8.09±0.02 348±24 3.4±0.1 217±9 211Range 2212–2322 1887–2028 8.03–8.17 275–420 3.0–3.8 195–245
7664
Discussion
Paper
|D
iscussionP
aper|
Discussion
Paper
|D
iscussionP
aper|
Table 2. Length, depth, velocity, and sample size (n) of Langrangian transects by season.
Length Depth Velocity n, daytime n, nighttimem m cm s−1 (sample times) (sample times)
Summer
Mean±1 SD 210±59 1.7±0.5 11.6±5.7 10 (09:30–16:00) 6 (19:00–03:30)Range 85–316 1.1–2.8 4.2–22.5 – –
Winter
Mean±1 SD 193±55 1.9±0.4 10.1±3.8 20 (09:00–15:30) 11 (19:00–23:00)Range 77–397 1.2–2.6 3.1–17.5 – –
7665
Discussion
Paper
|D
iscussionP
aper|
Discussion
Paper
|D
iscussionP
aper|
Table 3. Percent cover (Mean±1 SD) of major benthic groups on the Davies Reef flat byseason. Benthos was assigned to one of five categories: (1) live coral; (2) algae, includingmacroalgae, turf, and cyanobacteria; (3) coralline algae; (4) CaCO3 substrate, including sand,CaCO3 rock (e.g. old, dead coral), and/or rubble (i.e., substrate with the potential to undergodissolution); and (5) “other”, including sponges, gorgonians, zoanthids, etc. When morphologicforms of CaCO3 (e.g. rubble, CaCO3 rock) were covered with biologically active groups (e.g.turf, coralline algae, cyanobacteria), the biologically active group was scored.
Live Algae Coralline CaCO3 “Other”Coral algae substrate
Summer 10±2 58±3 8±4 22±5 <2Winter 8±2 56±3 9±3 24±3 <3
7666
Discussion
Paper
|D
iscussionP
aper|
Discussion
Paper
|D
iscussionP
aper|
Fig. 1. (a) Map of Queensland, Australia, showing the location of Davies Reef within the CentralGreat Barrier Reef (www.imos.org). (b) Quickbird image of Davies Reef (1850′ S, 147 38′ E)with the reef flat study area denoted by a red square. The asterisk denotes the location of theautomated water sampler. Lagrangian transects were conducted within the 300 m2 samplingbox.
7667
Discussion
Paper
|D
iscussionP
aper|
Discussion
Paper
|D
iscussionP
aper|
Fig. 2. Automated water sampler that was deployed at the lagoonal edge of the reef flat for 10days in austral summer (17–27 January 2012) and 9 days in winter (29 July–6 August 2012).The sampler collected discrete water samples at 2 h intervals during the course of each deploy-ment for the analysis of total alkalinity (AT) and dissolved inorganic carbon (CT). Photo credit:E. Matson.
7668
Discussion
Paper
|D
iscussionP
aper|
Discussion
Paper
|D
iscussionP
aper|
31
669
Figure 3. Composite diel curves of carbonate chemistry parameters by season for the 670 Davies Reef flat. Data points show reef flat data from 10- and 9- consecutive days in 671 January and August, respectively. Solid black lines represent best-fit curves, and shaded 672 areas represent 95% confidence intervals for future data points. Dashed horizontal lines 673 represent average daily conditions. 674
Fig. 3. Caption on next page.
7669
Discussion
Paper
|D
iscussionP
aper|
Discussion
Paper
|D
iscussionP
aper|
Fig. 3. Composite diel curves of carbonate chemistry parameters by season for the DaviesReef flat. Data points show reef flat data from 10- and 9-consecutive days in January andAugust, respectively. Solid black lines represent best-fit curves, and shaded areas represent95 % confidence intervals for future data points. Dashed horizontal lines represent averagedaily conditions.
7670
Discussion
Paper
|D
iscussionP
aper|
Discussion
Paper
|D
iscussionP
aper|
32
675
Figure 4. Daily times series of aragonite saturation state (Ωarag) of the Davies Reef flat in 676 summer (January) and winter (August), 2012. Data were collected using an automated 677 water sampler that was deployed at the lagoonal edge of the reef flat. Light and dark 678 cycles are denoted by shading, and moon phases are indicated by open (full moon) and 679 closed (new moon) circles. Tide height is indicated by the grey line. The red dashed line 680 corresponds to the calculated Ωarag thresholds when the community transitions from net 681 calcification to net dissolution (see text for details). Gaps in the data correspond to when 682 the instrument was removed from the reef for maintenance. 683
Fig. 4. Daily times series of aragonite saturation state (Ωarag) of the Davies Reef flat in summer(January) and winter (August), 2012. Data were collected using an automated water samplerthat was deployed at the lagoonal edge of the reef flat. Light and dark cycles are denoted byshading, and moon phases are indicated by open (full moon) and closed (new moon) circles.Tide height is indicated by the grey line. The red dashed line corresponds to the calculatedΩarag thresholds when the community transitions from net calcification to net dissolution (seetext for details). Gaps in the data correspond to when the instrument was removed from thereef for maintenance.
7671
Discussion
Paper
|D
iscussionP
aper|
Discussion
Paper
|D
iscussionP
aper|33
684
Figure 5. Net ecosystem calcification (nec) and net community production (ncp) of the 685 Davies Reef flat by season. Dashed line represents the combined (summer and winter) 686 diurnal trend in aragonite saturation state (Ωarag) as modeled from data in Figure 3. 687
688
689
Fig. 5. Net ecosystem calcification (nec) and net community production (ncp) of the DaviesReef flat by season. Dashed line represents the combined (summer and winter) diurnal trendin aragonite saturation state (Ωarag) as modeled from data in Fig. 3.
7672
Discussion
Paper
|D
iscussionP
aper|
Discussion
Paper
|D
iscussionP
aper|
34
690
Figure 6. Total alkalinity versus dissolved inorganic carbon diagrams by season. Vectors 691 illustrate the theoretical effects of photosynthesis, respiration, calcification, and 692 dissolution on AT, CT, and Ωarag. Omega isopleths correspond to 28.3°C in summer and 693 22.5°C in winter. AT and CT data were normalized to a salinity of 35 (nAT and nCT, 694 respectively) by multiplying AT and CT data by the ratio of 35 to the measured in situ 695 salinity. Data points show all reef flat data collected by water samplers and lagrangian 696 transects. The slope of the AT-CT relationship is less than the slope of the omega 697 isopleths, indicating that biological activity during the day elevates the saturation state of 698 the overlying water column, benefiting calcification and partially offsetting the effects of 699 ocean acidification. See text for details. 700
701
702
703
704
705
706
707
708
709
710
711
Fig. 6. Total alkalinity versus dissolved inorganic carbon diagrams by season. Vectors illustratethe theoretical effects of photosynthesis, respiration, calcification, and dissolution on AT, CT,and Ωarag. Omega isopleths correspond to 28.3 C in summer and 22.5 C in winter. AT andCT data were normalized to a salinity of 35 (nAT and nCT, respectively) by multiplying AT andCT data by the ratio of 35 to the measured in situ salinity. Data points show all reef flat datacollected by water samplers and lagrangian transects. The slope of the AT–CT relationship isless than the slope of the omega isopleths, indicating that biological activity during the dayelevates the saturation state of the overlying water column, benefiting calcification and partiallyoffsetting the effects of ocean acidification. See text for details.
7673
Discussion
Paper
|D
iscussionP
aper|
Discussion
Paper
|D
iscussionP
aper|
35
712
Figure 7. Relationship between net community production (ncp) and net ecosystem 713 calcification (nec) for combined seasons (summer and winter, 2012) at Davies Reef flat. 714
Fig. 7. Relationship between net community production (ncp) and net ecosystem calcification(nec) for combined seasons (summer and winter, 2012) at Davies Reef flat.
7674
Discussion
Paper
|D
iscussionP
aper|
Discussion
Paper
|D
iscussionP
aper|
36
715
Figure 8. Relationship between net ecosystem calcification and aragonite saturation state 716 (Ωarag) by season. 717
718
719
720
Fig. 8. Relationship between net ecosystem calcification and aragonite saturation state (Ωarag)by season.
7675
Discussion
Paper
|D
iscussionP
aper|
Discussion
Paper
|D
iscussionP
aper|
37
721
Figure 9. Community productivity- and calcification-irradiance curves for combined 722 seasons at Davies Reef flat. 723
724
Fig. 9. Community productivity- and calcification-irradiance curves for combined seasons atDavies Reef flat.
7676
Related Documents