No. 0513 Social Protection Discussion Paper Series Dynamics of Child Labor: Labor Force Entry and Exit in Urban Brazil Suzanne Duryea Jasper Hoek David Lam Deborah Levison May 2005 Social Protection Unit Human Development Network The World Bank Social Protection Discussion Papers are not formal publications of the World Bank. They present preliminary and unpolished results of analysis that are circulated to encourage discussion and comment; citation and the use of such a paper should take account of its provisional character. The findings, interpretations, and conclusions expressed in this paper are entirely those of the author(s) and should not be attributed in any manner to the World Bank, to its affiliated organizations or to members of its Board of Executive Directors or the countries they represent. For free copies of this paper, please contact the Social Protection Advisory Service, The World Bank, 1818 H Street, N.W., Washington, D.C. 20433 USA. Telephone: (202) 458-5267, Fax: (202) 614-0471, E-mail: [email protected] . Or visit the Social Protection website at http://www.worldbank.org/sp .

Welcome message from author
This document is posted to help you gain knowledge. Please leave a comment to let me know what you think about it! Share it to your friends and learn new things together.
Transcript
No. 0513
Social Protection Discussion Paper Series
Dynamics of Child Labor: Labor Force Entry and Exit in Urban Brazil
Suzanne Duryea
Jasper Hoek David Lam
Deborah Levison
May 2005
Social Protection Unit
Human Development Network
The World Bank
Social Protection Discussion Papers are not formal publications of the World Bank. They present preliminary and unpolished results of analysis that are circulated to encourage discussion and comment; citation and the use of such a paper should take account of its provisional character. The findings, interpretations, and conclusions expressed in this paper are entirely those of the author(s) and should not be attributed in any manner to the World Bank, to its affiliated organizations or to members of its Board of Executive Directors or the countries they represent.
For free copies of this paper, please contact the Social Protection Advisory Service, The World Bank, 1818 H Street, N.W., Washington, D.C. 20433 USA. Telephone: (202) 458-5267, Fax: (202) 614-0471, E-mail: [email protected]. Or visit the Social Protection website at http://www.worldbank.org/sp.
Dynamics of Child Labor: Labor Force Entry and Exit in Urban Brazil∗
Suzanne Duryea
Jasper Hoek
David Lam
Deborah Levison
May 2005
∗Excerpts obtained from the IADB/WB joint book on child labor in LAC

Dynamics of Child Labor: Labor Force Entry and Exit in Urban Brazil• Suzanne Duryea
Jasper Hoek David Lam
Deborah Levison
Relatively little is known about the dynamics of child labor, although it has been the
subject of research and policy discussion since the days of Europe's Industrial Revolution. Small
case studies from Latin America and elsewhere suggest that children tend to move in and out of
different jobs, and in and out of the labor force, to a much greater extent than do adults. Still,
policy discussions of child labor often seem to have an underlying unstated assumption that most
children work long hours in jobs that, like those of adults, continue steadily from day to day and
from week to week. Even if the jobs change, children are imagined to find other jobs
immediately, because of the pressing needs generated by poverty.
This chapter reports the results of an analysis of nearly 20 years of panel data for
metropolitan Brazil. It shows that, in fact, employed children frequently stop work then start
again, a phenomenon labeled "intermittent employment." Children's tendency to work
intermittently is reflected by differential employment levels, depending on the time interval used
and by monthly employment entry and exit rates. The time series of estimated labor market entry
and exit rates are used to explain how a secular decline in child labor has occurred over the
period and the extent to which the decline is due to fewer children working or to shorter
employment spells.
• This research was supported by funding from the National Institute of Child Health and Human Development, Grant R01HDHD031214.

2
The intermittent nature of urban children's work patterns has implications for the optimal
design of Brazilian programs intended to encourage families to keep children in school and out
of the labor force. The most important of such programs are Bolsa Escola, or School Scholarship
Program, and Programa de Erradicação do Trabalho Infantil (PETI), or Program to Eradicate
Child Labor. Since 1996, the Bolsa Escola program has provided scholarships to poor children
in urban areas under the verifiable condition that the children attend school regularly. PETI, with
the explicit goal of reducing hazardous child labor, also provides scholarships conditional on
school attendance; it was originally implemented in rural states of Brazil with high rates of
hazardous child labor. Unfortunately, because the panel data only cover metropolitan areas, they
cannot reflect whether the PETI program has been successful since its inception in 1996.
However, the analysis of the levels and transitions in the panel data can be useful as a baseline
because the Brazilian government currently is expanding the program to urban areas.
An understanding of children's employment transitions—their labor force entries and
exits—is critical to the appropriate formulation of policies aimed at reducing and regulating
children's work.
Data
This analysis uses the Pesquisa Mensal de Emprego (PME), Brazil's monthly
employment survey. It has been administered by the Brazilian statistical agency, the Instituto
Brasileiro de Geografia e Estatística (IBGE), in its current format since February 1982 in Brazil's
six largest cities.1 It is an exceptional resource for studying urban labor markets in developing
countries, distinguished by its panel structure, very large sample sizes, and nearly two decades of
continuous fielding with minimal changes to the questionnaire. About 35,000 households are
1 A seventh city, Curitíba, was added in 1998; it is not included in the analysis.
3
interviewed each month, enabling an examination of labor market trends for fairly narrowly
defined demographic groups.
While the PME's detail on employment trends over two decades is extremely valuable, an
even more intriguing feature of the data is the ability to follow labor force transitions of all
individuals aged 10 and older. Despite the large samples of the PME, slicing up the data by city,
month, age, sex, and socioeconomic status can very quickly leave only a small number of
observations: there are simply not many 14-year-old girls in Salvador making the transition
between employment and non-employment in any given month. Where small samples become a
problem, an aggregation across one or more of these dimensions, usually across time or cities
(weighting by each city's population), is used.
A word about sample selection. The figures below include all children observed in any
two consecutive calendar months, which is necessary for providing a complete picture of
employment transitions over time. In the tables, however, some statistics are directed at
understanding child employment patterns over a four-month period. For this study, only children
with complete data for the first four months were included in the sample.2 For the analysis of
children by socioeconomic status, the sample is further limited to those children who are sons,
daughters, or other relatives of the head of the household. This is because the proxy for
socioeconomic status, mother's education, is not available for children unrelated to the household
head; it is impossible to link them to their families of origin. Finally, it should be noted that
sample attrition is not a major concern. About 80% of children scheduled to be re-interviewed in
2 Sample moments of statistics that did not require the full-four months of data were very similar across the data sets that included or excluded the observations with only partial observations, so the selection on four months of data appears to be random. Details on the data sets and their properties can be found in Levison et al. (2002).
4
one month's time were actually observed the following month, and there are few observable
differences between those who return and those who do not.
Trends in Child Employment Levels
This analysis refers to children's employment status, not to their labor force status. All
individuals are classified as either working or not working in the labor force during the reference
week of the survey. There is no differentiation between being unemployed (looking for work but
not working) and being out of the labor force. The study also ignores the large amount of non-
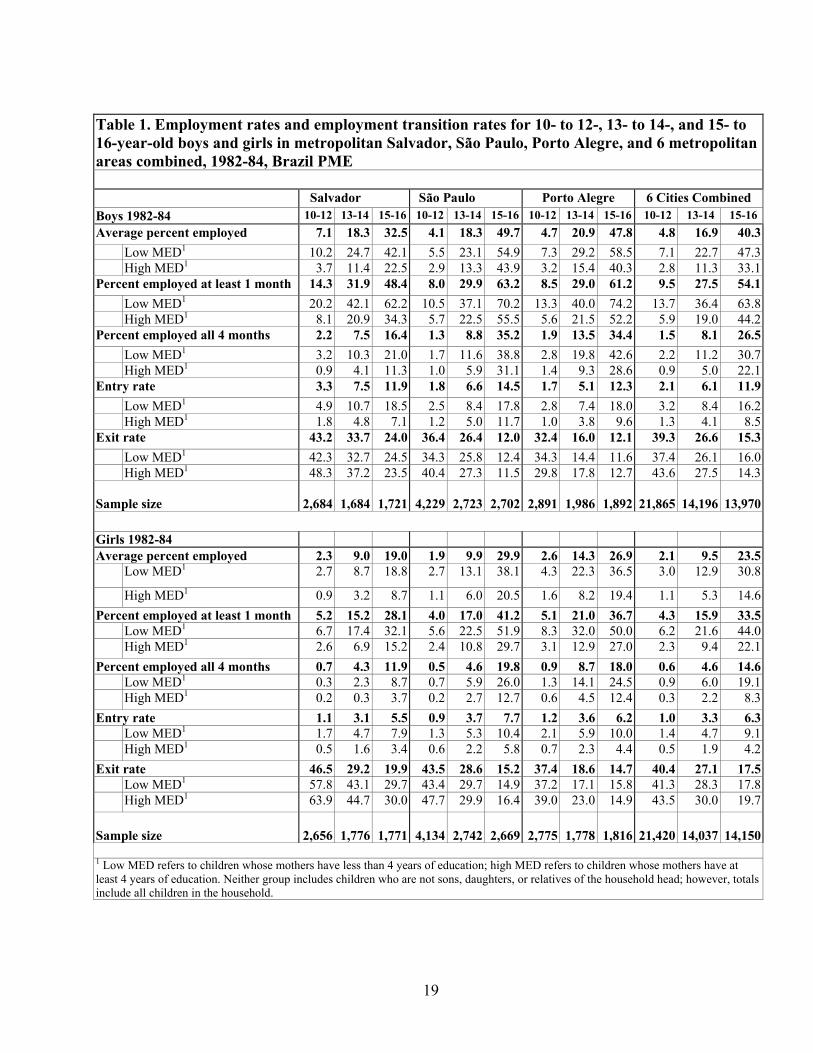
labor-force work done by children, due to lack of data.3 Table 1 presents child employment rates
by age and mother’s education for the three metropolitan areas of Salvador, São Paulo, and Porto
Alegre, as well as for all six cities combined for 1982 to 1984. Table 2 does the same for the
1996-1998 period. Salvador, São Paulo, and Porto Alegre are used to give a sense of the regional
disparities in child employment rates. São Paulo, in the southeast, is Brazil's largest city and its
major industrial center. Salvador is located in the poor, less industrialized northeast. Porto Alegre
is in the wealthier and newly industrializing south.
The average percent of employed children is calculated by taking the average of monthly
employment rates, as if the data were a series of cross-sectional surveys rather than a panel.
From 1982 to 1984, average employment rates for 10- to 12-year-olds were relatively low in all
cities; the rates for girls were under 3% in all cases and the rates for boys were under 5% except
in Salvador, where the rate was 7.1%. (see table 1.) Employment rates rise rapidly as age
increases, with the percentage of boys employed in the six cities rising from 4.8% at age 10 to 12
3 The PME asks what all individuals in the household age 10 and over were doing during the previous week. Possible responses are work, had a job but didn't work, looked for work, retired, student, domestic tasks, and other. Respondents are to indicate the first activity on the list that they are involved in. Students who are also working should therefore be indicated as working. Work includes formal and informal work for pay plus unpaid family labor that is normally at least 15 hours per week. In this study, the measure of employment includes only those who are reported as working or had a job but didn't work.
5
to 16.9% at age 13 and 14 and to 40.3% at age 15 and 16. Employment rates for males were
typically about twice as high as employment rates for females. For 13- and 14-year-olds in the
six cities combined, employment rates were 16.9% for males and 9.5% for females.
Average employment rates for 10- to 12-year-olds and 13- and 14-year-olds were
relatively similar across the three cities, but there are some substantial differences in employment
rates of 15- and 16-year-olds. Employment rates for 15- and 16-year-olds were about 50% higher
in the higher-income cities of São Paulo and Porto Alegre than in the poor northeast city of
Salvador. This suggests that demand-side effects of greater employment opportunities may be
more important than labor supply effects resulting from low income levels, which is consistent
with the argument of Barros et al. (1996) that poverty alone cannot explain Brazil's high child
employment rates.
It is likely that the PME underreports work done by children whose daily or weekly work
hours tend to be low; Levison (1991) documented this pattern using the 1985 annual household
survey data.4 While remunerated work is not subject to the 15-hour minimum of non-
remunerated work to be measured in the survey, it may be that children who work few hours per
week babysitting or doing occasional odd jobs are not being reported as working. The
employment levels present here should therefore be viewed as describing a substantial level of
work effort.
4 When core measures of employment, such as the questions used in the PME, were contrasted with supplementary questions on work activity, it became clear that the different measures captured somewhat different, although overlapping, populations. The core measures seemed to include most children with a substantial commitment to labor force work, as shown by lengthy hours of work, but it did not capture many children who undertook jobs or tasks of shorter duration. (Levison 1991)
6
Table 1 includes separate estimates of employment levels for children from high- and
low-socioeconomic status households.5 The mother's education level (MED) is used as a proxy
for household socioeconomic status, dividing the sample into lower-MED and upper-MED
groups. The lower-MED group includes children whose mothers have completed fewer than four
years of schooling, while the higher-MED group includes children whose mothers have
completed four or more years of schooling.6 Except for the oldest group of boys, employment
rates were approximately twice in the households with less educated mothers as in the higher
MED groups. As table 1 indicates, 22.7% of boys aged 13 and 14 in the low-MED group on
average were employed in the pooled six cities, compared to 11.3% in the high-MED group. For
girls, 12.9% in the low-MED group were working, versus 5.3% in the high-MED group.
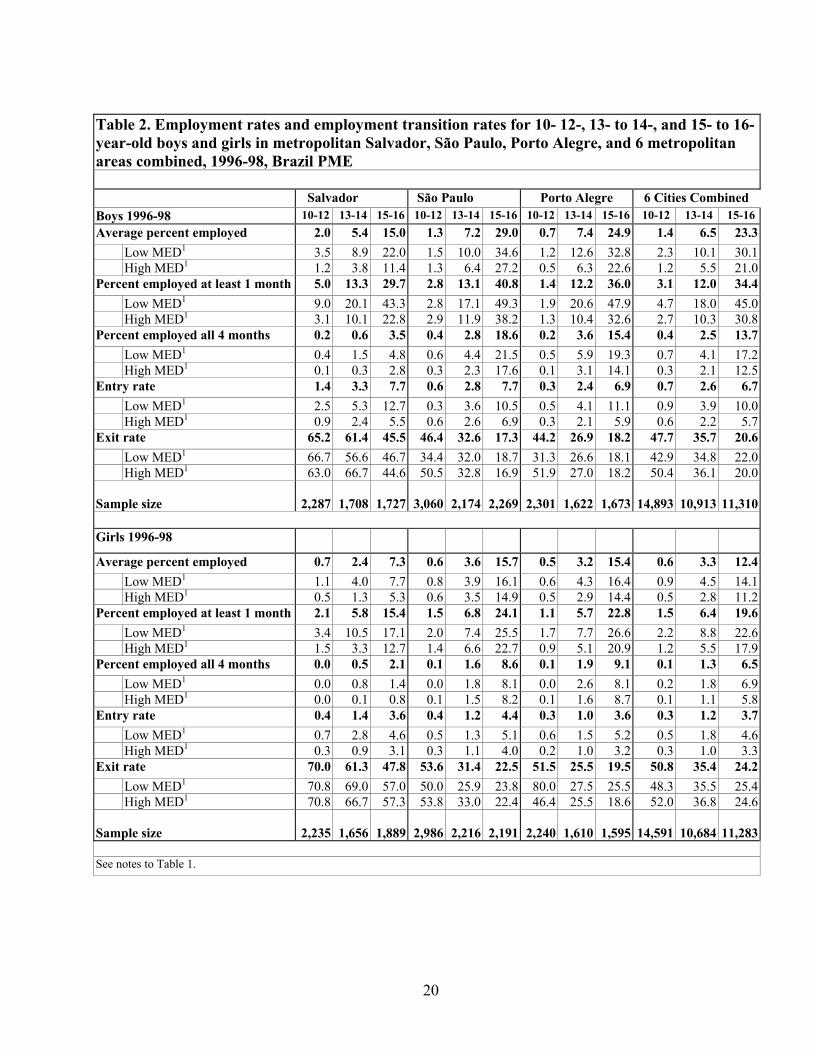
Table 2 presents comparable summary statistics for 1996 to 1998. Average employment
rates for the same groups of boys in the pooled six cities fell from 4.8% to 1.4% for ages 10 to
12, from 16.9% to 6.5% for ages 13 and 14, and from 40.3% to 23.3% for ages 15 and 16. For all
groups and time periods boys had higher employment rates than girls, but rates for girls also fell
during this interval. The gaps between socioeconomic groups were lower in the 1996-98 period.
The average employment rates for low-MED 13- and 14-year-old boys fell from 22.7% to
10.1%, and from 11.3% to 5.5% in the high-MED group.
5 Again, note that statistics calculated by socioeconomic status group refer to a somewhat smaller sample (sons and daughters of head) than the totals of which they are a subset (which also include children who are relatives of household head). 6 No measure of socioeconomic status is without its problems. Mother's education is used because relatively few children have absent mothers; many more fathers are absent. The biggest problem with using mother's education is that education levels have been increasing over time. In 1982, a much higher proportion of women had fewer than four completed years of education than in 1998. Thus, the group of children in the lower-SES group becomes increasingly small and, presumably, increasingly poor relative to the overall population over time. This implies that the trend of declining employment for the lower-SES group would appear even greater if it were possible to track a constant proportion of children from poorer households.
7
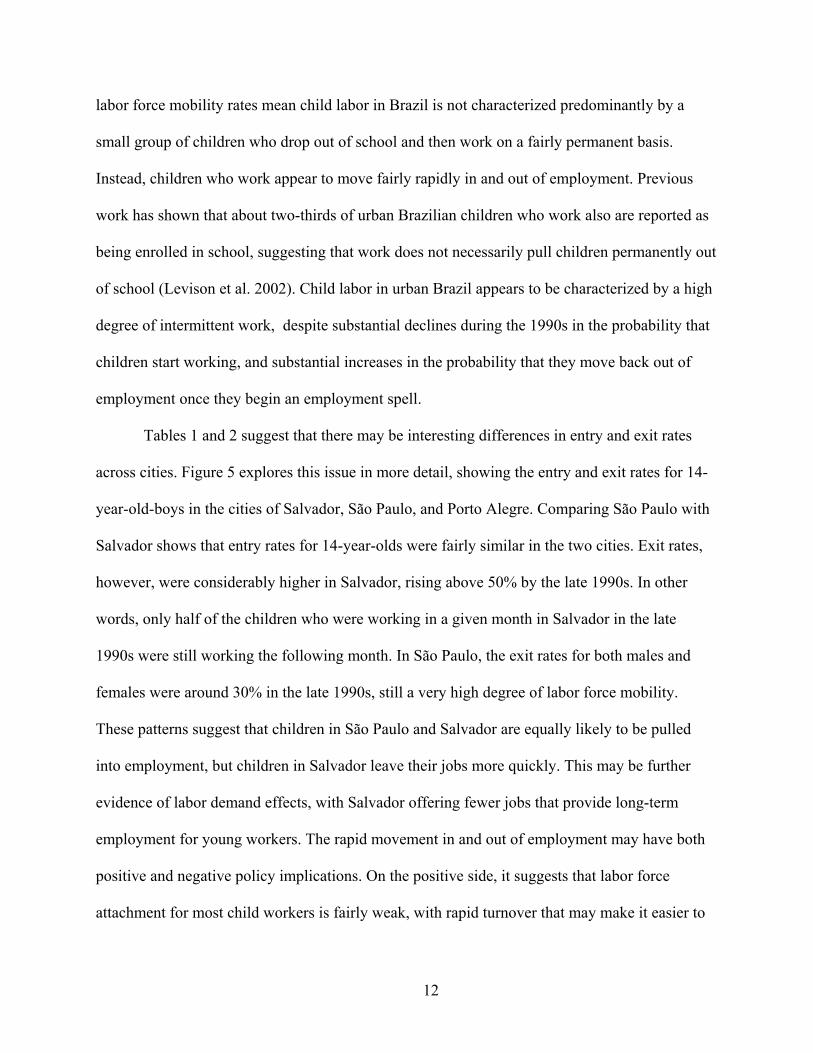
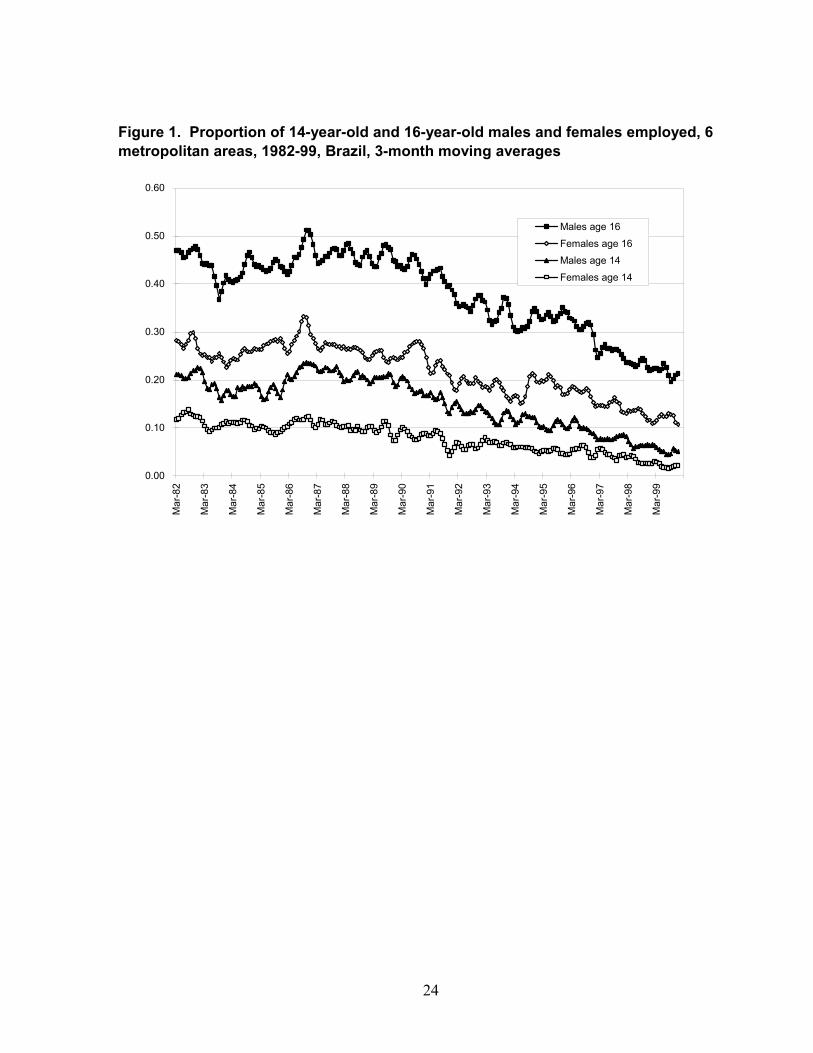
The pace of declines in employment rates over the two decades can best be seen in figure
1, which shows employment levels for girls and boys aged 14 and 16 for the six metropolitan
regions combined over the entire 1982-1999 period. The figure shows that employment levels
were relatively constant during the 1980s, with some evidence of increasing levels in the late
1980s. The figure clearly shows a substantial downward trend in employment levels for all
groups beginning about 1990. For all four age and gender groups shown, declines in employment
were already under way in the early 1990s. These declines in youth employment in metropolitan
areas in the early 1990s cannot be attributed to programs such as Bolsa Escola or PETI because
these programs did not begin until after 1995, and PETI was limited to rural areas through the
end of the decade.
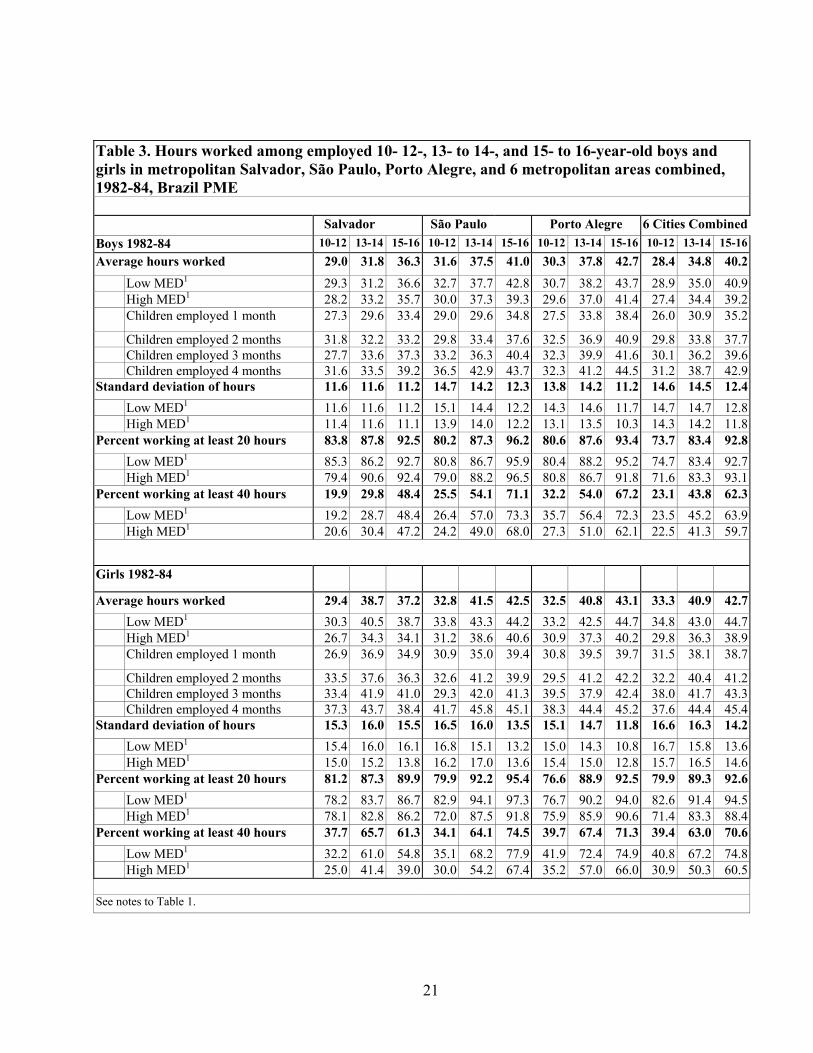
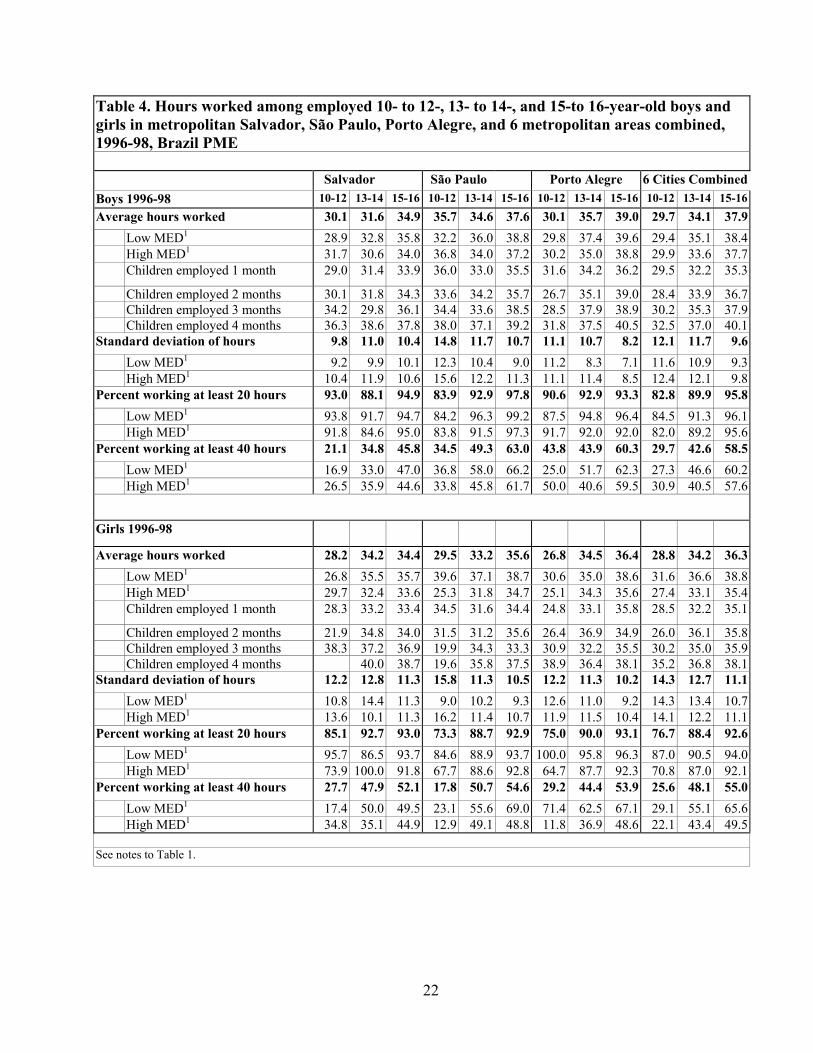
While the PME definition of work should include children with even very low hours of
work, most of the children who were reported as working were in fact working a substantial
number of hours. Tables 3 and 4 present hours worked by employed children from 1982 to 1984
and from 1996 to 1998, respectively. Average hours worked exceeded twenty-seven hours per
week in all age groups and all cities. Moreover, the underlying month-by-month estimates of
average hours worked show very little variation across months of the year. About 80% of the
children who were employed worked more than twenty hours per week. Even among 10- to 12-
year-olds, work hours were high: In the early 1980s, 23% of employed boys and 39% of
employed girls worked at least forty hours per week. By the late 1990s these percentages had
shifted to 30% of boys and 26% of girls aged 10 to 12.
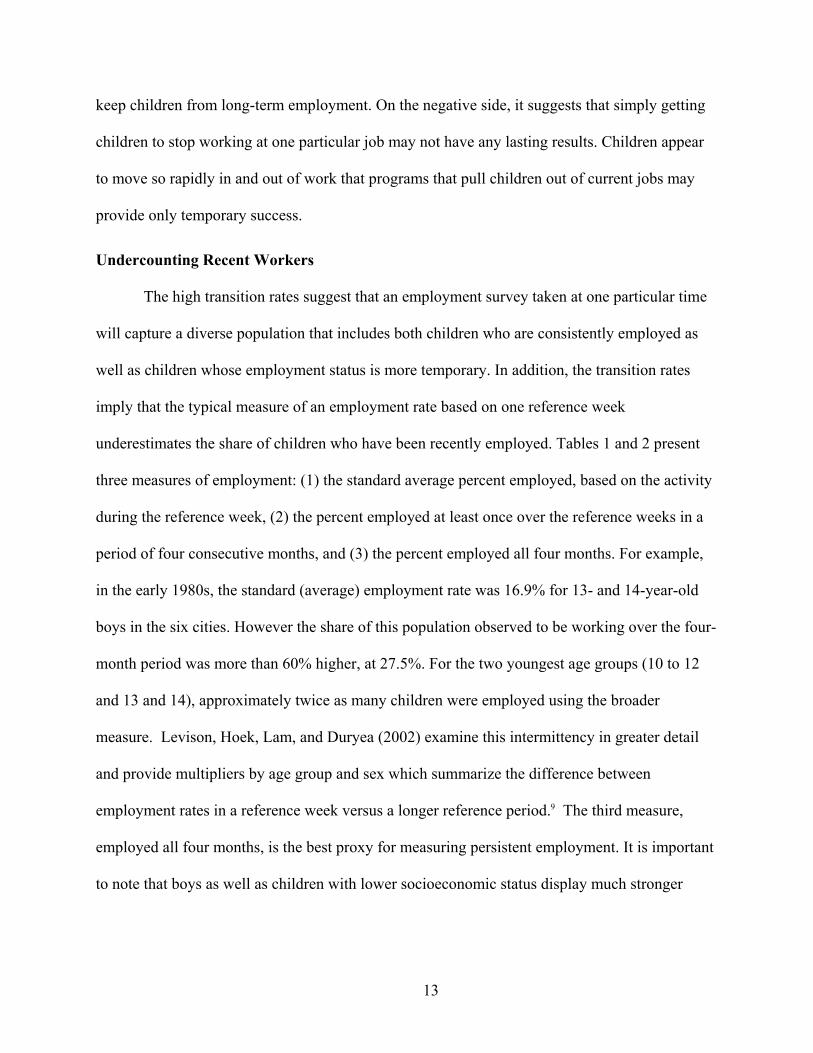
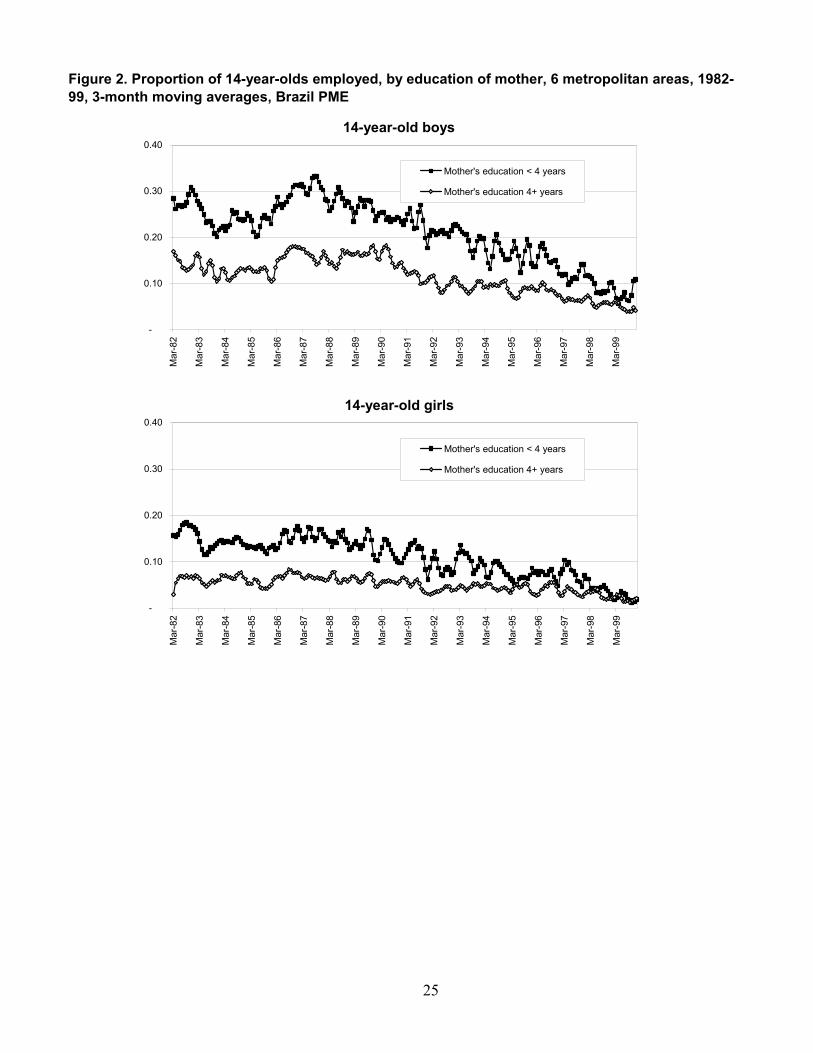
Figure 2 shows the trends in employment for 14-year-old boys and girls by
socioeconomic status over time. The lines are remarkably parallel over time, suggesting that
employment rates for both high- and low-MED children tend to move up and down together over

8
time. Both groups show substantial declines in employment levels beginning around 1990. The
absolute gap between MED groups declines over time, but the proportional differences remain
relatively constant, with the lower-MED group typically having employment rates roughly
double those of the higher-MED group. Employment rates for both groups of high- and low-
MED status generally were under 10% by the end of the 1990s.
Exit and Entry Rates
While the data presented above provide a good picture of the proportion of children
working at any given point in time, they do not reveal anything about the movements of children
in and out of employment. From a policy perspective it may be important to know whether the
employment levels presented above represent a small group of children who work all the time or
a larger group of children who rotate in and out of employment. For example, the 20% of 14-
year-old boys working in most months in the early 1980s could represent the same 20% of boys
working steadily or 100% of boys each working 20% of the time. The panel structure of the PME
data makes it possible to analyze some dimensions of child labor transitions, or the extent to
which children move in and out of employment and how these employment transitions vary by
age, sex, and socioeconomic status and over time.
Tables 1 and 2 include estimates of monthly transitions in and out of employment. Job
changes cannot be identified from the PME data, so these measures do not capture transitions
from one job to another, only transitions between the state of being employed and the state of not
being employed. Similarly, multiple transitions within one month cannot be captured. For each
pair of sequential months, the PME data are used to calculate the proportion of children who
change status from being employed in the reference week of one month to being non-employed
in the reference week of the following month. The exit rate for month t is defined as the number
9
of children who change from employed in month t to non-employed in month t+1, divided by the
number of children who were employed in month t. The entry rate is defined analogously based
on those who move from non-employed in month t to employed in month t+1. Table 1 shows
that for all six cities combined in 1982 to 1984, 2.1% of 10- to 12-year-old boys who were not
working in one month had started working by the following month. The entry rate for older boys
was much higher, 6.1% for ages 13 and 14 and 11.9% for ages 15 and 16. The entry rates for
boys with low-MED backgrounds were roughly twice as high as the entry rates for high-MED
boys. Entry rates are relatively similar across the three cities in Table 1.
The exit rates in Table 1 are much higher than the entry rates because the denominator
(the employed population) is much smaller than in the case of entry (the not-employed
population). For all six cities in from 1982 to 1984, 39.3% of 10- to 12-year-old boys who were
working in one month were not working in the following month. Exit rates were 26.6% for ages
13 and 14 and 15.3% for ages 15 and 16. Across cities there are considerably larger differences
in exit rates than in entry rates, with exit rates roughly twice as high in Salvador as Porto Alegre
for any given age group.
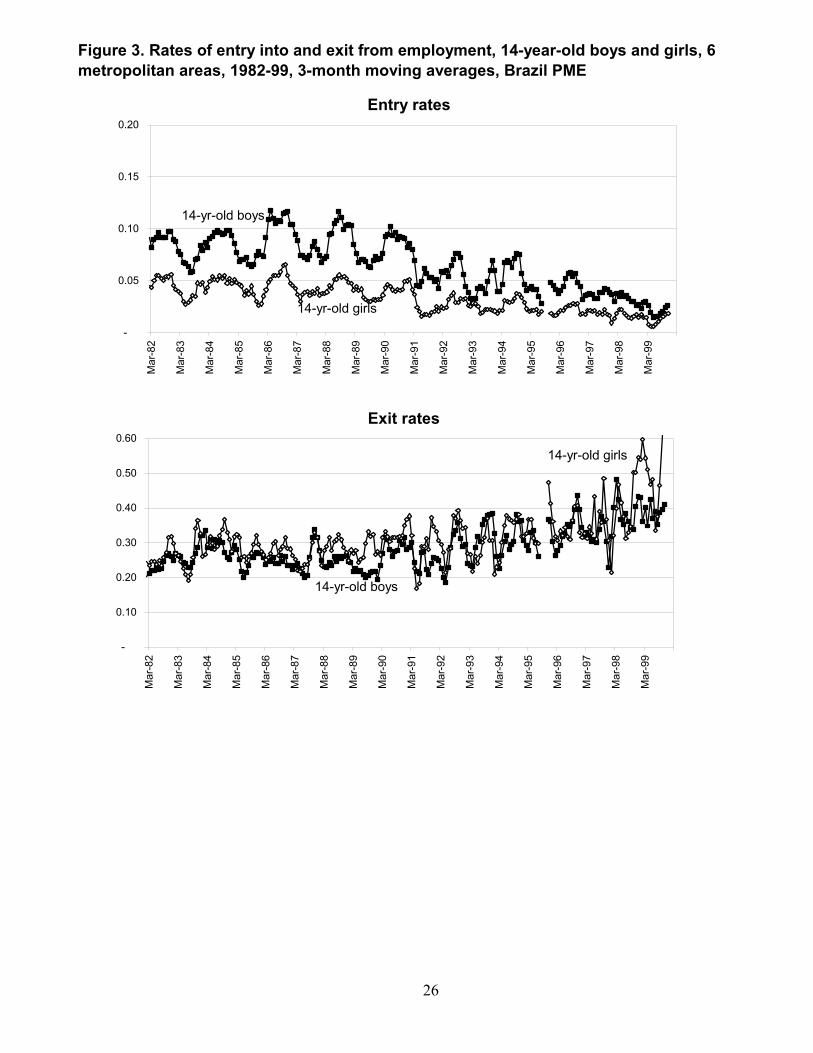
The entry and exit rates in table 2 show substantial changes over time. These trends can
be seen in more detail in figure 3, which gives estimates of entry and exit rates for 14-year-olds
for the entire period covered by the data, using three-month moving averages.7 The focus is on
14-year-olds because age 14 is defined, in Brazil and according to international conventions, as
the upper limit of childhood. Thus, children over 14 are not eligible for Bolsa Escola or PETI, for
7 The large monthly variations in Figure 3 reflect both seasonal movements and monthly volatility due to small sample sizes. The greater volatility in the exit rates reflects the fact that the denominator of employed children in any month is rather small in spite of the large sample sizes, especially at the younger ages and in the later years. Using moving averages makes the trends more easily visible.
10
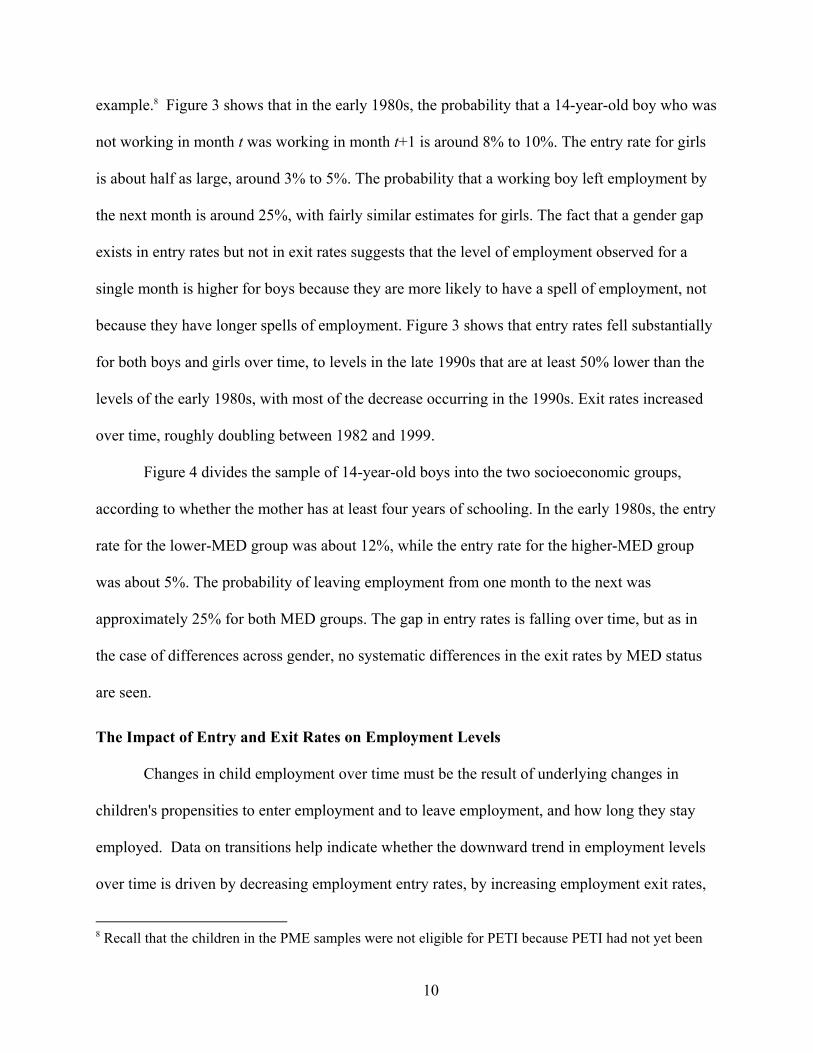
example.8 Figure 3 shows that in the early 1980s, the probability that a 14-year-old boy who was
not working in month t was working in month t+1 is around 8% to 10%. The entry rate for girls
is about half as large, around 3% to 5%. The probability that a working boy left employment by
the next month is around 25%, with fairly similar estimates for girls. The fact that a gender gap
exists in entry rates but not in exit rates suggests that the level of employment observed for a
single month is higher for boys because they are more likely to have a spell of employment, not
because they have longer spells of employment. Figure 3 shows that entry rates fell substantially
for both boys and girls over time, to levels in the late 1990s that are at least 50% lower than the
levels of the early 1980s, with most of the decrease occurring in the 1990s. Exit rates increased
over time, roughly doubling between 1982 and 1999.
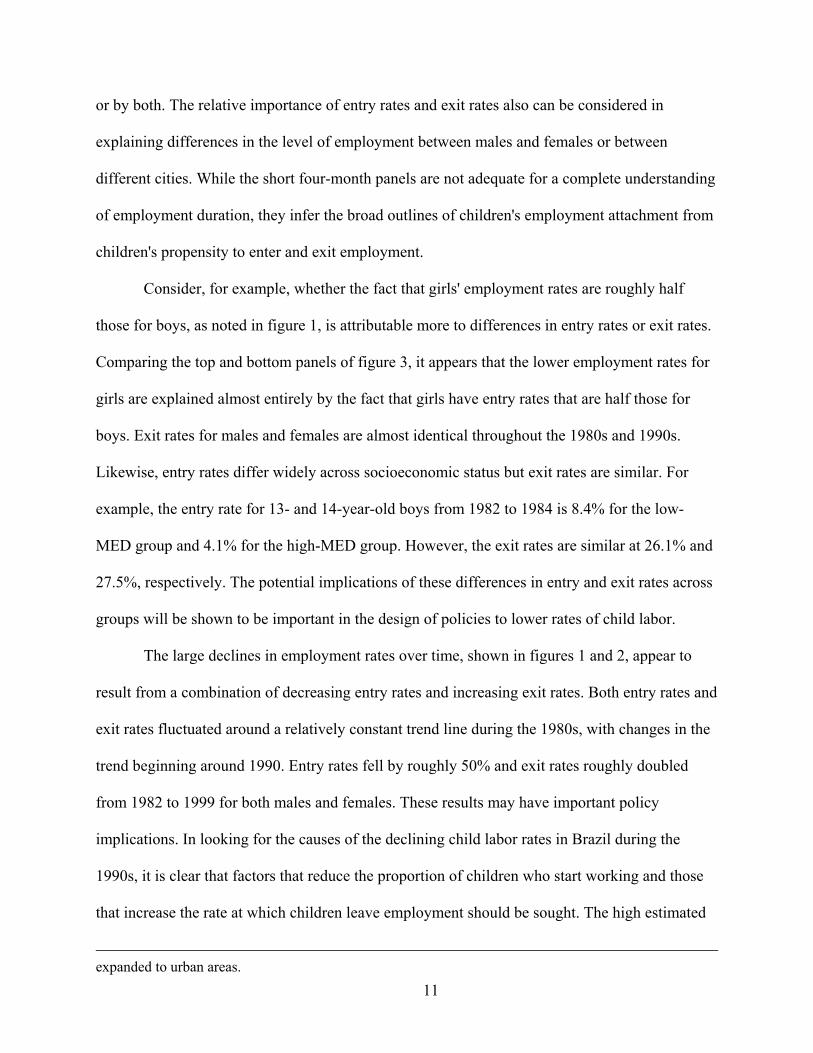
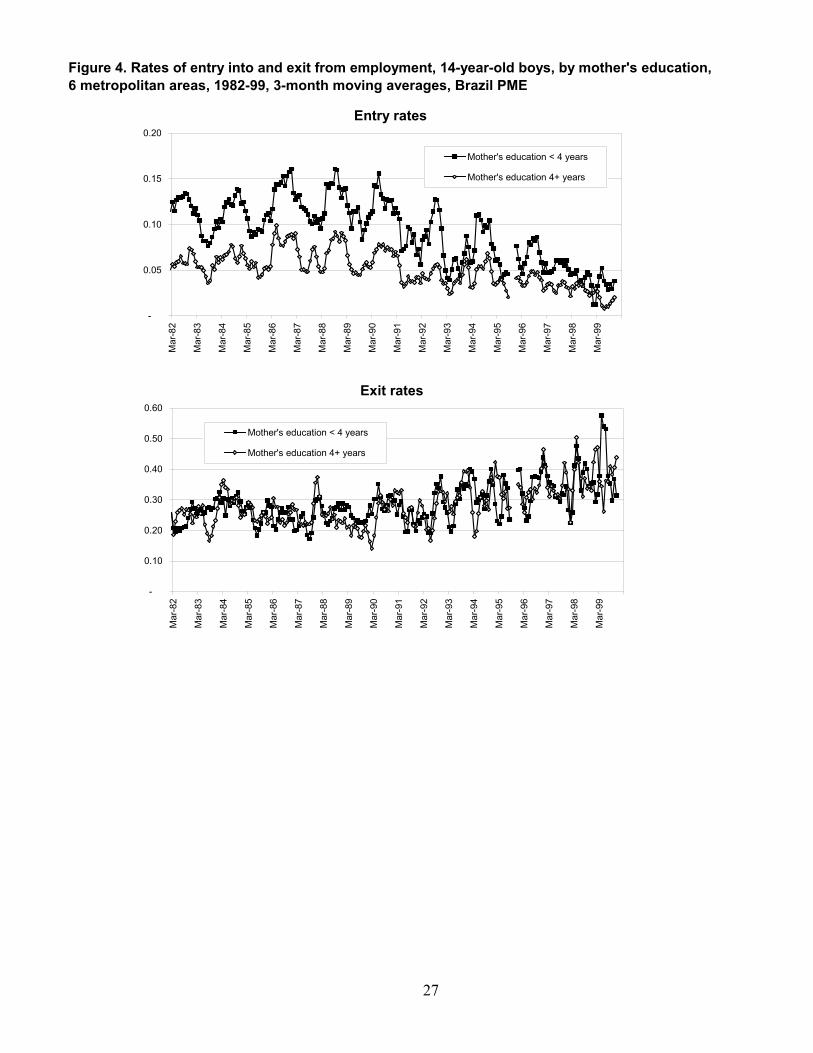
Figure 4 divides the sample of 14-year-old boys into the two socioeconomic groups,
according to whether the mother has at least four years of schooling. In the early 1980s, the entry
rate for the lower-MED group was about 12%, while the entry rate for the higher-MED group
was about 5%. The probability of leaving employment from one month to the next was
approximately 25% for both MED groups. The gap in entry rates is falling over time, but as in
the case of differences across gender, no systematic differences in the exit rates by MED status
are seen.
The Impact of Entry and Exit Rates on Employment Levels
Changes in child employment over time must be the result of underlying changes in
children's propensities to enter employment and to leave employment, and how long they stay
employed. Data on transitions help indicate whether the downward trend in employment levels
over time is driven by decreasing employment entry rates, by increasing employment exit rates,
8 Recall that the children in the PME samples were not eligible for PETI because PETI had not yet been
11
or by both. The relative importance of entry rates and exit rates also can be considered in
explaining differences in the level of employment between males and females or between
different cities. While the short four-month panels are not adequate for a complete understanding
of employment duration, they infer the broad outlines of children's employment attachment from
children's propensity to enter and exit employment.
Consider, for example, whether the fact that girls' employment rates are roughly half
those for boys, as noted in figure 1, is attributable more to differences in entry rates or exit rates.
Comparing the top and bottom panels of figure 3, it appears that the lower employment rates for
girls are explained almost entirely by the fact that girls have entry rates that are half those for
boys. Exit rates for males and females are almost identical throughout the 1980s and 1990s.
Likewise, entry rates differ widely across socioeconomic status but exit rates are similar. For
example, the entry rate for 13- and 14-year-old boys from 1982 to 1984 is 8.4% for the low-
MED group and 4.1% for the high-MED group. However, the exit rates are similar at 26.1% and
27.5%, respectively. The potential implications of these differences in entry and exit rates across
groups will be shown to be important in the design of policies to lower rates of child labor.
The large declines in employment rates over time, shown in figures 1 and 2, appear to
result from a combination of decreasing entry rates and increasing exit rates. Both entry rates and
exit rates fluctuated around a relatively constant trend line during the 1980s, with changes in the
trend beginning around 1990. Entry rates fell by roughly 50% and exit rates roughly doubled
from 1982 to 1999 for both males and females. These results may have important policy
implications. In looking for the causes of the declining child labor rates in Brazil during the
1990s, it is clear that factors that reduce the proportion of children who start working and those
that increase the rate at which children leave employment should be sought. The high estimated
expanded to urban areas.
12
labor force mobility rates mean child labor in Brazil is not characterized predominantly by a
small group of children who drop out of school and then work on a fairly permanent basis.
Instead, children who work appear to move fairly rapidly in and out of employment. Previous
work has shown that about two-thirds of urban Brazilian children who work also are reported as
being enrolled in school, suggesting that work does not necessarily pull children permanently out
of school (Levison et al. 2002). Child labor in urban Brazil appears to be characterized by a high
degree of intermittent work, despite substantial declines during the 1990s in the probability that
children start working, and substantial increases in the probability that they move back out of
employment once they begin an employment spell.
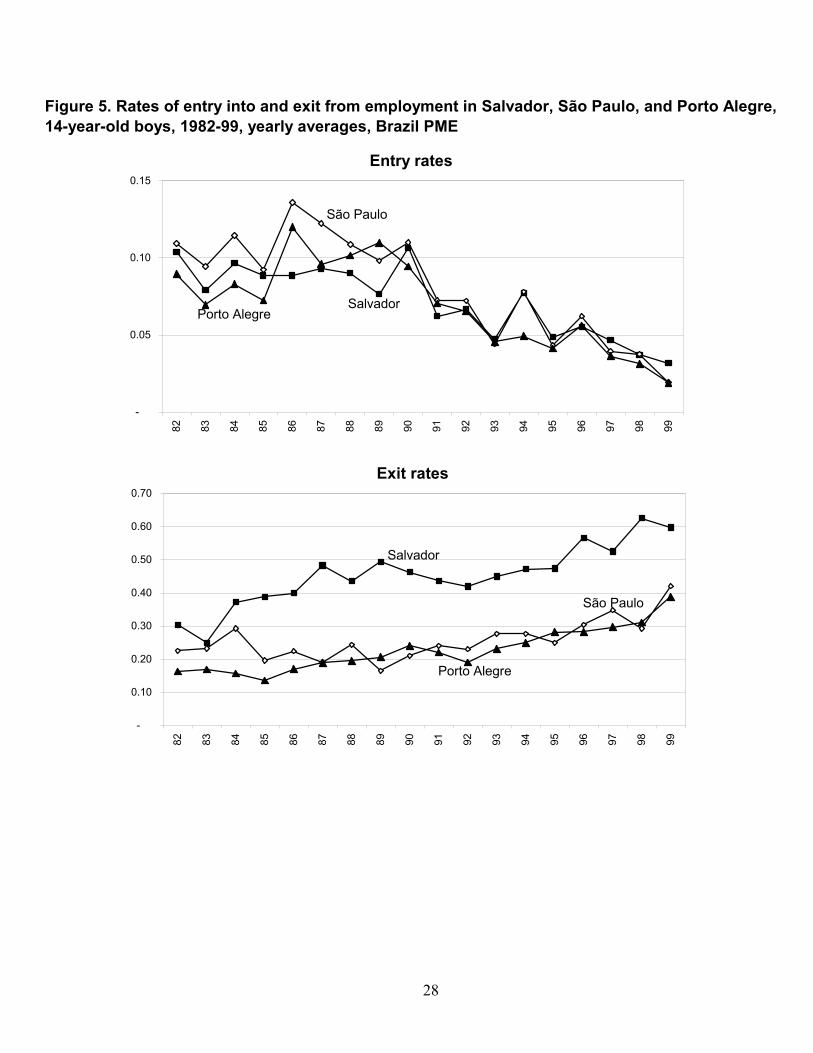
Tables 1 and 2 suggest that there may be interesting differences in entry and exit rates
across cities. Figure 5 explores this issue in more detail, showing the entry and exit rates for 14-
year-old-boys in the cities of Salvador, São Paulo, and Porto Alegre. Comparing São Paulo with
Salvador shows that entry rates for 14-year-olds were fairly similar in the two cities. Exit rates,
however, were considerably higher in Salvador, rising above 50% by the late 1990s. In other
words, only half of the children who were working in a given month in Salvador in the late
1990s were still working the following month. In São Paulo, the exit rates for both males and
females were around 30% in the late 1990s, still a very high degree of labor force mobility.
These patterns suggest that children in São Paulo and Salvador are equally likely to be pulled
into employment, but children in Salvador leave their jobs more quickly. This may be further
evidence of labor demand effects, with Salvador offering fewer jobs that provide long-term
employment for young workers. The rapid movement in and out of employment may have both
positive and negative policy implications. On the positive side, it suggests that labor force
attachment for most child workers is fairly weak, with rapid turnover that may make it easier to
13
keep children from long-term employment. On the negative side, it suggests that simply getting
children to stop working at one particular job may not have any lasting results. Children appear
to move so rapidly in and out of work that programs that pull children out of current jobs may
provide only temporary success.
Undercounting Recent Workers
The high transition rates suggest that an employment survey taken at one particular time
will capture a diverse population that includes both children who are consistently employed as
well as children whose employment status is more temporary. In addition, the transition rates
imply that the typical measure of an employment rate based on one reference week
underestimates the share of children who have been recently employed. Tables 1 and 2 present
three measures of employment: (1) the standard average percent employed, based on the activity
during the reference week, (2) the percent employed at least once over the reference weeks in a
period of four consecutive months, and (3) the percent employed all four months. For example,
in the early 1980s, the standard (average) employment rate was 16.9% for 13- and 14-year-old
boys in the six cities. However the share of this population observed to be working over the four-
month period was more than 60% higher, at 27.5%. For the two youngest age groups (10 to 12
and 13 and 14), approximately twice as many children were employed using the broader
measure. Levison, Hoek, Lam, and Duryea (2002) examine this intermittency in greater detail
and provide multipliers by age group and sex which summarize the difference between
employment rates in a reference week versus a longer reference period.9 The third measure,
employed all four months, is the best proxy for measuring persistent employment. It is important
to note that boys as well as children with lower socioeconomic status display much stronger
14
attachment to the labor market, with approximately twice as many boys as girls reported as
employed all four months. Substantially higher percentages of children were reported as
employed all four months among groups with lower socioeconomic status in tables 1 and 2.
One might wonder if the children most likely to be missed in standard calculations, for
example, children working only one of the four months, are participating in trivial employment
activities that can be overlooked because they are unlikely to conflict with school efforts and
general well-being. This does not appear to be the case. Tables 3 and 4 report average hours
worked by the number of months worked. While the average length of hours increases with the
number of months worked, in all groups the average hours worked per week was at least twenty,
and in many cases more than thirty. In the pooled six-city sample for the latter period, among the
13- and 14-year-olds reported to have worked only one month, the average labor market time for
girls and boys was thirty-two hours.
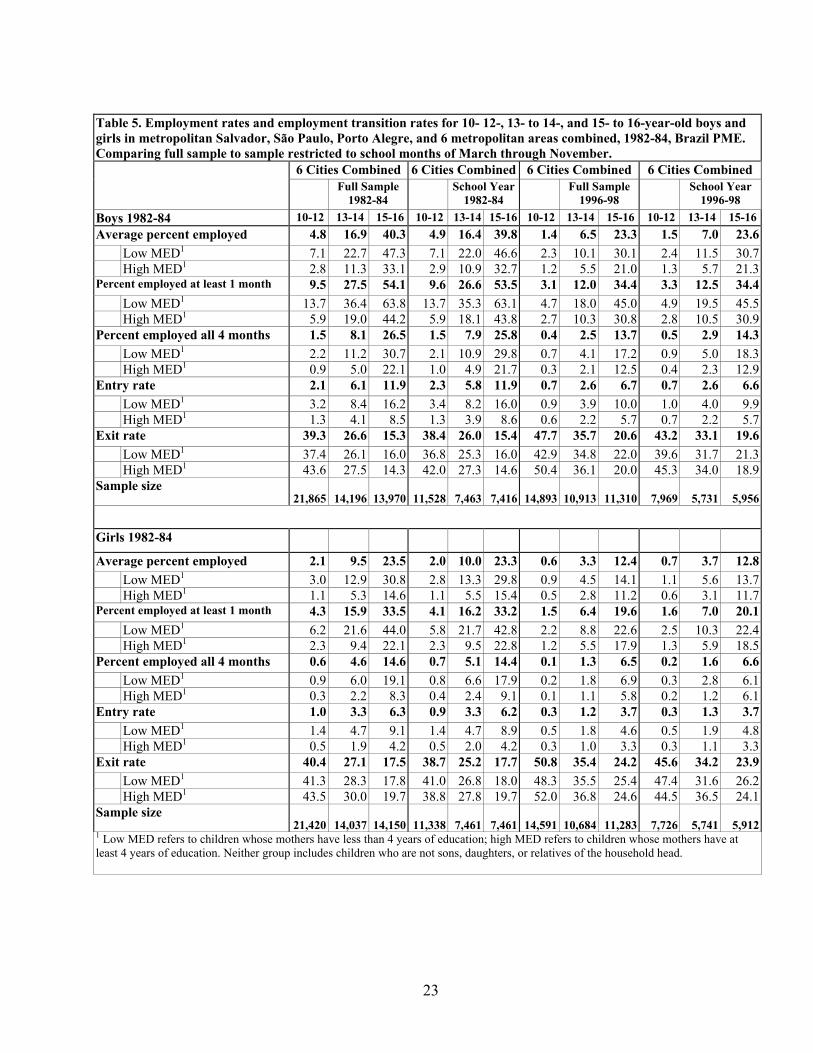
The implications of work during vacations on the undercounting of child labor is
explored by restricting the sample to the months of the school year, i.e., March through
November. Table 5 presents calculations for the full sample as well as for the sample restricted
to the school year. The percentages of children employed for at least one month are qualitatively
the same if the samples are restricted to months of the school year. For example, the percent of
13- to 14-year-old boys who worked at least one month, restricting the sample to March through
November, is 12.5% for the 1996-1998 period, compared to 12% for the full sample. Among
girls, 7% worked at least one month during March through November, compared to 6.4% for the
full period. The undercounting of employment in standard calculations for Brazil is not driven by
the omission of a few hours of work on the weekends or on summer vacations. The lack of a
9 This study also demonstrates that children and adolescents move in and out of employment at much higher rates than do adults.
15
seasonal pattern in intermittency with respect to school vacations implies that the under-
measurement of child work should be of concern to policymakers.
A potential weakness of the PME data is that measurement error may lead to observations
of apparent movements in and out of employment that do not actually take place. For example,
reports of children's employment may change from month to month due to a change in the family
member answering the enumerator's questions, even if there is no actual change in the child's
work activity. This may cause overstatement of transitions both in and out of employment.
While all of the estimates in this study may be subject to measurement error, it is important to
note that the basic methodology of the PME is constant across cities and across the two decades
analyzed. It is therefore highly unlikely that measurement error can explain the large changes in
entry rates and exit rates over time or the differences between groups, such as the higher entry
rates for males or the larger exit rates for Salvador relative to São Paulo. While the absolute
levels of the entry and exit rates may be measured with error, it seems safe to assume that the
large changes measured over time reflect actual changes in the labor force dynamics of Brazilian
children.
Conclusion and Policy Implications
Taking advantage of the panel dimension of Brazil's monthly employment survey, this
study analyzes transitions in and out of employment for children and adolescents. It finds that
child and youth employment is an extremely dynamic process that does not fit the common
perception of a stable set of children persistently attached to long-term jobs. The fluidity of
movement of children into and out of employment is consistent with the way the poorer
households allocated child time in response to the loss of income of the household head. The
intermittency of child employment implies that the typical reference period of "last week" in

16
labor surveys seriously understates the number of children working over a longer period. The
results also imply that child workers may be harder to identify than previously imagined, due to
the volatility of their activities.
In fact, the findings have both negative and positive policy implications. The past few
years have seen a proliferation of programs explicitly aimed to reduce child labor in Latin
America. Examples include PETI and Bolsa Escola in Brazil and Programa de Atención
Inmediata (PAI) in Costa Rica.10 It is likely that governments and international organizations, in
designing these programs, have underestimated the number of workers, especially children under
the age of 15. Another negative implication is that simply preventing urban children from
working in a particular job may not free up children's time for attending school, because urban
children often are accustomed to moving from one job to another. While moving children out of
hazardous work is to be commended, the same children also must be discouraged from simply
finding another, perhaps equally or more hazardous, job. On the positive side, the results suggest
that for many children who can be described as "recent child workers," the apparently normal
interruptions in employment provide the potential for interventions to focus on preventing new
employment activities, which may be easier than asking children to leave specific jobs. The high
levels of intermittency also suggest that the cash transfers intended to replace the income earned
in the labor market may have a tendency to be set too high, because many children do not receive
a consistent stream of income. This would imply that the extra cost associated with the
underestimate of child workers might be offset by a lower subsidy per child.
Cash transfer programs, such as PROGRESA in Mexico and Red de Protección Social in
Nicaragua, often use geographic-based targeting during the first stage of the program and must
10 For more information on these programs see Chapters 8-9 for an overview and evaluations of Bolsa Escola and PETI. See Duryea and Morrison (2002) for PAI.

17
rely on additional rules for eligibility once the program expands to include new regions. In
Brazil, the PETI program is expanding to national coverage. These results imply that
determining eligibility in PETI on children's labor force behavior over a short reference period
would result in the exclusion of large numbers of children who have recently engaged in child
labor.
18
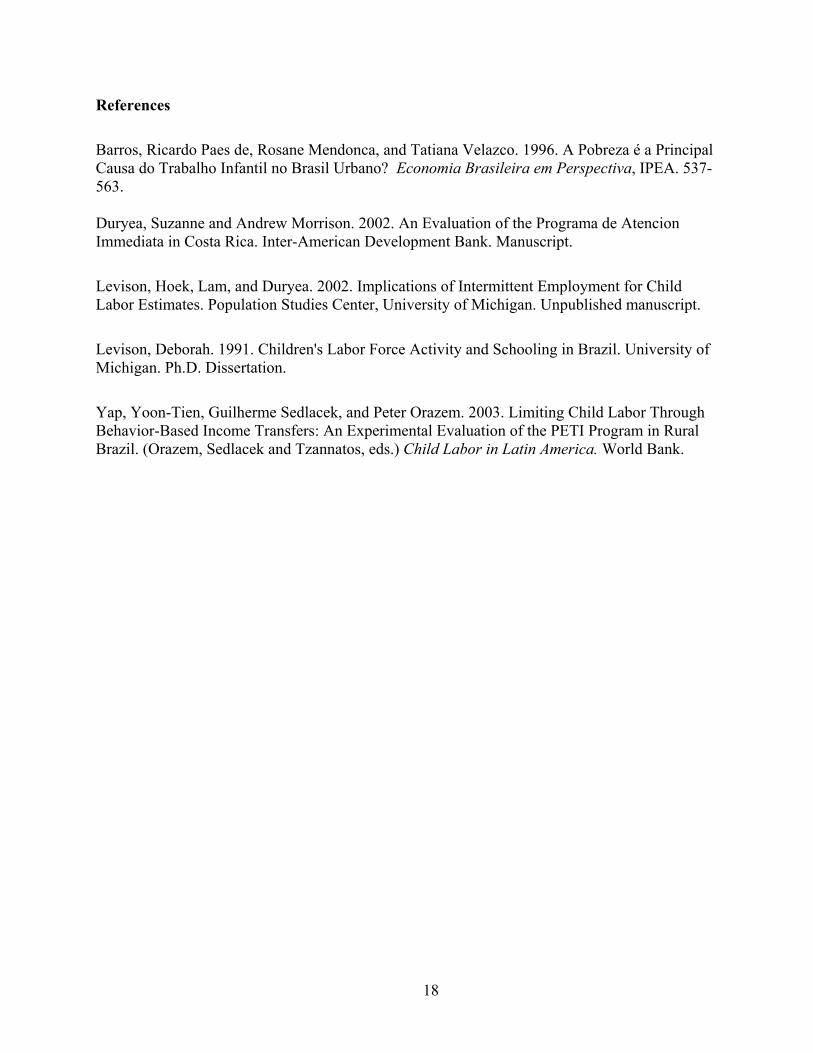
References
Barros, Ricardo Paes de, Rosane Mendonca, and Tatiana Velazco. 1996. A Pobreza é a Principal Causa do Trabalho Infantil no Brasil Urbano? Economia Brasileira em Perspectiva, IPEA. 537-563. Duryea, Suzanne and Andrew Morrison. 2002. An Evaluation of the Programa de Atencion Immediata in Costa Rica. Inter-American Development Bank. Manuscript.
Levison, Hoek, Lam, and Duryea. 2002. Implications of Intermittent Employment for Child Labor Estimates. Population Studies Center, University of Michigan. Unpublished manuscript.
Levison, Deborah. 1991. Children's Labor Force Activity and Schooling in Brazil. University of Michigan. Ph.D. Dissertation.
Yap, Yoon-Tien, Guilherme Sedlacek, and Peter Orazem. 2003. Limiting Child Labor Through Behavior-Based Income Transfers: An Experimental Evaluation of the PETI Program in Rural Brazil. (Orazem, Sedlacek and Tzannatos, eds.) Child Labor in Latin America. World Bank.
19
Table 1. Employment rates and employment transition rates for 10- to 12-, 13- to 14-, and 15- to 16-year-old boys and girls in metropolitan Salvador, São Paulo, Porto Alegre, and 6 metropolitan areas combined, 1982-84, Brazil PME
Salvador São Paulo Porto Alegre 6 Cities Combined Boys 1982-84 10-12 13-14 15-16 10-12 13-14 15-16 10-12 13-14 15-16 10-12 13-14 15-16Average percent employed 7.1 18.3 32.5 4.1 18.3 49.7 4.7 20.9 47.8 4.8 16.9 40.3
Low MED1 10.2 24.7 42.1 5.5 23.1 54.9 7.3 29.2 58.5 7.1 22.7 47.3 High MED1 3.7 11.4 22.5 2.9 13.3 43.9 3.2 15.4 40.3 2.8 11.3 33.1
Percent employed at least 1 month 14.3 31.9 48.4 8.0 29.9 63.2 8.5 29.0 61.2 9.5 27.5 54.1 Low MED1 20.2 42.1 62.2 10.5 37.1 70.2 13.3 40.0 74.2 13.7 36.4 63.8 High MED1 8.1 20.9 34.3 5.7 22.5 55.5 5.6 21.5 52.2 5.9 19.0 44.2
Percent employed all 4 months 2.2 7.5 16.4 1.3 8.8 35.2 1.9 13.5 34.4 1.5 8.1 26.5 Low MED1 3.2 10.3 21.0 1.7 11.6 38.8 2.8 19.8 42.6 2.2 11.2 30.7 High MED1 0.9 4.1 11.3 1.0 5.9 31.1 1.4 9.3 28.6 0.9 5.0 22.1
Entry rate 3.3 7.5 11.9 1.8 6.6 14.5 1.7 5.1 12.3 2.1 6.1 11.9 Low MED1 4.9 10.7 18.5 2.5 8.4 17.8 2.8 7.4 18.0 3.2 8.4 16.2 High MED1 1.8 4.8 7.1 1.2 5.0 11.7 1.0 3.8 9.6 1.3 4.1 8.5
Exit rate 43.2 33.7 24.0 36.4 26.4 12.0 32.4 16.0 12.1 39.3 26.6 15.3 Low MED1 42.3 32.7 24.5 34.3 25.8 12.4 34.3 14.4 11.6 37.4 26.1 16.0 High MED1 48.3 37.2 23.5 40.4 27.3 11.5 29.8 17.8 12.7 43.6 27.5 14.3
Sample size 2,684 1,684 1,721 4,229 2,723 2,702 2,891
1,986
1,892 21,865 14,196 13,970
Girls 1982-84 Average percent employed 2.3 9.0 19.0 1.9 9.9 29.9 2.6 14.3 26.9 2.1 9.5 23.5
Low MED1 2.7 8.7 18.8 2.7 13.1 38.1 4.3 22.3 36.5 3.0 12.9 30.8
High MED1 0.9 3.2 8.7 1.1 6.0 20.5 1.6 8.2 19.4 1.1 5.3 14.6Percent employed at least 1 month 5.2 15.2 28.1 4.0 17.0 41.2 5.1 21.0 36.7 4.3 15.9 33.5
Low MED1 6.7 17.4 32.1 5.6 22.5 51.9 8.3 32.0 50.0 6.2 21.6 44.0 High MED1 2.6 6.9 15.2 2.4 10.8 29.7 3.1 12.9 27.0 2.3 9.4 22.1
Percent employed all 4 months 0.7 4.3 11.9 0.5 4.6 19.8 0.9 8.7 18.0 0.6 4.6 14.6 Low MED1 0.3 2.3 8.7 0.7 5.9 26.0 1.3 14.1 24.5 0.9 6.0 19.1 High MED1 0.2 0.3 3.7 0.2 2.7 12.7 0.6 4.5 12.4 0.3 2.2 8.3
Entry rate 1.1 3.1 5.5 0.9 3.7 7.7 1.2 3.6 6.2 1.0 3.3 6.3 Low MED1 1.7 4.7 7.9 1.3 5.3 10.4 2.1 5.9 10.0 1.4 4.7 9.1 High MED1 0.5 1.6 3.4 0.6 2.2 5.8 0.7 2.3 4.4 0.5 1.9 4.2
Exit rate 46.5 29.2 19.9 43.5 28.6 15.2 37.4 18.6 14.7 40.4 27.1 17.5 Low MED1 57.8 43.1 29.7 43.4 29.7 14.9 37.2 17.1 15.8 41.3 28.3 17.8 High MED1 63.9 44.7 30.0 47.7 29.9 16.4 39.0 23.0 14.9 43.5 30.0 19.7
Sample size 2,656 1,776 1,771 4,134 2,742 2,669 2,775
1,778
1,816 21,420 14,037 14,150
1 Low MED refers to children whose mothers have less than 4 years of education; high MED refers to children whose mothers have at least 4 years of education. Neither group includes children who are not sons, daughters, or relatives of the household head; however, totals include all children in the household.
20
Table 2. Employment rates and employment transition rates for 10- 12-, 13- to 14-, and 15- to 16- year-old boys and girls in metropolitan Salvador, São Paulo, Porto Alegre, and 6 metropolitan areas combined, 1996-98, Brazil PME
Salvador São Paulo Porto Alegre 6 Cities Combined Boys 1996-98 10-12 13-14 15-16 10-12 13-14 15-16 10-12 13-14 15-16 10-12 13-14 15-16Average percent employed 2.0 5.4 15.0 1.3 7.2 29.0 0.7 7.4 24.9 1.4 6.5 23.3
Low MED1 3.5 8.9 22.0 1.5 10.0 34.6 1.2 12.6 32.8 2.3 10.1 30.1 High MED1 1.2 3.8 11.4 1.3 6.4 27.2 0.5 6.3 22.6 1.2 5.5 21.0
Percent employed at least 1 month 5.0 13.3 29.7 2.8 13.1 40.8 1.4 12.2 36.0 3.1 12.0 34.4 Low MED1 9.0 20.1 43.3 2.8 17.1 49.3 1.9 20.6 47.9 4.7 18.0 45.0 High MED1 3.1 10.1 22.8 2.9 11.9 38.2 1.3 10.4 32.6 2.7 10.3 30.8
Percent employed all 4 months 0.2 0.6 3.5 0.4 2.8 18.6 0.2 3.6 15.4 0.4 2.5 13.7 Low MED1 0.4 1.5 4.8 0.6 4.4 21.5 0.5 5.9 19.3 0.7 4.1 17.2 High MED1 0.1 0.3 2.8 0.3 2.3 17.6 0.1 3.1 14.1 0.3 2.1 12.5
Entry rate 1.4 3.3 7.7 0.6 2.8 7.7 0.3 2.4 6.9 0.7 2.6 6.7 Low MED1 2.5 5.3 12.7 0.3 3.6 10.5 0.5 4.1 11.1 0.9 3.9 10.0 High MED1 0.9 2.4 5.5 0.6 2.6 6.9 0.3 2.1 5.9 0.6 2.2 5.7
Exit rate 65.2 61.4 45.5 46.4 32.6 17.3 44.2 26.9 18.2 47.7 35.7 20.6 Low MED1 66.7 56.6 46.7 34.4 32.0 18.7 31.3 26.6 18.1 42.9 34.8 22.0 High MED1 63.0 66.7 44.6 50.5 32.8 16.9 51.9 27.0 18.2 50.4 36.1 20.0
Sample size 2,287 1,708 1,727 3,060 2,174 2,269 2,301
1,622
1,673 14,893 10,913 11,310
Girls 1996-98
Average percent employed 0.7 2.4 7.3 0.6 3.6 15.7 0.5 3.2 15.4 0.6 3.3 12.4 Low MED1 1.1 4.0 7.7 0.8 3.9 16.1 0.6 4.3 16.4 0.9 4.5 14.1 High MED1 0.5 1.3 5.3 0.6 3.5 14.9 0.5 2.9 14.4 0.5 2.8 11.2
Percent employed at least 1 month 2.1 5.8 15.4 1.5 6.8 24.1 1.1 5.7 22.8 1.5 6.4 19.6 Low MED1 3.4 10.5 17.1 2.0 7.4 25.5 1.7 7.7 26.6 2.2 8.8 22.6 High MED1 1.5 3.3 12.7 1.4 6.6 22.7 0.9 5.1 20.9 1.2 5.5 17.9
Percent employed all 4 months 0.0 0.5 2.1 0.1 1.6 8.6 0.1 1.9 9.1 0.1 1.3 6.5 Low MED1 0.0 0.8 1.4 0.0 1.8 8.1 0.0 2.6 8.1 0.2 1.8 6.9 High MED1 0.0 0.1 0.8 0.1 1.5 8.2 0.1 1.6 8.7 0.1 1.1 5.8
Entry rate 0.4 1.4 3.6 0.4 1.2 4.4 0.3 1.0 3.6 0.3 1.2 3.7 Low MED1 0.7 2.8 4.6 0.5 1.3 5.1 0.6 1.5 5.2 0.5 1.8 4.6 High MED1 0.3 0.9 3.1 0.3 1.1 4.0 0.2 1.0 3.2 0.3 1.0 3.3
Exit rate 70.0 61.3 47.8 53.6 31.4 22.5 51.5 25.5 19.5 50.8 35.4 24.2 Low MED1 70.8 69.0 57.0 50.0 25.9 23.8 80.0 27.5 25.5 48.3 35.5 25.4 High MED1 70.8 66.7 57.3 53.8 33.0 22.4 46.4 25.5 18.6 52.0 36.8 24.6
Sample size 2,235 1,656 1,889 2,986 2,216 2,191 2,240
1,610
1,595 14,591 10,684 11,283
See notes to Table 1.
21
Table 3. Hours worked among employed 10- 12-, 13- to 14-, and 15- to 16-year-old boys and girls in metropolitan Salvador, São Paulo, Porto Alegre, and 6 metropolitan areas combined, 1982-84, Brazil PME
Salvador São Paulo Porto Alegre 6 Cities CombinedBoys 1982-84 10-12 13-14 15-16 10-12 13-14 15-16 10-12 13-14 15-16 10-12 13-14 15-16Average hours worked 29.0 31.8 36.3 31.6 37.5 41.0 30.3 37.8 42.7 28.4 34.8 40.2
Low MED1 29.3 31.2 36.6 32.7 37.7 42.8 30.7 38.2 43.7 28.9 35.0 40.9 High MED1 28.2 33.2 35.7 30.0 37.3 39.3 29.6 37.0 41.4 27.4 34.4 39.2 Children employed 1 month 27.3 29.6 33.4 29.0 29.6 34.8 27.5 33.8 38.4 26.0 30.9 35.2
Children employed 2 months 31.8 32.2 33.2 29.8 33.4 37.6 32.5 36.9 40.9 29.8 33.8 37.7 Children employed 3 months 27.7 33.6 37.3 33.2 36.3 40.4 32.3 39.9 41.6 30.1 36.2 39.6 Children employed 4 months 31.6 33.5 39.2 36.5 42.9 43.7 32.3 41.2 44.5 31.2 38.7 42.9
Standard deviation of hours 11.6 11.6 11.2 14.7 14.2 12.3 13.8 14.2 11.2 14.6 14.5 12.4 Low MED1 11.6 11.6 11.2 15.1 14.4 12.2 14.3 14.6 11.7 14.7 14.7 12.8 High MED1 11.4 11.6 11.1 13.9 14.0 12.2 13.1 13.5 10.3 14.3 14.2 11.8
Percent working at least 20 hours 83.8 87.8 92.5 80.2 87.3 96.2 80.6 87.6 93.4 73.7 83.4 92.8 Low MED1 85.3 86.2 92.7 80.8 86.7 95.9 80.4 88.2 95.2 74.7 83.4 92.7 High MED1 79.4 90.6 92.4 79.0 88.2 96.5 80.8 86.7 91.8 71.6 83.3 93.1
Percent working at least 40 hours 19.9 29.8 48.4 25.5 54.1 71.1 32.2 54.0 67.2 23.1 43.8 62.3 Low MED1 19.2 28.7 48.4 26.4 57.0 73.3 35.7 56.4 72.3 23.5 45.2 63.9 High MED1 20.6 30.4 47.2 24.2 49.0 68.0 27.3 51.0 62.1 22.5 41.3 59.7
Girls 1982-84
Average hours worked 29.4 38.7 37.2 32.8 41.5 42.5 32.5 40.8 43.1 33.3 40.9 42.7 Low MED1 30.3 40.5 38.7 33.8 43.3 44.2 33.2 42.5 44.7 34.8 43.0 44.7 High MED1 26.7 34.3 34.1 31.2 38.6 40.6 30.9 37.3 40.2 29.8 36.3 38.9 Children employed 1 month 26.9 36.9 34.9 30.9 35.0 39.4 30.8 39.5 39.7 31.5 38.1 38.7
Children employed 2 months 33.5 37.6 36.3 32.6 41.2 39.9 29.5 41.2 42.2 32.2 40.4 41.2 Children employed 3 months 33.4 41.9 41.0 29.3 42.0 41.3 39.5 37.9 42.4 38.0 41.7 43.3 Children employed 4 months 37.3 43.7 38.4 41.7 45.8 45.1 38.3 44.4 45.2 37.6 44.4 45.4
Standard deviation of hours 15.3 16.0 15.5 16.5 16.0 13.5 15.1 14.7 11.8 16.6 16.3 14.2 Low MED1 15.4 16.0 16.1 16.8 15.1 13.2 15.0 14.3 10.8 16.7 15.8 13.6 High MED1 15.0 15.2 13.8 16.2 17.0 13.6 15.4 15.0 12.8 15.7 16.5 14.6
Percent working at least 20 hours 81.2 87.3 89.9 79.9 92.2 95.4 76.6 88.9 92.5 79.9 89.3 92.6 Low MED1 78.2 83.7 86.7 82.9 94.1 97.3 76.7 90.2 94.0 82.6 91.4 94.5 High MED1 78.1 82.8 86.2 72.0 87.5 91.8 75.9 85.9 90.6 71.4 83.3 88.4
Percent working at least 40 hours 37.7 65.7 61.3 34.1 64.1 74.5 39.7 67.4 71.3 39.4 63.0 70.6 Low MED1 32.2 61.0 54.8 35.1 68.2 77.9 41.9 72.4 74.9 40.8 67.2 74.8 High MED1 25.0 41.4 39.0 30.0 54.2 67.4 35.2 57.0 66.0 30.9 50.3 60.5
See notes to Table 1.
22
Table 4. Hours worked among employed 10- to 12-, 13- to 14-, and 15-to 16-year-old boys and girls in metropolitan Salvador, São Paulo, Porto Alegre, and 6 metropolitan areas combined, 1996-98, Brazil PME
Salvador São Paulo Porto Alegre 6 Cities CombinedBoys 1996-98 10-12 13-14 15-16 10-12 13-14 15-16 10-12 13-14 15-16 10-12 13-14 15-16Average hours worked 30.1 31.6 34.9 35.7 34.6 37.6 30.1 35.7 39.0 29.7 34.1 37.9
Low MED1 28.9 32.8 35.8 32.2 36.0 38.8 29.8 37.4 39.6 29.4 35.1 38.4 High MED1 31.7 30.6 34.0 36.8 34.0 37.2 30.2 35.0 38.8 29.9 33.6 37.7 Children employed 1 month 29.0 31.4 33.9 36.0 33.0 35.5 31.6 34.2 36.2 29.5 32.2 35.3
Children employed 2 months 30.1 31.8 34.3 33.6 34.2 35.7 26.7 35.1 39.0 28.4 33.9 36.7 Children employed 3 months 34.2 29.8 36.1 34.4 33.6 38.5 28.5 37.9 38.9 30.2 35.3 37.9 Children employed 4 months 36.3 38.6 37.8 38.0 37.1 39.2 31.8 37.5 40.5 32.5 37.0 40.1
Standard deviation of hours 9.8 11.0 10.4 14.8 11.7 10.7 11.1 10.7 8.2 12.1 11.7 9.6 Low MED1 9.2 9.9 10.1 12.3 10.4 9.0 11.2 8.3 7.1 11.6 10.9 9.3 High MED1 10.4 11.9 10.6 15.6 12.2 11.3 11.1 11.4 8.5 12.4 12.1 9.8
Percent working at least 20 hours 93.0 88.1 94.9 83.9 92.9 97.8 90.6 92.9 93.3 82.8 89.9 95.8 Low MED1 93.8 91.7 94.7 84.2 96.3 99.2 87.5 94.8 96.4 84.5 91.3 96.1 High MED1 91.8 84.6 95.0 83.8 91.5 97.3 91.7 92.0 92.0 82.0 89.2 95.6
Percent working at least 40 hours 21.1 34.8 45.8 34.5 49.3 63.0 43.8 43.9 60.3 29.7 42.6 58.5 Low MED1 16.9 33.0 47.0 36.8 58.0 66.2 25.0 51.7 62.3 27.3 46.6 60.2 High MED1 26.5 35.9 44.6 33.8 45.8 61.7 50.0 40.6 59.5 30.9 40.5 57.6
Girls 1996-98
Average hours worked 28.2 34.2 34.4 29.5 33.2 35.6 26.8 34.5 36.4 28.8 34.2 36.3 Low MED1 26.8 35.5 35.7 39.6 37.1 38.7 30.6 35.0 38.6 31.6 36.6 38.8 High MED1 29.7 32.4 33.6 25.3 31.8 34.7 25.1 34.3 35.6 27.4 33.1 35.4 Children employed 1 month 28.3 33.2 33.4 34.5 31.6 34.4 24.8 33.1 35.8 28.5 32.2 35.1
Children employed 2 months 21.9 34.8 34.0 31.5 31.2 35.6 26.4 36.9 34.9 26.0 36.1 35.8 Children employed 3 months 38.3 37.2 36.9 19.9 34.3 33.3 30.9 32.2 35.5 30.2 35.0 35.9 Children employed 4 months 40.0 38.7 19.6 35.8 37.5 38.9 36.4 38.1 35.2 36.8 38.1
Standard deviation of hours 12.2 12.8 11.3 15.8 11.3 10.5 12.2 11.3 10.2 14.3 12.7 11.1 Low MED1 10.8 14.4 11.3 9.0 10.2 9.3 12.6 11.0 9.2 14.3 13.4 10.7 High MED1 13.6 10.1 11.3 16.2 11.4 10.7 11.9 11.5 10.4 14.1 12.2 11.1
Percent working at least 20 hours 85.1 92.7 93.0 73.3 88.7 92.9 75.0 90.0 93.1 76.7 88.4 92.6 Low MED1 95.7 86.5 93.7 84.6 88.9 93.7 100.0 95.8 96.3 87.0 90.5 94.0 High MED1 73.9 100.0 91.8 67.7 88.6 92.8 64.7 87.7 92.3 70.8 87.0 92.1
Percent working at least 40 hours 27.7 47.9 52.1 17.8 50.7 54.6 29.2 44.4 53.9 25.6 48.1 55.0 Low MED1 17.4 50.0 49.5 23.1 55.6 69.0 71.4 62.5 67.1 29.1 55.1 65.6 High MED1 34.8 35.1 44.9 12.9 49.1 48.8 11.8 36.9 48.6 22.1 43.4 49.5
See notes to Table 1.
23
Table 5. Employment rates and employment transition rates for 10- 12-, 13- to 14-, and 15- to 16-year-old boys and girls in metropolitan Salvador, São Paulo, Porto Alegre, and 6 metropolitan areas combined, 1982-84, Brazil PME. Comparing full sample to sample restricted to school months of March through November.
6 Cities Combined 6 Cities Combined 6 Cities Combined 6 Cities Combined Full Sample
1982-84 School Year
1982-84 Full Sample
1996-98 School Year
1996-98 Boys 1982-84 10-12 13-14 15-16 10-12 13-14 15-16 10-12 13-14 15-16 10-12 13-14 15-16Average percent employed 4.8 16.9 40.3 4.9 16.4 39.8 1.4 6.5 23.3 1.5 7.0 23.6
Low MED1 7.1 22.7 47.3 7.1 22.0 46.6 2.3 10.1 30.1 2.4 11.5 30.7 High MED1 2.8 11.3 33.1 2.9 10.9 32.7 1.2 5.5 21.0 1.3 5.7 21.3
Percent employed at least 1 month 9.5 27.5 54.1 9.6 26.6 53.5 3.1 12.0 34.4 3.3 12.5 34.4 Low MED1 13.7 36.4 63.8 13.7 35.3 63.1 4.7 18.0 45.0 4.9 19.5 45.5 High MED1 5.9 19.0 44.2 5.9 18.1 43.8 2.7 10.3 30.8 2.8 10.5 30.9
Percent employed all 4 months 1.5 8.1 26.5 1.5 7.9 25.8 0.4 2.5 13.7 0.5 2.9 14.3 Low MED1 2.2 11.2 30.7 2.1 10.9 29.8 0.7 4.1 17.2 0.9 5.0 18.3 High MED1 0.9 5.0 22.1 1.0 4.9 21.7 0.3 2.1 12.5 0.4 2.3 12.9
Entry rate 2.1 6.1 11.9 2.3 5.8 11.9 0.7 2.6 6.7 0.7 2.6 6.6 Low MED1 3.2 8.4 16.2 3.4 8.2 16.0 0.9 3.9 10.0 1.0 4.0 9.9 High MED1 1.3 4.1 8.5 1.3 3.9 8.6 0.6 2.2 5.7 0.7 2.2 5.7
Exit rate 39.3 26.6 15.3 38.4 26.0 15.4 47.7 35.7 20.6 43.2 33.1 19.6 Low MED1 37.4 26.1 16.0 36.8 25.3 16.0 42.9 34.8 22.0 39.6 31.7 21.3 High MED1 43.6 27.5 14.3 42.0 27.3 14.6 50.4 36.1 20.0 45.3 34.0 18.9
Sample size 21,865 14,196 13,970 11,528 7,463 7,416 14,893
10,913
11,310 7,969 5,731 5,956
Girls 1982-84
Average percent employed 2.1 9.5 23.5 2.0 10.0 23.3 0.6 3.3 12.4 0.7 3.7 12.8 Low MED1 3.0 12.9 30.8 2.8 13.3 29.8 0.9 4.5 14.1 1.1 5.6 13.7 High MED1 1.1 5.3 14.6 1.1 5.5 15.4 0.5 2.8 11.2 0.6 3.1 11.7
Percent employed at least 1 month 4.3 15.9 33.5 4.1 16.2 33.2 1.5 6.4 19.6 1.6 7.0 20.1 Low MED1 6.2 21.6 44.0 5.8 21.7 42.8 2.2 8.8 22.6 2.5 10.3 22.4 High MED1 2.3 9.4 22.1 2.3 9.5 22.8 1.2 5.5 17.9 1.3 5.9 18.5
Percent employed all 4 months 0.6 4.6 14.6 0.7 5.1 14.4 0.1 1.3 6.5 0.2 1.6 6.6 Low MED1 0.9 6.0 19.1 0.8 6.6 17.9 0.2 1.8 6.9 0.3 2.8 6.1 High MED1 0.3 2.2 8.3 0.4 2.4 9.1 0.1 1.1 5.8 0.2 1.2 6.1
Entry rate 1.0 3.3 6.3 0.9 3.3 6.2 0.3 1.2 3.7 0.3 1.3 3.7 Low MED1 1.4 4.7 9.1 1.4 4.7 8.9 0.5 1.8 4.6 0.5 1.9 4.8 High MED1 0.5 1.9 4.2 0.5 2.0 4.2 0.3 1.0 3.3 0.3 1.1 3.3
Exit rate 40.4 27.1 17.5 38.7 25.2 17.7 50.8 35.4 24.2 45.6 34.2 23.9 Low MED1 41.3 28.3 17.8 41.0 26.8 18.0 48.3 35.5 25.4 47.4 31.6 26.2 High MED1 43.5 30.0 19.7 38.8 27.8 19.7 52.0 36.8 24.6 44.5 36.5 24.1
Sample size 21,420 14,037 14,150 11,338 7,461 7,461 14,591
10,684
11,283 7,726 5,741 5,912
1 Low MED refers to children whose mothers have less than 4 years of education; high MED refers to children whose mothers have at least 4 years of education. Neither group includes children who are not sons, daughters, or relatives of the household head.
24
Figure 1. Proportion of 14-year-old and 16-year-old males and females employed, 6 metropolitan areas, 1982-99, Brazil, 3-month moving averages
0.00
0.10
0.20
0.30
0.40
0.50
0.60M
ar-8
2
Mar
-83
Mar
-84
Mar
-85
Mar
-86
Mar
-87
Mar
-88
Mar
-89
Mar
-90
Mar
-91
Mar
-92
Mar
-93
Mar
-94
Mar
-95
Mar
-96
Mar
-97
Mar
-98
Mar
-99
Males age 16
Females age 16
Males age 14
Females age 14
25
Figure 2. Proportion of 14-year-olds employed, by education of mother, 6 metropolitan areas, 1982-99, 3-month moving averages, Brazil PME
14-year-old boys
-
0.10
0.20
0.30
0.40
Mar
-82
Mar
-83
Mar
-84
Mar
-85
Mar
-86
Mar
-87
Mar
-88
Mar
-89
Mar
-90
Mar
-91
Mar
-92
Mar
-93
Mar
-94
Mar
-95
Mar
-96
Mar
-97
Mar
-98
Mar
-99
Mother's education < 4 years
Mother's education 4+ years
14-year-old girls
-
0.10
0.20
0.30
0.40
Mar
-82
Mar
-83
Mar
-84
Mar
-85
Mar
-86
Mar
-87
Mar
-88
Mar
-89
Mar
-90
Mar
-91
Mar
-92
Mar
-93
Mar
-94
Mar
-95
Mar
-96
Mar
-97
Mar
-98
Mar
-99
Mother's education < 4 years
Mother's education 4+ years
26
Figure 3. Rates of entry into and exit from employment, 14-year-old boys and girls, 6 metropolitan areas, 1982-99, 3-month moving averages, Brazil PME
Entry rates
-
0.05
0.10
0.15
0.20
Mar
-82
Mar
-83
Mar
-84
Mar
-85
Mar
-86
Mar
-87
Mar
-88
Mar
-89
Mar
-90
Mar
-91
Mar
-92
Mar
-93
Mar
-94
Mar
-95
Mar
-96
Mar
-97
Mar
-98
Mar
-99
14-yr-old boys
14-yr-old girls
Exit rates
-
0.10
0.20
0.30
0.40
0.50
0.60
Mar
-82
Mar
-83
Mar
-84
Mar
-85
Mar
-86
Mar
-87
Mar
-88
Mar
-89
Mar
-90
Mar
-91
Mar
-92
Mar
-93
Mar
-94
Mar
-95
Mar
-96
Mar
-97
Mar
-98
Mar
-99
14-yr-old boys
14-yr-old girls
27
Figure 4. Rates of entry into and exit from employment, 14-year-old boys, by mother's education, 6 metropolitan areas, 1982-99, 3-month moving averages, Brazil PME
Entry rates
-
0.05
0.10
0.15
0.20
Mar
-82
Mar
-83
Mar
-84
Mar
-85
Mar
-86
Mar
-87
Mar
-88
Mar
-89
Mar
-90
Mar
-91
Mar
-92
Mar
-93
Mar
-94
Mar
-95
Mar
-96
Mar
-97
Mar
-98
Mar
-99
Mother's education < 4 years
Mother's education 4+ years
Exit rates
-
0.10
0.20
0.30
0.40
0.50
0.60
Mar
-82
Mar
-83
Mar
-84
Mar
-85
Mar
-86
Mar
-87
Mar
-88
Mar
-89
Mar
-90
Mar
-91
Mar
-92
Mar
-93
Mar
-94
Mar
-95
Mar
-96
Mar
-97
Mar
-98
Mar
-99
Mother's education < 4 years
Mother's education 4+ years
28
Figure 5. Rates of entry into and exit from employment in Salvador, São Paulo, and Porto Alegre, 14-year-old boys, 1982-99, yearly averages, Brazil PME
Entry rates
-
0.05
0.10
0.1582 83 84 85 86 87 88 89 90 91 92 93 94 95 96 97 98 99
São Paulo
SalvadorPorto Alegre
Exit rates
-
0.10
0.20
0.30
0.40
0.50
0.60
0.70
82 83 84 85 86 87 88 89 90 91 92 93 94 95 96 97 98 99
São Paulo
Porto Alegre
Salvador
Related Documents


