Dynamics of Alaska Boreal Forest under Climate Change Jingjing Liang a, Mo Zhou a, Dave L. Verbyla b, Lianjun Zhang c, Anna L. Springsteen d, Thomas Malone b a Division of Forestry and Natural Resources, West Virginia University b School of Natural Resources and Agricultural Sciences, University of Alaska Fairbanks, c Department of Forest and Natural Resources Management, SUNY-ESF d Scenarios Network for Alaska and Arctic Planning, University of Alaska Fairbanks

Welcome message from author
This document is posted to help you gain knowledge. Please leave a comment to let me know what you think about it! Share it to your friends and learn new things together.
Transcript

Dynamics of Alaska Boreal Forest under Climate Change
Dynamics of Alaska Boreal Forest under Climate Change
Jingjing Liang a,
Mo Zhou a, Dave L. Verbyla b, Lianjun Zhang c,
Anna L. Springsteen d, Thomas Malone b
a Division of Forestry and Natural Resources, West Virginia University
b School of Natural Resources and Agricultural Sciences, University of Alaska Fairbanks,
c Department of Forest and Natural Resources Management, SUNY-ESF
d Scenarios Network for Alaska and Arctic Planning, University of Alaska Fairbanks

2
Alaska Boreal ForestAlaska Boreal Forest
• Largest forest component in the U.S. (500,000km2)
• A biome characterized by coniferous forests
• Grow under the most severe climate conditions in the world
• Forest industry is scarce, but with great potentials

3
Alaska Boreal ForestAlaska Boreal Forest
4 Major species:
• Picea glauca (white spruce)
• Picea mariana (black spruce)
• Betula neoalaskana (Alaska birch)
• Populus tremuloides (quaking aspen)

4
An Inconvenient Situation An Inconvenient Situation
• Global climate change is strengthened by human induced greenhouse gas emissions (e.g. IPCC, 2007)
• Climate change is affecting forests around the world, especially in the northern high latitudes (e.g. Serreze et al., 2000)
• Studies on the dynamics of Alaska boreal forest are sporadic and rare (Wurtz et al., 2006 )
• Forest management in the region has been conducted in the absence of a useful growth model (Alaska DNR, 2001)

5
Objectives Objectives
• Develop a spatial-explicit and climate-sensitive matrix model for ABF
• Verify model accuracy and compare it with other existing models for the region
• Apply the model to map forest dynamics under three IPCC climate change scenarios across the region

6
Forest Inventory DataForest Inventory Data
Cooperative Alaska Forest Inventory (CAFI)(Malone, Liang, and Packee, 2009)
• 1st inventory started in 1994
• New plots added on an annual basis
• Established plots remeasured with a 5-year interval
• More than 100,000 tree records from over 600 plots

7
Forest Inventory DataForest Inventory Data
Tree-level variables
D Diameter at breast height (cm) of a live tree
g Diameter increment (cm)
m Mortality rate of a live tree in a given period
Plot-level variables
R Recruitment
N Total number of trees per hectare
B Stand basal area (m2ha-1)
z Plot elevation (103m)
l Plot slope (%)
a Plot aspect
T Mean growing season temperature (°C)
P Total growth year precipitation (100mm)
λ WGS84 Longitude (°)
φ WGS84 Latitude (°)

8
Climate Projection of ABFClimate Projection of ABF
Three IPCC Scenarios (IPCC, 2001)
• A2: High emission. Independently operating and self-reliant nations, continuously increasing populations, and regionally oriented economic development
• A1B: Medium emission. A more integrated world with rapid economic growth and a balanced technological emphasis across all sources
• B1: Low Emission. Rapid adaptation of alternative energy technologies
11
12
13
14
15
16
2010 2020 2030 2040 2050 2060 2070 2080 2090 2100
Tem
per
atu
re (
°C)
A2 A1B B1
5
5.5
6
6.5
7
7.5
2010 2020 2030 2040 2050 2060 2070 2080 2090 2100
Year
Pre
cip
itat
ion
(10
0mm
)

9
Methods: Climate-Sensitive Matrix Model
T: mean summer temperature
P: growth-year precipitation
),(),(=1 tttttt PTPT RyGy
Tree growth depends largely on temperature and soil water conditions of the current year (Barnes et al. 1998. Forest Ecology
(4th ed.) )

10
Methods: Mapping Forest DynamicsMethods: Mapping Forest Dynamics
• For each pixel s:
• Initial stand conditions are obtained from USGS DEM and 2001 NLCD
• Projected dynamics of each pixel is then aggregated to map the entire region
(Liang and Zhou, 2010)
)()()()(1 sRsysGsy tt

11
Results: Climate-Induced ChangesResults: Climate-Induced Changes
% changes from the constant climate of the 397 sample plots under 3 IPCC emission scenarios
-10
-5
0
2000 2010 2020 2030 2040 2050 2060 2070 2080 2090 2100
Ste
m D
ensi
tyA2 A1B B1
-1.5
-1.0
-0.5
0.0
2000 2010 2020 2030 2040 2050 2060 2070 2080 2090 2100
Bas
al A
rea
-1
1
3
5
2000 2010 2020 2030 2040 2050 2060 2070 2080 2090 2100Year
Div
ersi
ty
B
C
A

12
Predicted 2100 ABF Vegetation under Climate ChangePredicted 2100 ABF Vegetation under Climate Change

13
Predicted ABF Basal Area Change 2000-2100Predicted ABF Basal Area Change 2000-2100

14
Predicted ABF Diversity Change 2000-2100Predicted ABF Diversity Change 2000-2100

15
Results: Model AccuracyResults: Model Accuracy
Ref: CTS Model-Liang and Zhou, 2010; Conv. Model- Liang, 2010)
birch
0
0.5
1
1.5
0 5 10 15 20 25 30 35 40
m2
/ ha
aspen
0
0.5
1
1.5
0 5 10 15 20 25 30 35 40
white spruce
0
0.5
1
1.5
0 5 10 15 20 25 30 35 40
Diameter (cm)
m2 /
ha
black spruce
0
0.1
0.2
0 5 10 15 20 25 30 35 40
Diameter (cm)
ObservedCSMatrix (A)CTS (B)Conv. (C)
RMSE(A)=1.42RMSE(B)=1.47RMSE(C)=1.66
RMSE(A)=1.36RMSE(B)=1.78RMSE(C)=1.82
RMSE(A)=2.48RMSE(B)=2.16RMSE(C)=2.72
RMSE(A)=0.33RMSE(B)=0.42RMSE(C)=0.33

16
Conclusion: Key FindingsConclusion: Key Findings
• Basal area of ABF could continue to increase due to natural succession
• Temperature-induced drought stress would hinder the increase of basal area across the region, especially in dry upland areas
• Climate change would boost stand diversity across the region through transient species redistribution

17
Conclusion: Model LimitationsConclusion: Model Limitations
• Sample range: 7-14°C. Extrapolation may be subject to bias.
• Lack of control for major disturbances

18
Acknowledgement Acknowledgement
We thank Dr. Tara M. Barrett, Dr. Joseph Buongiorno, and Dr. David Valentine for their helpful comments on this manuscript. The spatial analysis was assisted by the Scenarios Network for Arctic Planning of the University of Alaska Fairbanks.
Contact Information:
Jingjing Liang
West Virginia University
http://jingjing.liang.forestry.wvu.edu/
Tel: 304-293-1577, Email: [email protected]

19

20
Background: Forest Dynamics Modelling
Forest Matrix Model
• Superior Accuracy (Liang et al., 2005)
• Superior Applicability (Liang et al., 2006)
• Matrix model is constantly evolving
- Diversity effects (Liang et al., 2007)
- Geospatial trend (Liang and Zhou, 2010)
- Climatic effects (Liang et al., in review)
Ref: Liang et al., 2005. Canadian Journal of Forest Research 35: 2369-2382.
Liang et al., 2006. Forest Science 52(5): 579-594.
21
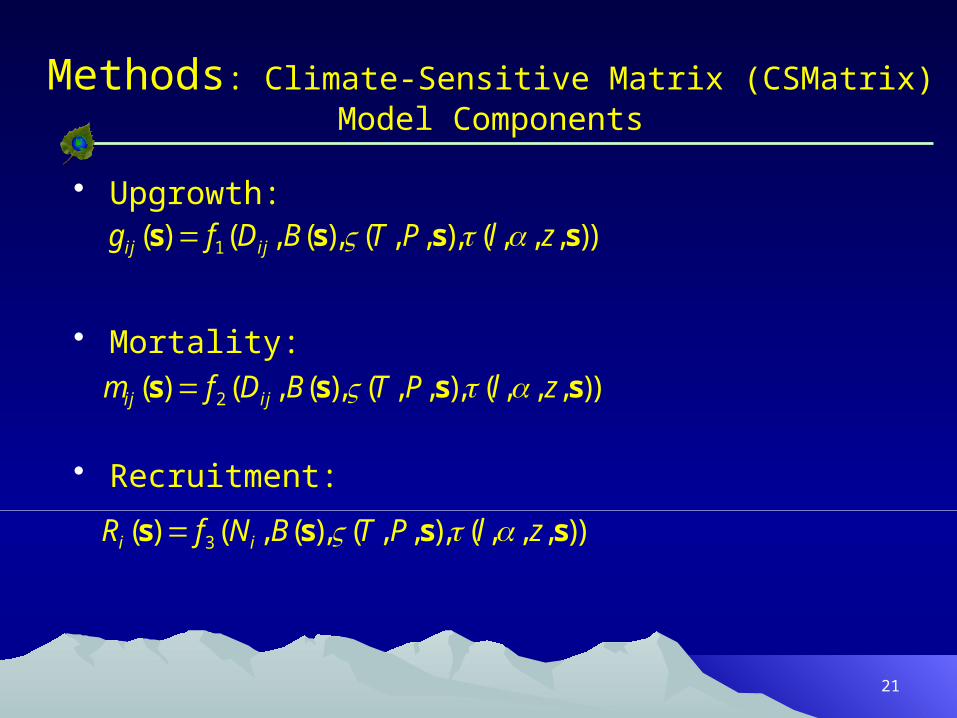
Methods: Climate-Sensitive Matrix (CSMatrix) Model Components
• Upgrowth:
• Mortality:
• Recruitment:
)),,,(),,,(),(,()( 1 ssss zlPTBDfg ijij
)),,,(),,,(),(,()( 2 ssss zlPTBDfm ijij
)),,,(),,,(),(,()( 3 ssss zlPTBNfR ii

22
Methods: Model Selection CriteriaMethods: Model Selection Criteria
• expected biological responses
• statistical significance
• contribution to the model goodness-of-fit (hierarchical partitioning, see Chevan and Sutherland, 1991)
Related Documents