International Journal of Pure and Applied Mathematics Volume 88 No. 1 2013, 125-156 ISSN: 1311-8080 (printed version); ISSN: 1314-3395 (on-line version) url: http://www.ijpam.eu doi: http://dx.doi.org/10.12732/ijpam.v88i1.10 P A ijpam.eu MATHEMATICAL MODEL FOR MALARIA TRANSMISSION DYNAMICS IN HUMAN AND MOSQUITO POPULATIONS WITH NONLINEAR FORCES OF INFECTION S. Olaniyi 1 § , O.S. Obabiyi 2 1 Department of Pure and Applied mathematics Ladoke Akintola University of Technology PMB 4000, Ogbomoso, NIGERIA 2 Department of Mathematics University of Ibadan, NIGERIA Abstract: This paper presents a seven-dimensional ordinary differential equa- tion modelling the transmission of Plasmodium falciparum malaria between hu- mans and mosquitoes with non-linear forces of infection in form of saturated in- cidence rates. These incidence rates produce antibodies in response to the pres- ence of parasite-causing malaria in both human and mosquito populations.The existence of region where the model is epidemiologically feasible is established. Stability analysis of the disease-free equilibrium is investigated via the thresh- old parameter (reproduction number R 0 ) obtained using the next generation matrix technique. The model results show that the disease-free equilibrium is asymptotically stable at threshold parameter less than unity and unstable at threshold parameter greater than unity. The existence of the unique endemic equilibrium is also determined under certain conditions. Numerical simulations are carried out to confirm the analytic results and explore the possible behavior of the formulated model. AMS Subject Classification: 92B05, 93A30 Key Words: mathematical model, malaria, force of infection, reproduction number, antibody, stability Received: August 15, 2013 c 2013 Academic Publications, Ltd. url: www.acadpubl.eu § Correspondence author

Welcome message from author
This document is posted to help you gain knowledge. Please leave a comment to let me know what you think about it! Share it to your friends and learn new things together.
Transcript

International Journal of Pure and Applied Mathematics
Volume 88 No. 1 2013, 125-156
ISSN: 1311-8080 (printed version); ISSN: 1314-3395 (on-line version)url: http://www.ijpam.eudoi: http://dx.doi.org/10.12732/ijpam.v88i1.10
PAijpam.eu
MATHEMATICAL MODEL FOR MALARIA TRANSMISSION
DYNAMICS IN HUMAN AND MOSQUITO POPULATIONS
WITH NONLINEAR FORCES OF INFECTION
S. Olaniyi1 §, O.S. Obabiyi2
1Department of Pure and Applied mathematicsLadoke Akintola University of Technology
PMB 4000, Ogbomoso, NIGERIA2Department of Mathematics
University of Ibadan, NIGERIA
Abstract: This paper presents a seven-dimensional ordinary differential equa-tion modelling the transmission of Plasmodium falciparum malaria between hu-mans and mosquitoes with non-linear forces of infection in form of saturated in-cidence rates. These incidence rates produce antibodies in response to the pres-ence of parasite-causing malaria in both human and mosquito populations.Theexistence of region where the model is epidemiologically feasible is established.Stability analysis of the disease-free equilibrium is investigated via the thresh-old parameter (reproduction number R0) obtained using the next generationmatrix technique. The model results show that the disease-free equilibrium isasymptotically stable at threshold parameter less than unity and unstable atthreshold parameter greater than unity. The existence of the unique endemicequilibrium is also determined under certain conditions. Numerical simulationsare carried out to confirm the analytic results and explore the possible behaviorof the formulated model.
AMS Subject Classification: 92B05, 93A30Key Words: mathematical model, malaria, force of infection, reproductionnumber, antibody, stability
Received: August 15, 2013 c© 2013 Academic Publications, Ltd.url: www.acadpubl.eu
§Correspondence author

126 S. Olaniyi, O.S. Obabiyi
1. Introduction
Malaria is one of the deadliest infectious diseases that has claimed million oflives around the world. Globally, 3.3 billion people or half of the world’s popu-lation in 104 countries are at the risk of getting infected by malaria disease[1]and [2]. It has been estimated that between 300 and 500 million individualsof all ages are infected annually and between 1.5 and 2.7 million people die ofmalaria every year[3].
Malaria is widely spread in tropical and subtropical regions, including Africa,Asia, Latin America, the middle East and some parts of Europe. The most casesand deaths occur in sub-Saharan Africa. In particular, thirty countries in sub-Saharan Africa account for 90% of global malaria deaths[1]. Shockingly, thedisease kills an african child every 30 seconds and over 2,000 young lives arelost daily across the globe[4] and [5]. For example, malaria accounts for 60% ofoutpatient visits and 30% of hospitalizations among children under five yearsof age in Nigeria[6].
The disease, malaria, which remains one of the most prevalent and lethal hu-man infection world wide, is caused by infection with single-celled (protozoan)parasites of genus Plasmodium and is characterized by paroxysms of chills,fever, headache, pain and vomiting. The parasites are transmitted to humansthrough the bites of infected female Anopheles mosquitoes (vectors). Of thefive parasite species (Plasmodium falciparum, Plasmodium vivax, Plasmodium
ovale, Plasmodium malariae and Plasmodium knowlesi) that cause malaria inhumans, Plasmodium falciparum is the most deadly form and it predominatesin Africa[2]. The parasite is responsible for the greatest number of deaths andclinical cases in the tropics. Its infection can lead to serious complicationsaffecting brain, lungs, kidneys and other organs[4].
Mathematical models for transmission dynamics of malaria are useful in pro-viding better insights into the behavior of the disease.The models have playedgreat roles in influencing the decision making processes regarding interventionstrategies for preventing and controlling the insurgence of malaria. The studyon malaria using mathematical modelling began in 1911 with Ronald Ross[7].He introduced the first deterministic two-dimensional model with one variablerepresenting humans and the other representing mosquitoes where it was shownthat reduction of mosquito population below a certain threshold was sufficientto eradicate malaria. In [8], the Ross’s model was modified by consideringthe latency period of the parasites in mosquitoes and their survival duringthat period. However, in this case, it was shown that reducing the number ofmosquitoes is an inefficient control strategy that would have little effect on the
MATHEMATICAL MODEL FOR MALARIA TRANSMISSION... 127
epidemiology of malaria in areas of intense transmission. Further extension wasdescribed by Anderson and May [9], where the latency of infection in humanswas introduced by making the additional exposed class in humans. This mod-ification further reduces the long term prevalence of both the infected humansand mosquitoes.
Thus, all other models that exist for malaria dynamics are developed fromthe three basic models explained earlier by incorporating different factors tomake them biologically more realistic in explaining disease prevalence and pre-diction[10]. For examples, a number of epidemiological studies [11], [12] and[13] considered the inclusion of the recovered class which incorporates a timedependent immunity developed on recovery from infection in humans. Fur-ther work on acquired immunity in malaria has been conducted by Aron [14]and Bailey [15]. Their models take into account that acquired immunity tomalaria depends on continuous exposure to reinfection. Moreover, some mod-els have integrated other factors such as: environmental effects [16], [17] and[18]; mosquito’s resistance to insecticides and resistance of some parasite strainsto anti-malaria drugs [5]
Incidence rate is of utmost importance in the transmission dynamics of thedisease, as the qualitative behavior of the disease depends on it. The incidenceof malaria infection is referred to as the number of new infected individuals(humans or mosquitoes) yielding in unit time [19]. The most commonly usedincidence rates in the formulation of models for malaria transmission are simplemass-action and standard incidences. For other forms of incidence functionsthat arise in epidemiological models, see [20] and [21].
The model presented in this work consists of four compartments in humansand three compartment in mosquitoes, with inclusions of nonlinear forces ofinfection in form of saturated incidence rates in both the host and vector pop-ulations. The disease-induced death rates for humans and mosquitoes are alsoincorporated into the the model. We study the effects of these inclusions onthe behavior of the formulated model.
The rest of this work is organized as follows: we give a full descriptionof the model and show a domain where the model is epidemiologically well-posed in Section 2. Section 3 provides the existence of equilibria includinga derivation of the basic reproduction number and stability analysis of theequilibria. In Section 4, we perform numerical simulations of the model withgraphical illustrations and give concluding remarks in Section 5.

128 S. Olaniyi, O.S. Obabiyi
2. Model Formulation
To study the transmission and spread of malaria in two interacting populationof humans (the host) and mosquitoes (the vector), we formulate a model whichsubdivides the total human population size at time t, denoted by Nh(t), intosusceptible humans Sh(t), exposed humans Eh(t), infectious humans Ih(t) andrecovered humans Rh(t). Hence, we have
Nh(t) = Sh(t) + Eh(t) + Ih(t) +Rh(t).
Unlike human population, we divide the mosquito population into threesubclasses: susceptible mosquitoes Sm(t), exposed mosquitoes Em(t) and infec-tious mosquitoes Im(t). The mosquitoes remain infectious for life and have norecovered class [22] and [23]. Thus, the total size of the mosquito populationat any time t is denoted by
Nm(t) = Sm(t) + Em(t) + Im(t).
Susceptible individuals are recruited into the human population by inputrate Λh. Using the ideas in Ibezim and Odo [24], an infectious female anophelesmosquito, Im, usually attacks susceptible human Sh(t) by piercing and suckingusing its proboscis, with which it introduces an enzyme from the saliva intohuman’s bloodstream in order to inhibit blood clotting while sucking. In theprocess, the parasite (in the form of sporozoites) is injected into the blood andthe susceptible human moves to the exposed class Eh(t). Exposed humans arethose who have parasites in them and the parasites are in asexual stages. Theyare without gametocytes and are not capable of transmitting the disease to thesusceptible mosquitoes [25].
From the blood of the exposed human, the parasite goes into the liver forcell division and multiplication before being released into the blood again asmerozoites. At this stage, the exposed human becomes infectious Ih(t). Aftersome time, the infectious human recovers and moves to the recovered classRh(t). However, the recovered human has some immunity to the disease forsome period of time and later loses the immunity to become susceptible again.Every class of human population is decreased by natural death or throughemigration except for the infectious class which has a per capital disease-induceddeath rate δh as an addition.
In a similar manner, when a susceptible mosquito Sm(t) bites an infectioushuman, the parasite (in the form of a gametocytes) enters the mosquito withsome probability, βm, and the mosquito moves from the susceptible to the

MATHEMATICAL MODEL FOR MALARIA TRANSMISSION... 129
exposed class Em(t). The exposed mosquito then becomes infectious and entersthe class Im(t) after a given time. Mosquitoes leave the population throughnatural death rate µm or through a disease-induced death rate δm.
The compartmental model which shows the mode of transmission of malariabetween the two interacting populations is depicted in the figure below: The
Figure 1: The compartmental model of malaria parasite transmissionbetween humans and mosquitoes.
state variables and parameters used for the transmission model are describedin the following tables:
Sh(t) Number of host humans susceptible to malaria infection at time t
Eh(t) Number of host humans exposed to malaria infection at time t
Ih(t) Number of infectious host humans at time t
Rh(t) Number of recovered host humans at time t
Sm(t) Number of susceptible mosquitoes at time t
Em(t) Number of exposed mosquitoes at time t
Im(t) Number of infectious mosquitoes at time t
Table 1: Description of state variables.
In what follows, we obtain a seven-dimensional system of ordinary differentialequations which describe the progress of the disease as:
dSh
dt= Λh −
bβhSh(t)Im(t)
1 + νhIm(t)− µhSh(t) + ωRh(t) (2.1)
dEh
dt=
bβhSh(t)Im(t)
1 + νhIm(t)− (αh + µh)Eh(t) (2.2)

130 S. Olaniyi, O.S. Obabiyi
Λh Recruitment term of the susceptible humansΛm Recruitment term of the susceptible mosquitoesb Bitting rate of the mosquitoβh Probability that a bite by an infectious mosquito results
in transmission of disease to humanβm Probability that a bite results in transmission
of parasite to a susceptible mosquitoµh Per capital death rate of humanµm Per capital death rate of mosquitoδh Disease-induced death rate of humanδm Disease-induced death rate of humanαh Per capital rate of progression of humans from the
exposed state to the infectious stateαm Per capital rate of progression of mosquitoes from the
exposed state to the infectious stater Per capital recovery rate for humans from the infectious state to the
recovered stateω Per capital rate of loss of immunity in humansνh Proportion of an antibody produced by human in
response to the incidence of infection caused by mosquitoνm Proportion of an antibody produced by mosquito in
response to the incidence of infection caused by human
Table 2: Description of model parameters.
dIh
dt= αhEh(t)− (r + µh + δh)Ih(t) (2.3)
dRh
dt= rIh(t)− (µh + ω)Rh(t) (2.4)
dSm
dt= Λm −
bβmSm(t)Ih(t)
1 + νmIh(t)− µmSm(t) (2.5)
dEm
dt=
bβmSm(t)Ih(t)
1 + νmIh(t)− (αm + µm)Em(t) (2.6)
dIm
dt= αmEm(t)− (µm + δm)Ih(t) (2.7)
together with the initial conditions:
Sh(0) = S0h, Eh(0) = E0h, Ih(0) = I0h, Rh(0) = R0h
Sm(0) = S0m, Em(0) = E0m, Im(0) = I0m
}
(2.8)

MATHEMATICAL MODEL FOR MALARIA TRANSMISSION... 131
The term bβhSh(t)Im(t), a bilinear incidence used in [23], refers to the rateat which the susceptible human Sh(t) gets infected by infectious mosquitoes
Im(t). In this work, we use a saturated incidence of the form bβhSh(t)Im(t)1+νhIm(t) ,
where 11+νhIm(t) denotes a saturating feature that inhibits the force of infection
from infectious mosquitoes to susceptible humans. In other words, it producesantibodies at νh ∈ [0, 1] in response to the presence of antigens (in form ofparasites) produced by infectious anopheles mosquitoes.
Moreover, bβmSm(t)Ih(t) refers to the rate at which the susceptible mosquitoesSm(t) are infected by the infectious humans Ih(t). Since mosquitoes have DNAlike humans [26], they also develop antibodies against the malaria parasites
[27]. Thus, we have a saturated force of infection of the form bβmIh(t)1+νmIh(t)
, where
νm ∈ [0, 1] is the rate at which antibodies are produced against the antigenscontacted from infectious humans.
2.1. Existence and Positivity of Solutions
Here, we provide the following results which guarantee that the malaria modelgoverned by system (2) is epidemiologically and mathematically well-posed ina feasible region D given by:
D = Dh ×Dm ⊂ R4+ × R
3+,
where
Dh = {(Sh, Eh, Ih, Rh) ∈ R4+ : Nh ≤
Λh
µh}
and
Dm = {(Sm, Em, Im) ∈ R3+ : Nh ≤
Λm
µm}.
Theorem 2.1. There exists a domainD in which the solution set {Sh, Eh, Ih,Rh, Sm, Em, Im} is contained and bounded.
Proof. Given the solution set {Sh, Eh, Ih, Rh, Sm, Em, Im} with positiveinitial conditions (2.8), we let
V1(Sh, Eh, Ih, Rh) = Sh(t) + Eh(t) + Ih(t) +Rh(t)
and
V2(Sm, Em, Im) = Sm(t) + Em(t) + Im(t).

132 S. Olaniyi, O.S. Obabiyi
Then the time derivatives V ′1 and V ′
2 , along solutions of system (2) for humansand mosquitoes respectively, are obtained by
V ′1 =
∂V1
∂Sh
dSh
dt+
∂V1
∂Eh
dEh
dt+
∂V1
∂Ih
dIh
dt+
∂V1
∂Rh
dRh
dt
and
V ′2 =
∂V2
∂Sm
dSm
dt+
∂V2
∂Em
dEm
dt+
∂V2
∂Im
dIm
dt
It follows that V ′1 ≤ Λh − µhV1 and V ′
2 ≤ Λm − µmV2. Solving the differentialinequalities yields
V1 ≤Λh
µh(1− exp(−µht)) + V1(S0h, E0h, I0h, R0h)exp(−µht)
and
V2 ≤Λm
µm(1− exp(−µmt)) + V2(S0m, E0m, I0m)exp(−µmt).
Consequently, taking the limits as t → ∞ gives V1 ≤ Λh
µhand V2 ≤ Λm
µm. Thus,
all solutions of the humans population only are confined in the feasible regionDh and all solutions of the mosquitoes population are confined in Dm. Showingthat the feasible region for the formulated model (2) exists and is given by
D =
{
(Sh, Eh, Ih, Rh, Sm, Em, Im) ∈ R7+ : Nh ≤
Λh
µh;Nm ≤
Λm
µm
}
. �
It remains to show that the solutions of system (2) are nonnegative in D forany time t > 0 since the model represents humans and mosquitoes populations.
Theorem 2.2. The solutions Sh, Eh, Ih, Rh, Sm, Em, Im of the malariamodel (2) with nonnegative initial data (2.8) in the feasible domain D, remainnonnegative in D for all t > 0.
Proof. We will carry out the proof following ideas by [23] and [28]. It iseasy to see that Sh(t) > 0 for all t ≥ 0. If not, let there exists t∗ > 0 such thatSh(t∗) = 0, S′
h(t∗) ≤ 0 and Sh, Eh, Ih, Rh, Sm, Em, Im > 0 for 0 < t < t∗. Thenfrom (2.1) of the system (2), we have
S′h(t∗) = Λh −
bβhSh(t∗)Im(t∗)1+νhIm(t∗)
− µhSh(t∗) + ωRh(t∗)
= Λh + ωRh(t∗) > 0,(2.9)
which is a contradiction. Hence Sh(t) > 0.

MATHEMATICAL MODEL FOR MALARIA TRANSMISSION... 133
Assume that there exists t∗ = sup{t > 0 : Sh, Eh, Ih, Rh, Sm, Em, Im > 0}.Then from (2.2) of the system (2) we have that
d
dt(Ehexp(αh + µh)t) =
bβhSh(t)Im(t)
1 + νhIm(t)exp(αh + µh)t. (2.10)
Integrating (2.10) from 0 to t∗ we get
Eh(t∗)exp(αh + µh)t∗ − Eh(0) =
∫ t∗
0
bβhSh(θ)Im(θ)
1 + νhIm(θ)exp(αh + µh)θdθ, (2.11)
multiplying both sides of (2.11) by exp{−(αh + µh)t∗}, gives
Eh(t∗) = Eh(0)exp{−(αh + µh)t∗}+ exp{−(αh + µh)t∗}
×∫ t∗0
bβhSh(θ)Im(θ)1+νhIm(θ) exp(αh + µh)θdθ > 0.
Hence Eh(t) > 0.Next for Ih(t), suppose t∗ > 0 ∋ Ih(t∗) = 0, and Ih(t) > 0 where t ∈ [0, t∗).
Then from (2.3) of system (2) we have
d
dt(Ihexp(r + µh + δh)t) = αhEh(t)exp(r + µh + δh)t. (2.12)
Integrating (2.12) from 0 to t∗ we obtain
Ih(t∗) = Ih(0)exp{−(r + µh + δh)t∗}+ exp{−(r + µh + δh)t∗}
×∫ t∗0 αhEh(θ)exp(r + µh + δh)θdθ > 0,
,
which contradicts Ih(t∗) = 0. Similarly for Rh(t), assume that there is somet∗ > 0 such that Ih(t∗) = 0 and Ih(t) > 0. Then integrating (2.4) of the system(2) from 0 to t∗, we see that
Rh(t∗) = Rh(0)exp{−(µh + ω)t∗}+ exp{−(µh + ω)t∗}
×∫ t∗0 rIh(θ)dθ > 0,
which contradicts Rh(t∗) = 0.Assuming further that Sm(t∗) is non-increasing and other variables are pos-
itive with Sm(t) > 0 for t ∈ [0, t∗). It follows from (2.5) that
S′m(t∗) = Λm −
bβmSm(t∗)Ih(t∗)
1 + νmIh(t∗)− µmSm(t∗) > 0,
which is a contradiction. Hence there is no such time t∗ for which Sm(t∗) = 0.

134 S. Olaniyi, O.S. Obabiyi
Likewise for Em(t), one sees from (2.6) that
d
dt(Em(t)exp(αm + µm)t) =
bβmSm(t)Ih(t)
1 + νmIh(t)exp(αm + µm)t. (2.13)
Integrating (2.13) from 0 to t∗ for some t∗ > 0 where t ∈ [0, t∗) and such thatEm(t∗) = 0, we get
Em(t∗) = Em(0)exp{−(αm + µm)t∗}+ exp{−(αm + µm)t∗}
×∫ t∗0
bβmSm(θ)Ih(θ)1+νmIh(θ)
exp(αm + µm)θdθ > 0,
showing that Em(t) > 0.
Finally, it is easy to see from (2.7) of the system (2) that
dIm
dt≥ −µmIm(t)
and
Im(t) ≥ Im(0)exp(−µmt) ≥ 0.
This completes the proof.
3. Existence and Stability of Equilibrium Points
The points at which the differential equations of the system (2) equal to zeroare referred to as equilibrium points or steady-state solutions. As shown inTheorem 2.2, it is important to note that there is no trivial equilibrium pointsas long as the recruitment terms Λh and Λm are not zero. This implies that(S∗
h, E∗h, I
∗h, R
∗h, S
∗m, E∗
m, I∗m) 6= (0, 0, 0, 0, 0, 0, 0) and the populations will not beextinct.
3.1. Existence of Disease-free Equilibrium Point
Disease-free equilibrium points are steady-state solutions where there is nomalaria infection. Thus, the disease-free equilibrium point, E0, for the malariamodel (2) implies that E∗
h = 0, I∗h = 0, R∗h = 0, E∗
m = 0, I∗m = 0 and solving
(2.1) and (2.5) yields S∗h = Λh
µhand S∗
m = Λm
µmrespectively. Thus we obtain
E0 = (Λh
µh, 0, 0, 0,
Λm
µm, 0, 0).

MATHEMATICAL MODEL FOR MALARIA TRANSMISSION... 135
3.2. Reproduction Number
An important notion in epidemiological models is the basic reproduction num-ber, usually denoted by R0. This number can be understood as the averagenumber of secondary infectious infected by an infective individual during whosewhole cause of disease in the case that all members of the population are sus-ceptible [19]. It is an important parameter that gives us whether an infectionwill spread through the population or not.
To obtain R0 for model (2), we use the next-generation matrix techniquedescribed in [29] and [30]. Let x = (Eh, Ih, Em, Im, Sh, Rh, Sm)T . Then themodel (2) can be written asdxdt
= F(x)− V(x), where
F(x) =
bβhShIm1+νhIm
0bβmSmIh1+νmIh
0000
and V(x) =
(αh + µh)Eh
(r + δh + µh)Ih − αhEh
(αm + µm)Em
(δm + µm)Im − αmEm
µhSh − Λh − ωRh
(µh + ω)Rh − rIhµmSm − Λm
.
Finding the derivatives of F and V at the disease-free equilibrium point E0
gives F and V respectively. Where
F =
0 0 0 bβhΛh
µh
0 0 0 0
0 bβmΛm
µm0 0
0 0 0 0
and
V =
αh + µh 0 0 0−αh r + µh + δh 0 00 0 αm + µm 00 0 −αm δm + µm
So that,
V−1 =
0 0 bαmβhΛh
µh(δm+µm)(αm+µm)bβhΛh
µh(δm+µm)
0 0 0 0bαhβmΛm
µm(r+δh+µh)(αh+µh)bβmΛm
µm(r+δh+µh)0 0
0 0 0 0
.

136 S. Olaniyi, O.S. Obabiyi
The basic reproduction number, R0 = ρ(FV−1), is the spectral radius of theproduct FV−1. Hence, for the model (2), we arrive at
R0 =
√
b2αhβhΛhαmβmΛm
µh(αh + µh)(r + δh + µh)µm(δm + µm)(αm + µm). (3.1)
In (3.1), αh
(αh+µh)is the probability that a human will survive the exposed state
to become infectious; 1(r+δh+µh)
is the average duration of the infectious period
of the human; αm
(αm+µm) is the probability that a mosquito will survive the
exposed state to become infectious and 1(δm+µm) is state to become infectious;
1(r+δh+µh)
is the average duration of the infectious period of the mosquito.Let the basic reproduction number,R0, be written as
R0 =√
RhRm, (3.2)
where Rh = bαhβhΛh
µh(αh+µh)(r+δh+µh)and Rm = bαmβmΛm
µm(αm+µm)(r+δm+µm) . Here, Rh de-scribes the number of humans that one infectious mosquito infects over itsexpected infection period in a completely susceptible humans population, whileRm is the number of mosquitoes infected by one infectious human during theperiod of infectiousness in a completely susceptible mosquitoes population.
3.3. Stability of the Disease-free Equilibrium Point
Using the basic reproduction number obtained for the model (2), we analyzethe stability of the equilibrium point in the following result.
Theorem 3.1. The disease-free state, E0, is locally asymptotically stableif R0 < 1 and unstable if R0 > 1.
Proof. The Jacobian matrix of the system (2) evaluated at the disease-freeequilibrium point E0, is obtained as
J(E0) =
J11 0 0 J14 0 0 J170 J22 0 0 0 0 J270 J32 J33 0 0 0 00 0 J43 J44 0 0 00 0 J53 0 J55 0 00 0 J63 0 0 J66 00 0 0 0 0 J76 J77
,
where J11 = −µh, J17 = − bβhΛh
µh, J22 = −(αh + µh), J27 = bβhΛh
µh, J32 = αh,
J33 = −(r+δh+µh), J43 = r, J44 = −(µh+ω), J53 = − bβmΛm
µm, J55 = −µm, J63 =

MATHEMATICAL MODEL FOR MALARIA TRANSMISSION... 137
bβmΛm
µm,
J66 = −(αm + µm), J76 = αm, and J77 = −(µm + δm).We need to show that all the eigenvalues of J(E0) are negative. As the firstand fifth columns contain only the diagonal terms which form the two negativeeigenvalues, −µh and −µm, the other five eigenvalues can be obtained from thesub-matrix, J1(E0), formed by excluding the first and fifth rows and columnsof J(E0). Hence we have
J1(E0) =
−(αh + µh) 0 0 0 bβhΛh
µh
αh −(r + δh + µh) 0 0 00 r −(µh + ω) 0 0
0 bβmΛm
µm0 −(αm + µm) 0
0 0 0 αm −(µm + δm)
.
In the same way, the third column of J1(E0) contains only the diagonal termwhich forms a negative eigenvalue, −(µh + ω). The remaining four eigenvaluesare obtained from the sub-matrix
J2(E0) =
−(αh + µh) 0 0 bβhΛh
µh
αh −(r + δh + µh) 0 0
0 bβmΛm
µm−(αm + µm) 0
0 0 αm −(µm + δm)
.
The eigenvalues of the matrix J2(E0) are the roots of the characteristic equation
(λ+αh+µh)(λ+r+δh+µh)(λ+αm+µm)(λ+µm+δm)−b2αhβhΛhαmβmΛm
µhµm= 0.
(3.3)If we let B1 = αh + µh, B2 = r + δh + µh, B3 = αm + µm, and B4 = µm + δm,
then (3.3) becomes
A4λ4 +A3λ
3 +A2λ2 +A1λ+A0 = 0, (3.4)
whereA4 = 1A3 = B1 +B2 +B3 +B4
A2 = (B1 +B2)(B3 +B4) +B1B2 +B3B4
A1 = (B1 +B2)B3B4 + (B3 +B4)B1B2
A0 = B1B2B3B4 −b2αhβhΛhαmβmΛm
µhµm
. (3.5)

138 S. Olaniyi, O.S. Obabiyi
Further manipulation of A0 in terms of the reproduction number, R0, yields
A0 = B1B2B3B4(1−R20). (3.6)
We employ the Routh-Hurwitz criterion, see [31] and [32], which statesthat all roots of the polynomial (3.4) have negative real parts if and only ifthe coefficients Ai are positive and matrices Hi > 0, for i = 0, 1, 2, 3, 4. From(3.5), it is easy to see that A1 > 0, A2 > 0, A3 > 0, A4 > 0, since all B′
is
are positive. Moreover, if R0 < 1, it follows from (3.6) that A0 > 0. Alsothe Hurwitz matrices for the polynomial (3.4) are found to be positive. That
is, H1 = A3 > 0,H2 =
∣
∣
∣
∣
A3 A4
A1 A2
∣
∣
∣
∣
> 0,H3 =
∣
∣
∣
∣
∣
∣
A3 A4 0A1 A2 A3
0 A0 A1
∣
∣
∣
∣
∣
∣
> 0, and
H4 =
∣
∣
∣
∣
∣
∣
∣
∣
A3 A4 0 0A1 A2 A3 A4
0 A0 A1 A2
0 0 0 A0
∣
∣
∣
∣
∣
∣
∣
∣
> 0.
Therefore, all the eigenvalues of the Jacobian matrix J(E0) have negative realparts when R0 < 1 and the disease-free equilibrium point is locally asymptoti-cally stable.
However, when R0 > 1, we see that A0 < 0 and by Descartes’rule of signs[32], there is exactly one sign change in the sequence, A4, A3, A2, A1, A0, ofcoefficients of the polynomial (3.4). So, there is one eigenvalue with positivereal part and the disease-free equilibrium point is unstable.
3.4. Existence of Endemic Equilibrium Point
Besides the disease-free equilibrium point, we shall show that the formulatedmodel (2) has an endemic equilibrium point, Ee. The endemic equilibrium pointis a positive steady state solution where the disease persists in the population.
Theorem 3.2. The malaria model (2) has no endemic equilibrium whenR0 < 1 and a unique endemic equilibrium exists when R0 > 1.
Proof. Let Ee = (S∗∗h , E∗∗
h , I∗∗h , R∗∗h , S∗∗
m , E∗∗m , I∗∗m ) be a nontrivial equilib-
rium of the model (2); i.e., all components of Ee are positive. If we set all the

MATHEMATICAL MODEL FOR MALARIA TRANSMISSION... 139
differential equations in (2) to zero, we get
S∗∗h =
((αm+µm)(µm+δm)bβm+νhRm)ΛhI∗∗
h+Λh
µhR20
,
E∗∗h =
(r+δh+µh)I∗∗
h
αh,
R∗∗h =
rI∗∗h
µh+ω,
S∗∗m = Λm
bβmI∗∗h
1+νmI∗∗h
+µm
,
E∗∗m =
bβmS∗∗
m I∗∗h
(1+νmI∗∗h
)(αm+µm) ,
I∗∗m =RmI∗∗
h
1+((αm+µm)(µm+δm)bβm+νm)I∗∗h
,
(3.7)
and I∗∗h is a positive solution of a equation given by
C1(I∗∗h )2 + C2I
∗∗h + C3 = 0, (3.8)
with
C1 = ΛhΦ(µh + ω)(bβhRm + µhΦ− ωrµhR20Φ),
C2 = Λh(µh + ω)(2µhΦ+ bβhRm − µhΦR20)− ωrµhR
20Φ,
C3 = Λhµh(µh + ω)(1−R20),
where Φ = (αm + µm)(µm + δm)bβm + νm + νhRm. For C1 > 0 and C2 > 0,when R0 < 1, one sees that C3 > 0. Then model (2) has no positive solution.However, when R0 > 1, then C3 < 0 and endemic equilibrium exists. Thiscompletes the proof.
Numerical simulations in the next section also confirm the existence of anendemic equilibrium and its stability when R0 > 1.
4. Numerical Results and Discussion
Here, we study numerically the behavior of the system (2) using some of theparameter values compatible with malaria [5], [23] and [33] as given in Table3 and by considering initial conditions, Sh(0) = 100, Eh(0) = 20, Ih(0) =10, Rh(0) = 0, Sm(0) = 1000, Em(0) = 20, Im(0) = 30.
The numerical simulations are conducted using Maple and the results aregiven in Figures 2-16 to illustrate the system’s behavior for different values ofmodel’s parameters. Figures 2, 3, 4 and 5 show the varrying effects of theproportion of antibody on human population while keeping the remaining pa-rameters in Table 3 unchanged and the reproduction number is less than unity.In particular, Figure 2 shows the behavior of the susceptible human population

140 S. Olaniyi, O.S. Obabiyi
Parameters Values
Λh 0.000215Λm 0.07b 0.12βh 0.1βm 0.09µh 0.0000548µm 1/15δh 0.001δm 0.01αh 1/17αm 1/18r 0.05ω 1/730
Table 3: Model parameters and values used in simulation.
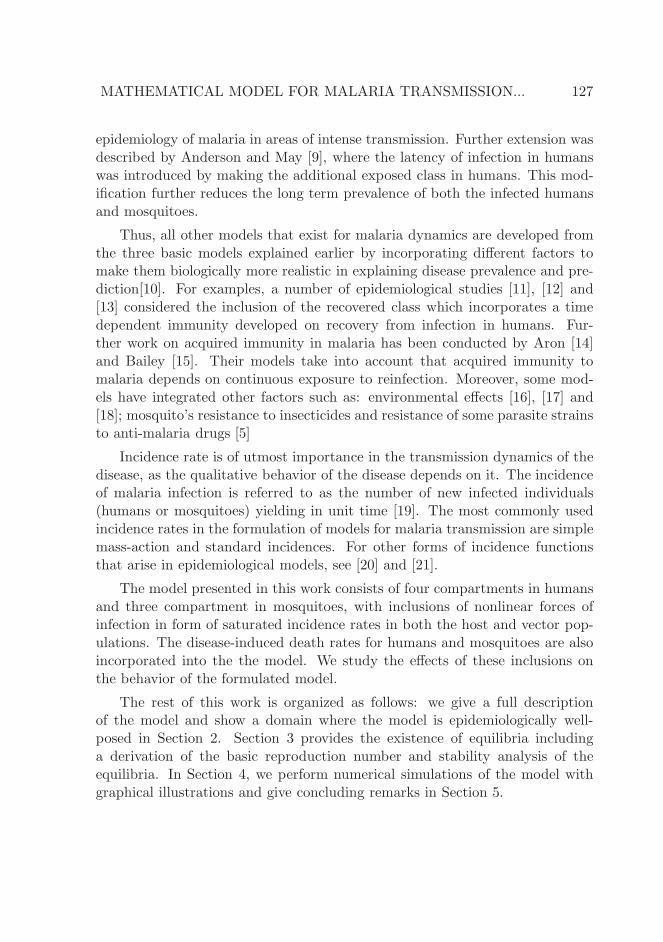
as the antibody, νh, increases in proportion. We observe that the susceptiblehuman population drops as a result of infection by infectious mosquito and laterstabilizes when the human develops an antibody against the parasite-causingmalaria. An increase in the proportion of the antibody reduces the sharp de-crease in the susceptible human population. The magnitudes of the exposedand infectious human populations in Figures 3 and 4 respectively, decreasewith increased presence of antibody. Thus, the decreased number of infectioushuman population contributes to the increase in the number of recovered hu-man in Figure 5, which in turn influences the reduction in the sharp decreaseexperienced by susceptible human population.
Similarly, Figures 6, 7 and 8 depict the varring effects of the proportion ofantibody, νm, produced against parasite, on mosquito populations. As seen inFigure 6, the number of susceptible mosquito decreases with time since there isno recovered class for mosquito population. However, increasing the proportionof antibody, νm, inhibits the reduction in the number of susceptible mosquito.Also, in Figures 7 and 8, the number of the exposed and infectious mosquitopopulations decreases due to increase in resistance to the malaria parasite.Figures 9-12 assess the impact of the antibody produced by susceptible humanin response to the presence of the parasite, when the reproduction number isgreater than unity with an increased number of mosquito’s biting rate, b. Wesee that increasing the proportion of the antibody with the biting rate, has lowereffect in reducing the burden of the endemic malaria infection when compared
MATHEMATICAL MODEL FOR MALARIA TRANSMISSION... 141
Figure 2: The behavior of susceptible human for different values of νhwhen R0 < 1 and b = 0.12.
with Figures 2 to 5.
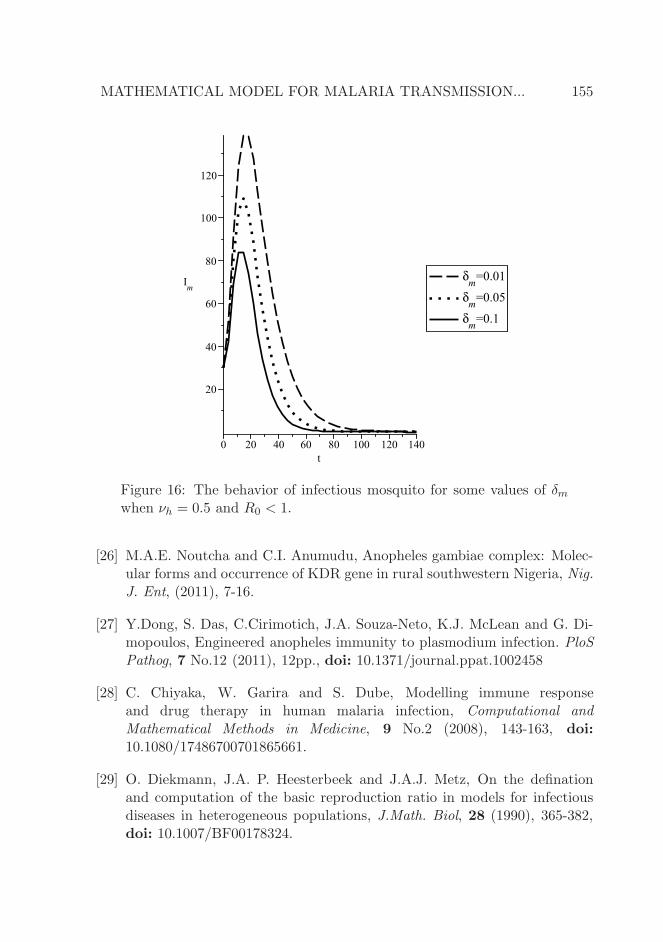
Figure 13 illustrates the effect of the mosquito’s resistance to the endemicdisease on infectious mosquito population when the human-mosquito contactrate, b, is increased. We notice that the number of infectious mosquito decreasesslowly with increased propportion of antibody, νm. This observation can be seenclearly when compared with Figure 8, as the number of infectious mosquitodecreases faster with increased propportion of antibody, νm in Figure 8.
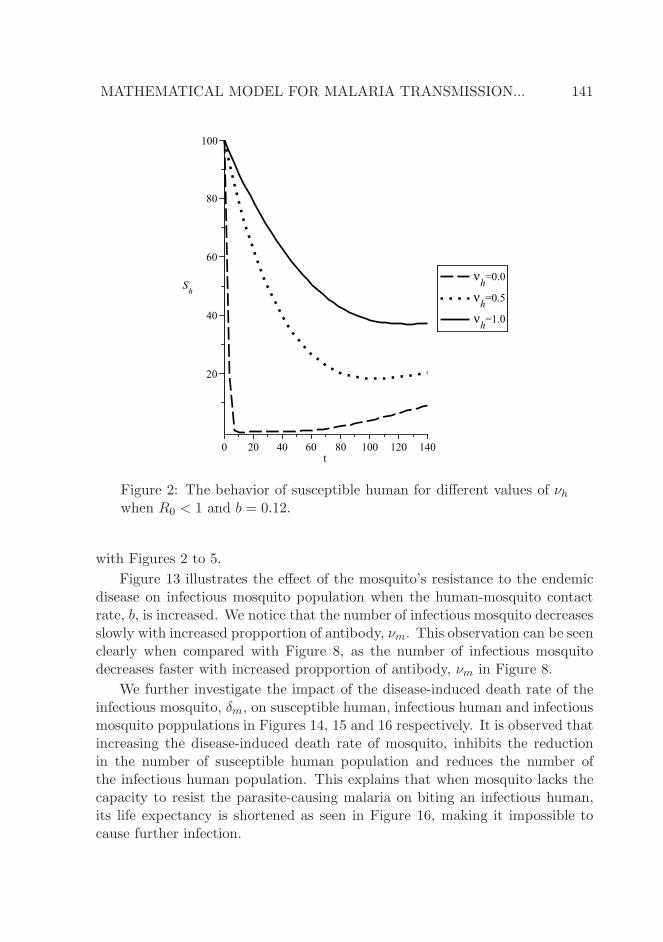
We further investigate the impact of the disease-induced death rate of theinfectious mosquito, δm, on susceptible human, infectious human and infectiousmosquito poppulations in Figures 14, 15 and 16 respectively. It is observed thatincreasing the disease-induced death rate of mosquito, inhibits the reductionin the number of susceptible human population and reduces the number ofthe infectious human population. This explains that when mosquito lacks thecapacity to resist the parasite-causing malaria on biting an infectious human,its life expectancy is shortened as seen in Figure 16, making it impossible tocause further infection.

142 S. Olaniyi, O.S. Obabiyi
Figure 3: The behavior of exposed human for different values of νhwhen R0 < 1 and b = 0.12.
5. Concluding Remarks
In this paper, we have formulated and analysed a compartmental model formalaria transmission in human and mosquito populations with non-linear forcesof infection. The human population was divided into four compartments: sus-ceptible, exposed, infectious and recovered, while the mosquito population wasdivided into three compartments: susceptible, exposed and infectious; sincemosquitoes remain infectious for life and have no recovered class. The non-linear forces of infection in the formulated model present saturated incidencerates unlike the most commonly used simple mass-action and standard inci-dence rates. We established a region where the model is epidemiologically fea-sible and mathematically well-posed. The existence of a disease-free equilibriumpoint was shown.
Moreover, we employed the next generation matrix technique to obtain anexplicit formula for a reproduction number, R0, which is the expected numberof secondary cases (in humans or mosquitoes) produced by a typical infectious

MATHEMATICAL MODEL FOR MALARIA TRANSMISSION... 143
Figure 4: The behavior of infectious human for different values of νhwhen R0 < 1 and b = 0.12.
individual (mosquito or human) during its entire period of infectiousness ina completely susceptible population. This number, R0, represents a thresh-old parameter for the model. We proved that the disease-free equilibrium isasymptotically stable at threshold parameter less than unity and unstable atthreshold parameter greater than unity. We further showed that a unique en-demic equilibrium point exists when R0 > 1.
When an antigen, a foreign substance in form of malaria parasite, invadesthe body, several types of cells work together to recognize and respond to it.These cells produce antibodies; which are a primary form of immune responsein resistance to parasite-causing malaria, and act by attaching themselves tothe parasite in order to weaken or destroy it. We showed that both human andmosquito develop antibodies through saturated incidence rates. The numericalsimulations were performed to see the effects of the proportions of antibodiesproduced by both populations and other key parameters on the spread of thedisease. Our results showed that increasing the proportions of antibodies hassignificant effect in reducing the transmission of the malaria infection. However,

144 S. Olaniyi, O.S. Obabiyi
Figure 5: The behavior of recovered human for different values of νhwhen R0 < 1 and b = 0.12.
with increased mosquito biting rate, increasing the proportions of antibodieshas lower effect in reducing the burden of malaria. We also revealed that anincrease in the number of disease-induced death rate of the mosquito reducesthe number of infectious human.
In view of the above, humans need to boost their antibodies production tobe able to subdue the invasion of parasites in the bloodstream. The immunitystate of the individual, that is, the general health and nutritional status of theinfected individual, is a factor for preventing or aiding the occurrence of malaria.Thus, leading a healthy lifestyle and eating right foods can help boost the levelof antibodies in humans. It is also important to note that reducing human-mosquito contact rate plays a big role in inhibiting the prevalence of malaria.Hence, we can achieve a malaria-free state by scaling down mosquito bitingrate through; the regular indoor residual spraying with insecticides, the use ofinsecticide-treated bednets, closing of doors and windows against mosquitoes,clearing of stagnant water and drainages, and the use of mosquito repellantlotions, which are all regarded as vector control measures.

MATHEMATICAL MODEL FOR MALARIA TRANSMISSION... 145
Figure 6: The behavior of susceptible mosquito for some values of νmwhen R0 < 1 and b = 0.12.
Finally, Prophylaxis and chemotherapy have also been found to be very use-ful in preventing the occurrence of malaria and treating malaria attack respec-tively by the use of drugs. However, efforts should be intensified in developingmalaria vaccine as this would facilitate the stimulation of the immune systemin producing antibodies against malaria.
6. Acknowledgments
The authors thank the anonymous referees whose comments led to an improvedpaper. S.Olaniyi gratefully acknowledges TETFUND AST&D via LAUTECH.

146 S. Olaniyi, O.S. Obabiyi
Figure 7: The behavior of exposed mosquito for different values of νmwhen R0 < 1 and b = 0.12.

MATHEMATICAL MODEL FOR MALARIA TRANSMISSION... 147
Figure 8: The behavior of infectious mosquito for different values of νmwhen R0 < 1 and b = 0.12.

148 S. Olaniyi, O.S. Obabiyi
Figure 9: The behavior of susceptible human for different values of νhwhen R0 > 1 and b = 3.

MATHEMATICAL MODEL FOR MALARIA TRANSMISSION... 149
Figure 10: The behavior of exposed human for different values of νhwhen R0 > 1 and b = 3.

150 S. Olaniyi, O.S. Obabiyi
Figure 11: The behavior of infectious human for different values of νhwhen R0 > 1 and b = 3.
References
[1] World Health Organization, World malaria report, WHO Press, Switzer-land (2012).
[2] World Health Organization, 10 facts on malaria, WHO Online (2011).
[3] G. Magombedze, C. Chiyaka and Z. Mukandavire, Optimal control ofmalaria chemotherapy, Nonlinear Analysis: Modelling and Control, 16
No.4 (2011), 415-434.
[4] J. Tumwiine, J.Y.T. Mugisha and L.S. Luboobi, A mathematical modelfor the dynamics of malaria in a human host and mosquito vector withtemporary immunity, Applied Mathematics and Computation, 189 (2007),1953-1965, doi: 10.1016/j.amc.2006.12.084.
[5] K. O. Okosun and O. D. Makinde, Modelling the impact of drug resis-tance in malaria transmission and its optimal control analysis, Interna-

MATHEMATICAL MODEL FOR MALARIA TRANSMISSION... 151
Figure 12: The behavior of recovered human for different values of νhwhen R0 > 1 and b = 3.
tional Journal of the Physical Sciences, 6 No.28, (2011) 6479-6487, doi:10.5897/IJPS10.542.
[6] United States Embassy in Nigeria, Nigeria malaria fact sheet, A publica-tion of Economic Section of US Embassy, Abuja, Nigeria (2011).
[7] R. Ross, The prevention of malaria, John Murray, London (1911).
[8] G. Macdonald, The epidemiology and control of malaria, Oxford UniversityPress, London (1957).
[9] R.M. Anderson and R.M. May, Infectious diseases of humans: dynamics
and control, Oxford University Press, London (1991).
[10] S. Mandal, R.R Sarkar and S. Sinha, Mathematical models of malaria - areview, Malaria Journal, 10 (2011), 202, doi: 10.1186/1475-2875-10-202.
[11] K. Dietz, L. Molineaux, A. Thomas, A malaria model tested in the Africansavannah, Bull World Health Organ, 50 (1974), 347-357.

152 S. Olaniyi, O.S. Obabiyi
Figure 13: The behavior of infectious mosquito for different values ofνm when R0 > 1 and b = 3.
[12] J.L. Aron and R.M. May, The population dynamics of malaria, In Popula-
tion Dynamics of Infectious Disease, Chapman and Hall (1982), 139-179.
[13] G.A. Ngwa and W.S. Shu, A mathematical model for endemic malariawith variable human and mosquito populations, Math Comput Model, 32(2000), 747-763, doi: 10.1016/S0895-7177(00)00169-2.
[14] J.L. Aron, Mathematical modeling of immunity to malaria, Math Bios.,90 (1988), 385-396, doi: 10.1016/0025-5564(88)90076-4.
[15] N.T.J. Bailey, The Biomathematics of malaria, Charles Griffin and Co Ltd,London (1982).
[16] J. Li, R.M. Welch, U.S. Nair, T.L. Sever, D.E. Irwin, C. Cordon-Rosales,N. Padilla, Dynamic Malaria Models with Environmental Changes, Pro-ceedings of the Thirty- Fourth Southeastern Symposium on System Theory
Huntsville, AL, ( 2002), 396-400.

MATHEMATICAL MODEL FOR MALARIA TRANSMISSION... 153
Figure 14: The behavior of susceptible human for different values of δmwhen νh = 0.5 and R0 < 1.
[17] H.M. Yang, Malaria transmission model for different levels of acquired im-munity and temperature-dependent parameters (vector), Revista de Saude
Publica 34 (2000), 223-231, doi: 10.10.1590/S0034-89102000000300003.
[18] H.M. Yang and M.U. Ferreira, Assessing the effects of global warm-ing and local social and economic conditions on the malaria transmis-sion. Revista de Saude Publica, 34 (2000), 214-222, doi: 10.1590/S0034-89102000000300002.
[19] M. Zhien, Z. Yicang and W. Jianhong, Modeling and Dynamics of Infec-
tious disease, World Scientific Publishing Co Pte Ltd. Singapore (2009).
[20] L. Dan and X. Zhiongyi, On the study of an SEIV epidemic model concern-ing vaccination and vertical transmission, Journal of Applied Mathematics
and Bioinformatics, 1 No.1 (2011), 21-30.
[21] S. Ruoyan and S. Junping, Global stability of multigroup epidemic model

154 S. Olaniyi, O.S. Obabiyi
Figure 15: The behavior of infectious human for different values of δmwhen νh = 0.5 and R0 < 1.
with group mixing and nonlinear incidence rates, Appl Math and Comp,218 (2011), 280-286, doi: 10.1016/j.amc.2011.05.056.
[22] N. Chitnis, J. M. Hyman and C.A. Manore, Modelling vertical transmissionin vector-borne diseases with applications to Rift Valley fever, Journal ofBiological Dynamics, 7 (2013), 11-40, doi: 10.1080/17513756.2012.733427.
[23] A.A. Lashari, S. Aly, K. Hattaf, G. Zaman, I.H. Jung, and and X. Li, Pre-sentation of Malaria Epidemics Using Multiple Optimal Controls, Journalof Applied Mathematics, (2012), 17 pp., doi: 10.1155/2012/946504.
[24] E.C. Ibezim and U. odo, Current trends in malarial chemotherapy, AfricanJournal of Biotechnology, 7 No.4 (2008), 349-356.
[25] J. Labadin, C. Kon M.L. and S.F.S. Juan, Deterministic malaria transmis-sion model with acquired immunity, Proceedings of the wolrd congress on
engineering and computer science, II (2009), 1-6.
MATHEMATICAL MODEL FOR MALARIA TRANSMISSION... 155
Figure 16: The behavior of infectious mosquito for some values of δmwhen νh = 0.5 and R0 < 1.
[26] M.A.E. Noutcha and C.I. Anumudu, Anopheles gambiae complex: Molec-ular forms and occurrence of KDR gene in rural southwestern Nigeria, Nig.J. Ent, (2011), 7-16.
[27] Y.Dong, S. Das, C.Cirimotich, J.A. Souza-Neto, K.J. McLean and G. Di-mopoulos, Engineered anopheles immunity to plasmodium infection. PloSPathog, 7 No.12 (2011), 12pp., doi: 10.1371/journal.ppat.1002458
[28] C. Chiyaka, W. Garira and S. Dube, Modelling immune responseand drug therapy in human malaria infection, Computational and
Mathematical Methods in Medicine, 9 No.2 (2008), 143-163, doi:
10.1080/17486700701865661.
[29] O. Diekmann, J.A. P. Heesterbeek and J.A.J. Metz, On the definationand computation of the basic reproduction ratio in models for infectiousdiseases in heterogeneous populations, J.Math. Biol, 28 (1990), 365-382,doi: 10.1007/BF00178324.

156 S. Olaniyi, O.S. Obabiyi
[30] P. Van den Driessche and J. Watmough, Reproduction numbers and sub-threshold endemic equilibria for compartmental models of disease transmis-sion, Math. Bios, 180 (2002), 29-48, doi: 10.1016/S0025-5564(02)00108-6.
[31] J.D. Murray, Mathematical Biology I, An introduction, 3rd Ed. Springer-Verlag Berlin Heidelberg, (2001).
[32] A.D. Polyanin and A.V. Manzhirov, Handbook of mathematics for engi-
neers and scientists, Chapman and Hall/CRC, Taylor and Francis Group(2007).
[33] K. Blayneh, Y. Cao and H. Kwon, Optimal control of vector-borne diseases:treatment and prevention, Discrete and Continuous Dynamical Sys. Series
B, 11 No.3 (2009), 587-611, doi: 10.3934/dcdsb.2009.11.587.
Related Documents