Dynamic thermal decomposition of blends of polyamide 6 with functionalized and non-functionalized PP Jeanette Gonza´lez a , Carmen Albano b, *, Rosalba Sciamanna b , Miren Ichazo a , Carmen Rosales a , Jose Martı ´ nez a , Marı ´ a Candal a a Universidad Simo ´n Bolı´var, Departamento de Meca ´nica, Apartado 89000, Caracas 1080-A, Venezuela b Universidad Central de Venezuela, Facultad de Ingenierı´a, Escuela de Ingenierı´a Quı´mica, PO Box 48146, Caracas 1041-A, Venezuela Received 14 June 1999; accepted 11 August 1999 Abstract The processes of thermal degradation taking place in polyamide 6 (PA6) blends with functionalized (PP1-g-DEM) and non- functionalized polypropylene (PP2) have been studied by thermogravimetric analysis. Coats–Redfern, Van Krevelen and Horowitz– Metzger integral methods were used to determine kinetic parameters. It was observed that the starting temperature of the decom- position of the blends decreases from 380 to 340 C when increasing the concentration of functionalized polypropylene. When non- functionalized polypropylene is used, the decrease is from 360 to 300 C. On the other hand, although the activation energy of the functionalized polypropylene is smaller than that of the non-functionalized, it was demonstrated that the thermal stability is bigger for the mixtures of PA6 with PP1-g-DEM, the latter being at 30 wt% composition of PP. Also, the use of functionalized poly- propylene in the blends with polyamide evidences a better dispersion and a smaller particle size; this behavior positively influences the thermal stability of these blends. # 2000 Elsevier Science Ltd. All rights reserved. 1. Introduction Multicomponent polymer materials are frequently made by blending two or more miscible or inmiscible polymers. It is very dicult to obtain good dispersion in polymer blends whose components are insoluble in each other, particularly for combinations of polar polymers with non-polar polymers. Due to their dierence of polarities, the system usually separates into two distinct phases. The major components form a matrix and the minor components form domains, whose size and shape greatly depend upon several factors, such as melt viscosity of components, interfacial tension and adhesion, proces- sing condition, and so on. The final properties of these blends are strongly aected by the volume fraction of the two components, the size and shape of domains, and the interfacial tension and adhesion between the two phases. Nylon is one of the most used polymers for engineer- ing applications, but a number of deficiencies, e.g. brit- tleness, high moisture sorption, poor dimensional stability, and marginal heat deflection temperature, limit some applications [1]. To improve these defi- ciencies, nylon is blended with other plastics; in parti- cular, most of the studies are relative to blends with polyolefins [1,2], rubbers [3,4], and some others [5,6]. However, these blends quite often have mechanical prop- erties which are poorer than those of their components, and therefore their applications are limited. The reason for this is the unfavorable interaction between molecular segments of the components, which leads to a large interfacial tension in the melt; also, the dispersion of the components during mixing is dicult [7]. A solution to these shortcomings may be found by adding functionalized polymeric components, which gen- erally modify the interfacial interactions [8,9]. Nylons present an inherent chemical functionality through the amine or carboxyl end groups and, potentially, the amide linkage. The typical functional group grafted on poly- propylene (PP) that interacts with nylon is maleic anhy- dride. The corresponding blends show significant improvements in the mechanical properties, in particular, the elongation at break and the impact resistance [10,11]. However, investigations on the thermal stability of these mixtures have not been carried out exhaustively, and this is a study of importance to determine if the 0141-3910/00/$ - see front matter # 2000 Elsevier Science Ltd. All rights reserved. PII: S0141-3910(99)00160-3 Polymer Degradation and Stability 68 (2000) 9–19 * Corresponding author. Tel.: +58-2-605-3175; fax: +58-2-605-3178. E-mail address: [email protected] (C. Albano).

Welcome message from author
This document is posted to help you gain knowledge. Please leave a comment to let me know what you think about it! Share it to your friends and learn new things together.
Transcript
Dynamic thermal decomposition of blends of polyamide 6 withfunctionalized and non-functionalized PP
Jeanette Gonza leza, Carmen Albanob,*, Rosalba Sciamannab, Miren Ichazoa,Carmen Rosalesa, Jose Martõ neza, Marõ a Candala
aUniversidad SimoÂn BolõÂvar, Departamento de MecaÂnica, Apartado 89000, Caracas 1080-A, VenezuelabUniversidad Central de Venezuela, Facultad de IngenierõÂa, Escuela de IngenierõÂa QuõÂmica, PO Box 48146, Caracas 1041-A, Venezuela
Received 14 June 1999; accepted 11 August 1999
Abstract
The processes of thermal degradation taking place in polyamide 6 (PA6) blends with functionalized (PP1-g-DEM) and non-functionalized polypropylene (PP2) have been studied by thermogravimetric analysis. Coats±Redfern, Van Krevelen and Horowitz±Metzger integral methods were used to determine kinetic parameters. It was observed that the starting temperature of the decom-
position of the blends decreases from 380 to 340�C when increasing the concentration of functionalized polypropylene. When non-functionalized polypropylene is used, the decrease is from 360 to 300�C. On the other hand, although the activation energy of thefunctionalized polypropylene is smaller than that of the non-functionalized, it was demonstrated that the thermal stability is bigger
for the mixtures of PA6 with PP1-g-DEM, the latter being at 30 wt% composition of PP. Also, the use of functionalized poly-propylene in the blends with polyamide evidences a better dispersion and a smaller particle size; this behavior positively in¯uencesthe thermal stability of these blends. # 2000 Elsevier Science Ltd. All rights reserved.
1. Introduction
Multicomponent polymer materials are frequentlymade by blending two or more miscible or inmisciblepolymers. It is very di�cult to obtain good dispersion inpolymer blends whose components are insoluble in eachother, particularly for combinations of polar polymerswith non-polar polymers. Due to their di�erence ofpolarities, the system usually separates into two distinctphases. The major components form a matrix and theminor components form domains, whose size and shapegreatly depend upon several factors, such as melt viscosityof components, interfacial tension and adhesion, proces-sing condition, and so on. The ®nal properties of theseblends are strongly a�ected by the volume fraction of thetwo components, the size and shape of domains, and theinterfacial tension and adhesion between the two phases.Nylon is one of the most used polymers for engineer-
ing applications, but a number of de®ciencies, e.g. brit-tleness, high moisture sorption, poor dimensionalstability, and marginal heat de¯ection temperature,
limit some applications [1]. To improve these de®-ciencies, nylon is blended with other plastics; in parti-cular, most of the studies are relative to blends withpolyole®ns [1,2], rubbers [3,4], and some others [5,6].However, these blends quite often have mechanical prop-erties which are poorer than those of their components,and therefore their applications are limited.The reason for this is the unfavorable interaction
between molecular segments of the components, whichleads to a large interfacial tension in the melt; also, thedispersion of the components during mixing is di�cult [7].A solution to these shortcomings may be found by
adding functionalized polymeric components, which gen-erally modify the interfacial interactions [8,9]. Nylonspresent an inherent chemical functionality through theamine or carboxyl end groups and, potentially, the amidelinkage. The typical functional group grafted on poly-propylene (PP) that interacts with nylon is maleic anhy-dride. The corresponding blends show signi®cantimprovements in the mechanical properties, in particular,the elongation at break and the impact resistance [10,11].However, investigations on the thermal stability of
these mixtures have not been carried out exhaustively,and this is a study of importance to determine if the
0141-3910/00/$ - see front matter # 2000 Elsevier Science Ltd. All rights reserved.
PI I : S0141-3910(99 )00160-3
Polymer Degradation and Stability 68 (2000) 9±19
* Corresponding author. Tel.: +58-2-605-3175; fax: +58-2-605-3178.
E-mail address: [email protected] (C. Albano).
processing conditions accelerate the decomposition andto analyze the useful lifetime of these materials. On theother hand, it is interesting to study the e�ect of thefunctionalization, using diethylmaleate and dicumylperoxide, on the thermal stabilization of the PP.Consequently, this work aims at studying kinetic
parameters of a blend of PA6 with non-functionalizedPP and PP functionalized with diethylmaleate anddicumyl peroxide, in di�erent blend ratios. To this end,dynamic thermograms were obtained for each blend toapply di�erent methods (Coats±Redfern[12], Van Kre-velen [13,14], Horowitz±Metzger [15]) for determiningactivation energy and reaction order.
2. Theoretical background
The decomposition reactions of solids are hetero-geneous reactions, therefore in the kinetic analysis phe-nomena such as chemical reaction, heat and masstransfer, and the physical changes of the solid should betaken into account.In particular, it is known that polymer degradation is
a very complex phenomenon, composed of several ele-mentary reactions that are di�cult to analyze separatelyand whose quantitative contribution to the global processof degradation is virtually impossible to evaluate. For thisreason, mathematical models that simulate the globalprocess are established and they allow checking the valid-ity of the assumptions on which they are based [16].In kinetic studies of decomposition, the concentration
of the reactants and the products is one of the mainfactors. Reactions are considered irreversible, and thevelocity depends on the activation energy and order ofthe reaction.The parameters can be calculated from a dynamic
experimental curve. When we combine the reactionvelocity and the Arrhenius expression, we have the fol-lowing basic expression:
d�
dt� f �� �A exp ÿ Ea
RT
� ��1�
where T is the temperature (K), � is the reacted fractionat time t; d�=dt is the velocity of reaction (tÿ1), f �� � is afunction of a depending on the reaction mechanism, Ea
is the activation energy (kJ/mol), A is the pre-exponen-tial factor and R is the gas constant.On the other hand, conversion is calculated according to:
� � W0 ÿW
W0 ÿWf�2�
where Wo: initial mass of the sample (g), W: mass of thesample at a temperature T (g) and Wf : ®nal mass of thesample (g). The methods described below were developed
from Eq. 1. With the integral method of Coats andRedfern [12], the expression is as follows when n 6� 1 (n:reaction order):
log1ÿ 1ÿ �� �1ÿn
T2 1ÿ n� �� �
� logAR
BE1ÿ 2RT
Ea
� �ÿ Ea
2:3RT�3�
where B is the rate of heating (degree/time)When n � 1, the expression becomes:
log ÿ log 1ÿ �� �T2
� �� log
AR
BEa1ÿ 2RT
Ea
� �ÿ Ea
2:3RT�4�
Van-Krevelen [13,14], using the same methodology asCoats and Redfern, obtained, for n 6� 1:
ln1ÿ �� �1ÿnÿ1
1ÿ n
� �� ln
A
B
0:368
Tn
� � EaRTn 1
Ea
RTn� 1
0BB@1CCA
0BB@1CCA
� Ea
RTn� 1
� �lnT
�5�where Tn is the temperature at the maximum rate (K).When n � 1, the expression becomes:
ln�ln 1ÿ ��� � � lnA
B
0:368
Tn
� � EaRTn 1
Ea
RTn� 1
0BB@1CCA
0BB@1CCA
� Ea
RTn� 1
� �lnT �6�
The Horowitz and Metzger method [15] is a simpli®ca-tion of that of Coats and Redfern.Based on Eqs (3) and (4), a characteristic temperature is
de®ned as � � Tÿ Ts, where T is temperature at any timeand Ts the TGA di�erential curve peak temperature.For n 6� 1 the following expression is obtained:
ln 1ÿ 1ÿ �� �1ÿnÿ � � ÿ Ea�
RT2s
� ln 1ÿ n� � �7�
When n � 1, Eq. (4) becomes:
ln ÿ ln 1ÿ �� �� � � Ea�
RT2s
�8�
In studying the thermal degradation of syndiotacticpolystyrene, Ravanetti and Zini [17] obtained an acti-vation energy of 209±251 kJ/mol using both integral(Van±Krevelen, Coats±Redfern) and di�erential methods(Freeman±Carroll), which implies that those models areadequate to use in this present research.
10 J. GonzaÂlez et al. / Polymer Degradation and Stability 68 (2000) 9±19
Also, Carrasco [16] studied the PS decompositionusing di�erent kinetic models, ®nding that the value of theactivation energy calculated by the method of Van Kre-velen is 8% higher than the one obtained by analyticalmethods.
3. Experimental
The materials used in this study were PA6 and twoPolypropylenes named PP1 and PP2. PP1 is a homo-polymer resin with a melt ¯ow index (MFI) of 1.2 dg/min. (ASTM D 1238, 230 C and 2.16 kg) and density0.90 g/cm3. PP2 is a resin with a MFI of 11.4 dg/min. at230 C and was used to compare it with the grafted PP1(PP1-g-DEM). The PP1 was functionalized by reactiveextrusion with diethylmaleate (DEM) and 0.05 p.h.r. ofdicumyl peroxide was used as initiator.The rheological properties of the materials are pre-
sented in Table 1 [18]. The blends were prepared at anominal shear rate where the viscosity ratio was close toone because the particle size that could be achievedshould be the smallest [19]. The shear rate at every screw
element in the extruder was calculated following themethod proposed by Michaeli et al. [20].The binary blends of PA6 with PP2 and PP1-g-DEM
were made in a twin screw extruder at 264�C and 55r.p.m. The compositions of the blends used were 10, 20,30, 50, 60, 70 and 80 wt%. The blends were dried in avacuum oven for 16 h at 85�C (before compounding).The thermograms were obtained in the TGA
(Dupont, model 951) under the following conditions:the samples were heated up to a temperature of 773 K ata rate of 10�/min, in a nitrogen atmosphere. Subse-quently, the blend was kinetically examined using thedi�erent methods in order to determine the globalenergy of activation and the global order of reaction.
4. Results and discussion
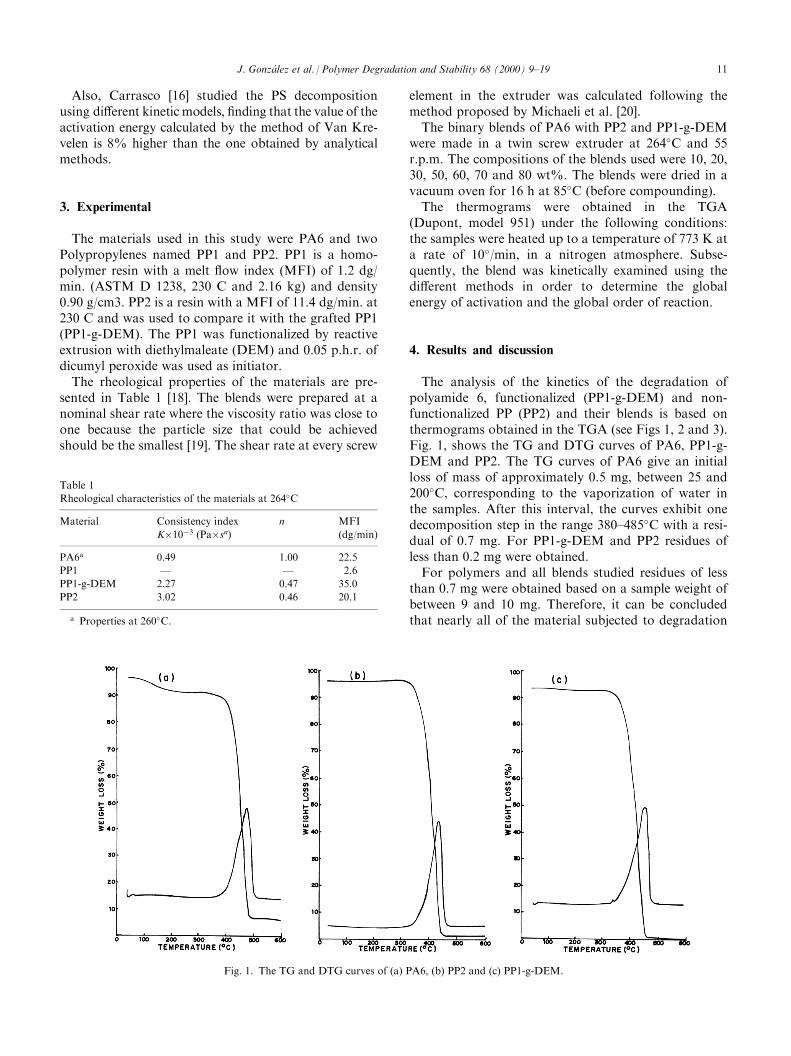
The analysis of the kinetics of the degradation ofpolyamide 6, functionalized (PP1-g-DEM) and non-functionalized PP (PP2) and their blends is based onthermograms obtained in the TGA (see Figs 1, 2 and 3).Fig. 1, shows the TG and DTG curves of PA6, PP1-g-DEM and PP2. The TG curves of PA6 give an initialloss of mass of approximately 0.5 mg, between 25 and200�C, corresponding to the vaporization of water inthe samples. After this interval, the curves exhibit onedecomposition step in the range 380±485�C with a resi-dual of 0.7 mg. For PP1-g-DEM and PP2 residues ofless than 0.2 mg were obtained.For polymers and all blends studied residues of less
than 0.7 mg were obtained based on a sample weight ofbetween 9 and 10 mg. Therefore, it can be concludedthat nearly all of the material subjected to degradation
Table 1
Rheological characteristics of the materials at 264�C
Material Consistency index
K�10ÿ3 (Pa�sn)n MFI
(dg/min)
PA6a 0.49 1.00 22.5
PP1 Ð Ð 2.6
PP1-g-DEM 2.27 0.47 35.0
PP2 3.02 0.46 20.1
a Properties at 260�C.
Fig. 1. The TG and DTG curves of (a) PA6, (b) PP2 and (c) PP1-g-DEM.
J. GonzaÂlez et al. / Polymer Degradation and Stability 68 (2000) 9±19 11
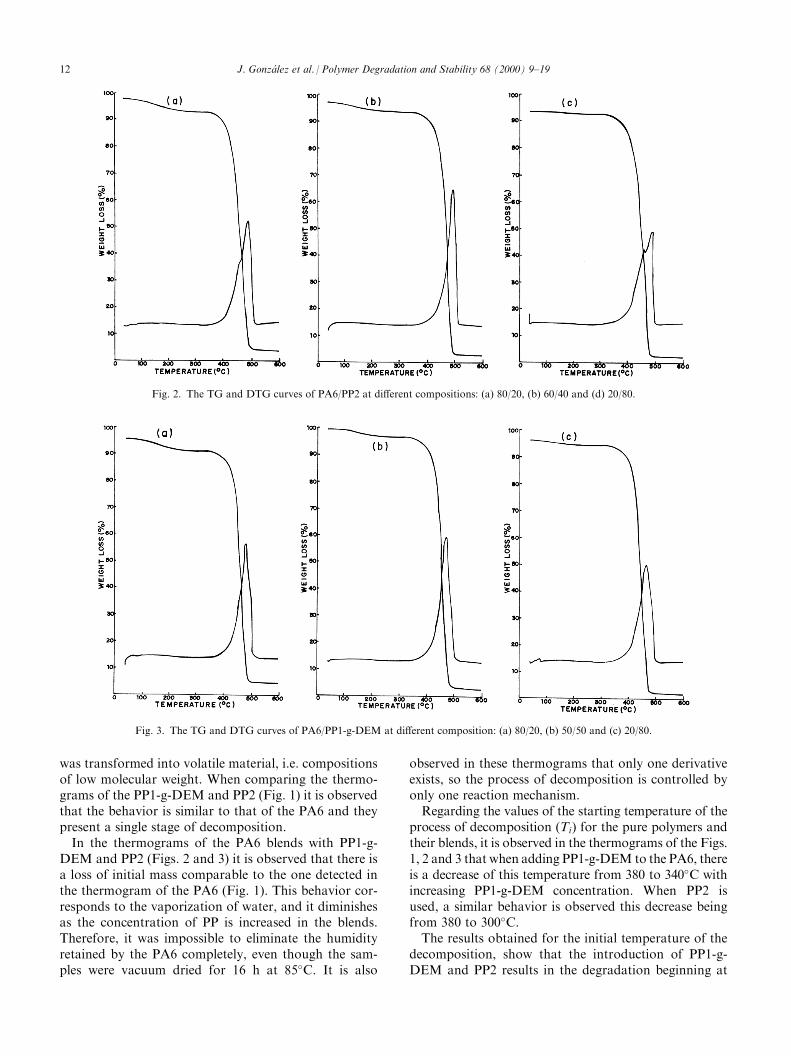
was transformed into volatile material, i.e. compositionsof low molecular weight. When comparing the thermo-grams of the PP1-g-DEM and PP2 (Fig. 1) it is observedthat the behavior is similar to that of the PA6 and theypresent a single stage of decomposition.In the thermograms of the PA6 blends with PP1-g-
DEM and PP2 (Figs. 2 and 3) it is observed that there isa loss of initial mass comparable to the one detected inthe thermogram of the PA6 (Fig. 1). This behavior cor-responds to the vaporization of water, and it diminishesas the concentration of PP is increased in the blends.Therefore, it was impossible to eliminate the humidityretained by the PA6 completely, even though the sam-ples were vacuum dried for 16 h at 85�C. It is also
observed in these thermograms that only one derivativeexists, so the process of decomposition is controlled byonly one reaction mechanism.Regarding the values of the starting temperature of the
process of decomposition (Ti) for the pure polymers andtheir blends, it is observed in the thermograms of the Figs.1, 2 and 3 that when adding PP1-g-DEM to the PA6, thereis a decrease of this temperature from 380 to 340�C withincreasing PP1-g-DEM concentration. When PP2 isused, a similar behavior is observed this decrease beingfrom 380 to 300�C.The results obtained for the initial temperature of the
decomposition, show that the introduction of PP1-g-DEM and PP2 results in the degradation beginning at
Fig. 2. The TG and DTG curves of PA6/PP2 at di�erent compositions: (a) 80/20, (b) 60/40 and (d) 20/80.
Fig. 3. The TG and DTG curves of PA6/PP1-g-DEM at di�erent composition: (a) 80/20, (b) 50/50 and (c) 20/80.
12 J. GonzaÂlez et al. / Polymer Degradation and Stability 68 (2000) 9±19
lower temperatures. This may indicate that in PA6blends with PP1-g-DEM and PP2 there could be aninitial induction period which is slightly lower thanwhen the polymers are not blends.The values of the initial temperature of decomposi-
tion are very important, since they could indicate whatthe processing and manufacturing temperatures can bewithout continuing or initiating decomposition, espe-cially in blends of PP1-g-DEM. The values of Ti give anidea of the beginning of the decomposition, but they arenot enough to establish that there are variations in thethermal stability of the blends.
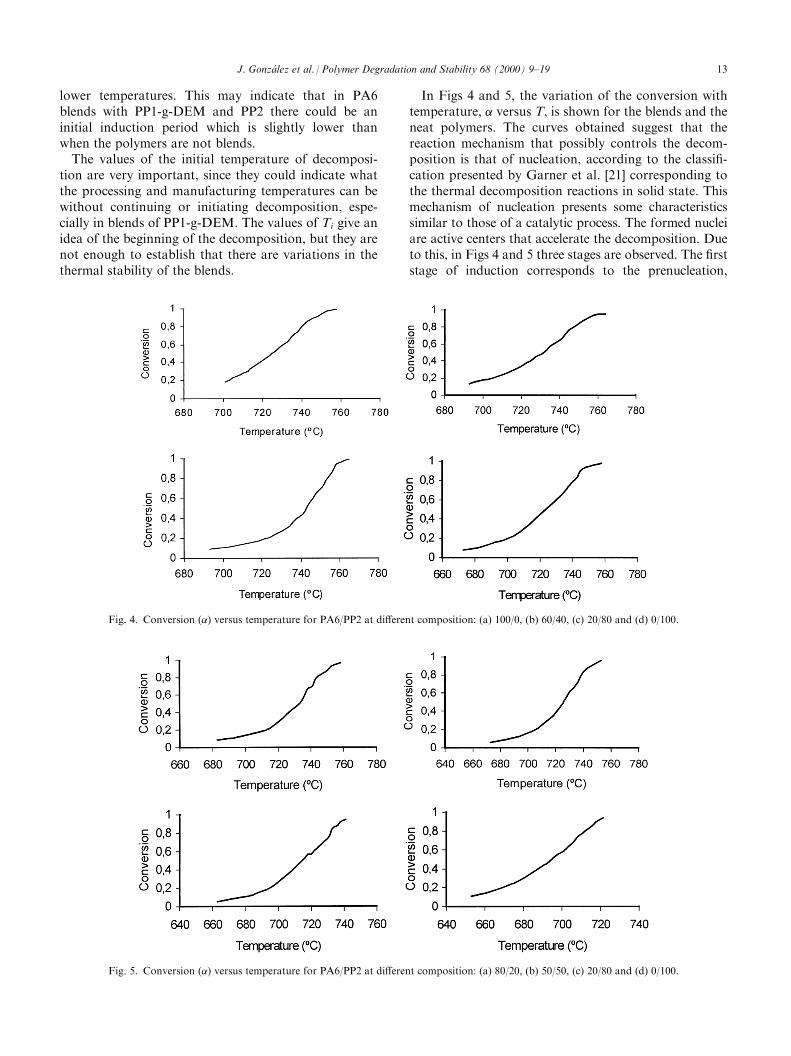
In Figs 4 and 5, the variation of the conversion withtemperature, � versus T, is shown for the blends and theneat polymers. The curves obtained suggest that thereaction mechanism that possibly controls the decom-position is that of nucleation, according to the classi®-cation presented by Garner et al. [21] corresponding tothe thermal decomposition reactions in solid state. Thismechanism of nucleation presents some characteristicssimilar to those of a catalytic process. The formed nucleiare active centers that accelerate the decomposition. Dueto this, in Figs 4 and 5 three stages are observed. The ®rststage of induction corresponds to the prenucleation,
Fig. 4. Conversion (�) versus temperature for PA6/PP2 at di�erent composition: (a) 100/0, (b) 60/40, (c) 20/80 and (d) 0/100.
Fig. 5. Conversion (�) versus temperature for PA6/PP2 at di�erent composition: (a) 80/20, (b) 50/50, (c) 20/80 and (d) 0/100.
J. GonzaÂlez et al. / Polymer Degradation and Stability 68 (2000) 9±19 13
which is a period when the nucleus formation velocity isslow. In the second stage, these nuclei accelerate thedecomposition process, this behavior being similar tothat of a catalytic process. In the last stage, the reactionvelocity slows down, since active nuclei do not exist.The di�erent values of activation energy and global
order of reaction obtained through the several methodsused in PA6 and functionalized and non-functionalizedPP are shown in Tables 2±4. The methods used in theexperiments were those of Horowitz±Metzger (H±M),Coats±Redfern (C±R) and Van-Krevelen (K). For the
three methods used, a similar behavior is observed inthe values of the activation energy.The Horowitz±Metzger method shows the highest
values of activation energy, while the method of Coats±Redfern shows results with a tendency to smaller valuesthan the previous one. This is due to the fact that in theequation developed by Coats±Redfern, when evaluatingthe result of the integral of the expression[ expÿEa=RT], a recurrent series is used that is trun-cated when arriving at the second term. On the otherhand, as Horowitz±Metzger method is based on thedevelopment of the asymptotic expansion of[ expÿEa=RT] before integration, other values are takeninto account. These values increase the result of theintegral.On the other hand, in the Van Krevelen method, the
maximum temperature of decomposition plays animportant role in determining of the activation energy,so that if the maximum temperature is not well de®ned,this would be an important source of error. Anotherimportant factor to consider is that, contrary to themethod of Horowitz±Metzger and that of Coats±Red-fern, Van Krevelen makes an approach of the term[ expÿEa=RT] to the value of:
0:368xT
Tmax
� � ERTmax
ÿ ��9�
which cannot be applied to low temperatures. Thesereasons explain the behavior of the obtained values ofthe activation energy. The calculated results using theVan Krevelen model are higher than those obtainedwhen using the Coats±Redfern model, but smaller thanthe ones for the Horowitz±Metzger method. In general,the tendency of the calculated activation energy in thiswork, for the di�erent methods is similar to that estab-lished by other investigators such as Carrasco [16] andAlbano et al. [22].Carrasco [16] claims that big variations can exist in
the activation energy for the same polymeric material;these di�erences depend on several factors: method ofpreparation of the polymer, defects in the net, impu-rities, molecular weight of the polymer, experimentaltechnique and operating conditions in which the ther-mograms were obtained. These considerations were alsoanalyzed by Orlao et al. [23] who suggests that one ofthe problems associated with the method of dynamictermogravimetry, is that the obtained kinetic para-meters are frequently dependent of the experimentalconditions. For these reasons, in this work, the sameconditions were used while working and during thepreparation of samples, for the pure polymers as well asfor their blends.It is worthwhile to point out that polymers show two
forms of thermal decomposition: one having the typical
Table 2
Global activation energy (Ea) for the degradation PA6, PP1-G-DEM
and their blends
PP1-g-DEM
(%)
H±M
(kJ/mol)�5
C±R
(kJ/mol)�5
K
(kJ/mol)�5
0 249 224 237
10 209 166 180
20 197 160 177
30 232 195 205
50 216 177 197
60 188 159 167
70 167 159 164
80 217 179 196
100 193 149 165
Table 3
Global activation energy (Ea) for the degradation PA6, PP2 and their
blends
PP2 (%) H±M (kJ/mol)�5 C±R (kJ/mol)�5 K (kJ/mol)�5
20 183 153 161
40 187 155 184
80 185 155 167
90 161 132 146
100 230 196 221
Table 4
Global reaction order (n) for the degradation of PA6, PP2, PP1-g-
DEM and their blends
PP1-g-DEM (%) PP2 (%) H±M C±R K
0 Ð 1.0 1.0 1.0
10 Ð 0.7 0.8 0.8
20 Ð 0.4 0.3 0.3
30 Ð 0.6 0.7 0.6
50 Ð 0.7 0.5 0.6
60 Ð 0.6 0.5 0.4
70 Ð 0.6 0.5 0.4
80 Ð 0.7 0.7 0.5
100 Ð 0.7 0.7 0.6
Ð 20 0.5 0.5 0.4
Ð 40 0.5 0.5 0.5
Ð 80 0.5 0.5 0.4
Ð 90 0.5 0.5 0.5
Ð 100 1.3 1.0 1.1
14 J. GonzaÂlez et al. / Polymer Degradation and Stability 68 (2000) 9±19
characteristics of solid±gas reactions that occur via freeradicals, and the other a chain reaction. The formerreactions are a�ected by the di�usivity of the volatilereaction products, and the latter by the mechanism ofchain reaction. This leads to the conclusion that thedecomposition takes place via a very complex mechanism,since each reaction has its own activation energy. There-fore, the results obtained show only the global activationenergy of the real mechanism of decomposition.As far as the activation energy of the pure polymers is
concerned (Tables 2 and 3) PA6 shows values that varybetween 224 and 249 kJ/mol. Albano et al. [24] obtainedvalues for PA6 between 200 and 237 kJ/mol, usingintegral methods, and a value of 244 kJ/mol using theFreeman±Carroll di�erential method. The values foundin the present work are slightly higher than those pre-sented by Albano et al. [24], possibly due to the presenceof the thermal stabilizer in the sample of PA6.For the case of the PP1-g-DEM (Table 2) the values
observed are between 149 and 193 kJ/mol and for thePP2 the activation energy oscillates between 196 and230 kJ/mol (Table 3). Studies carried out by Balke et al.[25] on polypropylene reported values in the range of160 and 279 kJ/mol, for di�erent heating rates, usingthe method of Freeman±Carroll.
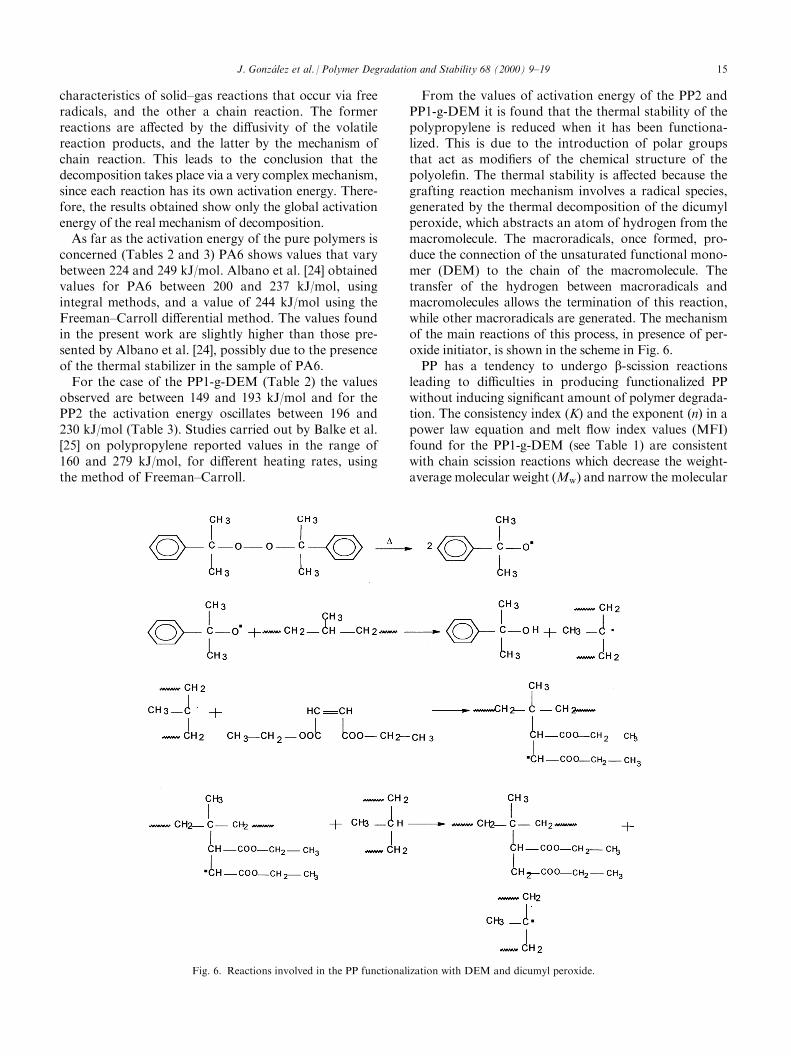
From the values of activation energy of the PP2 andPP1-g-DEM it is found that the thermal stability of thepolypropylene is reduced when it has been functiona-lized. This is due to the introduction of polar groupsthat act as modi®ers of the chemical structure of thepolyole®n. The thermal stability is a�ected because thegrafting reaction mechanism involves a radical species,generated by the thermal decomposition of the dicumylperoxide, which abstracts an atom of hydrogen from themacromolecule. The macroradicals, once formed, pro-duce the connection of the unsaturated functional mono-mer (DEM) to the chain of the macromolecule. Thetransfer of the hydrogen between macroradicals andmacromolecules allows the termination of this reaction,while other macroradicals are generated. The mechanismof the main reactions of this process, in presence of per-oxide initiator, is shown in the scheme in Fig. 6.PP has a tendency to undergo b-scission reactions
leading to di�culties in producing functionalized PPwithout inducing signi®cant amount of polymer degrada-tion. The consistency index (K) and the exponent (n) in apower law equation and melt ¯ow index values (MFI)found for the PP1-g-DEM (see Table 1) are consistentwith chain scission reactions which decrease the weight-average molecular weight (Mw) and narrow the molecular
Fig. 6. Reactions involved in the PP functionalization with DEM and dicumyl peroxide.
J. GonzaÂlez et al. / Polymer Degradation and Stability 68 (2000) 9±19 15
weight distribution [26]. For these reasons the MFIvalues increase and the viscosity at a ®xed shear ratedecreases when PP1-g-DEM is compared with the neatPP1. The amount of peroxide employed to functionalizethe PP1 was chosen in order to obtain similar viscositycurves to that of PA6.As is well known, the thermal stability of neat mate-
rials and their blends is of vital importance in industry,to be able to establish storage conditions of the com-pleted products to avoid possible accidents caused bythe exothermicity of the decomposition reactions.The di�erence in the molecular structure of the PP1
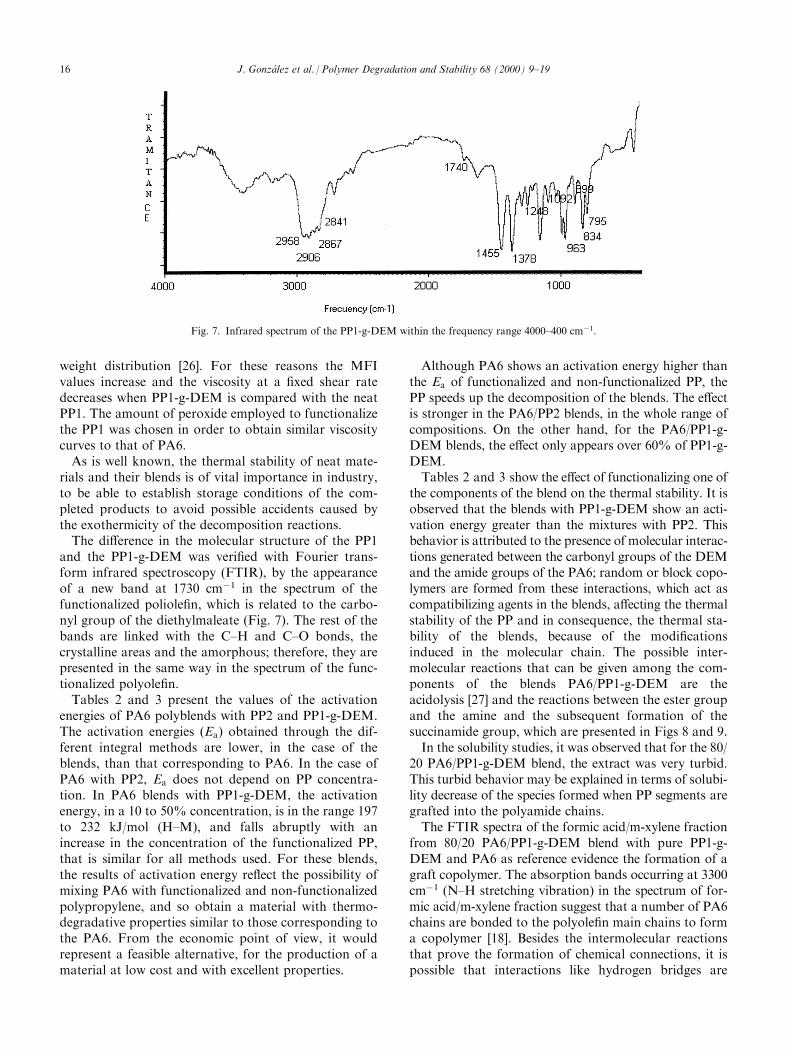
and the PP1-g-DEM was veri®ed with Fourier trans-form infrared spectroscopy (FTIR), by the appearanceof a new band at 1730 cmÿ1 in the spectrum of thefunctionalized poliole®n, which is related to the carbo-nyl group of the diethylmaleate (Fig. 7). The rest of thebands are linked with the C±H and C±O bonds, thecrystalline areas and the amorphous; therefore, they arepresented in the same way in the spectrum of the func-tionalized polyole®n.Tables 2 and 3 present the values of the activation
energies of PA6 polyblends with PP2 and PP1-g-DEM.The activation energies (Ea) obtained through the dif-ferent integral methods are lower, in the case of theblends, than that corresponding to PA6. In the case ofPA6 with PP2, Ea does not depend on PP concentra-tion. In PA6 blends with PP1-g-DEM, the activationenergy, in a 10 to 50% concentration, is in the range 197to 232 kJ/mol (H±M), and falls abruptly with anincrease in the concentration of the functionalized PP,that is similar for all methods used. For these blends,the results of activation energy re¯ect the possibility ofmixing PA6 with functionalized and non-functionalizedpolypropylene, and so obtain a material with thermo-degradative properties similar to those corresponding tothe PA6. From the economic point of view, it wouldrepresent a feasible alternative, for the production of amaterial at low cost and with excellent properties.
Although PA6 shows an activation energy higher thanthe Ea of functionalized and non-functionalized PP, thePP speeds up the decomposition of the blends. The e�ectis stronger in the PA6/PP2 blends, in the whole range ofcompositions. On the other hand, for the PA6/PP1-g-DEM blends, the e�ect only appears over 60% of PP1-g-DEM.Tables 2 and 3 show the e�ect of functionalizing one of
the components of the blend on the thermal stability. It isobserved that the blends with PP1-g-DEM show an acti-vation energy greater than the mixtures with PP2. Thisbehavior is attributed to the presence of molecular interac-tions generated between the carbonyl groups of the DEMand the amide groups of the PA6; random or block copo-lymers are formed from these interactions, which act ascompatibilizing agents in the blends, a�ecting the thermalstability of the PP and in consequence, the thermal sta-bility of the blends, because of the modi®cationsinduced in the molecular chain. The possible inter-molecular reactions that can be given among the com-ponents of the blends PA6/PP1-g-DEM are theacidolysis [27] and the reactions between the ester groupand the amine and the subsequent formation of thesuccinamide group, which are presented in Figs 8 and 9.In the solubility studies, it was observed that for the 80/
20 PA6/PP1-g-DEM blend, the extract was very turbid.This turbid behavior may be explained in terms of solubi-lity decrease of the species formed when PP segments aregrafted into the polyamide chains.The FTIR spectra of the formic acid/m-xylene fraction
from 80/20 PA6/PP1-g-DEM blend with pure PP1-g-DEM and PA6 as reference evidence the formation of agraft copolymer. The absorption bands occurring at 3300cmÿ1 (N±H stretching vibration) in the spectrum of for-mic acid/m-xylene fraction suggest that a number of PA6chains are bonded to the polyole®n main chains to forma copolymer [18]. Besides the intermolecular reactionsthat prove the formation of chemical connections, it ispossible that interactions like hydrogen bridges are
Fig. 7. Infrared spectrum of the PP1-g-DEM within the frequency range 4000±400 cmÿ1.
16 J. GonzaÂlez et al. / Polymer Degradation and Stability 68 (2000) 9±19
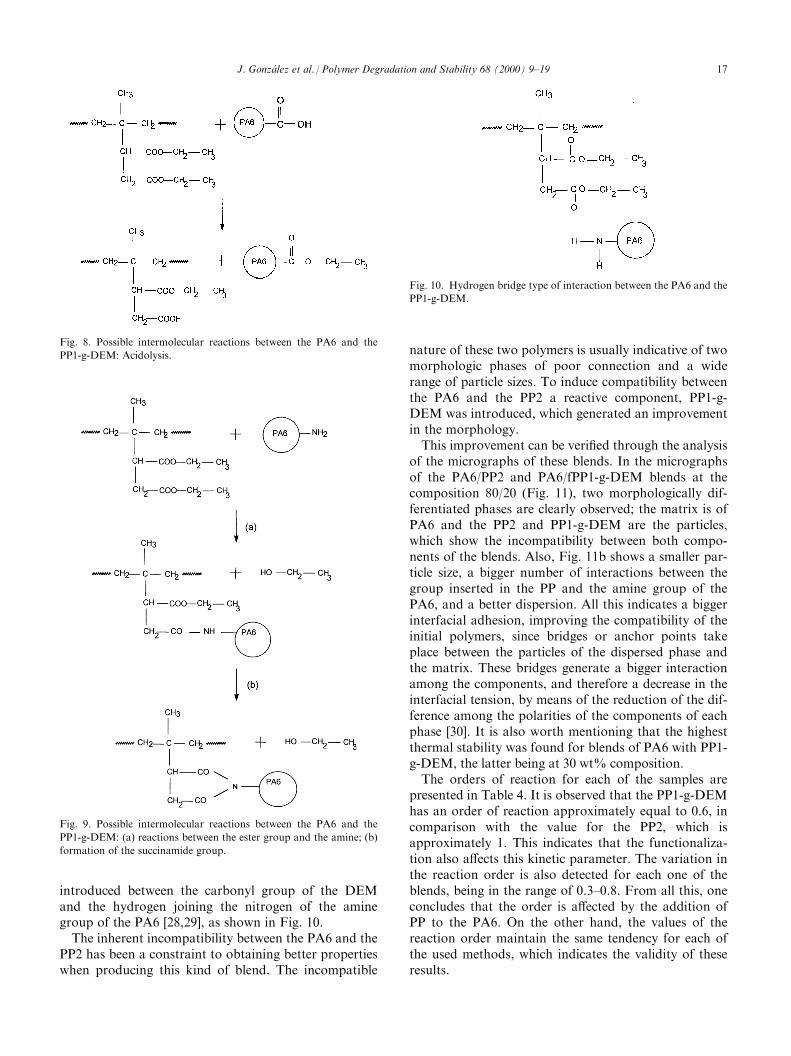
introduced between the carbonyl group of the DEMand the hydrogen joining the nitrogen of the aminegroup of the PA6 [28,29], as shown in Fig. 10.The inherent incompatibility between the PA6 and the
PP2 has been a constraint to obtaining better propertieswhen producing this kind of blend. The incompatible
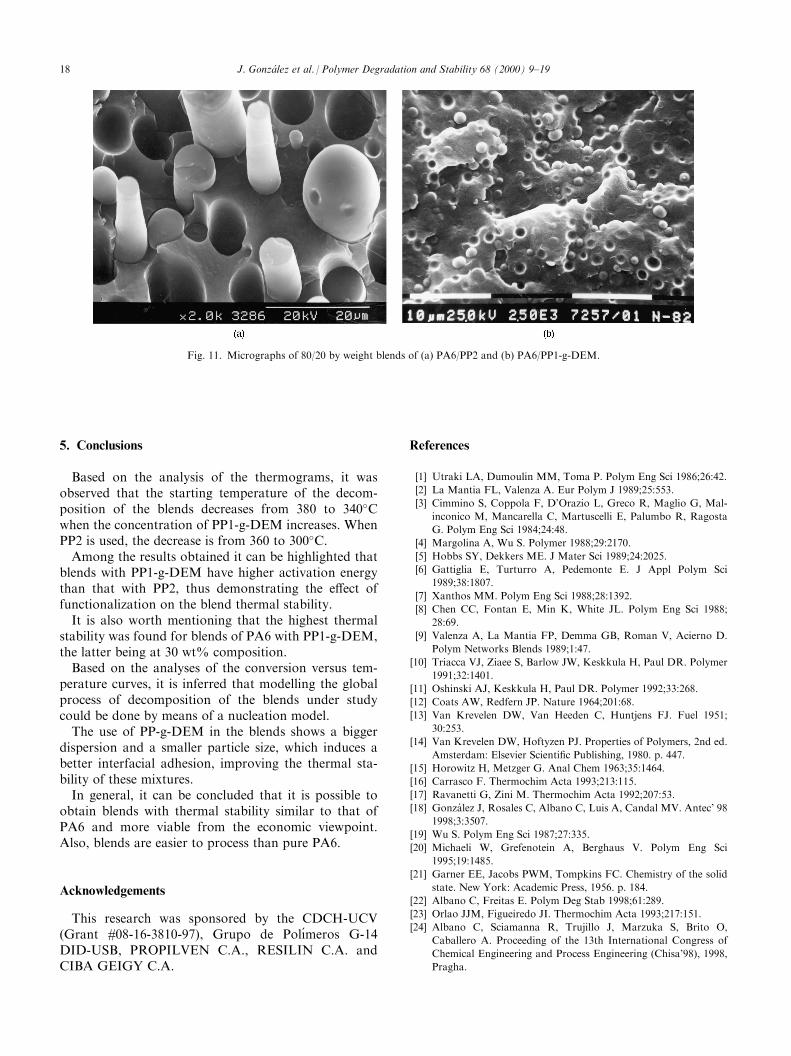
nature of these two polymers is usually indicative of twomorphologic phases of poor connection and a widerange of particle sizes. To induce compatibility betweenthe PA6 and the PP2 a reactive component, PP1-g-DEM was introduced, which generated an improvementin the morphology.This improvement can be veri®ed through the analysis
of the micrographs of these blends. In the micrographsof the PA6/PP2 and PA6/fPP1-g-DEM blends at thecomposition 80/20 (Fig. 11), two morphologically dif-ferentiated phases are clearly observed; the matrix is ofPA6 and the PP2 and PP1-g-DEM are the particles,which show the incompatibility between both compo-nents of the blends. Also, Fig. 11b shows a smaller par-ticle size, a bigger number of interactions between thegroup inserted in the PP and the amine group of thePA6, and a better dispersion. All this indicates a biggerinterfacial adhesion, improving the compatibility of theinitial polymers, since bridges or anchor points takeplace between the particles of the dispersed phase andthe matrix. These bridges generate a bigger interactionamong the components, and therefore a decrease in theinterfacial tension, by means of the reduction of the dif-ference among the polarities of the components of eachphase [30]. It is also worth mentioning that the highestthermal stability was found for blends of PA6 with PP1-g-DEM, the latter being at 30 wt% composition.The orders of reaction for each of the samples are
presented in Table 4. It is observed that the PP1-g-DEMhas an order of reaction approximately equal to 0.6, incomparison with the value for the PP2, which isapproximately 1. This indicates that the functionaliza-tion also a�ects this kinetic parameter. The variation inthe reaction order is also detected for each one of theblends, being in the range of 0.3±0.8. From all this, oneconcludes that the order is a�ected by the addition ofPP to the PA6. On the other hand, the values of thereaction order maintain the same tendency for each ofthe used methods, which indicates the validity of theseresults.
Fig. 10. Hydrogen bridge type of interaction between the PA6 and the
PP1-g-DEM.
Fig. 8. Possible intermolecular reactions between the PA6 and the
PP1-g-DEM: Acidolysis.
Fig. 9. Possible intermolecular reactions between the PA6 and the
PP1-g-DEM: (a) reactions between the ester group and the amine; (b)
formation of the succinamide group.
J. GonzaÂlez et al. / Polymer Degradation and Stability 68 (2000) 9±19 17
5. Conclusions
Based on the analysis of the thermograms, it wasobserved that the starting temperature of the decom-position of the blends decreases from 380 to 340�Cwhen the concentration of PP1-g-DEM increases. WhenPP2 is used, the decrease is from 360 to 300�C.Among the results obtained it can be highlighted that
blends with PP1-g-DEM have higher activation energythan that with PP2, thus demonstrating the e�ect offunctionalization on the blend thermal stability.It is also worth mentioning that the highest thermal
stability was found for blends of PA6 with PP1-g-DEM,the latter being at 30 wt% composition.Based on the analyses of the conversion versus tem-
perature curves, it is inferred that modelling the globalprocess of decomposition of the blends under studycould be done by means of a nucleation model.The use of PP-g-DEM in the blends shows a bigger
dispersion and a smaller particle size, which induces abetter interfacial adhesion, improving the thermal sta-bility of these mixtures.In general, it can be concluded that it is possible to
obtain blends with thermal stability similar to that ofPA6 and more viable from the economic viewpoint.Also, blends are easier to process than pure PA6.
Acknowledgements
This research was sponsored by the CDCH-UCV(Grant #08-16-3810-97), Grupo de PolõÂmeros G-14DID-USB, PROPILVEN C.A., RESILIN C.A. andCIBA GEIGY C.A.
References
[1] Utraki LA, Dumoulin MM, Toma P. Polym Eng Sci 1986;26:42.
[2] La Mantia FL, Valenza A. Eur Polym J 1989;25:553.
[3] Cimmino S, Coppola F, D'Orazio L, Greco R, Maglio G, Mal-
inconico M, Mancarella C, Martuscelli E, Palumbo R, Ragosta
G. Polym Eng Sci 1984;24:48.
[4] Margolina A, Wu S. Polymer 1988;29:2170.
[5] Hobbs SY, Dekkers ME. J Mater Sci 1989;24:2025.
[6] Gattiglia E, Turturro A, Pedemonte E. J Appl Polym Sci
1989;38:1807.
[7] Xanthos MM. Polym Eng Sci 1988;28:1392.
[8] Chen CC, Fontan E, Min K, White JL. Polym Eng Sci 1988;
28:69.
[9] Valenza A, La Mantia FP, Demma GB, Roman V, Acierno D.
Polym Networks Blends 1989;1:47.
[10] Triacca VJ, Ziaee S, Barlow JW, Keskkula H, Paul DR. Polymer
1991;32:1401.
[11] Oshinski AJ, Keskkula H, Paul DR. Polymer 1992;33:268.
[12] Coats AW, Redfern JP. Nature 1964;201:68.
[13] Van Krevelen DW, Van Heeden C, Huntjens FJ. Fuel 1951;
30:253.
[14] Van Krevelen DW, Hoftyzen PJ. Properties of Polymers, 2nd ed.
Amsterdam: Elsevier Scienti®c Publishing, 1980. p. 447.
[15] Horowitz H, Metzger G. Anal Chem 1963;35:1464.
[16] Carrasco F. Thermochim Acta 1993;213:115.
[17] Ravanetti G, Zini M. Thermochim Acta 1992;207:53.
[18] Gonza lez J, Rosales C, Albano C, Luis A, Candal MV. Antec' 98
1998;3:3507.
[19] Wu S. Polym Eng Sci 1987;27:335.
[20] Michaeli W, Grefenotein A, Berghaus V. Polym Eng Sci
1995;19:1485.
[21] Garner EE, Jacobs PWM, Tompkins FC. Chemistry of the solid
state. New York: Academic Press, 1956. p. 184.
[22] Albano C, Freitas E. Polym Deg Stab 1998;61:289.
[23] Orlao JJM, Figueiredo JI. Thermochim Acta 1993;217:151.
[24] Albano C, Sciamanna R, Trujillo J, Marzuka S, Brito O,
Caballero A. Proceeding of the 13th International Congress of
Chemical Engineering and Process Engineering (Chisa'98), 1998,
Pragha.
Fig. 11. Micrographs of 80/20 by weight blends of (a) PA6/PP2 and (b) PA6/PP1-g-DEM.
18 J. GonzaÂlez et al. / Polymer Degradation and Stability 68 (2000) 9±19

[25] Balke ST, Chan JH. Polym Deg Stab 1997;57:135.
[26] Aglietto M, Bertani R, Ruggeri G, Serpe A. Makromolecules
1990;23:1928.
[27] Shaver G, Paul D, Barlow J. Compalloy 89, 1989, New Orleans.
[28] Holsti-Mettinen R, Seppala J. Polym Eng Sci 1992;32:868.
[29] Benedetti E, Posar F, Da lessio A, Vergamini P, Aglietto M,
Ruggeri G, Ciardelli F. Br Polym 1985;17:34.
[30] Dagli S, Kamdar K. Polym Eng Sci 1994;34:1709.
J. GonzaÂlez et al. / Polymer Degradation and Stability 68 (2000) 9±19 19
Related Documents