IEEE TRANSACTIONS ON VEHICULAR TECHNOLOGY, VOL. 54, NO. 3, MAY 2005 825 Dynamic Simulation for Analysis of Hybrid Electric Vehicle System and Subsystem Interactions, Including Power Electronics Marco Amrhein, Student Member, IEEE, and Philip T. Krein, Fellow, IEEE Abstract—Simulation tools for hybrid electric vehicles (HEVs) can be classified into steady-state and dynamic models, according to their purpose. Tools with steady-state models are useful for system-level analysis. The information gained is helpful for assessing long-term behavior of the vehicle. Tools that utilize dynamic models give in-depth information about the short-term behavior of sublevel components. In this paper, a dynamic model of a hybrid electric vehicle that includes fuel cells, batteries, ultra- capacitors, and induction machine drives is presented. Simulation results of vehicle configurations with a battery, a fuel cell-battery combination and a fuel cell-ultracapacitor combination are dis- cussed. The focus of the model is a detailed assessment of different subsystem components, particularly component losses. Index Terms—Dynamic hybrid electric vehicle model, fuel cell electric vehicle, hybrid electric vehicle, hybrid electric vehi- cles—power electronics, ultracapacitors. I. INTRODUCTION A DVANCES in the technology of hybrid electric vehicle (HEV) components demand simulation tools for system interactions. These tools can generally be divided into two cat- egories: models based on steady-state component behavior or dynamic models. The first category models components of an HEV at a high level and supports long-term analysis over ex- tended drive cycles. Such models are helpful during the de- sign stage when architectural decisions and high-level operating strategies need to be evaluated. A typical example uses static ef- ficiency maps of components under various conditions. An early example was SIMPLEV, developed by the Idaho National En- gineering and Environmental Laboratories (INEEL) [1]. Others are the ADVISOR program developed through the National Re- newable Energy Laboratory (NREL) [2], [3], and PSAT from Argonne National Research Laboratories [4]. Dynamic models are needed to make lower-level compar- isons among subsystems and support subsystem design. In this case, detailed subsystem models are assembled to address the complete system. V-Elph, a program developed at Texas A&M University [5], uses various levels of subsystem models for dif- ferent purposes. It can be utilized to study performance issues Manuscript received October 4, 2004; revised December 17, 2004 and Jan- uary 18, 2005. This work was supported by the U.S. Department of Energy under UT-Battelle Sub-Contract 4000030581. The review of this paper was co- ordinated by Prof. A. Emadi. The authors are with the Department of Electrical and Computer Engineering, University of Illinois at Urbana-Champaign, Urbana, IL 61801 USA (e-mail: [email protected]; [email protected]). Digital Object Identifier 10.1109/TVT.2005.847231 such as energy efficiency, fuel economy and vehicle emissions. Another dynamic simulator for hybrid and electric vehicles, dis- cussed in [6], is based on the PSIM simulation tool and uses detailed electrical equivalent models of vehicle components. A parallel-configured HEV model is discussed in [7]. Some sim- ulation results are included in the comprehensive review article by Chan [8]. In this paper, a dynamic model for an HEV with a fuel cell to provide its primary power is developed and analyzed. It is augmented from a model of a series HEV with an internal com- bustion engine [9], validated by experimental data from a se- ries HEV built at the University of Illinois at Urbana-Cham- paign [10]. The model expands results from [10] such that bat- teries, ultracapacitors, and fuel cells, together with additional power electronics components are implemented and analyzed. This makes it suitable for several types of HEVs, including fuel-cell electric vehicles (FCEVs) as well as those based on internal combustion engines or those that incorporate multiple energy sources. Power electronics ratings and requirements in various parts of the vehicle can be assessed, such as specific re- quirements for the electronic drive or for the dc-to-dc converter between the fuel cell and the energy storage. II. THE NEED FOR DYNAMIC MODELING Power electronics devices are rated according to their peak voltage and peak and average current. Average ratings can be derived from steady-state operation and characteristics of the system, but peak ratings can only be estimated from the steady- state results and are often inadequate. A more accurate approach is to use a dynamic model in which large load transients, such as those which occur during shifting of gears or fast acceleration of the vehicle, can be studied. Estimates of conducting losses in power electronics devices, batteries, ultracapacitors and other components can be supported directly with a dynamic model. The main disadvantage of a comprehensive dynamic model is the extended computation time. Small time-steps are required as well as a fast simulator capable of handling large amounts of data. Another disadvantage is that detailed models require extensive parametric information. Parameters such as inductors and capacitor values are needed, along with detailed parameters of the traction machine (whether induction, permanent-magnet, or reluctance). A detailed model is appropriate for short-term analysis and supplements the long-term capabilities of a steady-state model as described in [2] and [3]. 0018-9545/$20.00 © 2005 IEEE

dynamic simulation of hybrid electric vehicles
Dec 07, 2015
Mecahnical
Welcome message from author
This document is posted to help you gain knowledge. Please leave a comment to let me know what you think about it! Share it to your friends and learn new things together.
Transcript

IEEE TRANSACTIONS ON VEHICULAR TECHNOLOGY, VOL. 54, NO. 3, MAY 2005 825
Dynamic Simulation for Analysis of HybridElectric Vehicle System and Subsystem Interactions,
Including Power ElectronicsMarco Amrhein, Student Member, IEEE, and Philip T. Krein, Fellow, IEEE
Abstract—Simulation tools for hybrid electric vehicles (HEVs)can be classified into steady-state and dynamic models, accordingto their purpose. Tools with steady-state models are useful forsystem-level analysis. The information gained is helpful forassessing long-term behavior of the vehicle. Tools that utilizedynamic models give in-depth information about the short-termbehavior of sublevel components. In this paper, a dynamic modelof a hybrid electric vehicle that includes fuel cells, batteries, ultra-capacitors, and induction machine drives is presented. Simulationresults of vehicle configurations with a battery, a fuel cell-batterycombination and a fuel cell-ultracapacitor combination are dis-cussed. The focus of the model is a detailed assessment of differentsubsystem components, particularly component losses.
Index Terms—Dynamic hybrid electric vehicle model, fuelcell electric vehicle, hybrid electric vehicle, hybrid electric vehi-cles—power electronics, ultracapacitors.
I. INTRODUCTION
ADVANCES in the technology of hybrid electric vehicle(HEV) components demand simulation tools for system
interactions. These tools can generally be divided into two cat-egories: models based on steady-state component behavior ordynamic models. The first category models components of anHEV at a high level and supports long-term analysis over ex-tended drive cycles. Such models are helpful during the de-sign stage when architectural decisions and high-level operatingstrategies need to be evaluated. A typical example uses static ef-ficiency maps of components under various conditions. An earlyexample was SIMPLEV, developed by the Idaho National En-gineering and Environmental Laboratories (INEEL) [1]. Othersare the ADVISOR program developed through the National Re-newable Energy Laboratory (NREL) [2], [3], and PSAT fromArgonne National Research Laboratories [4].
Dynamic models are needed to make lower-level compar-isons among subsystems and support subsystem design. In thiscase, detailed subsystem models are assembled to address thecomplete system. V-Elph, a program developed at Texas A&MUniversity [5], uses various levels of subsystem models for dif-ferent purposes. It can be utilized to study performance issues
Manuscript received October 4, 2004; revised December 17, 2004 and Jan-uary 18, 2005. This work was supported by the U.S. Department of Energyunder UT-Battelle Sub-Contract 4000030581. The review of this paper was co-ordinated by Prof. A. Emadi.
The authors are with the Department of Electrical and Computer Engineering,University of Illinois at Urbana-Champaign, Urbana, IL 61801 USA (e-mail:[email protected]; [email protected]).
Digital Object Identifier 10.1109/TVT.2005.847231
such as energy efficiency, fuel economy and vehicle emissions.Another dynamic simulator for hybrid and electric vehicles, dis-cussed in [6], is based on the PSIM simulation tool and usesdetailed electrical equivalent models of vehicle components. Aparallel-configured HEV model is discussed in [7]. Some sim-ulation results are included in the comprehensive review articleby Chan [8].
In this paper, a dynamic model for an HEV with a fuel cellto provide its primary power is developed and analyzed. It isaugmented from a model of a series HEV with an internal com-bustion engine [9], validated by experimental data from a se-ries HEV built at the University of Illinois at Urbana-Cham-paign [10]. The model expands results from [10] such that bat-teries, ultracapacitors, and fuel cells, together with additionalpower electronics components are implemented and analyzed.This makes it suitable for several types of HEVs, includingfuel-cell electric vehicles (FCEVs) as well as those based oninternal combustion engines or those that incorporate multipleenergy sources. Power electronics ratings and requirements invarious parts of the vehicle can be assessed, such as specific re-quirements for the electronic drive or for the dc-to-dc converterbetween the fuel cell and the energy storage.
II. THE NEED FOR DYNAMIC MODELING
Power electronics devices are rated according to their peakvoltage and peak and average current. Average ratings can bederived from steady-state operation and characteristics of thesystem, but peak ratings can only be estimated from the steady-state results and are often inadequate. A more accurate approachis to use a dynamic model in which large load transients, such asthose which occur during shifting of gears or fast accelerationof the vehicle, can be studied. Estimates of conducting losses inpower electronics devices, batteries, ultracapacitors and othercomponents can be supported directly with a dynamic model.
The main disadvantage of a comprehensive dynamic modelis the extended computation time. Small time-steps are requiredas well as a fast simulator capable of handling large amountsof data. Another disadvantage is that detailed models requireextensive parametric information. Parameters such as inductorsand capacitor values are needed, along with detailed parametersof the traction machine (whether induction, permanent-magnet,or reluctance). A detailed model is appropriate for short-termanalysis and supplements the long-term capabilities of asteady-state model as described in [2] and [3].
0018-9545/$20.00 © 2005 IEEE

826 IEEE TRANSACTIONS ON VEHICULAR TECHNOLOGY, VOL. 54, NO. 3, MAY 2005
Fig. 1. Main window of the series HEV Simulink model.
Even in a dynamic model there are tradeoffs to be made interms of detail versus simulation time. Detailed behavior of adc-to-dc converter switching at 100 kHz or higher, for example,requires nanosecond time resolution. Time constants of othervehicle components, such as the fuel cell, are in the range oftens of seconds, so a simulation over several minutes is neces-sary to get useful results. To manage the computational burden,switching power converters are implemented as averagedmodels [11] in this system. Loss models of power electronicsdevices are added and derive results from the averaged models.Switching losses of the devices can be estimated separatelybased on component datasheets and peak operating voltagesand currents. This simplification permits time steps on theorder of microseconds, yet still yields accurate results aboutfast dynamics of the vehicle system.
III. IMPLEMENTATION AND SUBSYSTEM MODELS
The dynamic model of an HEV system has been implementedin the Matlab/Simulink environment. Advantages of Matlab arethe extensive component library of Simulink, the flexibility inimplementing behavioral and physical models, Simulink’s mod-ular interface with subsystems, and simple data handling andstorage. However, Matlab is slow owing to its extensive capa-bilities. The Mathworks Real-Time Workshop (RTW), a toolboxembedded in Matlab and Simulink, was used to improve the re-sults. Instead of solving the model directly within Matlab, theRTW-toolbox creates executable code based on C++, which alsocontains the desired solver-algorithm. It reduces typical simula-tion time by up to a factor of ten compared to Simulink [12].With this tool, a full 1400 s drive cycle requires about 12 h ofsimulation time on a computer with a Pentium 4 processor and512 MB of memory.
In this HEV simulation system, three main components canbe identified, as shown in Fig. 1: the primary energy source(i.e., engine-generator set or fuel cell), the energy storagemodule (battery or ultracapacitor), and the traction systemincluding all vehicle dynamics. Each is broken down intosubsystems where dynamic models are implemented. In afuel cell car or series HEV, the components share a commondc-bus. The traction load determines the total instantaneouspower used by the system.
Fig. 2. Block diagram of traction system.
A. Traction System
The block diagram of the traction system is shown in Fig. 2.The vehicle is driven by a power electronics drive comprisedof a controller, power electronics devices, and an induction ma-chine. The transmission block models the translation of motortorque into wheel torque. The vehicle dynamics block simulatesroad conditions and actual load. The traction system model wasderived in [9], and its important features are summarized in thefollowing paragraphs.
1) Motor Drive and Control: Inputs to the traction systemare the dc-bus voltage and a torque command . Thelatter is calculated to deliver the required road power. A field-oriented controller (FOC) calculates the motor current com-mand from power, speed and motor parameters. Field weak-ening is enforced in the controller although the induction ma-chine seldom enters this operation region. When the gears areshifted, the transmission block sends a new torque command
to accelerate or decelerate the induction machine. TheFOC controller follows this command dynamically through asimulated shifting sequence.
The power electronics drive uses an averaged model andfast current regulator. The device models are based on insu-lated-gate bipolar transistors (IGBTs) and include forwardvoltage drop and forward conducting resistance. The loadcurrent on the dc-bus, , is the electrical input needed bythe traction system,
(1)
where is the forward resistance and is the for-ward voltage drop of one IGBT. This dynamic representation isequally valid for motoring or for regeneration.
The induction machine is modeled in the conventionalmanner [13], based on linear magnetics. In practice, the FOCcontroller limits the flux level and avoids saturation effects.
AMRHEIN AND KREIN: DYNAMIC SIMULATION FOR ANALYSIS OF HEV SYSTEM 827
Fig. 3. Transmission block diagram.
The linear motor parameters were determined experimentallyfor the motor used in [10] and [14]. Joule losses in the motorwere included in the model with a look-up table based onexperimental motor data [14].
2) Transmission Model: The transmission model is for afive-speed “semimanual” gearbox. Since the drive response isvery fast, the mechanism for shifting a gear is simple and quick.When the shift process begins, the induction machine torque isremoved from the drive shaft, the transmission enters neutral,and the motor is controlled to accelerate or decelerate to a speedsynchronized with the new gear. The new gear is then engagedand motor torque is restored. This process is accomplished inthe real vehicle in the same way with no need for a clutch orcomplications in the mechanism.
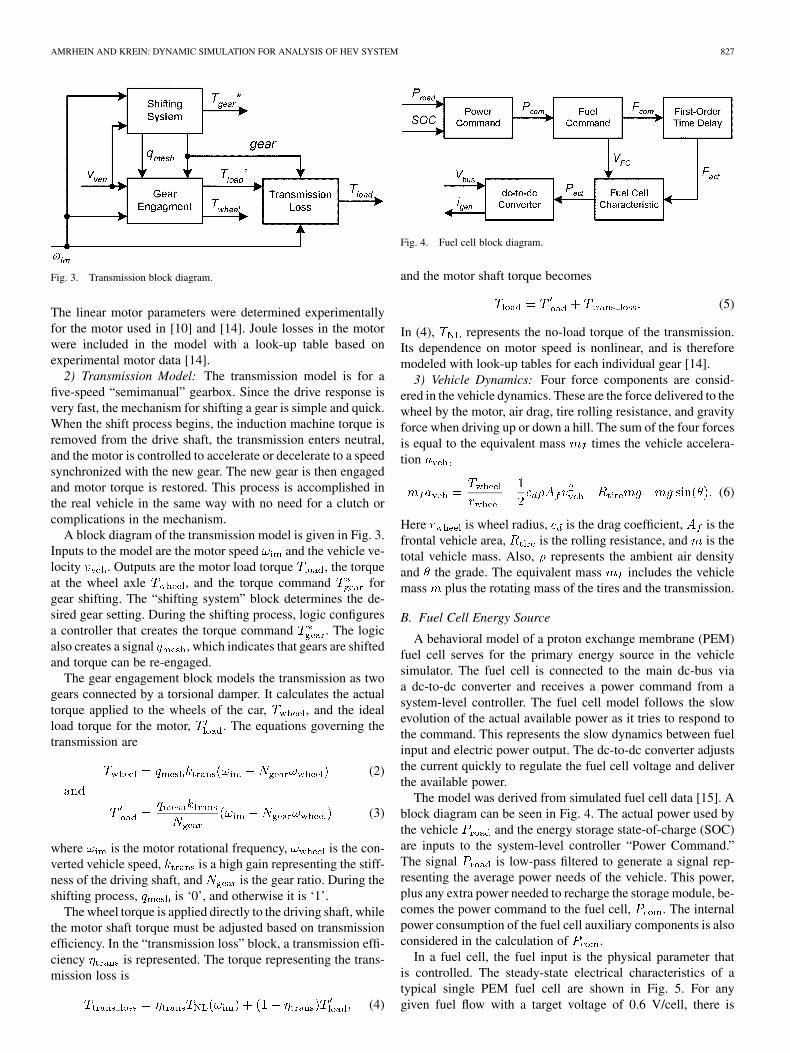
A block diagram of the transmission model is given in Fig. 3.Inputs to the model are the motor speed and the vehicle ve-locity . Outputs are the motor load torque , the torqueat the wheel axle , and the torque command forgear shifting. The “shifting system” block determines the de-sired gear setting. During the shifting process, logic configuresa controller that creates the torque command . The logicalso creates a signal , which indicates that gears are shiftedand torque can be re-engaged.
The gear engagement block models the transmission as twogears connected by a torsional damper. It calculates the actualtorque applied to the wheels of the car, , and the idealload torque for the motor, . The equations governing thetransmission are
(2)
(3)
where is the motor rotational frequency, is the con-verted vehicle speed, is a high gain representing the stiff-ness of the driving shaft, and is the gear ratio. During theshifting process, is ‘0’, and otherwise it is ‘1’.
The wheel torque is applied directly to the driving shaft, whilethe motor shaft torque must be adjusted based on transmissionefficiency. In the “transmission loss” block, a transmission effi-ciency is represented. The torque representing the trans-mission loss is
(4)
Fig. 4. Fuel cell block diagram.
and the motor shaft torque becomes
(5)
In (4), represents the no-load torque of the transmission.Its dependence on motor speed is nonlinear, and is thereforemodeled with look-up tables for each individual gear [14].
3) Vehicle Dynamics: Four force components are consid-ered in the vehicle dynamics. These are the force delivered to thewheel by the motor, air drag, tire rolling resistance, and gravityforce when driving up or down a hill. The sum of the four forcesis equal to the equivalent mass times the vehicle accelera-tion
(6)
Here is wheel radius, is the drag coefficient, is thefrontal vehicle area, is the rolling resistance, and is thetotal vehicle mass. Also, represents the ambient air densityand the grade. The equivalent mass includes the vehiclemass plus the rotating mass of the tires and the transmission.
B. Fuel Cell Energy Source
A behavioral model of a proton exchange membrane (PEM)fuel cell serves for the primary energy source in the vehiclesimulator. The fuel cell is connected to the main dc-bus viaa dc-to-dc converter and receives a power command from asystem-level controller. The fuel cell model follows the slowevolution of the actual available power as it tries to respond tothe command. This represents the slow dynamics between fuelinput and electric power output. The dc-to-dc converter adjuststhe current quickly to regulate the fuel cell voltage and deliverthe available power.
The model was derived from simulated fuel cell data [15]. Ablock diagram can be seen in Fig. 4. The actual power used bythe vehicle and the energy storage state-of-charge (SOC)are inputs to the system-level controller “Power Command.”The signal is low-pass filtered to generate a signal rep-resenting the average power needs of the vehicle. This power,plus any extra power needed to recharge the storage module, be-comes the power command to the fuel cell, . The internalpower consumption of the fuel cell auxiliary components is alsoconsidered in the calculation of .
In a fuel cell, the fuel input is the physical parameter thatis controlled. The steady-state electrical characteristics of atypical single PEM fuel cell are shown in Fig. 5. For anygiven fuel flow with a target voltage of 0.6 V/cell, there is

828 IEEE TRANSACTIONS ON VEHICULAR TECHNOLOGY, VOL. 54, NO. 3, MAY 2005
Fig. 5. Steady-state characteristics of single PEM fuel cell.
Fig. 6. Topology for dc-to-dc converter in fuel cell unit.
a one-to-one mapping between output power and fuel input.This mapping is implemented in a look-up table, and the fuelcommand is determined by the appropriate current ofa single cell. The cell current can be calculated from thepower command .
The third block in Fig. 4 is a first-order time delay, whichmodels the slow rate of change of the available fuel relativeto the actual commanded fuel input. Different time constantscan be defined for fuel increase and fuel decrease. (Typicallya real fuel cell responds more quickly to a decrease). The “fuelcell characteristic” block calculates the actual output poweravailable from the fuel cell stack at any moment by applying theinverse of the output power—fuel input characteristic.
Since the dc-dc converter has much faster dynamics than thefuel cell, it can deliver all the available fuel cell output power (ata low voltage) to the dc-bus (typically at a higher voltage) withnegligible delay. It is possible to calculate the power losses inthe converter based on the configuration shown in Fig. 6. Fourswitches on the primary side of the transformer (fuel cell side),either MOSFETs or IGBTs, are operated in a 50% duty cyclesequence [16]. The total losses in the four switches can be com-puted as
(7)
where is the total output current of the fuel cell stack,the series resistance of one device and the forward drop ofone device. In the case of MOSFETs, the parameter is setto zero to represent the purely resistive behavior of the devices.On the secondary side of the transformer, the power loss in thediodes is determined by
(8)
where is the series resistance and the forward drop ofone diode, and and the number of winding turns on thetransformer for the primary and the secondary side, respectively.Here the output voltage of the fuel cell stack is controlled to bea target cell voltage times the number of cells in series . Thediode duty ratios are determined by
(9)
The converter power loss plus is subtracted from theoutput power of the fuel cell, , and the result is divided by
. The resulting current is the actual value delivered tothe dc-bus.
C. Energy Storage—Batteries and Ultracapacitors
1) Battery: The batteries, modeled in [10], are conventional12 V lead acid types, with rated capacity of 302 W-h each. Asimple model with a controlled voltage source and a variable se-ries resistor has been established from battery test data. Look-uptables have been created to relate the stored energy to the batteryvoltage and resistance. SOC is an index of the available batteryenergy. It is calculated by
(10)
where is the current battery energy and is thenominal battery capacity. To calculate the instantaneous batteryenergy, the charge or discharge power of the battery is relatedto the actual change in battery energy. This relationship can beexpressed as
(11)
where is the input battery power or discharge rate andis a function relating the discharge rate to the battery
capacity approximated empirically [9]. Notice that this equationrepresents battery loss, since for all .
2) Ultracapacitor: Ultracapacitors have the advantage ofnear-instantaneous energy delivery. The stored energy can betransferred to the dc-bus at nearly any discharge rate. In con-trast, batteries will experience high internal losses if they aredischarged too quickly. Thus ultracapacitors are of considerableinterest for HEV applications.
A model of an ultracapacitor consists of the capacitance andan equivalent series resistance (ESR). Since capacitor voltagedepends on stored energy, wide variation is needed to take full

AMRHEIN AND KREIN: DYNAMIC SIMULATION FOR ANALYSIS OF HEV SYSTEM 829
Fig. 7. Boost converter configuration for ultracapacitor.
advantage of storage. Thus a dc-dc converter interfaces the ca-pacitor to the dc-bus. Here a bidirectional boost converter is im-plemented, based on an ultracapacitor maximum design voltagelevel lower than the nominal dc-bus voltage. The configurationis given in Fig. 7. The duty ratio of switch #2 provides con-trol, while duty ratio of switch #1 is the complement of .The control is fast enough to react to transients of drive load cur-rent while holding the dc-bus voltage close to its nominalvalue.
Losses in the ultracapacitor occur in the ESR and the dc-dcconverter switches. For each switch, the losses can be expressedas
(12)
where is the forward drop voltage and the series re-sistance of the switch. When MOSFETs are used, is set tozero. In a bidirectional boost converter as in Fig. 7, MOSFETdevices would act as synchronous rectifiers. Each MOSFET willconduct for either current polarity, and the reverse diode is notused [11]. This makes the model (12) independent of currentpolarity and justifies the simple form. Because and arecomplementary, the combined loss for both switches is there-fore
(13)
and the total loss of the ultracapacitor storage unit is
(14)
With IGBTs, the reverse diode is usually matched to the tran-sistor, and (13) remains valid regardless of the energy flow di-rection.
In the derivation and analysis of the converter losses, onlyconduction losses were considered, and switching losses wereexcluded because of the time step constraints as explained inSection II. Switching losses can be estimated, for example, as
(15)
where is the device voltage in off-state, is the device cur-rent in on-state, is the total switching time, and isthe converter switching frequency. The time representsa detailed device parameter that varies significantly between
TABLE ITRACTION SYSTEM PARAMETERS
TABLE IIFUEL CELL ENERGY SOURCE PARAMETERS
various devices and also has decreased with each new devicegeneration. Switching loss estimates are of limited value whenmaking general comparisons of different converter topologieswith different device types, because exact specifications of aparticular device are necessary. In a more advanced simulationwith specific converter topologies and devices, switching lossestimation can be added in the form of (15).
Like the battery, a signal SOC is needed to communicate withthe fuel cell. The total energy stored in an ultracapacitor is pro-portional to the actual capacitor voltage squared. Thus the SOCis
(16)
where is the actual voltage, and is the maximumallowed voltage.
D. Simulation Parameters
Parameters from a possible vehicle design and design param-eters for possible fuel cells and ultracapacitors have been com-bined to create a comprehensive simulation example and study.Table I presents the parameters of the traction system. Tables IIand III present parameters for the fuel cell and energy storagemodule, respectively. General model data are given in Table IV.

830 IEEE TRANSACTIONS ON VEHICULAR TECHNOLOGY, VOL. 54, NO. 3, MAY 2005
TABLE IIIENERGY STORAGE PARAMETERS
TABLE IVGENERAL PARAMETERS
IV. SIMULATION RESULTS AND ANALYSIS
Sample simulation results presented here focus on the dy-namic behavior of currents and voltages in the system and thelosses in the subsystems. Three different vehicle configurationsare simulated. In the first, the fuel cell is disabled and the bat-tery pack is used as the sole energy source, essentially reducingthe model to an electric vehicle. The second uses the fuel cell asthe primary energy source and the battery as the energy storageunit. The third combines the fuel cell with an ultracapacitor asthe energy storage unit. All configurations are simulated overthe FUDS city cycle [17].
A. Validation
Simulation results have been validated against a real serieshybrid electric vehicle [10]. Fig. 8 shows two comparisons ofthe simulated and measured output battery power over urbanand highway driving profiles experienced during local tests. Themodel closely follows the actual behavior of the vehicle in theurban profile but is less accurate in the highway profile. Rea-sons for the differences are identified and analyzed in [10]. Themost significant issue is the absence of real-time driving infor-mation during actual road tests: the simulation assigns zero windand a flat road. Although the tests were conducted under rela-tively calm conditions over flat terrain, small deviations in windand road slope are sufficient to explain the errors. There are alsosmall velocity measurement errors because of uncertainty in tireradius, and the transmission loss is modeled only as a fixed ef-ficiency.
B. Electric Vehicle, Battery Storage
As an example, consider a case in which the fuel cell is offand the car operates as an electric vehicle (EV) with batteriesas its sole power source. The battery pack capacity is 28.3 MJ(7.85 kWh)—somewhat larger than battery packs found in cur-rent production HEVs. The model uses 26 batteries in series toachieve a bus voltage level of 312 V. The initial SOC was set to70%.
Fig. 8. Battery output power of University of Illinois series HEV for differentdrive profiles. (a) Urban drive cycle. (b) Highway drive cycle.
Results of the simulation are shown in Fig. 9. The batterySOC [Fig. 9(a)] decreases by 39% or 11 MJ during the cycle,corresponding to an average power of 7.86 kW over 1400 s.Fig. 9(b) shows that the charge decrease leads to a decrease inbattery voltage and bus voltage, which fluctuates around the bat-tery voltage. Battery losses, given in Fig. 9(c), have an averagevalue of 3.95 kW. The average power required by the vehicleduring the drive cycle is 3.9 kW, so system efficiency under thistest is just under 50%. More details about average powers aregiven in Table V.
C. HEV With Fuel Cell and Batteries
The fuel cell is the primary energy source of the vehicle, andthe batteries balance the power production and consumption inthe system. The fuel cell setup consists of 151 fuel cell stacksin parallel, each having 80 single cells in series. Assuming thatindividual cells operate at 0.6 V with a maximum current of 8 Aat 100% fuel input, the maximum available output power is 58kW. The dc-dc converter is implemented with 24 parallel MOS-FETs, each rated for 50 A, on the primary transformer side and

AMRHEIN AND KREIN: DYNAMIC SIMULATION FOR ANALYSIS OF HEV SYSTEM 831
Fig. 9. Dynamic behavior in energy storage module of the EV with batteries.(a) Battery SOC. (b) Battery and dc-bus voltage. (c) Battery losses.
with single power diodes on the secondary side. Model param-eters were given in Table II.
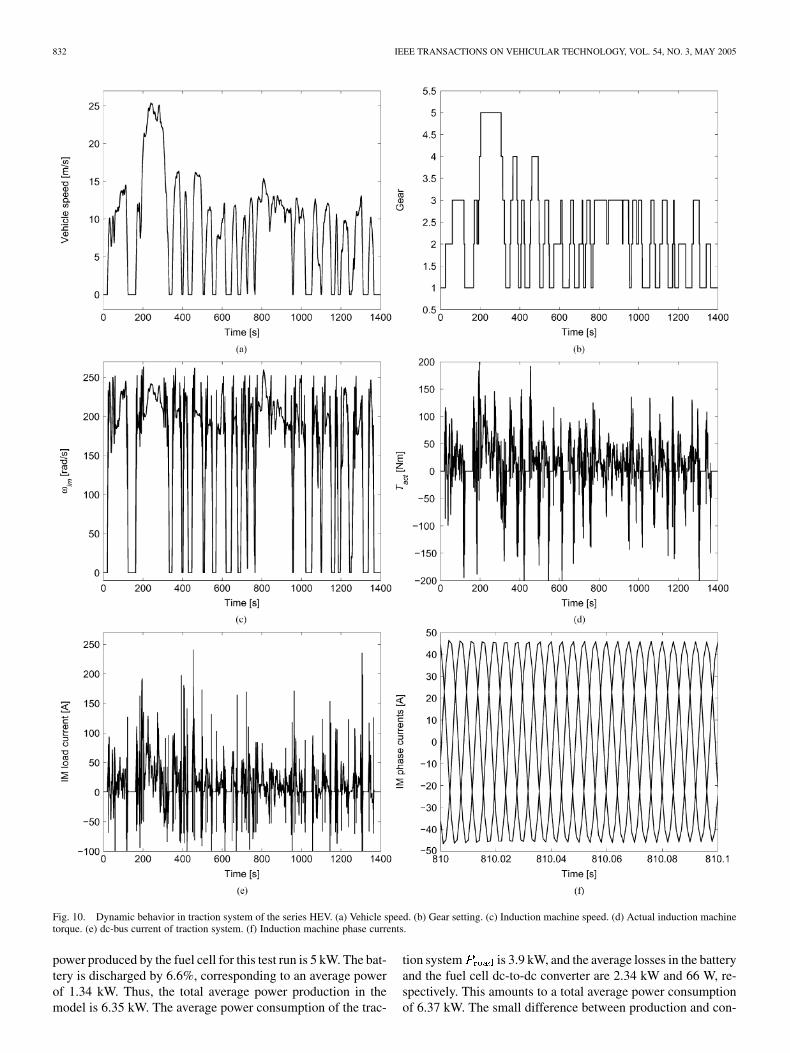
Traction system results are given in Fig. 10. Vehicle speed isshown in Fig. 10(a), with gear settings in Fig. 10(b). The short
TABLE VPOWER BALANCE OF HEV-MODEL
transitions in between two gears, where the transmission is inneutral, have been removed for clarity. The rotational speed ofthe motor is given in Fig. 10(c). Here shifting of gears is clearlyvisible in short-term accelerations and decelerations. The motortorque is shown in Fig. 10(d), where the shifting of gears againis obvious as large spikes in the torque. The same effect, givenin Fig. 10(e), can be observed in the dc-bus load current. Aclose-up view in a small time frame of the three phase currentsin the induction machine is shown in Fig. 10(f).
The time constants associated with the fuel cell are muchslower than those of the traction system. Thus, the behavior ofmost of the fuel cell signals will be slower and closer to an av-erage value. Fig. 11 shows a collection of graphs from the fuelcell. Commanded and actual fuel input is given in Fig. 11(a).The large changes in the commanded fuel input are the resultof quick load changes on the dc-bus. The fuel cell acts as alow-pass filter, and the actual fuel input lags the commandedone. Notice that the turn-on time of the fuel cell is considerablylarger than the turn-off time, as defined in the fuel cell model.The output current of the fuel cell stack going into the dc-dcconverter can be seen in Fig. 11(b). The transients of this cur-rent are slow compared to the induction machine load current,giving an average of the required load current. Thus, the batterymust provide for the resulting current difference on the dc-bus.Fig. 11(c) shows the instantaneous power loss between the fuelcell and the dc-bus in the dc-dc converter.
Fig. 12 shows graphs associated with energy storage basedon lead-acid batteries. The evolution of the battery charge SOCduring the drive cycle can be seen in Fig. 12(a). The battery ca-pacity is larger than needed for this cycle, thus the short-termchanges in the battery charge are only a few percent. Fig. 12(b)shows the associated battery and dc-bus voltage. Notice that thebattery voltage range is narrow because the SOC is changingonly slightly. However, the bus voltage drops significantly everytime the vehicle accelerates and increases when the vehicle re-generates. This is related to battery resistance and the smallbus capacitance. The total battery loss, given in Fig. 12(c), isstrongly influenced by the load variations on the dc-bus. Loador regeneration spikes translate into fast discharges of the bat-tery and result in substantial loss.
A power balance can be used to check the simulator (Table V).Average power produced in the system must equal consumedaverage power plus any change in stored energy. The average
832 IEEE TRANSACTIONS ON VEHICULAR TECHNOLOGY, VOL. 54, NO. 3, MAY 2005
Fig. 10. Dynamic behavior in traction system of the series HEV. (a) Vehicle speed. (b) Gear setting. (c) Induction machine speed. (d) Actual induction machinetorque. (e) dc-bus current of traction system. (f) Induction machine phase currents.
power produced by the fuel cell for this test run is 5 kW. The bat-tery is discharged by 6.6%, corresponding to an average powerof 1.34 kW. Thus, the total average power production in themodel is 6.35 kW. The average power consumption of the trac-
tion system is 3.9 kW, and the average losses in the batteryand the fuel cell dc-to-dc converter are 2.34 kW and 66 W, re-spectively. This amounts to a total average power consumptionof 6.37 kW. The small difference between production and con-

AMRHEIN AND KREIN: DYNAMIC SIMULATION FOR ANALYSIS OF HEV SYSTEM 833
Fig. 11. Dynamic behavior in fuel cell energy source of the series HEV.(a) Commanded and actual fuel input. (b) Fuel cell current. (c) Power loss infuel cell dc-to-dc converter.
sumption is a computational limit. Since large amounts of dataneed to be stored and memory is limited, data is stored onlyevery 100 ms for slow evolving signals and every millisecondfor fast evolving signals instead of at each time step.
Fig. 12. Dynamic behavior in battery energy storage module of the series HEV.(a) Battery SOC. (b) Battery and dc-bus voltage. (c) Battery losses.
Uncertainties in the model and parameters are sources of er-rors when comparing the results with measured data. Some ofthe largest uncertainty factors in this simulation are the fuelcell model and its parameters. The fuel cell, modeled with a

834 IEEE TRANSACTIONS ON VEHICULAR TECHNOLOGY, VOL. 54, NO. 3, MAY 2005
Fig. 13. Dynamic behavior in ultracapacitor storage module of the series HEV.(a) Ultracapacitor SOC. (b) dc-bus voltage. (c) Ultracapacitor module losses.
first-order time delay of steady-state characteristics, is a roughapproximation of a real fuel cell. Other uncertainty factors arethe battery parameters, which were approximated from actualmeasurements. The actual discharge function of the battery is
TABLE VIFUEL CELL CONFIGURATIONS
slightly steeper than modeled, which decreases the output powerand increases battery losses by a small margin.
D. HEV With Fuel Cell and Ultracapacitors
As ultracapacitors respond rapidly, lower capacity can be tol-erated compared to batteries. A 3.2-MJ ultracapacitor should besufficient for the HEV requirements [18]. Assuming a maximumvoltage of 300 V for the ultracapacitor, the required capacitanceis 71 F. The ESR value of the capacitor is assumed to be 0.03
. IGBTs are used in the boost converter between ultracapacitorand dc-bus. A 600-V, 250-A module with its parameters givenin Table III should be sufficient for this task.
The behavior of the traction system and the fuel cell whencombined with an ultracapacitor will be similar to that in Sec-tion IV-C. However, when the ultracapacitor SOC in Fig. 13(a)is compared to the battery SOC in Fig. 12(a), it can be noticedthat the ultracapacitor charge fluctuates more than the batterycharge owing to its smaller capacity. But when power is cycledquickly, the battery experiences high losses, while the losses inthe ultracapacitor are much lower. Thus, with an ultracapacitor,the system is significantly more efficient.
The dc-bus voltage with the ultracapacitor module in placecan be seen in Fig. 13(b). Again, the difference between ultra-capacitor and battery is noticeable. It is evident that the boostconverter between the ultracapacitor and the bus can enforcenear-constant bus voltage. Fig. 13(c) shows the losses in the ul-tracapacitor and the boost converter. Although there is some un-certainty due to the low ultracapacitor ESR, the losses in the ul-tracapacitor module are more than an order of magnitude lowerthan in the battery module.
Once again, the simulation can be checked with a powerbalance. The values of the average power production andconsumption in the series HEV with the ultracapacitor aregiven in Table V. The fuel cell produces about 4.1 kW, whilethe 0.84% charge decrease in the ultracapacitor correspondsto an average power production of 19 W, resulting in a totalaverage power production of 4.12 kW. The losses in thedc-to-dc converter of the fuel cell are 61 W. The losses inthe ultracapacitor module are 133 W, considerably lower thanthe battery losses. The vehicle consumes an average powerof 3.9 kW, so system efficiency (from fuel cell output to theroad) is nearly 95%. The total average power consumption isabout 4.1 kW—very close to the average power production.These impressive results depend on achieving ultracapacitorswith sufficiently low ESR.

AMRHEIN AND KREIN: DYNAMIC SIMULATION FOR ANALYSIS OF HEV SYSTEM 835
TABLE VIIFUEL CELL CONFIGURATION RESULTS
E. Comparison of Power Electronics Devices
The configuration of the fuel cell stack and dc-dc convertercan be implemented in several ways. One configuration shownin Fig. 6 has a low-voltage fuel cell stack (48 V) and MOSFETsas the power electronics device of choice on the primary sideof the dc-dc converter. Another configuration is a high-voltagefuel cell stack (300 V) and IGBTs as the device of choice. Witha voltage of 0.6 V per cell, 500 cells in series are required to geta stack voltage of 300 V. Assuming a maximum current outputof 8 A at 0.6 V per cell, 25 stacks in parallel are necessary inorder to get a power capacity of 58 kW. The total number ofcells used is 12 500 in the high-voltage case, and 12 080 in thelow-voltage case.
The ratings needed by the power electronics devices can bederived from the fuel cell characteristic in Fig. 5. The maximumvoltage per cell is on the order of 1.2 V, and the maximum cur-rent per cell is 8 A, assuming the voltage is not allowed to dropbelow 0.5 V per cell. Thus, in the low-voltage configuration, themaximum stack voltage is 96 V, and the maximum current ofthe total fuel cell is about 1200 A. For the high-voltage configu-ration, the maximum stack voltage is 600 V, and the maximumcurrent 200 A. Both configurations are summarized in Table VI.
Advantages of the high-voltage solution include lower cur-rent requirements and thus reduced cost of components andwiring compared to the low-voltage solution. Disadvantages arethe fabrication process of the fuel cell stack, which are likely tobe more daunting for the high-voltage stack.
Table VII shows the comparison of the two fuel cell configura-tions with different devices. With MOSFETs in the low-voltageconfiguration, losses are between 40 and 70 W, while the IGBTmodule in the high-voltage configuration has losses of about100 W. A low-voltage fuel cell stack with parallel MOSFETs onthe primary side is, therefore, likely to be the better solution.
In general, these simulation results could be used to optimizethe fuel cell stack and to find the best dc-dc converter configura-tion. Component losses from inductors and capacitors could beincluded to give a better estimate of the complete performance.The dynamic simulation tool supports testing of different con-figurations in a reasonable time frame, and provides detailedperformance predictions.
V. CONCLUSION
Steady-state simulation tools for the design and analysis ofhybrid electric automotives have been developed in recent years
and support comparisons over long drive cycles. In the past, dy-namic simulation models have focused mainly on the analysis ofcontrol strategies. In this paper, a dynamic simulation system foran HEV, implemented in Matlab/Simulink, has been presented.The model features fuel cells as the vehicle’s energy source, bat-teries and ultracapacitors as energy storage units, and an induc-tion machine drive in the traction system. The purpose of themodel is to provide an in-depth analysis of sublevel componentsin the vehicle and loss analysis in power electronics devices inconverters associated with these sublevel components. Simula-tion results of three configurations (battery only, fuel cell-bat-tery, and fuel cell-ultracapacitor) were compared, along with theperformances of different power electronics devices in a specificdc-to-dc converter. The results show dramatic differences deter-mined by short-term dynamic energy losses at the subsystemlevel. Specific results show that ultracapacitors are indeed verypromising for HEV applications.
REFERENCES
[1] G. Cole, Simple Electric Vehicle Simulation (SIMPLEV) v3.1: DOEIdaho National Eng. Lab.
[2] K. B. Wipke, M. R. Cuddy, and S. D. Burch, “ADVISOR 2.1: Auser-friendly advanced powertrain simulation using a combined back-ward/forward approach,” IEEE Trans. Veh. Technol., vol. 48, no. 6, pp.1751–1761, Nov. 1999.
[3] The ADVISOR Code and Manual are Available from the National Re-newable Energy Lab. [Online]. Available: http://www.ctts.nrel.gov/anal-ysis
[4] Argonne National Lab. PSAT (Powertrain System AnalysisToolkit) [Online]. Available: http://www.transportation.anl.gov/soft-ware/PSAT/index.html
[5] K. L. Butler, M. Ehsani, and P. Kamath, “A Matlab-based modeling andsimulation package for electric and hybrid electric vehicle design,” IEEETrans. Veh. Technol., vol. 48, no. 6, pp. 1770–1778, Nov. 1999.
[6] S. Onoda and A. Emadi, “PSIM-based modeling of automotive powersystems: Conventional, electric and hybrid electric vehicles,” IEEETrans. Veh. Technol., vol. 53, no. 2, pp. 390–400, Mar. 2004.
[7] S. R. Cikanek, K. E. Bailey, and B. K. Powell, “Parallel hybrid electricvehicle dynamic model and powertrain control,” in Proc. Amer. Contr.Conf., Jun. 1997, pp. 684–688.
[8] C. C. Chan, “The state of the art of electric and hybrid vehicles,” Proc.IEEE, vol. 90, pp. 247–275, Feb. 2002.
[9] D. L. Logue and P. T. Krein, “Dynamic hybrid electric vehicle simula-tion, Version 1.0,” Univ. Illinois, Tech. Rep. UILU-ENG-98-0409, Dec.1998.
[10] P. T. Krein, S. Splater, C. Hidrovo, and D. Logue, “Hybrid vehicle testingand simulation final report,” Univ. Illinois, Tech. Rep. PAP-TR-97-6, Jul.1997.
[11] P. T. Krein, Elements of Power Electronics. New York: Oxford Univ,Press, 1998.
[12] Real-Time Workshop V 5.0, 2002. Mathworks Technical Staff, Math-works.

836 IEEE TRANSACTIONS ON VEHICULAR TECHNOLOGY, VOL. 54, NO. 3, MAY 2005
[13] P. C. Krause, O. Wasynczuk, and S. D. Sudhoff, Analysis of ElectricMachinery. New York: IEEE, 2002.
[14] S. A. Splater, “Power consumption analysis of a practical series hybridelectric vehicle,” Univ. Illinois, Tech. Rep. PAP-TR-96-10, Dec. 1996.
[15] P. Famouri and R. S. Gemmen, “Electrochemical circuit model of a PEMfuel cell,” in Proc. IEEE Power Eng. Soc. General Meeting, 2003, pp.1436–1440.
[16] P. T. Krein and R. Balog, “Low cost inverter suitable for medium-powerfuel cell sources,” in Conf. Rec., IEEE Power Electron. Special., 2002,pp. 321–326.
[17] U.S. Environmental Protection Agency, Federal Urban Driving Schedule(FUDS) 505 [Online]. Available: http://www.epa.gov/otaq/emisslab/methods/uddscol.txt
[18] P. T. Krein and M. Amrhein, “Vehicle system and subsystem interactionwith power electronics,” Univ. Illinois, Tech. Rep. CEME-TR-2004-03,Jul. 2004.
Marco Amrhein (S’02) received the Fach-Hochschul-Diploma in electrical engineering fromZurich University of Applied Sciences, Switzerland.He received the M.S. degree in electrical engineeringfrom the University of Illinois, Urbana.
He is currently working toward the Ph.D. degreein electrical engineering. He is a Research Assistantunder P. T. Krein. In 2001, he was a ResearchEngineer with the Zurich University of AppliedSciences. His research interests include all aspectsof electrical machines, drives, and power electronics,
with emphasis in machine design.Mr. Amrhein was part of the Future Energy Challenge team of the University
of Illinois in 2003, which won second place overall. In 2004, he was awarded theReid Fellowship, a fellowship given to an outstanding student with an interestin an academic career.
Philip T. Krein (S’76–M’82–SM’93–F’00) receivedthe B.S. degree in electrical engineering and the A.B.degree in economics and business from LafayetteCollege, Easton, PA, and the M.S. and Ph.D. degreesin electrical engineering from the University ofIllinois, Urbana.
He was an engineer with Tektronix, Beaverton,OR, then returned to the University of Illinois. Atpresent, he holds the Grainger Endowed Director’sChair in Electric Machinery and Electromechanicsas Director of the Grainger Center for Electric
Machinery and Electromechanics. His research interests address all aspects ofpower electronics, machines, and drives, with emphasis on nonlinear controlapproaches. He published an undergraduate textbook Elements of PowerElectronics (Oxford, U.K.: Oxford University Press, 1998). In 2001, he helpedinitiate the International Future Energy Challenge, a major student competitioninvolving fuel cell power conversion and energy efficiency for machines. Heholds eight U.S. patents.
Dr. Krein is a registered professional engineer in Illinois and in Oregon. Hewas a senior Fulbright Scholar at the University of Surrey in the United Kingdomduring 1997–1998, and was recognized as a University Scholar in 1999, thehighest research award at the University of Illinois. In 2003 he received the IEEEWilliam E. Newell Award in Power Electronics. During 1999–2000, he servedas President of the IEEE Power Electronics Society. At present he is Editor ofIEEE POWER ELECTRONICS LETTERS and serves on the IEEE Board of Directorsfor Division II.
Related Documents