Dynamic relaxation characteristics of Matrimid Ò polyimide Anthony C. Comer a , Douglass S. Kalika a, * , Brandon W. Rowe b, c , Benny D. Freeman b, c , Donald R. Paul b a Department of Chemical and Materials Engineering, University of Kentucky, Lexington, KY 40506-0046, USA b Department of Chemical Engineering and Texas Materials Institute, The University of Texas at Austin, Austin, TX 78712, USA c Center for Energy and Environmental Resources, Department of Chemical Engineering, The University of Texas at Austin, Austin, TX 78758, USA article info Article history: Received 30 July 2008 Received in revised form 2 December 2008 Accepted 7 December 2008 Available online 11 December 2008 Keywords: Dynamic mechanical analysis Dielectric spectroscopy Physical aging abstract The dynamic relaxation characteristics of Matrimid Ò (BTDA–DAPI) polyimide have been investigated using dynamic mechanical and dielectric methods. Matrimid exhibits three motional processes with increasing temperature: two sub-glass relaxations (g and b transitions), and the glassdrubber (a) transition. The low-temperature g transition is purely non-cooperative, and displays an identical time– temperature response to both the dynamic mechanical and the dielectric probes with a corresponding activation energy, E A ¼ 43 kJ/mol. The b sub-glass transition shows a more cooperative character as assessed via the Starkweather method. Comparison of dynamic mechanical and dielectric data for the b process suggests that the dynamic mechanical test (E A ¼ 156 kJ/mol) is sensitive to a broader, more strongly correlated range of sub-glass motions as compared to the dielectric probe (E A ¼ 99 kJ/mol). Time–temperature superposition was used to establish mechanical master curves across the glass– rubber (a) relaxation, and these data could be described using the Kohlrausch–Williams–Watts function with an exponent value, b KWW ¼ 0.34. The corresponding shift factors were used as the basis of a cooperativity plot for the determination of dynamic fragility. The relation between fragility index (m ¼ 115) and b KWW for the Matrimid polyimide was in good agreement with the wide correlation reported in the literature. Ó 2008 Elsevier Ltd. All rights reserved. 1. Introduction Polymers below their glass transition temperature, T g , are non- equilibrium materials that evolve over time towards an equilibrium state. This process, known as physical aging, is manifested by changes in physical properties of the polymer and has been studied extensively for bulk materials [1–3]. Physical aging is strongly dependent on the system temperature, which affects both segmental mobility and displacement from equilibrium [4]. Molecular motions that persist below the glass transition, related to secondary transitions, allow physical aging to proceed by small localized rearrangements towards equilibrium [2]. It has been suggested that physical aging does not continue at temperatures below the sub-glass transition range, because the localized motions related to these processes become frozen. However, evidence of low-temperature aging (i.e., below the sub- glass transition) has been reported [5,6]. For example, Lee and McGarry showed that cooperative segmental motions exist at temperatures below T b in polystyrene, as evidenced by isothermal volume relaxation [6]. By studying the effect of secondary relaxa- tions on physical aging, additional insight regarding the molecular mechanisms responsible for aging may be obtained and improved performance predictions, as well as strategies to control and possibly arrest physical aging, can be developed. Matrimid Ò is a high T g , amorphous thermoplastic polyimide comprised of 3,3 0 -4,4 0 -benzophenone tetracarboxylic dianhydride (BTDA) and diaminophenylindane (DAPI); see Fig. 1 [7]. Matrimid is a useful material for the creation of gas separation membranes [8– 10]. However, the performance of these membranes decreases over time due to physical aging [11–13]. In an effort to more fully understand the mechanisms responsible for physical aging in the BTDA–DAPI polyimide, a comprehensive study of the dynamic relaxation characteristics of the commercial polymer has been undertaken. Specifically, dynamic mechanical analysis (DMA) and broadband dielectric spectroscopy (BDS) have been used to deter- mine the glass–rubber and sub-glass transition properties of the Matrimid polyimide. This detailed investigation provides valuable information regarding the nature of the underlying motional processes responsible for these transitions, and their potential relationship to physical aging. * Corresponding author. Department of Chemical and Materials Engineering, University of Kentucky, 177 Anderson Hall (Tower), Lexington, KY 40506-0046, USA. Tel.: þ1 859 257 5507; fax: þ1 859 323 1929. E-mail address: [email protected] (D.S. Kalika). Contents lists available at ScienceDirect Polymer journal homepage: www.elsevier.com/locate/polymer 0032-3861/$ – see front matter Ó 2008 Elsevier Ltd. All rights reserved. doi:10.1016/j.polymer.2008.12.013 Polymer 50 (2009) 891–897

Welcome message from author
This document is posted to help you gain knowledge. Please leave a comment to let me know what you think about it! Share it to your friends and learn new things together.
Transcript
lable at ScienceDirect
Polymer 50 (2009) 891–897
Contents lists avai
Polymer
journal homepage: www.elsevier .com/locate/polymer
Dynamic relaxation characteristics of Matrimid� polyimide
Anthony C. Comer a, Douglass S. Kalika a,*, Brandon W. Rowe b,c, Benny D. Freeman b,c, Donald R. Paul b
a Department of Chemical and Materials Engineering, University of Kentucky, Lexington, KY 40506-0046, USAb Department of Chemical Engineering and Texas Materials Institute, The University of Texas at Austin, Austin, TX 78712, USAc Center for Energy and Environmental Resources, Department of Chemical Engineering, The University of Texas at Austin, Austin, TX 78758, USA
a r t i c l e i n f o
Article history:Received 30 July 2008Received in revised form2 December 2008Accepted 7 December 2008Available online 11 December 2008
Keywords:Dynamic mechanical analysisDielectric spectroscopyPhysical aging
* Corresponding author. Department of ChemicalUniversity of Kentucky, 177 Anderson Hall (Tower), LexTel.: þ1 859 257 5507; fax: þ1 859 323 1929.
E-mail address: [email protected] (D.S. Kalika).
0032-3861/$ – see front matter � 2008 Elsevier Ltd.doi:10.1016/j.polymer.2008.12.013
a b s t r a c t
The dynamic relaxation characteristics of Matrimid� (BTDA–DAPI) polyimide have been investigatedusing dynamic mechanical and dielectric methods. Matrimid exhibits three motional processes withincreasing temperature: two sub-glass relaxations (g and b transitions), and the glassdrubber (a)transition. The low-temperature g transition is purely non-cooperative, and displays an identical time–temperature response to both the dynamic mechanical and the dielectric probes with a correspondingactivation energy, EA¼ 43 kJ/mol. The b sub-glass transition shows a more cooperative character asassessed via the Starkweather method. Comparison of dynamic mechanical and dielectric data for theb process suggests that the dynamic mechanical test (EA¼ 156 kJ/mol) is sensitive to a broader, morestrongly correlated range of sub-glass motions as compared to the dielectric probe (EA¼ 99 kJ/mol).Time–temperature superposition was used to establish mechanical master curves across the glass–rubber (a) relaxation, and these data could be described using the Kohlrausch–Williams–Watts functionwith an exponent value, bKWW¼ 0.34. The corresponding shift factors were used as the basis ofa cooperativity plot for the determination of dynamic fragility. The relation between fragility index(m¼ 115) and bKWW for the Matrimid polyimide was in good agreement with the wide correlationreported in the literature.
� 2008 Elsevier Ltd. All rights reserved.
1. Introduction
Polymers below their glass transition temperature, Tg, are non-equilibrium materials that evolve over time towards an equilibriumstate. This process, known as physical aging, is manifested bychanges in physical properties of the polymer and has been studiedextensively for bulk materials [1–3]. Physical aging is stronglydependent on the system temperature, which affects bothsegmental mobility and displacement from equilibrium [4].Molecular motions that persist below the glass transition, related tosecondary transitions, allow physical aging to proceed by smalllocalized rearrangements towards equilibrium [2].
It has been suggested that physical aging does not continue attemperatures below the sub-glass transition range, because thelocalized motions related to these processes become frozen.However, evidence of low-temperature aging (i.e., below the sub-glass transition) has been reported [5,6]. For example, Lee and
and Materials Engineering,ington, KY 40506-0046, USA.
All rights reserved.
McGarry showed that cooperative segmental motions exist attemperatures below Tb in polystyrene, as evidenced by isothermalvolume relaxation [6]. By studying the effect of secondary relaxa-tions on physical aging, additional insight regarding the molecularmechanisms responsible for aging may be obtained and improvedperformance predictions, as well as strategies to control andpossibly arrest physical aging, can be developed.
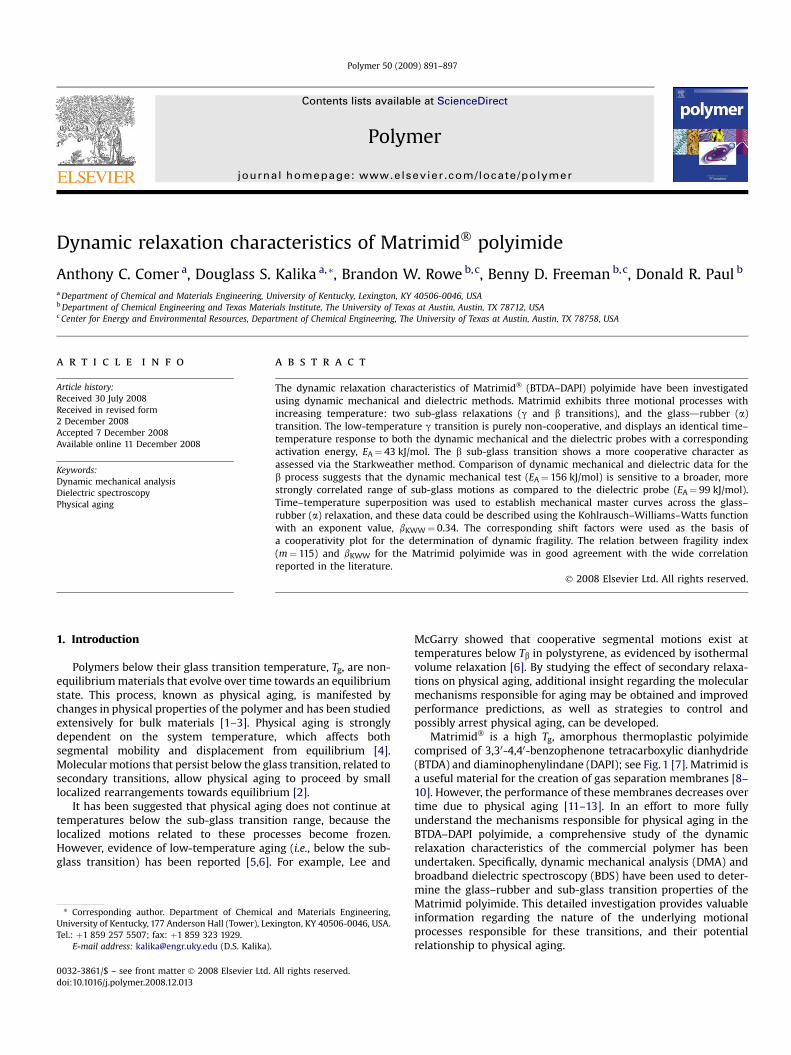
Matrimid� is a high Tg, amorphous thermoplastic polyimidecomprised of 3,30-4,40-benzophenone tetracarboxylic dianhydride(BTDA) and diaminophenylindane (DAPI); see Fig. 1 [7]. Matrimid isa useful material for the creation of gas separation membranes [8–10]. However, the performance of these membranes decreases overtime due to physical aging [11–13]. In an effort to more fullyunderstand the mechanisms responsible for physical aging in theBTDA–DAPI polyimide, a comprehensive study of the dynamicrelaxation characteristics of the commercial polymer has beenundertaken. Specifically, dynamic mechanical analysis (DMA) andbroadband dielectric spectroscopy (BDS) have been used to deter-mine the glass–rubber and sub-glass transition properties of theMatrimid polyimide. This detailed investigation provides valuableinformation regarding the nature of the underlying motionalprocesses responsible for these transitions, and their potentialrelationship to physical aging.
Temperature (°C)
-150 -50 50 150 250 350 450
Sto
rag
e M
od
ulu
s (P
a)
106
107
108
109
1010
Lo
ss M
od
ulu
s (P
a)
106
107
108
109
1010
1 Hz
βγ α
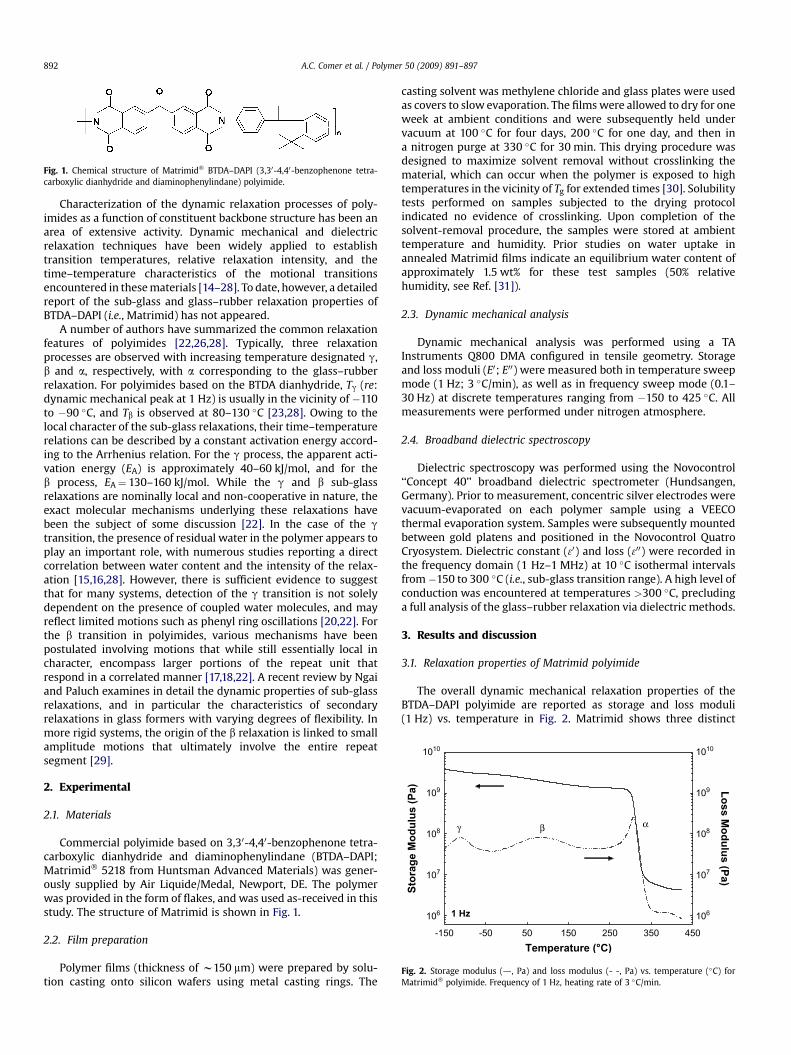
Fig. 2. Storage modulus (d, Pa) and loss modulus (- -, Pa) vs. temperature (�C) forMatrimid� polyimide. Frequency of 1 Hz, heating rate of 3 �C/min.
Fig. 1. Chemical structure of Matrimid� BTDA–DAPI (3,30-4,40-benzophenone tetra-carboxylic dianhydride and diaminophenylindane) polyimide.
A.C. Comer et al. / Polymer 50 (2009) 891–897892
Characterization of the dynamic relaxation processes of poly-imides as a function of constituent backbone structure has been anarea of extensive activity. Dynamic mechanical and dielectricrelaxation techniques have been widely applied to establishtransition temperatures, relative relaxation intensity, and thetime–temperature characteristics of the motional transitionsencountered in these materials [14–28]. To date, however, a detailedreport of the sub-glass and glass–rubber relaxation properties ofBTDA–DAPI (i.e., Matrimid) has not appeared.
A number of authors have summarized the common relaxationfeatures of polyimides [22,26,28]. Typically, three relaxationprocesses are observed with increasing temperature designated g,b and a, respectively, with a corresponding to the glass–rubberrelaxation. For polyimides based on the BTDA dianhydride, Tg (re:dynamic mechanical peak at 1 Hz) is usually in the vicinity of �110to �90 �C, and Tb is observed at 80–130 �C [23,28]. Owing to thelocal character of the sub-glass relaxations, their time–temperaturerelations can be described by a constant activation energy accord-ing to the Arrhenius relation. For the g process, the apparent acti-vation energy (EA) is approximately 40–60 kJ/mol, and for theb process, EA¼ 130–160 kJ/mol. While the g and b sub-glassrelaxations are nominally local and non-cooperative in nature, theexact molecular mechanisms underlying these relaxations havebeen the subject of some discussion [22]. In the case of the gtransition, the presence of residual water in the polymer appears toplay an important role, with numerous studies reporting a directcorrelation between water content and the intensity of the relax-ation [15,16,28]. However, there is sufficient evidence to suggestthat for many systems, detection of the g transition is not solelydependent on the presence of coupled water molecules, and mayreflect limited motions such as phenyl ring oscillations [20,22]. Forthe b transition in polyimides, various mechanisms have beenpostulated involving motions that while still essentially local incharacter, encompass larger portions of the repeat unit thatrespond in a correlated manner [17,18,22]. A recent review by Ngaiand Paluch examines in detail the dynamic properties of sub-glassrelaxations, and in particular the characteristics of secondaryrelaxations in glass formers with varying degrees of flexibility. Inmore rigid systems, the origin of the b relaxation is linked to smallamplitude motions that ultimately involve the entire repeatsegment [29].
2. Experimental
2.1. Materials
Commercial polyimide based on 3,30-4,40-benzophenone tetra-carboxylic dianhydride and diaminophenylindane (BTDA–DAPI;Matrimid� 5218 from Huntsman Advanced Materials) was gener-ously supplied by Air Liquide/Medal, Newport, DE. The polymerwas provided in the form of flakes, and was used as-received in thisstudy. The structure of Matrimid is shown in Fig. 1.
2.2. Film preparation
Polymer films (thickness of w150 mm) were prepared by solu-tion casting onto silicon wafers using metal casting rings. The
casting solvent was methylene chloride and glass plates were usedas covers to slow evaporation. The films were allowed to dry for oneweek at ambient conditions and were subsequently held undervacuum at 100 �C for four days, 200 �C for one day, and then ina nitrogen purge at 330 �C for 30 min. This drying procedure wasdesigned to maximize solvent removal without crosslinking thematerial, which can occur when the polymer is exposed to hightemperatures in the vicinity of Tg for extended times [30]. Solubilitytests performed on samples subjected to the drying protocolindicated no evidence of crosslinking. Upon completion of thesolvent-removal procedure, the samples were stored at ambienttemperature and humidity. Prior studies on water uptake inannealed Matrimid films indicate an equilibrium water content ofapproximately 1.5 wt% for these test samples (50% relativehumidity, see Ref. [31]).
2.3. Dynamic mechanical analysis
Dynamic mechanical analysis was performed using a TAInstruments Q800 DMA configured in tensile geometry. Storageand loss moduli (E0; E00) were measured both in temperature sweepmode (1 Hz; 3 �C/min), as well as in frequency sweep mode (0.1–30 Hz) at discrete temperatures ranging from �150 to 425 �C. Allmeasurements were performed under nitrogen atmosphere.
2.4. Broadband dielectric spectroscopy
Dielectric spectroscopy was performed using the Novocontrol‘‘Concept 40’’ broadband dielectric spectrometer (Hundsangen,Germany). Prior to measurement, concentric silver electrodes werevacuum-evaporated on each polymer sample using a VEECOthermal evaporation system. Samples were subsequently mountedbetween gold platens and positioned in the Novocontrol QuatroCryosystem. Dielectric constant (30) and loss (300) were recorded inthe frequency domain (1 Hz–1 MHz) at 10 �C isothermal intervalsfrom�150 to 300 �C (i.e., sub-glass transition range). A high level ofconduction was encountered at temperatures >300 �C, precludinga full analysis of the glass–rubber relaxation via dielectric methods.
3. Results and discussion
3.1. Relaxation properties of Matrimid polyimide
The overall dynamic mechanical relaxation properties of theBTDA–DAPI polyimide are reported as storage and loss moduli(1 Hz) vs. temperature in Fig. 2. Matrimid shows three distinct
Temperature (°C)
-50 0 50 100 150 200 250
Lo
ss M
od
ulu
s (G
Pa)
0.00
0.03
0.06
0.09
0.12
0.15
Temperature (°C)
-160 -140 -120 -100 -80 -60 -40
Lo
ss M
od
ulu
s (G
Pa)
0.00
0.02
0.04
0.06
0.08
0.10
0.12a
γ transition
0.1 Hz0.3 Hz1 Hz3 Hz10 Hz30 Hz
b
β transition
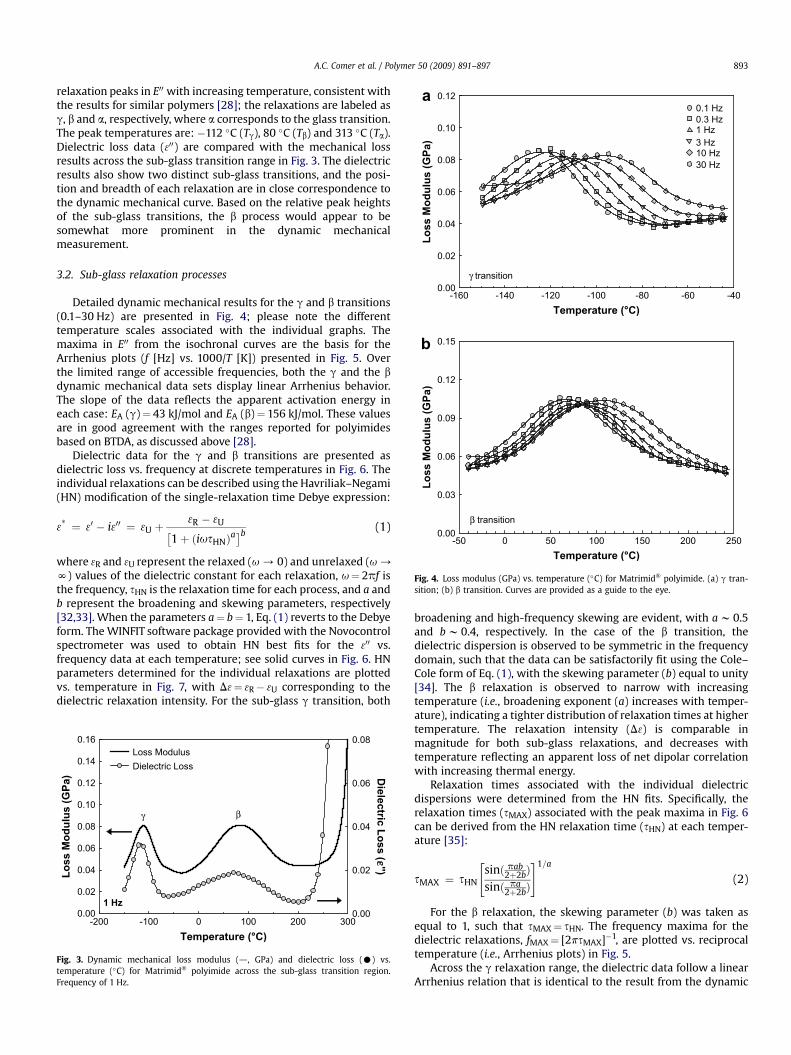
Fig. 4. Loss modulus (GPa) vs. temperature (�C) for Matrimid� polyimide. (a) g tran-sition; (b) b transition. Curves are provided as a guide to the eye.
A.C. Comer et al. / Polymer 50 (2009) 891–897 893
relaxation peaks in E00 with increasing temperature, consistent withthe results for similar polymers [28]; the relaxations are labeled asg, b and a, respectively, where a corresponds to the glass transition.The peak temperatures are: �112 �C (Tg), 80 �C (Tb) and 313 �C (Ta).Dielectric loss data (300) are compared with the mechanical lossresults across the sub-glass transition range in Fig. 3. The dielectricresults also show two distinct sub-glass transitions, and the posi-tion and breadth of each relaxation are in close correspondence tothe dynamic mechanical curve. Based on the relative peak heightsof the sub-glass transitions, the b process would appear to besomewhat more prominent in the dynamic mechanicalmeasurement.
3.2. Sub-glass relaxation processes
Detailed dynamic mechanical results for the g and b transitions(0.1–30 Hz) are presented in Fig. 4; please note the differenttemperature scales associated with the individual graphs. Themaxima in E00 from the isochronal curves are the basis for theArrhenius plots (f [Hz] vs. 1000/T [K]) presented in Fig. 5. Overthe limited range of accessible frequencies, both the g and the bdynamic mechanical data sets display linear Arrhenius behavior.The slope of the data reflects the apparent activation energy ineach case: EA (g)¼ 43 kJ/mol and EA (b)¼ 156 kJ/mol. These valuesare in good agreement with the ranges reported for polyimidesbased on BTDA, as discussed above [28].
Dielectric data for the g and b transitions are presented asdielectric loss vs. frequency at discrete temperatures in Fig. 6. Theindividual relaxations can be described using the Havriliak–Negami(HN) modification of the single-relaxation time Debye expression:
3* ¼ 30 � i300 ¼ 3U þ3R � 3U�
1þ ðiusHNÞa�b (1)
where 3R and 3U represent the relaxed (u / 0) and unrelaxed (u /
N) values of the dielectric constant for each relaxation, u¼ 2pf isthe frequency, sHN is the relaxation time for each process, and a andb represent the broadening and skewing parameters, respectively[32,33]. When the parameters a¼ b¼ 1, Eq. (1) reverts to the Debyeform. The WINFIT software package provided with the Novocontrolspectrometer was used to obtain HN best fits for the 300 vs.frequency data at each temperature; see solid curves in Fig. 6. HNparameters determined for the individual relaxations are plottedvs. temperature in Fig. 7, with D3¼ 3R� 3U corresponding to thedielectric relaxation intensity. For the sub-glass g transition, both
Temperature (°C)
-200 -100 0 100 200 3000.00
0.02
0.04
0.06
0.08
Lo
ss M
od
ulu
s (G
Pa)
0.00
0.02
0.04
0.06
0.08
0.10
0.12
0.14
0.16
1 Hz
Dielectric LossLoss Modulus
Dielectric L
oss ( '')
γ β
Fig. 3. Dynamic mechanical loss modulus (d, GPa) and dielectric loss (C) vs.temperature (�C) for Matrimid� polyimide across the sub-glass transition region.Frequency of 1 Hz.
broadening and high-frequency skewing are evident, with a w 0.5and b w 0.4, respectively. In the case of the b transition, thedielectric dispersion is observed to be symmetric in the frequencydomain, such that the data can be satisfactorily fit using the Cole–Cole form of Eq. (1), with the skewing parameter (b) equal to unity[34]. The b relaxation is observed to narrow with increasingtemperature (i.e., broadening exponent (a) increases with temper-ature), indicating a tighter distribution of relaxation times at highertemperature. The relaxation intensity (D3) is comparable inmagnitude for both sub-glass relaxations, and decreases withtemperature reflecting an apparent loss of net dipolar correlationwith increasing thermal energy.
Relaxation times associated with the individual dielectricdispersions were determined from the HN fits. Specifically, therelaxation times (sMAX) associated with the peak maxima in Fig. 6can be derived from the HN relaxation time (sHN) at each temper-ature [35]:
sMAX ¼ sHN
"sinð pab
2þ2bÞsinð pa
2þ2bÞ
#1=a
(2)
For the b relaxation, the skewing parameter (b) was taken asequal to 1, such that sMAX¼ sHN. The frequency maxima for thedielectric relaxations, fMAX¼ [2psMAX]�1, are plotted vs. reciprocaltemperature (i.e., Arrhenius plots) in Fig. 5.
Across the g relaxation range, the dielectric data follow a linearArrhenius relation that is identical to the result from the dynamic
1000/T(K)
3.5 4.0 4.5 5.0 5.5 6.0 6.5 7.0
fMAX
(H
z)
10-2
10-1
100
101
102
103
104
105
106
EA = 43 kJ/mol
DielectricDynamic Mechanical
1000/T(K)
1.8 2.0 2.2 2.4 2.6 2.8 3.0
fMAX
(H
z)
10-2
10-1
100
101
102
103
104
105
106
EA = 99 kJ/mol
EA = 156 kJ/mol
DielectricDynamic Mechanical
a
b
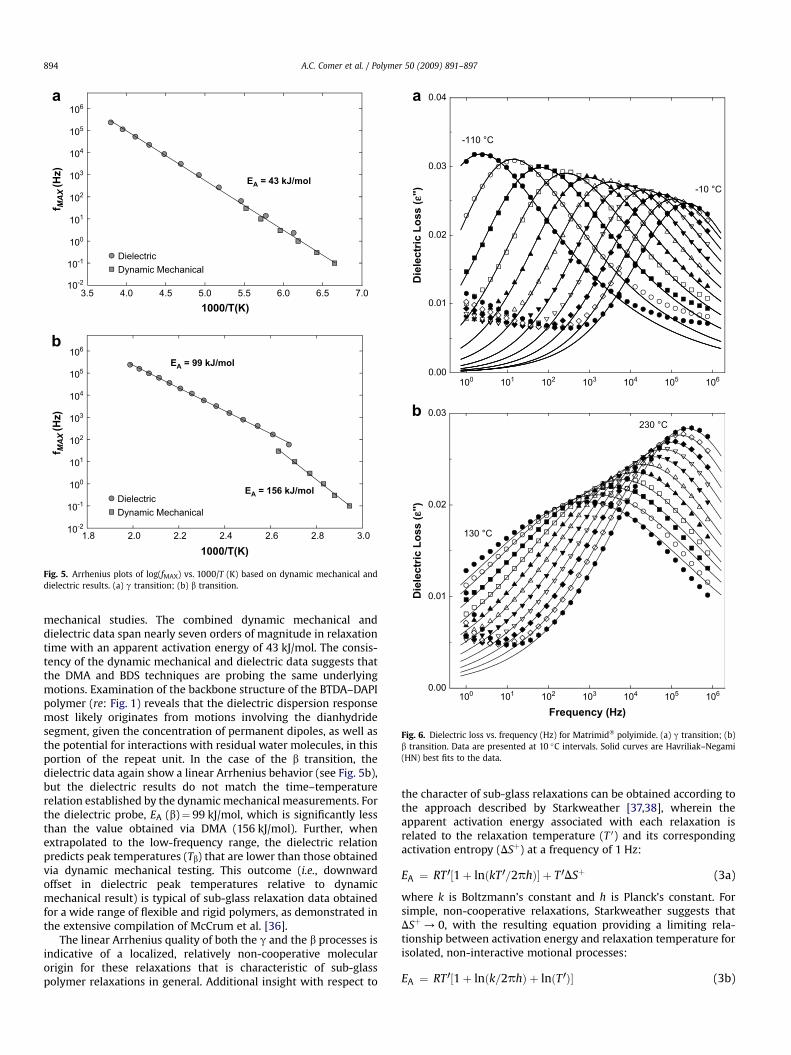
Fig. 5. Arrhenius plots of log(fMAX) vs. 1000/T (K) based on dynamic mechanical anddielectric results. (a) g transition; (b) b transition.
100 101 102 103 104 105 1060.00
0.01
0.02
0.03
0.04
-110 °C
-10 °C
Frequency (Hz)
100 101 102 103 104 105 1060.00
0.01
0.02
0.03
130 °C
230 °C
a
bD
ielectric L
oss ( '
')D
ielectric L
oss ( '
')
Fig. 6. Dielectric loss vs. frequency (Hz) for Matrimid� polyimide. (a) g transition; (b)b transition. Data are presented at 10 �C intervals. Solid curves are Havriliak–Negami(HN) best fits to the data.
A.C. Comer et al. / Polymer 50 (2009) 891–897894
mechanical studies. The combined dynamic mechanical anddielectric data span nearly seven orders of magnitude in relaxationtime with an apparent activation energy of 43 kJ/mol. The consis-tency of the dynamic mechanical and dielectric data suggests thatthe DMA and BDS techniques are probing the same underlyingmotions. Examination of the backbone structure of the BTDA–DAPIpolymer (re: Fig. 1) reveals that the dielectric dispersion responsemost likely originates from motions involving the dianhydridesegment, given the concentration of permanent dipoles, as well asthe potential for interactions with residual water molecules, in thisportion of the repeat unit. In the case of the b transition, thedielectric data again show a linear Arrhenius behavior (see Fig. 5b),but the dielectric results do not match the time–temperaturerelation established by the dynamic mechanical measurements. Forthe dielectric probe, EA (b)¼ 99 kJ/mol, which is significantly lessthan the value obtained via DMA (156 kJ/mol). Further, whenextrapolated to the low-frequency range, the dielectric relationpredicts peak temperatures (Tb) that are lower than those obtainedvia dynamic mechanical testing. This outcome (i.e., downwardoffset in dielectric peak temperatures relative to dynamicmechanical result) is typical of sub-glass relaxation data obtainedfor a wide range of flexible and rigid polymers, as demonstrated inthe extensive compilation of McCrum et al. [36].
The linear Arrhenius quality of both the g and the b processes isindicative of a localized, relatively non-cooperative molecularorigin for these relaxations that is characteristic of sub-glasspolymer relaxations in general. Additional insight with respect to
the character of sub-glass relaxations can be obtained according tothe approach described by Starkweather [37,38], wherein theapparent activation energy associated with each relaxation isrelated to the relaxation temperature (T 0) and its correspondingactivation entropy (DSþ) at a frequency of 1 Hz:
EA ¼ RT0½1þ lnðkT0=2phÞ� þ T 0DSþ (3a)
where k is Boltzmann’s constant and h is Planck’s constant. Forsimple, non-cooperative relaxations, Starkweather suggests thatDSþ/ 0, with the resulting equation providing a limiting rela-tionship between activation energy and relaxation temperature forisolated, non-interactive motional processes:
EA ¼ RT0½1þ lnðk=2phÞ þ lnðT 0Þ� (3b)
Temperature (°C)
-120 -100 -80 -60 -40 -20 140 160 180 200 220 240
HN
P
aram
eters
0.1
0.2
0.3
0.4
0.5
0.6aHN (γ)
aHN (β)
bHN (γ)
Δε (γ) Δε (β)
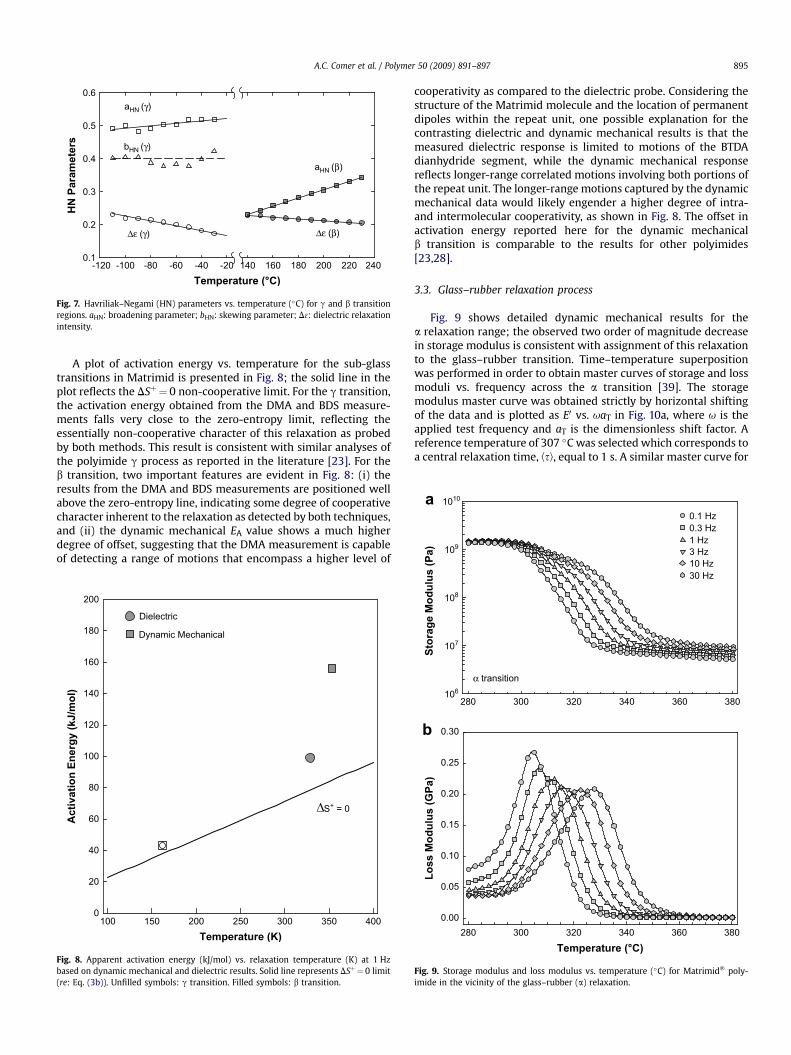
Fig. 7. Havriliak–Negami (HN) parameters vs. temperature (�C) for g and b transitionregions. aHN: broadening parameter; bHN: skewing parameter; D3: dielectric relaxationintensity.
(P
a) 109
1010
10 Hz3 Hz1 Hz0.3 Hz0.1 Hz
a
A.C. Comer et al. / Polymer 50 (2009) 891–897 895
A plot of activation energy vs. temperature for the sub-glasstransitions in Matrimid is presented in Fig. 8; the solid line in theplot reflects the DSþ¼ 0 non-cooperative limit. For the g transition,the activation energy obtained from the DMA and BDS measure-ments falls very close to the zero-entropy limit, reflecting theessentially non-cooperative character of this relaxation as probedby both methods. This result is consistent with similar analyses ofthe polyimide g process as reported in the literature [23]. For theb transition, two important features are evident in Fig. 8: (i) theresults from the DMA and BDS measurements are positioned wellabove the zero-entropy line, indicating some degree of cooperativecharacter inherent to the relaxation as detected by both techniques,and (ii) the dynamic mechanical EA value shows a much higherdegree of offset, suggesting that the DMA measurement is capableof detecting a range of motions that encompass a higher level of
Temperature (K)
100 150 200 250 300 350 400
Activatio
n E
nerg
y (kJ/m
ol)
0
20
40
60
80
100
120
140
160
180
200
Dynamic Mechanical
Dielectric
S+ = 0
Fig. 8. Apparent activation energy (kJ/mol) vs. relaxation temperature (K) at 1 Hzbased on dynamic mechanical and dielectric results. Solid line represents DSþ¼ 0 limit(re: Eq. (3b)). Unfilled symbols: g transition. Filled symbols: b transition.
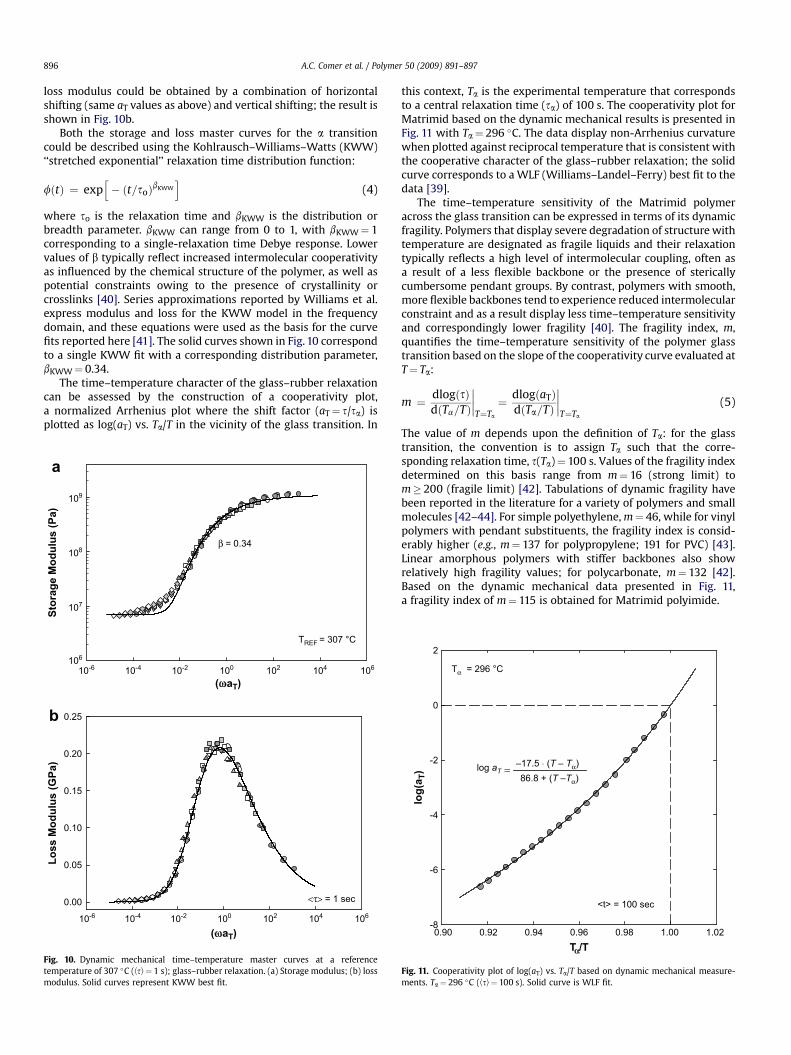
cooperativity as compared to the dielectric probe. Considering thestructure of the Matrimid molecule and the location of permanentdipoles within the repeat unit, one possible explanation for thecontrasting dielectric and dynamic mechanical results is that themeasured dielectric response is limited to motions of the BTDAdianhydride segment, while the dynamic mechanical responsereflects longer-range correlated motions involving both portions ofthe repeat unit. The longer-range motions captured by the dynamicmechanical data would likely engender a higher degree of intra-and intermolecular cooperativity, as shown in Fig. 8. The offset inactivation energy reported here for the dynamic mechanicalb transition is comparable to the results for other polyimides[23,28].
3.3. Glass–rubber relaxation process
Fig. 9 shows detailed dynamic mechanical results for thea relaxation range; the observed two order of magnitude decreasein storage modulus is consistent with assignment of this relaxationto the glass–rubber transition. Time–temperature superpositionwas performed in order to obtain master curves of storage and lossmoduli vs. frequency across the a transition [39]. The storagemodulus master curve was obtained strictly by horizontal shiftingof the data and is plotted as E0 vs. uaT in Fig. 10a, where u is theapplied test frequency and aT is the dimensionless shift factor. Areference temperature of 307 �C was selected which corresponds toa central relaxation time, CsD, equal to 1 s. A similar master curve for
Sto
ra
ge
M
od
ulu
s
106
107
108
α transition
30 Hz
Temperature (°C)
280 300 320 340 360 380
280 300 320 340 360 380
Lo
ss M
od
ulu
s (G
Pa)
0.00
0.05
0.10
0.15
0.20
0.25
0.30b
Fig. 9. Storage modulus and loss modulus vs. temperature (�C) for Matrimid� poly-imide in the vicinity of the glass–rubber (a) relaxation.
A.C. Comer et al. / Polymer 50 (2009) 891–897896
loss modulus could be obtained by a combination of horizontalshifting (same aT values as above) and vertical shifting; the result isshown in Fig. 10b.
Both the storage and loss master curves for the a transitioncould be described using the Kohlrausch–Williams–Watts (KWW)‘‘stretched exponential’’ relaxation time distribution function:
fðtÞ ¼ exph� ðt=soÞbKWW
i(4)
where so is the relaxation time and bKWW is the distribution orbreadth parameter. bKWW can range from 0 to 1, with bKWW¼ 1corresponding to a single-relaxation time Debye response. Lowervalues of b typically reflect increased intermolecular cooperativityas influenced by the chemical structure of the polymer, as well aspotential constraints owing to the presence of crystallinity orcrosslinks [40]. Series approximations reported by Williams et al.express modulus and loss for the KWW model in the frequencydomain, and these equations were used as the basis for the curvefits reported here [41]. The solid curves shown in Fig. 10 correspondto a single KWW fit with a corresponding distribution parameter,bKWW¼ 0.34.
The time–temperature character of the glass–rubber relaxationcan be assessed by the construction of a cooperativity plot,a normalized Arrhenius plot where the shift factor (aT¼ s/sa) isplotted as log(aT) vs. Ta/T in the vicinity of the glass transition. In
10-6 10-4 10-2 100 102 104 106
Lo
ss M
od
ulu
s (G
Pa)
0.00
0.05
0.10
0.15
0.20
0.25
10-6 10-4 10-2 100 102 104 106
Sto
rag
e M
od
ulu
s (P
a)
106
107
108
109
TREF = 307 °C
β = 0.34
<τ> = 1 sec
a
b
( aT)
( aT)
Fig. 10. Dynamic mechanical time–temperature master curves at a referencetemperature of 307 �C (CsD¼ 1 s); glass–rubber relaxation. (a) Storage modulus; (b) lossmodulus. Solid curves represent KWW best fit.
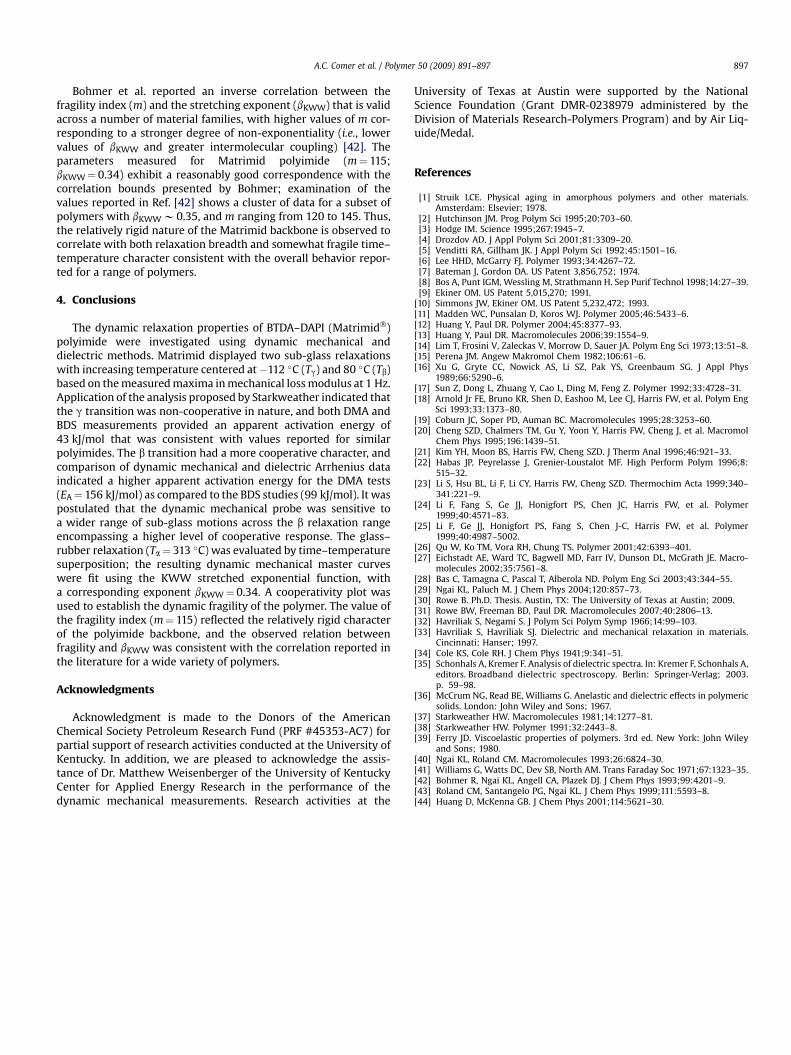
this context, Ta is the experimental temperature that correspondsto a central relaxation time (sa) of 100 s. The cooperativity plot forMatrimid based on the dynamic mechanical results is presented inFig. 11 with Ta¼ 296 �C. The data display non-Arrhenius curvaturewhen plotted against reciprocal temperature that is consistent withthe cooperative character of the glass–rubber relaxation; the solidcurve corresponds to a WLF (Williams–Landel–Ferry) best fit to thedata [39].
The time–temperature sensitivity of the Matrimid polymeracross the glass transition can be expressed in terms of its dynamicfragility. Polymers that display severe degradation of structure withtemperature are designated as fragile liquids and their relaxationtypically reflects a high level of intermolecular coupling, often asa result of a less flexible backbone or the presence of stericallycumbersome pendant groups. By contrast, polymers with smooth,more flexible backbones tend to experience reduced intermolecularconstraint and as a result display less time–temperature sensitivityand correspondingly lower fragility [40]. The fragility index, m,quantifies the time–temperature sensitivity of the polymer glasstransition based on the slope of the cooperativity curve evaluated atT¼ Ta:
m ¼ dlogðsÞdðTa=TÞ
����T¼Ta
¼ dlogðaTÞdðTa=TÞ
����T¼Ta
(5)
The value of m depends upon the definition of Ta: for the glasstransition, the convention is to assign Ta such that the corre-sponding relaxation time, s(Ta)¼ 100 s. Values of the fragility indexdetermined on this basis range from m¼ 16 (strong limit) tom� 200 (fragile limit) [42]. Tabulations of dynamic fragility havebeen reported in the literature for a variety of polymers and smallmolecules [42–44]. For simple polyethylene, m¼ 46, while for vinylpolymers with pendant substituents, the fragility index is consid-erably higher (e.g., m¼ 137 for polypropylene; 191 for PVC) [43].Linear amorphous polymers with stiffer backbones also showrelatively high fragility values; for polycarbonate, m¼ 132 [42].Based on the dynamic mechanical data presented in Fig. 11,a fragility index of m¼ 115 is obtained for Matrimid polyimide.
0.90 0.92 0.94 0.96 0.98 1.00 1.02
lo
g(a
T)
-8
-6
-4
-2
0
2
Tα = 296 °C
<t> = 100 sec
86.8 + (T –Tα)–17.5 ⋅ (T – Tα)log a
T
T /T
Fig. 11. Cooperativity plot of log(aT) vs. Ta/T based on dynamic mechanical measure-ments. Ta¼ 296 �C (CsD¼ 100 s). Solid curve is WLF fit.
A.C. Comer et al. / Polymer 50 (2009) 891–897 897
Bohmer et al. reported an inverse correlation between thefragility index (m) and the stretching exponent (bKWW) that is validacross a number of material families, with higher values of m cor-responding to a stronger degree of non-exponentiality (i.e., lowervalues of bKWW and greater intermolecular coupling) [42]. Theparameters measured for Matrimid polyimide (m¼ 115;bKWW¼ 0.34) exhibit a reasonably good correspondence with thecorrelation bounds presented by Bohmer; examination of thevalues reported in Ref. [42] shows a cluster of data for a subset ofpolymers with bKWW w 0.35, and m ranging from 120 to 145. Thus,the relatively rigid nature of the Matrimid backbone is observed tocorrelate with both relaxation breadth and somewhat fragile time–temperature character consistent with the overall behavior repor-ted for a range of polymers.
4. Conclusions
The dynamic relaxation properties of BTDA–DAPI (Matrimid�)polyimide were investigated using dynamic mechanical anddielectric methods. Matrimid displayed two sub-glass relaxationswith increasing temperature centered at�112 �C (Tg) and 80 �C (Tb)based on the measured maxima in mechanical loss modulus at 1 Hz.Application of the analysis proposed by Starkweather indicated thatthe g transition was non-cooperative in nature, and both DMA andBDS measurements provided an apparent activation energy of43 kJ/mol that was consistent with values reported for similarpolyimides. The b transition had a more cooperative character, andcomparison of dynamic mechanical and dielectric Arrhenius dataindicated a higher apparent activation energy for the DMA tests(EA¼ 156 kJ/mol) as compared to the BDS studies (99 kJ/mol). It waspostulated that the dynamic mechanical probe was sensitive toa wider range of sub-glass motions across the b relaxation rangeencompassing a higher level of cooperative response. The glass–rubber relaxation (Ta¼ 313 �C) was evaluated by time–temperaturesuperposition; the resulting dynamic mechanical master curveswere fit using the KWW stretched exponential function, witha corresponding exponent bKWW¼ 0.34. A cooperativity plot wasused to establish the dynamic fragility of the polymer. The value ofthe fragility index (m¼ 115) reflected the relatively rigid characterof the polyimide backbone, and the observed relation betweenfragility and bKWW was consistent with the correlation reported inthe literature for a wide variety of polymers.
Acknowledgments
Acknowledgment is made to the Donors of the AmericanChemical Society Petroleum Research Fund (PRF #45353-AC7) forpartial support of research activities conducted at the University ofKentucky. In addition, we are pleased to acknowledge the assis-tance of Dr. Matthew Weisenberger of the University of KentuckyCenter for Applied Energy Research in the performance of thedynamic mechanical measurements. Research activities at the
University of Texas at Austin were supported by the NationalScience Foundation (Grant DMR-0238979 administered by theDivision of Materials Research-Polymers Program) and by Air Liq-uide/Medal.
References
[1] Struik LCE. Physical aging in amorphous polymers and other materials.Amsterdam: Elsevier; 1978.
[2] Hutchinson JM. Prog Polym Sci 1995;20:703–60.[3] Hodge IM. Science 1995;267:1945–7.[4] Drozdov AD. J Appl Polym Sci 2001;81:3309–20.[5] Venditti RA, Gillham JK. J Appl Polym Sci 1992;45:1501–16.[6] Lee HHD, McGarry FJ. Polymer 1993;34:4267–72.[7] Bateman J, Gordon DA. US Patent 3,856,752; 1974.[8] Bos A, Punt IGM, Wessling M, Strathmann H. Sep Purif Technol 1998;14:27–39.[9] Ekiner OM. US Patent 5,015,270; 1991.
[10] Simmons JW, Ekiner OM. US Patent 5,232,472; 1993.[11] Madden WC, Punsalan D, Koros WJ. Polymer 2005;46:5433–6.[12] Huang Y, Paul DR. Polymer 2004;45:8377–93.[13] Huang Y, Paul DR. Macromolecules 2006;39:1554–9.[14] Lim T, Frosini V, Zaleckas V, Morrow D, Sauer JA. Polym Eng Sci 1973;13:51–8.[15] Perena JM. Angew Makromol Chem 1982;106:61–6.[16] Xu G, Gryte CC, Nowick AS, Li SZ, Pak YS, Greenbaum SG. J Appl Phys
1989;66:5290–6.[17] Sun Z, Dong L, Zhuang Y, Cao L, Ding M, Feng Z. Polymer 1992;33:4728–31.[18] Arnold Jr FE, Bruno KR, Shen D, Eashoo M, Lee CJ, Harris FW, et al. Polym Eng
Sci 1993;33:1373–80.[19] Coburn JC, Soper PD, Auman BC. Macromolecules 1995;28:3253–60.[20] Cheng SZD, Chalmers TM, Gu Y, Yoon Y, Harris FW, Cheng J, et al. Macromol
Chem Phys 1995;196:1439–51.[21] Kim YH, Moon BS, Harris FW, Cheng SZD. J Therm Anal 1996;46:921–33.[22] Habas JP, Peyrelasse J, Grenier-Loustalot MF. High Perform Polym 1996;8:
515–32.[23] Li S, Hsu BL, Li F, Li CY, Harris FW, Cheng SZD. Thermochim Acta 1999;340–
341:221–9.[24] Li F, Fang S, Ge JJ, Honigfort PS, Chen JC, Harris FW, et al. Polymer
1999;40:4571–83.[25] Li F, Ge JJ, Honigfort PS, Fang S, Chen J-C, Harris FW, et al. Polymer
1999;40:4987–5002.[26] Qu W, Ko TM, Vora RH, Chung TS. Polymer 2001;42:6393–401.[27] Eichstadt AE, Ward TC, Bagwell MD, Farr IV, Dunson DL, McGrath JE. Macro-
molecules 2002;35:7561–8.[28] Bas C, Tamagna C, Pascal T, Alberola ND. Polym Eng Sci 2003;43:344–55.[29] Ngai KL, Paluch M. J Chem Phys 2004;120:857–73.[30] Rowe B. Ph.D. Thesis. Austin, TX: The University of Texas at Austin; 2009.[31] Rowe BW, Freeman BD, Paul DR. Macromolecules 2007;40:2806–13.[32] Havriliak S, Negami S. J Polym Sci Polym Symp 1966;14:99–103.[33] Havriliak S, Havriliak SJ. Dielectric and mechanical relaxation in materials.
Cincinnati: Hanser; 1997.[34] Cole KS, Cole RH. J Chem Phys 1941;9:341–51.[35] Schonhals A, Kremer F. Analysis of dielectric spectra. In: Kremer F, Schonhals A,
editors. Broadband dielectric spectroscopy. Berlin: Springer-Verlag; 2003.p. 59–98.
[36] McCrum NG, Read BE, Williams G. Anelastic and dielectric effects in polymericsolids. London: John Wiley and Sons; 1967.
[37] Starkweather HW. Macromolecules 1981;14:1277–81.[38] Starkweather HW. Polymer 1991;32:2443–8.[39] Ferry JD. Viscoelastic properties of polymers. 3rd ed. New York: John Wiley
and Sons; 1980.[40] Ngai KL, Roland CM. Macromolecules 1993;26:6824–30.[41] Williams G, Watts DC, Dev SB, North AM. Trans Faraday Soc 1971;67:1323–35.[42] Bohmer R, Ngai KL, Angell CA, Plazek DJ. J Chem Phys 1993;99:4201–9.[43] Roland CM, Santangelo PG, Ngai KL. J Chem Phys 1999;111:5593–8.[44] Huang D, McKenna GB. J Chem Phys 2001;114:5621–30.
Related Documents


