Dynamic Position Analysis for September 2015 SFWMM Model Simulation of 41 years ( 1965-2005 ) Modeling Assumptions Discussion of UPA Results Lake Okeechobee Projection within the Next 2 Months Lake Okeechobee o Percentiles o Dry Years o Wet Years o AMO / ENSO Sub-Sampling o Spaghetti Plot o All El Niño Years Lake Okeechobee Probability Results o Zone Probability Graphs o Probability Band Width Graph o Zone Probability Table o LORS Releases to the Estuaries o LORS Releases to the WCA's WCA-1 o Percentiles o Dry Years o Wet Years o Canal Sub-Sampling Years o AMO / ENSO Sub-Sampling WCA-2A o Percentiles o Dry Years o Wet Years o Canal Sub-Sampling Years o AMO / ENSO Sub-Sampling WCA-3A o Percentiles o Dry Years o Wet Years o Canal Sub-Sampling Years o AMO / ENSO Sub-Sampling Upper Kissimmee Stage and Flow o Lake Kissimmee Stage at S65 o Lake Toho Stage at S61

Welcome message from author
This document is posted to help you gain knowledge. Please leave a comment to let me know what you think about it! Share it to your friends and learn new things together.
Transcript

Dynamic Position Analysis for September 2015
SFWMM Model Simulation of 41 years ( 1965-2005 )
Modeling Assumptions
Discussion of UPA Results
Lake Okeechobee Projection within the Next 2 Months
Lake Okeechobee
o Percentiles
o Dry Years
o Wet Years
o AMO / ENSO Sub-Sampling
o Spaghetti Plot
o All El Niño Years
Lake Okeechobee Probability Results
o Zone Probability Graphs
o Probability Band Width Graph
o Zone Probability Table
o LORS Releases to the Estuaries
o LORS Releases to the WCA's
WCA-1
o Percentiles
o Dry Years
o Wet Years
o Canal Sub-Sampling Years
o AMO / ENSO Sub-Sampling
WCA-2A
o Percentiles
o Dry Years
o Wet Years
o Canal Sub-Sampling Years
o AMO / ENSO Sub-Sampling
WCA-3A
o Percentiles
o Dry Years
o Wet Years
o Canal Sub-Sampling Years
o AMO / ENSO Sub-Sampling
Upper Kissimmee Stage and Flow
o Lake Kissimmee Stage at S65
o Lake Toho Stage at S61
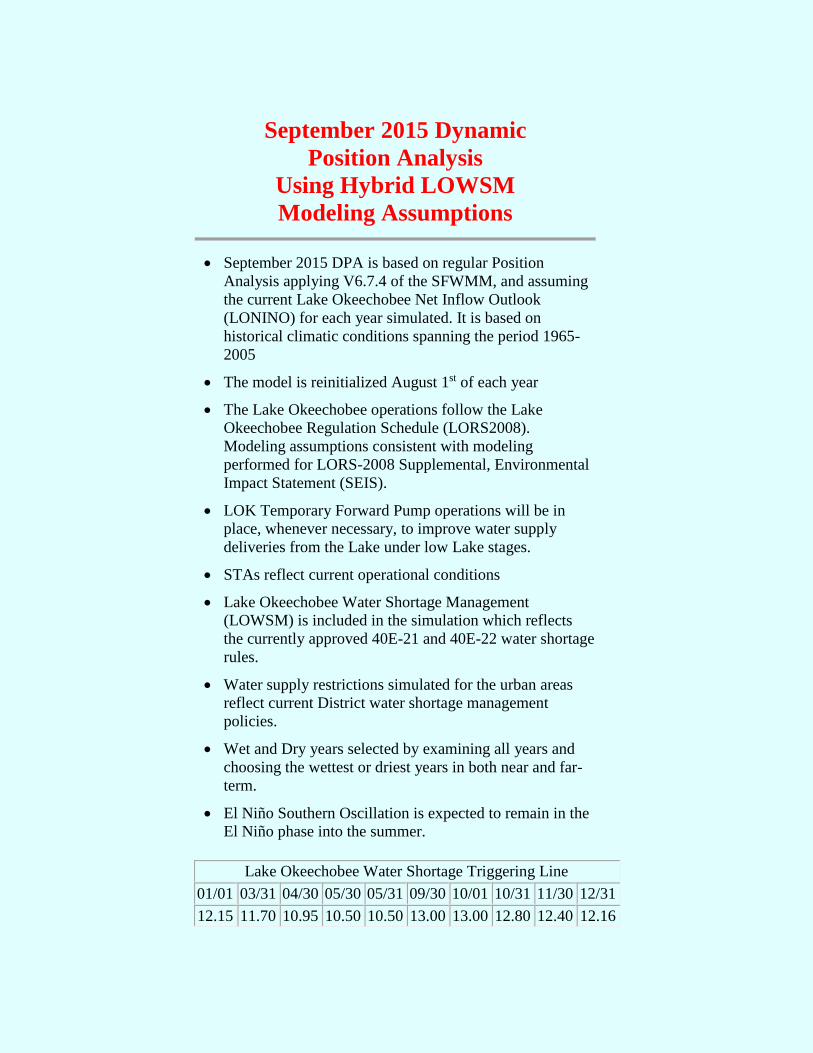
September 2015 Dynamic
Position Analysis
Using Hybrid LOWSM
Modeling Assumptions
September 2015 DPA is based on regular Position
Analysis applying V6.7.4 of the SFWMM, and assuming
the current Lake Okeechobee Net Inflow Outlook
(LONINO) for each year simulated. It is based on
historical climatic conditions spanning the period 1965-
2005
The model is reinitialized August 1st of each year
The Lake Okeechobee operations follow the Lake
Okeechobee Regulation Schedule (LORS2008).
Modeling assumptions consistent with modeling
performed for LORS-2008 Supplemental, Environmental
Impact Statement (SEIS).
LOK Temporary Forward Pump operations will be in
place, whenever necessary, to improve water supply
deliveries from the Lake under low Lake stages.
STAs reflect current operational conditions
Lake Okeechobee Water Shortage Management
(LOWSM) is included in the simulation which reflects
the currently approved 40E-21 and 40E-22 water shortage
rules.
Water supply restrictions simulated for the urban areas
reflect current District water shortage management
policies.
Wet and Dry years selected by examining all years and
choosing the wettest or driest years in both near and far-
term.
El Niño Southern Oscillation is expected to remain in the
El Niño phase into the summer.
Lake Okeechobee Water Shortage Triggering Line
01/01 03/31 04/30 05/30 05/31 09/30 10/01 10/31 11/30 12/31
12.15 11.70 10.95 10.50 10.50 13.00 13.00 12.80 12.40 12.16

S-65E inflows entering Lake Okeechobee in the
SFWMM simulation were obtained by adding S-65
flows, obtained from the UK-OPS simulation in a PA
mode, and local runoff contribution from the Lower
Kissimmee, computed as the difference of S65E and
S65 historical flows for the period 1965-2005. Runoff
contribution on any given day of the current PA month
is adjusted based on a correlation function of Palmer
Drought Index, rainfall and historical flows.
Back pumping of excess runoff from the EAA into
Lake Okeechobee takes place only under flood control
conditions (Interim Action Plan).
Weekly flow target to the North East Shark River
Slough (NESRS) is predicted by the Rainfall Driven
formula using previous week's calculated flow target
and the preceding 10 weeks of meteorological (rainfall
and ET) data. As the simulation moves away from the
initialization date, a blend of the most recent and
historical data is used to compute the flow targets.
ERTP operations consistent with the March 2011 EIS
are included in the simulation. The main features of
these operations are:
1. Structures S-343A, S-343B, S-344 and S-12A are
closed Nov. 1 to July 15.
2. Structure S-12B is closed Jan. 1 to July 15.
3. No closures for structure S-12C and S-12D.
4. Zone A line lowered on average by 0.35 feet (from
10-10.75 ft to 9.5-10.5 ft)
Information for the initial conditions can be viewed here.
Initial stages for specified canals are shown here and
gages are shown here.
Please view the Documentation for the SFWMM.
Back to Operational Planning Main Page

Aug
11
12
13
14
15
16
17
18
Sta
ge
(fee
t, N
GV
D)
Lake Okeechobee SFWMM September 2015 Dynamic Position AnalysisPercentiles PA_SEP15DPA
Sat Sep 5 10:56:28 2015
Historical
Aug
Sep
Oct
11
12
13
14
15
16
17
18
Sat Sep 5 10:56:28 2015
MAXP95P90P75P50P25P10P5MIN
Water Shortage Management Band
HLM High Inter Low BasFlo BenUse
High Lake Management Band
(See assumptions on the Position Analysis Results website)
Jun
Jul
Aug
Sep
Oct
Nov
Dec Jan
Feb
Mar Apr
May Jun
Jul
8
9
10
11
12
13
14
15
16
17
18
19
20
Sta
ge
(fee
t, N
GV
D)
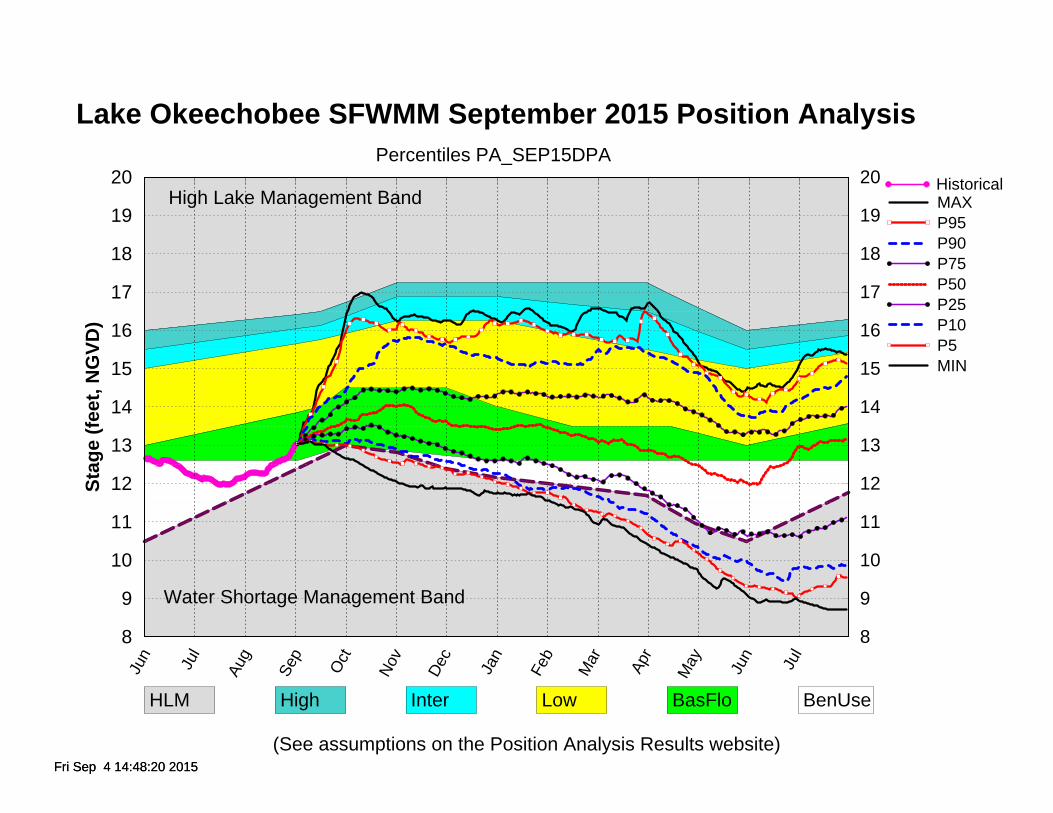
Lake Okeechobee SFWMM September 2015 Position AnalysisPercentiles PA_SEP15DPA
Fri Sep 4 14:48:20 2015
Historical
8
9
10
11
12
13
14
15
16
17
18
19
20
Fri Sep 4 14:48:20 2015
MAXP95P90P75P50P25P10P5MIN
Water Shortage Management Band
HLM High Inter Low BasFlo BenUse
High Lake Management Band
(See assumptions on the Position Analysis Results website)
Jun
Jul
Aug
Sep
Oct
Nov
Dec Jan
Feb
Mar Apr
May Jun
Jul
8
9
10
11
12
13
14
15
16
17
18
19
20
Sta
ge
(fee
t, N
GV
D)
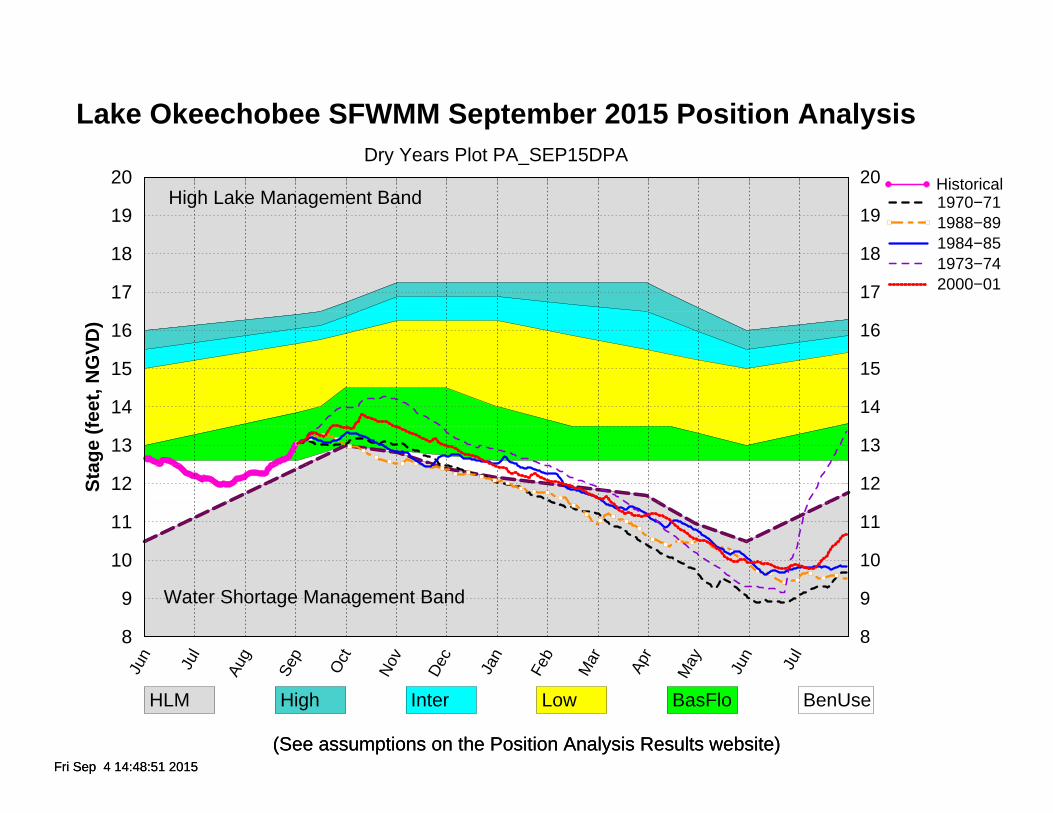
Lake Okeechobee SFWMM September 2015 Position AnalysisDry Years Plot PA_SEP15DPA
Fri Sep 4 14:48:51 2015
Historical
8
9
10
11
12
13
14
15
16
17
18
19
20
Fri Sep 4 14:48:51 2015
1970−711988−891984−851973−742000−01
Water Shortage Management Band
HLM High Inter Low BasFlo BenUse
High Lake Management Band
(See assumptions on the Position Analysis Results website)(See assumptions on the Position Analysis Results website)
Jun
Jul
Aug
Sep
Oct
Nov
Dec Jan
Feb
Mar Apr
May Jun
Jul
8
9
10
11
12
13
14
15
16
17
18
19
20
Sta
ge
(fee
t, N
GV
D)
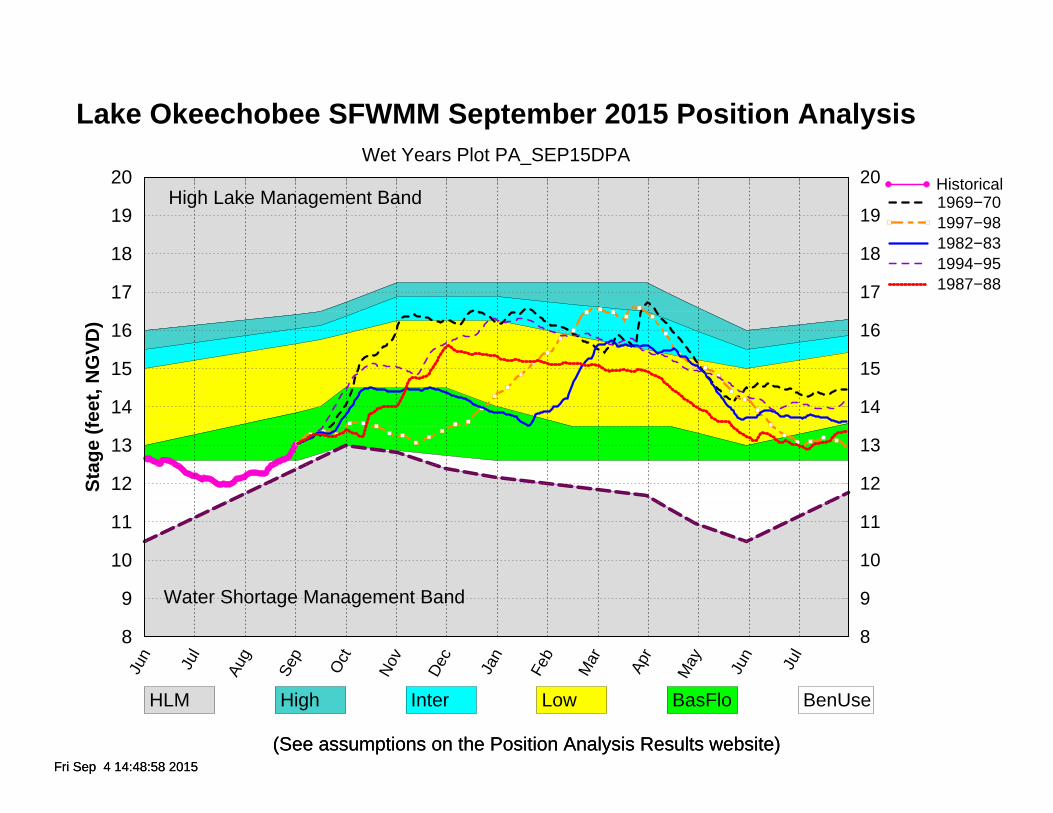
Lake Okeechobee SFWMM September 2015 Position AnalysisWet Years Plot PA_SEP15DPA
Fri Sep 4 14:48:58 2015
Historical
8
9
10
11
12
13
14
15
16
17
18
19
20
Fri Sep 4 14:48:58 2015
1969−701997−981982−831994−951987−88
Water Shortage Management Band
HLM High Inter Low BasFlo BenUse
High Lake Management Band
(See assumptions on the Position Analysis Results website)(See assumptions on the Position Analysis Results website)

Jun
Jul
Aug
Sep
Oct
Nov
Dec Jan
Feb
Mar Apr
May Jun
Jul
8
9
10
11
12
13
14
15
16
17
18
19
20
Sta
ge
(fee
t, N
GV
D)
Lake Okeechobee SFWMM September 2015 Position AnalysisAMO Warm / El Nino Analog Years Plot PA_SEP15DPA
Fri Sep 4 14:49:10 2015
Historical
8
9
10
11
12
13
14
15
16
17
18
19
20
Fri Sep 4 14:49:10 2015
1965−661997−982002−03
Water Shortage Management Band
HLM High Inter Low BasFlo BenUse
High Lake Management Band
(See assumptions on the Position Analysis Results website)(See assumptions on the Position Analysis Results website)
Analog Years are years
with similar climatological conditions
to the current year.

Jun
Jul
Aug
Sep
Oct
Nov
Dec Jan
Feb
Mar Apr
May Jun
Jul
8
9
10
11
12
13
14
15
16
17
18
19
20
Sta
ge
(fee
t, N
GV
D)
Lake Okeechobee SFWMM September 2015 Position AnalysisAll Simulated Years Plot PA_SEP15DPA
Fri Sep 4 14:51:34 2015
Historical
8
9
10
11
12
13
14
15
16
17
18
19
20
Fri Sep 4 14:51:34 2015
1965−661966−671967−681968−691969−701970−711971−721972−731973−741974−751975−761976−771977−781978−791979−801980−811981−821982−831983−841984−851985−861986−871987−881988−891989−901990−911991−921992−931993−941994−951995−961996−971997−981998−991999−002000−012001−022002−032003−042004−05
Water Shortage Management Band
HLM High Inter Low BasFlo BenUse
(See assumptions on the Position Analysis Results website)
High Lake Management Band
(See assumptions on the Position Analysis Results website)

Jun
Jul
Aug
Sep
Oct
Nov
Dec Jan
Feb
Mar Apr
May Jun
Jul
8
9
10
11
12
13
14
15
16
17
18
19
20
Sta
ge
(fee
t, N
GV
D)
Lake Okeechobee SFWMM September 2015 Position AnalysisAll El Nino Years Plot PA_SEP15DPA
Fri Sep 4 14:49:04 2015
Historical
8
9
10
11
12
13
14
15
16
17
18
19
20
Fri Sep 4 14:49:04 2015
1965−661972−731982−831987−881997−982002−03
Water Shortage Management Band
HLM High Inter Low BasFlo BenUse
High Lake Management Band
(See assumptions on the Position Analysis Results website)(See assumptions on the Position Analysis Results website)
Sep Oct
Nov
Dec Jan
Feb
Mar
Apr
May Jun
Jul
020406080
100
Sat Sep 5 11:44:51 2015
020406080100
Sat Sep 5 11:44:51 2015
020406080
100
Sat Sep 5 11:44:51 2015
020406080100
Sat Sep 5 11:44:51 2015
020406080
100
Sat Sep 5 11:44:51 2015
020406080100
Sat Sep 5 11:44:51 2015
020406080
100
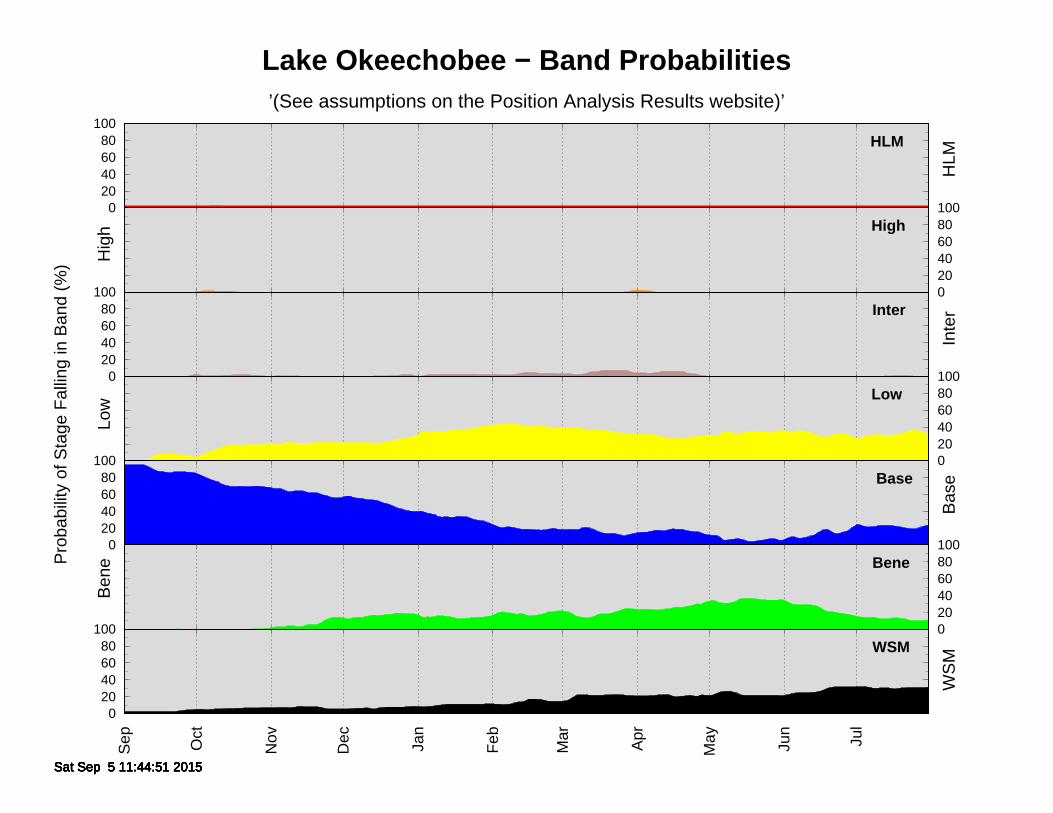
Lake Okeechobee − Band Probabilities’(See assumptions on the Position Analysis Results website)’
Sat Sep 5 11:44:51 2015
HLM
Hig
h
Inte
r
Low
Bas
e
Ben
e
WS
M
HLM
High
Inter
Low
Base
Bene
WSM
Pro
babi
lity
of S
tage
Fal
ling
in B
and
(%)

Sep Oct
Nov
Dec Jan
Feb
Mar
Apr
May Jun
Jul
0
10
20
30
40
50
60
70
80
90
100
Pro
babi
lity
of S
tage
Fal
ling
at o
r be
low
Ban
d (%
)
Lake Okeechobee − Probabilities for Operational Bands’(See assumptions on the Position Analysis Results website)’
Sat Sep 5 11:45:40 2015Sat Sep 5 11:45:40 2015
WSM
Bene
Base
Low
Inter
High
HLM
The width for each band gives the probability of stage falling in that band, as defined by theoperational schedules.

Lake Okechobee Band Probabilities (%) at the Begining of Each Month’(See assumptions on the Position Analysis Results website)’ Initial Stage 12.19 ft. for 08/01/2015
Date HLM High Inter Low Base Bene WSM2015 08 01 2.4 0.0 0.0 0.0 0.0 95.1 2.42015 09 01 2.4 0.0 0.0 0.0 95.1 0.0 2.42015 10 01 2.4 0.4 2.3 4.6 85.0 0.2 5.02015 11 01 2.4 0.0 0.1 20.7 68.0 1.9 7.02015 12 01 2.4 0.0 0.1 21.5 57.0 13.6 5.52016 01 01 2.4 0.0 0.5 31.6 40.0 17.2 8.42016 02 01 2.4 0.0 2.5 42.5 24.3 16.8 11.52016 03 01 2.4 0.0 3.3 39.6 18.3 21.9 14.52016 04 01 2.4 2.4 4.4 31.3 14.4 24.0 21.12016 05 01 2.4 0.0 0.2 30.0 12.0 33.6 21.82016 06 01 2.4 0.0 0.0 35.3 6.3 34.3 21.62016 07 01 2.4 0.0 0.0 26.4 23.9 15.4 31.8
Sep Oct
Nov
Dec Jan
Feb
Mar
Apr
May Jun
Jul
0 0
10 10
20 20
30 30
40 40
50 50
60 60
70 70
80 80
90 90
100 100
Pro
babi
lity
(%)
Pro
babi
lity
(%)
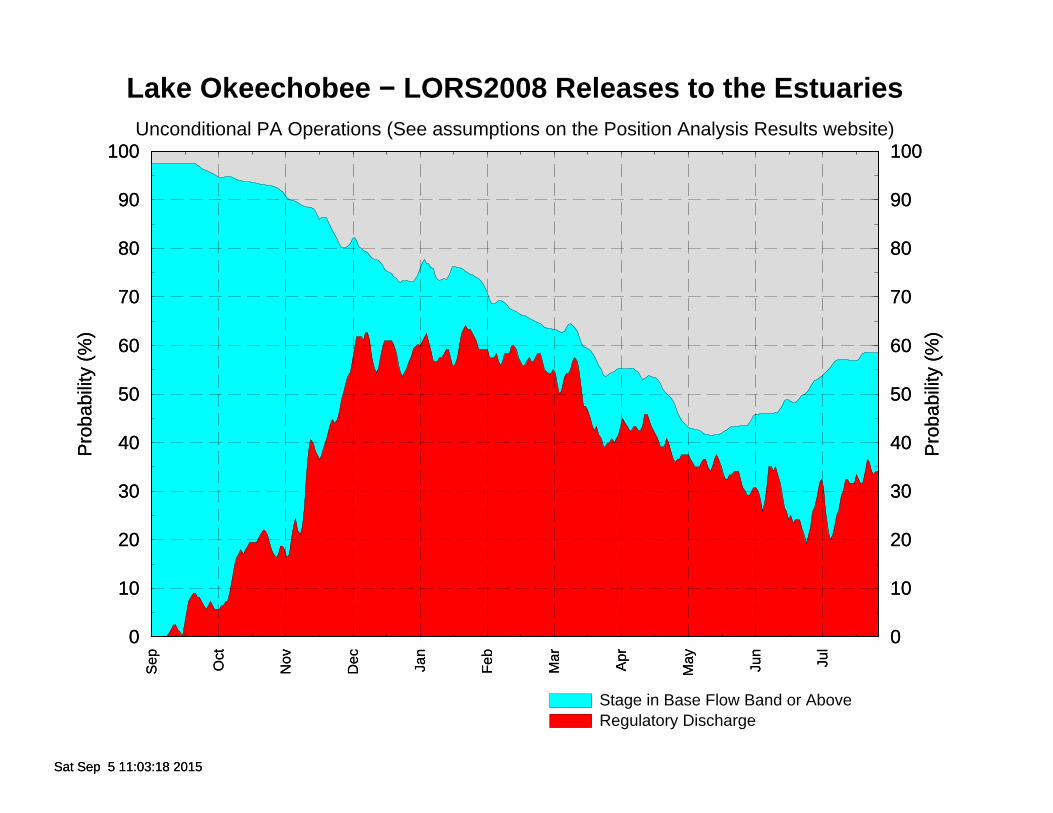
Lake Okeechobee − LORS2008 Releases to the EstuariesUnconditional PA Operations (See assumptions on the Position Analysis Results website)
Sat Sep 5 11:03:18 2015
Stage in Base Flow Band or AboveRegulatory Discharge
Sep Oct
Nov
Dec Jan
Feb
Mar
Apr
May Jun
Jul
0 0
10 10
20 20
30 30
40 40
50 50
60 60
70 70
80 80
90 90
100 100
Pro
babi
lity
(%)
Pro
babi
lity
(%)
Sat Sep 5 11:03:18 2015
Sep Oct
Nov
Dec Jan
Feb
Mar
Apr
May Jun
Jul
0 0
10 10
20 20
30 30
40 40
50 50
60 60
70 70
80 80
90 90
100 100
Pro
babi
lity
(%)
Pro
babi
lity
(%)
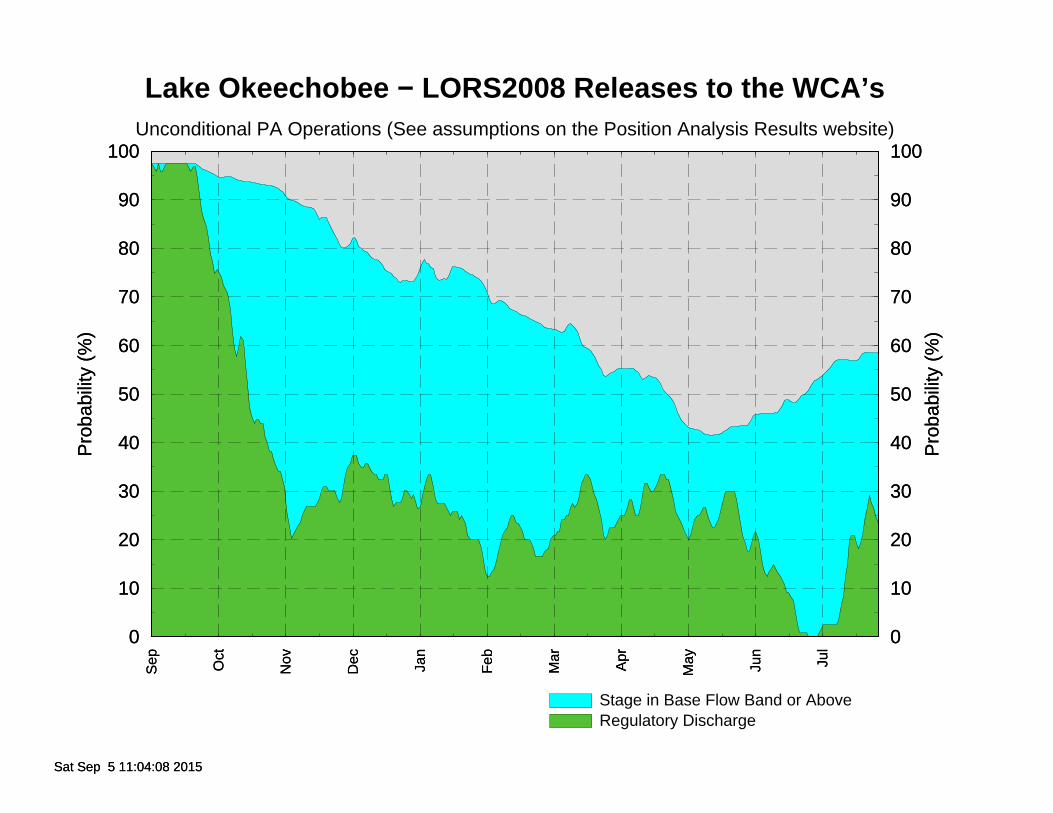
Lake Okeechobee − LORS2008 Releases to the WCA’sUnconditional PA Operations (See assumptions on the Position Analysis Results website)
Sat Sep 5 11:04:08 2015
Stage in Base Flow Band or AboveRegulatory Discharge
Sep Oct
Nov
Dec Jan
Feb
Mar
Apr
May Jun
Jul
0 0
10 10
20 20
30 30
40 40
50 50
60 60
70 70
80 80
90 90
100 100
Pro
babi
lity
(%)
Pro
babi
lity
(%)
Sat Sep 5 11:04:08 2015

Jun
Jul
Aug
Sep
Oct
Nov
Dec Jan
Feb
Mar Apr
May Jun
Jul
11
12
13
14
15
16
17
18
19
Sta
ge
(fee
t, N
GV
D)
WCA1 SFWMM September 2015 Position AnalysisPercentiles PA_SEP15DPA
Fri Sep 4 14:48:27 2015
Historical
11
12
13
14
15
16
17
18
19
Fri Sep 4 14:48:27 2015
MAXP95P90P75P50P25P10P5MINFloor
Zone A−1 Zone A−2 Zone B Zone C
(See assumptions on the Position Analysis Results website)

Jun
Jul
Aug
Sep
Oct
Nov
Dec Jan
Feb
Mar Apr
May Jun
Jul
11
12
13
14
15
16
17
18
19
Sta
ge
(fee
t, N
GV
D)
WCA1 SFWMM September 2015 Position AnalysisDry Years Plot PA_SEP15DPA
Fri Sep 4 14:49:15 2015
Historical
11
12
13
14
15
16
17
18
19
Fri Sep 4 14:49:15 2015
1970−711988−891974−751972−731984−85Floor
Zone A−1 Zone A−2 Zone B Zone C
(See assumptions on the Position Analysis Results website)

Jun
Jul
Aug
Sep
Oct
Nov
Dec Jan
Feb
Mar Apr
May Jun
Jul
11
12
13
14
15
16
17
18
19
Sta
ge
(fee
t, N
GV
D)
WCA1 SFWMM September 2015 Position AnalysisWet Years Plot PA_SEP15DPA
Fri Sep 4 14:49:20 2015
Historical
11
12
13
14
15
16
17
18
19
Fri Sep 4 14:49:20 2015
1969−701985−861982−831997−981981−82Floor
Zone A−1 Zone A−2 Zone B Zone C
(See assumptions on the Position Analysis Results website)

Jun
Jul
Aug
Sep
Oct
Nov
Dec Jan
Feb
Mar Apr
May Jun
Jul
11
12
13
14
15
16
17
18
19
Sta
ge
(fee
t, N
GV
D)
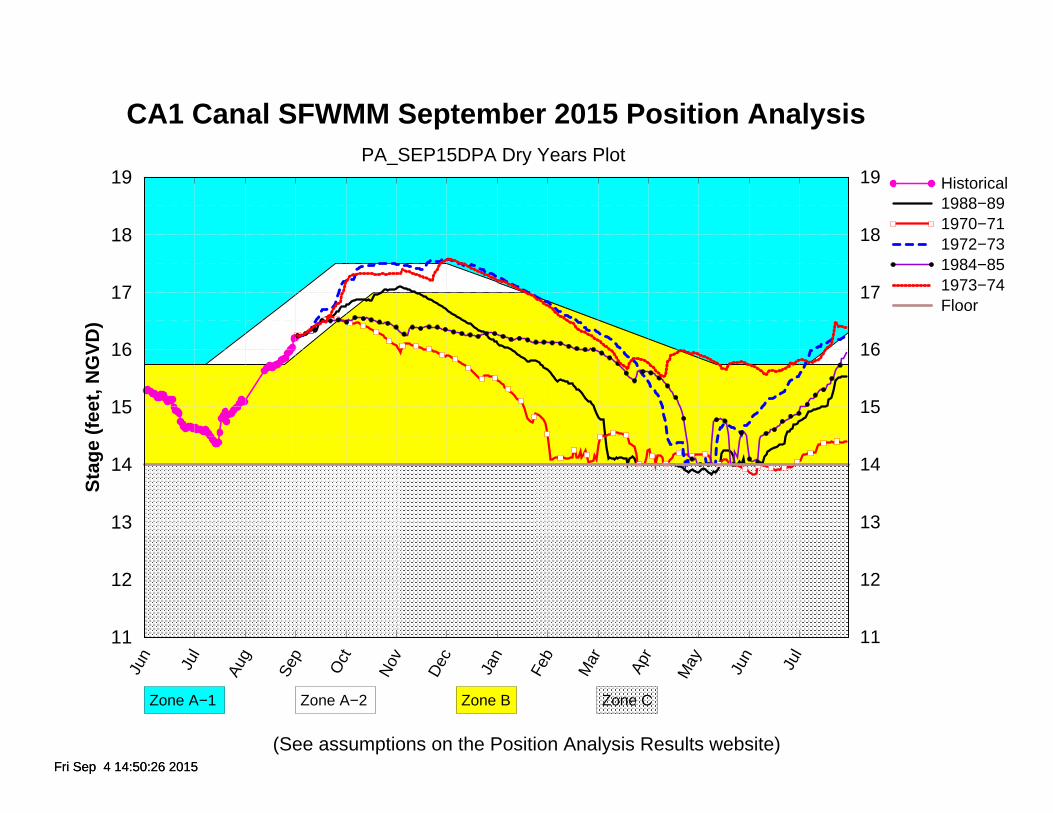
CA1 Canal SFWMM September 2015 Position AnalysisPA_SEP15DPA Dry Years Plot
Fri Sep 4 14:50:26 2015
Historical
11
12
13
14
15
16
17
18
19
Fri Sep 4 14:50:26 2015
1988−891970−711972−731984−851973−74Floor
Zone A−1 Zone A−2 Zone B Zone C
(See assumptions on the Position Analysis Results website)
Jun
Jul
Aug
Sep
Oct
Nov
Dec Jan
Feb
Mar Apr
May Jun
Jul
11
12
13
14
15
16
17
18
19
Sta
ge
(fee
t, N
GV
D)
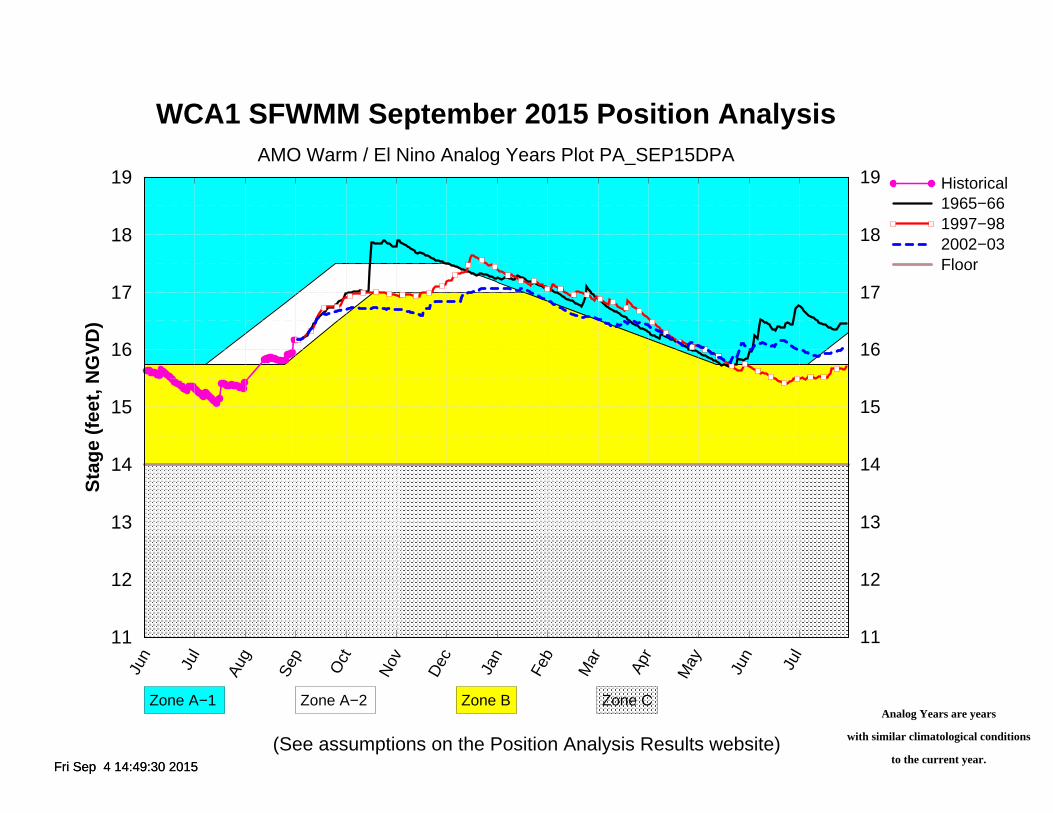
WCA1 SFWMM September 2015 Position AnalysisAMO Warm / El Nino Analog Years Plot PA_SEP15DPA
Fri Sep 4 14:49:30 2015
Historical
11
12
13
14
15
16
17
18
19
Fri Sep 4 14:49:30 2015
1965−661997−982002−03Floor
Zone A−1 Zone A−2 Zone B Zone C
(See assumptions on the Position Analysis Results website)
Analog Years are years
with similar climatological conditions
to the current year.

Jun
Jul
Aug
Sep
Oct
Nov
Dec Jan
Feb
Mar Apr
May Jun
Jul
8
9
10
11
12
13
14
15
16
17
18
Sta
ge
(fee
t, N
GV
D)
WCA2A SFWMM September 2015 Position AnalysisPercentiles PA_SEP15DPA
Fri Sep 4 14:48:33 2015
Historical
8
9
10
11
12
13
14
15
16
17
18
Fri Sep 4 14:48:33 2015
MAXP95P90P75P50P25P10P5MINFloor
(See assumptions on the Position Analysis Results website)

Jun
Jul
Aug
Sep
Oct
Nov
Dec Jan
Feb
Mar Apr
May Jun
Jul
8
9
10
11
12
13
14
15
16
17
18
Sta
ge
(fee
t, N
GV
D)
WCA2A SFWMM September 2015 Position AnalysisDry Years Plot PA_SEP15DPA
Fri Sep 4 14:49:34 2015
Historical
8
9
10
11
12
13
14
15
16
17
18
Fri Sep 4 14:49:34 2015
1970−711988−891984−851980−811974−75Floor
(See assumptions on the Position Analysis Results website)

Jun
Jul
Aug
Sep
Oct
Nov
Dec Jan
Feb
Mar Apr
May Jun
Jul
8
9
10
11
12
13
14
15
16
17
18
Sta
ge
(fee
t, N
GV
D)
WCA2A SFWMM September 2015 Position AnalysisWet Years Plot PA_SEP15DPA
Fri Sep 4 14:49:39 2015
Historical
8
9
10
11
12
13
14
15
16
17
18
Fri Sep 4 14:49:39 2015
1969−701997−981982−831994−951985−86Floor
(See assumptions on the Position Analysis Results website)
Jun
Jul
Aug
Sep
Oct
Nov
Dec Jan
Feb
Mar Apr
May Jun
Jul
11
12
13
14
15
16
17
18
19
Sta
ge
(fee
t, N
GV
D)
CA1 Canal SFWMM September 2015 Position AnalysisPA_SEP15DPA Dry Years Plot
Fri Sep 4 14:50:26 2015
Historical
11
12
13
14
15
16
17
18
19
Fri Sep 4 14:50:26 2015
1988−891970−711972−731984−851973−74Floor
Zone A−1 Zone A−2 Zone B Zone C
(See assumptions on the Position Analysis Results website)

Jun
Jul
Aug
Sep
Oct
Nov
Dec Jan
Feb
Mar Apr
May Jun
Jul
8
9
10
11
12
13
14
15
16
17
18
Sta
ge
(fee
t, N
GV
D)
WCA2A SFWMM September 2015 Position AnalysisAMO Warm / El Nino Analog Years Plot PA_SEP15DPA
Fri Sep 4 14:49:49 2015
Historical
8
9
10
11
12
13
14
15
16
17
18
Fri Sep 4 14:49:49 2015
1965−661997−982002−03Floor
(See assumptions on the Position Analysis Results website)
Analog Years are years
with similar climatological conditions
to the current year.

Jun
Jul
Aug
Sep
Oct
Nov
Dec Jan
Feb
Mar Apr
May Jun
Jul
6
7
8
9
10
11
12
13
Sta
ge
(fee
t, N
GV
D)
WCA3A SFWMM September 2015 Position AnalysisPercentiles PA_SEP15DPA
Fri Sep 4 14:48:39 2015
Historical
6
7
8
9
10
11
12
13
Fri Sep 4 14:48:39 2015
MAXP95P90P75P50P25P10P5MINFloor
Zone A Zone D Zone E Zone E1
(See assumptions on the Position Analysis Results website)
Jun
Jul
Aug
Sep
Oct
Nov
Dec Jan
Feb
Mar Apr
May Jun
Jul
6
7
8
9
10
11
12
13
Sta
ge
(fee
t, N
GV
D)
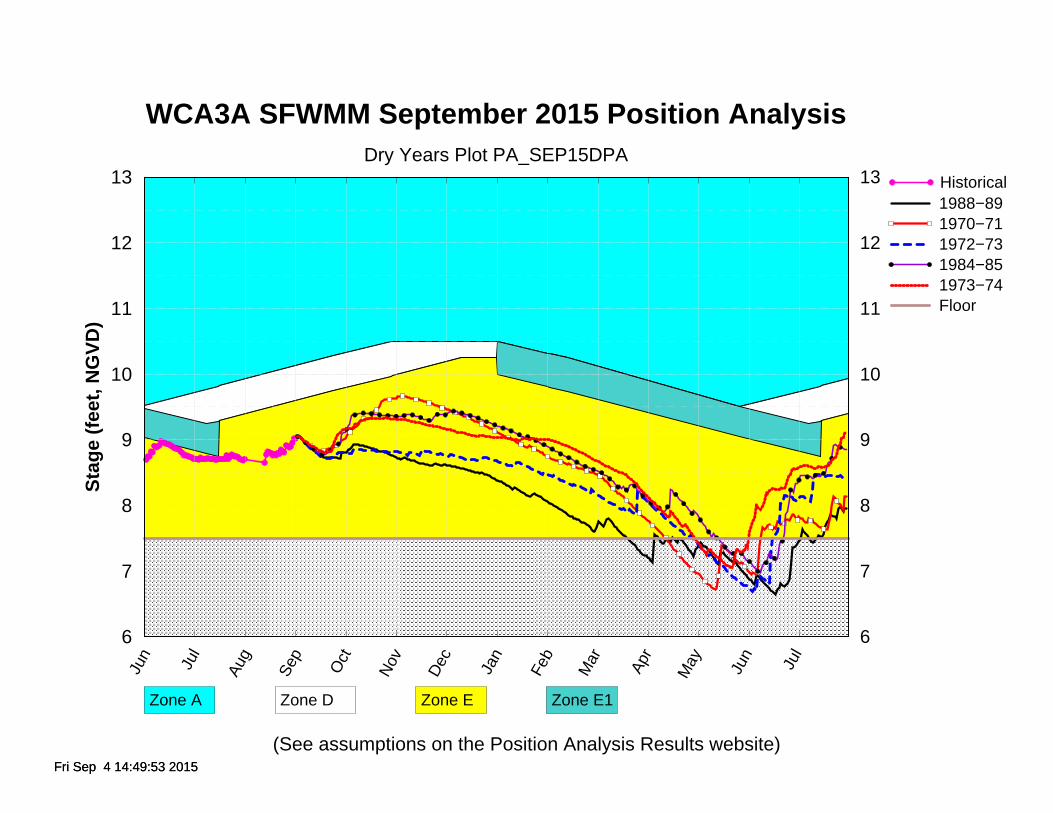
WCA3A SFWMM September 2015 Position AnalysisDry Years Plot PA_SEP15DPA
Fri Sep 4 14:49:53 2015
Historical
6
7
8
9
10
11
12
13
Fri Sep 4 14:49:53 2015
1988−891970−711972−731984−851973−74Floor
Zone A Zone D Zone E Zone E1
(See assumptions on the Position Analysis Results website)

Jun
Jul
Aug
Sep
Oct
Nov
Dec Jan
Feb
Mar Apr
May Jun
Jul
6
7
8
9
10
11
12
13
Sta
ge
(fee
t, N
GV
D)
WCA3A SFWMM September 2015 Position AnalysisWet Years Plot PA_SEP15DPA
Fri Sep 4 14:49:58 2015
Historical
6
7
8
9
10
11
12
13
Fri Sep 4 14:49:58 2015
1994−951982−831969−701997−981992−93Floor
Zone A Zone D Zone E Zone E1
(See assumptions on the Position Analysis Results website)

Jun
Jul
Aug
Sep
Oct
Nov
Dec Jan
Feb
Mar Apr
May Jun
Jul
6
7
8
9
10
11
12
13
Sta
ge
(fee
t, N
GV
D)
CA3 Canal SFWMM September 2015 Position AnalysisPA_SEP15DPA Dry Years Plot
Fri Sep 4 14:50:59 2015
Historical
6
7
8
9
10
11
12
13
Fri Sep 4 14:50:59 2015
1988−891970−711972−731984−851973−74Floor
Zone A Zone D Zone E Zone E1
(See assumptions on the Position Analysis Results website)
Jun
Jul
Aug
Sep
Oct
Nov
Dec Jan
Feb
Mar Apr
May Jun
Jul
6
7
8
9
10
11
12
13
Sta
ge
(fee
t, N
GV
D)
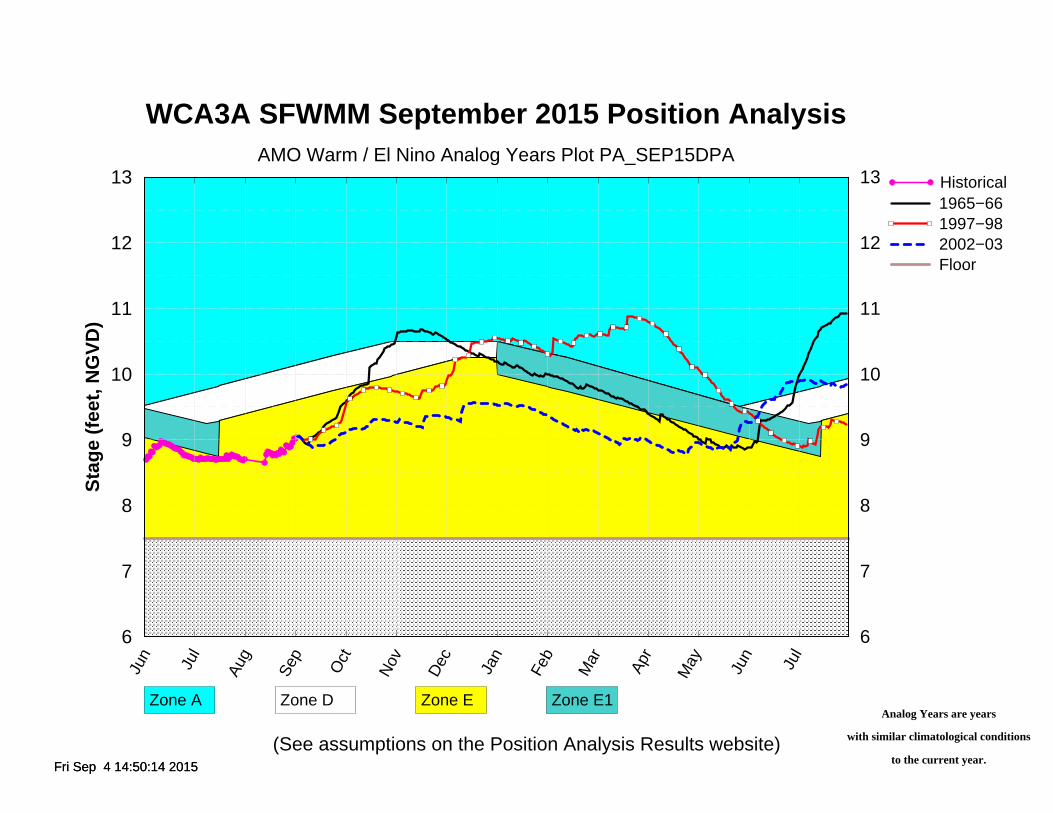
WCA3A SFWMM September 2015 Position AnalysisAMO Warm / El Nino Analog Years Plot PA_SEP15DPA
Fri Sep 4 14:50:14 2015
Historical
6
7
8
9
10
11
12
13
Fri Sep 4 14:50:14 2015
1965−661997−982002−03Floor
Zone A Zone D Zone E Zone E1
(See assumptions on the Position Analysis Results website)
Analog Years are years
with similar climatological conditions
to the current year.

Jul
Aug
Sep
Oct
Nov
Dec Jan
Feb
Mar Apr
May Jun
Jul
Aug
48
49
50
51
52
53
54
55
56
Sta
ge (
feet
, NG
VD
)S65 UK−OPS Sep 1 2015 Position Analysis
UK−OPS Unconditional PA
Fri Sep 4 14:48:09 2015
Historical
48
49
50
51
52
53
54
55
56
Fri Sep 4 14:48:09 2015
MAXP95P90P75P50P25P10P5MIN
Zone A Zone B Zone C
(See assumptions on the Position Analysis Results website)

Jul
Aug
Sep
Oct
Nov
Dec Jan
Feb
Mar Apr
May Jun
Jul
Aug
47
48
49
50
51
52
53
54
55
56
57
58
Sta
ge (
feet
, NG
VD
)S61 UK−OPS Sep 1 2015 Position Analysis
UK−OPS Unconditional PA
Fri Sep 4 14:47:59 2015
Historical
47
48
49
50
51
52
53
54
55
56
57
58
Fri Sep 4 14:47:59 2015
MAXP95P90P75P50P25P10P5MIN
Zone A Zone C
(See assumptions on the Position Analysis Results website)

For the Dynamic Position Analysis the Upper Kissimmee Operations Screening (UK-OPS) Model is used to
simulate water levels and releases from Lakes Kissimmee-Cypress-Hatchineha, Tohopekaliga, and East
Lake Tohopekaliga. The UK-OPS Model is used to obtain a representation of the Lake Kissimmee
operations per the 2015 Wet Season Kissimmee Basin Interagency Planning Meeting. While SFWMD
staff efforts continue toward improving the modeling tools for the Kissimmee basins, an intermediate
solution is to use the UK-OPS Model.

AREA :Canal Name :SFWMM Name:Location :SFWMD sensor
stage(ft)
WPB :C-18 :C18 :G92-H : 14.01
WPB :C-17 :C17 :S44-H : 6.86
WPB :C-51W :C51W :S5AE-T : 11.66
WPB :C-51 :C51 :S155-H : 8.02
WCA :WCA-1 L-40 :CA1 :1-8C : 16.23
FTLD :Hillsboro Canal :HLSB :G56-H : 7.69
WCA :WCA-2A L-38 :L38 :S11B-H : 11.83
WCA :WCA-2A L-39 :CA2A :S10A-T : 12.48
FTLD :C-14 :C14 :S37B-H : 6.79
FTLD :C-14E :C14E :S37A-H : 3.70
FTLD :Pompano :POMP :G57-H : 4.43
FTLD :C-12 :C12 :S33-H : 3.10
FTLD :C-13 :C13 :S36-H : 4.07
FTLD :North New River Canal :NNRC :G54-H : 4.33
MIAMI :L-33 :L33 :S30-H : 4.85
MIAMI :C-304 :C304 :S31-H : 7.05
MIAMI :C-9 :C9 :S29-H : 2.53
MIAMI :C-9 DEN :C9DEN :S29-H : 2.53
MIAMI :C-8 :C8 :S28-H : 2.36
MIAMI :C-7 :C7 :S27-H : 2.20
MIAMI :C-6 :C6 :S26-H : 2.83
MIAMI :C-2/C-4 :C4 :S25B-H : 2.48
MIAMI :L-30 :L30 :S335-H : 6.08
WCA :WCA-3A L-29 :CA3 :S333-H : 8.78
WCA :S-12A :S12AD :S12A-T : 8.19
WCA :S-12B :S12BD :S12B-T : 7.91
WCA :S-12C :S12CD :S12C-T : 8.18
WCA :S-12D :S12DD :S12D-T : 6.44
MIAMI :L-29 :L29 :S334-H : 6.42
MIAMI :C-100C :C100C :S119-H : 3.55
MIAMI :C-100 :C100 :S118-H : 3.85
MIAMI :C-100A :C100A :S123-H : 2.46
HMST :C-1/S-148 :S148U :S148-H : 4.19
HMST :L-31N :L31N :S331-H : 4.86
HMST :C-1N :C1N :S149-H : 3.48
MIAMI :S-21 :S21 :S21-H : 1.94
HMST :L-31S :L31S :S176-H : 2.00
MIAMI :C-102N :C102N :S21A-H : 2.36
HMST :C-102 :C102 :S165-H : 3.93
MIAMI :C-103S :C103S :S167-H : 3.82
HMST :C-103N :C103N :S166-H : 3.53
HMST :C-103 :S179 :S179-H : 3.16
HMST :L-31W :L31W :S332-H : 4.53
HMST :C-111 :C111 :S177-H : 3.73
HMST :CNO :CNO :S179-H : 3.16
HMST :C-111E :C111E :S18C-H : 2.33
HMST :S-197 :S197 :S197-H : 2.28
EAA :L-23E :L23E :S8-T : 11.89
EAA :C-60 :C60 :S140-T : 11.49
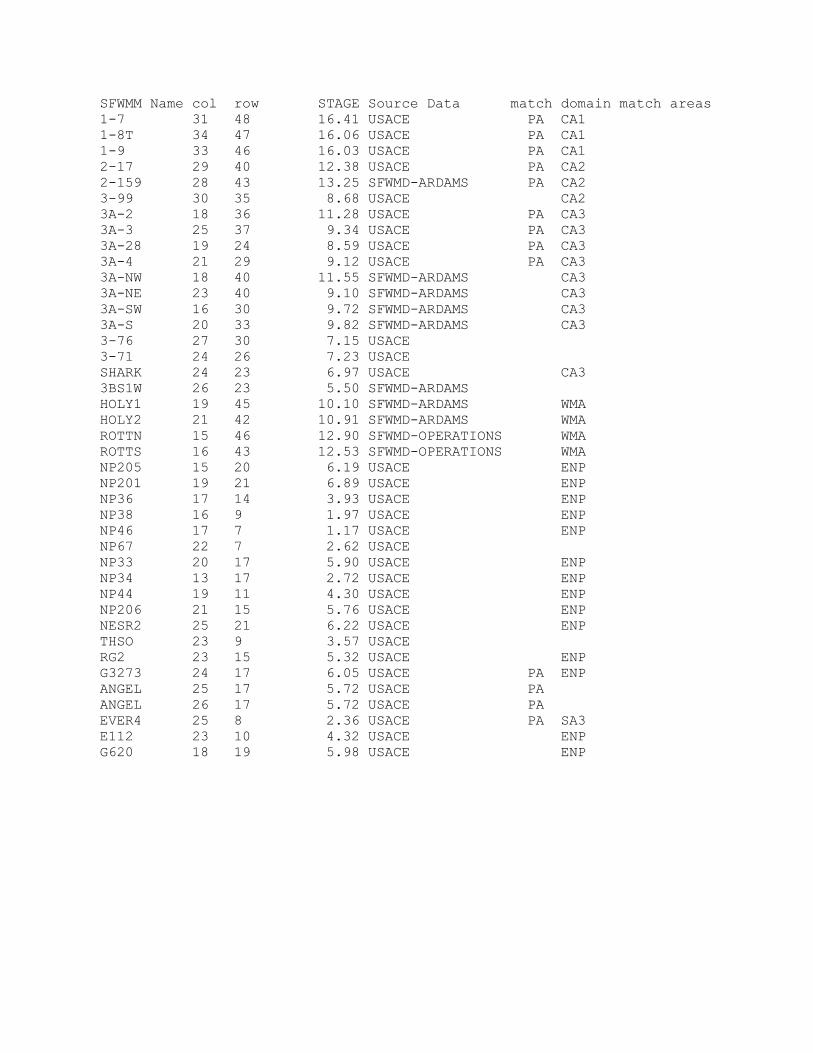
SFWMM Name col row STAGE Source Data match domain match areas
1-7 31 48 16.41 USACE PA CA1
1-8T 34 47 16.06 USACE PA CA1
1-9 33 46 16.03 USACE PA CA1
2-17 29 40 12.38 USACE PA CA2
2-159 28 43 13.25 SFWMD-ARDAMS PA CA2
3-99 30 35 8.68 USACE CA2
3A-2 18 36 11.28 USACE PA CA3
3A-3 25 37 9.34 USACE PA CA3
3A-28 19 24 8.59 USACE PA CA3
3A-4 21 29 9.12 USACE PA CA3
3A-NW 18 40 11.55 SFWMD-ARDAMS CA3
3A-NE 23 40 9.10 SFWMD-ARDAMS CA3
3A-SW 16 30 9.72 SFWMD-ARDAMS CA3
3A-S 20 33 9.82 SFWMD-ARDAMS CA3
3-76 27 30 7.15 USACE
3-71 24 26 7.23 USACE
SHARK 24 23 6.97 USACE CA3
3BS1W 26 23 5.50 SFWMD-ARDAMS
HOLY1 19 45 10.10 SFWMD-ARDAMS WMA
HOLY2 21 42 10.91 SFWMD-ARDAMS WMA
ROTTN 15 46 12.90 SFWMD-OPERATIONS WMA
ROTTS 16 43 12.53 SFWMD-OPERATIONS WMA
NP205 15 20 6.19 USACE ENP
NP201 19 21 6.89 USACE ENP
NP36 17 14 3.93 USACE ENP
NP38 16 9 1.97 USACE ENP
NP46 17 7 1.17 USACE ENP
NP67 22 7 2.62 USACE
NP33 20 17 5.90 USACE ENP
NP34 13 17 2.72 USACE ENP
NP44 19 11 4.30 USACE ENP
NP206 21 15 5.76 USACE ENP
NESR2 25 21 6.22 USACE ENP
THSO 23 9 3.57 USACE
RG2 23 15 5.32 USACE ENP
G3273 24 17 6.05 USACE PA ENP
ANGEL 25 17 5.72 USACE PA
ANGEL 26 17 5.72 USACE PA
EVER4 25 8 2.36 USACE PA SA3
E112 23 10 4.32 USACE ENP
G620 18 19 5.98 USACE ENP

777675747372717069686766656463626160595857565554535251504948474645444342414039383736353433323130292827262524232221201918171615141312111098765432
2 3 4 5 6 7 8 9 10 11 12 13 14 15 16 17 18 19 20 21 22 23 24 25 26 27 28 29 30 31 32 33 34 35 36 37 38 39 40 411
SFWMM POSITION ANALYSIS RUNINITIAL STAGE VALUES SEPTEMBER 1, 2015
/
CREATED: 1 SEPT 2015
0 10 205Miles
Stage Class (feet NGVD)SFWMM Grid
< or = 1.001.01 - 2.002.01 - 3.003.01 - 4.004.01 - 5.005.01 - 6.006.01 - 7.007.01 - 8.008.01 - 9.009.01 - 10.0010.01 - 11.0011.01 - 12.0012.01 - 13.0013.01 - 14.0014.01 - 15.0015.01 - 16.0016.01 - 17.00> 17.00
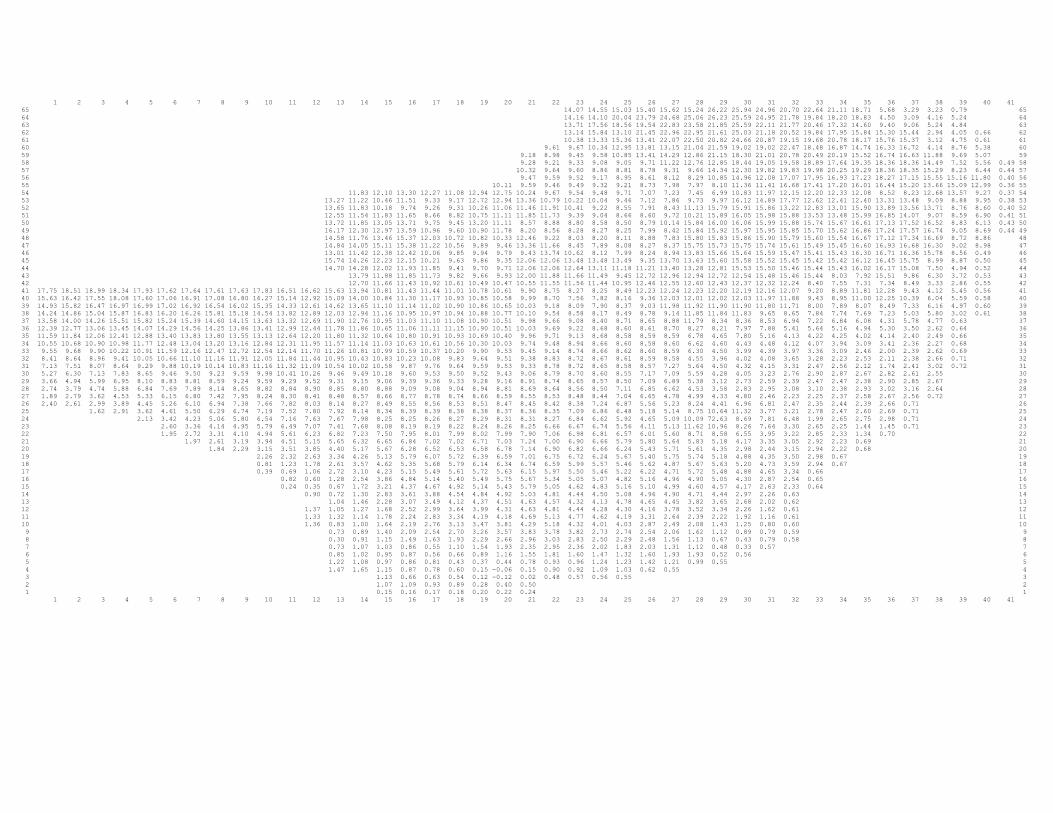
1 2 3 4 5 6 7 8 9 10 11 12 13 14 15 16 17 18 19 20 21 22 23 24 25 26 27 28 29 30 31 32 33 34 35 36 37 38 39 40 41
65 14.07 14.55 15.03 15.40 15.62 15.24 26.22 25.94 24.96 20.70 22.64 21.11 18.71 5.68 3.29 3.23 0.79 65
64 14.16 14.10 20.04 23.79 24.68 25.06 26.23 25.59 24.95 21.78 19.84 18.20 18.83 4.50 3.09 4.16 5.24 64
63 13.71 17.56 18.56 19.54 22.83 23.58 21.85 25.59 22.11 21.77 20.46 17.32 14.60 9.40 9.06 5.24 4.84 63
62 13.14 15.84 13.10 21.45 22.96 22.95 21.61 25.03 21.18 20.52 19.84 17.95 15.84 15.30 15.44 2.94 4.05 0.66 62
61 10.38 13.33 15.36 13.41 22.07 22.50 20.82 24.66 20.87 19.15 19.68 20.78 18.17 15.76 15.37 3.12 4.75 0.61 61
60 9.61 9.67 10.34 12.95 13.81 13.15 21.04 21.59 19.02 19.02 22.47 18.48 16.87 14.74 16.33 16.72 4.14 8.76 5.38 60
59 9.18 8.98 9.45 9.58 10.85 13.41 14.29 12.86 21.15 18.30 21.01 20.78 20.49 20.19 15.52 16.74 16.63 11.88 9.69 5.07 59
58 9.28 9.21 9.33 9.08 9.05 9.71 11.22 12.76 12.85 18.44 19.05 19.58 18.89 17.64 19.35 18.36 18.36 14.49 7.52 5.56 0.49 58
57 10.32 9.64 9.60 8.86 8.81 8.78 9.31 9.66 14.34 12.30 19.82 19.83 19.98 20.25 19.29 18.36 18.35 15.29 8.23 6.44 0.44 57
56 9.47 9.59 9.52 9.17 8.95 8.61 8.12 8.29 10.85 14.96 12.08 17.07 17.95 16.93 17.23 18.27 17.15 15.55 15.16 11.80 0.40 56
55 10.11 9.59 9.46 9.49 9.32 9.21 8.73 7.98 7.97 8.10 11.36 11.41 16.68 17.41 17.20 16.01 16.44 15.20 13.66 15.09 12.99 0.36 55
54 11.83 12.10 13.30 12.27 11.08 12.94 12.75 10.24 9.67 9.54 9.48 9.71 7.07 7.23 7.45 6.99 10.83 11.97 12.15 12.20 12.33 12.08 8.52 8.23 12.68 13.57 9.27 0.37 54
53 13.27 11.22 10.46 11.51 9.33 9.17 12.72 12.94 13.36 10.79 10.22 10.04 9.46 7.12 7.86 9.73 9.97 16.12 14.89 17.77 12.62 12.41 12.40 13.31 13.48 9.09 8.88 9.95 0.38 53
52 13.65 11.83 10.18 9.74 9.26 9.31 10.26 11.06 11.46 11.91 10.41 9.22 8.55 7.91 8.43 11.13 15.79 15.91 15.86 13.22 12.83 13.01 15.90 13.89 13.56 13.71 8.76 8.60 0.40 52
51 12.55 11.54 11.83 11.65 8.66 8.82 10.75 11.11 11.85 11.73 9.39 9.04 8.66 8.60 9.72 10.21 15.89 16.05 15.98 15.88 13.53 13.48 15.99 16.85 14.07 9.07 8.59 6.90 0.41 51
50 13.72 11.85 13.05 13.71 9.75 9.45 13.20 11.11 8.57 8.88 8.80 8.58 8.50 8.79 10.14 15.84 16.00 16.06 15.99 15.88 15.74 15.67 16.61 17.13 17.52 16.52 8.83 6.13 0.43 50
49 16.17 12.30 12.97 13.59 10.96 9.60 10.90 11.78 8.20 8.56 8.28 8.27 8.25 7.99 8.42 15.84 15.92 15.97 15.95 15.85 15.70 15.62 16.86 17.24 17.57 16.74 9.05 8.69 0.44 49
48 14.58 11.76 13.46 15.37 12.03 10.72 10.82 10.33 12.46 9.22 8.03 8.20 8.11 8.88 7.83 15.80 15.83 15.86 15.90 15.79 15.60 15.54 16.67 17.12 17.34 16.69 8.72 8.86 48
47 14.84 14.05 15.11 15.38 11.22 10.56 9.89 9.46 13.36 11.66 8.45 7.89 8.08 8.27 8.37 15.75 15.73 15.75 15.74 15.61 15.49 15.45 16.60 16.93 16.68 16.30 9.02 8.98 47
46 13.01 11.42 12.38 12.42 10.06 9.85 9.94 9.79 9.43 13.74 10.62 8.12 7.99 8.24 8.94 13.83 15.66 15.64 15.59 15.47 15.41 15.43 16.30 16.71 16.36 15.78 8.56 0.49 46
45 15.74 14.26 12.23 12.15 10.21 9.63 9.86 9.35 12.06 12.06 13.48 13.48 13.49 9.35 13.70 13.63 15.60 15.58 15.52 15.45 15.42 15.42 16.12 16.45 15.75 8.99 8.87 0.50 45
44 14.70 14.28 12.02 11.93 11.85 9.41 9.70 9.71 12.06 12.06 12.64 13.11 11.18 11.21 13.40 13.28 12.81 15.53 15.50 15.46 15.44 15.43 16.02 16.17 15.08 7.50 4.94 0.52 44
43 13.79 11.88 11.85 11.73 9.82 9.66 9.93 12.00 11.88 11.66 11.49 9.45 12.72 12.96 12.94 12.72 12.54 15.48 15.46 15.44 8.03 7.92 15.51 9.86 6.30 3.72 0.53 43
42 12.70 11.66 11.43 10.92 10.61 10.49 10.47 10.55 11.55 11.56 11.44 10.95 12.46 12.55 12.60 12.43 12.37 12.32 12.24 8.40 7.55 7.31 7.34 8.49 3.33 2.86 0.55 42
41 17.75 18.51 18.99 18.34 17.93 17.62 17.64 17.61 17.63 17.83 16.51 16.62 15.63 13.94 10.81 11.43 11.44 11.01 10.78 10.61 9.90 8.75 8.27 8.25 8.49 12.23 12.24 12.23 12.20 12.19 12.16 12.07 9.20 8.89 11.81 12.28 9.43 4.12 5.45 0.56 41
40 15.63 16.42 17.55 18.08 17.60 17.06 16.91 17.08 16.80 16.27 15.14 12.92 15.09 14.00 10.84 11.30 11.17 10.93 10.85 10.58 9.99 8.70 7.56 7.82 8.16 9.36 12.03 12.01 12.02 12.03 11.97 11.88 9.43 8.95 11.00 12.25 10.39 6.04 5.59 0.58 40
39 14.93 15.82 16.47 16.97 16.99 17.02 16.92 16.54 16.02 15.35 14.33 12.61 14.62 13.65 11.10 11.14 11.02 10.90 10.86 10.65 10.03 9.18 8.09 7.90 8.37 9.03 11.98 11.92 11.90 11.90 11.80 11.71 8.00 7.89 8.07 8.49 7.33 6.16 4.97 0.60 39
38 14.24 14.86 15.04 15.87 16.83 16.20 16.26 15.81 15.18 14.54 13.82 12.89 12.03 12.94 11.16 10.95 10.97 10.94 10.88 10.77 10.10 9.54 8.58 8.17 8.49 8.78 9.14 11.85 11.84 11.83 9.65 8.65 7.84 7.74 7.69 7.23 5.03 5.80 3.02 0.61 38
37 13.58 14.00 14.26 15.51 15.82 15.24 15.39 14.60 14.15 13.63 13.32 12.69 11.90 12.76 10.95 11.03 11.10 11.08 10.90 10.51 9.98 9.66 9.08 8.40 8.71 8.65 8.88 11.79 8.34 8.36 8.53 6.94 7.22 6.84 6.08 4.31 5.78 4.77 0.63 37
36 12.39 12.77 13.06 13.45 14.07 14.29 14.56 14.25 13.86 13.41 12.99 12.44 11.78 11.86 10.65 11.06 11.11 11.15 10.90 10.51 10.03 9.69 9.22 8.68 8.60 8.61 8.70 8.27 8.21 7.97 7.88 5.41 5.64 5.16 4.94 5.30 3.50 2.62 0.64 36
35 11.59 11.84 12.06 12.41 12.88 13.40 13.83 13.80 13.55 13.13 12.64 12.20 11.80 11.32 10.64 10.80 10.91 10.93 10.69 10.40 9.96 9.71 9.13 8.68 8.58 8.59 8.59 6.78 4.65 7.80 5.16 4.13 4.22 4.25 4.02 4.14 2.40 2.49 0.66 35
34 10.55 10.68 10.90 10.98 11.77 12.48 13.04 13.20 13.16 12.84 12.31 11.95 11.57 11.14 11.03 10.63 10.61 10.56 10.30 10.03 9.74 9.48 8.94 8.66 8.60 8.58 8.60 6.62 4.60 4.43 4.48 4.12 4.07 3.94 3.09 3.41 2.36 2.27 0.68 34
33 9.55 9.68 9.90 10.22 10.91 11.59 12.16 12.47 12.72 12.54 12.14 11.70 11.26 10.81 10.99 10.59 10.37 10.20 9.90 9.53 9.45 9.14 8.74 8.66 8.62 8.60 8.59 6.30 4.50 3.99 4.39 3.97 3.36 3.09 2.46 2.00 2.39 2.62 0.69 33
32 8.41 8.64 8.96 9.41 10.05 10.66 11.10 11.16 11.91 12.05 11.84 11.44 10.95 10.43 10.83 10.23 10.08 9.83 9.64 9.51 9.38 8.83 8.72 8.67 8.61 8.59 8.58 4.55 3.96 4.02 4.08 3.65 3.28 2.23 2.53 2.11 2.38 2.66 0.71 32
31 7.13 7.51 8.07 8.64 9.29 9.88 10.19 10.14 10.83 11.16 11.32 11.09 10.54 10.02 10.58 9.87 9.76 9.64 9.59 9.53 9.33 8.78 8.72 8.65 8.58 8.57 7.27 5.64 4.50 4.32 4.15 3.31 2.47 2.56 2.12 1.74 2.41 3.02 0.72 31
30 5.27 6.30 7.13 7.83 8.65 9.46 9.50 9.23 9.59 9.98 10.41 10.26 9.46 9.49 10.18 9.60 9.53 9.50 9.52 9.43 9.06 8.79 8.70 8.60 8.55 7.17 7.09 5.59 4.28 4.05 3.23 2.76 2.90 2.87 2.67 2.82 2.61 2.55 30
29 3.66 4.94 5.99 6.95 8.10 8.83 8.81 8.59 9.24 9.59 9.29 9.52 9.31 9.15 9.06 9.39 9.36 9.33 9.28 9.16 8.91 8.74 8.65 8.57 8.50 7.09 6.89 5.38 3.12 2.73 2.59 2.39 2.47 2.47 2.38 2.90 2.85 2.67 29
28 2.74 3.79 4.74 5.88 6.84 7.69 7.89 8.14 8.65 8.82 8.84 8.90 8.85 8.80 8.88 9.09 9.08 9.04 8.94 8.81 8.69 8.64 8.56 8.50 7.11 6.85 6.62 4.53 3.58 2.83 2.95 3.08 3.10 2.38 2.93 3.02 3.16 2.64 28
27 1.89 2.79 3.62 4.53 5.33 6.15 6.80 7.42 7.95 8.24 8.30 8.41 8.48 8.57 8.66 8.77 8.78 8.74 8.66 8.59 8.55 8.53 8.48 8.44 7.04 6.65 4.78 4.99 4.33 4.80 2.46 2.23 2.25 2.37 2.58 2.67 2.56 0.72 27
26 2.40 2.61 2.99 3.89 4.45 5.26 6.10 6.94 7.38 7.66 7.82 8.03 8.14 8.27 8.49 8.55 8.56 8.53 8.51 8.47 8.45 8.42 8.38 7.24 6.87 5.56 5.23 8.24 4.41 6.96 6.81 2.47 2.35 2.44 2.39 2.66 0.71 26
25 1.62 2.91 3.62 4.61 5.50 6.29 6.74 7.19 7.52 7.80 7.92 8.14 8.34 8.39 8.39 8.38 8.38 8.37 8.36 8.35 7.09 6.86 6.48 5.18 5.14 8.75 10.64 11.32 3.77 3.21 2.78 2.47 2.60 2.69 0.71 25
24 2.13 3.42 4.23 5.06 5.80 6.54 7.16 7.63 7.67 7.98 8.25 8.25 8.26 8.27 8.29 8.31 8.31 8.27 6.84 6.62 5.92 4.65 5.09 10.09 72.63 8.69 7.81 6.48 1.99 2.65 2.75 2.98 0.71 24
23 2.60 3.36 4.14 4.95 5.79 6.49 7.07 7.41 7.68 8.08 8.19 8.19 8.22 8.24 8.26 8.25 6.66 6.67 6.74 5.56 4.11 5.13 11.62 10.96 8.26 7.64 3.30 2.65 2.25 1.44 1.45 0.71 23
22 1.95 2.72 3.31 4.10 4.94 5.61 6.23 6.82 7.23 7.50 7.95 8.01 7.99 8.02 7.99 7.90 7.06 6.98 6.81 6.57 6.01 5.60 8.71 8.58 6.55 3.95 3.22 2.85 2.33 1.34 0.70 22
21 1.97 2.61 3.19 3.94 4.51 5.15 5.65 6.32 6.65 6.84 7.02 7.02 6.71 7.03 7.24 7.00 6.90 6.66 5.79 5.80 5.64 5.83 5.18 4.17 3.35 3.05 2.92 2.23 0.69 21
20 1.84 2.29 3.15 3.51 3.85 4.40 5.17 5.67 6.28 6.52 6.53 6.58 6.78 7.14 6.90 6.82 6.66 6.24 5.43 5.71 5.61 4.35 2.98 2.44 3.15 2.94 2.22 0.68 20
19 2.26 2.32 2.63 3.34 4.26 5.13 5.79 6.07 5.72 6.39 6.59 7.01 6.75 6.72 6.24 5.67 5.40 5.75 5.74 5.18 4.88 4.35 3.50 2.98 0.67 19
18 0.81 1.23 1.78 2.61 3.57 4.62 5.35 5.68 5.79 6.14 6.34 6.74 6.59 5.99 5.57 5.46 5.62 4.87 5.67 5.63 5.20 4.73 3.59 2.94 0.67 18
17 0.39 0.69 1.06 2.72 3.10 4.23 5.15 5.49 5.61 5.72 5.63 6.15 5.97 5.50 5.46 5.22 6.22 4.71 5.72 5.48 4.88 4.65 3.34 0.66 17
16 0.82 0.60 1.28 2.54 3.86 4.84 5.14 5.40 5.49 5.75 5.67 5.34 5.05 5.07 4.82 5.16 4.96 4.90 5.05 4.30 2.87 2.54 0.65 16
15 0.24 0.35 0.67 1.72 3.21 4.37 4.67 4.92 5.14 5.43 5.79 5.05 4.62 4.83 5.16 5.10 4.99 4.60 4.57 4.17 2.63 2.33 0.64 15
14 0.90 0.72 1.30 2.83 3.61 3.88 4.54 4.84 4.92 5.03 4.81 4.44 4.50 5.08 4.96 4.90 4.71 4.44 2.97 2.26 0.63 14
13 1.04 1.46 2.28 3.07 3.49 4.12 4.37 4.51 4.63 4.57 4.32 4.13 4.78 4.65 4.45 3.82 3.65 2.68 2.02 0.62 13
12 1.37 1.05 1.27 1.68 2.52 2.99 3.64 3.99 4.31 4.63 4.81 4.44 4.28 4.30 4.16 3.78 3.52 3.34 2.26 1.62 0.61 12
11 1.33 1.32 1.14 1.78 2.24 2.83 3.34 4.19 4.18 4.69 5.13 4.77 4.62 4.19 3.31 2.64 2.39 2.22 1.92 1.16 0.61 11
10 1.36 0.83 1.00 1.64 2.19 2.76 3.13 3.47 3.81 4.29 5.18 4.32 4.01 4.03 2.87 2.49 2.08 1.43 1.25 0.80 0.60 10
9 0.73 0.89 1.40 2.09 2.54 2.70 3.26 3.57 3.83 3.78 3.82 2.73 2.74 2.54 2.06 1.62 1.12 0.89 0.79 0.59 9
8 0.30 0.91 1.15 1.49 1.63 1.93 2.29 2.66 2.96 3.03 2.83 2.50 2.29 2.48 1.56 1.13 0.67 0.43 0.79 0.58 8
7 0.73 1.07 1.03 0.86 0.55 1.10 1.54 1.93 2.35 2.95 2.36 2.02 1.83 2.03 1.31 1.12 0.48 0.33 0.57 7
6 0.85 1.02 0.95 0.87 0.56 0.66 0.89 1.16 1.55 1.81 1.60 1.47 1.32 1.60 1.93 1.93 0.52 0.56 6
5 1.22 1.08 0.97 0.86 0.81 0.43 0.37 0.44 0.78 0.93 0.96 1.24 1.23 1.42 1.21 0.99 0.55 5
4 1.47 1.65 1.15 0.87 0.78 0.60 0.15 -0.06 0.15 0.90 0.92 1.09 1.03 0.62 0.55 4
3 1.13 0.66 0.63 0.54 0.12 -0.12 0.02 0.48 0.57 0.56 0.55 3
2 1.07 1.09 0.93 0.89 0.28 0.40 0.50 2
1 0.15 0.16 0.17 0.18 0.20 0.22 0.24 1
1 2 3 4 5 6 7 8 9 10 11 12 13 14 15 16 17 18 19 20 21 22 23 24 25 26 27 28 29 30 31 32 33 34 35 36 37 38 39 40 41
777675747372717069686766656463626160595857565554535251504948474645444342414039383736353433323130292827262524232221201918171615141312111098765432
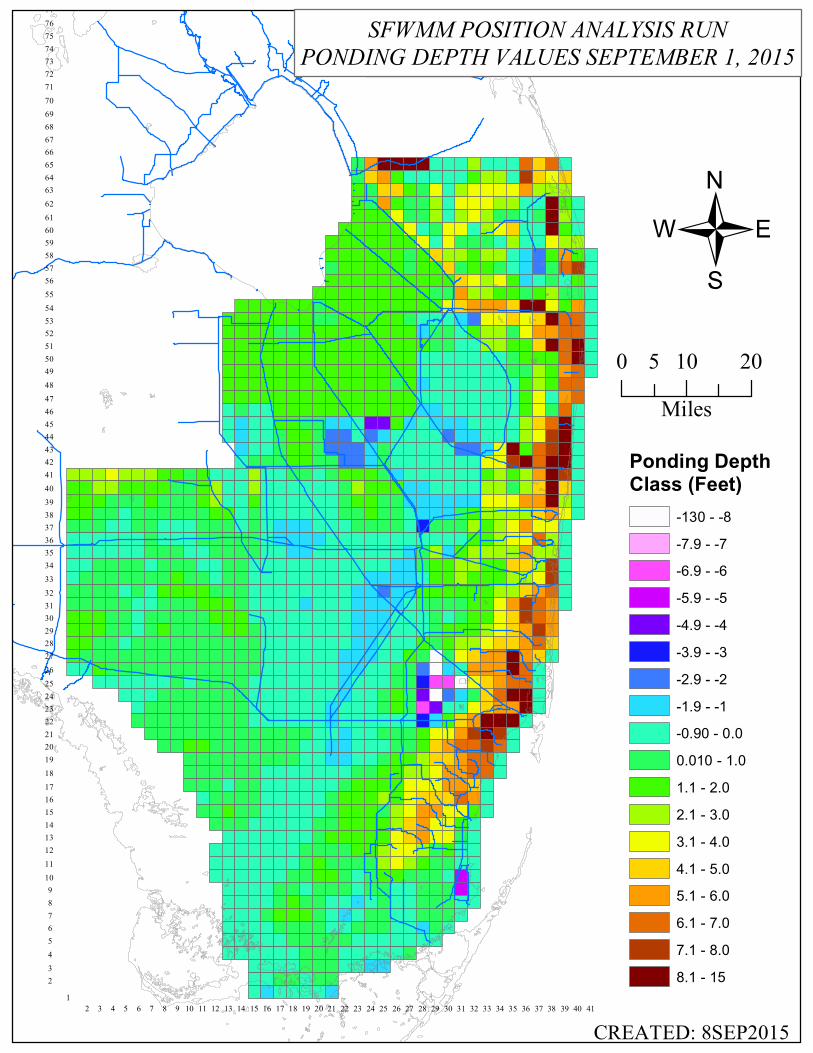
2 3 4 5 6 7 8 9 10 11 12 13 14 15 16 17 18 19 20 21 22 23 24 25 26 27 28 29 30 31 32 33 34 35 36 37 38 39 40 411
SFWMM POSITION ANALYSIS RUNPONDING DEPTH VALUES SEPTEMBER 1, 2015
/
CREATED: 8SEP2015
0 10 205Miles
Ponding Depth Class (Feet)
-130 - -8-7.9 - -7-6.9 - -6-5.9 - -5-4.9 - -4-3.9 - -3-2.9 - -2-1.9 - -1-0.90 - 0.00.010 - 1.01.1 - 2.02.1 - 3.03.1 - 4.04.1 - 5.05.1 - 6.06.1 - 7.07.1 - 8.08.1 - 15

Lake Okechobee Band Probabilities (%) at the Begining of Each Month’(See assumptions on the Position Analysis Results website)’ Initial Stage 12.19 ft. for 08/01/2015
Date HLM High Inter Low Base Bene WSM2015 08 01 2.4 0.0 0.0 0.0 0.0 95.1 2.42015 09 01 2.4 0.0 0.0 0.0 95.1 0.0 2.42015 10 01 2.4 0.4 2.3 4.6 85.0 0.2 5.02015 11 01 2.4 0.0 0.1 20.7 68.0 1.9 7.02015 12 01 2.4 0.0 0.1 21.5 57.0 13.6 5.52016 01 01 2.4 0.0 0.5 31.6 40.0 17.2 8.42016 02 01 2.4 0.0 2.5 42.5 24.3 16.8 11.52016 03 01 2.4 0.0 3.3 39.6 18.3 21.9 14.52016 04 01 2.4 2.4 4.4 31.3 14.4 24.0 21.12016 05 01 2.4 0.0 0.2 30.0 12.0 33.6 21.82016 06 01 2.4 0.0 0.0 35.3 6.3 34.3 21.62016 07 01 2.4 0.0 0.0 26.4 23.9 15.4 31.8

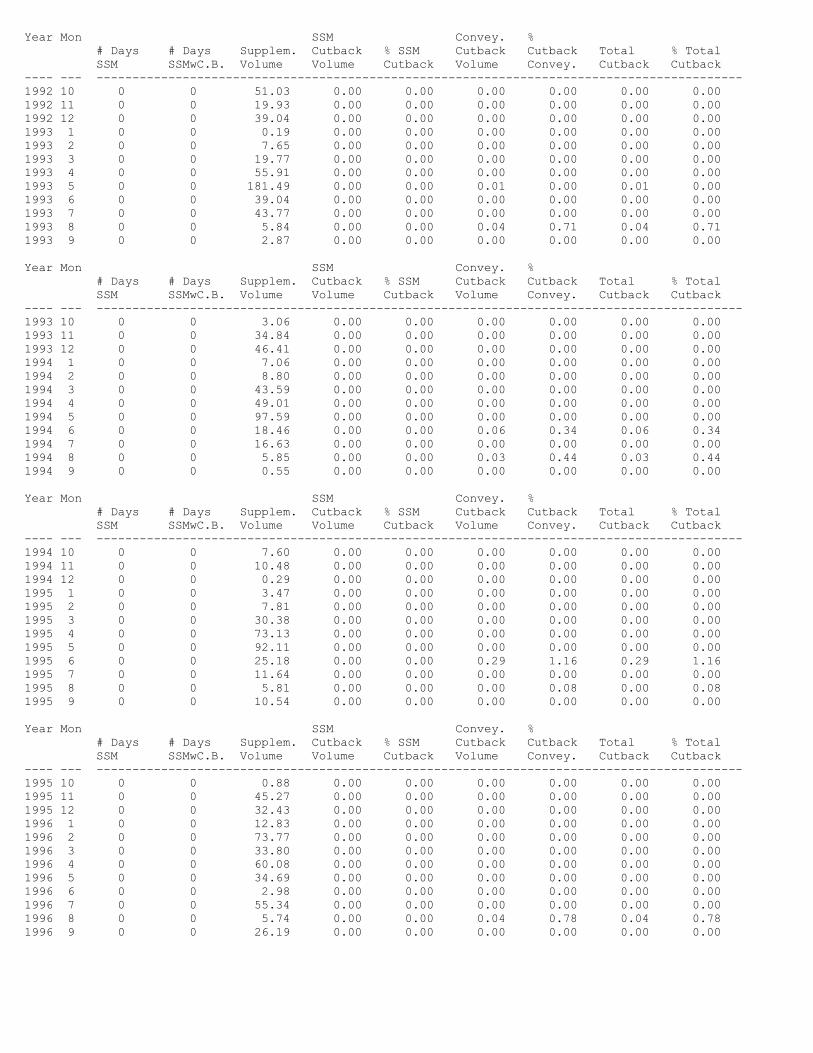
Monthly Supply Side Management Results
for the Lake Okeechobee Service Area
Report by Water Years Oct-Sep
(Volumes in 1000 ac-ft)
Run:
SFWMM v6.7.4 - September 1, 2015 DPA Final
Note: SSM stands for Supply Side Management
SSMwC.B. stands for Supply Side Management with cutback
Year Mon SSM Convey. %
# Days # Days Supplem. Cutback % SSM Cutback Cutback Total % Total
SSM SSMwC.B. Volume Volume Cutback Volume Convey. Cutback Cutback
---- --- ------------------------------------------------------------------------------------------
1965 10 0 0 1.08 0.00 0.00 0.00 0.00 0.00 0.00
1965 11 0 0 46.38 0.00 0.00 0.00 0.00 0.00 0.00
1965 12 0 0 40.14 0.00 0.00 0.00 0.00 0.00 0.00
1966 1 0 0 0.64 0.00 0.00 0.00 0.00 0.00 0.00
1966 2 0 0 15.52 0.00 0.00 0.00 0.00 0.00 0.00
1966 3 0 0 62.64 0.00 0.00 0.00 0.00 0.00 0.00
1966 4 0 0 58.09 0.00 0.00 0.00 0.00 0.00 0.00
1966 5 0 0 49.49 0.00 0.00 0.01 0.01 0.01 0.01
1966 6 0 0 5.78 0.00 0.00 0.00 0.00 0.00 0.00
1966 7 0 0 0.01 0.00 0.00 0.00 0.00 0.00 0.00
1966 8 0 0 5.91 0.00 0.00 0.03 0.54 0.03 0.54
1966 9 0 0 0.02 0.00 0.00 0.00 0.00 0.00 0.00
Year Mon SSM Convey. %
# Days # Days Supplem. Cutback % SSM Cutback Cutback Total % Total
SSM SSMwC.B. Volume Volume Cutback Volume Convey. Cutback Cutback
---- --- ------------------------------------------------------------------------------------------
1966 10 0 0 6.68 0.00 0.00 0.00 0.00 0.00 0.00
1966 11 0 0 83.91 0.00 0.00 0.00 0.00 0.00 0.00
1966 12 0 0 54.70 0.00 0.00 0.00 0.00 0.00 0.00
1967 1 0 0 44.84 0.00 0.00 0.09 0.20 0.09 0.20
1967 2 0 0 26.79 0.00 0.00 0.08 0.31 0.08 0.31
1967 3 0 0 79.43 0.00 0.00 0.00 0.00 0.00 0.00
1967 4 0 0 165.99 0.00 0.00 0.02 0.01 0.02 0.01
1967 5 27 22 220.95 63.46 28.72 2.75 1.24 66.21 29.97
1967 6 30 3 34.67 3.20 9.22 6.02 17.36 9.21 26.58
1967 7 31 1 5.64 1.08 19.10 0.00 0.00 1.08 19.10
1967 8 0 0 5.90 0.00 0.00 0.07 1.13 0.07 1.13
1967 9 0 0 10.29 0.00 0.00 0.00 0.00 0.00 0.00
Year Mon SSM Convey. %
# Days # Days Supplem. Cutback % SSM Cutback Cutback Total % Total
SSM SSMwC.B. Volume Volume Cutback Volume Convey. Cutback Cutback
---- --- ------------------------------------------------------------------------------------------
1967 10 0 0 1.11 0.00 0.00 0.00 0.00 0.00 0.00
1967 11 0 0 85.36 0.00 0.00 0.00 0.00 0.00 0.00
1967 12 0 0 30.04 0.00 0.00 0.00 0.00 0.00 0.00
1968 1 0 0 59.26 0.00 0.00 0.00 0.00 0.00 0.00
1968 2 0 0 36.81 0.00 0.00 0.04 0.10 0.04 0.10
1968 3 0 0 75.14 0.00 0.00 0.00 0.00 0.00 0.00
1968 4 6 0 130.30 0.00 0.00 0.00 0.00 0.00 0.00
1968 5 14 0 27.41 0.00 0.00 0.00 0.00 0.00 0.00
1968 6 0 0 0.83 0.00 0.00 0.00 0.00 0.00 0.00
1968 7 0 0 11.06 0.00 0.00 0.00 0.00 0.00 0.00
1968 8 0 0 5.78 0.00 0.00 0.07 1.17 0.07 1.17
1968 9 0 0 6.39 0.00 0.00 0.00 0.00 0.00 0.00

Year Mon SSM Convey. %
# Days # Days Supplem. Cutback % SSM Cutback Cutback Total % Total
SSM SSMwC.B. Volume Volume Cutback Volume Convey. Cutback Cutback
---- --- ------------------------------------------------------------------------------------------
1968 10 0 0 0.54 0.00 0.00 0.00 0.00 0.00 0.00
1968 11 0 0 35.06 0.00 0.00 0.00 0.00 0.00 0.00
1968 12 0 0 83.82 0.00 0.00 0.00 0.00 0.00 0.00
1969 1 0 0 25.68 0.00 0.00 0.00 0.00 0.00 0.00
1969 2 0 0 46.44 0.00 0.00 0.00 0.00 0.00 0.00
1969 3 0 0 12.31 0.00 0.00 0.00 0.00 0.00 0.00
1969 4 0 0 64.38 0.00 0.00 0.00 0.00 0.00 0.00
1969 5 0 0 25.00 0.00 0.00 0.00 0.00 0.00 0.00
1969 6 0 0 22.82 0.00 0.00 0.00 0.00 0.00 0.00
1969 7 0 0 22.43 0.00 0.00 0.03 0.14 0.03 0.14
1969 8 0 0 5.93 0.00 0.00 0.06 1.06 0.06 1.06
1969 9 0 0 0.72 0.00 0.00 0.00 0.00 0.00 0.00
Year Mon SSM Convey. %
# Days # Days Supplem. Cutback % SSM Cutback Cutback Total % Total
SSM SSMwC.B. Volume Volume Cutback Volume Convey. Cutback Cutback
---- --- ------------------------------------------------------------------------------------------
1969 10 0 0 7.52 0.00 0.00 0.00 0.00 0.00 0.00
1969 11 0 0 10.93 0.00 0.00 0.00 0.00 0.00 0.00
1969 12 0 0 16.81 0.00 0.00 0.00 0.00 0.00 0.00
1970 1 0 0 3.55 0.00 0.00 0.00 0.00 0.00 0.00
1970 2 0 0 11.54 0.00 0.00 0.00 0.00 0.00 0.00
1970 3 0 0 13.93 0.00 0.00 0.00 0.00 0.00 0.00
1970 4 0 0 73.08 0.00 0.00 0.00 0.00 0.00 0.00
1970 5 0 0 161.19 0.00 0.00 0.02 0.02 0.02 0.02
1970 6 0 0 9.38 0.00 0.00 0.00 0.00 0.00 0.00
1970 7 0 0 10.33 0.00 0.00 0.00 0.00 0.00 0.00
1970 8 0 0 5.88 0.00 0.00 0.03 0.49 0.03 0.49
1970 9 0 0 6.07 0.00 0.00 0.15 2.55 0.15 2.55
Year Mon SSM Convey. %
# Days # Days Supplem. Cutback % SSM Cutback Cutback Total % Total
SSM SSMwC.B. Volume Volume Cutback Volume Convey. Cutback Cutback
---- --- ------------------------------------------------------------------------------------------
1970 10 0 0 10.79 0.00 0.00 0.00 0.01 0.00 0.01
1970 11 0 0 90.35 0.00 0.00 0.00 0.00 0.00 0.00
1970 12 16 11 88.88 7.45 8.38 0.00 0.01 7.46 8.39
1971 1 31 13 65.18 4.41 6.77 0.00 0.00 4.42 6.77
1971 2 28 9 49.44 7.87 15.91 0.03 0.06 7.89 15.96
1971 3 31 18 117.01 24.01 20.52 0.00 0.00 24.01 20.52
1971 4 30 28 179.78 80.32 44.68 0.03 0.02 80.35 44.69
1971 5 31 13 138.73 40.87 29.46 10.51 7.57 51.38 37.03
1971 6 30 5 40.43 5.91 14.61 2.23 5.50 8.13 20.12
1971 7 31 0 0.73 0.00 0.00 0.00 0.00 0.00 0.00
1971 8 0 0 5.94 0.00 0.00 0.07 1.13 0.07 1.13
1971 9 0 0 11.88 0.00 0.00 0.00 0.00 0.00 0.00
Year Mon SSM Convey. %
# Days # Days Supplem. Cutback % SSM Cutback Cutback Total % Total
SSM SSMwC.B. Volume Volume Cutback Volume Convey. Cutback Cutback
---- --- ------------------------------------------------------------------------------------------
1971 10 0 0 14.32 0.00 0.00 0.00 0.00 0.00 0.00
1971 11 0 0 40.09 0.00 0.00 0.00 0.00 0.00 0.00
1971 12 0 0 48.70 0.00 0.00 0.00 0.00 0.00 0.00
1972 1 0 0 32.84 0.00 0.00 0.00 0.00 0.00 0.00
1972 2 0 0 33.43 0.00 0.00 0.00 0.00 0.00 0.00
1972 3 0 0 88.18 0.00 0.00 0.02 0.02 0.02 0.02
1972 4 0 0 42.93 0.00 0.00 0.00 0.00 0.00 0.00
1972 5 0 0 23.63 0.00 0.00 0.00 0.00 0.00 0.00
1972 6 0 0 31.23 0.00 0.00 0.63 2.03 0.63 2.03
1972 7 0 0 27.31 0.00 0.00 0.00 0.00 0.00 0.00
1972 8 0 0 5.71 0.00 0.00 0.02 0.34 0.02 0.34
1972 9 8 6 31.40 7.61 24.25 0.07 0.22 7.68 24.46

Year Mon SSM Convey. %
# Days # Days Supplem. Cutback % SSM Cutback Cutback Total % Total
SSM SSMwC.B. Volume Volume Cutback Volume Convey. Cutback Cutback
---- --- ------------------------------------------------------------------------------------------
1972 10 31 15 78.05 10.19 13.06 0.00 0.00 10.19 13.06
1972 11 30 4 25.51 1.32 5.17 1.01 3.94 2.33 9.12
1972 12 31 0 26.27 0.00 0.00 0.13 0.48 0.13 0.48
1973 1 31 1 13.67 0.02 0.16 0.17 1.22 0.19 1.38
1973 2 22 0 9.80 0.00 0.00 0.19 1.92 0.19 1.92
1973 3 16 2 56.65 0.73 1.30 0.24 0.43 0.98 1.73
1973 4 0 0 92.35 0.00 0.00 0.00 0.00 0.00 0.00
1973 5 0 0 117.02 0.00 0.00 0.81 0.69 0.81 0.69
1973 6 25 2 27.85 0.60 2.16 0.00 0.00 0.60 2.16
1973 7 31 0 1.93 0.00 0.00 0.00 0.00 0.00 0.00
1973 8 0 0 5.84 0.00 0.00 0.02 0.37 0.02 0.37
1973 9 0 0 0.63 0.00 0.00 0.00 0.00 0.00 0.00
Year Mon SSM Convey. %
# Days # Days Supplem. Cutback % SSM Cutback Cutback Total % Total
SSM SSMwC.B. Volume Volume Cutback Volume Convey. Cutback Cutback
---- --- ------------------------------------------------------------------------------------------
1973 10 0 0 18.17 0.00 0.00 0.00 0.00 0.00 0.00
1973 11 0 0 92.39 0.00 0.00 0.00 0.00 0.00 0.00
1973 12 0 0 26.94 0.00 0.00 0.00 0.00 0.00 0.00
1974 1 0 0 46.07 0.00 0.00 0.06 0.13 0.06 0.13
1974 2 0 0 75.97 0.00 0.00 0.00 0.00 0.00 0.00
1974 3 26 18 129.31 16.42 12.70 0.00 0.00 16.43 12.70
1974 4 30 9 113.76 14.31 12.58 0.00 0.00 14.31 12.58
1974 5 31 12 131.30 36.33 27.67 6.24 4.76 42.57 32.42
1974 6 30 0 10.38 0.00 0.00 0.92 8.90 0.92 8.90
1974 7 6 0 1.38 0.00 0.00 0.44 31.80 0.44 31.80
1974 8 0 0 5.86 0.00 0.00 0.05 0.77 0.05 0.77
1974 9 0 0 1.01 0.00 0.00 0.00 0.00 0.00 0.00
Year Mon SSM Convey. %
# Days # Days Supplem. Cutback % SSM Cutback Cutback Total % Total
SSM SSMwC.B. Volume Volume Cutback Volume Convey. Cutback Cutback
---- --- ------------------------------------------------------------------------------------------
1974 10 0 0 26.27 0.00 0.00 0.00 0.00 0.00 0.00
1974 11 0 0 65.49 0.00 0.00 0.00 0.00 0.00 0.00
1974 12 0 0 19.17 0.00 0.00 0.53 2.77 0.53 2.77
1975 1 0 0 75.68 0.00 0.00 0.00 0.00 0.00 0.00
1975 2 9 3 67.34 2.98 4.43 0.00 0.00 2.98 4.43
1975 3 29 14 99.65 10.77 10.81 0.00 0.00 10.77 10.81
1975 4 30 18 122.46 17.97 14.68 0.00 0.00 17.97 14.68
1975 5 31 4 52.31 8.02 15.33 2.03 3.88 10.05 19.21
1975 6 30 0 4.84 0.00 0.00 0.00 0.00 0.00 0.00
1975 7 31 0 2.61 0.00 0.00 0.00 0.00 0.00 0.00
1975 8 0 0 5.93 0.00 0.00 0.12 2.02 0.12 2.02
1975 9 0 0 0.66 0.00 0.00 0.00 0.00 0.00 0.00
Year Mon SSM Convey. %
# Days # Days Supplem. Cutback % SSM Cutback Cutback Total % Total
SSM SSMwC.B. Volume Volume Cutback Volume Convey. Cutback Cutback
---- --- ------------------------------------------------------------------------------------------
1975 10 0 0 3.44 0.00 0.00 0.00 0.00 0.00 0.00
1975 11 0 0 52.93 0.00 0.00 0.00 0.00 0.00 0.00
1975 12 0 0 76.70 0.00 0.00 0.00 0.00 0.00 0.00
1976 1 0 0 61.17 0.00 0.00 0.00 0.00 0.00 0.00
1976 2 0 0 64.55 0.00 0.00 0.00 0.00 0.00 0.00
1976 3 0 0 71.19 0.00 0.00 0.00 0.00 0.00 0.00
1976 4 0 0 111.30 0.00 0.00 0.00 0.00 0.00 0.00
1976 5 0 0 9.67 0.00 0.00 0.00 0.00 0.00 0.00
1976 6 0 0 16.70 0.00 0.00 0.00 0.00 0.00 0.00
1976 7 0 0 18.93 0.00 0.00 0.03 0.16 0.03 0.16
1976 8 0 0 5.71 0.00 0.00 0.02 0.43 0.02 0.43
1976 9 0 0 2.28 0.00 0.00 0.00 0.00 0.00 0.00

Year Mon SSM Convey. %
# Days # Days Supplem. Cutback % SSM Cutback Cutback Total % Total
SSM SSMwC.B. Volume Volume Cutback Volume Convey. Cutback Cutback
---- --- ------------------------------------------------------------------------------------------
1976 10 0 0 66.13 0.00 0.00 0.00 0.00 0.00 0.00
1976 11 0 0 46.89 0.00 0.00 0.00 0.00 0.00 0.00
1976 12 0 0 22.71 0.00 0.00 0.08 0.34 0.08 0.34
1977 1 0 0 1.72 0.00 0.00 0.00 0.00 0.00 0.00
1977 2 0 0 52.67 0.00 0.00 0.00 0.00 0.00 0.00
1977 3 0 0 105.54 0.00 0.00 0.00 0.00 0.00 0.00
1977 4 18 4 134.52 4.22 3.14 0.12 0.09 4.34 3.23
1977 5 13 2 45.12 2.23 4.94 0.07 0.15 2.30 5.10
1977 6 12 5 62.03 19.61 31.62 0.07 0.12 19.68 31.73
1977 7 31 3 20.44 4.75 23.24 0.00 0.00 4.75 23.24
1977 8 0 0 5.83 0.00 0.00 0.02 0.43 0.02 0.43
1977 9 0 0 0.12 0.00 0.00 0.00 0.00 0.00 0.00
Year Mon SSM Convey. %
# Days # Days Supplem. Cutback % SSM Cutback Cutback Total % Total
SSM SSMwC.B. Volume Volume Cutback Volume Convey. Cutback Cutback
---- --- ------------------------------------------------------------------------------------------
1977 10 0 0 65.13 0.00 0.00 0.00 0.00 0.00 0.00
1977 11 0 0 17.19 0.00 0.00 0.00 0.00 0.00 0.00
1977 12 0 0 1.08 0.00 0.00 0.00 0.00 0.00 0.00
1978 1 0 0 6.72 0.00 0.00 0.00 0.00 0.00 0.00
1978 2 0 0 24.86 0.00 0.00 0.00 0.00 0.00 0.00
1978 3 0 0 48.20 0.00 0.00 0.00 0.00 0.00 0.00
1978 4 0 0 108.69 0.00 0.00 0.00 0.00 0.00 0.00
1978 5 0 0 17.85 0.00 0.00 0.00 0.00 0.00 0.00
1978 6 0 0 20.63 0.00 0.00 0.00 0.00 0.00 0.00
1978 7 0 0 1.08 0.00 0.00 0.00 0.00 0.00 0.00
1978 8 0 0 5.85 0.00 0.00 0.03 0.45 0.03 0.45
1978 9 0 0 1.88 0.00 0.00 0.00 0.00 0.00 0.00
Year Mon SSM Convey. %
# Days # Days Supplem. Cutback % SSM Cutback Cutback Total % Total
SSM SSMwC.B. Volume Volume Cutback Volume Convey. Cutback Cutback
---- --- ------------------------------------------------------------------------------------------
1978 10 0 0 8.76 0.00 0.00 0.00 0.00 0.00 0.00
1978 11 0 0 24.56 0.00 0.00 0.00 0.00 0.00 0.00
1978 12 0 0 17.84 0.00 0.00 0.00 0.00 0.00 0.00
1979 1 0 0 0.00 0.00 0.00 0.00 0.00 0.00 0.00
1979 2 0 0 39.80 0.00 0.00 0.00 0.00 0.00 0.00
1979 3 0 0 73.35 0.00 0.00 0.00 0.00 0.00 0.00
1979 4 0 0 115.10 0.00 0.00 0.05 0.05 0.05 0.05
1979 5 0 0 0.27 0.00 0.00 0.00 0.00 0.00 0.00
1979 6 0 0 151.66 0.00 0.00 1.92 1.27 1.92 1.27
1979 7 0 0 21.87 0.00 0.00 0.00 0.00 0.00 0.00
1979 8 0 0 5.82 0.00 0.00 0.02 0.28 0.02 0.28
1979 9 0 0 0.00 0.00 0.00 0.00 0.00 0.00 0.00
Year Mon SSM Convey. %
# Days # Days Supplem. Cutback % SSM Cutback Cutback Total % Total
SSM SSMwC.B. Volume Volume Cutback Volume Convey. Cutback Cutback
---- --- ------------------------------------------------------------------------------------------
1979 10 0 0 12.79 0.00 0.00 0.00 0.00 0.00 0.00
1979 11 0 0 4.36 0.00 0.00 0.00 0.00 0.00 0.00
1979 12 0 0 19.44 0.00 0.00 0.00 0.00 0.00 0.00
1980 1 0 0 36.20 0.00 0.00 0.00 0.00 0.00 0.00
1980 2 0 0 11.57 0.00 0.00 0.00 0.00 0.00 0.00
1980 3 0 0 64.92 0.00 0.00 0.00 0.00 0.00 0.00
1980 4 0 0 12.99 0.00 0.00 0.00 0.00 0.00 0.00
1980 5 0 0 98.00 0.00 0.00 0.00 0.00 0.00 0.00
1980 6 0 0 129.62 0.00 0.00 0.94 0.73 0.94 0.73
1980 7 0 0 14.42 0.00 0.00 0.00 0.00 0.00 0.00
1980 8 0 0 5.69 0.00 0.00 0.01 0.17 0.01 0.17
1980 9 0 0 2.72 0.00 0.00 0.00 0.00 0.00 0.00

Year Mon SSM Convey. %
# Days # Days Supplem. Cutback % SSM Cutback Cutback Total % Total
SSM SSMwC.B. Volume Volume Cutback Volume Convey. Cutback Cutback
---- --- ------------------------------------------------------------------------------------------
1980 10 0 0 74.28 0.00 0.00 0.00 0.00 0.00 0.00
1980 11 2 1 28.65 0.04 0.14 0.71 2.46 0.75 2.60
1980 12 0 0 39.64 0.00 0.00 0.15 0.38 0.15 0.38
1981 1 22 10 66.07 4.18 6.32 0.05 0.08 4.23 6.40
1981 2 28 3 28.68 1.52 5.31 0.42 1.46 1.94 6.78
1981 3 31 10 82.01 11.57 14.11 0.07 0.09 11.65 14.20
1981 4 30 26 158.60 29.74 18.75 0.00 0.00 29.74 18.75
1981 5 31 22 194.50 80.79 41.54 5.07 2.61 85.86 44.15
1981 6 30 11 92.70 29.08 31.37 6.23 6.72 35.30 38.08
1981 7 31 18 71.71 47.78 66.62 0.00 0.00 47.78 66.62
1981 8 0 0 5.81 0.00 0.00 0.01 0.11 0.01 0.11
1981 9 0 0 1.84 0.00 0.00 0.00 0.00 0.00 0.00
Year Mon SSM Convey. %
# Days # Days Supplem. Cutback % SSM Cutback Cutback Total % Total
SSM SSMwC.B. Volume Volume Cutback Volume Convey. Cutback Cutback
---- --- ------------------------------------------------------------------------------------------
1981 10 0 0 99.98 0.00 0.00 0.00 0.00 0.00 0.00
1981 11 0 0 48.78 0.00 0.00 0.00 0.00 0.00 0.00
1981 12 0 0 89.08 0.00 0.00 0.00 0.00 0.00 0.00
1982 1 0 0 58.56 0.00 0.00 0.08 0.13 0.08 0.13
1982 2 0 0 19.85 0.00 0.00 0.00 0.00 0.00 0.00
1982 3 0 0 29.74 0.00 0.00 0.00 0.00 0.00 0.00
1982 4 0 0 11.52 0.00 0.00 0.00 0.02 0.00 0.02
1982 5 0 0 107.57 0.00 0.00 0.00 0.00 0.00 0.00
1982 6 0 0 19.60 0.00 0.00 0.09 0.47 0.09 0.47
1982 7 0 0 4.86 0.00 0.00 0.00 0.00 0.00 0.00
1982 8 0 0 5.87 0.00 0.00 0.04 0.71 0.04 0.71
1982 9 0 0 3.39 0.00 0.00 0.00 0.00 0.00 0.00
Year Mon SSM Convey. %
# Days # Days Supplem. Cutback % SSM Cutback Cutback Total % Total
SSM SSMwC.B. Volume Volume Cutback Volume Convey. Cutback Cutback
---- --- ------------------------------------------------------------------------------------------
1982 10 0 0 13.32 0.00 0.00 0.00 0.00 0.00 0.00
1982 11 0 0 44.79 0.00 0.00 0.00 0.00 0.00 0.00
1982 12 0 0 46.94 0.00 0.00 0.00 0.00 0.00 0.00
1983 1 0 0 21.84 0.00 0.00 0.00 0.00 0.00 0.00
1983 2 0 0 0.28 0.00 0.00 0.00 0.00 0.00 0.00
1983 3 0 0 0.07 0.00 0.00 0.00 0.00 0.00 0.00
1983 4 0 0 28.78 0.00 0.00 0.00 0.00 0.00 0.00
1983 5 0 0 207.07 0.00 0.00 0.02 0.01 0.02 0.01
1983 6 0 0 28.56 0.00 0.00 0.00 0.00 0.00 0.00
1983 7 0 0 32.82 0.00 0.00 0.00 0.00 0.00 0.00
1983 8 0 0 5.84 0.00 0.00 0.02 0.39 0.02 0.39
1983 9 0 0 4.53 0.00 0.00 0.03 0.59 0.03 0.59
Year Mon SSM Convey. %
# Days # Days Supplem. Cutback % SSM Cutback Cutback Total % Total
SSM SSMwC.B. Volume Volume Cutback Volume Convey. Cutback Cutback
---- --- ------------------------------------------------------------------------------------------
1983 10 0 0 3.26 0.00 0.00 0.00 0.00 0.00 0.00
1983 11 0 0 19.80 0.00 0.00 0.00 0.00 0.00 0.00
1983 12 0 0 16.86 0.00 0.00 0.00 0.00 0.00 0.00
1984 1 0 0 29.16 0.00 0.00 0.00 0.00 0.00 0.00
1984 2 0 0 31.96 0.00 0.00 0.00 0.00 0.00 0.00
1984 3 0 0 15.24 0.00 0.00 0.00 0.00 0.00 0.00
1984 4 0 0 48.22 0.00 0.00 0.00 0.00 0.00 0.00
1984 5 0 0 119.11 0.00 0.00 0.00 0.00 0.00 0.00
1984 6 0 0 51.21 0.00 0.00 0.11 0.22 0.11 0.22
1984 7 0 0 1.02 0.00 0.00 0.00 0.00 0.00 0.00
1984 8 0 0 5.71 0.00 0.00 0.03 0.44 0.03 0.44
1984 9 0 0 11.51 0.00 0.00 0.00 0.00 0.00 0.00

Year Mon SSM Convey. %
# Days # Days Supplem. Cutback % SSM Cutback Cutback Total % Total
SSM SSMwC.B. Volume Volume Cutback Volume Convey. Cutback Cutback
---- --- ------------------------------------------------------------------------------------------
1984 10 0 0 51.81 0.00 0.00 0.00 0.00 0.00 0.00
1984 11 12 9 60.01 10.70 17.83 0.18 0.31 10.88 18.14
1984 12 0 0 47.72 0.00 0.00 0.00 0.00 0.00 0.00
1985 1 0 0 57.83 0.00 0.00 0.05 0.09 0.05 0.09
1985 2 18 14 88.58 8.14 9.19 0.00 0.00 8.14 9.19
1985 3 31 16 85.61 18.32 21.40 0.03 0.03 18.35 21.43
1985 4 30 0 29.30 0.00 0.00 0.00 0.00 0.00 0.00
1985 5 31 13 122.62 23.71 19.34 4.19 3.41 27.90 22.75
1985 6 30 11 114.98 52.72 45.85 7.71 6.70 60.43 52.56
1985 7 31 2 5.73 1.71 29.84 0.00 0.00 1.71 29.84
1985 8 0 0 5.84 0.00 0.00 0.03 0.45 0.03 0.45
1985 9 0 0 0.30 0.00 0.00 0.00 0.00 0.00 0.00
Year Mon SSM Convey. %
# Days # Days Supplem. Cutback % SSM Cutback Cutback Total % Total
SSM SSMwC.B. Volume Volume Cutback Volume Convey. Cutback Cutback
---- --- ------------------------------------------------------------------------------------------
1985 10 0 0 7.92 0.00 0.00 0.00 0.00 0.00 0.00
1985 11 0 0 33.85 0.00 0.00 0.00 0.00 0.00 0.00
1985 12 0 0 18.12 0.00 0.00 0.00 0.00 0.00 0.00
1986 1 0 0 11.81 0.00 0.00 0.00 0.00 0.00 0.00
1986 2 0 0 46.37 0.00 0.00 0.00 0.00 0.00 0.00
1986 3 0 0 18.29 0.00 0.00 0.00 0.00 0.00 0.00
1986 4 0 0 138.19 0.00 0.00 0.00 0.00 0.00 0.00
1986 5 0 0 130.83 0.00 0.00 0.10 0.08 0.10 0.08
1986 6 0 0 18.70 0.00 0.00 0.00 0.00 0.00 0.00
1986 7 0 0 3.15 0.00 0.00 0.00 0.00 0.00 0.00
1986 8 0 0 5.81 0.00 0.00 0.01 0.19 0.01 0.19
1986 9 0 0 5.17 0.00 0.00 0.00 0.00 0.00 0.00
Year Mon SSM Convey. %
# Days # Days Supplem. Cutback % SSM Cutback Cutback Total % Total
SSM SSMwC.B. Volume Volume Cutback Volume Convey. Cutback Cutback
---- --- ------------------------------------------------------------------------------------------
1986 10 0 0 30.54 0.00 0.00 0.00 0.00 0.00 0.00
1986 11 0 0 22.65 0.00 0.00 0.27 1.21 0.27 1.21
1986 12 0 0 40.67 0.00 0.00 0.56 1.38 0.56 1.38
1987 1 0 0 12.39 0.00 0.00 0.04 0.28 0.04 0.28
1987 2 0 0 21.24 0.00 0.00 0.05 0.21 0.05 0.21
1987 3 0 0 19.48 0.00 0.00 0.05 0.25 0.05 0.25
1987 4 0 0 107.59 0.00 0.00 0.02 0.02 0.02 0.02
1987 5 0 0 110.17 0.00 0.00 0.21 0.19 0.21 0.19
1987 6 0 0 110.19 0.00 0.00 0.21 0.19 0.21 0.19
1987 7 14 2 13.46 0.84 6.23 0.00 0.00 0.84 6.23
1987 8 0 0 5.87 0.00 0.00 0.07 1.14 0.07 1.14
1987 9 0 0 8.35 0.00 0.00 0.00 0.00 0.00 0.00
Year Mon SSM Convey. %
# Days # Days Supplem. Cutback % SSM Cutback Cutback Total % Total
SSM SSMwC.B. Volume Volume Cutback Volume Convey. Cutback Cutback
---- --- ------------------------------------------------------------------------------------------
1987 10 0 0 17.11 0.00 0.00 0.00 0.00 0.00 0.00
1987 11 0 0 2.17 0.00 0.00 0.00 0.00 0.00 0.00
1987 12 0 0 34.14 0.00 0.00 0.00 0.00 0.00 0.00
1988 1 0 0 8.94 0.00 0.00 0.00 0.00 0.00 0.00
1988 2 0 0 11.32 0.00 0.00 0.00 0.00 0.00 0.00
1988 3 0 0 25.08 0.00 0.00 0.00 0.00 0.00 0.00
1988 4 0 0 135.81 0.00 0.00 0.00 0.00 0.00 0.00
1988 5 0 0 109.30 0.00 0.00 0.00 0.00 0.00 0.00
1988 6 0 0 54.95 0.00 0.00 0.24 0.43 0.24 0.43
1988 7 0 0 6.55 0.00 0.00 0.00 0.00 0.00 0.00
1988 8 0 0 5.70 0.00 0.00 0.01 0.19 0.01 0.19
1988 9 0 0 45.86 0.00 0.00 0.11 0.25 0.11 0.25

Year Mon SSM Convey. %
# Days # Days Supplem. Cutback % SSM Cutback Cutback Total % Total
SSM SSMwC.B. Volume Volume Cutback Volume Convey. Cutback Cutback
---- --- ------------------------------------------------------------------------------------------
1988 10 28 26 121.58 37.52 30.86 0.02 0.01 37.54 30.87
1988 11 30 0 38.65 0.00 0.00 0.97 2.51 0.97 2.51
1988 12 31 4 46.86 1.50 3.20 0.57 1.21 2.06 4.40
1989 1 31 12 54.23 7.49 13.81 0.09 0.17 7.58 13.98
1989 2 28 18 86.29 13.16 15.25 0.05 0.06 13.21 15.31
1989 3 31 5 52.91 0.73 1.39 0.02 0.04 0.76 1.43
1989 4 30 7 45.89 5.15 11.22 0.01 0.02 5.16 11.24
1989 5 31 15 133.68 37.98 28.41 2.70 2.02 40.68 30.43
1989 6 30 22 171.51 84.26 49.13 9.55 5.57 93.81 54.69
1989 7 31 13 43.14 21.80 50.53 0.00 0.00 21.80 50.53
1989 8 0 0 5.84 0.00 0.00 0.03 0.45 0.03 0.45
1989 9 0 0 0.75 0.00 0.00 0.00 0.00 0.00 0.00
Year Mon SSM Convey. %
# Days # Days Supplem. Cutback % SSM Cutback Cutback Total % Total
SSM SSMwC.B. Volume Volume Cutback Volume Convey. Cutback Cutback
---- --- ------------------------------------------------------------------------------------------
1989 10 0 0 13.90 0.00 0.00 0.00 0.00 0.00 0.00
1989 11 0 0 87.00 0.00 0.00 0.00 0.00 0.00 0.00
1989 12 0 0 22.67 0.00 0.00 0.00 0.00 0.00 0.00
1990 1 0 0 58.05 0.00 0.00 0.08 0.14 0.08 0.14
1990 2 0 0 12.22 0.00 0.00 0.03 0.20 0.03 0.20
1990 3 0 0 68.67 0.00 0.00 0.00 0.00 0.00 0.00
1990 4 0 0 90.85 0.00 0.00 0.00 0.00 0.00 0.00
1990 5 0 0 46.45 0.00 0.00 0.03 0.06 0.03 0.06
1990 6 1 0 56.11 0.00 0.00 1.41 2.51 1.41 2.51
1990 7 15 0 5.20 0.00 0.00 0.00 0.00 0.00 0.00
1990 8 0 0 5.85 0.00 0.00 0.02 0.41 0.02 0.41
1990 9 0 0 17.70 0.00 0.00 0.05 0.30 0.05 0.30
Year Mon SSM Convey. %
# Days # Days Supplem. Cutback % SSM Cutback Cutback Total % Total
SSM SSMwC.B. Volume Volume Cutback Volume Convey. Cutback Cutback
---- --- ------------------------------------------------------------------------------------------
1990 10 0 0 14.41 0.00 0.00 0.00 0.00 0.00 0.00
1990 11 0 0 76.99 0.00 0.00 0.00 0.00 0.00 0.00
1990 12 0 0 78.76 0.00 0.00 0.00 0.00 0.00 0.00
1991 1 0 0 4.88 0.00 0.00 0.03 0.67 0.03 0.67
1991 2 0 0 26.74 0.00 0.00 0.00 0.00 0.00 0.00
1991 3 0 0 55.20 0.00 0.00 0.00 0.00 0.00 0.00
1991 4 0 0 3.91 0.00 0.00 0.00 0.00 0.00 0.00
1991 5 0 0 50.10 0.00 0.00 0.00 0.00 0.00 0.00
1991 6 0 0 15.61 0.00 0.00 0.00 0.00 0.00 0.00
1991 7 0 0 0.00 0.00 0.00 0.00 0.00 0.00 0.00
1991 8 0 0 5.82 0.00 0.00 0.02 0.42 0.02 0.42
1991 9 0 0 4.68 0.00 0.00 0.03 0.60 0.03 0.60
Year Mon SSM Convey. %
# Days # Days Supplem. Cutback % SSM Cutback Cutback Total % Total
SSM SSMwC.B. Volume Volume Cutback Volume Convey. Cutback Cutback
---- --- ------------------------------------------------------------------------------------------
1991 10 0 0 11.94 0.00 0.00 0.00 0.00 0.00 0.00
1991 11 0 0 43.18 0.00 0.00 0.00 0.00 0.00 0.00
1991 12 0 0 35.21 0.00 0.00 0.00 0.00 0.00 0.00
1992 1 0 0 20.12 0.00 0.00 0.03 0.13 0.03 0.13
1992 2 0 0 22.47 0.00 0.00 0.00 0.00 0.00 0.00
1992 3 0 0 31.43 0.00 0.00 0.00 0.00 0.00 0.00
1992 4 0 0 7.24 0.00 0.00 0.00 0.00 0.00 0.00
1992 5 0 0 202.21 0.00 0.00 0.44 0.22 0.44 0.22
1992 6 0 0 20.82 0.00 0.00 0.07 0.35 0.07 0.35
1992 7 0 0 17.66 0.00 0.00 0.00 0.00 0.00 0.00
1992 8 0 0 5.77 0.00 0.00 0.04 0.62 0.04 0.62
1992 9 0 0 0.90 0.00 0.00 0.00 0.00 0.00 0.00
Year Mon SSM Convey. %
# Days # Days Supplem. Cutback % SSM Cutback Cutback Total % Total
SSM SSMwC.B. Volume Volume Cutback Volume Convey. Cutback Cutback
---- --- ------------------------------------------------------------------------------------------
1992 10 0 0 51.03 0.00 0.00 0.00 0.00 0.00 0.00
1992 11 0 0 19.93 0.00 0.00 0.00 0.00 0.00 0.00
1992 12 0 0 39.04 0.00 0.00 0.00 0.00 0.00 0.00
1993 1 0 0 0.19 0.00 0.00 0.00 0.00 0.00 0.00
1993 2 0 0 7.65 0.00 0.00 0.00 0.00 0.00 0.00
1993 3 0 0 19.77 0.00 0.00 0.00 0.00 0.00 0.00
1993 4 0 0 55.91 0.00 0.00 0.00 0.00 0.00 0.00
1993 5 0 0 181.49 0.00 0.00 0.01 0.00 0.01 0.00
1993 6 0 0 39.04 0.00 0.00 0.00 0.00 0.00 0.00
1993 7 0 0 43.77 0.00 0.00 0.00 0.00 0.00 0.00
1993 8 0 0 5.84 0.00 0.00 0.04 0.71 0.04 0.71
1993 9 0 0 2.87 0.00 0.00 0.00 0.00 0.00 0.00
Year Mon SSM Convey. %
# Days # Days Supplem. Cutback % SSM Cutback Cutback Total % Total
SSM SSMwC.B. Volume Volume Cutback Volume Convey. Cutback Cutback
---- --- ------------------------------------------------------------------------------------------
1993 10 0 0 3.06 0.00 0.00 0.00 0.00 0.00 0.00
1993 11 0 0 34.84 0.00 0.00 0.00 0.00 0.00 0.00
1993 12 0 0 46.41 0.00 0.00 0.00 0.00 0.00 0.00
1994 1 0 0 7.06 0.00 0.00 0.00 0.00 0.00 0.00
1994 2 0 0 8.80 0.00 0.00 0.00 0.00 0.00 0.00
1994 3 0 0 43.59 0.00 0.00 0.00 0.00 0.00 0.00
1994 4 0 0 49.01 0.00 0.00 0.00 0.00 0.00 0.00
1994 5 0 0 97.59 0.00 0.00 0.00 0.00 0.00 0.00
1994 6 0 0 18.46 0.00 0.00 0.06 0.34 0.06 0.34
1994 7 0 0 16.63 0.00 0.00 0.00 0.00 0.00 0.00
1994 8 0 0 5.85 0.00 0.00 0.03 0.44 0.03 0.44
1994 9 0 0 0.55 0.00 0.00 0.00 0.00 0.00 0.00
Year Mon SSM Convey. %
# Days # Days Supplem. Cutback % SSM Cutback Cutback Total % Total
SSM SSMwC.B. Volume Volume Cutback Volume Convey. Cutback Cutback
---- --- ------------------------------------------------------------------------------------------
1994 10 0 0 7.60 0.00 0.00 0.00 0.00 0.00 0.00
1994 11 0 0 10.48 0.00 0.00 0.00 0.00 0.00 0.00
1994 12 0 0 0.29 0.00 0.00 0.00 0.00 0.00 0.00
1995 1 0 0 3.47 0.00 0.00 0.00 0.00 0.00 0.00
1995 2 0 0 7.81 0.00 0.00 0.00 0.00 0.00 0.00
1995 3 0 0 30.38 0.00 0.00 0.00 0.00 0.00 0.00
1995 4 0 0 73.13 0.00 0.00 0.00 0.00 0.00 0.00
1995 5 0 0 92.11 0.00 0.00 0.00 0.00 0.00 0.00
1995 6 0 0 25.18 0.00 0.00 0.29 1.16 0.29 1.16
1995 7 0 0 11.64 0.00 0.00 0.00 0.00 0.00 0.00
1995 8 0 0 5.81 0.00 0.00 0.00 0.08 0.00 0.08
1995 9 0 0 10.54 0.00 0.00 0.00 0.00 0.00 0.00
Year Mon SSM Convey. %
# Days # Days Supplem. Cutback % SSM Cutback Cutback Total % Total
SSM SSMwC.B. Volume Volume Cutback Volume Convey. Cutback Cutback
---- --- ------------------------------------------------------------------------------------------
1995 10 0 0 0.88 0.00 0.00 0.00 0.00 0.00 0.00
1995 11 0 0 45.27 0.00 0.00 0.00 0.00 0.00 0.00
1995 12 0 0 32.43 0.00 0.00 0.00 0.00 0.00 0.00
1996 1 0 0 12.83 0.00 0.00 0.00 0.00 0.00 0.00
1996 2 0 0 73.77 0.00 0.00 0.00 0.00 0.00 0.00
1996 3 0 0 33.80 0.00 0.00 0.00 0.00 0.00 0.00
1996 4 0 0 60.08 0.00 0.00 0.00 0.00 0.00 0.00
1996 5 0 0 34.69 0.00 0.00 0.00 0.00 0.00 0.00
1996 6 0 0 2.98 0.00 0.00 0.00 0.00 0.00 0.00
1996 7 0 0 55.34 0.00 0.00 0.00 0.00 0.00 0.00
1996 8 0 0 5.74 0.00 0.00 0.04 0.78 0.04 0.78
1996 9 0 0 26.19 0.00 0.00 0.00 0.00 0.00 0.00

Year Mon SSM Convey. %
# Days # Days Supplem. Cutback % SSM Cutback Cutback Total % Total
SSM SSMwC.B. Volume Volume Cutback Volume Convey. Cutback Cutback
---- --- ------------------------------------------------------------------------------------------
1996 10 0 0 15.96 0.00 0.00 0.00 0.00 0.00 0.00
1996 11 0 0 66.01 0.00 0.00 0.00 0.00 0.00 0.00
1996 12 0 0 71.61 0.00 0.00 0.00 0.00 0.00 0.00
1997 1 0 0 41.10 0.00 0.00 0.00 0.00 0.00 0.00
1997 2 0 0 44.36 0.00 0.00 0.35 0.79 0.35 0.79
1997 3 26 7 56.99 6.55 11.50 0.13 0.22 6.68 11.72
1997 4 15 0 29.68 0.00 0.00 0.00 0.00 0.00 0.00
1997 5 0 0 18.43 0.00 0.00 0.00 0.00 0.00 0.00
1997 6 0 0 31.91 0.00 0.00 0.67 2.09 0.67 2.09
1997 7 0 0 12.29 0.00 0.00 0.00 0.00 0.00 0.00
1997 8 0 0 5.82 0.00 0.00 0.02 0.28 0.02 0.28
1997 9 0 0 5.94 0.00 0.00 0.00 0.02 0.00 0.02
Year Mon SSM Convey. %
# Days # Days Supplem. Cutback % SSM Cutback Cutback Total % Total
SSM SSMwC.B. Volume Volume Cutback Volume Convey. Cutback Cutback
---- --- ------------------------------------------------------------------------------------------
1997 10 0 0 50.81 0.00 0.00 0.01 0.01 0.01 0.01
1997 11 0 0 16.42 0.00 0.00 0.00 0.00 0.00 0.00
1997 12 0 0 0.00 0.00 0.00 0.00 0.00 0.00 0.00
1998 1 0 0 2.17 0.00 0.00 0.00 0.00 0.00 0.00
1998 2 0 0 1.98 0.00 0.00 0.00 0.00 0.00 0.00
1998 3 0 0 4.62 0.00 0.00 0.00 0.00 0.00 0.00
1998 4 0 0 92.45 0.00 0.00 0.00 0.00 0.00 0.00
1998 5 0 0 132.47 0.00 0.00 0.15 0.12 0.15 0.12
1998 6 0 0 153.00 0.00 0.00 1.73 1.13 1.73 1.13
1998 7 0 0 23.81 0.00 0.00 0.00 0.00 0.00 0.00
1998 8 0 0 5.89 0.00 0.00 0.05 0.88 0.05 0.88
1998 9 0 0 0.31 0.00 0.00 0.00 0.00 0.00 0.00
Year Mon SSM Convey. %
# Days # Days Supplem. Cutback % SSM Cutback Cutback Total % Total
SSM SSMwC.B. Volume Volume Cutback Volume Convey. Cutback Cutback
---- --- ------------------------------------------------------------------------------------------
1998 10 0 0 22.19 0.00 0.00 0.00 0.00 0.00 0.00
1998 11 0 0 18.27 0.00 0.00 0.00 0.00 0.00 0.00
1998 12 0 0 30.94 0.00 0.00 0.00 0.00 0.00 0.00
1999 1 0 0 10.17 0.00 0.00 0.00 0.00 0.00 0.00
1999 2 0 0 44.99 0.00 0.00 0.00 0.00 0.00 0.00
1999 3 0 0 122.64 0.00 0.00 0.00 0.00 0.00 0.00
1999 4 0 0 129.92 0.00 0.00 0.00 0.00 0.00 0.00
1999 5 0 0 88.79 0.00 0.00 0.11 0.12 0.11 0.12
1999 6 0 0 6.47 0.00 0.00 0.00 0.00 0.00 0.00
1999 7 0 0 9.78 0.00 0.00 0.02 0.18 0.02 0.18
1999 8 0 0 5.86 0.00 0.00 0.03 0.43 0.03 0.43
1999 9 0 0 0.00 0.00 0.00 0.00 100.00 0.00 100.00
Year Mon SSM Convey. %
# Days # Days Supplem. Cutback % SSM Cutback Cutback Total % Total
SSM SSMwC.B. Volume Volume Cutback Volume Convey. Cutback Cutback
---- --- ------------------------------------------------------------------------------------------
1999 10 0 0 0.42 0.00 0.00 0.00 0.00 0.00 0.00
1999 11 0 0 37.46 0.00 0.00 0.00 0.00 0.00 0.00
1999 12 0 0 47.24 0.00 0.00 0.00 0.00 0.00 0.00
2000 1 0 0 59.58 0.00 0.00 0.00 0.00 0.00 0.00
2000 2 0 0 65.02 0.00 0.00 0.00 0.00 0.00 0.00
2000 3 0 0 72.48 0.00 0.00 0.00 0.00 0.00 0.00
2000 4 0 0 73.04 0.00 0.00 0.04 0.05 0.04 0.05
2000 5 0 0 183.69 0.00 0.00 0.13 0.07 0.13 0.07
2000 6 13 6 154.38 19.49 12.63 1.04 0.67 20.53 13.30
2000 7 31 0 1.94 0.00 0.00 0.00 0.00 0.00 0.00
2000 8 0 0 5.75 0.00 0.00 0.04 0.75 0.04 0.75
2000 9 0 0 2.23 0.00 0.00 0.00 0.07 0.00 0.07

Year Mon SSM Convey. %
# Days # Days Supplem. Cutback % SSM Cutback Cutback Total % Total
SSM SSMwC.B. Volume Volume Cutback Volume Convey. Cutback Cutback
---- --- ------------------------------------------------------------------------------------------
2000 10 0 0 41.35 0.00 0.00 0.00 0.00 0.00 0.00
2000 11 0 0 98.20 0.00 0.00 0.07 0.07 0.07 0.07
2000 12 0 0 80.26 0.00 0.00 0.01 0.01 0.01 0.01
2001 1 0 0 57.83 0.00 0.00 0.00 0.00 0.00 0.00
2001 2 13 13 95.44 8.53 8.94 0.00 0.00 8.53 8.94
2001 3 31 11 65.21 12.05 18.47 0.14 0.21 12.19 18.69
2001 4 30 14 122.44 8.19 6.69 0.00 0.00 8.19 6.69
2001 5 31 14 155.21 61.63 39.71 2.69 1.73 64.32 41.44
2001 6 30 8 62.46 9.76 15.63 8.90 14.24 18.66 29.87
2001 7 31 3 13.64 3.84 28.19 0.00 0.00 3.84 28.19
2001 8 0 0 5.80 0.00 0.00 0.00 0.00 0.00 0.00
2001 9 0 0 2.84 0.00 0.00 0.00 0.00 0.00 0.00
Year Mon SSM Convey. %
# Days # Days Supplem. Cutback % SSM Cutback Cutback Total % Total
SSM SSMwC.B. Volume Volume Cutback Volume Convey. Cutback Cutback
---- --- ------------------------------------------------------------------------------------------
2001 10 0 0 10.00 0.00 0.00 0.00 0.00 0.00 0.00
2001 11 0 0 41.31 0.00 0.00 0.00 0.00 0.00 0.00
2001 12 0 0 43.10 0.00 0.00 0.01 0.02 0.01 0.02
2002 1 0 0 29.20 0.00 0.00 0.00 0.00 0.00 0.00
2002 2 0 0 30.52 0.00 0.00 0.00 0.00 0.00 0.00
2002 3 0 0 78.92 0.00 0.00 0.00 0.00 0.00 0.00
2002 4 0 0 106.95 0.00 0.00 0.05 0.04 0.05 0.04
2002 5 0 0 152.78 0.00 0.00 0.04 0.03 0.04 0.03
2002 6 0 0 64.64 0.00 0.00 0.15 0.23 0.15 0.23
2002 7 0 0 12.27 0.00 0.00 0.00 0.00 0.00 0.00
2002 8 0 0 5.84 0.00 0.00 0.00 0.04 0.00 0.04
2002 9 0 0 12.04 0.00 0.00 0.00 0.02 0.00 0.02
Year Mon SSM Convey. %
# Days # Days Supplem. Cutback % SSM Cutback Cutback Total % Total
SSM SSMwC.B. Volume Volume Cutback Volume Convey. Cutback Cutback
---- --- ------------------------------------------------------------------------------------------
2002 10 0 0 11.83 0.00 0.00 0.00 0.00 0.00 0.00
2002 11 0 0 30.79 0.00 0.00 0.00 0.00 0.00 0.00
2002 12 0 0 7.81 0.00 0.00 0.00 0.00 0.00 0.00
2003 1 0 0 45.87 0.00 0.00 0.00 0.00 0.00 0.00
2003 2 0 0 56.60 0.00 0.00 0.00 0.00 0.00 0.00
2003 3 0 0 34.83 0.00 0.00 0.00 0.00 0.00 0.00
2003 4 0 0 68.28 0.00 0.00 0.00 0.00 0.00 0.00
2003 5 0 0 55.32 0.00 0.00 0.00 0.00 0.00 0.00
2003 6 0 0 15.57 0.00 0.00 0.00 0.00 0.00 0.00
2003 7 0 0 15.08 0.00 0.00 0.00 0.00 0.00 0.00
2003 8 0 0 5.80 0.00 0.00 0.00 0.00 0.00 0.00
2003 9 0 0 3.70 0.00 0.00 0.00 0.00 0.00 0.00
Year Mon SSM Convey. %
# Days # Days Supplem. Cutback % SSM Cutback Cutback Total % Total
SSM SSMwC.B. Volume Volume Cutback Volume Convey. Cutback Cutback
---- --- ------------------------------------------------------------------------------------------
2003 10 0 0 41.72 0.00 0.00 0.00 0.00 0.00 0.00
2003 11 0 0 33.01 0.00 0.00 0.00 0.00 0.00 0.00
2003 12 0 0 30.08 0.00 0.00 0.03 0.09 0.03 0.09
2004 1 0 0 45.70 0.00 0.00 0.15 0.33 0.15 0.33
2004 2 0 0 17.62 0.00 0.00 0.11 0.64 0.11 0.64
2004 3 0 0 99.68 0.00 0.00 0.00 0.00 0.00 0.00
2004 4 0 0 96.63 0.00 0.00 0.00 0.00 0.00 0.00
2004 5 0 0 195.13 0.00 0.00 0.06 0.03 0.06 0.03
2004 6 28 7 54.69 17.42 31.85 0.00 0.00 17.42 31.85
2004 7 31 18 53.38 31.12 58.31 0.03 0.06 31.15 58.37
2004 8 0 0 5.69 0.00 0.00 0.00 0.03 0.00 0.03
2004 9 0 0 0.15 0.00 0.00 0.00 0.00 0.00 0.00

Year Mon SSM Convey. %
# Days # Days Supplem. Cutback % SSM Cutback Cutback Total % Total
SSM SSMwC.B. Volume Volume Cutback Volume Convey. Cutback Cutback
---- --- ------------------------------------------------------------------------------------------
2004 10 0 0 8.37 0.00 0.00 0.00 0.00 0.00 0.00
2004 11 0 0 42.59 0.00 0.00 0.00 0.00 0.00 0.00
2004 12 0 0 58.69 0.00 0.00 0.00 0.00 0.00 0.00
2005 1 0 0 44.59 0.00 0.00 0.00 0.00 0.00 0.00
2005 2 0 0 79.24 0.00 0.00 0.00 0.00 0.00 0.00
2005 3 0 0 0.40 0.00 0.00 0.00 0.00 0.00 0.00
2005 4 0 0 59.78 0.00 0.00 0.00 0.00 0.00 0.00
2005 5 0 0 67.04 0.00 0.00 0.05 0.08 0.05 0.08
2005 6 0 0 4.18 0.00 0.00 0.00 0.00 0.00 0.00
2005 7 0 0 19.72 0.00 0.00 0.00 0.00 0.00 0.00
2005 8 0 0 5.90 0.00 0.00 0.03 0.53 0.03 0.53
2005 9 0 0 12.95 0.00 0.00 0.05 0.42 0.05 0.42
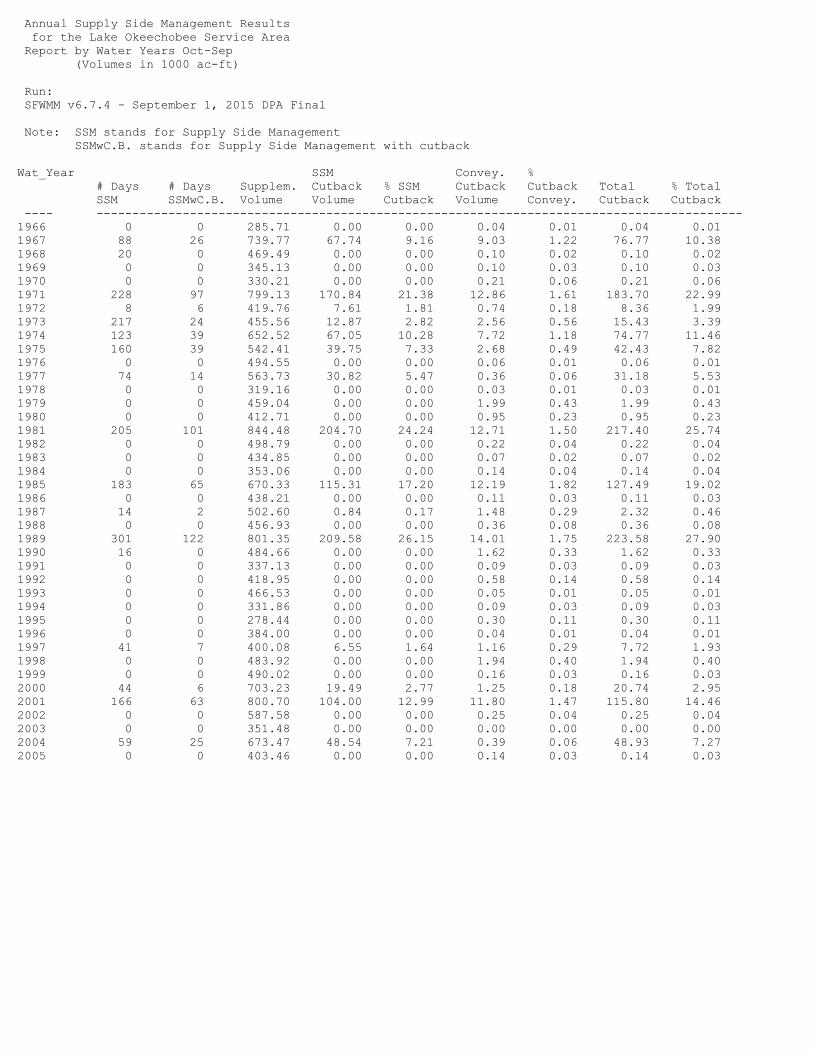
Annual Supply Side Management Results
for the Lake Okeechobee Service Area
Report by Water Years Oct-Sep
(Volumes in 1000 ac-ft)
Run:
SFWMM v6.7.4 - September 1, 2015 DPA Final
Note: SSM stands for Supply Side Management
SSMwC.B. stands for Supply Side Management with cutback
Wat_Year SSM Convey. %
# Days # Days Supplem. Cutback % SSM Cutback Cutback Total % Total
SSM SSMwC.B. Volume Volume Cutback Volume Convey. Cutback Cutback
---- ------------------------------------------------------------------------------------------
1966 0 0 285.71 0.00 0.00 0.04 0.01 0.04 0.01
1967 88 26 739.77 67.74 9.16 9.03 1.22 76.77 10.38
1968 20 0 469.49 0.00 0.00 0.10 0.02 0.10 0.02
1969 0 0 345.13 0.00 0.00 0.10 0.03 0.10 0.03
1970 0 0 330.21 0.00 0.00 0.21 0.06 0.21 0.06
1971 228 97 799.13 170.84 21.38 12.86 1.61 183.70 22.99
1972 8 6 419.76 7.61 1.81 0.74 0.18 8.36 1.99
1973 217 24 455.56 12.87 2.82 2.56 0.56 15.43 3.39
1974 123 39 652.52 67.05 10.28 7.72 1.18 74.77 11.46
1975 160 39 542.41 39.75 7.33 2.68 0.49 42.43 7.82
1976 0 0 494.55 0.00 0.00 0.06 0.01 0.06 0.01
1977 74 14 563.73 30.82 5.47 0.36 0.06 31.18 5.53
1978 0 0 319.16 0.00 0.00 0.03 0.01 0.03 0.01
1979 0 0 459.04 0.00 0.00 1.99 0.43 1.99 0.43
1980 0 0 412.71 0.00 0.00 0.95 0.23 0.95 0.23
1981 205 101 844.48 204.70 24.24 12.71 1.50 217.40 25.74
1982 0 0 498.79 0.00 0.00 0.22 0.04 0.22 0.04
1983 0 0 434.85 0.00 0.00 0.07 0.02 0.07 0.02
1984 0 0 353.06 0.00 0.00 0.14 0.04 0.14 0.04
1985 183 65 670.33 115.31 17.20 12.19 1.82 127.49 19.02
1986 0 0 438.21 0.00 0.00 0.11 0.03 0.11 0.03
1987 14 2 502.60 0.84 0.17 1.48 0.29 2.32 0.46
1988 0 0 456.93 0.00 0.00 0.36 0.08 0.36 0.08
1989 301 122 801.35 209.58 26.15 14.01 1.75 223.58 27.90
1990 16 0 484.66 0.00 0.00 1.62 0.33 1.62 0.33
1991 0 0 337.13 0.00 0.00 0.09 0.03 0.09 0.03
1992 0 0 418.95 0.00 0.00 0.58 0.14 0.58 0.14
1993 0 0 466.53 0.00 0.00 0.05 0.01 0.05 0.01
1994 0 0 331.86 0.00 0.00 0.09 0.03 0.09 0.03
1995 0 0 278.44 0.00 0.00 0.30 0.11 0.30 0.11
1996 0 0 384.00 0.00 0.00 0.04 0.01 0.04 0.01
1997 41 7 400.08 6.55 1.64 1.16 0.29 7.72 1.93
1998 0 0 483.92 0.00 0.00 1.94 0.40 1.94 0.40
1999 0 0 490.02 0.00 0.00 0.16 0.03 0.16 0.03
2000 44 6 703.23 19.49 2.77 1.25 0.18 20.74 2.95
2001 166 63 800.70 104.00 12.99 11.80 1.47 115.80 14.46
2002 0 0 587.58 0.00 0.00 0.25 0.04 0.25 0.04
2003 0 0 351.48 0.00 0.00 0.00 0.00 0.00 0.00
2004 59 25 673.47 48.54 7.21 0.39 0.06 48.93 7.27
2005 0 0 403.46 0.00 0.00 0.14 0.03 0.14 0.03

0
100,000
200,000
300,000
400,000
500,000
600,000
700,000
Mo
nth
ly I
nfl
ow
s (
ac
-ft)
September 2015 Dynamic Position AnalysisHistorical and Estimated S65E Monthly Flow
for September from 1965 - 2005
Historical
Estimated
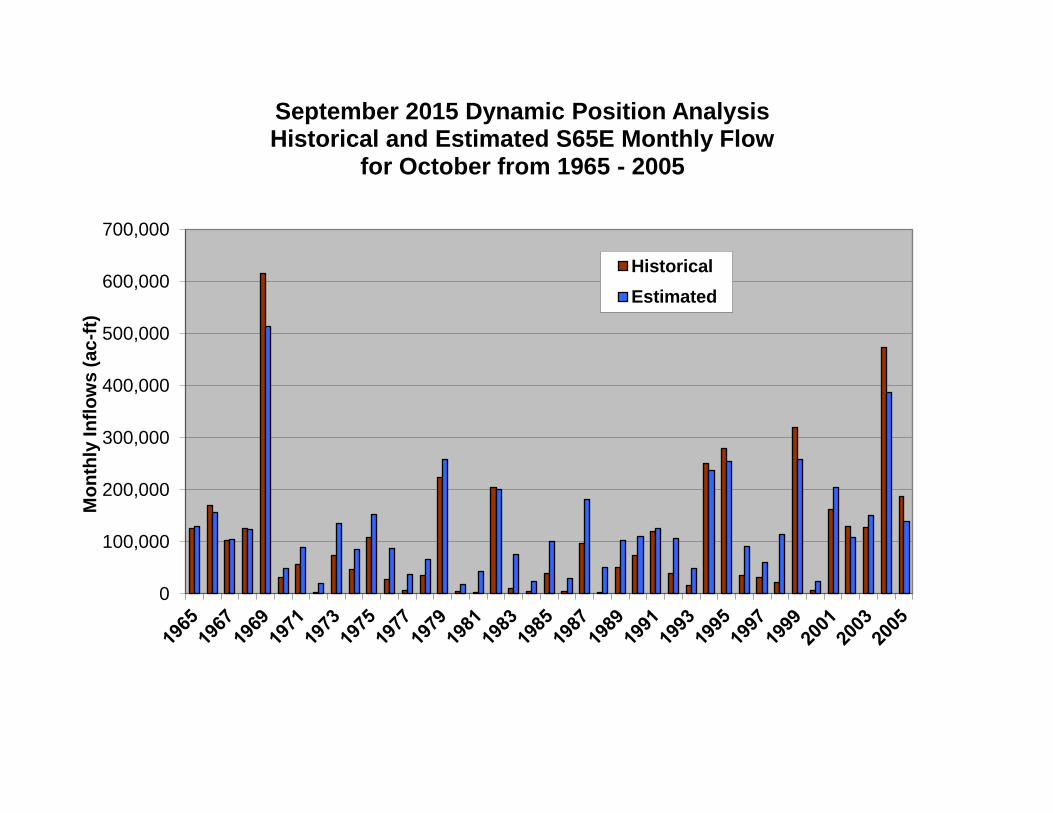
0
100,000
200,000
300,000
400,000
500,000
600,000
700,000
Mo
nth
ly I
nfl
ow
s (
ac
-ft)
September 2015 Dynamic Position Analysis Historical and Estimated S65E Monthly Flow
for October from 1965 - 2005
Historical
Estimated
Related Documents