RESEARCH ARTICLE Dynamic modelling of the PI3K/MTOR signalling network uncovers biphasic dependence of mTORC1 activity on the mTORC2 subunit SIN1 Milad Ghomlaghi 1,2☯ , Guang Yang ID 3☯ , Sung-Young Shin ID 1,2 , David E. James ID 3 , Lan K. Nguyen ID 1,2 * 1 Department of Biochemistry and Molecular Biology, School of Biomedical Sciences, Monash University, Melbourne, Australia, 2 Biomedicine Discovery Institute, Monash University, Melbourne, Australia, 3 Charles Perkins Centre, School of Life and Environmental Sciences, The University of Sydney, Sydney, Australia ☯ These authors contributed equally to this work. * [email protected] Abstract The PI3K/MTOR signalling network regulates a broad array of critical cellular processes, including cell growth, metabolism and autophagy. The mechanistic target of rapamycin (MTOR) kinase functions as a core catalytic subunit in two physically and functionally dis- tinct complexes mTORC1 and mTORC2, which also share other common components including MLST8 (also known as GβL) and DEPTOR. Despite intensive research, how mTORC1 and 2 assembly and activity are coordinated, and how they are functionally linked remain to be fully characterized. This is due in part to the complex network wiring, featuring multiple feedback loops and intricate post-translational modifications. Here, we integrate predictive network modelling, in vitro experiments and -omics data analysis to elucidate the emergent dynamic behaviour of the PI3K/MTOR network. We construct new mechanistic models that encapsulate critical mechanistic details, including mTORC1/2 coordination by MLST8 (de)ubiquitination and the Akt-to-mTORC2 positive feedback loop. Model simula- tions validated by experimental studies revealed a previously unknown biphasic, threshold- gated dependence of mTORC1 activity on the key mTORC2 subunit SIN1, which is robust against cell-to-cell variation in protein expression. In addition, our integrative analysis dem- onstrates that ubiquitination of MLST8, which is reversed by OTUD7B, is regulated by IRS1/ 2. Our results further support the essential role of MLST8 in enabling both mTORC1 and 2’s activity and suggest MLST8 as a viable therapeutic target in breast cancer. Overall, our study reports a new mechanistic model of PI3K/MTOR signalling incorporating MLST8- mediated mTORC1/2 formation and unveils a novel regulatory linkage between mTORC1 and mTORC2. PLOS COMPUTATIONAL BIOLOGY PLOS Computational Biology | https://doi.org/10.1371/journal.pcbi.1008513 September 16, 2021 1 / 26 a1111111111 a1111111111 a1111111111 a1111111111 a1111111111 OPEN ACCESS Citation: Ghomlaghi M, Yang G, Shin S-Y, James DE, Nguyen LK (2021) Dynamic modelling of the PI3K/MTOR signalling network uncovers biphasic dependence of mTORC1 activity on the mTORC2 subunit SIN1. PLoS Comput Biol 17(9): e1008513. https://doi.org/10.1371/journal.pcbi.1008513 Editor: Stacey Finley, University of Southern California, UNITED STATES Received: November 3, 2020 Accepted: September 3, 2021 Published: September 16, 2021 Copyright: © 2021 Ghomlaghi et al. This is an open access article distributed under the terms of the Creative Commons Attribution License, which permits unrestricted use, distribution, and reproduction in any medium, provided the original author and source are credited. Data Availability Statement: All relevant data are within the manuscript and its Supporting Information files. In addition, the models’ differential equations and parameter sets are also deposited to GitHub and can be accessed at https:// github.com/NguyenLab- IntegratedNetworkModeling/mTORC2_mTORC1_ biphasic. Funding: L.K.N was funded by a Victorian Cancer Agency Mid-Career Research Fellowship (MCRF18026), a Metcalf Venture Grant Scheme

Welcome message from author
This document is posted to help you gain knowledge. Please leave a comment to let me know what you think about it! Share it to your friends and learn new things together.
Transcript

RESEARCH ARTICLE
Dynamic modelling of the PI3K/MTOR
signalling network uncovers biphasic
dependence of mTORC1 activity on the
mTORC2 subunit SIN1
Milad Ghomlaghi1,2☯, Guang YangID3☯, Sung-Young ShinID
1,2, David E. JamesID3, Lan
K. NguyenID1,2*
1 Department of Biochemistry and Molecular Biology, School of Biomedical Sciences, Monash University,
Melbourne, Australia, 2 Biomedicine Discovery Institute, Monash University, Melbourne, Australia, 3 Charles
Perkins Centre, School of Life and Environmental Sciences, The University of Sydney, Sydney, Australia
☯ These authors contributed equally to this work.
Abstract
The PI3K/MTOR signalling network regulates a broad array of critical cellular processes,
including cell growth, metabolism and autophagy. The mechanistic target of rapamycin
(MTOR) kinase functions as a core catalytic subunit in two physically and functionally dis-
tinct complexes mTORC1 and mTORC2, which also share other common components
including MLST8 (also known as GβL) and DEPTOR. Despite intensive research, how
mTORC1 and 2 assembly and activity are coordinated, and how they are functionally linked
remain to be fully characterized. This is due in part to the complex network wiring, featuring
multiple feedback loops and intricate post-translational modifications. Here, we integrate
predictive network modelling, in vitro experiments and -omics data analysis to elucidate the
emergent dynamic behaviour of the PI3K/MTOR network. We construct new mechanistic
models that encapsulate critical mechanistic details, including mTORC1/2 coordination by
MLST8 (de)ubiquitination and the Akt-to-mTORC2 positive feedback loop. Model simula-
tions validated by experimental studies revealed a previously unknown biphasic, threshold-
gated dependence of mTORC1 activity on the key mTORC2 subunit SIN1, which is robust
against cell-to-cell variation in protein expression. In addition, our integrative analysis dem-
onstrates that ubiquitination of MLST8, which is reversed by OTUD7B, is regulated by IRS1/
2. Our results further support the essential role of MLST8 in enabling both mTORC1 and 2’s
activity and suggest MLST8 as a viable therapeutic target in breast cancer. Overall, our
study reports a new mechanistic model of PI3K/MTOR signalling incorporating MLST8-
mediated mTORC1/2 formation and unveils a novel regulatory linkage between mTORC1
and mTORC2.
PLOS COMPUTATIONAL BIOLOGY
PLOS Computational Biology | https://doi.org/10.1371/journal.pcbi.1008513 September 16, 2021 1 / 26
a1111111111
a1111111111
a1111111111
a1111111111
a1111111111
OPEN ACCESS
Citation: Ghomlaghi M, Yang G, Shin S-Y, James
DE, Nguyen LK (2021) Dynamic modelling of the
PI3K/MTOR signalling network uncovers biphasic
dependence of mTORC1 activity on the mTORC2
subunit SIN1. PLoS Comput Biol 17(9): e1008513.
https://doi.org/10.1371/journal.pcbi.1008513
Editor: Stacey Finley, University of Southern
California, UNITED STATES
Received: November 3, 2020
Accepted: September 3, 2021
Published: September 16, 2021
Copyright: © 2021 Ghomlaghi et al. This is an open
access article distributed under the terms of the
Creative Commons Attribution License, which
permits unrestricted use, distribution, and
reproduction in any medium, provided the original
author and source are credited.
Data Availability Statement: All relevant data are
within the manuscript and its Supporting
Information files. In addition, the models’
differential equations and parameter sets are also
deposited to GitHub and can be accessed at https://
github.com/NguyenLab-
IntegratedNetworkModeling/mTORC2_mTORC1_
biphasic.
Funding: L.K.N was funded by a Victorian Cancer
Agency Mid-Career Research Fellowship
(MCRF18026), a Metcalf Venture Grant Scheme
Author summary
Signalling networks are the key information-processing machineries that underpin the
ability of living cells to respond proportionately to extra- (and intra-) cellular cues. The
PI3K/MTOR signalling network is one of the most important signalling networks in
human cells that regulates cellular response to critical hormones such as insulin; yet our
understanding of the network behaviour remains far from complete. Here, we employed a
highly integrative approach that combines predictive mathematical modelling, biological
experimentation, and data analysis to gain novel systems-level insights into PI3K/MTOR
signalling. We constructed new mathematical models of this complex network incorpo-
rating important regulatory mechanisms. In contrary to commonly-held views that
mTORC2 lies upstream and is a positive regulator of mTORC1, we found that their rela-
tionship is highly non-linear and dose dependent. This finding has major implications for
anti-mTORC2 therapy as depending on the cellular contexts, inhibiting mTORC2 may
either reduce or enhance mTORC1 activation, the latter could inadvertently dampen the
effect of mTORC2 blockade. Furthermore, our results demonstrate that MLST8 is
required for the assembly and activity of both MTOR complexes and suggest MLST8 is a
viable therapeutic target in breast cancer.
Introduction
The PI3K/MTOR signalling network plays an important role in the regulation of cell signal
transduction and regulates a variety of key biological processes such as cell growth, metabolism
and autophagy [1]. The mechanistic target of rapamycin (MTOR) is a Ser/Thr kinase that lies
at the center of this complex network, where it serves as an indispensable catalytic subunit for
two functionally distinct complexes termed MTOR complex 1 (mTORC1) and MTOR com-
plex 2 (mTORC2). In addition to mTOR, mTORC1 and 2 share two common subunits,
MTOR associated protein LST8 homolog (MLST8, also known as GβL) and DEP domain-con-
taining mTOR-interacting protein (DEPTOR); whereas regulatory associated protein of
MTOR complex 1 (raptor) and proline-rich Akt substrate of 40 kDa (PRAS40) are unique
components of mTORC1 [2], and stress-activated map kinase-interacting protein 1 (SIN1) [3]
and raptor independent companion of MTOR complex 2 (RICTOR) [4] are exclusive to
mTORC2. Reflecting its importance in physiological regulation, the PI3K/MTOR network is
frequently disrupted in human diseases, including cancer, metabolic and neurodegenerative
disorders [2]. In cancer alone, more than 40 inhibitors directed at various components of the
network have been developed or are under active development [5]. Given the clinical relevance
of PI3K/MTOR signalling, it is important to understand the interconnectivities within this
network and emergent network behaviors.
The PI3K/MTOR network is highly complicated and arguably one of the most extensively
studied signalling pathways, yet its complexity continues to expand through new mechanistic
discoveries. For example, in addition to known feedback mechanisms such as p70S6 kinase
(S6K)-mediated negative feedback to PI3K/AKT via IRS1/2, we have identified a positive feed-
back loop between AKT and mTORC2, where AKT phosphorylates SIN1 to enhance
mTORC2 activity [5,6]. More recently, a molecular switch involving MLST8 through its (de)
ubiquitination modification was identified [7]. Mechanistically, the TNF receptor-associated
factor 2 (TRAF2) E3 ubiquitin ligase promotes MLST8 ubiquitination on lysine 63 (K63),
which disrupts its interaction with the unique mTORC2 component SIN1 [7]. By contrast,
ubiquitinated MLST8 can be converted back to its de-ubiquitinated form by the OTU
PLOS COMPUTATIONAL BIOLOGY Integrative modelling reveals biphasic dependence of mTORC1 activity on Sin1
PLOS Computational Biology | https://doi.org/10.1371/journal.pcbi.1008513 September 16, 2021 2 / 26
from Cancer Council Victoria, Australia, and an
Investigator Initiated Research Scheme grant from
National Breast Cancer Foundation and Love Your
Sister (IIRS-20–094). The funders had no role in
study design, data collection and analysis, decision
to publish, or preparation of the manuscript.
Competing interests: The authors have declared
that no competing interests exist.

deubiquitinase 7B (OTUD7B) deubiquitinase. De-ubiquitinated MLST8 binds more favour-
ably to SIN1, which facilitates mTORC2 assembly but at the same time reduces mTORC1 for-
mation [7] (Fig 1A). These findings add extra layers of complexity and intricacy to the wiring
of the PI3K/MTOR network, however its dynamic properties incorporating these new regula-
tory mechanisms have not been characterized.
Moreover, although the MLST8 ubiquitination-dependent switch seems to provide tight
regulation of MTOR complex integrity, the functional role of MLST8 in each complex remains
incompletely defined. While it is established that MLST8 is indispensable for mTORC2 activity
[8,9], whether it is essential for mTORC1 function is unclear. For example, ablation of MLST8
does not affect mTORC1 activity as measured by the phosphorylation level of its major sub-
strate S6K1[9–11]. On the other hand, MLST8 stabilizes the raptor-MTOR interaction and
promotes mTORC1 activity [12], and upregulation of MLST8 enhances mTORC1/2 activities
in colon carcinoma and prostate cancer [13].
Here we employed an integrated approach that combines predictive network modelling
and biological experiments to analyze the emergent network-level behavior of PI3K/MTOR
signalling conferred by the MLST8-mediated switch. We constructed alternative mechanistic
models of the PI3K/MTOR network that explicitly encapsulate MLST8 (de)ubiquitination,
ensuing mTORC1/2 coordination, and the AKT-mTORC2 positive feedback. The candidate
models consider competing hypotheses of network interactions, reflecting different network
structures. To differentiate among the models and arrive at the optimal one, we performed
comparative model calibration and validation using time-resolved experimental data. Using
the optimal model, we undertook simulation studies with an emphasis on the regulation of
mTORC1/2 formation and activity, and characterized the governing factors through network
perturbation analysis. Model predictions were validated experimentally using in vitro assays
and interrogation of publicly available data.
Our integrative studies revealed a hitherto unknown biphasic dependence of mTORC1
activity on the key mTORC2 component SIN1, uncovering an emergent functional linkage
between the two MTOR complexes. This non-linear dependence seems to be a robust feature
among a broad array of cell types, as model simulations predict its existence in the face of
marked cell-to-cell heterogeneity in protein expression. The SIN1-mTORC1 biphasic response
may help explain context-specific biological observations in cells with low or high levels of
SIN1. Furthermore, our results demonstrate that MLST8 is required for the assembly and
activity of both MTOR complexes and suggest MLST8 is a viable therapeutic target in breast
cancer. As cellular response specificity is encoded by the spatial and temporal dynamics of sig-
nalling networks and coordinated by all network components, this study highlights the need
to undertake systems approaches to study complex perturbation-response relationship. To this
end, the models developed here provide useful resources for future systems-based studies of
PI3K/MTOR signalling.
Results
Construction of mechanistic PI3K/MTOR network models incorporating
MLST8-mediated switch
To elucidate the functional role of the MLST8 (de)ubiquitination switch in coordinating
mTORC1/2 formation and PI3K/MTOR network dynamics, we constructed new mathemati-
cal models of this network incorporating the switch regulation. A number of models have pre-
viously been developed for the PI3K/MTOR pathway [14]. For example, Dalle Pezze et al.
(2012) presented a model using ordinary differential equations (ODEs) to investigate potential
regulators of mTORC2 [15]. Based on observations that amino acids can also activate
PLOS COMPUTATIONAL BIOLOGY Integrative modelling reveals biphasic dependence of mTORC1 activity on Sin1
PLOS Computational Biology | https://doi.org/10.1371/journal.pcbi.1008513 September 16, 2021 3 / 26
PLOS COMPUTATIONAL BIOLOGY Integrative modelling reveals biphasic dependence of mTORC1 activity on Sin1
PLOS Computational Biology | https://doi.org/10.1371/journal.pcbi.1008513 September 16, 2021 4 / 26
mTORC2 in addition to mTORC1 [16], an integrated modelling-experimental approach was
employed to identify novel downstream targets of amino acids within the MTOR pathway
[17]. Other models focused on insulin resistance and aimed to explain the PI3K/MTOR net-
work dynamics following insulin stimulation in healthy and diabetic cells [18–21]. We previ-
ously constructed mechanistic models that revealed complex emergent network dynamics
conferred by DEPTOR, an endogenous inhibitor of both mTORC1 and 2 [22]. However, none
of the published models consider the coordination of mTORC1/2 formation by the MLST8
(de)ubiquitination switch [7]. The models developed in this study are the first to explicitly
incorporate this switch, in addition to known regulatory mechanisms. Below we describe the
key model assumptions and underpinning experimental observations.
MLST8-mediated switch regulates MTOR complex formation
Although MLST8 was identified as a shared component of mTORC1 and 2 more than a decade
ago [12,23], only recently the (de)ubiquitination of MLST8 was found to regulate its binding
to mTORC1 and 2 [7]. Depicted in Fig 1A, MLST8 is ubiquitinated by the E3 ligase TRAF2 on
its WD7 kinase domain, which is also the binding site for SIN1. Consequently, MLST8 ubiqui-
tination prevents SIN1-MLST8 association and decreases formation of mTORC2. However, as
raptor binds MLST8 via its WD6 domain, MLST8 ubiquitination does not affect MLST8-rap-
tor binding [7]. Moreover, ubiquitination-mediated reduction of SIN1-MLST8 association
frees MLST8 to be available for raptor binding, thereby enhancing mTORC1 formation [7].
The ubiquitination of MLST8 is reversed by the deubiquitinating enzyme OTUD7B, which
catalyzes MLST8 deubiquitination [7]. By doing so, OTUD7B enhances MLST8’s binding
affinity for SIN1 and thus mTORC2 formation (Fig 1A). Importantly, insulin acts as a trigger-
ing input for OTUD7B as insulin stimulation promotes activation of OTUD7B [7]. Collec-
tively, MLST8 (de)ubiquitination functions as a molecular switch where ubiquitination
promotes mTORC1 formation while simultaneously blocking mTORC2 formation, and deu-
biquitination does the opposite. However, how the MLST8-induced switch interplays with
other regulatory mechanisms within the PI3K/MTOR network to orchestrate network behav-
iour is not clear. These mechanistic details are captured in our new models, indicated in the
model reaction scheme in Fig 1B.
Other key signalling events and feedback loops
The model schematic in Fig 1B further includes key signalling and feedback events induced by
insulin stimulation. Briefly, insulin binds to the insulin receptor (INSR), triggering INSR
dimerization, autophosphorylation and activation [24]. Activated INSR recruits and phos-
phorylates insulin receptor substrates (IRS1/2) that leads to PI3K recruitment and activation
[24]. Activated PI3K in turn phosphorylates phosphatidylinositol (3,4,5)-bisphosphate (PIP2)
and generates phosphatidylinositol (3,4,5)-trisphosphate (PIP3), which recruits the kinase
3-phosphoinositide-dependent protein kinase 1 (PDK1) to the plasma membrane to
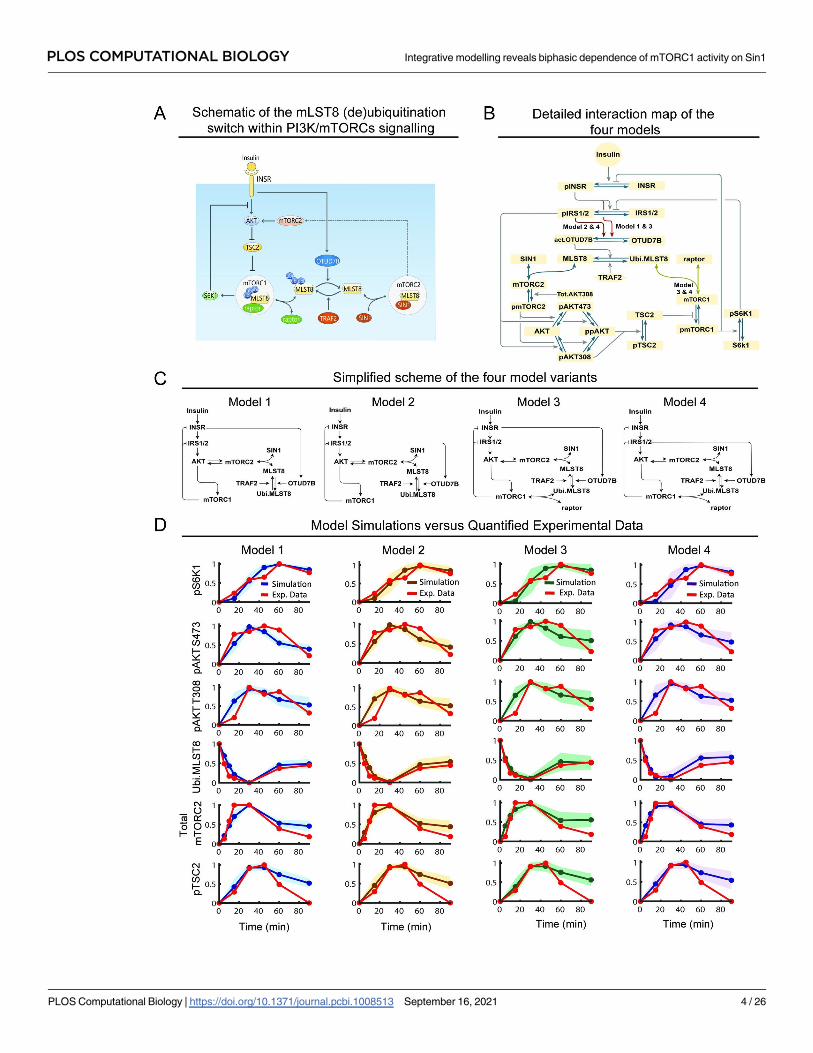
Fig 1. Construction and calibration of new mathematical models of the PI3K/MTOR signalling network incorporating the MLST8 (de)
ubiquitination switch. (A) Schematic displaying a molecular switch mediated by MLST8 ubiquitination recently reported in [7], which dictates
how MLST8 associates with mTORC1 or 2 through raptor and SIN1, respectively (ubi: ubiquitination). (B) Detailed reaction diagrams of the new
PI3K/MTOR network models incorporating the MLST8 switch. Four model variants (models 1–4) with distinguishing interactions as described
in the text are highlighted (ubi: ubiquitination, act: activated, Tot: total). (C) Simplified schematics of the different network structures captured by
the four model variants. (D) Time-course model simulations using best-fitted parameter sets as compared to the quantified experimental data
(red curves), presented for each of the four models. Experimental data represent the dynamic response of various network proteins following
insulin stimulation (100nM) in MEF cells, reproduced from Western blot data representative of at least three biological replicates obtained from
[7]. Per model, multiple best-fitted sets obtained from model calibration (n = 189, 198, 12, 13 for model 1, 2, 3, 4, respectively) were used for
simulations: the lines represent the mean simulated curve and the shaded areas indicate standard deviation of all curves.
https://doi.org/10.1371/journal.pcbi.1008513.g001
PLOS COMPUTATIONAL BIOLOGY Integrative modelling reveals biphasic dependence of mTORC1 activity on Sin1
PLOS Computational Biology | https://doi.org/10.1371/journal.pcbi.1008513 September 16, 2021 5 / 26
phosphorylate AKT at Threonine 308 (pAKT T308). To keep the model simplified without
compromising dynamic accuracy, we lumped the IRS1/2! PI3K! PIP3! PDK1! pAKT
T308 cascade into a single step, IRS1/2! pAKT T308 (Fig 1B).
As an AGC family kinase, AKT requires dual phosphorylation to become fully activated
[25]. To this end, mTORC2 serves as a second AKT kinase and phosphorylates it at Serine 473
(pAKT S473). We assume that double phosphorylated AKT (ppAKT) can be achieved indepen-
dently through either pAKT T308 or pAKT S473 first (Fig 1B) [26]. Moreover, as pAKT S473
alone possesses relatively much weaker kinase activity compared to pAKT T308 and ppAKT
[26], we assumed that phosphorylation of the downstream substrate TSC2 is primarily catalyzed
by the latter. This acts to inhibit TSC2 and releases its repression on mTORC1 activity. Acti-
vated mTORC1 phosphorylates S6K1, which in turn phosphorylates IRS1/2 on the inhibitory
sites S636/S639, forming a well-established negative feedback within the PI3K/MTOR pathway
that downregulates the input signal [27]. In addition, there is another negative feedback from
mTORC1 to INSR via growth factor receptor bound protein 10 (Grb10) [28,29] (Fig 1B).
The study by Liu et al. [30] indicates that S6K1phosphorylates SIN1 at Threonine 86 and
398 and impairs mTORC2 function. However, our previous studies instead demonstrate that
AKT, rather than S6K1, actually phosphorylates SIN1 at Threonine 86 (T86), which acts to
enhance mTORC2 kinase activity. This generates a positive feedback loop between mTORC2
and AKT [5], which was incorporated into the model.
Construction of multiple network model variants
In addition to the more established signalling events above, there are gaps in our network
structure understanding. First, although insulin stimulation was shown to promote OTUD7B
activation, it is unclear if this is mediated at the level of the insulin receptor or downstream.
Therefore, we constructed two different model variants to examine alternative scenarios: (i) in
model 1, OTUD7B is regulated directly by INSR and thus is not influenced by IRS1/2 and the
S6K1-IRS1/2 negative feedback loop; and (ii) in model 2, OTUD7B is regulated by IRS1/2 and
therefore under the control of two negative feedbacks (Fig 1C, left panels). Second, while
MLST8 is critical for mTORC2 kinase activity as previously discussed, the evidence regarding
whether it is required for mTORC1’s functional activity are conflicting [9,10,12,13]. This led
us to construct two additional models in order to investigate the role of MLST8 in mTORC1
regulation. Specifically, in models 1–2, we assumed that MLST8 is not required for mTORC1’s
function. In contrast, in models 3–4, MLST8 binds to raptor and forms mTORC1, thus
MLST8 is required for mTORC1 formation and activity (Fig 1C, right panels).
In summary, we constructed four model variants differing in specific details pertaining to
the regulation of OTUD7B and the role of MLST8 in mTORC1 regulation, allowing us to
examine competing hypotheses. The new models were formulated using ODEs that represent
biochemical interactions as a series of ordinary differential equations based on established
kinetic laws [31]. Solving these equations enables us to evaluate temporal evolution in the con-
centration (i.e. states) of the network proteins. The rates of protein-protein interactions (e.g.
association and dissociation reactions) were described by mass-action kinetics, and the rates of
enzyme-catalyzed reactions (e.g. (de)phosphorylation and (de)ubiquitination) were given by
Michaelis-Menten kinetics. Detailed description of the models, including ODE equations,
reaction rates and model parameters are given in S1 and S2 Tables and S1 File.
Model simulation predicts OTUD7B is regulated by IRS1/2
To confer specificity and predictive power to our models, we performed model calibration (i.e.
parameter estimation) using insulin-stimulated time-course experimental data obtained from
PLOS COMPUTATIONAL BIOLOGY Integrative modelling reveals biphasic dependence of mTORC1 activity on Sin1
PLOS Computational Biology | https://doi.org/10.1371/journal.pcbi.1008513 September 16, 2021 6 / 26
mouse embryonic fibroblast (MEF) cells previously published in [7], which was the primary
cell model used for the characterization of the MLST8-mediated switch. The representative
data were quantified using the software ImageJ [32] (see S1 Fig). Parameter estimation was car-
ried out using an optimization procedure based on a genetic algorithm implemented in
MATLAB (Materials and Methods). To avoid possible biases associated with using a single
best-fitted parameter set, for each model we repeated the parameter estimation process 500
times to obtain multiple optimal parameter sets that best fitted the data, and utilized these sets
collectively for subsequent simulation and analysis (see Materials and Methods).
Simulation results of the four models using the corresponding optimized parameter sets
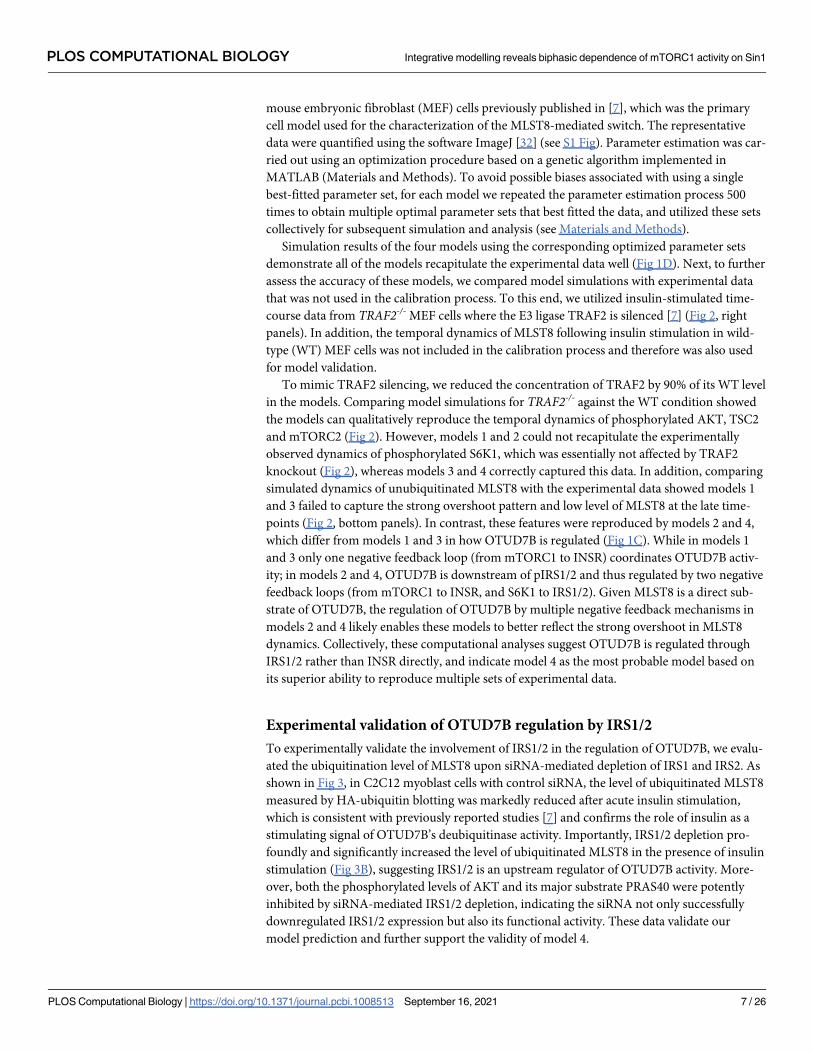
demonstrate all of the models recapitulate the experimental data well (Fig 1D). Next, to further
assess the accuracy of these models, we compared model simulations with experimental data
that was not used in the calibration process. To this end, we utilized insulin-stimulated time-
course data from TRAF2-/- MEF cells where the E3 ligase TRAF2 is silenced [7] (Fig 2, right
panels). In addition, the temporal dynamics of MLST8 following insulin stimulation in wild-
type (WT) MEF cells was not included in the calibration process and therefore was also used
for model validation.
To mimic TRAF2 silencing, we reduced the concentration of TRAF2 by 90% of its WT level
in the models. Comparing model simulations for TRAF2-/- against the WT condition showed
the models can qualitatively reproduce the temporal dynamics of phosphorylated AKT, TSC2
and mTORC2 (Fig 2). However, models 1 and 2 could not recapitulate the experimentally
observed dynamics of phosphorylated S6K1, which was essentially not affected by TRAF2
knockout (Fig 2), whereas models 3 and 4 correctly captured this data. In addition, comparing
simulated dynamics of unubiquitinated MLST8 with the experimental data showed models 1
and 3 failed to capture the strong overshoot pattern and low level of MLST8 at the late time-
points (Fig 2, bottom panels). In contrast, these features were reproduced by models 2 and 4,
which differ from models 1 and 3 in how OTUD7B is regulated (Fig 1C). While in models 1
and 3 only one negative feedback loop (from mTORC1 to INSR) coordinates OTUD7B activ-
ity; in models 2 and 4, OTUD7B is downstream of pIRS1/2 and thus regulated by two negative
feedback loops (from mTORC1 to INSR, and S6K1 to IRS1/2). Given MLST8 is a direct sub-
strate of OTUD7B, the regulation of OTUD7B by multiple negative feedback mechanisms in
models 2 and 4 likely enables these models to better reflect the strong overshoot in MLST8
dynamics. Collectively, these computational analyses suggest OTUD7B is regulated through
IRS1/2 rather than INSR directly, and indicate model 4 as the most probable model based on
its superior ability to reproduce multiple sets of experimental data.
Experimental validation of OTUD7B regulation by IRS1/2
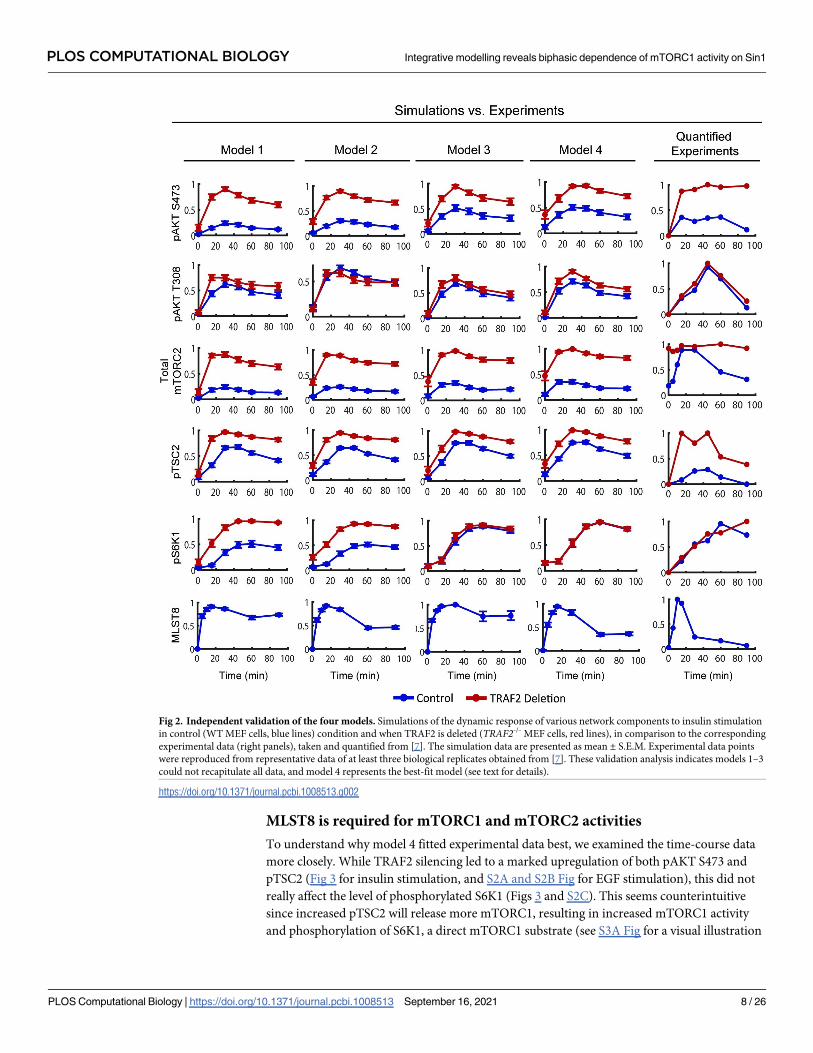
To experimentally validate the involvement of IRS1/2 in the regulation of OTUD7B, we evalu-
ated the ubiquitination level of MLST8 upon siRNA-mediated depletion of IRS1 and IRS2. As
shown in Fig 3, in C2C12 myoblast cells with control siRNA, the level of ubiquitinated MLST8
measured by HA-ubiquitin blotting was markedly reduced after acute insulin stimulation,
which is consistent with previously reported studies [7] and confirms the role of insulin as a
stimulating signal of OTUD7B’s deubiquitinase activity. Importantly, IRS1/2 depletion pro-
foundly and significantly increased the level of ubiquitinated MLST8 in the presence of insulin
stimulation (Fig 3B), suggesting IRS1/2 is an upstream regulator of OTUD7B activity. More-
over, both the phosphorylated levels of AKT and its major substrate PRAS40 were potently
inhibited by siRNA-mediated IRS1/2 depletion, indicating the siRNA not only successfully
downregulated IRS1/2 expression but also its functional activity. These data validate our
model prediction and further support the validity of model 4.
PLOS COMPUTATIONAL BIOLOGY Integrative modelling reveals biphasic dependence of mTORC1 activity on Sin1
PLOS Computational Biology | https://doi.org/10.1371/journal.pcbi.1008513 September 16, 2021 7 / 26
MLST8 is required for mTORC1 and mTORC2 activities
To understand why model 4 fitted experimental data best, we examined the time-course data
more closely. While TRAF2 silencing led to a marked upregulation of both pAKT S473 and
pTSC2 (Fig 3 for insulin stimulation, and S2A and S2B Fig for EGF stimulation), this did not
really affect the level of phosphorylated S6K1 (Figs 3 and S2C). This seems counterintuitive
since increased pTSC2 will release more mTORC1, resulting in increased mTORC1 activity
and phosphorylation of S6K1, a direct mTORC1 substrate (see S3A Fig for a visual illustration
Fig 2. Independent validation of the four models. Simulations of the dynamic response of various network components to insulin stimulation
in control (WT MEF cells, blue lines) condition and when TRAF2 is deleted (TRAF2-/- MEF cells, red lines), in comparison to the corresponding
experimental data (right panels), taken and quantified from [7]. The simulation data are presented as mean ± S.E.M. Experimental data points
were reproduced from representative data of at least three biological replicates obtained from [7]. These validation analysis indicates models 1–3
could not recapitulate all data, and model 4 represents the best-fit model (see text for details).
https://doi.org/10.1371/journal.pcbi.1008513.g002
PLOS COMPUTATIONAL BIOLOGY Integrative modelling reveals biphasic dependence of mTORC1 activity on Sin1
PLOS Computational Biology | https://doi.org/10.1371/journal.pcbi.1008513 September 16, 2021 8 / 26
of this reasoning). This raises the questions as to why pS6K1 was buffered from TRAF2 silenc-
ing, and which mechanism underpins such buffering?
We hypothesize that the stable pS6K1 level in response to TRAF2 knockout is due to a com-
pensatory upregulation of mTORC1 activity. Model 4 assumes that MLST8 is required for
mTORC1 function. Thus, while there are increased levels of mTORC2 and phosphorylated
AKT and TSC2 in TRAF2-/- cells, which together activate mTORC1 more strongly, the abun-
dance of mTORC1 is reduced due to a loss of ubiquitinated MLST8. Overall, this leads to a bal-
ance in mTORC1’s total kinase activity potential (defined by the product of mTORC1
abundance and activity potential per mTORC1 molecule, as described in the Material and
Methods), and so no changes in phosphorylated S6K1 (S3B Fig). This balance breaks down in
models 1–2, which assume MLST8 is not required for mTORC1 function, resulting in a signifi-
cant change in pS6K1 when TRAF2 is silenced.
Taken together, through rational construction of a series of mechanistic models and con-
trasting model simulations with experimental measurements, we arrived at model 4 that best
reconciles multiple sets of experimental data in WT and TRAF2-/- MEF cells. This model will
be used for subsequent analyses.
Modelling predicts biphasic mTORC1 activation dependency on mTORC2
subunit SIN1
Given the key role of MLST8 in coordinating the assembly and activity of mTORC1/2, pertur-
bation of the MLST8-mediated switch is likely to disrupt mTORC1/2 signalling but how this
Fig 3. Experimental validation of IRS1/2-mediated regulation of MLST8 ubiquitination. (A) Flag-MLST8 immunoprecipitates from IRS1/2
knockdown C2C12 cells after insulin stimulation were analyzed by Western blot. (B) Graph shows mean ± S.E.M. of quantitative analyses of the
Western blots in Fig 3A normalized for the total proteins (A.U., arbitrary units. � P<0.05, ��P<0.01, two-tailed student’s t test, n = 3 biological
replicates).
https://doi.org/10.1371/journal.pcbi.1008513.g003
PLOS COMPUTATIONAL BIOLOGY Integrative modelling reveals biphasic dependence of mTORC1 activity on Sin1
PLOS Computational Biology | https://doi.org/10.1371/journal.pcbi.1008513 September 16, 2021 9 / 26
occurs is not understood. To address this, we performed in silico sensitivity analysis where the
concentration of the switch-related proteins (MLST8, TRAF2, OTUD7B, SIN1 and raptor)
were systematically perturbed over a wide range (from 100-fold down to 1000-fold up) of their
nominal values, and the impact on mTORC1 and 2 signalling was quantified using the
response of pS6K1 and pAKT S473 at steady state, respectively.
Interestingly, model simulations predict that increasing SIN1 induces a biphasic, dose-
dependent response in pS6K1 (Fig 4A). Time-course simulations in Fig 4B confirm that an
increase of SIN1 from a low level initially promotes pS6K1 (first phase), but further increase of
SIN1 beyond a critical threshold suppresses pS6K1 instead (second phase). Biphasic patterns,
albeit to a lesser extent, are also observed for TRAF2, raptor and OTUD7B graded perturba-
tions (Figs 4A and S4). The underlying mechanism for SIN1-induced biphasic pattern can be
explained based on the fact that MLST8 is competitively sequestered by raptor and SIN1 for
assembly of mTORC1 and 2, respectively. According to Eq (1), the overall ability of mTORC1
to phosphorylate S6K1 is determined by two factors: (i) the abundance of mTORC1 as well as
(ii) the kinase activity potential per mTORC1 molecule, the latter is proportionally dependent
on the upstream kinases AKT and mTORC2. Thus, the level of pS6K1 is dictated by the bal-
ance between these factors. During the first phase, an increase in SIN1 would sequester more
MLST8 and increase mTORC2 formation, leading to higher mTORC1 activity potential, but at
the same time resulting in less mTORC1 formation. As the gain in mTORC1 activity out-
weighs the loss in abundance, the net effect is an overall enhancement of pS6K1. In contrast,
the balance is tipped in the opposite direction in the second phase, as a further increase of
SIN1 reduces mTORC1 abundance dramatically, which overrides the upregulation in
mTORC1 activity, leading to an overall reduction in pS6K1.
To further investigate the robustness of this biphasic dependency with regard to changes in
the expression of multiple proteins, we extended the sensitivity analysis to two dimensions by
assessing the level of pS6K1in response to simultaneous changes in the abundance of pairs of
state variables. Fig 4C shows that the SIN1-dependent pS6K1 biphasic response is present over
a large range of TRAF2 expression levels. Similarly, the biphasic response persists over a wide
range of OTUD7B expression levels. Together, these simulation results indicate that the
biphasic mTORC1 activation induced by SIN1 is robust to expression variation in multiple
network components.
Unlike pS6K1, model simulation predicts a monotonic increase of pAKT S473 in response
to SIN1 overexpression (Fig 4A). Similarly, increasing OTUD7B and TRAF2 concentration
monotonically promotes and diminishes pAKT S473, respectively; owing to their opposing
effects on deubiquitinated MLST8 and mTORC2 formation (Figs 4A and S4). Interestingly,
simulations show that overexpression of MLST8 enhances the level of both pAKT S473 and
pS6K1 (S4 Fig), suggesting MLST8 promotes activation of both MTOR complexes. The model
prediction is consistent with previous findings that MLST8 is upregulated in several cancer
types [13]. Further, knockdown of MLST8 suppresses tumor growth by inhibiting MTOR
complex formation and activity [13].
Experimental validation of SIN1-induced biphasic mTORC1 dependency
In order to experimentally validate the predicted biphasic dependency of mTORC1 on SIN1,
we generated MEF cells that express increasing levels of SIN1. To this end, we utilized MEFs
where SIN1 has been knocked out and transfected these with the SIN1 construct containing
EGFP as a sorting marker. The SIN1 low- and high-expression cells were sorted according to
the expression level of EGFP. To measure the effect of graded SIN1 levels on phosphorylated
S6K1, cells were stimulated with insulin after serum starvation and pS6K1 was measured using
PLOS COMPUTATIONAL BIOLOGY Integrative modelling reveals biphasic dependence of mTORC1 activity on Sin1
PLOS Computational Biology | https://doi.org/10.1371/journal.pcbi.1008513 September 16, 2021 10 / 26

Western Blot (Fig 4D). In cells with no SIN1, there was a low level of pS6K1, which results pri-
marily from pAKT T308 activity alone since mTORC2 is not functional in these cells, evident
by the lack of any pAKT S473 signal (Fig 4D). In cells with low SIN1, there was a significant
increase in the level of both pS6K1 and pAKT S473, the latter due to the formation of func-
tional mTORC2. However, in cells having the highest levels of SIN1, while pAKT S473 was fur-
ther increased, the level of pS6K1 was instead significantly reduced in comparison to SIN1-low
cells (Fig 4D). These data confirm the model predictions and demonstrate a biphasic
Fig 4. In silico analyses and experimental validation show biphasic dependency of mTORC1 activity on SIN1. (A) Dose-response simulations of the steady-state
values of pS6K1 and pAKT S473 in response to increasing SIN1 or TRAF2, revealing a biphasic dependence of mTORC1 activity on SIN1. SIN1 or TRAF2
concentrations were varied within a wide range: 100 folds down and 1000 folds up of their nominal values. Each curve related to each parameter set was normalized
by its maximal (peak) value and then average and S.E.M. were calculated at each concentration. (B) Temporal simulations of pS6K1 at different concentrations of
SIN1. (C) Two-dimensional perturbation analysis showing the simulated steady-state response of pS6K1 to simultaneous change in pairs of proteins, which
demonstrates the biphasic pattern is robust over wide ranges of TRAF2 and OTUD7B expression levels. (D) Experimental validation of the SIN1-mTORC1 biphasic
dependency. Cells were deprived of serum for 2 h, followed by insulin (100 nM) stimulation for 10 min, and samples were analyzed by Western blot. Graphs show
mean ± S.E.M. of quantitative analyses of Western blots (�P<0.05, ��P<0.01, ����P<0.0001, two-tailed student’s t test, n = 3 biological replicates).
https://doi.org/10.1371/journal.pcbi.1008513.g004
PLOS COMPUTATIONAL BIOLOGY Integrative modelling reveals biphasic dependence of mTORC1 activity on Sin1
PLOS Computational Biology | https://doi.org/10.1371/journal.pcbi.1008513 September 16, 2021 11 / 26
dependence of mTORC1 activity on SIN1 expression. Furthermore, in contrast to the results
in previous studies indicating SIN1 knockout and mTORC2 activity have no effects on
mTORC1 function [9,10], our model simulations verified by experimental data here indicate
that mTORC2 regulates both the activity of AKT and mTORC1 in MEF cells.
Interrogating the SIN1-mTORC1 biphasic dependency in diverse cancer
cell lines
By integrating model-based simulation and biological validation, we have identified a previ-
ously unknown biphasic dependency between SIN1 and mTORC1 activity in MEF cells. To
investigate this biphasic connection under various cellular contexts and how it may be
impacted by cell-to-cell variability in protein expression, we adjusted our model by incorporat-
ing cell-type specific protein expression data from diverse cell types and performed simula-
tions under these varying conditions.
To this end, we first obtained relative protein expression recently reported by the Cancer
Cell Line Encyclopedia (CCLE) for 375 human cancer cell lines [33], which allowed us to com-
pare protein levels across the various cell lines. Of these, 33 cell lines have missing data, i.e. no
detectable expression of one of the model proteins, leaving 342 for further analysis. However,
tailoring our model to a new cell type ideally requires absolute protein levels, i.e. abundance of
proteins within a proteome. To address this, we utilized a second dataset containing absolute
protein abundances obtained by Geiger et al. [34] for 11 common cell lines, using mass spec-
trometry based label-free proteomics and intensity-based absolute quantification (iBAQ) algo-
rithm [34]. Since 7 cell lines were consistent between these two datasets, we could use the
iBAQ data of these 7 cell lines and the relative protein information in 342 cell lines to infer the
absolute protein levels for the CCLE cohort (see Material and Methods for detailed descrip-
tion). A schematic of this inference pipeline is illustrated in Fig 5A. Using MCF7 as an exam-
ple, we combined absolute protein abundances (i.e. iBAQ data) in MCF7 and the relative
expression data (i.e. CCLE data) between MCF7 and 341 remaining cell lines to compute the
absolute protein abundances for these cells. We repeated this process for the 6 remaining cell
lines with iBAQ data (Fig 5A). As a result, for each of the 342 CCLE cell lines we have 7 sets of
protein abundances that were inferred using each of the 7 cell lines from [33]. The final abun-
dance of the model protein components in each cell line were then derived by taking average
of the 7 corresponding values, which were subsequently used to modify the initial conditions
in our model in order to tailor it for each of the 342 cancer cell lines (see Material and Methods
for detailed description).
Having customized our model for different cell lines, we asked if the SIN1-mTORC1
biphasic dependency still exists under these varying cellular contexts. Fig 5B displays the
model simulation results for pS6K1 in response to increasing SIN1 expression, showing the
biphasic dependency is still present in almost all of the cell lines. This suggests the biphasic
dependency is robust to intercellular variation, albeit the precise shape of this biphasic curve
differs between different cell types, where it peaks at a lower level of SIN1 in some compared
to others (Fig 5B). On the other hand, increasing SIN1 consistently promotes phosphorylated
AKT levels in all the cell types (Fig 5B). In addition, we analyzed the effect of MLST8 perturba-
tion in various network conditions (Fig 5C). In contrast to SIN1, increasing MLST8 consis-
tently enhanced the levels of phosphorylated S6K1 and AKT in the majority of the tested cell
types. These results highlight the role of MLST8 overexpression in tumor progression in part
through promoting mTORC1 and 2 activities, which was observed in colon carcinoma and
prostate cancer [13].
PLOS COMPUTATIONAL BIOLOGY Integrative modelling reveals biphasic dependence of mTORC1 activity on Sin1
PLOS Computational Biology | https://doi.org/10.1371/journal.pcbi.1008513 September 16, 2021 12 / 26
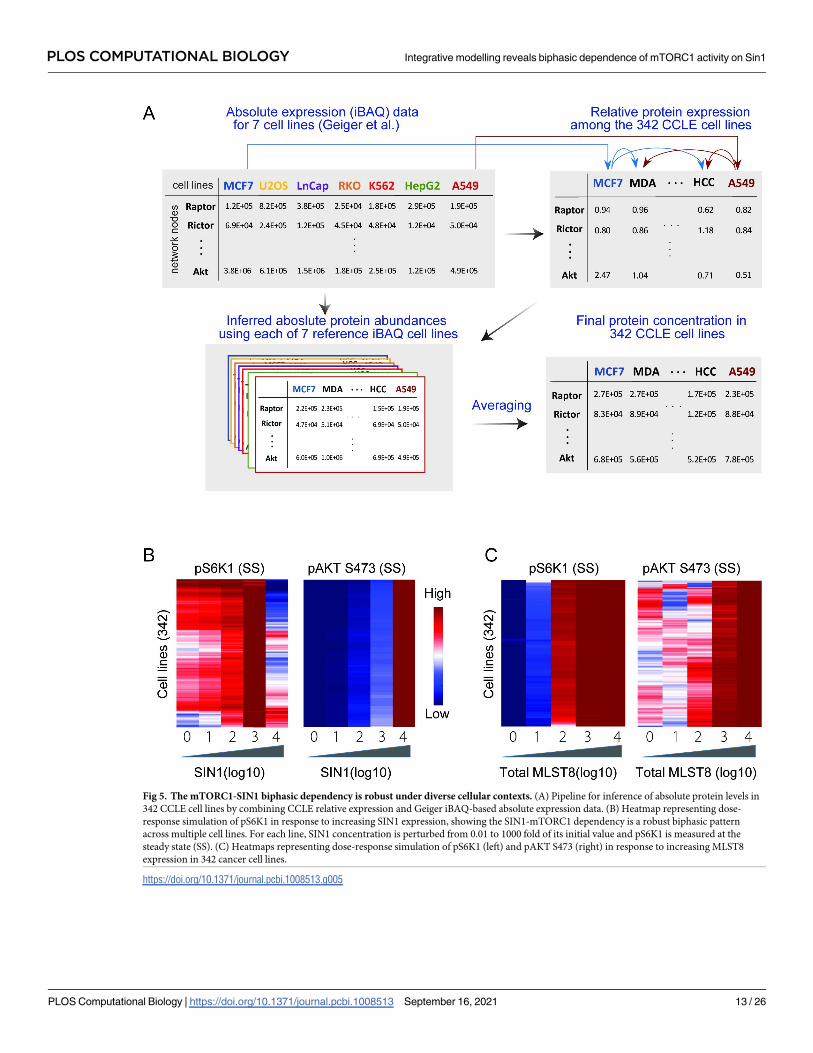
Fig 5. The mTORC1-SIN1 biphasic dependency is robust under diverse cellular contexts. (A) Pipeline for inference of absolute protein levels in
342 CCLE cell lines by combining CCLE relative expression and Geiger iBAQ-based absolute expression data. (B) Heatmap representing dose-
response simulation of pS6K1 in response to increasing SIN1 expression, showing the SIN1-mTORC1 dependency is a robust biphasic pattern
across multiple cell lines. For each line, SIN1 concentration is perturbed from 0.01 to 1000 fold of its initial value and pS6K1 is measured at the
steady state (SS). (C) Heatmaps representing dose-response simulation of pS6K1 (left) and pAKT S473 (right) in response to increasing MLST8
expression in 342 cancer cell lines.
https://doi.org/10.1371/journal.pcbi.1008513.g005
PLOS COMPUTATIONAL BIOLOGY Integrative modelling reveals biphasic dependence of mTORC1 activity on Sin1
PLOS Computational Biology | https://doi.org/10.1371/journal.pcbi.1008513 September 16, 2021 13 / 26
Molecular factors governing the SIN1-mTORC1 biphasic dependency
A strength of a modelling approach is that potential factors controlling the emergent complex
network behaviors can be systematically tested through in silico perturbation/sensitivity analy-
sis, which would otherwise be challenging experimentally. Here, we seek to decipher the
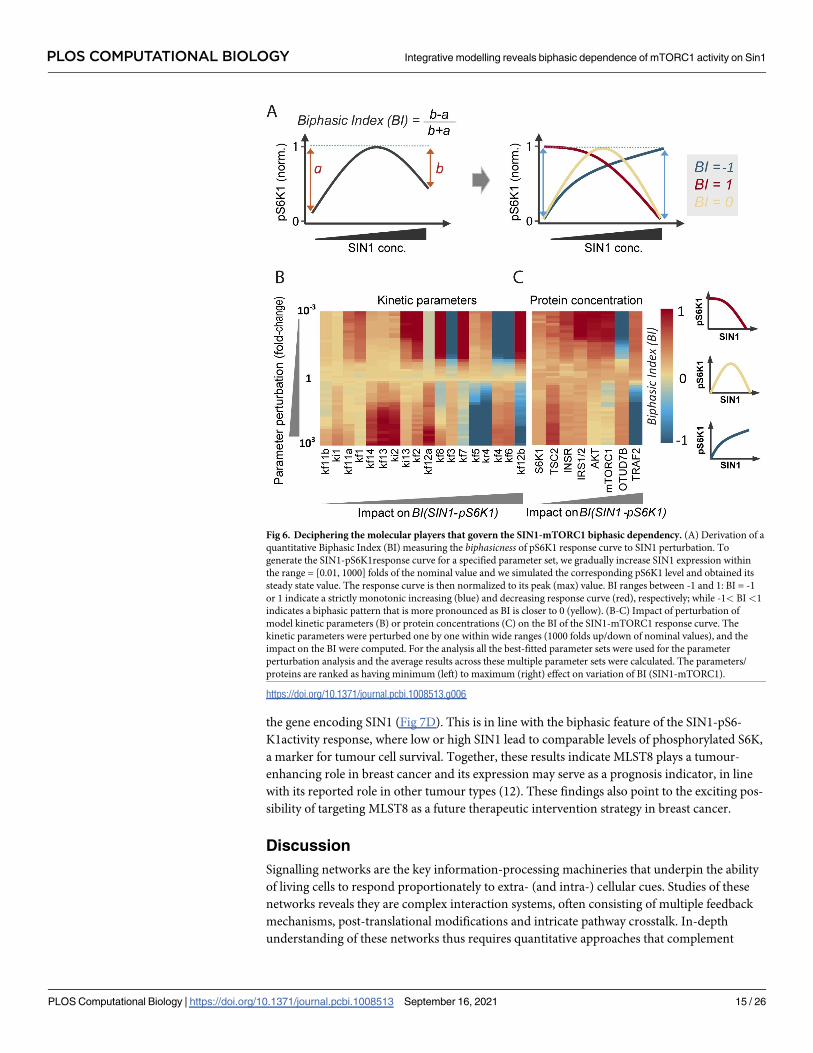
molecular players that govern the observed SIN1-mTORC1 biphasic dependency. To evaluate
a biphasic response quantitatively, we introduced a general ‘biphasic index’ (BI) that measures
the biphasicness of a response curve, as defined in Fig 6A. Since the response curve is normal-
ized to its peak (maximal) value, BI ranges between -1 and 1. BI = -1 or 1 indicate a strictly
monotonic increasing or decreasing response curve, respectively; while -1< BI<1 indicates a
biphasic pattern that becomes more pronounced as BI is closer to 0 (Fig 6A). Next, we system-
atically perturbed the model kinetic parameters representing the strength of network interac-
tions one by one within wide ranges (1000 folds up/down of nominal values) and assessed the
impact of these perturbations on the BI of the SIN1-mTORC1 response curve.
The results, displayed in Fig 6B, indicate that the parameters related to the MLST8 switch:
(de)ubiquitination of MLST8 (kf4 and kr4), MLST8-SIN1/raptor binding (kf6/kf5), and
OTUD7B activation (kf3) have the strongest impact on the shape of the SIN1-pS6K1response
curve (S5 Fig). Indeed, lowering kf3,4,6 converts the SIN1-pS6K1curve from biphasic to mono-
tonic increasing, while raising them shifts the curve to a monotonic decreasing pattern instead
(the opposite is true for kf5 and kr4). Consequently, the biphasic response exists over relatively
restricted ranges of these parameters (yellow regions, Fig 6B). In contrast, the biphasic
response persists over much wider ranges of the lower-ranked parameters, and their perturba-
tions largely shifts the curve to an increasing pattern only (yellow to red, Fig 6B), suggesting
the biphasic response is less sensitive to changes in the switch non-related parameters. Of note,
the lowest-ranked parameters (kf11b, ki1) do not significantly affect the biphasic pattern. Inter-
estingly, the sensitivity analysis further reveals that kf12a and kf12b impact the BI in opposite
ways, indicating the rate of TSC2 phosphorylation by pAKT T308 (kf12a) or the fully activated
ppAKT (kf12b) have divergent influence on the SIN1-pS6K1response. The reason for this is
that ppAKT is regulated by mTORC2 activity and therefore SIN1 concentration, whereas
pAKT T308 is independent from SIN1.
In addition, we performed similar sensitivity analysis for the model state variables (i.e.
proteins’ concentration). Fig 6C shows that in accordance with the results above, perturbing
OTUD7B and TRAF2, the primary regulators of the MLST8 (de)ubiquitination switch, most
strongly affect the BI of the SIN1-pS6K1 response curve. Collectively, these results indicate
that the MLST8 ubiquitination switch and its constituents critically govern the biphasic rela-
tionship between mTORC1 activity and SIN1 concentration.
MLST8 represents a viable therapeutic target in breast cancer
Our model simulation showed that MLST8 enhances the activity of both mTORC1 and 2 (Figs
5C and S4), suggesting it plays a tumour-promoting role. To examine this further, we interro-
gated the alteration profiles of MLST8 in cancer patients from The Cancer Genome Atlas
(TCGA). In line with our prediction, MLST8 is primarily amplified in the top frequently-
altered tumour types, including breast cancer, uterine carcinosarcoma and adrenocortical car-
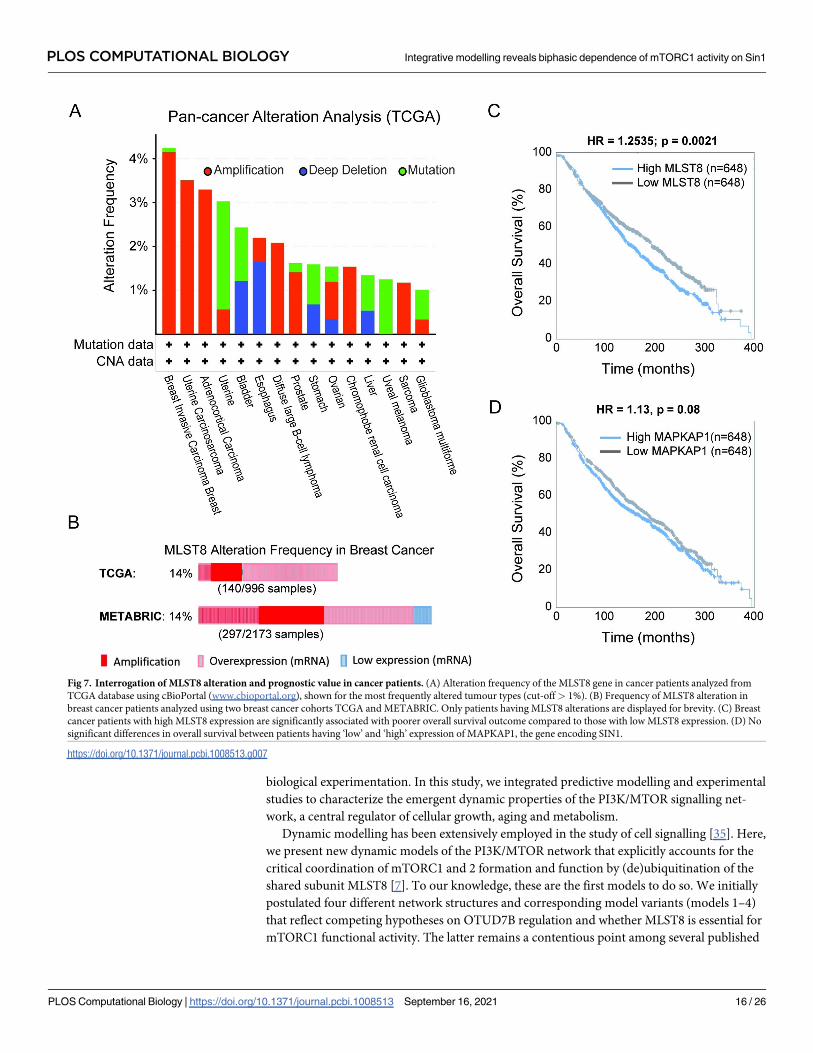
cinoma (Fig 7A). Further analysis of breast cancer, where MLST8 is most commonly ampli-
fied, shows that it is frequently overexpressed (~14%) in patients from both the TCGA and
METABRIC cohorts (Fig 7B), two of the largest publicly-available breast cancer cohorts.
Importantly, survival analysis demonstrates that high MLST8 expression is significantly associ-
ated with poorer overall survival in breast cancer patients (Fig 7C). Unlike MLST8, there are
no differences in the overall survival of patients with low and high expression of MAPKAP1,
PLOS COMPUTATIONAL BIOLOGY Integrative modelling reveals biphasic dependence of mTORC1 activity on Sin1
PLOS Computational Biology | https://doi.org/10.1371/journal.pcbi.1008513 September 16, 2021 14 / 26
the gene encoding SIN1 (Fig 7D). This is in line with the biphasic feature of the SIN1-pS6-
K1activity response, where low or high SIN1 lead to comparable levels of phosphorylated S6K,
a marker for tumour cell survival. Together, these results indicate MLST8 plays a tumour-
enhancing role in breast cancer and its expression may serve as a prognosis indicator, in line
with its reported role in other tumour types (12). These findings also point to the exciting pos-
sibility of targeting MLST8 as a future therapeutic intervention strategy in breast cancer.
Discussion
Signalling networks are the key information-processing machineries that underpin the ability
of living cells to respond proportionately to extra- (and intra-) cellular cues. Studies of these
networks reveals they are complex interaction systems, often consisting of multiple feedback
mechanisms, post-translational modifications and intricate pathway crosstalk. In-depth
understanding of these networks thus requires quantitative approaches that complement
Fig 6. Deciphering the molecular players that govern the SIN1-mTORC1 biphasic dependency. (A) Derivation of a
quantitative Biphasic Index (BI) measuring the biphasicness of pS6K1 response curve to SIN1 perturbation. To
generate the SIN1-pS6K1response curve for a specified parameter set, we gradually increase SIN1 expression within
the range = [0.01, 1000] folds of the nominal value and we simulated the corresponding pS6K1 level and obtained its
steady state value. The response curve is then normalized to its peak (max) value. BI ranges between -1 and 1: BI = -1
or 1 indicate a strictly monotonic increasing (blue) and decreasing response curve (red), respectively; while -1< BI<1
indicates a biphasic pattern that is more pronounced as BI is closer to 0 (yellow). (B-C) Impact of perturbation of
model kinetic parameters (B) or protein concentrations (C) on the BI of the SIN1-mTORC1 response curve. The
kinetic parameters were perturbed one by one within wide ranges (1000 folds up/down of nominal values), and the
impact on the BI were computed. For the analysis all the best-fitted parameter sets were used for the parameter
perturbation analysis and the average results across these multiple parameter sets were calculated. The parameters/
proteins are ranked as having minimum (left) to maximum (right) effect on variation of BI (SIN1-mTORC1).
https://doi.org/10.1371/journal.pcbi.1008513.g006
PLOS COMPUTATIONAL BIOLOGY Integrative modelling reveals biphasic dependence of mTORC1 activity on Sin1
PLOS Computational Biology | https://doi.org/10.1371/journal.pcbi.1008513 September 16, 2021 15 / 26
biological experimentation. In this study, we integrated predictive modelling and experimental
studies to characterize the emergent dynamic properties of the PI3K/MTOR signalling net-
work, a central regulator of cellular growth, aging and metabolism.
Dynamic modelling has been extensively employed in the study of cell signalling [35]. Here,
we present new dynamic models of the PI3K/MTOR network that explicitly accounts for the
critical coordination of mTORC1 and 2 formation and function by (de)ubiquitination of the
shared subunit MLST8 [7]. To our knowledge, these are the first models to do so. We initially
postulated four different network structures and corresponding model variants (models 1–4)
that reflect competing hypotheses on OTUD7B regulation and whether MLST8 is essential for
mTORC1 functional activity. The latter remains a contentious point among several published
Fig 7. Interrogation of MLST8 alteration and prognostic value in cancer patients. (A) Alteration frequency of the MLST8 gene in cancer patients analyzed from
TCGA database using cBioPortal (www.cbioportal.org), shown for the most frequently altered tumour types (cut-off> 1%). (B) Frequency of MLST8 alteration in
breast cancer patients analyzed using two breast cancer cohorts TCGA and METABRIC. Only patients having MLST8 alterations are displayed for brevity. (C) Breast
cancer patients with high MLST8 expression are significantly associated with poorer overall survival outcome compared to those with low MLST8 expression. (D) No
significant differences in overall survival between patients having ‘low’ and ‘high’ expression of MAPKAP1, the gene encoding SIN1.
https://doi.org/10.1371/journal.pcbi.1008513.g007
PLOS COMPUTATIONAL BIOLOGY Integrative modelling reveals biphasic dependence of mTORC1 activity on Sin1
PLOS Computational Biology | https://doi.org/10.1371/journal.pcbi.1008513 September 16, 2021 16 / 26

studies [9–13]. By validating model simulations against multiple experimental datasets, we
were able to discriminate among the alternative network structures and arrived at model 4 as
the most likely model as it provides the best fit to the data. Importantly, this model was subse-
quently validated by new biological experiments. Collectively, these integrative analyses dem-
onstrate that MLST8 is required for the assembly and activity of mTORC1, and the
deubiquitinase OTUD7B is stimulated through IRS1/2 rather than INSR directly (Fig 3).
Although model 4 best fitted the data among the considered models variants, it did not per-
fectly recapitulate the quantitative dynamic features of certain network nodes, e.g. mTORC2
and pTSC2 under TRAF2-deleted condition (Fig 2D). There are several possible reasons for
such discrepancy. First, while we aimed to include the salient regulatory mechanisms within
the insulin/PI3K/MTOR network, model 4 remains an abstraction of reality and a simplified
version of the real network. Second, as the involvement of TRAF2 in PI3K/MTOR signalling
has only been recently reported [7], we still lack a full mechanistic understanding of its role in
regulating the network behaviour. Since TRAF2 has diverse functions [36], it may have
unknown regulation towards pTSC2 that is independent of MLST8. Future incorporation of
these potential mechanisms will likely further improve the quality of model 4.
Using model 4 for subsequent analysis, model simulations predicted a hitherto unknown
biphasic dependency between mTORC1 activity and SIN1, a central subunit of mTORC2.
Importantly, we confirmed this prediction experimentally by gradually overexpressing SIN1 in
SIN1-/- MEF cells and measured phosphorylated S6K1 and AKT (pS473) as indicators of
mTORC1 and 2 activity, respectively. Indeed, increasing SIN1 concentration from a low level
significantly enhanced mTORC1 activity. However, beyond a critical threshold, further over-
expression of SIN1 inhibited mTORC1 activity (Fig 4A and 4D). This is in contrast to the
monotonic increase in mTORC2 activation in response to SIN1 overexpression observed in
both model simulations and experimental data. To identify the molecular factors that control
the SIN1-mTORC1 biphasic response, we performed model-based sensitivity analyses assess-
ing possible effects of changes in model kinetic parameters and state variables on the biphasic-ness of the response curve, quantified by a newly derived metric. Interestingly, we found that
the top-ranked, i.e. most dominant, parameters and state variables are primarily involved in
the regulation of the MLST8 (de)ubiquitination switch, suggesting this molecular mechanism
plays an important role in modulating the biphasic level of the SIN1-mTORC1 curve. In line
with this finding, the mechanistic explanation underlying the biphasic response stems from
the switch-mediated protein competitions and the balance of such competitions that play out
within the network. Increasing SIN1 sequesters MLST8 from raptor to form more mTORC2
and less mTORC1 at the same time; however higher levels of mTORC2 promotes stronger
AKT activation, which converts more mTORC1 molecules from inactive to active state. In the
first phase, the gain in mTORC1 activity dominates the loss in abundance, and the net effect is
an enhancement of pS6K1, while the balance is flipped in the second phase, leading to an over-
all reduction in pS6K1.
While our integrative analyses demonstrated the biphasic SIN1-pS6K1dependency using
MEF cells as the main experimental model, we wondered whether such response is robust to
cell-to-cell variability and if it is conserved under different cellular contexts. Given the rele-
vance of the PI3K/MTOR signalling network in cancer and availability of large-scale protein
expression data in cancer cell lines, we integrated relative and absolute protein abundances
from complementary proteomics studies and developed a pipeline to infer absolute protein
abundances for 342 cancer cell lines within the CCLE consortium. Using these data, we
adjusted our model for each individual cell type by changing the total expression of model pro-
teins (i.e. initial conditions) accordingly, and simulated the SIN1-pS6K1response curve for
each cell type. Simulation results predict that while the precise shape of the response curve
PLOS COMPUTATIONAL BIOLOGY Integrative modelling reveals biphasic dependence of mTORC1 activity on Sin1
PLOS Computational Biology | https://doi.org/10.1371/journal.pcbi.1008513 September 16, 2021 17 / 26
vary between the cell types, the biphasic pattern is still present in most of them, suggesting the
biphasic dependency is robust to the cell-to-cell heterogeneity in protein expression.
This biphasic (rather than monotonic) pattern may underlie the diverse and inconsistent
response of phosphorylated S6K1 to mTORC2 inhibition reported by different experimental
studies. For example, blocking mTORC2 reduced pS6K1 in breast cancer MCF7 and ZR-75-1
cells [37] as well as in non-transformed cells, including 3T3-L1 [26,38] and HEK-293 cells (3);
whereas it enhanced pS6K1 in lung cancer A549 and prostate cancer PC3 cells (35); and
induced no changes in pS6K1 in other tumour cells, including HT29 [39] and U251 [40].
Moreover, inconsistent observations were recorded even in the same cell line by different stud-
ies, e.g. as in the case of Hela [3,16] and MEF cells [9,10]. One reason for these discrepancies
may be due to the non-linear feature of biphasic input-output curves, where depending on the
starting value of the input (dose) and efficiency of knockdown/inhibition, this could either
inhibit, promote or not affect the output (response) (see S6 Fig).
Another consequence of the SIN1-pS6K1 biphasic response pattern is that the level of
pS6K1, which is indicative of mTORC1 activity, is maximized over an intermediate range of
SIN1 expression. Since the biphasic pattern was found to be present across many different can-
cer cell types, this may provide a conserved mechanism for tumour cells to sustain proliferative
and survival signalling elicited by mTORC1 against possible variation in SIN1 expression,
which can arise from the molecular heterogeneity within a cell population [41]. This property
is analogous to the biphasic response conferred by scaffold proteins to signalling cascades,
where signalling outputs can be fine-tuned by the expression level of the scaffolds [42,43]. The
existence of a biphasic relationship among network components further highlights the nonlin-
ear dependency of signalling outputs on the network conditions, emphasizing the need to
embrace biological contexts while studying cell signalling. Indeed, depending on the specific
expression of SIN1, this could lead to entirely different activation levels of mTORC1. This
notion is in contrary to the linear viewpoint that is still prevalent in cell signalling cascades,
where an ‘upstream’ node is often assumed to have a linear (either positive or negative) effect
on a downstream node regardless of the specific network context. In addition, as SIN1 repre-
sents a potential therapeutic target for cancer therapy (3), the biphasic response of pS6K1 on
SIN1 may have implication in the development of anti-SIN1 therapy. This is because therapeu-
tic inhibition of SIN1 in SIN1-high tumour cells may inadvertently upregulate pS6K1 and pro-
mote tumour cell growth.
In addition to revealing a novel functional connection between mTORC2 and mTORC1,
our model simulations further showed that MLST8 promotes the activity of both complexes
(Figs 5C and S4). This result is consistent with the alteration profiles found in cancer patients
analysed from TCGA, which show MLST8 is primarily amplified and overexpressed in the
most frequently altered tumour types, notably breast cancer (Fig 7A and 7B). Model simula-
tions further suggest that MLST8 may stimulate tumour development and/or progression
through promoted activation of both MTOR complexes, a notion in line with published data
in colon and prostate cancer [13] and our result that high MLST8 is associated with poorer
overall survival in breast cancer patients (Fig 7C). Together, these findings highlight the poten-
tial of targeting MLST8 as an anti-cancer therapeutic strategy, which is currently under investi-
gation [44].
In this study we considered SIN1 phosphorylation by AKT as the main mechanism for
mTORC2 activation [5]. However, there is another potential activation mechanism for
mTORC2 that is mediated by PIP3 [45]. To investigate whether the AKT-mTORC2 positive
feedback loop is required to reflect the experimental observations, we modified model 4 by
removing the link from AKT to mTORC2 and instead assumed that mTORC2 can be activated
by PIP3. As PIP3 was not explicitly included in our model for the sake of simplicity, we
PLOS COMPUTATIONAL BIOLOGY Integrative modelling reveals biphasic dependence of mTORC1 activity on Sin1
PLOS Computational Biology | https://doi.org/10.1371/journal.pcbi.1008513 September 16, 2021 18 / 26
assumed mTORC2 is activated by the upstream component pIRS1/2, and re-calibrated the
modified model against the same data. Simulation results of the modified model compared to
the experimental data shows there is no significant difference in fitting quality between the
modified and the original model 4 (see S7 Fig). Together, this suggests that the AKT-mTORC2
positive feedback loop is not required to reflect the experimental data, but also does not harm
the simulation results.
In conclusion, we have integrated mechanistic modelling and experimental analysis to elu-
cidate novel emergent behavior of the PI3K/MTOR signalling network. In contrast to the com-
monly-held view that mTORC2 lies upstream and is a positive regulator of mTORC1, we
found that their relationship is highly non-linear. Our results highlight the need to embrace
network-level view and integrative approaches for the study of complex signalling systems.
The new model developed here is the first that incorporates the MLST8 ubiquitination switch,
and provides a useful quantitative framework for future studies of PI3K/MTOR signalling.
Material and methods
Cell culture and viral transduction
PlatE cells were cultured in DMEM with 10% FBS, 2 mM L-GlutaMAX, 1 μg/ml puromycin
and 10 μg/ml blastcidine. SIN1-/- MEFs and C2C12 myoblast cells were cultured in DMEM
with 10% FBS, 2 mM L-GlutaMAX, non-essential amino acids, and 1 mM sodium
pyrophosphate.
For SIN1 retroviral production, PlatE cells [34] grown in 10 cm dish were transiently trans-
fected using lipofectamine 2000 (Life Technologies) according to manufacturer’s instructions
with retroviral vectors pMIG or pMIG-SIN1. Medium was replaced the next day with 6 ml
medium per dish. Virus-containing medium was collected after 2 days, followed by filtration
using a 0.45 micron filter and used immediately for infection or stored at -80˚C.
To generate SIN1 re-expression MEFs, SIN1-/- MEFs were seeded into retroviral-contain-
ing media and transduced overnight with 4 μg/ml polybrene, followed by fresh media change
the next morning.
The SIN1 low- and high-expression cells were sorted by FACS (FACSAria II) according to
the expression level of EGFP.
Plasmids, siRNA and transfection
pLentiCMV-Blast MLST8-Flag was a gift from Jin Chen (Addgene plasmid # 124915; http://
n2t.net/addgene:124915; RRID:Addgene_124915). MISSION esiRNA targeting Renilla Lucif-
erase (EHURLUC), mouse IRS1 (EMU061331) and IRS2 (EMU187631) were purchased from
Sigma.
C2C12 myoblast cells were transfected with siRNA at approximately 70–75% confluency
using TransIT-X2 (Mirus Bio) according to manufacturer’s instructions. Twenty-four hours
later, cells were transfected with HA-ubiquitin and MLST8-Flag using Lipofectamine 3000
(Life Technologies) according to manufacturer’s instructions. Cells were serum starved for 16
hours followed by insulin stimulation (100 nM, 15 min), and harvested for immunoprecipita-
tion 48 h post-transfection.
Immunoprecipitation
Whole-cell lysates were prepared in Flag IP buffer (1% NP-40, 10% glycerol, 150 mM NaCl, 50
mM Tris-Cl pH 7.4) supplemented with EDTA-free protease inhibitors and phosphatase
inhibitors. The total protein concentrations of whole-cell lysates were measured by the
PLOS COMPUTATIONAL BIOLOGY Integrative modelling reveals biphasic dependence of mTORC1 activity on Sin1
PLOS Computational Biology | https://doi.org/10.1371/journal.pcbi.1008513 September 16, 2021 19 / 26

FLUOstar Omega microplate reader (BMG LABTECH) using BCA assay reagent. Lysates were
incubated with Flag antibody overnight at 4˚C followed by 1hour incubation with protein G
beads (GE Healthcare). Immunoprecipitates were washed three times with IP buffer followed
twice washing with PBS buffer before being resolved by SDS–PAGE and immunoblotted with
indicated antibodies.
Western blotting
Samples were separated by SDS–PAGE and transferred to PVDF membranes. The membranes
were incubated in a blocking buffer containing 5% skim milk in Tris-buffered saline (TBS)
and immunoblotted with the relevant antibodies overnight at 4˚C in the blocking buffer con-
taining 5% BSA–0.1% Tween in TBS buffer. After incubation, the membranes were washed
and incubated with HRP-labeled secondary antibodies for 1 h and then detected by Super-
Signal West Pico Chemiluminescent Substrate. In some cases, IR dye 800-conjugated second-
ary antibodies were used and then scanned at the 800-nm channels using an Odyssey IR
imager. Immunoblots were quantified by Image studio software and statistical significance was
assessed using Student’s t test.
The following antibodies were used: SIN1 (Millipore, 07–2276), S6K1(CST, 2708),
S6K-T389 (CST, 9234), AKT (CST, 4051), AKT-S473 (CST, 4058), AKT-T308 (CST, 9275),
PRAS40 (CST, 2691), PRAS40-T246 (CST, 2997), IRS1 (CST, 3407), IRS2 (CST, 3089), MLST8
(CST, 3274), HA (CST, 3724)) and 14-3-3 (Santa Cruz, sc-629).
Mathematical modelling and parameter estimation
We constructed four mechanistic models to interrogate different possible network structures
of the PI3K/MTOR signalling pathway. With these models we examined whether: (i) The
OTUD7B activity is regulated by the S6K1 negative feedback in the pathway, and (ii) MLST8 is
required for mTORC1 kinase activity. With these four models we assessed the 4 different pos-
sible combinations. The models are constructed using ordinary differential equations (ODEs).
The ODEs and the best-fitted parameter sets for each model are given in S1 and S2 Tables. The
model formulation and calibration processes were implemented in MATLAB (The Math-
Works. Inc. 2019a).The IQM toolbox (http://www.intiquan.com/intiquan-tools/) was used to
compile the IQM file for a MEX file which makes the simulation much faster.
Model training is the process of estimation of the model’s parameters. As a result of model
calibration a ‘best-fitted’ model will be produced that best recapitulates biological data used for
model training. To calibrate the model parameters objective function J was used that quantifies
the difference between the model simulation results and corresponding experimental measure-
ments:
JðpÞ ¼XM
j¼1
XN
i¼1
ðyDj;i � yjðti; pÞÞ2
The model parameters value were estimated to minimize the objective function value. Here,
M is the number of experimental data sets for fitting and N denotes the number of time points
in a experimental data set. yj(ti, p) indicates the model simulations of the component j at the
time point ti while parameter set p is used for the simulation. Finally, yDj;i is the experimental
data of component j at time point ti and wj is the weight of the component j.For each model, parameter estimation was undertaken using a genetic algorithm (GA)-
based optimization procedure (Man et al., 1996; Reali et al., 2017; Shin et al., 2014). For this,
the Global Optimization Toolbox and the ga function in MATLAB were used. The GA runs
PLOS COMPUTATIONAL BIOLOGY Integrative modelling reveals biphasic dependence of mTORC1 activity on Sin1
PLOS Computational Biology | https://doi.org/10.1371/journal.pcbi.1008513 September 16, 2021 20 / 26
were implemented with population size set to 200 and the generation number set to 800.
Because there likely exist multiple optimal parameter sets that fit the experimental data more
or less equally well, we repeated the GA procedure 500 independent times for each model in
order to identify as many best-fitted parameter sets as possible for subsequent ensemble simu-
lations. Selection of these best-fitted sets for further analysis was based on two key criteria: (i)
first, the objective function values (i.e. the numeric measures of the aggregated discrepancy
between the simulated and experimental values) for each of these sets must be under a cut-off
threshold, as shown in S8 Fig; and (ii) second, they should also pass a qualitative assessment
based on visual inspection of how well the simulated curves match the experimental data
curves. The reason for including the latter is because sometimes a fitted parameter set can
yield a low objective function value but does not display good qualitative fitting. Combination
of both quantitative and qualitative assessments allowed us to arrive at high-confident best-fit-
ted parameter sets for each model. As a result, we selected 189, 198, 12, 13 best-fitted parame-
ter sets for Model 1, 2, 3 and 4 for further simulation and analysis, respectively. The same cut-
off threshold for the objective function value was applied across the models and determined
based on visual assessment of the fitting quality.
To examine the similarity between the chosen best-fitted parameter sets for model 4, we
performed hierarchical clustering analysis of these sets. S9 Fig shows that the parameter sets
were quite heterogeneous and poorly clustered, suggesting the model is non-identifiable as
expected and our genetic algorithm has managed to unbiasedly explore a diverse landscape of
local minima in the high-dimensional parameter space, again highlighting the need to consider
multiple best-fitted sets.
Inference of protein concentrations for model customization
We inferred the absolute protein abundance of the proteins of interest (in this case the network
nodes) for each of the 342 cancer cell lines in the CCLE database according to the following
formula:
Protein Concentration i; xð Þ ¼1
7
X7
j¼1
IBAQði; jÞ �CCLEði; xÞCCLEði; jÞ
¼
IBAQði;MCF7Þ
CCLEði;MCF7Þþ
IBAQði;U2OSÞCCLEði;U2OSÞ þ � � � þ
IBAQði;A549Þ
CCLEði;A549Þ
7� CCLE i; xð Þ
Here i and x denote protein i in cell line x, which is one of the 342 cell lines obtained from
the CCLE database. IBAQ(i, j) denotes the absolute abundance (copies number) of protein i in
cell line j, where j represents one of the seven cell lines obtained from the iBAQ dataset: j =
(MCF7, U2OS, LnCap, RKO, K562, HepG2 or A549); and CCLE(i, j) is the relative expression
of protein i in cell line j obtained from the CCLE database.
S10 Fig displays the inferred concentration for the relevant proteins for four examples cell
lines, which have been averaged across 7 values obtained by using each of the 7 reference cell
lines. Here, error bars represent the standard errors across the 7 replicates. As we can see con-
sistently between the proteins, the standard errors are relatively small indicating that the indi-
vidual inferred values are similar along the 7 replicates.
Next, for each cell line we converted the protein abundance numbers into protein concen-
trations in nanomole (nM), which is the unit used in our models. For this, we utilised the fol-
lowing formula, which keeps the total protein concentration in each cell line to be the same as
that in the MEF cell:
Protein Concentration i; xð Þ ¼Absolute abundance of protein ðiÞ in cell line ðxÞ � 100 ðnMÞAverage of the absolute proteins concentration in cell line ðxÞ
PLOS COMPUTATIONAL BIOLOGY Integrative modelling reveals biphasic dependence of mTORC1 activity on Sin1
PLOS Computational Biology | https://doi.org/10.1371/journal.pcbi.1008513 September 16, 2021 21 / 26
Sensitivity analysis
To investigate the molecular factors that govern the biphasic pattern between SIN1 concentra-
tion and mTORC1 activity we used sensitivity analysis. First, we defined a biphasic index (BI)
that calculates the biphasicness of the pS6K1-SIN1 concentration response curve. For this,
SIN1 concentration is perturbed from 0.01 to 1000 of its initial value and pS6K1 is measured
to obtain the pS6K1-SIN1 concentration curve (Fig 6A). In the next step, this curve is normal-
ized to 1 and BI index is calculated as defined in Fig 6A.
Next, value of each model kinetic parameter is perturbed from 0.001 to 1000 of its nominal
value and the BI is calculated for each parameter value. Finally, the parameters are ranked
based on their impact on variation of BI index after perturbing their value.
mTORC1 total kinase activity
The kinase activity of the mTORC1 is defined as follows:
Total mTORC1 kinase activity potential¼ ðmTORC1 abundancesÞ � ðactivity potential per one mTORC1 moleculeÞ ð1Þ
which indicates the total activity of mTORC1 is the product of the activity of each mTORC1
molecule and the abundance of mTORC1 in the cell.
Patient data analysis
For survival analysis, mRNA expression and associated overall survival data for breast cancer
patients from the METABRIC trial [46] were downloaded from the cBioPortal for Cancer
Genomics portal (www.cbioportal.org). The patients were divided into 2 groups with ‘low’
(below the 34th percentile) and ‘high’ (above the 66th percentile) expression of the MLST8 (or
MAPKAP1) gene. Accordingly, out of a total of 1904 cases available for analysis, 648 met the
high-group criteria and 648 met the low-group criteria for inclusion into the analysis. Analysis
comparing overall survival between these groups was implemented using a Log-rank test (with
p< 0.05 considered significant). The Log-rank test statistics and survival curves were gener-
ated using Kaplan-Meier estimate and implemented using the Log rank package (https://www.
github.com/dnafinder/logrank) in MATLAB 2019b.
Supporting information
S1 Fig. Quantified time -course data of various network components following insulin
stimulation (100nM) in WT MEFs, reproduced from Western blot data representative of
at least three biological replicates obtained from [7]. Phosphorylated (p) and ubiquitinated
(Ubi) levels of each protein were normalized to the corresponding total protein levels. Each
curve was normalized by their maximal (peak) value.
(TIF)
S2 Fig. Quantified time-course data of the indicated proteins following EGF stimulation in
WT and TRAF2 knocked-out MEF cells, reproduced from representative experimental
data obtained from [7]. Phosphorylated (p) levels of each protein were normalized to the cor-
responding total protein levels. The curves under TRAF2 knockout condition were normalized
by their corresponding maximal (peak) values, and the WT curves were scaled accordingly.
(TIF)
S3 Fig. Visual depiction of signal flow within the PI3K/MTOR network. (A) In response to
insulin stimulation, phosphorylated AKT increases. This leads to enhanced TSC2
PLOS COMPUTATIONAL BIOLOGY Integrative modelling reveals biphasic dependence of mTORC1 activity on Sin1
PLOS Computational Biology | https://doi.org/10.1371/journal.pcbi.1008513 September 16, 2021 22 / 26
phosphorylation, relief of inhibitory effect on mTORC1, subsequent higher mTORC1 activa-
tion and phosphorylation of its key substrate S6K1. (B) Compensatory mechanism following
TRAF2 knockout that results in no change in mTORC1 activity dynamics as compared to WT
cells: TRAF2 deletion reduces mTORC1 formation and abundance because of lower ubiquiti-
nated MLST8 but at the same time leads to stronger mTORC1 activity (per molecule) due to
higher AKT phosphorylation; and the net effect is no significant change in the phosphoryla-
tion of S6K1.
(TIF)
S4 Fig. Dose-response simulations of the steady-state values of pS6K1 and pAKT S473 in
response to increasing raptor, OTUD7B or MLST8. Total raptor, OTUD7B and MLST8 con-
centrations were perturbed within 100 folds up/down of their initial values. The pS6K1 and
pAKT S473 curves for each parameter set were normalized by their corresponding maximal
(peak) values and then average and S.E.M. were calculated at each concentration.
(TIF)
S5 Fig. A reaction schematic of model 4 with overlay of the kinetic parameters. Normal
arrows indicate positive regulation, bar-headed arrows indicate negative regulation. The red
lines indicate the links that exert strongest impacts on the biphasicness (i.e. BI) of the SIN1-m-
TORC1 dependency.
(TIF)
S6 Fig. Biphasic response gives rise to highly context-dependent effect of mTORC2 block-
ade. Depending on the initial state of mTORC2 (e.g. SIN1 level) and the efficiency of blockade,
mTORC2 inhibition may result in upregulation, downregulation, or even no change in the
phosphorylation level of the key mTORC1 substrate S6K1. This potentially explains the
diverse, seemingly conflicting effect of mTORC2 blockade on mTORC1 activity reported in
multiple previous studies.
(TIF)
S7 Fig. Comparison of model performance of the original and modified model 4, which
describe activation of mTORC2 by pAKT T308 or pIRS1/2, respectively. (A) Model simula-
tions (blue curves) using best-fitted parameter sets as compared to the quantified experimental
data (red curves). (B) Simulations of the dynamic response of various network components to
insulin stimulation in control (WT MEF cells, blue lines) condition and when TRAF2 is
deleted (TRAF2-/- MEF cells, red lines), in comparison to the corresponding experimental
data (right panels), shown for the modified and original model 4.
(TIF)
S8 Fig. Result of the 500 independent GA-based optimization runs for the four models.
Per model, each GA run produced a best-fitted parameter set, which were then sorted by their
corresponding objective function values. The threshold cut-off was determined based on visual
assessment of fitting quality, and the parameter sets with objective function value under this
threshold were selected for further analysis.
(TIF)
S9 Fig. Clustering the best-fitted parameter sets of Model 4. Numbers on the right indicate
objective function values corresponding to the parameter sets. OFVs: Objective Function Val-
ues.
(TIF)
PLOS COMPUTATIONAL BIOLOGY Integrative modelling reveals biphasic dependence of mTORC1 activity on Sin1
PLOS Computational Biology | https://doi.org/10.1371/journal.pcbi.1008513 September 16, 2021 23 / 26
S10 Fig. Inferred mean concentration and standard errors of the model proteins based on
analysing CCLE and iBAQ data for four representative cell lines.
(TIF)
S1 Table. Reactions and rate equations of the PI3K/MTOR pathway model.
(DOCX)
S2 Table. Ordinary differential equations of the PI3K/MTOR pathway model. The reaction
rates are given in S1 Table. The initial conditions are representative values.
(DOCX)
S1 File. Best fitted parameter sets for Models 1–4.
(XLSX)
Acknowledgments
The results shown here are in part based upon data generated by the TCGA Research Network:
https://www.cancer.gov/tcga.
Author Contributions
Conceptualization: Milad Ghomlaghi, Lan K. Nguyen.
Formal analysis: Milad Ghomlaghi, Guang Yang, Sung-Young Shin, Lan K. Nguyen.
Funding acquisition: Lan K. Nguyen.
Methodology: Milad Ghomlaghi, Guang Yang, Sung-Young Shin, Lan K. Nguyen.
Project administration: Lan K. Nguyen.
Supervision: Sung-Young Shin, David E. James, Lan K. Nguyen.
Writing – original draft: Milad Ghomlaghi, Lan K. Nguyen.
Writing – review & editing: Milad Ghomlaghi, Guang Yang, Lan K. Nguyen.
References1. Kim LC, Cook RS, Chen J. mTORC1 and mTORC2 in cancer and the tumor microenvironment. Onco-
gene. 2017; 36(16):2191–201. https://doi.org/10.1038/onc.2016.363 PMID: 27748764
2. Kim D-H, Sarbassov DD, Ali SM, King JE, Latek RR, Erdjument-Bromage H, et al. mTOR interacts with
raptor to form a nutrient-sensitive complex that signals to the cell growth machinery. Cell. 2002; 110
(2):163–75. https://doi.org/10.1016/s0092-8674(02)00808-5 PMID: 12150925
3. Yang Q, Inoki K, Ikenoue T, Guan K-L. Identification of Sin1 as an essential TORC2 component
required for complex formation and kinase activity. Genes & development. 2006; 20(20):2820–32.
https://doi.org/10.1101/gad.1461206 PMID: 17043309
4. Sarbassov DD, Ali SM, Kim D-H, Guertin DA, Latek RR, Erdjument-Bromage H, et al. Rictor, a novel
binding partner of mTOR, defines a rapamycin-insensitive and raptor-independent pathway that regu-
lates the cytoskeleton. Current biology. 2004; 14(14):1296–302. https://doi.org/10.1016/j.cub.2004.06.
054 PMID: 15268862
5. Yang G, Murashige DS, Humphrey SJ, James DE. A positive feedback loop between Akt and mTORC2
via SIN1 phosphorylation. Cell reports. 2015; 12(6):937–43. https://doi.org/10.1016/j.celrep.2015.07.
016 PMID: 26235620
6. Humphrey SJ, Yang G, Yang P, Fazakerley DJ, Stockli J, Yang JY, et al. Dynamic adipocyte phospho-
proteome reveals that Akt directly regulates mTORC2. Cell metabolism. 2013; 17(6):1009–20. https://
doi.org/10.1016/j.cmet.2013.04.010 PMID: 23684622
7. Wang B, Jie Z, Joo D, Ordureau A, Liu P, Gan W, et al. TRAF2 and OTUD7B govern a ubiquitin-depen-
dent switch that regulates mTORC2 signalling. Nature. 2017; 545(7654):365. https://doi.org/10.1038/
nature22344 PMID: 28489822
PLOS COMPUTATIONAL BIOLOGY Integrative modelling reveals biphasic dependence of mTORC1 activity on Sin1
PLOS Computational Biology | https://doi.org/10.1371/journal.pcbi.1008513 September 16, 2021 24 / 26

8. Wang T, Blumhagen R, Lao U, Kuo Y, Edgar BA. LST8 regulates cell growth via target-of-rapamycin
complex 2 (TORC2). Molecular and cellular biology. 2012; 32(12):2203–13. https://doi.org/10.1128/
MCB.06474-11 PMID: 22493059
9. Guertin DA, Stevens DM, Thoreen CC, Burds AA, Kalaany NY, Moffat J, et al. Ablation in mice of the
mTORC components raptor, rictor, or mLST8 reveals that mTORC2 is required for signaling to Akt-
FOXO and PKCα, but not S6K1. Developmental cell. 2006; 11(6):859–71. https://doi.org/10.1016/j.
devcel.2006.10.007 PMID: 17141160
10. Jacinto E, Facchinetti V, Liu D, Soto N, Wei S, Jung SY, et al. SIN1/MIP1 maintains rictor-mTOR com-
plex integrity and regulates Akt phosphorylation and substrate specificity. Cell. 2006; 127(1):125–37.
https://doi.org/10.1016/j.cell.2006.08.033 PMID: 16962653
11. Hwang Y, Kim LC, Song W, Edwards DN, Cook RS, Chen J. Disruption of the scaffolding function of
mLST8 selectively inhibits mTORC2 assembly and function and suppresses mTORC2-dependent
tumor growth in vivo. Cancer research. 2019; 79(13):3178–84. https://doi.org/10.1158/0008-5472.
CAN-18-3658 PMID: 31085701
12. Kim D-H, Sarbassov DD, Ali SM, Latek RR, Guntur KV, Erdjument-Bromage H, et al. GβL, a positive
regulator of the rapamycin-sensitive pathway required for the nutrient-sensitive interaction between rap-
tor and mTOR. Molecular cell. 2003; 11(4):895–904. https://doi.org/10.1016/s1097-2765(03)00114-x
PMID: 12718876
13. Kakumoto K, Ikeda J-i, Okada M, Morii E, Oneyama C. mLST8 promotes mTOR-mediated tumor pro-
gression. PloS one. 2015; 10(4):e0119015. https://doi.org/10.1371/journal.pone.0119015 PMID:
25906254
14. Sulaimanov N, Klose M, Busch H, Boerries M. Understanding the mTOR signaling pathway via mathe-
matical modeling. Wiley Interdisciplinary Reviews: Systems Biology and Medicine. 2017; 9(4):e1379.
https://doi.org/10.1002/wsbm.1379 PMID: 28186392
15. Dalle Pezze P, Sonntag AG, Thien A, Prentzell MT, Godel M, Fischer S, et al. A dynamic network
model of mTOR signaling reveals TSC-independent mTORC2 regulation. Sci Signal. 2012; 5(217):
ra25–ra. https://doi.org/10.1126/scisignal.2002469 PMID: 22457331
16. Tato I, Bartrons R, Ventura F, Rosa JL. Amino acids activate mammalian target of rapamycin complex
2 (mTORC2) via PI3K/Akt signaling. Journal of Biological Chemistry. 2011; 286(8):6128–42. https://doi.
org/10.1074/jbc.M110.166991 PMID: 21131356
17. Dalle Pezze P, Ruf S, Sonntag AG, Langelaar-Makkinje M, Hall P, Heberle AM, et al. A systems study
reveals concurrent activation of AMPK and mTOR by amino acids. Nature communications. 2016;
7:13254. https://doi.org/10.1038/ncomms13254 PMID: 27869123
18. Nyman E, Cedersund G, Strålfors P. Insulin signaling–mathematical modeling comes of age. Trends in
Endocrinology & Metabolism. 2012; 23(3):107–15.
19. Nyman E, Rajan MR, Fagerholm S, Brannmark C, Cedersund G, Stralfors P. A single mechanism can
explain network-wide insulin resistance in adipocytes from obese patients with type 2 diabetes. Journal
of Biological Chemistry. 2014:jbc. M114. 608927. https://doi.org/10.1074/jbc.M114.608927 PMID:
25320095
20. Rajan MR, Nyman E, Kjølhede P, Cedersund G, Strålfors P. Systems-wide experimental and modeling
analysis of insulin signaling through Forkhead Box Protein O1 (FOXO1) in human adipocytes, normally
and in type 2 diabetes. Journal of Biological Chemistry. 2016; 291(30):15806–19.
21. Magnusson R, Gustafsson M, Cedersund G, Strålfors P, Nyman E. Cross-talks via mTORC2 can
explain enhanced activation in response to insulin in diabetic patients. Bioscience reports. 2017; 37(1):
BSR20160514. https://doi.org/10.1042/BSR20160514 PMID: 27986865
22. Varusai TM, Nguyen LK. Dynamic modelling of the mTOR signalling network reveals complex emergent
behaviours conferred by DEPTOR. Scientific reports. 2018; 8(1):643. https://doi.org/10.1038/s41598-
017-18400-z PMID: 29330362
23. Jacinto E, Loewith R, Schmidt A, Lin S, Ruegg MA, Hall A, et al. Mammalian TOR complex 2 controls
the actin cytoskeleton and is rapamycin insensitive. Nature cell biology. 2004; 6(11):1122. https://doi.
org/10.1038/ncb1183 PMID: 15467718
24. Abou-Faycal C, Hatat A-S, Gazzeri S, Eymin B. Splice variants of the RTK family: their role in tumour
progression and response to targeted therapy. International journal of molecular sciences. 2017; 18
(2):383. https://doi.org/10.3390/ijms18020383 PMID: 28208660
25. Yudushkin I. Getting the Akt together: guiding intracellular Akt activity by PI3K. Biomolecules. 2019; 9
(2):67. https://doi.org/10.3390/biom9020067 PMID: 30781447
26. Kearney AL, Cooke KC, Norris DM, Zadoorian A, Krycer JR, Fazakerley DJ, et al. Serine 474 phosphor-
ylation is essential for maximal Akt2 kinase activity in adipocytes. Journal of Biological Chemistry. 2019;
294(45):16729–39. https://doi.org/10.1074/jbc.RA119.010036 PMID: 31548312
PLOS COMPUTATIONAL BIOLOGY Integrative modelling reveals biphasic dependence of mTORC1 activity on Sin1
PLOS Computational Biology | https://doi.org/10.1371/journal.pcbi.1008513 September 16, 2021 25 / 26
27. Shah OJ, Hunter T. Turnover of the active fraction of IRS1 involves raptor-mTOR-and S6K1-dependent
serine phosphorylation in cell culture models of tuberous sclerosis. Molecular and cellular biology.
2006; 26(17):6425–34. https://doi.org/10.1128/MCB.01254-05 PMID: 16914728
28. Hsu PP, Kang SA, Rameseder J, Zhang Y, Ottina KA, Lim D, et al. The mTOR-regulated phosphopro-
teome reveals a mechanism of mTORC1-mediated inhibition of growth factor signaling. Science. 2011;
332(6035):1317–22. https://doi.org/10.1126/science.1199498 PMID: 21659604
29. Yu Y, Yoon S-O, Poulogiannis G, Yang Q, Ma XM, Villen J, et al. Phosphoproteomic analysis identifies
Grb10 as an mTORC1 substrate that negatively regulates insulin signaling. Science. 2011; 332
(6035):1322–6. https://doi.org/10.1126/science.1199484 PMID: 21659605
30. Liu P, Gan W, Inuzuka H, Lazorchak AS, Gao D, Arojo O, et al. Sin1 phosphorylation impairs mTORC2
complex integrity and inhibits downstream Akt signalling to suppress tumorigenesis. Nat Cell Biol. 2013;
15(11):1340–50. Epub 2013/10/29. https://doi.org/10.1038/ncb2860 PMID: 24161930; PubMed Central
PMCID: PMC3827117.
31. Klipp E. Systems biology: a textbook2016.
32. Schneider CA, Rasband WS, Eliceiri KW. NIH Image to ImageJ: 25 years of image analysis. Nature
methods. 2012; 9(7):671–5. https://doi.org/10.1038/nmeth.2089 PMID: 22930834
33. Nusinow DP, Szpyt J, Ghandi M, Rose CM, McDonald ER 3rd, Kalocsay M, et al. Quantitative Proteo-
mics of the Cancer Cell Line Encyclopedia. Cell. 2020; 180(2):387–402 e16. Epub 2020/01/25. https://
doi.org/10.1016/j.cell.2019.12.023 PMID: 31978347.
34. Schwanhausser B, Busse D, Li N, Dittmar G, Schuchhardt J, Wolf J, et al. Global quantification of mam-
malian gene expression control. Nature. 2011; 473(7347):337–42. https://doi.org/10.1038/nature10098
PMID: 21593866
35. Janes KA, Lauffenburger DA. Models of signalling networks–what cell biologists can gain from them
and give to them. Journal of cell science. 2013; 126(9):1913–21.
36. Xie P. TRAF molecules in cell signaling and in human diseases. Journal of molecular signaling. 2013; 8
(1):7. https://doi.org/10.1186/1750-2187-8-7 PMID: 23758787
37. Miao-chong JL, Rojas KS, Cerione RA, Wilson KF. Identification of mTORC2 as a necessary compo-
nent of HRG/ErbB2-dependent cellular transformation. Molecular Cancer Research. 2014; 12(6):940–
52. https://doi.org/10.1158/1541-7786.MCR-13-0555 PMID: 24615340
38. Burkhart DL, Sage J. Cellular mechanisms of tumour suppression by the retinoblastoma gene. Nature
Reviews Cancer. 2008; 8(9):671. https://doi.org/10.1038/nrc2399 PMID: 18650841
39. Sarbassov DD, Guertin DA, Ali SM, Sabatini DM. Phosphorylation and regulation of Akt/PKB by the ric-
tor-mTOR complex. Science. 2005; 307(5712):1098–101. https://doi.org/10.1126/science.1106148
PMID: 15718470
40. Tanaka K, Babic I, Nathanson D, Akhavan D, Guo D, Gini B, et al. Oncogenic EGFR signaling activates
an mTORC2–NF-κB pathway that promotes chemotherapy resistance. Cancer discovery. 2011; 1
(6):524–38. https://doi.org/10.1158/2159-8290.CD-11-0124 PMID: 22145100
41. Norris D, Yang P, Shin S-Y, Kearney AL, Kim HJ, Geddes T, et al. Signaling Heterogeneity is Defined
by Pathway Architecture and Intercellular Variability in Protein Expression. Iscience. 2021; 24
(2):102118. https://doi.org/10.1016/j.isci.2021.102118 PMID: 33659881
42. Good MC, Zalatan JG, Lim WA. Scaffold proteins: hubs for controlling the flow of cellular information.
Science. 2011; 332(6030):680–6. https://doi.org/10.1126/science.1198701 PMID: 21551057
43. Levchenko A, Bruck J, Sternberg PW. Scaffold proteins may biphasically affect the levels of mitogen-
activated protein kinase signaling and reduce its threshold properties. Proceedings of the National
Academy of Sciences. 2000; 97(11):5818–23. https://doi.org/10.1073/pnas.97.11.5818 PMID:
10823939
44. Sapam TD, Velmurugan Ilavarasi A, Palaka BK, Elumalai E, Kanika ND, Ampasala DR. Identifying
novel small molecule antagonists for mLST8 protein using computational approaches. Journal of
Receptors and Signal Transduction. 2018; 38(1):1–11. https://doi.org/10.1080/10799893.2017.
1387920 PMID: 29041842
45. Liu P, Gan W, Chin YR, Ogura K, Guo J, Zhang J, et al. PtdIns (3, 4, 5) P3-dependent activation of the
mTORC2 kinase complex. Cancer discovery. 2015:CD-15-0460. https://doi.org/10.1158/2159-8290.
CD-15-0460 PMID: 26293922
46. Pereira B, Chin S-F, Rueda OM, Vollan H-KM, Provenzano E, Bardwell HA, et al. The somatic mutation
profiles of 2,433 breast cancers refine their genomic and transcriptomic landscapes. Nature communi-
cations. 2016; 7(1):1–16. https://doi.org/10.1038/ncomms11908 PMID: 27264733
PLOS COMPUTATIONAL BIOLOGY Integrative modelling reveals biphasic dependence of mTORC1 activity on Sin1
PLOS Computational Biology | https://doi.org/10.1371/journal.pcbi.1008513 September 16, 2021 26 / 26
Related Documents