Dynamic in vivo imaging of cerebral blood flow and blood–brain barrier permeability Ofer Prager a,1 , Yoash Chassidim a,c,1 , Chen Klein a , Haviv Levi a , Ilan Shelef c , and Alon Friedman a,b,* a Department of Physiology, Soroka University Medical Center and Zlotowski Center for Neuroscience, Ben-Gurion University of the Negev, Beer-Sheva, Israel b Department of Neurosurgery, Soroka University Medical Center and Zlotowski Center for Neuroscience, Ben-Gurion University of the Negev, Beer-Sheva, Israel c Department of Neuroradiology, Soroka University Medical Center and Zlotowski Center for Neuroscience, Ben-Gurion University of the Negev, Beer-Sheva, Israel Abstract The brain is characterized by an extremely rich blood supply, regulated by changes in blood vessel diameter and blood flow, depending on metabolic demands. The blood–brain barrier (BBB)—a functional and structural barrier separating the intravascular and neuropil compartments— characterizes the brain's vascular bed and is essential for normal brain functions. Disruptions to the regional cerebral blood supply, to blood drainage and to BBB properties have been described in most common neurological disorders, but there is a lack of quantitative methods for assessing blood flow dynamics and BBB permeability in small blood vessels under both physiological and pathological conditions. Here, we present a quantitative image analysis approach that allows the characterization of relative changes in the regional cerebral blood flow (rCBF) and BBB properties in small surface cortical vessels. In experiments conducted using the open window technique in rats, a fluorescent tracer was injected into the tail vein, and images of the small vessels at the surface of the cortex were taken using a fast CCD camera. Pixel-based image analysis included registration and characterization of the changes in fluorescent intensity, followed by cluster analysis. This analysis enabled the characterization of rCBF in small arterioles and venules and changes in BBB permeability. The method was implemented successfully under experimental conditions, including increased rCBF induced by neural stimulation, bile salt- induced BBB breakdown, and photothrombosis-mediated local ischemia. The new approach may be used to study changes in rCBF, neurovascular coupling and BBB permeability under normal and pathological brain conditions. Introduction Brain metabolism and normal function is critically dependent on proper functioning of the neurovascular unit (Iadecola, 2004). This unit comprises the cerebral circulation, including the pial and intraparenchymal cerebral blood vessels with their extrinsic and intrinsic innervation, perivascular pericytes, astrocytes and surrounding neurons. The regional © 2009 Elsevier Inc. All rights reserved. * Corresponding author. Department of Physiology, Faculty of Health Sciences, Ben-Gurion University of the Negev, Beer-Sheva 84105, Israel. Fax: +972 8 6479883. [email protected] (A. Friedman). 1 The first two authors contributed equally to the manuscript. Appendix A. Supplementary data Supplementary data associated with this article can be found, in the online version, at doi:10.1016/j.neuroimage.2009.08.009. NIH Public Access Author Manuscript Neuroimage. Author manuscript; available in PMC 2013 May 07. Published in final edited form as: Neuroimage. 2010 January 1; 49(1): 337–344. doi:10.1016/j.neuroimage.2009.08.009. NIH-PA Author Manuscript NIH-PA Author Manuscript NIH-PA Author Manuscript

Welcome message from author
This document is posted to help you gain knowledge. Please leave a comment to let me know what you think about it! Share it to your friends and learn new things together.
Transcript

Dynamic in vivo imaging of cerebral blood flow and blood–brainbarrier permeability
Ofer Pragera,1, Yoash Chassidima,c,1, Chen Kleina, Haviv Levia, Ilan Shelefc, and AlonFriedmana,b,*
aDepartment of Physiology, Soroka University Medical Center and Zlotowski Center forNeuroscience, Ben-Gurion University of the Negev, Beer-Sheva, IsraelbDepartment of Neurosurgery, Soroka University Medical Center and Zlotowski Center forNeuroscience, Ben-Gurion University of the Negev, Beer-Sheva, IsraelcDepartment of Neuroradiology, Soroka University Medical Center and Zlotowski Center forNeuroscience, Ben-Gurion University of the Negev, Beer-Sheva, Israel
AbstractThe brain is characterized by an extremely rich blood supply, regulated by changes in blood vesseldiameter and blood flow, depending on metabolic demands. The blood–brain barrier (BBB)—afunctional and structural barrier separating the intravascular and neuropil compartments—characterizes the brain's vascular bed and is essential for normal brain functions. Disruptions to theregional cerebral blood supply, to blood drainage and to BBB properties have been described inmost common neurological disorders, but there is a lack of quantitative methods for assessingblood flow dynamics and BBB permeability in small blood vessels under both physiological andpathological conditions. Here, we present a quantitative image analysis approach that allows thecharacterization of relative changes in the regional cerebral blood flow (rCBF) and BBBproperties in small surface cortical vessels. In experiments conducted using the open windowtechnique in rats, a fluorescent tracer was injected into the tail vein, and images of the smallvessels at the surface of the cortex were taken using a fast CCD camera. Pixel-based imageanalysis included registration and characterization of the changes in fluorescent intensity, followedby cluster analysis. This analysis enabled the characterization of rCBF in small arterioles andvenules and changes in BBB permeability. The method was implemented successfully underexperimental conditions, including increased rCBF induced by neural stimulation, bile salt-induced BBB breakdown, and photothrombosis-mediated local ischemia. The new approach maybe used to study changes in rCBF, neurovascular coupling and BBB permeability under normaland pathological brain conditions.
IntroductionBrain metabolism and normal function is critically dependent on proper functioning of theneurovascular unit (Iadecola, 2004). This unit comprises the cerebral circulation, includingthe pial and intraparenchymal cerebral blood vessels with their extrinsic and intrinsicinnervation, perivascular pericytes, astrocytes and surrounding neurons. The regional
© 2009 Elsevier Inc. All rights reserved.*Corresponding author. Department of Physiology, Faculty of Health Sciences, Ben-Gurion University of the Negev, Beer-Sheva84105, Israel. Fax: +972 8 6479883. [email protected] (A. Friedman).1The first two authors contributed equally to the manuscript.
Appendix A. Supplementary dataSupplementary data associated with this article can be found, in the online version, at doi:10.1016/j.neuroimage.2009.08.009.
NIH Public AccessAuthor ManuscriptNeuroimage. Author manuscript; available in PMC 2013 May 07.
Published in final edited form as:Neuroimage. 2010 January 1; 49(1): 337–344. doi:10.1016/j.neuroimage.2009.08.009.
NIH
-PA Author Manuscript
NIH
-PA Author Manuscript
NIH
-PA Author Manuscript

cerebral blood flow (rCBF) is related to neuronal activity and metabolic demand (alsoknown as “neurovascular coupling,” see Baskurt and Meiselman, 2003). In addition, therCBF is autoregulated and can therefore remain constant over a wide range of perfusionpressures (Hansen-Schwartz, 2004). Regulation of the rCBF is often impaired inpathological brain conditions associated with vascular abnormalities (e.g., stroke) andprimary neuronal dysfunctions (e.g., epileptic seizure and cortical spreading depression). Forexample, it has been reported for both animals (Dreier et al., 1998, 2001, 2004) and humanpatients (Strong et al., 2007) that under specific clinical conditions (e.g., subarachnoidhemorrhage and traumatic brain injury) neurovascular coupling may be breached, leading toexacerbation of ischemic neuronal damage.
Another hallmark of vascular pathology in the brain is breakdown of the blood–brain barrier(BBB). The BBB characterizes the cerebral circulation, keeping a stable and uniqueextracellular environment within the neuropil, which is essential for normal neuronalfunctions. Clinical studies have demonstrated BBB breakdown under diverse pathologicalbrain conditions (for review see Abbott, 2002; Neuwelt, 2004). Recent animal experimentshave documented that BBB pathology may lead directly to malfunction of the neurovascularunit and hence to long-lasting changes in neuronal activity, followed by neuronal loss (Ivenset al., 2007; Seiffert et al., 2004; Tomkins et al., 2007).
Despite accumulating evidence for the role of rCBF dynamics, neurovascular coupling andBBB permeability changes in the pathogenesis of common brain diseases, there are very fewmethods available for the quantitative assessment of rCBF dynamics and BBB permeabilityin small cerebral vessels. Here we report a new dynamic imaging method for quantificationof local changes in the blood flow and the permeability of small pial and surface corticalvessels under physiological and pathological conditions.
Materials and methodsAll experimental procedures were approved by the Beer-Sheva Animal Ethics Committee.Chemicals were purchased from Sigma-Aldrich.
In vivo animal preparationsIn vivo experiments were performed using established methods (Seiffert et al., 2004):Briefly, adult male SD rats weighing 200–300 g were deeply anesthetized by intraperitonealinjection of ketamine (100 mg/ml, 0.08 ml/100 g) and xylazine (20 mg/ml, 0.06 ml/100 g).The tail vein was catheterized, and the animal was placed in a stereotactic frame under aflorescence stereomicroscope (Zeiss, SteReO Lumar V12). Body temperature wascontinuously monitored and maintained at 38.0 ± 0.5 °C with a heating pad. A bone windowwas drilled over the motor-somatosensory cortex (4 mm caudal, 2 mm frontal, 5 mm lateralto bregma) of one hemisphere. The dura was opened, and the cortex was continuouslysuperfused with artificial cerebrospinal fluid (ACSF) containing (in mM): 129 NaCl, 21NaHCO3, 1.25 NaH2PO4, 1.8 MgSO4, 1.6 CaCl2, 3 KCl, and 10 glucose (pH 7.4). Toinduce increased rCBF, the intraorbital ethmoidal nerve, including the parasympatheticnerve fibers from the spheno-palatine ganglion (SPG) was isolated (Henninger and Fisher,2007) and stimulated (NeuroPath™, BrainsGate) by two sets of 60 s of stimulation separatedby an interval of 12 s (10 Hz, square pulse width 500 µs, 1–6 mA). For disruption of theBBB, the bile salt deoxycholic acid (DOC, 2 mM) was added to the ACSF (Greenwood etal., 1991; Seiffert et al., 2004), and the cortex was perfused for 30 min. To induce focalischemia, the photochemical agent, Rose bengal (RBG; 7.5 mg/ml, in saline) was injected(0.133 ml/100 g body weight) i.v., as previously reported (Watson et al., 1985). The exposedcortex was then illuminated with a halogen light, transferred through fiber optic bundles(Zeiss, KL 1500 LCD). To confirm the generation of an infarct, after the experiment the
Prager et al. Page 2
Neuroimage. Author manuscript; available in PMC 2013 May 07.
NIH
-PA Author Manuscript
NIH
-PA Author Manuscript
NIH
-PA Author Manuscript

bone window was carefully closed, the animal was sutured and put back in cage forrecovery. Two to 3 weeks later the brain was fixed by transcardial perfusion using 4%paraformaldehyde (PFA), removed and stored for 48 h in PFA (Tomkins et al., 2007). 40-µm coronal sections were mounted and stained using cresyl violet. In some experiments,animals were injected with the BBB-non-permeable albumin-binding dye Evans blue forconfirmation of BBB breakdown (Rawson, 1943; Friedman et al., 1996). For methodvalidation, in some experiments the rCBF was monitored with a laser Doppler flowmeter(LDF) (Oxford Optronix, OxyFlo™ 2000) (Dirnagl et al., 1989). Changes in the rCBF werecalculated as percent change from the averaged baseline signal recorded for 30 min prior totreatment.
Real-time florescence imagingFor imaging rCBF and BBB permeability, the non-permeable florescent dye, Lucifer yellowCH dipotassium salt (LY, FW = 521.58) was injected intravenously (Easton and Fraser,1994). Full-resolution (658×496) images of cortical surface vessels were obtained at 12–30images/s using an EMCCD camera (Andor Technology, DL-658 M-TIL) before, during, andafter injection of the tracer (total of 20–40 s). About 15–20 min after LY injection, averagedimage intensity returned to pre-injection values, and the injection could be repeated.
Image analysisTo reduce memory usage and computation time, images were rescaled (to 256 × 256) using2D bicubic interpolation (Keys, 1981). Sub-pixel image registration to overcome artifactsdue to small movements was performed by applying a single step discrete Fourier transform(Guizar-Sicairos et al., 2008) to each image. To increase the signal-to-noise ratio, eachframe was registered according to a moving average of several preceding images. Signalintensity changes over time and space were then analyzed. Each pixel was represented by afeatures vector, which was extracted from the intensity–time curve. Cluster analysis wasthen performed using a K-means clustering algorithm (Hartigan and Wong, 1979) toseparate between signal behavior in arteries, veins and the extravascular matrix. Severalphysiologically relevant parameters were measured: (1) Baseline, representing thebackground intensity (“noise”) before injection of the tracer (0–2.5 s, about 30–50 images);(2) time to incline, time to the first detection of a significant increase in intensity comparedto the baseline (tti), (3) incline, slope of the signal intensity increase between tti and themaximal value; (4) time to maximal intensity (ttmax); (5) max, the maximal value; and (6)decline, slope of the signal intensity decrease, and (7) time to decline, time from the tracerinjection to the time at which the rapid decline terminated (ttd). Pixel-wise analysis mapscreated for each of the parameters demonstrated differences between anatomically definedarterioles, venules and extravascular brain tissue (the latter showing, as expected, asignificantly smaller change in fluorescent intensity). tti, max, incline, ttmax, decline, andttd were the features chosen for the clustering process. Automatic feature extraction from theintensity–time curve was performed by least-square errors fitting of the signal intensitycurve using a segmented linear model with four segments and three internal breakpoints(Fig. 1). In the model, the middle breakpoint was set as the time to maximal intensity (theouter fixed points were the start and end points), with two degrees of freedom for theremaining two breakpoints. The two latter points achieving the minimization of the sum ofsquared errors (between the model and the original intensity curve) are the time to inclineand time to decline points (ordered accordingly). Incline was calculated as the averagedslope of the line connecting the max value to the preceding baseline. Decline was calculatedas the averaged slope from max to ttd. To calculate mean transit time (MTT), we assumethat, in average, the MTT of all particles is the same and behaves approximately as a first-in-first-out sequence (Meier and Zierler, 1954). Let the times in which the first particle isentering and leaving the system be denoted as tenter and texit respectively. Assuming all
Prager et al. Page 3
Neuroimage. Author manuscript; available in PMC 2013 May 07.
NIH
-PA Author Manuscript
NIH
-PA Author Manuscript
NIH
-PA Author Manuscript

particles entering the system also exit, the number of particles entering the system betweententer and texit is equal to the amount of particles leaving the system after texit. Accordingly,texit is the time point which divides the total area under the intensity curve into two equalareas. Since tenter = tt_inc, we can derive MTT = texit−tenter. The number of clusters found todescribe arterioles and venules were summed together as the cerebral vascular area (CBA).
ResultsDirect visualization of flow in surface vessels and dynamic image analysis
Pixel-based image analysis following fluorescent tracer injection under control conditionswas performed for nine animals, with LY as the tracer. On average, 5.15 ± 0.15 s afterinjection, the tracer was detected in the pial arterioles (Fig. 1A), followed by delayed (6.85 ±0.30 s) labeling of the venules (Fig. 1B; for video see Supplementary material). Imageanalysis revealed a rapid increase, followed by a slower decrease in the intensity of thefluorescent signal, which reflected the flow of tracer through the local vasculature (Fig. 1C).Pixel-wise analysis maps created for each of the measured physiological-relevant parameters(Fig. 1D and see Methods) demonstrating differences between anatomically definedarterioles, venules and extravascular brain tissue. Indeed, cluster analysis resulted in a clearseparation between blood vessels and the extravascular tissue (when the number of clusterswas set to two; Fig. 1E, left) and between anatomically defined arterioles and venules (whenthe number of clusters was set to three; Fig. 1E, middle). Thus, the compartment identifiedwith a shorter tti and a higher incline values was anatomically identified to inclusivelyinclude arterioles (Figs. 1A, D, left). The extravascular compartment showed, as expected, asignificantly smaller change in fluorescent intensity. However, even in the presence of intactBBB (as validated histologically, see below and Seiffert et al., 2004), a small but significantincrease in signal was measured (Fig. 1E “extravascular”). Signal kinetics were similar tothat of the intravascular compartment, suggesting that it reflects “background” flow in bloodvessels in a different focal plane. This effect was eliminated by subtracting the extravascularcurve with the averaged arteriole curve (factored down according to mean maximalintensities ratio). Indeed, this resulted in a “near zero” signal change in the extravascularcompartment of the intact control brain (Fig. 1E, “extravascular corrected” trace).
Imaging increased rCBF following stimulation of the ethmoidal nerveWe then explored the extent to which the method is sensitive for the detection ofphysiological and pathological changes in the rCBF. Previous studies demonstrated thatstimulation of the ethmoidal nerve results in increased rCBF in the ipsilateral fronto-parietalcortex (Ayajiki et al., 2005; Henninger and Fisher, 2007). Repeated stimulation of the nerveby pulses greater than 1mA consistently resulted in a variable, but significant, increase invessel diameter and in the averaged rCBF measured with LDF (n = 5, Fig. 2B). In a differentset of experiments, trains of 60 s of stimulation separated by 12-s intervals (500 µs duration,10 Hz, 1–6 mA) were given every 15 min with increasing stimulation intensity. LY wasinjected i.v. at the end of each train. A clear increase in vessel diameters was observed (Figs.2A, C), with a stimulation intensity above 1 mA. Vasodilatation was greater for arteriolesthan for venules (data not shown). Dynamic image analysis, which was consistent with theLDF and diameter measurements, showed increased rCBF, decreased tti and increasedincline and max values at stimulation intensities above 1mA (Figs. 2D, E). Importantly, botharterial and venous compartments showed similar responses, suggesting increased rCBF anddrainage (outflow).
Imaging blood–brain barrier breakdownThe successful clustering of anatomically identified arterioles, venules and extravascularcompartments via analysis of the dynamic fluorescent intensity predicted that under
Prager et al. Page 4
Neuroimage. Author manuscript; available in PMC 2013 May 07.
NIH
-PA Author Manuscript
NIH
-PA Author Manuscript
NIH
-PA Author Manuscript

conditions in which the BBB is disrupted, the impermeable tracer would diffuse out of theblood vessels and increase the image intensity in the extravascular compartment (cluster).We first tested tracer behavior before (Fig. 3A) and after (Fig. 3B) exposing the brain toDOC, a compound previously shown to cause increased BBB permeability to largemolecules with no (or minimal) damage to other cellular structures (Greenwood et al., 1991;Seiffert et al., 2004). Indeed, 30 min after brain exposure to DOC, repeating tracer injectionshowed clear staining of the extravascular tissue (Fig. 3B; see also video 1 in theSupplementary material). This finding was confirmed by extravasation of the Evans blue–albumin complex in the brain, as was also observed after removal of the brain at the end ofthe experiment (Fig. 3C). Unexpectedly, LDF measurements demonstrated a steady andconsistent increase in rCBF in all experiments (n = 5, Fig. 3D). The increased rCBF wasassociated with vasodilatation of both arterioles and venules (Fig. 3B); confirmed by ourimage analysis showing increased CBA of both the arterial and venous clusters followingDOC (Fig. 3D). Vasodilatation was associated with increased incline and max values (5.4 ±2 Units/s vs. 6.79 ± 3.6 Units/s and 594.1 ± 11.08 Units vs. 606.3 ± 27 Units for ACSF vs.DOC, respectively, p < 0.0001) and a decrease in the MTT (2.74 ± 0.97 vs. 2.15 ± 1.3 s,Figs. 3E, F), consistent with increased rCBF. In contrast to the stimulation-inducedvasodilatation (Fig. 2) the increase in apparent flow in the arterial compartment followingDOC was associated with a decrease in the apparent flow in the venous cluster, shown bydecreased incline and max values and increased MTT (incline 3.81 ± 1.3 vs. 3.07 ± 1.5Units/s, max 588.57 ± 8 vs. 572 ± 7.3 Units, and MTT 4.08 ± 1.02 vs. 4.84 ± 1.8 s for ACSFvs. DOC, respectively, p<<0.001, Figs. 3 E, F). In the extravascular compartment (cluster),the response to DOC was manifested mainly characterized by a late and persistant increasein intensity reflecting the accumulation of tracer in the extravascular compartment (Fig. 3F).Overall, the data suggest that DOC induces vasodilatation, increased flow in brain arteriolesand increase BBB permeability leading to the accumulation of tracer in the extravascularspace, which probably underlies the decreased signal in the venous compartment.
Imaging blood flow in experimental focal ischemiaTo implement our imaging and analysis methods for conditions in which blood flow isreduced, we used the RBG model to induce focal intravascular thrombosis. Thirty minutesafter i.v. injection of RBG and exposure to light, repeated LY injection demonstrated a clearfocal reduction in rCBF (“center” in Fig. 4B; see also video 2 in the Supplementarymaterial). As expected, image intensity changes in both the arterial and venouscompartments were significantly reduced (Fig. 4D). The resultant ischemia was confirmedby histological studies showing a large necrotic lesion and loss of cortical tissue three weeksafter treatment (Fig. 4D). Interestingly, In the region surrounding the ischemic area(“surround” in Fig. 4B), increased incline and max values were observed in both arterial andvenous compartments (Figs. 4C, D). Importantly, the extravascular compartment showed adelayed increase in intensity (and apparent slowing of the decline phase), similar to thatobserved when the BBB was disrupted (Fig. 3). This finding was supported by extravasationof the Evans blue–albumin complex into the brain tissue surrounding the treated cortex (Fig.4D).
DiscussionThe importance of measuring dynamic changes in the rCBF and in BBB properties in vivolies in the complex interactions between different components of the neurovascular unit andthe dynamic nature of the unit during both physiological and pathological activation. Here,we describe a new direct imaging method for in vivo detection of BBB breakdown andrelative CBF changes under normal and pathological conditions. The method combines real-time fluorescence imaging of small cortical vessels with quantitative image analysis using
Prager et al. Page 5
Neuroimage. Author manuscript; available in PMC 2013 May 07.
NIH
-PA Author Manuscript
NIH
-PA Author Manuscript
NIH
-PA Author Manuscript

in-house tailored MATLAB-scripts. Our method thus fuses recently described techniquesbased on fluorescent tracers and in vivo microscopy (e.g. Murphy et al., 2008; Nishimura etal., 2006) to facilitate high-resolution dynamic brain imaging. To the best of our knowledge,our technology constitutes the first quantitative approach for evaluation of rCBF and BBBpermeability by using high-resolution imaging combined with powerful image analysisapproaches. In this study, we demonstrated that the method facilitates: (1) reliabledistinction between arterioles, venules and extravascular compartments; (2) the observationof relatively small changes in rCBF in response to neuronal stimulation; (3) the detection ofaltered BBB permeability in vivo; and (4) the detection of regional changes in rCBF (e.g.,ischemic center and surrounding tissue, arterial and venous parts of the brain circulation).
Regional blood flow within the brain is tightly controlled by autoregulatory mechanisms andby the brain's metabolic demands (for review see Hansen-Schwartz, 2004; Strandgaard andPaulson, 1984). Most neurological disorders are associated with impaired blood supply, i.e.,a decrease (e.g., stroke) or increase (e.g., seizures) in rCBF and in some cases withabnormally regulated rCBF (Dreier et al., 2000; Strong et al., 2007). The complex nature ofchanges in blood flow and their relation to the pathogenesis of brain diseases calls fordynamic high-resolution methods for monitoring rCBF. The various methods used inprevious studies to investigate dynamic changes in rCBF include LDF (Dirnagl et al., 1989)and thermal diffusion flowmetry (TDF) (Bhatia and Gupta, 2007). Although LDF canprovide instantaneous, continuous and real-time measurements of relative changes in rCBF,its drawbacks are limited spatial resolution and inability to differentiate between arterial andvenous compartments or report changes in BBB permeability. TDF, which is based onthermal conductivity of the cortical tissue, provides continuous real-time assessment ofrCBF changes. However, TDF is an invasive method and similarly to LDF measurementsare relative in nature (Bhatia and Gupta, 2007). Among the noninvasive methods that areavailable today to study dynamic changes in rCBF are those based on near infraredspectroscopy (NIRS), positron emission tomography (PET), and magnetic resonanceimaging (MRI). NIRS, which gives a measure of blood volume and blood oxygenationlevels (Rovati et al., 2007), can be used to measure the oxygenated hemoglobinconcentrations as an index of rCBF in a continuous and non-invasive manner. Thedrawbacks of this method are cortical-limited measurements and low spatial resolution(Shibasaki, 2008). PET has limited use since it suffers from poor spatial resolution and theneed for radioactive tracers (Ishiwata et al., 2008). MRI, in its commonly used form, givesfine anatomical details of the human brain (Hacke et al., 2005; Leithner et al., 2008) butdoes not give a dynamic functional picture. In addition, continuous, prolonged monitoringwith this technology cannot be done in most patients and centers.
BBB breakdown is associated with numerous brain pathologies such as ischemia, stroke,trauma, brain tumors and epilepsy (for review, see Ballabh et al., 2004; Neuwelt, 2004;Abbott et al., 2006), and has recently been linked directly to the pathogenesis of neuronaldysfunction and degeneration (Ivens et al., 2007; Seiffert et al., 2004; Tomkins et al., 2007;Zlokovic, 2008). Thus, measurements of changes in vessel permeability, in terms of extentand timing, may be crucial for our understanding of the pathophysiology of brain diseases.To date, BBB breakdown is most commonly evaluated by traditional “static”, usually semi-quantitative methods, in which BBB non-permeable dyes or fluorescent tracers, such asEvans blue (Ehrlich, 1885; Rawson, 1943; Friedman et al., 1996; Seiffert et al., 2004) orNafluorescein (Hartl et al., 1997; Lenzser et al., 2007), are injected into the periphery anddetected within the brain parenchyma. Immunostaining can also be used to detect blood-borne proteins within the brain [e.g., against serum albumin or immunoglobulins (Rigau etal., 2007; van Vliet et al., 2007)]. An alternative approach sometimes used in the clinicalsetting is the detection of brain-borne proteins (e.g., S100) within the blood (Marchi et al.,2003).While these approaches give a semi-quantitative assessment for a single time point,
Prager et al. Page 6
Neuroimage. Author manuscript; available in PMC 2013 May 07.
NIH
-PA Author Manuscript
NIH
-PA Author Manuscript
NIH
-PA Author Manuscript

they do not enable a more dynamic measurement of changes in the extent of BBBbreakdown in time and space.
Various in vivo approaches—some static and others more dynamic—have been developedfor animal studies and for human diagnostics using NIRS (Klohs et al., 2009), computerizedtomography (Bisdas et al., 2008; Tomkins et al., 2001) and MRI (Neumann-Haefelin et al.,2000; Stoll et al., 2008; Tofts et al., 1999; Tomkins et al., 2008). While some of thesemethods have the advantages of full brain imaging and often the ability for repeatedmeasurements in a single animal, they are limited in terms of their low signal-to-noise ratioand spatial resolution and the limited number of contrast agents available. However, some ofthe computational and modeling approaches developed for dynamic contrast-enhancedimaging (e.g. Tofts et al., 1999) could be implemented in the future on the data obtained bythe method presented in the present manuscript. NIRS has also been recently usedsuccessfully to evaluate relative changes in BBB permeability in the cortical surface (Klohset al., 2009). An alternative technique to study BBB permeability is by measuring thetransendothelial electrical resistance (Butt et al., 1990; Crone and Christensen, 1981).However, this approach is invasive, technically challenging and is limited in its ability forrepeated measures at different brain regions. The method presented here is, to the best of ourknowledge, the first to combine real-time imaging of changes in BBB permeability withrCBF. The use of tracers with a short half life in the circulation facilitates repeated scans anddynamic studies (e.g., Figs. 2–4). In addition, the use of tracers with different molecularstructures is expected to improve our understanding of BBB properties under diseaseconditions. In this study, we used a stereomicroscope, thus limiting our measurements tosurface cortical vessels. Although these vessels appear to share many morphological andfunctional features with the deeper intracerebral microcirculation, including ultrastructuralcharacteristics, permeability of cell junctions, trans-EC electrical resistance, there are alsoimportant differences between them, including the heterogeneous expression of some tightjunction proteins (Allt and Lawrenson, 1997) and their proximity to the astrocytic glialimitants. We confirmed—using a well-established BBB disruption procedure (exposure tobile salts)—that surface vessels show a clear increase in permeability, reflecting similarchanges to those reported for deeper vessels (Fig. 3; Greenwood et al., 1991; Seiffert et al.,2004). The use of two-photon microscopy (Shih et al., 2009; Stefanovic et al., 2007) willenable implementation of the analysis methods developed in the present study to deepervessels. This limitation seems also to underlie the small change we observed in theextravascular compartment in the healthy brain. To overcome this potential limitation weassumed that the “background” intensity change (results of blood flow in adjacent focalplans) is similar to that in the arterial compartment reduced by a factor. Indeed, suchcorrection resulted in a “near zero” intensity changes in the intact brain, with no effect ondetection of the delayed increase in signal intensity observed under BBB breakdown (Figs.3–4).
A significant question for any method is how sensitive it is for the detection of changesunder both physiological and pathological conditions. We showed that neuronal stimulationresulting in vasodilatation of 10–20% of the vessel diameter induced increased rCBF, whichwas clearly detected using our method. In a model for focal intravascular ischemia, we coulddistinguish between core ischemic lesions and the surrounding brain tissue supplied byneighboring vessels (<0.5 mm distance, see Fig. 4). Although this surrounding brain regionhad an intact blood supply, it showed increased perfusion and increased BBB permeability,as has been described for the penumbra region.
An obvious limitation of our method is that it requires the use of the open windowtechnique, which limits its application to anaesthetized experimental animals. However,recent developments have already made it possible to conduct prolonged experiments and to
Prager et al. Page 7
Neuroimage. Author manuscript; available in PMC 2013 May 07.
NIH
-PA Author Manuscript
NIH
-PA Author Manuscript
NIH
-PA Author Manuscript

obtain repeated measurements from animals with cranial windows (Seylaz et al., 1999;Tomita et al., 2005). The use of similar approaches in selected surgical patients or in amicrocirculation system that is more accessible (i.e., retinal vessels) may well be adopted inthe future to assess blood flow and permeability, and thus improve diagnosis andmonitoring.
In conclusion, the presented method offers a new tool to study dynamic, regional blood flowchanges in small and specific vessels together with changes in BBB properties. The methodmay serve as a powerful tool for improving our understanding of disease mechanisms anddifferent therapeutic modalities.
Supplementary MaterialRefer to Web version on PubMed Central for supplementary material.
AcknowledgmentsSupported by the Sonderforschungsbereich TR3, the Israel Science Foundation (566/07), the Binational US-IsraelFoundation (BSF 2007185) and Brainsgate.
ReferencesAbbott NJ. Astrocyte-endothelial interactions and blood–rain barrier permeability. J. Anat. 2002;
200:629–638. [PubMed: 12162730]
Abbott NJ, Ronnback L, Hansson E. Astrocyte-endothelial interactions at the blood–brain barrier. Nat.Rev. Neurosci. 2006; 7:41–53. [PubMed: 16371949]
Allt G, Lawrenson JG. Is the pial microvessel a good model for blood–brain barrier studies? BrainRes. Rev. 1997; 24:67–76. [PubMed: 9233542]
Ayajiki K, Fujioka H, Shinozaki K, Okamura T. Effects of capsaicin and nitric oxide synthaseinhibitor on increase in cerebral blood flow induced by sensory and parasympathetic nervestimulation in the rat. J. Appl. Physiol. 2005; 98:1792–1798. [PubMed: 15626754]
Ballabh P, Braun A, Nedergaard M. The blood–brain barrier: an overview: structure, regulation, andclinical implications. Neurobiol. Dis. 2004; 16:1–13. [PubMed: 15207256]
Baskurt OK, Meiselman HJ. Blood rheology and hemodynamics. Semin. Thromb. Hemost. 2003;29:435–450. [PubMed: 14631543]
Bhatia A, Gupta A. Neuromonitoring in the intensive care unit. II. Cerebral oxygenation monitoringand microdialysis. Intensive Care Med. 2007; 33:1322–1328. [PubMed: 17522846]
Bisdas S, Yang X, Lim C, Vogl T, Koh T. Delineation and segmentation of cerebral tumors bymapping blood–brain barrier disruption with dynamic contrast-enhanced CT and tracer kineticsmodeling—a feasibility study. Eur. Radiol. 2008; 18:143–151. [PubMed: 17701183]
Butt AM, Jones HC, Abbott NJ. Electrical resistance across the blood–brain barrier in anaesthetizedrats: a developmental study. J. Physiol. 1990; 429:47–62. [PubMed: 2277354]
Crone C, Christensen O. Electrical resistance of a capillary endothelium. J. Gen. Physiol. 1981;77:349–371. [PubMed: 7241087]
Dirnagl U, Kaplan B, Jacewicz M, Pulsinelli W. Continuous measurement of cerebral cortical bloodflow by laser-Doppler flowmetry in a rat stroke model. J. Cereb. Blood Flow Metab. 1989; 9:589–596. [PubMed: 2674168]
Dreier JP, Korner K, Ebert N, Gorner A, Rubin I, Back T, Lindauer U, Wolf T, Villringer A, EinhauplKM, Lauritzen M, Dirnagl U. Nitric oxide scavenging by hemoglobin or nitric oxide synthaseinhibition by N-nitro-l-arginine induces cortical spreading ischemia when K+ is increased in thesubarachnoid space. J. Cereb. Blood Flow Metab. 1998; 18:978–990. [PubMed: 9740101]
Dreier JP, Ebert N, Priller J, Megow D, Lindauer U, Klee R, Reuter U, Imai Y, Einhaupl KM,Victorov I, Dirnagl U. Products of hemolysis in the subarachnoid space inducing spreading
Prager et al. Page 8
Neuroimage. Author manuscript; available in PMC 2013 May 07.
NIH
-PA Author Manuscript
NIH
-PA Author Manuscript
NIH
-PA Author Manuscript

ischemia in the cortex and focal necrosis in rats: a model for delayed ischemic neurologicaldeficits after subarachnoid hemorrhage? J. Neurosurg. 2000; 93:658–666. [PubMed: 11014545]
Dreier JP, Petzold G, Tille K, Lindauer U, Arnold G, Heinemann U, Einhaupl KM, Dirnagl U.Ischaemia triggered by spreading neuronal activation is inhibited by vasodilators in rats. J. Physiol.2001; 531:515–526. [PubMed: 11230523]
Dreier JP, Tille K, Dirnagl U. Partial antagonistic effect of adenosine on inverse coupling betweenspreading neuronal activation and cerebral blood flow in rats. Neurocrit. Care. 2004; 1:85–94.[PubMed: 16174901]
Easton AS, Fraser PA. Variable restriction of albumin diffusion across inflamed cerebral microvesselsof the anaesthetized rat. J. Physiol. Online. 1994; 475:147–157.
Ehrlich P. Das Sauerstoffbeduerfnis des Organismus: Eine Farbenanalytiche Studie. Hirschwald. 1885;8:167.
Friedman A, Kaufer D, Shemer J, Hendler I, Soreq H, Tur-Kaspa I. Pyridostigmine brain penetrationunder stress enhances neuronal excitability and induces early immediate transcriptional response.Nat. Med. 1996; 2:1382–1385. [PubMed: 8946841]
Greenwood J, Adu J, Davey AJ, Abbott NJ, Bradbury MW. The effect of bile salts on the permeabilityand ultrastructure of the perfused, energy-depleted, rat blood–brain barrier. J. Cereb. Blood FlowMetab. 1991; 11:644–654. [PubMed: 2050752]
Guizar-Sicairos M, Thurman ST, Fienup JR. Efficient subpixel image registration algorithms. OpticalLett. 2008; 33:156–158.
Hacke W, Albers G, Al-Rawi Y, Bogousslavsky J, Davalos A, Eliasziw M, Fischer M, Furlan A, KasteM, Lees KR, Soehngen M, Warach S. for The DIAS Study Group. The Desmoteplase in AcuteIschemic Stroke Trial (DIAS): a phase II MRI-based 9-hour window acute stroke thrombolysistrial with intravenous desmoteplase. Stroke. 2005; 36:66–73. [PubMed: 15569863]
Hansen-Schwartz J. Cerebral vasospasm: a consideration of the various mechanisms involved in thepathophysiology. Neurocrit. Care. 2004; 1:235–246. [PubMed: 16174921]
Hartigan A, Wong MA. A K-means clustering algorithm. Applied Statistics. 1979; 28:100–108.
Hartl R, Medary MB, Ruge M, Arfors KE, Ghajar J. Early white blood cell dynamics after traumaticbrain injury: effects on the cerebral microcirculation. J. Cereb. Blood Flow Metab. 1997; 17:1210–1220. [PubMed: 9390653]
Henninger N, Fisher M. Stimulating circle of Willis nerve fibers preserves the diffusion-perfusionmismatch in experimental stroke. Stroke. 2007; 38:2779–2786. [PubMed: 17761922]
Iadecola C. Neurovascular regulation in the normal brain and in Alzheimer's disease. Nat. Rev.Neurosci. 2004; 5:347–360. [PubMed: 15100718]
Ishiwata K, Ishii K, Kimura Y, Kawamura K, Oda K, Sasaki T, Sakata M, Senda M. Successivepositron emission tomography measurement of cerebral blood flow and neuroreceptors in thehuman brain: an 11C-SA4503 study. Ann. Nucl. Med. 2008; 22:411–416. [PubMed: 18600419]
Ivens S, Kaufer D, Flores LP, Bechmann I, Zumsteg D, Tomkins O, Seiffert E, Heinemann U,Friedman A. TGF-beta receptor-mediated albumin uptake into astrocytes is involved in neocorticalepileptogenesis. Brain. 2007; 130:535–547. [PubMed: 17121744]
Keys RG. Cubic convolution interpolation for digital image. IEEE transactions on acoustics, speech,and signal processing. 1981:29.
Klohs J, Steinbrink J, Bourayou R, Mueller S, Cordell R, Licha K, Schirner M, Dirnagl U, Lindauer U,Wunder A. Near-infrared fluorescence imaging with fluorescently labeled albumin: a novelmethod for non-invasive optical imaging of blood–brain barrier impairment after focal cerebralischemia in mice. J. Neurosci. Methods. 2009; 180:126–132. [PubMed: 19427539]
Leithner C, Gertz K, Schr÷ck H, Priller J, Prass K, Steinbrink J, Villringer A, Endres M, Lindauer U,Dirnagl U, Royl G. A flow sensitive alternating inversion recovery (FAIR)-MRI protocol tomeasure hemispheric cerebral blood flow in a mouse stroke model. Exp. Neurol. 2008; 210:118–127. [PubMed: 18037417]
Lenzser G, Kis B, Snipes JA, Gaspar T, Sandor P, Komjati K, Szabo C, Busija DW. Contribution ofpoly(ADP-ribose) polymerase to postischemic blood–brain barrier damage in rats. J. Cereb. BloodFlow Metab. 2007; 27:1318–1326. [PubMed: 17213862]
Prager et al. Page 9
Neuroimage. Author manuscript; available in PMC 2013 May 07.
NIH
-PA Author Manuscript
NIH
-PA Author Manuscript
NIH
-PA Author Manuscript

Marchi N, Rasmussen P, Kapural M, Fazio V, Kight K, Mayberg MR, Kanner A, Ayumar B, AlbensiB, Cavaglia M, Janigro D. Peripheral markers of brain damage and blood–brain barrierdysfunction. Restor. Neurol. Neurosci. 2003; 21:109–121. [PubMed: 14530574]
Meier P, Zierler KL. On the theory of the indicator-dilution method for measurement of blood flowand volume. J. Appl. Physiol. 1954; 6:731–744. [PubMed: 13174454]
Murphy TH, Li P, Betts K, Liu R. Two-photon imaging of stroke onset in vivo reveals that NMDA-receptor independent ischemic depolarization is the major cause of rapid reversible damage todendrites and spines. J Neurosci. 2008; 28:1756–1772. [PubMed: 18272696]
Neumann-Haefelin T, Kastrup A, de Crespigny A, Yenari MA, Ringer T, Sun GH, Moseley ME,Fisher M. Serial MRI after transient focal cerebral ischemia in rats: dynamics of tissue injury,blood–brain barrier damage, and edema formation. Stroke. 2000; 31:1965–1973. [PubMed:10926965]
Neuwelt EA. Mechanisms of disease: the blood–brain barrier. Neurosurgery. 2004; 54:131–140.[PubMed: 14683550]
Nishimura N, Schaffer CB, Friedman B, Tsai PS, Lyden PD, Kleinfeld D. Targeted insult tosubsurface cortical blood vessels using ultrashort laser pulses: three models of stroke. Nat. Meth.2006; 3:99–108.
Rawson RA. The binding of T-824 and structurally related diazo dyes by plasma proteins. Am. J.Physiol. 1943; 138:708–717.
Rigau V, Morin M, Rousset MC, de BF, Lebrun A, Coubes P, Picot MC, Baldy-Moulinier M,Bockaert J, Crespel A, Lerner-Natoli M. Angiogenesis is associated with blood–brain barrierpermeability in temporal lobe epilepsy. Brain. 2007; 130:1942–1956. [PubMed: 17533168]
Rovati L, Salvatori G, Bulf L, Fonda S. Optical and electrical recording of neural activity evoked bygraded contrast visual stimulus. Biomed. Eng. OnLine. 2007; 6:28. [PubMed: 17610733]
Seiffert E, Dreier JP, Ivens S, Bechmann I, Tomkins O, Heinemann U, Friedman A. Lasting blood–brain barrier disruption induces epileptic focus in the rat somatosensory cortex. J. Neurosci. 2004;24:7829–7836. [PubMed: 15356194]
Seylaz J, Charbonne R, Nanri K, Von Euw D, Borredon J, Kacem K, Meric P, Pinard E. Dynamic invivo measurement of erythrocyte velocity and flow in capillaries and of microvessel diameter inthe rat brain by confocal laser microscopy. J. Cereb. Blood Flow Metab. 1999; 19:863–870.[PubMed: 10458593]
Shibasaki H. Human brain mapping: hemodynamic response and electrophysiology. Clin.Neurophysiol. 2008; 119:731–743. [PubMed: 18187361]
Shih AY, Friedman B, Drew PJ, Tsai PS, Lyden PD, Kleinfeld D. Active dilation of penetratingarterioles restores red blood cell flux to penumbral neocortex after focal stroke. J. Cereb. Blood.Flow Metab. 2009; 29:738–751. [PubMed: 19174826]
Stefanovic B, Hutchinson E, Yakovleva V, Schram V, Russell JT, Belluscio L, Koretsky AP, SilvaAC. Functional reactivity of cerebral capillaries. J. Cereb. Blood Flow Metab. 2007; 28:961–972.[PubMed: 18059431]
Stoll G, Kleinschnitz C, Meuth SG, Braeuninger S, Ip CW, Wessig C, Nolte I, Bendszus M. Transientwidespread blood–brain barrier alterations after cerebral photothrombosis as revealed bygadofluorine M-enhanced magnetic resonance imaging. J Cereb. Blood Flow Metab. 2008;29:331–341. [PubMed: 18957988]
Strandgaard S, Paulson OB. Cerebral autoregulation. Stroke. 1984; 15:413–416. [PubMed: 6374982]
Strong AJ, Hartings JA, Dreier JP. Cortical spreading depression: an adverse but treatable factor inintensive care? Curr. Opin. Crit Care. 2007; 13:126–133. [PubMed: 17327732]
Tofts PS, Brix G, Buckley DL, Evelhoch JL, Henderson E, Knopp MV, Larsson HB, Lee TY, MayrNA, Parker GJ, Port RE, Taylor J, Weisskoff RM. Estimating kinetic parameters from dynamiccontrast-enhanced T(1)-weighted MRI of a diffusable tracer: standardized quantities and symbols.J. Magn. Reson. Imaging. 1999; 10:223–232. [PubMed: 10508281]
Tomita Y, Kubis N, Calando Y, Dinh AT, Meric P, Seylaz J, Pinard E. Long-term in vivo investigationof mouse cerebral microcirculation by fluorescence confocal microscopy in the area of focalischemia. J. Cereb. Blood Flow Metab. 2005; 25:858–867. [PubMed: 15758950]
Prager et al. Page 10
Neuroimage. Author manuscript; available in PMC 2013 May 07.
NIH
-PA Author Manuscript
NIH
-PA Author Manuscript
NIH
-PA Author Manuscript

Tomkins O, Kaufer D, Korn A, Shelef I, Golan H, Reichenthal E, Soreq H, Friedman A. Frequentblood–brain barrier disruption in the human cerebral cortex. Cell. Mol. Neurobiol. 2001; 21:675–691. [PubMed: 12043841]
Tomkins O, Friedman O, Ivens S, Reiffurth C, Major S, Dreier JP, Heinemann U, Friedman A. Blood–brain barrier disruption results in delayed functional and structural alterations in the rat neocortex.Neurobiol. Dis. 2007; 25:367–377. [PubMed: 17188501]
Tomkins O, Shelef I, Kaizerman I, Eliushin A, Afawi Z, Misk A, Gidon M, Cohen A, Zumsteg D,Friedman A. Blood–brain barrier disruption in post-traumatic epilepsy. J Neurol. Neurosurg.Psychiatry. 2008; 79:774–777. [PubMed: 17991703]
van Vliet EA, da Costa AS, Redeker S, van SR, Aronica E, Gorter JA. Blood–brain barrier leakagemay lead to progression of temporal lobe epilepsy. Brain. 2007; 130:521–534. [PubMed:17124188]
Watson BD, Dietrich WD, Busto R, Wachtel MS, Ginsberg MD. Induction of reproducible braininfarction by photochemically initiated thrombosis. Ann. Neurol. 1985; 17:497–504. [PubMed:4004172]
Zlokovic BV. The blood–brain barrier in health and chronic neurodegenerative disorders. Neuron.2008; 57:178–201. [PubMed: 18215617]
Prager et al. Page 11
Neuroimage. Author manuscript; available in PMC 2013 May 07.
NIH
-PA Author Manuscript
NIH
-PA Author Manuscript
NIH
-PA Author Manuscript

Fig. 1.Flow visualization in pial vessels and image analysis: (A–C) Intravenous injection of thefluorescent tracer LY under control conditions resulted in an early increase in signalintensity within the surface arterioles (A), followed by delayed labeling of the venules (B).By using image analysis, an intensity–time curve was created (C), reflecting the change intracer intensity within the local vasculature. The curve allows the estimation of severalparameters using a segmented linear model (inset—red line, blue line—the raw data in arepresentative pixel). (D) Analysis results are represented for each voxel of the originalimage, enabling the distinction between defined vessels and the extravascular brain tissue.(E) Cluster analysis was used for automatic clustering of similarly behaving pixels (seeMethods). Left image is the result of setting the number of clusters to 2; pixels are labeled asred for presumed blood vessels and gray for extravascular tissue. Right image—number ofclusters was set to 3, allowing the distinction between arterioles (red), venules (blue) andtissue (gray). Light gray—the original signal in the extravascular compartment, dark gray—corrected signal following “background reduction” (see text).
Prager et al. Page 12
Neuroimage. Author manuscript; available in PMC 2013 May 07.
NIH
-PA Author Manuscript
NIH
-PA Author Manuscript
NIH
-PA Author Manuscript

Fig. 2.Experimental CBF increases following stimulation of the ethmoidal nerve: (A) A fluorescenttracer (LY) was injected under control conditions (left image) and at the end of eachstimulus train (right image at 3 mA). Vasodilatation of surface vessels can clearly be seen.(B) LDF showed increased rCBF in each stimulation train above 1mA (inset). The graphshows mean measurements of maximal rCBF increase during each stimulation train,showing a consistent increase in mean rCBF when stimulation was repeated at 2 mA but notat 1mA (n = 5 at each intensity). (C) Stimulation of the ethmoidal nerve induced increase inrCBF, which was associated with intensity-dependent dilatation of arterioles. (D) Results ofdynamic analysis during tracer injection are shown for max value, demonstrating anincreasing change in maximal intensity (i.e., flow) following stimulation. (E) Mean intensitychanges during injection in the arterial (left) and venous (right) compartments. Note that asignificant reduction in tti and increases in incline and max values were observed atstimulation intensities higher than 1 mA.
Prager et al. Page 13
Neuroimage. Author manuscript; available in PMC 2013 May 07.
NIH
-PA Author Manuscript
NIH
-PA Author Manuscript
NIH
-PA Author Manuscript

Fig. 3.Imaging analysis reveals increased BBB permeability: (A–B) Fluorescent images of surfacevessels during the venous phase of injection before (A) and after (B) DOC treatment.Diffusion of the injected tracer (LY) outside the vessels is seen after treatment, indicatingBBB breakdown. (C) A coronal section following treatment with DOC and injection ofEvans blue demonstrates extravasation of the albumin-binding dye into the treated corticaltissue, which indicates BBB breakdown. (D) Treatment with DOC was associated with asteady increase in LDF signal (left) and vasodilatation. The bar graph shows the number ofpixels in the arterial and venous clusters under control conditions (ACSF) and followingperfusion with DOC. (E) Maps of mean transient time (MTT) showing decreased MTT in
Prager et al. Page 14
Neuroimage. Author manuscript; available in PMC 2013 May 07.
NIH
-PA Author Manuscript
NIH
-PA Author Manuscript
NIH
-PA Author Manuscript

arterioles and the robust increase in the extravascular space where the tracer wasaccumulating. (F) Intensity curve for each compartment showing the increased flow in thearterial compartment together with decreased signal intensity in the venous compartmentafter DOC (dashed line). Note the robust slowing of the signal decay in the extravascularcompartment after BBB breakdown.
Prager et al. Page 15
Neuroimage. Author manuscript; available in PMC 2013 May 07.
NIH
-PA Author Manuscript
NIH
-PA Author Manuscript
NIH
-PA Author Manuscript
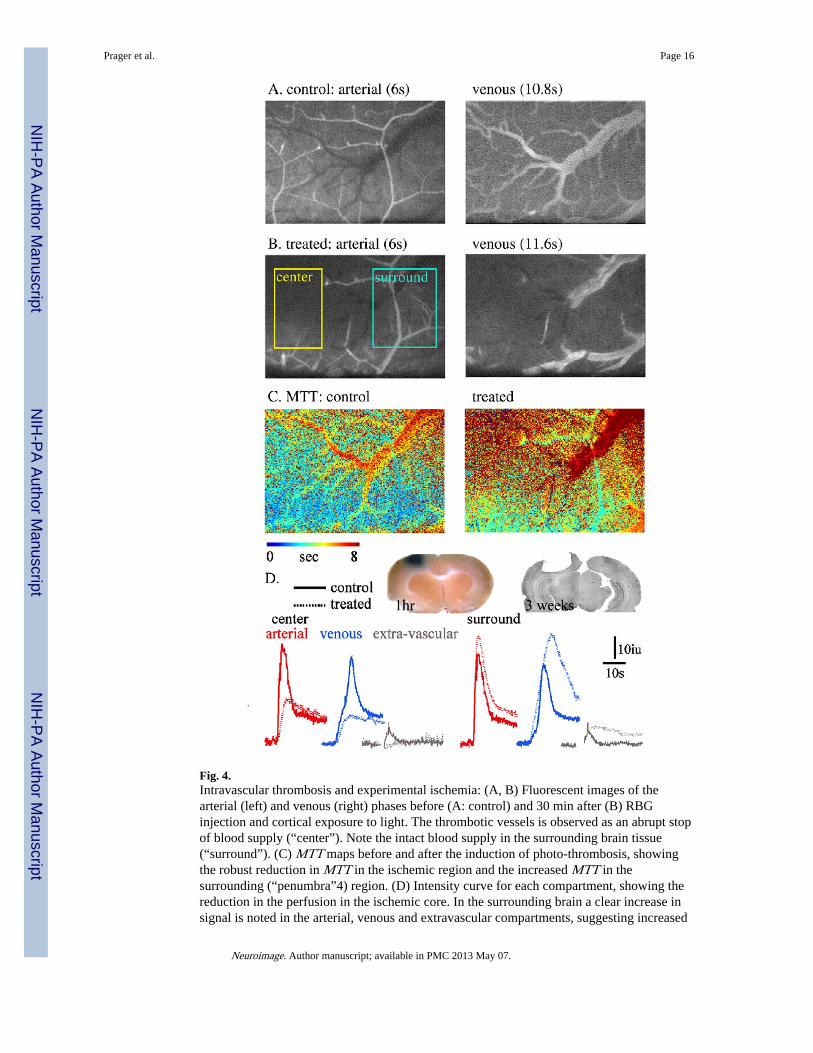
Fig. 4.Intravascular thrombosis and experimental ischemia: (A, B) Fluorescent images of thearterial (left) and venous (right) phases before (A: control) and 30 min after (B) RBGinjection and cortical exposure to light. The thrombotic vessels is observed as an abrupt stopof blood supply (“center”). Note the intact blood supply in the surrounding brain tissue(“surround”). (C) MTT maps before and after the induction of photo-thrombosis, showingthe robust reduction in MTT in the ischemic region and the increased MTT in thesurrounding (“penumbra”4) region. (D) Intensity curve for each compartment, showing thereduction in the perfusion in the ischemic core. In the surrounding brain a clear increase insignal is noted in the arterial, venous and extravascular compartments, suggesting increased
Prager et al. Page 16
Neuroimage. Author manuscript; available in PMC 2013 May 07.
NIH
-PA Author Manuscript
NIH
-PA Author Manuscript
NIH
-PA Author Manuscript

blood flow and BBB breakdown. Inset: left: brain tissue 1 h after RBG treatment (30 minafter injection of Evans blue)—confirmed BBB breakdown in the region surrounding thethrombotic vessel. Right: histological brain section (cresyl violet staining) 21 days after aphotothrombotic lesion.
Prager et al. Page 17
Neuroimage. Author manuscript; available in PMC 2013 May 07.
NIH
-PA Author Manuscript
NIH
-PA Author Manuscript
NIH
-PA Author Manuscript
Related Documents


