Dynamic headspace (DHS) technique: set-up and parameter control for GC/MS analysis of odorant formulations Ellen Vercruyssen Supervisors: Prof. dr. Jo Schaubroeck, dr. Jan Van Biesen Master's dissertation submitted in order to obtain the academic degree of Master of Science in de industriële wetenschappen: chemie Department of Industrial Technology and Construction Chairman: Prof. dr. Marc Vanhaelst Faculty of Engineering and Architecture Academic year 2013-2014

Welcome message from author
This document is posted to help you gain knowledge. Please leave a comment to let me know what you think about it! Share it to your friends and learn new things together.
Transcript

Dynamic headspace (DHS) technique: set-up and
parameter control for GC/MS analysis of odorant
formulations
Ellen Vercruyssen
Supervisors: Prof. dr. Jo Schaubroeck, dr. Jan Van Biesen
Master's dissertation submitted in order to obtain the academic degree of
Master of Science in de industriële wetenschappen: chemie
Department of Industrial Technology and Construction
Chairman: Prof. dr. Marc Vanhaelst
Faculty of Engineering and Architecture
Academic year 2013-2014


I
Acknowledgements
I am very grateful for the opportunity that I have received to accomplish this task in Scentarom. The
combination of the subject and the entourage at Scentarom resulted in the feeling that this was the
best internship I could ever imagine.
I would like to express my appreciation for Dr. J. Van Biesen because he was always available when I
wanted to discuss the content of my thesis. He was full of involvement, patience and enthusiasm
during my process.
Also my special thanks to Dr. J. Schaubroeck and Dr. G. Diricks for the time they put into reading my
thesis and for the adaptations they’ve suggested.
Last but not least I would like to thank my colleague A. Vermoesen for the support during my
internship and the adjustments she made to my thesis.

II
Abstract
The DHS-technique has been explored as possible tool to obtain additional analytical information on
fragrances and flavours present in a complex matrix. The focus of present work is on mastering the
governing (odour) contamination present as ambient background in a fragrance company, while
performing an in-depth analysis.
Furthermore all experimental parameters, important for the DHS technique itself, have studied and
evaluated in the context of specific problems encountered in the loaded environment of a fragrance
production house.

III
Table of Contents
Acknowledgements .................................................................................................................................. I
Abstract ................................................................................................................................................... II
Table of Contents ................................................................................................................................... III
List of Figures ........................................................................................................................................... V
List of Tables ........................................................................................................................................... VI
List of abbreviations .............................................................................................................................. VII
Introduction ............................................................................................................................................. 1
I Literature/method description ....................................................................................................... 2
I.1 GC/MS ......................................................................................................................................... 2
I.1.1 Gas chromatograph ................................................................................................................. 2
I.1.1.1 Carrier gas ........................................................................................................................ 2
I.1.1.2 Sample introduction ........................................................................................................ 3
I.1.1.2.1 Types of sample introduction in GC ........................................................................ 3
I.1.1.2.2 PTV combined with TDU .......................................................................................... 3
I.1.1.3 Column ............................................................................................................................ 7
I.1.1.4 Detector ........................................................................................................................... 7
I.1.2 The GC/MS Interface ............................................................................................................... 7
I.1.3 MS ............................................................................................................................................ 7
I.1.3.1 Sample inlet ..................................................................................................................... 7
I.1.3.2 Ionization system ............................................................................................................. 8
I.1.3.3 Mass analyzer .................................................................................................................. 8
I.1.3.4 Ion detector ..................................................................................................................... 9
I.1.4 Computer ................................................................................................................................. 9
I.2 Sample preparation ................................................................................................................... 10
I.2.1 Static headspace .................................................................................................................... 10
I.2.2 Dynamic headspace ............................................................................................................... 10
I.2.2.1 Description .................................................................................................................... 10
I.2.2.2 Trapping of components ............................................................................................... 11
I.3 Flow charts ................................................................................................................................ 14
II Experimental part .......................................................................................................................... 16

IV
II.1 Short experimental method descriptions ................................................................................. 16
II.1.1 Blank TDU .......................................................................................................................... 17
II.1.2 Blank DHS .......................................................................................................................... 17
II.1.3 DHS analysis of sample ...................................................................................................... 18
II.2 Contamination ........................................................................................................................... 21
II.2.1 Introduction ....................................................................................................................... 21
II.2.2 Sources where contamination can occur .......................................................................... 21
II.2.3 Measurement of contamination ....................................................................................... 22
II.2.3.1 Preservation conditions of adsorption material (tenax in tenax tube and tenax in tenax
liner) ....................................................................................................................................... 22
II.2.3.2 TDU-tube in TDU-tray .................................................................................................... 22
II.2.3.3 PTV-liner in PTV ............................................................................................................. 22
II.2.3.4 TDU-tube in TDU............................................................................................................ 23
II.2.3.5 Unlocking of TDU ........................................................................................................... 24
II.2.3.6 Transporting TDU-tube to DHS carriage ........................................................................ 25
II.2.3.7 Septum of the sample vial ............................................................................................. 26
II.2.3.8 DHS station and DHS carriage ....................................................................................... 27
II.2.3.9 O-rings on TDU-head ..................................................................................................... 27
II.2.3.10 Carrier ........................................................................................................................ 28
II.2.4 Conclusion ......................................................................................................................... 30
II.3 Parameters ................................................................................................................................ 32
II.3.1 Introduction ....................................................................................................................... 32
II.3.2 Test sample ........................................................................................................................ 33
II.3.3 Split ratio R in PTV ............................................................................................................. 33
II.3.4 Sample temperature (Tsample i and Tsample tr) during incubation step and trapping step ..... 35
II.3.5 Total incubation time Δti ................................................................................................... 37
II.3.6 Trapping gas flow F (V=constant) ...................................................................................... 39
II.3.7 Trapping gas volume V (F=constant) ................................................................................. 41
II.3.8 Reproducibility .................................................................................................................. 43
II.4 Comparing DHS analysis and SHS analysis ............................................................................... 45
II.5 Shampoo .................................................................................................................................... 47
Conclusion ............................................................................................................................................. 50
Bibliography ........................................................................................................................................... 52
Attachments .......................................................................................................................................... 53

V
List of Figures
Figure 1-Schematic of GC/MS ................................................................................................................. 2
Figure 2-Sample introduction for DHS: thermal desorption (TDU-PTV-Column) .................................... 4
Figure 3-Structure Tenax TA .................................................................................................................... 4
Figure 4-Pneumatic diagram of the flow of the GC, TDU and PTV during desorption step and injection
step .......................................................................................................................................................... 6
Figure 5-Schematic figuration of electron ionization .............................................................................. 8
Figure 6-Schematic figuration of a quadrupole analyzer ........................................................................ 9
Figure 7-Scheme of an electron multiplier .............................................................................................. 9
Figure 8-DHS device............................................................................................................................... 11
Figure 9-Schematic overview when trapping all components .............................................................. 11
Figure 10-GC/MS with configuration for DHS analysis .......................................................................... 13
Figure 11-Schematic overview of GC/MS and sample preparation ...................................................... 14
Figure 12-Schematic overview of trapping and releasing ..................................................................... 15
Figure 13-Schematic overview of parameters of DHS and GC/MS ....................................................... 20
Figure 14-Figuration of PTV-liner, TDU-tube and sample vial ............................................................... 21
Figure 15-Chromatogram of contamination of TDU-tube (containing tenax) in tray ........................... 22
Figure 16-Results of PTV-liner in PTV .................................................................................................... 23
Figure 17-Results of contamination of TDU-tube in TDU ...................................................................... 24
Figure 18-Chromatogram of contamination when the TDU is open for 45 seconds ............................ 25
Figure 19-Chromatogram of test of transporting TDU-tube to DHS carriage ....................................... 25
Figure 20-Figuration of septum of sample vial ...................................................................................... 26
Figure 21-Result for contamination of septum of the sample vial ....................................................... 26
Figure 22-Results for contamination of blank DHS ............................................................................... 27
Figure 23-Contamination of O-rings on TDU head ................................................................................ 28
Figure 24-Results of contamination of carbohydrate and silica............................................................ 29
Figure 25-Chromatograms of blank TDU ............................................................................................... 30
Figure 26-Total area of test sample and total area of contamination .................................................. 34
Figure 27-Chromatogram of blank analysis of split ratio 1/10, 1/25, 1/50 and 1/100 ......................... 35
Figure 28-Influence of incubation temperature on the relative area and the total area of the
components trapped ............................................................................................................................. 36
Figure 29-Influence of incubation time on the relative area and the total area of the components
trapped .................................................................................................................................................. 38
Figure 30-Influence of trapping gas flow on the relative area and the total area of the components
trapped .................................................................................................................................................. 40
Figure 31-Influence of trapping gas volume on the relative area and the total area of the components
trapped .................................................................................................................................................. 42
Figure 32-Reproducibility of DHS on the absolute area of each component and the total area of all
components trapped ............................................................................................................................. 44
Figure 33-Comparing DHS with SHS on the absolute, relative and total area of the components
trapped .................................................................................................................................................. 46
Figure 34-Chromatograms of shampoo with concentration of 100 % shampoo, 50 % shampoo 50 %
H2O, 50 % shampoo 50 % silica and 25 % shampoo 25 % H2O 50 % silica ........................................... 49

VI
List of Tables
Table 1-Overview sample introduction when using TDU/PTV combination ........................................... 5
Table 2-Overview of the split ratio and the start split ratio .................................................................. 32
Table 3-Overview of the parameters of steps of the DHS and the start parameters ........................... 32
Table 4-Overview of components in test sample .................................................................................. 33
Table 5-Overview of the different split ratios and corresponding concentrations that have been
tested ..................................................................................................................................................... 33
Table 6-Overview of the different incubation temperatures that have been tested ........................... 35
Table 7-Overview of the different incubation times that have been tested ........................................ 37
Table 8-Overview of the different trapping gas flows that have been tested ...................................... 39
Table 9-Overview of the different trapping gas volumes that have been tested ................................. 41
Table 10-Total area of the individual analyses ...................................................................................... 45

VII
List of abbreviations
GC/MS: Gas Chromatography/Mass Spectrometry
GC: Gas Chromatograph
MS: Mass Spectrometer
COC: Cold On Column
PTV: Programmed Temperature Vaporizer
TDU: Thermal Desorption Unit
PDMS: polydimethylsiloxane
FID: Flame Ionisation Detector
TCD: Thermal Conductivity detector
m/z: mass-to-charge ratio
EI: Electron Ionisation
SHS: Static Headspace
DHS: Dynamic Headspace
DC: direct current
RF: radio frequency
VOC: volatile organic component

1
Introduction
Scentarom is a company which produces flavours and fragrances. These flavours and fragrances are
mixtures of different components and these components have a typical odour. The amount of
different components is dependent on the nature of the flavour or fragrance.
Because of the complex nature of the matrix to which these flavours and fragrances are added, there
are no straightforward methods for the analysis of the different components in it. GC/MS is an
analytical instrument with a high sensitivity, but fragrances and flavours cannot be injected directly
in the GC/MS (because of the matrix) and therefore a sample preparation is necessary.
In the open environment within Scentarom there is a strong background odour present and this
odour can cause contamination when using adsorption material during measurements. This
contamination will be examined in this work.
Present work is preceded by Nele Piens’ thesis “Static headspace characterisation of odorants in
complex matrices by hyphenated GC-MS techniques”. The SHS-type performed by Nele Pien is a SHS
with the use of trapping material. The trapping material is placed in a glass jar containing the sample
and then sealed with aluminium foil for a certain period of time at a certain temperature. During this
period of time the volatile components of the sample will be adsorped on the trapping material.
After this period of time the trapping material is analysed through GC/MS.
In this work attention is focussed on dynamic headspace (DHS), as more sensitivity could be
expected. DHS is a dynamic technique in which more parameters have to be explored when
compared to the SHS-type analysis described in the previous paragraph.

2
I Literature/method description
I.1 GC/MS Gas chromatography/mass spectrometry (GC/MS) (figure 1) is a synergetic combination of two
powerful analytical techniques. There is a GC which separates components of a mixture in function of
time, depending on the boiling point and the polarity of these components. After separation, the MS
provides information that helps to identify (structural identification) the components in the mixture.
[1]
Figure 1-Schematic of GC/MS
[2]
I.1.1 Gas chromatograph Gas chromatograph is a separation technique used to analyse volatile substances in the gas phase.
Components are dissolved in a solvent and vaporized when heated in the inlet port (injector), so the
components are in the gas phase. The gas chromatograph uses a carrier gas to sweep the
components to the column, that contains a coating of a stationary phase. Separation of components
is determined by the distribution of each component between the carrier gas and the stationary
phase. A component that has a low interaction with the stationary phase, will elute quickly and
reaches the detector first. A polar component interacts with a polar stationary phase. A non polar
component will interact with a non polar stationary phase. Also the boiling point has an influence on
the elution time of the component. Only components that can be vaporized without decomposition
will be suitable for GC analysis. [1, 2]
I.1.1.1 Carrier gas
Helium is the most commonly used carrier gas. Also nitrogen, argon and hydrogen can be used as
carrier gas. The choice of carrier gas depends upon the desired performance and the detector being
used. The carrier gas must be inert, so it won’t react with the components in the sample. It also may
not be retarded by the stationary phase of the column, so the carrier gas will reach the detector first.
The linear velocity of the carrier gas is an important parameter. It can be determined by injecting the

3
carrier gas and measuring the time from injection to detection (=retention time). The linear velocity
is the retention time divided by the column length. [1, 2]
I.1.1.2 Sample introduction
I.1.1.2.1 Types of sample introduction in GC
There are several types of sample introduction. The most common and oldest technique is the
split/splitless injection. Here the liquid sample is introduced into a heated room by a syringe. The
temperature of this room is normally minimum 50°C higher than the temperature of the column. The
sample will evaporate immediately and will be swept to the column by the carrier gas. The injection
of the sample needs to be done quickly to avoid peak broading. When using a splitless injection every
component of the sample will reach the column. To avoid overloading and contamination the
injection can be done by a split injection. Only a small part of the components will reach the column
when using a split injection.
Another type of sample introduction is the Cold On Column (COC) injection. Here the liquid sample is
introduced into a precolumn by a syringe at a low temperature. The precolumn is an uncoated
column with a wider diameter than the analytical column. This is used to avoid contamination of the
column and to refocus the liquid sample at the entrance of the analytical column. The temperature
of the COC is kept at a constant, near ambient temperature during the injection. After the injection
the GC will heat up. Because the sample is introduced directly into the column there is no
discrimination of volatile components.
The most advanced injection technique of sample introduction is a PTV-injector. PTV stands for
Programmed Temperature Vaporizor injection. The different between a PTV and a COC injection is
that the PTV contains a temperature program that can be activated in the software. PTV can heat up
very quickly. It can also be used as a COC injection. PTV can be used in split or splitless mode. [3]
I.1.1.2.2 PTV combined with TDU
Use of a PTV can be combined with a thermal desorption unit (TDU). TDU is a highly efficient thermal
desorption system. It allows the controlled transfer of thermal desorbed material to an injection
system (like PTV).
When TDU is combined with PTV sample injection (figure 2), the sample introduction device contains
2 units, a PTV and a TDU. Both PTV and TDU have a liner which can contain an adsorption or an
absorption material.
There are several kinds of liners, for example: empty glass liners, empty glass mulitbaffled liners,
liners packed with glass beads or Tenax TA or carbotrap or PDMS (polydimetylsiloxane) foam. The
liner in TDU can also contain a part of the sample itself when the sample is a solid.
In this work tenax TA is used in TDU and PTV. Tenax TA is a porous material with a specific surface
area of 35m2/g. It has a low affinity for water and methanol and adsorbs components in the C5-C20
range. Tenax TA is based on 2,6-diphenylphenylene oxide polymer (figure 3). It is used for it stability
when heated (upper limit of 350°C). The tube of PTV contains less tenax than the tube of TDU. The
tube of PTV is also smaller than the tube of TDU. [3, 4]

4
TDU
PTV
Column
Figure 2-Sample introduction for DHS: thermal desorption (TDU-PTV-Column)
[5]
Figure 3-Structure Tenax TA
[6]
There are 2 steps in the sample introduction when using the PTV in combination with the TDU:
Step 1. Thermal desorption (TDU)
The thermal desorption unit contains a liner that can contain an adsorption material used in the
sample preparation (see chapter I.2 Sample preparation, page 10). During the desorption step, TDU is
heated. While heating, the components will be desorbed from the adsorption material in TDU,
carried by helium gas and trapped on the adsorption material in the cold PTV.
Step 2. Sample injection (PTV)
PTV will be heated. While heating, the trapped components will be desorbed from the tenax in PTV,
carried by helium gas to the column. [3]
TDU and/or PTV can be used in split or splitless mode. There are different possible modes of
operation. The use of which methods depends on the type and concentration of the components
present in the sample. The 2 most important ones are mentioned in table 1. [3]

5
Table 1-Overview sample introduction when using TDU/PTV combination
Mode A B
Step 1 Desorption Splitless Splitless
Step 2 Injection Splitless Split
Software TDU Splitless Splitless
PTV Solvent Venting Solvent Venting
Mode A (splitless desorption, splitless injection):
Mode A is used for a quantitative transfer from TDU to the column. This is used when there has to be
a maximum sensitivity.
Step1: Nearly every component, desorbed from the tenax, will be carried by the helium gas and
trapped on the tenax in the cold PTV.
Step 2: Every component, trapped on the tenax of PTV of Step 1, goes quantitatively to the column.
[3]
For an efficient thermal desorption the flow in the TDU needs to be at least 20 ml/min. This flow is
too high for the column (should be 1 ml/min). The TDU and/or PTV therefore need to be in split
during the desorption step. This is done by choosing “solvent venting” in the software program,
allowing the PTV to be used in split or splitless mode. In solvent venting the valve, regulating the
split, closes during a small defined period of time. [3]
In figure 4 a pneumatic diagram of the GC, TDU and PTV during desorption step and injection step is
shown.
Pneumatic diagram during desorption step
PTV
23 ml/min
3 ml/min
16 ml/min
20 ml/min
1 ml/min

6
Pneumatic diagram during injection step
PV 1: Proportional valve
PV 2: Proportional valve
FS: Flow sensor
PS: Pressure sensor
SPR: Purge flow regulator for the septum purge
TPR: Purge flow regulator for the TDU
SV 3: Valve split/splitless of the GC pneumatic control
SV 4: Valve to switch between PTV split and TDU split Figure 4-Pneumatic diagram of the flow of the GC, TDU and PTV during desorption step and injection step
[3]
During thermal desorption step, the TDU is in splitless mode and SV4 valve is closed in TDU. The SV3
valve needs to be open, so there is no overflow in the column.
During sample injection, the PTV is in splitless mode, SV3 valve is closed in PTV. After the splitless
mode time the SV3 valve is open again. [3]
Mode B (splitless desorption, split injection):
Mode B is used whenever circumstances necessitate that not all the adsorbed material on the TDU
needs to reach the column.
Step 1: Every component, desorbed from the tenax in the TDU, will be carried by helium gas and
trapped on the tenax in the cold PTV.
Step 2: The components present on the tenax in the PTV, are splitted. This means that only a small
part reaches the column. The other part is vented through the split vent. [3]
During the thermal desorption step, the TDU is in splitless mode and the SV 4 valve is closed in TDU.
The SV3 valve needs to be open, so there is no overflow in the column (see figure 4, desorption step)
During the sample injection, the PTV is in split mode, the SV 3 valve is open in PTV. This SV 3 valve
controls the split ratio. The split ratio is the ratio of the flow in the column to the flow through the
PTV. [3]
4 ml/min
PTV
1 ml/min
7 ml/min
3 ml/min

7
I.1.1.3 Column
After the sample introduction the components reaches the column. This column contains a thin layer
of a non-volatile chemical, called the stationary phase and can be polar or non polar. The non-volatile
chemical can be coated onto the walls of the column or can be coated onto an inert solid that is
added to column. Components in the gas phase are carried through the column by the carrier gas.
They will selectively interact with the stationary phase of the column. The strength of interaction
depends on the polarity of the stationary phase and the polarity of the component. If the component
is a polar component, it will interact strongly with a polar stationary phase. The column is heated
with a temperature program. Because of its stability and the possibility of decomposition of its
components, the temperature of the column has a limit.
The column used in Scentarom is CP-Sil 8 CB. CP-Sil 8 CB is a non polar column. CP-Sil 8 CB has a
stationary phase of dimethyl polysiloxane with 5 % of the dimethyl replaced with diphenyl. Dimethyl
polysiloxane is a non polar component, but by replacing 5% of dimethyl in diphenyl the column will
be slightly less non polar, but still very non polar. Scentarom also uses carbowax as column.
Carbowax is a more polar column than CP-Sil 8 CB. In this work only CP-Sil 8 CB will be used. [1, 2]
I.1.1.4 Detector
There are several detectors used in gas chromatography. The most common used detectors are
flame ionisation detector (FID) and thermal conductivity detector (TCD).
When the GC is combined with a mass spectrometer, the GC separates the components and the mass
spectrometer serves as a detector.
I.1.2 The GC/MS Interface When the GC is combined with a MS, an interface is required. The interface transports the effluent
from the gas chromatograph to the mass spectrometer. It is a small tube on a high temperature
about 150°C. The temperature of the interface must be programmed at a certain temperature , so
the components neither condense in the interface nor decompose before entering the MS. [1, 7]
I.1.3 MS The mass spectrometer measures the mass-to-charge ratio (m/z) of gas phase ions and provides a
measure of the abundance of each ionic species. Components that are separated by the GC go in the
MS. In the MS, the components will be ionized through electron impact (bombardment). The charged
ions will be placed in a modulated electromagnetic field and sorted by their mass-to-charge ratio in
high vacuum. [7]
I.1.3.1 Sample inlet
In stand alone MS, the entire process from ionisation to detection takes place in gas phase and in
vacuum.
In sample inlet, components go to the gas phase. Liquids and solids will go in a gas chamber to
proceed in gas phase. Volatile components will evaporate immediately by vacuum. This is called
“cold inlet system”. Non volatile components will go in gas phase by heating. This is called “heated
inlet system”.
When using the hyphenated technique GC/MS, components leaving the column are already in gas
phase. Only a small quantity will reach the ion source. Carrier gas will be eliminated. [7]

8
I.1.3.2 Ionization system
The most common used ionization technique is the electron ionization (EI) (figure 5). Gaseous
molecules are brought in vacuum in the ionization chamber by column flow. In this chamber a beam
of electrons are produced by a heated filament and molecules will be ionized and defragmented by
the electrons. Resulting ions are then accelerated by the repeller and brought to the mass analyzer.
The repeller is positively charged compared to this ionization chamber. [7, 8]
Figure 5-Schematic figuration of electron ionization
[9]
The beam of electrons are perpendicular to the beam of molecules, so electrons clash with
molecules. Electrons that will not clash with the molecules will be collected on the trap. When
clashing a molecule, an electron is removed from the molecule and produces a positively charged ion
corresponding to the relative molecular mass of the sample being analysed. Also the molecule will
disintegrates in different pieces. Every piece is typical for the molecule, thus the mass spectrum gives
a fingerprint of the molecule. [8]
I.1.3.3 Mass analyzer
As mass analyzer a quadrupole analyzer (figure 6) is the most common used. A quadrupole analyzer
consists of four parallel rods that have fixed DC and alternating RF potentials applied to them. Ions
produced from the EI are focussed and passed along the middle of the 4 rods of the quadrupole
analyzer. The motion of the ions depends on the electric fields. So only ions with a particular m/z will
have a stable trajectory and will reach the detector, corresponding to a specific RF potential. Other
ions will disappear among the rods of the quadrupole analyzer. To bring ions of different m/z into
focus on the detector the RF is varied and in this way a mass spectrum is built up. The quadrupole
analyzer is used in hyphenated techniques, because of it high scan speed: it can measure up to 500
mass units in 0,005s. In Scentarom the speed of the mass analyzer is up to 4,45 scans per second. 1
scan consists of a mass spectrum of an m/z of 35 to 350. [7, 10]

9
Figure 6-Schematic figuration of a quadrupole analyzer
[11]
I.1.3.4 Ion detector
The most common used ion detector is the electron multiplier (figure 7). It will generate an increased
signal through which the ions can be detected. The electron multiplier consists of a series of dynodes
and is operating in a vacuum. When the ions reach the first dynode, the dynode will emits secondary
electrons. These generated electrons are multiplied in a cascade by the following dynodes. At the
end of the dynodes a cluster of secondary electrons will reach the anode that measures the signal.
The amplified signal will lead to the computer coupled at the MS and GC. [12]
Figure 7-Scheme of an electron multiplier
[13]
I.1.4 Computer The computer is connected to the MS by a converter which converts the signal of the MS in a signal
that can be registered by the computer. The signal is expressed into values of mass versus
abundance. The computer also registers the chromatogram of the GC.
Furthermore, the computer contains a data base of all possible mass spectra of many different
components. It compares the spectrum of the MS with the spectra in the data base. When there is a
match, the computer can tell which component it is.
In the computer there is also a software for creating several methods and adjusting parameters for
obtaining required results.

10
I.2 Sample preparation Sample preparation is needed whenever a sample contains analytes present in a complex matrix. In
this case the sample cannot be used as such and preliminary steps must be taken to prepare the
sample so it is fitted to the instrumental analyses to which it is to be subjected.
During sample preparation there is an enhanced risk of contamination and especially for SHS and
DHS, as sensibility increased considerably. Contamination can often become a major problem.
A few sample preparation techniques will here be described briefly.
I.2.1 Static headspace The word “headspace” here refers to the gas phase located above a liquid or solid phase present in a
sealed vial. The partition of volatile organic components (VOC’s) into the gas phase depends on
several factors a.o. the solubility in water or solvent (hydrophilic or hydrophobic), polarity, ionic
nature of analyte and solvent, molecular weight and temperature.
A liquid and/or solid sample is placed in a sealed vial. The sealed vial has an inert septum, mostly as a
result of teflon coating, and thus should be inert for adsorption of volatile components.
In static headspace an equilibrium is reached between the sample and gas phase. The gas phase can
be partially removed with a syringe and injected in the GC.
Another method for removing the gas phase is, placing an adsorbent material in a sealed vial so
volatile components will adsorb on the adsorbent material. The adsorbent material with the trapped
volatile components will be placed in a TDU. [14, 15]
I.2.2 Dynamic headspace
I.2.2.1 Description
Dynamic headspace (DHS) is a dynamic extraction technique. In DHS, VOC’s are continuously swept
away from the headspace onto a trap by a flow of inert carrier gas. An equilibrium is never reached
between the gas phase and the sample. The inert carrier gas can be nitrogen or helium. Sometimes
the inert carrier gas can be air, but there is a risk for oxidation. To release the components from the
trap, rapid heating is the most efficient method when using an adsorption material. Releasing the
components from the trap can be done in the TDU (see chapter I.1.1.2 Sample introduction, page 3).
The trap used in experimental work is tenax TA. [14, 16]
In practice, the DHS device contains 2 units (figure 8): a DHS station and a DHS carriage. The sample
is placed in a vial in the DHS station while the DHS carriage holds the tube containing the tenax TA.
This tube shall later be placed in the TDU unit for desorption. The DHS carriage can move forward, so
it can be placed above the sample in the DHS station.
DHS can be used for analysis of flavours and fragrances.

11
Figure 8-DHS device
[17]
I.2.2.2 Trapping of components
Figure 9-Schematic overview when trapping all components
[18]
Figure 9 gives an overview of the several steps of DHS when trapping all components. This includes
also all components which are already in the headspace above the sample before the DHS run starts.
Step 1: Before the analysis
The glass vial with the sample is sealed with a septum. Some analytes are already in the headspace
above the sample (gas phase).
Step 2: Incubation
The glass vial is placed into the DHS station. During incubation step the sample is heated up. The
incubation step includes also an agitation step, so the sample can be agitated if desired.
Step 3: Trapping
A TDU tube with an adsorption material is placed into DHS carriage above the glass vial. A double
needle is pushed through the septum into the glass vial, 1 needle for the inlet of the carrier gas in the
glass vial and 1 needle for the outlet of the carrier gas with the analytes. The carrier gas flows over
the sample and transfers the components from the headspace onto the adsorption material in the
tube above it. The carrier gas used is mostly the same as the carrier gas that will be used in the
subsequent GC analysis. During trapping the components the volume and the flow of the carrier gas
can be selected in the software.
DHS carriage
DHS station

12
During trapping 3 parameters are linked to each other:
Trapping gas volume (V)
Trapping gas flow (F)
Trapping time
Only 2 of the 3 parameters can be adjusted. Here the trapping gas volume (V) and the trapping gas
flow (F) can be adjusted. By adjusting the trapping gas volume at a constant gas flow, the trapping
time will change.
Step 4: Drying (optional)
For removing water or solvent, drying is used. Drying is done in a empty glass vial (the “drying vial”).
A defined gas flow is transferred through the drying vial and over the adsorption material in the tube.
This step is optional.
Step 5: Desorption and GC analysis
Adsorption material with the analytes, is transferred to the TDU and here the desorption and
injection step will start (see chapter I.1.1.2.2 PTV combined with TDU, page 3). [18]
In this work a DHS analysis is performed in 2 steps: incubation step (incl. agitation step) and trapping
step. Every step has a specific time and temperature.
Every step has several parameters that can be adjusted. These parameters will be described in the
experimental part of this work.
Time
Incubation step
Agitation step
Trapping step
Δti1 Δti2
Δti Δttr
Tsample i Ttr Temperature Tsample tr

13
Figure 10 gives an overview of the GC/MS (Agilent) used in Scentarom. The MPS (Gerstel) is the robot
that prepares and injects the samples. Dynamic headspace is a fully automated technique through
the use of the MPS robot.
1. Gas chromatograph
2. Mass spectrometer
3. Dynamic headspace (DHS)
4. Thermal desorption unit (TDU)
5. MPS robot
6. Tray TDU-tube Figure 10-GC/MS with configuration for DHS analysis
[19]
4 3
1 2
5
6

14
I.3 Flow charts
Figure 11-Schematic overview of GC/MS and sample preparation
[15]
I.1.1 Gas chromatography (GC)
Injection technique
Injector types
Split/splitless
(Cold) On-column
PTV Columns
I.1.2 Mass spectrometry (MS)
I.2. Sample preparation
Off-line
Filtration
Extraction
Soxhlet
Liquid-liquid
SPE Distillation
...
On-line
Headspace (HS)
Dynamic headspace (DHS)
Purge & trap
"Sweep"
Thermal extraction (TE)
Static headspace (SHS)
"Classical"
Using traps
SPME
Pyrolysis
...

15
Figure 12-Schematic overview of trapping and releasing
[15]
Trapping
Methods
Adsorption
Absorption
Materials
Zeolit
Tenax
Carbo(Trap)
PDMS
Releasing Desorption
Thermal (TDU)
Solvent

16
II Experimental part
The following subjects will be discussed:
Short overview of the several experimental methods used
Study and description of contamination caused during DHS analysis
Parameters description and adjustment for optimal analytical results
Short comparison between DHS and previous SHS techniques used in Scentarom
Analysis of odorants in a shampoo using DHS technique
II.1 Short experimental method descriptions The following methods are used in this experimental part and will be explained:
Blank TDU
Blank DHS
DHS analysis of sample
Figure 13 gives an overview of the several methods. There are 10 time laps described in the figure.
1. Incubation step DHS
During the incubation step the sample vial will be heated up and agitated if desired.
2. Trapping step DHS
During trapping step the components, present in the test sample, will be trapped on the
tenax in the DHS carriage.
3. Transport of TDU-tube from DHS to TDU
4. Pressurize
The pressurize time lap is the time the GC/MS needs to set all the parameters at start
position.
5. TDU heating
During TDU heating the TDU will heat up at a constant rate.
6. TDU hold time
The TDU hold time is the time the TDU stays on it highest temperature.
Time lap 4 and 5 are the desorption step (see chapter I.1.1.2.2 PTV combined with TDU, page
3).
7. TDU cooling
During TDU cooling the TDU cools down.
8. PTV heating + start GC runtime
During the PTV heating, the PTV will heat up with a constant speed.
The GC runtime starts with 1 minute solvent delay. This means that the detector starts to
collect the data after 1 minute. During solvent delay the solvent will reach the detector.
9. PTV hold time
PTV hold time is the time the PTV stays on it highest temperature.
Time lap 8 and 9 are the injection step (see chapter I.1.1.2.2 PTV combined with TDU, page
3).
10. Running

17
II.1.1 Blank TDU The method blank TDU consists of 7 time laps (figure 13):
During blank TDU time lap 1,2 and 3 are not performed. The GC starts directly with pressurize.
4. Pressurize
The duration of this time lap is 1 min. The temperature of the TDU will be 50 °C, the
temperature of the PTV will be 20 °C, the GC-oven will have a temperature of 50 °C and the
flow will be 24 ml/min.
5. TDU heating
The duration of the TDU heating is 2 min. The TDU will heat up with a velocity of 100 °C/min
and the flow will be 54 ml/min.
6. TDU hold time
This is the time lap the TDU stays on a temperature of 250 °C and a flow over the TDU of 54
ml/min. The duration of this time lap is 5 min.
7. TDU cooling
The TDU will cool down to 90 °C in 15 s. The flow is 54 ml/min.
8. PTV heating + start GC runtime
Here the PTV will heat up with a speed of 10 °C/s for 25 s. The flow over the PTV will be 14
ml/min. The runtime of the GC starts and after 1 minute solvent delay the detector will
collect the data of the analysis.
9. PTV hold time
This is the time lap the PTV stays on a temperature of 250 °C. The duration of this time lap is
10 min. The flow goes from 14 ml/min to 24 ml/min.
10. Running
The GC will run for 23 min 40 s with a velocity of 10 °C/min until a temperature of 240 °C is
reached. This is the green line of GC-oven in figure 13.
Data are collected as a control for the blank-level of the blank TDU.
II.1.2 Blank DHS The method blank DHS consists of 10 time laps (figure 13):
1. Incubation step DHS
During the incubation step the transfer heater will be 150 °C, the incubation temperature
30°C, the agitator speed 500 rpm. The duration of the incubation step is 1 min.
2. Trapping step DHS
During the trapping step the transfer heater will be 150 °C, the incubation temperature 30 °C
and the trapping flow 50 ml/min. The duration of the incubation step is 2 min.
3. Transport of TDU-tube from DHS to TDU
During the transport the DHS flow will be 1 ml/min.
4. Pressurize
The duration of this time lap is 1 min. The temperature of the TDU will be 50 °C, the
temperature of the PTV will be 20 °C, the GC-oven will have a temperature of 50 °C and the
flow will be 24 ml/min.
5. TDU heating
The duration of the TDU heating is 2 min. The TDU will heat up with a velocity of 100 °C/min
and the flow will be 54 ml/min.

18
6. TDU hold time
This is the time lap the TDU stays on a temperature of 250 °C and a flow over the TDU of 54
ml/min. The duration of this time lap is 5 min.
7. TDU cooling
The TDU will cool down to 90 °C in 15 s. The flow is 54 ml/min.
8. PTV heating + start GC runtime
Here the PTV will heat up with a speed of 10 °C/s for 25 s. The flow over the PTV will be 14
ml/min.
9. PTV hold time
This is the time lap the PTV stays on a temperature of 250 °C. The duration of this time lap is
10 min. The flow goes from 14 ml/min to 24 ml/min.
10. Running
The GC will run for 23 min 40 s with a velocity of 10 °C/min until a temperature of 240 °C is
reached. This is the green line of GC-oven in figure 13.
Data are collected as a control for the blank-level of the blank DHS.
II.1.3 DHS analysis of sample The method DHS analysis of sample consists of 9 time laps (figure 13):
1. Incubation step DHS
During the incubation step the transfer heater will be 150 °C, the incubation temperature
30°C, the agitator speed 500 rpm. The duration of the incubation step is 1 min.
2. Trapping step DHS
During the trapping step the transfer heater will be 150 °C, the incubation temperature 30 °C
and the trapping flow 50 ml/min. The duration of the incubation step is 2 min.
3. Transport of TDU-tube from TDU to DHS
During the transport the DHS flow will be 1 ml/min.
4. Pressurize
The duration of this time lap is 1 min. The temperature of the TDU will be 50 °C, the
temperature of the PTV will be 20 °C, the GC-oven will have a temperature of 50 °C and the
flow will be 24 ml/min.
5. TDU heating
The duration of the TDU heating is 2 min. The TDU will heat up with a velocity of 100 °C/min
and the flow will be 54 ml/min.
6. TDU hold time
This is the time lap the TDU stays on a temperature of 250 °C and a flow over the TDU of 54
ml/min. The duration of this time lap is 5 min.
7. TDU cooling
The TDU will cool down to 90 °C in 15 s. The flow is 54 ml/min.
8. PTV heating + start GC runtime
Here the PTV will heat up with a speed of 10 °C/s for 25 s. The flow over the PTV will be 14
ml/min.
9. PTV hold time
This is the time lap the PTV stays on a temperature of 250 °C. The duration of this time lap is
10 min. The flow goes from 14 ml/min to 24 ml/min.

19
10. Running
The GC will run for 74 min 20 s with a velocity of 3 °C/min until a temperature of 240 °C is
reached. This is the red line of GC-oven in figure 13.

1 2 3 4 5 6 7 8
9 10
25 °C
150 °C
1 min 0 min 3 min 4 min 5 min 7 min 12 min 15 s
24 s 0 s 1 min 10 min 25 s 23 min 40 s 65 min 20 s 74 min 20 s
30 °C
500 rpm
50 ml/min
5 ml/min 1 ml/min
5 ml/min
30 °C
300 °C
50 °C 100 °C/min
250 °C 90 °C 123 °C
20 °C 10 °C/s
250 °C 100 °C
50 °C 3 °C/min
250 °C
Solvent delay
24 ml/min
50 ml/min
10 ml/min 24 ml/min
10 °C/min
250 °C
SS SS SS SS
DHS Trap
Transfer
heater
Incubation
temperature
(Tsample i)
Agitator speed
Trapping flow
Incubation
temperature
(Tsample tr)
TDU transfer
TDU
temperature
PTV
temperature
GC
temperature
Data
Flow
GC/MS
Figure 13-Schematic overview of parameters of DHS and GC/MS Sample preparation GC/MS analysis
SS
12 min
20
DHS

21
TDU head
(inox)
O-rings
(rubber)
Tenax tube
(glass)
Vial
(glass)
II.2 Contamination
II.2.1 Introduction Scentarom produces flavours and fragrances for various applications. As a consequence a strong
background odour is present in the laboratories and production facilities. Thus, whenever the
adsorbent material (tenax) is in contact with the open environment within Scentarom, contamination
inevitably takes place. Detailed study of this contamination is absolutely necessary in order to master
(and if possible to eliminate) its influence on later analytical results.
II.2.2 Sources where contamination can occur To understand the sources of contamination next chapters has to be read first:
chapter I.1.1.2.2 PTV combined with TDU, page 3
chapter I.2.2 Dynamic headspace, page 10
PTV-liner TDU-tube sample vial Figure 14-Figuration of PTV-liner, TDU-tube and sample vial
Figure 14 gives a figuration of PTV-tube, TDU-tube and sample vial used in GC/MS. For photos of PTV-
tube, TDU-tube and sample vial: see attachment 2, page 55.
The following steps can cause contamination:
Preservation conditions of adsorption material (tenax in tenax tube and tenax in tenax liner)
TDU-tube in TDU-tray
PTV-liner in PTV
TDU-tube in TDU
Unlocking of TDU
Transporting TDU-tube to DHS carriage
Septum of sample vial
DHS carriage
DHS station
Sealing
(graphite)
Tenax
Tenax liner
(glass)
Tenax
Septum
(rubber +
teflon)

22
O-rings on TDU head
Carriers
II.2.3 Measurement of contamination
II.2.3.1 Preservation conditions of adsorption material (tenax in tenax tube and tenax in
tenax liner)
There is a strong background odour present within Scentarom. This background odour causes a lot of
contamination when the tenax in tenax tube and tenax liner are in contact with this background
odour. To reduce the contamination of the tenax in tenax tube and tenax liner a serie of blank TDU
has be performed before starting a DHS analysis.
Former test shows that the contamination can be reduced by keeping the tenax in a glass jar sealed
with aluminium foil. There will be less contamination, so less blank TDU will have to be performed to
reduce the contamination. (see thesis Pien and chapter II.2.4 Conclusion, page 30)
II.2.3.2 TDU-tube in TDU-tray
The TDU-tube needs to be placed in the TDU-tray when starting a DHS analysis. When performing a
DHS analysis the TDU-tube goes from TDU-tray to the DHS station. The time the TDU-tube is in TDU-
tray is 5 min. The contamination of the TDU-tube in TDU-tray is given in figure 15.
Figure 15-Chromatogram of contamination of TDU-tube (containing tenax) in tray
Conclusion:
TDU-tube in TDU-tray causes contamination. This contamination can be eliminated by performing
analyses in a sequence. When performing a sequence of analyses, the movement of the TDU is done
by the MPS robot. This robot moves the tenax tube in the TDU directly to the DHS station without
staying in the tray. The several steps of the MPS robot when performing a sequence of
measurements are given in attachment 1, page 54.
II.2.3.3 PTV-liner in PTV
When there is no analysis performed the PTV-liner stays in the PTV for technical and practical
reasons. The PTV is not airtight, so during standby the PTV-liner is exposed to the open environment

23
within Scentarom. This contamination is tested when the PTV-liner was respectively 1 day, 3 days
and 1 week present in the PTV. The results are given in figure 16.
Figure 16-Results of PTV-liner in PTV
The chromatograms of these tests are given in attachment (see attachment 3, page 55-56).
Conclusion:
The PTV-liner causes contamination. When no analyses are performed, the tenax in the tenax liner
adsorbs odour molecules present in the open environment within Scentarom. The tenax liner needs
to be free of contamination before starting a DHS analysis. To reduce the contamination of the PTV-
liner in the PTV a sequence of blank analyses (i.e. TDU blank) needs to be done. After a few analyses
the tenax in the PTV-liner will be blank.
In all further tests the PTV-liner will remain in the PTV during each analysis.
II.2.3.4 TDU-tube in TDU
The TDU-tube is kept outside Scentarom to reduce the contamination of the tenax in the tenax tube.
The contamination is tested when the TDU-tube was 3 days, 1 week and 2 months exposed in an
open environment outside Scentarom. The results are given in figure 17.
0,00E+00
1,00E+08
2,00E+08
3,00E+08
4,00E+08
5,00E+08
6,00E+08
7,00E+08
8,00E+08
9,00E+08
1,00E+09
Are
a (a
bso
lute
)
Total area of contamination of PTV-liner in PTV
1 day
3 days
1 week

24
Figure 17-Results of contamination of TDU-tube in TDU
The chromatograms of these analysis are given in attachment (see attachment 4, page 56-57).
Conclusion:
The tenax in the tenax tube adsorbs odour molecules even when the tenax is not exposed to the
open environment within Scentarom. To eliminate this contamination the tenax in the tenax tube
needs to be free of contamination before starting a DHS analysis. To reduce the contamination of the
TDU-tube in TDU, a sequence of blank TDU needs to be done. After a few analyses the tenax in the
TDU-tube will be blank.
To reduce the total time of measurements, the TDU-tube and PTV-liner will be made free of
contamination during the same sample analysis sequence.
II.2.3.5 Unlocking of TDU
When the TDU-tube goes to the DHS carriage, the TDU will be unlocked and open for 45 seconds. The
contamination of this step is tested and the result is given in figure 18.
0,00E+00
5,00E+07
1,00E+08
1,50E+08
2,00E+08
2,50E+08
3,00E+08
3,50E+08
4,00E+08
4,50E+08
Are
a (a
bso
lute
) Total area of contamination of TDU-tube in TDU
3 days
1 week
2 months

25
Figure 18-Chromatogram of contamination when the TDU is open for 45 seconds
Conclusion:
When the TDU is unlocked and open for 45 seconds, it causes negligible contamination.
II.2.3.6 Transporting TDU-tube to DHS carriage
When the TDU-tube is transported to DHS carriage, the TDU-tube will be exposed to the open
environment within Scentarom for 1 minute. The contamination of this step is tested and the result is
given in figure 19.
Figure 19-Chromatogram of test of transporting TDU-tube to DHS carriage
Conclusion:
Transporting the TDU-tube to the DHS carriage will not cause much contamination, so this step has
also negligible effect on the presence of contamination.

26
II.2.3.7 Septum of the sample vial
Figure 20-Figuration of septum of sample vial
The sample vial septum contains rubber and teflon (figure 20). Rubber is known for its adsorption of
odour molecules. In this test an empty sample vial with the same septum is measured for several
consecutive times. The result is given in figure 21.
Figure 21-Result for contamination of septum of the sample vial
Conclusion:
The contamination increases slightly. This can be explained by the fact that when the rubber and
teflon are pierced, the contamination of the rubber (odorous material adsorbed on the rubber) can
0,00E+00
1,00E+07
2,00E+07
3,00E+07
4,00E+07
5,00E+07
6,00E+07
7,00E+07
8,00E+07
1 2 3 4 5 6 7 8 9 10 11 12 13
Are
a (a
bso
lute
)
Total area of contamination of different blank DHS analyses
rubber
teflon
Movement of needles in DHS carriage
Needles

27
go into the sample vial through the pierced teflon. The described contamination can be avoided
through the use of new septa for each analysis. Changing the septa for every analysis is however not
expected to be essential.
II.2.3.8 DHS station and DHS carriage
The DHS station and DHS carriage are not airtight. There are o-rings made of rubber present in the
DHS carriage, these rubber o-rings can also cause contamination. The o-rings cannot be removed for
technical reasons, so the contamination caused by the o-rings in the DHS carriage cannot be reduced.
The contamination of the DHS station and DHS carriage is tested and the results are given in figure
22.
Figure 22-Results for contamination of blank DHS
The chromatogram of blank DHS is given in attachment (see attachment 5, page 57).
Conclusion:
The DHS station and carriage causes a lot of contamination. The amount of contamination is shown
by the difference in total area in figure 22. This significant contamination cannot be reduced.
However the influence of the contamination on the analytical results can be minimized by increasing
the split ratio. (see chapter II.3.3 Split ratio R in PTV, page 33).
II.2.3.9 O-rings on TDU-head
The O-rings of the TDU-head are made of rubber. Rubber is known for its adsorption of odour
molecules. The contamination is tested when the TDU head is exposed in the open environment
within Scentarom for respectively 1 min and 1 day. It is also tested when the TDU head is wrapped in
0,00E+00
5,00E+06
1,00E+07
1,50E+07
2,00E+07
2,50E+07
3,00E+07
3,50E+07
Are
a (a
bso
lute
)
Total area
Transporting TDU-tubeto DHS carriage
Blank DHS

28
aluminium foil and exposed in the open environment within Scentarom for respectively 1 day and 1
week. The results are given in figure 23.
Figure 23-Contamination of O-rings on TDU head
The chromatograms of these tests are in attachment (see attachment 6, pages 57-58).
Conclusion:
The O-rings on the TDU head causes contamination. To avoid this contamination the TDU heads are
kept in an open environment outside Scentarom.
II.2.3.10 Carrier
When preparing a test sample for DHS analysis, the sample needs to be diluted. Silica and a
carbohydrate are used as carrier. Silica and carbohydrate are solids that can adsorb odour molecules,
so can cause contamination. The contamination of carbohydrate and silica is tested when exposed in
open environment within Scentarom and when exposed in an open environment outside Scentarom.
The results are given in figure 24.
0
10000000
20000000
30000000
40000000
50000000
60000000
70000000
80000000
Are
a (a
bso
lute
)
Total area of O-rings on TDU head
1 min
1 day
1 day in aluminium foil
1 week in aluminium foil

29
Figure 24-Results of contamination of carbohydrate and silica
The chromatograms of these test are in attachment (see attachment 7, page 59-60).
Conclusion:
Carbohydrate causes a lot of contamination. Also silica adsorbs components present in the open
environment within Scentarom. To reduce this contamination carbohydrate and silica need to be
kept in a glass jar in an open environment outside Scentarom. After each use, the carriers need to be
exposed to open air outside Scentarom during several hours before closing the jar.
0,00E+00
5,00E+07
1,00E+08
1,50E+08
2,00E+08
2,50E+08
Are
a (a
bso
lute
) Total area of carbohydrate and silica
Carbohydrate exposedin open environmentat Scentarom
Carbohydrate 2 daysexposed in openenvironment outsideScentarom
Silica exposed in openenvironment atScentarom
Silica 2 days exposed inopen environmentoutside Scentarom

30
II.2.4 Conclusion To reduce the contamination of the TDU-tube in TDU and the PTV-liner in PTV a sequence of blank
analyses needs to be done. The results of these blank analyses are given in figure 25.
Figure 25-Chromatograms of blank TDU
The first chromatogram in figure 25 is the contamination of the tenax before performing a blank TDU
and the second chromatogram is the contamination the tenax after performing a blank TDU.
After 2 measurements the tenax in the tenax tube and tenax liner are reduced to almost blank.
These analyses must be done before performing a DHS analysis.
Also the septum of the sample vial needs to replaced after every analysis.
After using carbohydrate and silica these adsorbens needs to be exposed in an open environment
outside Scentarom.
before
after

31
Thus:
When performing a DHS analysis, the following sequence is performed.
1. Blank TDU
Blank TDU is performed to eliminate the contamination on the tenax. This analysis will be
repeated till the tenax is blank. When the tenax is blank (see figure 25), blank DHS will start.
2. Blank DHS
Blank DHS is a DHS analysis with an empty sample vial. This is performed to evaluate the
contamination of a DHS analysis.
3. DHS analysis of sample
This is a DHS analysis of a sample in the sample vial.

32
II.3 Parameters
II.3.1 Introduction The DHS technique can be described in 3 steps: incubation step, trapping step and drying step (see
chapter I.2.2.2 Trapping of components, page 11). Every step of the DHS device has several
parameters that can be adjusted.
The next parameters will be tested:
Split ratio R in PTV (see chapter I.1.1.2.2 PTV combined with TDU, page 3)
Sample temperature (Tsample i and Tsample tr)
Incubation time Δti (Δti = Δti1 + Δi2)
Trapping gas flow F (V=constant)
Trapping gas volume V (F=constant)
The trap temperature (Ttr) is also a parameter that can be tested. This parameter is not tested in this
work. Indeed, the temperature in the laboratories of Scentarom is 25°C, so a lower temperature is
not possible. A higher temperature is has no advantage, because the components with a low boiling
point will not adsorb on the tenax in the tenax tube when trapping the components.
Table 2-Overview of the split ratio and the start split ratio
Range Start
Split ratio (R) 1/1-1/1250 1/10
Table 3-Overview of the parameters of steps of the DHS and the start parameters
Range Start
Transfer Heater 50-150 °C 150°C
Incubation step (incl. agitation step)
Incubation Temperature (Tsample i)
10-200°C 30°C
Total incubation Time (Δti)
0-600 min 1 min
Agitator On Time (Δti2) 0-600 s 60 s
Agitator Off Time 0-300 s 1 s
Agitator Speed 250-1500 rpm 500 rpm
Trapping step Volume (V) 10-100000 ml 100,0 ml
Flow (F) 5-100 ml/min 50,0 ml/min
Trap Temperature (Ttr) 20-70 °C 25 °C
Incubation Temperature (Tsample tr)
10-200 °C 30 °C
Time (Δttr) / 2 min
Drying step (optional)
Volume 10-100000 ml 0 ml
Flow 5-100 ml/min /
Trap Temperature (Tdr)
20-70 °C /
Incubation Temperature (Tsample dr)
10-200 °C /
Time / /
Table 2 gives the split range and start value.

33
Table 3 gives an overview of the several parameters used in the DHS. It also gives the range of the
parameters. All these parameters will be tested, and the best result will be selected.
The last column in table 3 shows the start values of the parameters. These values will be adjusted to
the most efficient value.
II.3.2 Test sample The test sample used for parameter control consists of 12 components (table 4).
Table 4-Overview of components in test sample
Number in chromatogram
(see attachments)
Component (structures see attachment 8,
page 60)
Boiling Point (°C)
Molecular weight (g/mol)
Retention time (min)
1 diacetyl 88 86 5,2
2 ethyl acetate 77 88 5,5
3 cis-3-Hexenol 157 100 11,7
4 benzaldehyde 178 106 16,7
5 ethyl hexanoate 168 128 18,0
6 phenylethyl alcohol 220 122 24,1
7.I & 7.II citronellal 206 154 25,8 + 26,3
8 eugenol 256 164 35,3
9 b-ionone 128 192 40,8
10 g-undecalactone 297 184 44,5
11 thibetolide 280 240 54,4
12 benzyl salicylate 335 228 55,7
Boiling point and molecular weight were found in data sheets of the products.
The elution time of the components depends a.o. on boiling point, polarity and molecular weight of
each components and column characteristics. These components show a good dispersion in the
chromatogram. These components are representative for the most common chemical classes used
when producing fragrance and flavours.
II.3.3 Split ratio R in PTV See chapter I.1.1.2.2 PTV combined with TDU, page 3.
Split ratio is an important parameter.
The concentration of the samples has been adapted so as to keep the amount of all injected
components on the column independent from the split ratio used. After each analysis a blank DHS
was performed to evaluate the contamination (see figure 26)
The parameters of DHS for performing a DHS analysis are in attachment (see attachment 9, page 61).
The following split ratios have been tested (table 5):
Table 5-Overview of the different split ratios and corresponding concentrations that have been tested
Test 1 Test 2 Test 3 Test 4
Split ratio (R) 1/10 1/25 1/50 1/100
Concentration (ppm) 100 250 500 1000

34
Results:
Figure 26-Total area of test sample and total area of contamination
0,00E+00
5,00E+07
1,00E+08
1,50E+08
2,00E+08
2,50E+08
3,00E+08
3,50E+08
4,00E+08
4,50E+08
Splitratio 1/10 Splitratio 1/25 Splitratio 1/50 Splitratio 1/100
are
a (a
bso
lute
)
split ratio
total area
Total area of testsample
Total area of blankDHS
Split ratio 1/10
Split ratio 1/25

35
Figure 27-Chromatogram of blank analysis of split ratio 1/10, 1/25, 1/50 and 1/100
Figure 27 shows the chromatograms of a DHS analysis of an empty glass vial, so the peaks on the
chromatogram are contamination present in the glass vial or contamination present during
performing a DHS analysis.
Conclusion:
By increasing the split ratio, less contamination will reach the column and will be detected. This
means that the contamination is present in the DHS unit and not in the test sample. Increasing the
split ratio from 1/50 to 1/100, has minor advantage. The chosen split ratio for further testing will be
1/50 and concentration of the samples will be 500 ppm.
II.3.4 Sample temperature (Tsample i and Tsample tr) during incubation step and
trapping step See chapter I.2.2.2 Trapping of components, page 11.
The sample temperature is the temperature of the sample in the glass vial during incubation step
(Tsample i) and trapping step (Tsample tr) and are kept equal.
The concentration of the samples will be 500 ppm, the split ratio 1/50. (see attachment 10, page 61).
The following incubation temperatures will be tested (table 6):
Table 6-Overview of the different incubation temperatures that have been tested
Test 1 Test 2 Test 3 Test 4 Test 5
Sample temperature Tsample i and Tsample tr (°C)
30 50 65 75 85
Split ratio 1/50
Split ratio 1/100

36
Results:
Figure 28-Influence of incubation temperature on the relative area and the total area of the components trapped
The chromatograms of these tests are in attachment (see attachment 11, page 62-63)
0
5
10
15
20
25
30
are
a (r
ela
tive
in %
)
Components
Relative area
30°C
50°C
65°C
75°C
85°C
0,00E+00
5,00E+08
1,00E+09
1,50E+09
2,00E+09
2,50E+09
3,00E+09
3,50E+09
4,00E+09
4,50E+09
are
a (a
bso
lute
)
Total area
30°C
50°C
65°C
75°C
85°C

37
Conclusion:
The sample temperature has a significant influence on the signal. When using a low incubation
temperature the components with a smaller elution time will have a higher area.
When using 30 °C, benzyl salicylate is not detectable. When using 85°C diacetyl and ethylacetate are
almost not detectable. An incubation temperature of 65°C and 75°C shows the best results. An
incubation temperature of 65°C will be selected, as a higher temperature could decompose the
components.
When analysing a sample with components that have a lower retention time, an incubation
temperature of 30 °C will be preferred.
II.3.5 Total incubation time Δti See chapter I.2.2.2 Trapping of components, page 11.
The total time Δti consists of two time intervals: incubation time and agitation time. The total
incubation time Δti and agitation time Δti2 can be selected. By adjusting those 2 parameters the
incubation time Δti1 will change automatically.
The concentration of the sample is 500 ppm, the split ratio is 1/50 and the incubation temperature is
65°C. (see attachment 12, page 64).
The following incubation times will be tested (table 7):
Table 7-Overview of the different incubation times that have been tested
Test 1 Test 2 Test 3 Test 4 Test 5 Test 6 Test 7
Total incubation time Δti 0 min 15 s 1 min 2 min 5 min 10 min 15 min
Agitation time Δti2 0 15 s 1 min 2 min 5 min 10 min 10 min
Incubation time Δti1 (min) 0 0 0 0 0 0 5 min

38
Results:
Figure 29-Influence of incubation time on the relative area and the total area of the components trapped
The chromatograms of these tests are in attachment (see attachment 13, page 64-66).
0
5
10
15
20
25
are
a (r
ela
tive
in %
)
Components
Relative area
0 min
15 s
1 min
2 min
5 min
10 min
15 min
0,00E+00
5,00E+08
1,00E+09
1,50E+09
2,00E+09
2,50E+09
3,00E+09
3,50E+09
are
a (a
bso
lute
)
Total area
0 min
15 s
1 min
2 min
5 min
10 min
15 min

39
When there is no incubation step, the total area of the components is low. An incubation step of 15 s
does not give much improvement. One minute incubation gives a significant increase of the total
area, but further increase gives limited ameliorations (see figure 29).
Conclusion:
The incubation step is necessary to trap the components with a higher elution time. It has a
minimum duration required to trap the components with a higher elution time.
To reduce the total time of a DHS analyse an incubation time of 5 minutes will be selected.
II.3.6 Trapping gas flow F (V=constant) See chapter I.2.2.2 Trapping of components, page 11.
When adjusting the trapping gas flow at a constant trapping gas volume, the trapping time (Δttr) will
change.
The concentration of the sample is 500 ppm, the splitratio is 1/50, the incubation temperature is
65°C and the incubation time is 5 minutes. (see attachment 14, page 67).
The following trapping flows will be tested (table 8):
Table 8-Overview of the different trapping gas flows that have been tested
Test 1 Test 2 Test 3 Test 4 Test 5
Trapping gas flow F (ml/min) 5 10 25 50 100
Trapping gas volume V (ml) 100 100 100 100 100
Trapping time Δttr (min) 20 10 4 2 1

40
Results:
Figure 30-Influence of trapping gas flow on the relative area and the total area of the components trapped
The chromatograms of these test are in attachment (see attachment 15, page 67-69)
0
5
10
15
20
25
30
are
a (r
ela
tive
in %
)
Components
Relative area
5 ml/min
10 ml/min
25 ml/min
50 ml/min
100 ml/min
0,00E+00
5,00E+08
1,00E+09
1,50E+09
2,00E+09
2,50E+09
3,00E+09
are
a (a
bso
lute
)
Total area
5 ml/min
10 ml/min
25 ml/min
50 ml/min
100 ml/min

41
Conclusion:
The trapping gas flow has a minor influence on the amount of the components trapped. However
when using a lower trapping gas flow the trapping time will increase. To reduce the total time of an
DHS analysis to a reasonable time, a flow of 50 ml/min will be selected.
II.3.7 Trapping gas volume V (F=constant) See chapter I.2.2.2 Trapping of components, page 11.
When adjusting the trapping gas volume at a constant trapping gas flow, the trapping time (Δttr) will
change.
The concentration of the sample is 500 ppm, the split ratio is 1/50, the incubation temperature is
65°C, the incubation time is 5 minutes and the trapping flow is 50 ml/min. (see attachment 16, page
69).
The following trapping flows will be tested (table 9):
Table 9-Overview of the different trapping gas volumes that have been tested
Test 1 Test 2 Test 3 Test 4 Test 5
Trapping gas volume V (ml) 10 50 100 150 200
Trapping gas flow F (ml/min) 50 50 50 50 50
Trapping time Δttr 12 s 1 min 2 min 3 min 4 min

42
Results:
Figure 31-Influence of trapping gas volume on the relative area and the total area of the components trapped
0
5
10
15
20
25
30
are
a (r
ela
tive
in %
)
Components
Relative area
10 ml
50 ml
100 ml
150 ml
200 ml
0,00E+00
5,00E+08
1,00E+09
1,50E+09
2,00E+09
2,50E+09
3,00E+09
are
a (a
bso
lute
)
Total area
10 ml
50 ml
100 ml
150 ml
200 ml

43
The chromatograms of these tests are in attachment (see attachment 17, page 70-71)
Conclusion:
The trapping gas flow has a considerable influence. When increasing the trapping gas flow the
components with a higher elution time will have a higher area. The total area of components trapped
changes dramatically with the volume V increased. This change seems to be asymptotic. The
difference between 150 ml and 200 ml becomes minor, so 150 ml as trapping gas volume can be
selected.
II.3.8 Reproducibility The concentration of the sample is 500 ppm, the split ratio is 1/50, the incubation temperature is
65°C, the incubation time is 5 minutes, the trapping flow is 50 ml/min and the trapping volume is 150
ml. (see attachment 18, page 72).
The DHS analysis is repeated seven times. Each time a new test sample was prepared. The results are
given in figure 32.

44
Results:
Figure 32-Reproducibility of DHS on the absolute area of each component and the total area of all components trapped
0,00E+00
1,00E+08
2,00E+08
3,00E+08
4,00E+08
5,00E+08
6,00E+08
7,00E+08
8,00E+08
are
a (a
bso
lute
)
Components
Absolute area
Test 1
Test 2
Test 3
Test 4
Test 5
Test 6
Test 7
0,00E+00
5,00E+08
1,00E+09
1,50E+09
2,00E+09
2,50E+09
3,00E+09
3,50E+09
4,00E+09
are
a (a
bso
lute
)
Total area
Test 1
Test 2
Test 3
Test 4
Test 5
Test 6
Test 7

45
Table 10-Total area of the individual analyses
Total area
Test 1 2794640112
Test 2 3569893897
Test 3 2582285857
Test 4 2682901118
Test 5 2521646021
Test 6 3154605386
Test 7 2769350731
Table 10 gives the total areas of the individual analyses.
Test 2 has a higher total area than the other tests, so the Dixon-Q test and the 4s standard has been
performed to evaluate the result of test 2.
Conclusion:
After performing the Dixon-Q test and the 4s standard there can be concluded that test 2 is no
outliner. The reproducibility of these results are sufficient enough to use this method in further
analyses, as Scentarom will be in the future more interested in relative ratio among constituent of
compositions (see attachment 19, page 72).
II.4 Comparing DHS analysis and SHS analysis A SHS-type analysis has been performed and described by Pien earlier [15]. The concentration of the
test sample when performing a SHS is 100 ppm with a split ratio 1/10.
The concentration of the test sample when performing a DHS is 500 ppm with a split ratio 1/50.
Results are given in Figure 33:
0
5
10
15
20
25
30
are
a (r
ela
tive
in %
)
Components
Relative area
DHS
SHS

46
Figure 33-Comparing DHS with SHS on the absolute, relative and total area of the components trapped
The chromatograms of these tests are in attachment (see attachment 20, page 73).
0,00E+00
1,00E+08
2,00E+08
3,00E+08
4,00E+08
5,00E+08
6,00E+08
7,00E+08
are
a (a
bso
lute
)
Components
Absolute area
DHS
SHS
0,00E+00
5,00E+08
1,00E+09
1,50E+09
2,00E+09
2,50E+09
3,00E+09
are
a (a
bso
lute
)
Total area
DHS
SHS

47
Conclusion:
The sensitivity of DHS and SHS are in the same magnitude for this test sample (fragrance compounds
on carrier).
DHS has a higher sensitivity for the central components like citronellal and phenylethyl alcohol.
DHS however is a fully automated technique through the use of the robot, which gives an advantage
over SHS when several samples must be treated.
II.5 Shampoo When analysing the shampoo four different methods of diluting the shampoo were performed. This
is done to see which method gives the best results.
The split ratio is adapted accordingly to keep the responses within dynamic range.
Four different methods:
1. 100 % shampoo
2. 50 % shampoo + 50 % H2O
3. 50 % shampoo + 50 % silica
4. 25 % shampoo + 25 % H2O + 50 % silica
These 4 test shampoos were analysed with a different split ratio and the results are given in Fout!
Verwijzingsbron niet gevonden.:
1. Analysed with split ratio 1/250
2. Analysed with split ratio 1/250
3. Analysed with split ratio 1/100
4. Analysed with split ratio 1/50
100 % shampoo

48
50 % shampoo + 50 % H2O
50 % shampoo + 50 % silica

49
Figure 34-Chromatograms of shampoo with concentration of 100 % shampoo, 50 % shampoo 50 % H2O, 50 % shampoo 50 % silica and 25 % shampoo 25 % H2O 50 % silica
Conclusion:
When analysing the shampoo diluted in silica, all peaks are separated and have symmetrical shape.
When analysing the shampoo with a concentration of 100 % or diluted in 50 % H2O, not all peaks are
separated or have a symmetrical shape, see figure 34 chromatogram one and two. The reason why
these peaks are not separated is not known. Further tests has to be done.
25 % shampoo + 25 % H2O + 50 % silica

50
Conclusion
Study of the DHS technique for fragrant compositions in Scentarom reveals following features:
A. Contamination
Contamination is caused by following steps (+ appropriate reduction):
Preservation conditions of adsorption material (tenax in tenax tube and tenax in tenax
liner)
These materials are now kept in a glass jar sealed with aluminium outside Scentarom.
TDU-tube in TDU-tray
This contamination is eliminated by performing analyses in sequence, so the TDU-tube
doesn’t have to stay in the TDU-tray.
PTV-liner in PTV and TDU-tube in TDU
The PTV-liner and TDU-tube cause contamination when no analyses are performed. This
contamination is eliminated by performing a sequence of blank TDU.
DHS station and DHS carriage
This contamination cannot be reduced. However the influence of the contamination on
the analytical results can be minimized by increasing the split ratio.
O-rings on TDU-head
This contamination will be avoided by keeping the O-rings in an open environment
outside Scentarom.
Carrier
To reduce this contamination the carriers are kept in a glass jar in an open environment
outside Scentarom.
Steps that give negligible contamination:
Unlocking of TDU
Transporting TDU-tube to DHS carriage
Septum of the sample vial
B. The following experimental parameters were tested:
Split ratio R in PTV
Sample temperature (Tsample i and Tsample tr) during incubation step and trapping step
By increasing the sample temperature the components with a higher elution time will
have a higher area.
Total incubation time Δti
The incubation time is necessary to trap the components with a higher elution time. It
has a minimum duration required to trap the components with a higher elution time.
Trapping gas flow F
The trapping gas flow has a minor influence on the amount of the components trapped.
Trapping gas volume V
The trapping gas flow has a considerable influence. When increasing the trapping flow
the components with a higher elution time will have a higher area.

51
As a result, optimal experimental parameter settings are:
Spit ratio: 1/50
Sample temperature: 65 °C
Total incubation time: 5 min
Trapping gas flow: 50 ml/min
Trapping gas volume: 150 ml
C. Comparing DHS analysis to SHS-type analysis:
The sensitivity of DHS and SHS-type are similar for this test sample and test conditions.
However, DHS has a higher sensitivity for the medium volatile components. Furthermore,
DHS is a fully automated technique through the use of the robot, which makes it the method
of preference.

52
Bibliography
1. Fulton G. Kitson, B.S.L., Charles N. McEwen, gas chromatography and mass spectrometry, a practical guide. 1996, California: Academic Press, Inc.
2. Kyaw Thet, N.W. gas chromatography. 2007 [cited 2014 14 february]; Available from: http://chemwiki.ucdavis.edu/Analytical_Chemistry/Instrumental_Analysis/Chromatography/Gas_Chromatography.
3. Gerstel, Thermal Desorption Unit TDU with C506-Operation Manual. 2009: Gerstel. 4. Gerstel. Thermal Desorption Unit TDU-certified supplies. 2013 [cited 2014 18 march];
Available from: http://www.gerstel.com/pdf/s00135-702-02-Supplies-TDU-en.pdf. 5. R.I.C., SHS-DHS-TD-TE-SBSE-HSSE. 2012. 6. Lagard, D., G.A. Reiner, and G.W. Christensen. Analysis of the headspace proximate a
substrate surface containing fragrance-containing microcapsules. 2004 [cited 2014 6 may]; Available from: http://www.google.com/patents/US7531365.
7. Verberckmoes, A., Spectroscopische technieken. 2012, Gent. 8. Electron impact. [cited 2014 14 march]; Available from:
http://www.birmingham.ac.uk/facilities/chemical-analysis/mass-spec/electron-impact.aspx. 9. Mass Spectrometry Tutorial. [cited 2014 18 march]; Available from:
http://tera.chem.ut.ee/~jpenchuk/documents/kursused/Mass-spec/2.htm. 10. Gates, P. Quadruple & Triple Quadrupole (QQQ) Mass Analysis. 2009 [cited 2014 14 march];
Available from: http://www.chm.bris.ac.uk/ms/theory/quad-massspec.html. 11. GC/MS-TOF Description. [cited 2014 14 march]; Available from:
http://chromservis.cz/category/gc-ms-tof. 12. Hamamatsu, Electron multiplier tubes and ion detectors, in Photomultiplier Tubes: Basics and
Applications. 2007. p. 12. 13. How electron multipliers work. 2013 [cited 2014 11 march]; Available from:
http://www.sge.com/products/electron-multipliers/how-electron-multipliers-work. 14. Kevin Goodner, R.R., Practical analysis of flavor and fragrance materials. 2011: Whiley. 15. Pien, N., Static headspace characterisation of odorants in complex matrices by hyphenated
GC-MS techniques, in Hogeschool Gent. 2013: Gent. 16. Hübschmann, H.-J., Handbook of GC/MS: Fundamentals and Applications. 2009, Weinheim:
Whiley-VCH. 17. Gerstel. gerstel dynamic headspace DHS. [cited 2014 15 march]; Available from:
http://www.davinci-ls.com/systems/sample-introduction-preparation-systems/69-gerstel-dynamic-headspace-dhs.
18. Gerstel, Dynamic Headspace DHS with TDU and MPS-operation manual. 2014. 19. EVISA. Gerstel GmbH & Co.KG - MulitPurpose Sampler MPS for GC and GC/MS. 2010 [cited
2014 27 february]; Available from: http://www.speciation.net/Database/Instruments/GERSTEL-GmbH-amp-CoKG/MultiPurpose-Sampler-MPS-for-GC-and-GCMS-.

53
Attachments
Attachment 1-The several steps of the MPS for performing a DHS analysis ........................................ 54
Attachment 2-Figuration of PTV-tube, TDU-tube and sample vial ....................................................... 55
Attachment 3-Chromatograms of contamination of PTV-liner in PTV .................................................. 55
Attachment 4-Chromatograms of contamination of TDU-tube in TDU ................................................ 56
Attachment 5-Chromatogram of blank DHS ......................................................................................... 57
Attachment 6-Chromatograms of contamination of O-ring ................................................................. 57
Attachment 7-Chromatograms of contamination of carrier ................................................................. 59
Attachment 8-Overview of structures of different components .......................................................... 60
Attachment 9-Parameters of DHS for adjusting split ratio ................................................................... 61
Attachment 10-Parameters of DHS for adjusting incubation temperature .......................................... 61
Attachment 11-Chromatograms of analyses for adjusting incubation temperature ........................... 62
Attachment 12-Parameters of DHS for adjusting incubation time ....................................................... 64
Attachment 13-Chromatograms of analyses for adjusting incubation time ......................................... 64
Attachment 14-Parameters of DHS for adjusting trapping gas flow ..................................................... 67
Attachment 15-Chromatograms of analyses for adjusting trapping gas flow ...................................... 67
Attachment 16-Parameters of DHS for adjusting trapping gas volume ................................................ 69
Attachment 17-Chromatograms of analyses for adjusting trapping gas volume ................................. 70
Attachment 18-Parameters of DHS when performing a DHS ............................................................... 72
Attachment 19- Reproducibility of DHS on the relative area of each component trapped ................. 72
Attachment 20-Chromatograms of DHS and SHS comparison ............................................................. 73

54
Attachment 1-The several steps of the MPS for performing a DHS analysis
The dynamic headspace is a fully automated technique. It is automated by a robot above the GC/MS,
called MPS (Figure 10). When analysing a sample, the following measurements has to be performed
when trapping all components. First the tenax of the TDU and PTV has to be blank, to eliminate
components present in the air and on the tenax. When the tenax is blank, the DHS method is started
on a blank sample. A blank sample is an empty glass vial. And the next step is the DHS method for a
sample. These methods will be performed in a sequence.
It starts with placing an empty TDU tube in the TDU and placing an TDU tube with tenax in the tray
on the MPS. The method for making the tenax of the TDU and PTV blank starts (blank TDU).
The following steps will be done by the MPS:
1. Tenax tube will be removed from the TDU and placed in hold
2. Tenax tube (containing contamination) will be removed from the tray and placed in the TDU
Now the desorption step and the injection step starts. After the injection step, the GC/MS starts
to measure.
The next step is performing a DHS analysis of a empty sample (blank DHS). It starts with placing an
empty glass vial in the tray on the MPS.
The following steps will be done by the MPS:
3. Empty sample vial is removed from the tray and placed in the DHS
Incubation step starts.
4. A plastic TDU tube is removed from the DHS carriage and placed in hold in the DHS
5. DHS carriage is placed above the empty glass vial
6. TDU tube with tenax is removed from the TDU and placed in the DHS carriage
Trapping step starts.
7. While the trapping step starts, the empty TDU tube is removed from hold and placed in the
TDU. This is necessary because of the pressure over column. The GC needs to be closed at
any time
8. After the trapping step, the empty TDU tube is removed from the TDU and placed in hold
9. TDU tube with tenax is removed from the DHS carriage and placed in the TDU
The desorption step and injection step starts.
10. While the desorption step starts, the DHS carriage is moved backward and the plastic TDU
tube is placed in the DHS carriage. Also the empty glass vial in placed back in the tray on the
MPS
After the injection step, the GC/MS starts to measure.
The following step is performing a DHS analysis of a sample (DHS analysis of sample). It starts with
filling up the empty glass vial, used in the previous method, with the sample and placing it in the tray
on the MPS.
Steps 3 to 10 will be repeated by the MPS and in this method a glass vial with sample will be used.
After the measurement of the DHS the following steps will be done by the MPS:
11. After the measurement the TDU tube with tenax is removed from the TDU and placed in the
tray
12. The empty TDU tube is removed from hold and placed in the TDU

55
Attachment 2-Figuration of PTV-tube, TDU-tube and sample vial
PTV TDU sample vial
Attachment 3-Chromatograms of contamination of PTV-liner in PTV
1 day
3 days

56
Attachment 4-Chromatograms of contamination of TDU-tube in TDU
1 week
3 days
1 week

57
Attachment 5-Chromatogram of blank DHS
Attachment 6-Chromatograms of contamination of O-ring
2 months
1 min

58
1 day
1 day in aluminium foil
1 week in aluminium foil

59
Attachment 7-Chromatograms of contamination of carrier
Carbohydrate exposed in open environment within Scentarom
Carbohydrate exposed in open environment outside Scentarom
Silica exposed in open environment within Scentarom

60
Attachment 8-Overview of structures of different components
Component Structure Component Structure
diacetyl
citronellal
ethyl acetate
eugenol
cis-3-hexenol
b-ionone
benzaldehyde
g-undecalactone
ethyl hexanoate
thibetolide
phenylethyl alcohol
benzyl salicylate
Silica exposed in open environment outside Scentarom

61
Attachment 9-Parameters of DHS for adjusting split ratio
Range Start
Transfer Heater 50-150 °C 150 °C
Incubation step (incl. agitation step)
Incubation Temperature (Tsample i)
10-200 °C 30 °C
Total incubation Time (Δti)
0-600 min 1 min
Agitator On Time (Δti2) 0-600 s 60 s
Agitator Off Time 0-300 s 1 s
Agitator Speed 250-1500 rpm 500 rpm
Trapping step Volume (V) 10-100000 ml 100,0 ml
Flow (F) 5-100 ml/min 50,0 ml/min
Trap Temperature (Ttr) 20-70 °C 25 °C
Incubation Temperature (Tsample tr)
10-200 °C 30 °C
Time (Δttr) / 2 min
Drying step (optional)
Volume 10-100000 ml 0 ml
Flow 5-100 ml/min /
Trap Temperature (Tdr)
20-70 °C /
Incubation Temperature (Tsample dr)
10-200 °C /
Time / /
Attachment 10-Parameters of DHS for adjusting incubation temperature
Range Start
Transfer Heater 50-150 °C 150 °C
Incubation step (incl. agitation step)
Total incubation Time (Δti)
0-600 min 1 min
Agitator On Time (Δti2) 0-600 s 60 s
Agitator Off Time 0-300 s 1 s
Agitator Speed 250-1500 rpm 500 rpm
Trapping step Volume (V) 10-100000 ml 100,0 ml
Flow (F) 5-100 ml/min 50,0 ml/min
Trap Temperature (Ttr) 20-70 °C 25 °C
Time (Δttr) / 2 min
Drying step (optional)
Volume 10-100000 ml 0 ml
Flow 5-100 ml/min /
Trap Temperature (Tdr)
20-70 °C /
Incubation Temperature (Tsample dr)
10-200 °C /
Time / /

62
Attachment 11-Chromatograms of analyses for adjusting incubation
temperature
1 2
3 4 5 6
7.I
7.II
8 9
10 11 12
3
4 5
6
7.I
7.II 8 9
10 11 12
3
1 2
7.I
8 9 10 11
6
4 5
7.II
30°C
50°C
65°C
1 2
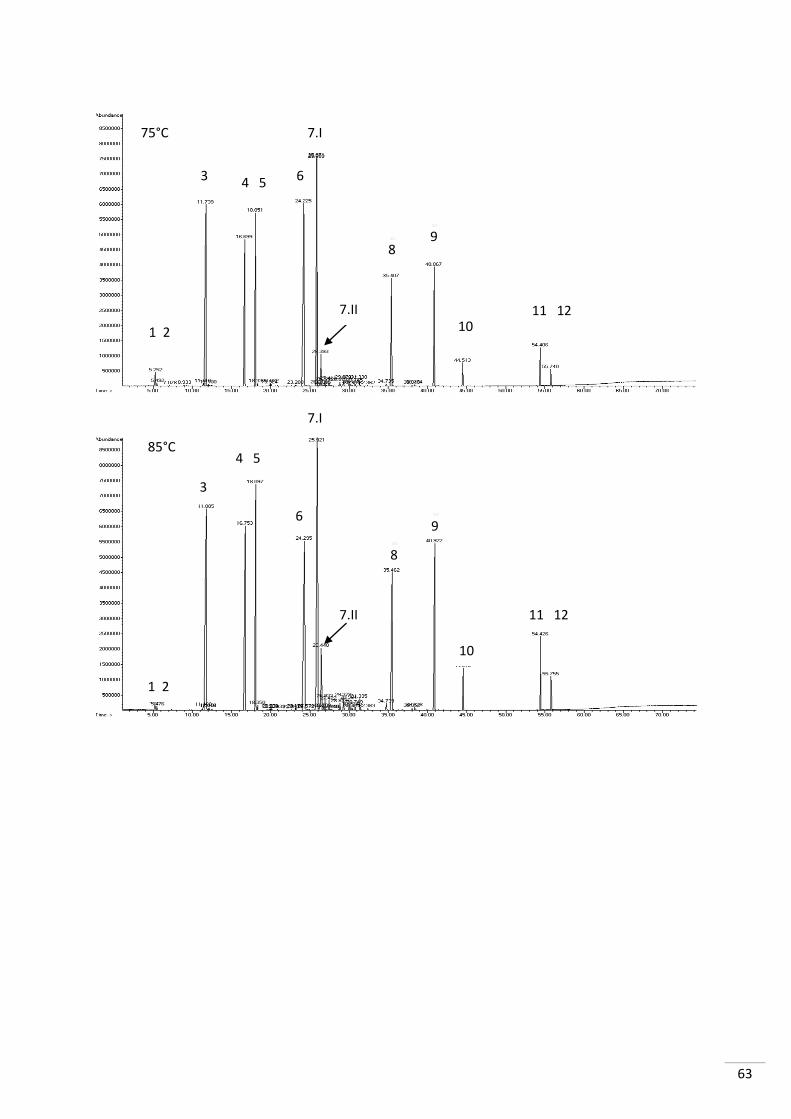
63
1 2
3 4 5 6
7.I
7.II
8 9
10 11 12
1 2
3
3
4 5
6
7.II
7.I
8
9
10
11 12
75°C
85°C

64
Attachment 12-Parameters of DHS for adjusting incubation time
Range Start
Transfer Heater 50-150 °C 150 °C
Incubation step (incl. agitation step)
Incubation Temperature (Tsample i)
10-200 °C 65 °C
Agitator Off Time 0-300 s 1 s
Agitator Speed 250-1500 rpm 500 rpm
Trapping step Volume (V) 10-100000 ml 100,0 ml
Flow (F) 5-100 ml/min 50,0 ml/min
Trap Temperature (Ttr) 20-70 °C 25 °C
Incubation Temperature (Tsample tr)
10-200 °C 65 °C
Time (Δttr) / 2 min
Drying step (optional)
Volume 10-100000 ml 0 ml
Flow 5-100 ml/min /
Trap Temperature (Tdr)
20-70 °C /
Incubation Temperature (Tsample dr)
10-200 °C /
Time / /
Attachment 13-Chromatograms of analyses for adjusting incubation time
0 min
1 2
3 4 5
6
7.I
7.II 8 9
10 11 12

65
1 2
3 4 5 6
7.I
7.II
8 9
10 11 12
1 2
3 4 5
6
7.I
7.II
8 9
10 11 12
15 s
1 min
2 min
1 2
3 4 5
6
7.I
7.II 8 9
10 11 12

66
1 2
3
3
3 4 5
7.II
8
7.II
9
1 2
1 2
4 5
4 5
6
6
6
7.I
7.I
7.I
7.II
10
8 9
11 12
8 9
11 12 10
11 12 10
3
5 min
10 min
15 min

67
Attachment 14-Parameters of DHS for adjusting trapping gas flow
Range Start
Transfer Heater 50-150 °C 150 °C
Incubation step (incl. agitation step)
Incubation Temperature (Tsample i)
10-200 °C 65 °C
Total incubation Time (Δti)
0-600 min 5 min
Agitator On Time (Δti2) 0-600 s 300 s
Agitator Off Time 0-300 s 1 s
Agitator Speed 250-1500 rpm 500 rpm
Trapping step Volume (V) 10-100000 ml 100,0 ml
Trap Temperature (Ttr) 20-70 °C 25 °C
Incubation Temperature (Tsample tr)
10-200 °C 65 °C
Drying step (optional)
Volume 10-100000 ml 0 ml
Flow 5-100 ml/min /
Trap Temperature (Tdr)
20-70 °C /
Incubation Temperature (Tsample dr)
10-200 °C /
Time / /
Attachment 15-Chromatograms of analyses for adjusting trapping gas
flow
5 ml/min
1 2
3
4 5
6
7.II
7.I
8 9
10 11 12

68
10 ml/min
25 ml/min
50 ml/min
1 2
3
4 5
6
7.I
7.II
8 9
10 11 12
1 2
3
4 5
6
7.I
7.II 8
9
10 11 12
1 2
3 4 5 6
7.I
7.II
8 9
10 11 12

69
Attachment 16-Parameters of DHS for adjusting trapping gas volume
Range Start
Transfer Heater 50-150 °C 150 °C
Incubation step (incl. agitation step)
Incubation Temperature (Tsample i)
10-200 °C 65 °C
Total incubation Time (Δti)
0-600 min 5 min
Agitator On Time (Δti2) 0-600 s 300 s
Agitator Off Time 0-300 s 1 s
Agitator Speed 250-1500 rpm 500 rpm
Trapping step Flow (F) 5-100 ml/min 50,0 ml/min
Trap Temperature (Ttr) 20-70 °C 25 °C
Incubation Temperature (Tsample tr)
10-200 °C 65 °C
Drying step (optional)
Volume 10-100000 ml 0 ml
Flow 5-100 ml/min /
Trap Temperature (Tdr)
20-70 °C /
Incubation Temperature (Tsample dr)
10-200 °C /
Time / /
100 ml/min
3
4 5
6
7.I
7.II 8
9
10 11 12
1 2

70
Attachment 17-Chromatograms of analyses for adjusting trapping gas
volume
10 ml
50 ml
100 ml
1 2
3
4 5 6
7.I
7.II 8 9
10 11
1 2
3 4 5
6
7.I
7.II
8 9
10 11 12
1 2
3 4 5 6
7.I
7.II
8 9
10 11 12

71
200 ml
150 ml
3
4 5
6
7.I
7.II
8 9
10 11 12
1 2
3 4 5 6
7.I
7.II
8
10
9
11 12
1 2

72
Attachment 18-Parameters of DHS when performing a DHS
Range Start
Transfer Heater 50-150 °C 150 °C
Incubation step (incl. agitation step)
Incubation Temperature (Tsample i)
10-200 °C 65 °C
Total incubation Time (Δti)
0-600 min 5 min
Agitator On Time (Δti2) 0-600 s 300 s
Agitator Off Time 0-300 s 1 s
Agitator Speed 250-1500 rpm 500 rpm
Trapping step Volume (V) 10-100000 ml 150,0 ml
Flow (F) 5-100 ml/min 50,0 ml/min
Trap Temperature (Ttr) 20-70 °C 25 °C
Incubation Temperature (Tsample tr)
10-200 °C 65 °C
Time (Δttr) / 3 min
Drying step (optional)
Volume 10-100000 ml 0 ml
Flow 5-100 ml/min /
Trap Temperature (Tdr)
20-70 °C /
Incubation Temperature (Tsample dr)
10-200 °C /
Time / /
Attachment 19- Reproducibility of DHS on the relative area of each
component trapped
0
5
10
15
20
25
30
are
a (r
ela
tive
in %
)
Components
Relative area
Test 1
Test 2
Test 3
Test 4
Test 5
Test 6
Test 7

73
Attachment 20-Chromatograms of DHS and SHS comparison
DHS
SHS
1 2
3 4 5
6
7.I
7.II
8 9
10 11 12
1
2
1 2
3
5
4 6
7.I
7.II
8 9
10
11 12
Related Documents