Dynamic classifier selection using spectral-spatial information for hyperspectral image classification Hongjun Su, a,b, * Bin Yong, a, * Peijun Du, b, * Hao Liu, c Chen Chen, d and Kui Liu d a Hohai University, State Key Laboratory of Hydrology-Water Resources and Hydraulic Engineering, Nanjing 210098, China b Nanjing University, Jiangsu Provincial Key Laboratory of Geographic Information Science and Technology, Nanjing 210046, China c Wuhan University, State Key Laboratory of Information Engineering in Surveying, Mapping and Remote Sensing, Wuhan 430079, China d University of Texas at Dallas, Department of Electrical Engineering, Richardson, Texas 75080- 3021, United States Abstract. This paper presents a new dynamic classifier selection approach for hyperspectral image classification, in which both spatial and spectral information are used to determine a pix- el’s label once the remaining classified pixels’ neighborhood meets the threshold. For volumetric texture feature extraction, a volumetric gray level co-occurrence matrix is used; for spectral fea- ture extraction, a minimum estimated abundance covariance-based band selection is used. Two hyperspectral remote sensing datasets, HYDICE Washington DC Mall and AVIRIS Indian Pines, are employed to evaluate the performance of the developed method. The classification accuracies of the two datasets are improved by 1.13% and 4.47%, respectively, compared with the tradi- tional algorithms using spectral information. The experimental results demonstrate that the inte- gration of spectral information with volumetric textural features can improve the classification performance for hyperspectral images. © 2014 Society of Photo-Optical Instrumentation Engineers (SPIE) [DOI: 10.1117/1.JRS.8.XXXXXX] Keywords: dynamic classifier selection; volumetric textural feature; spectral feature; hyperspec- tral image classification. Paper 14137SS received Mar. 9, 2014; revised manuscript received Jul. 9, 2014; accepted for publication Jul. 15, 2014. 1 Introduction Hyperspectral remote sensing plays an important role in land use/cover classification and map- ping. Spectral information has been widely utilized in hyperspectral image classification. However, related works that focused on geometric and textural features are still limited. 1,2 Many approaches have shown that the textural features combined with spectral information have great potential to improve the classification accuracy. 3 Texture analysis methods include structural methods, 4 statistical methods, 5 model-based methods, 6 and transform-based methods. 6 Statistical methods consist of a histogram, gray-level co-occurrence matrix (GLCM), and gray- level run-length. Although GLCM is a very popular technique, it is worth noting that this approach is only applied to single-band images. 5,7,8 Tsai et al. 9 extended the GLCM model to a three-dimensional (3-D) space, and proposed a volume GLCM (VGLCM) model to extract the texture features of hyperspectral data. The results obtained indicated that the VGLCM model outperformed the GLCM model, and the VGLCM model captures the relationship between neighboring spectral bands. Moreover, it has been verified that combining volumetric texture features computed by the VGLCM algorithm can improve the classification accuracy for hyper- spectral image analysis. *Address all correspondence to: Hongjun Su, E-mail: [email protected]; Bin Yong, E-mail: [email protected]; Peijun Du, E-mail: [email protected] 0091-3286/2014/$25.00 © 2014 SPIE Journal of Applied Remote Sensing XXXXXX-1 Vol. 8, 2014

Welcome message from author
This document is posted to help you gain knowledge. Please leave a comment to let me know what you think about it! Share it to your friends and learn new things together.
Transcript
Dynamic classifier selection using spectral-spatialinformation for hyperspectral image classification
Hongjun Su,a,b,* Bin Yong,a,* Peijun Du,b,* Hao Liu,c Chen Chen,d andKui Liud
aHohai University, State Key Laboratory of Hydrology-Water Resources and HydraulicEngineering, Nanjing 210098, China
bNanjing University, Jiangsu Provincial Key Laboratory of Geographic Information Science andTechnology, Nanjing 210046, China
cWuhan University, State Key Laboratory of Information Engineering in Surveying, Mappingand Remote Sensing, Wuhan 430079, China
dUniversity of Texas at Dallas, Department of Electrical Engineering, Richardson, Texas 75080-3021, United States
Abstract. This paper presents a new dynamic classifier selection approach for hyperspectralimage classification, in which both spatial and spectral information are used to determine a pix-el’s label once the remaining classified pixels’ neighborhood meets the threshold. For volumetrictexture feature extraction, a volumetric gray level co-occurrence matrix is used; for spectral fea-ture extraction, a minimum estimated abundance covariance-based band selection is used. Twohyperspectral remote sensing datasets, HYDICEWashington DCMall and AVIRIS Indian Pines,are employed to evaluate the performance of the developed method. The classification accuraciesof the two datasets are improved by 1.13% and 4.47%, respectively, compared with the tradi-tional algorithms using spectral information. The experimental results demonstrate that the inte-gration of spectral information with volumetric textural features can improve the classificationperformance for hyperspectral images. © 2014 Society of Photo-Optical Instrumentation Engineers(SPIE) [DOI: 10.1117/1.JRS.8.XXXXXX]
Keywords: dynamic classifier selection; volumetric textural feature; spectral feature; hyperspec-tral image classification.
Paper 14137SS received Mar. 9, 2014; revised manuscript received Jul. 9, 2014; accepted forpublication Jul. 15, 2014.
1 Introduction
Hyperspectral remote sensing plays an important role in land use/cover classification and map-ping. Spectral information has been widely utilized in hyperspectral image classification.However, related works that focused on geometric and textural features are still limited.1,2
Many approaches have shown that the textural features combined with spectral informationhave great potential to improve the classification accuracy.3 Texture analysis methods includestructural methods,4 statistical methods,5 model-based methods,6 and transform-based methods.6
Statistical methods consist of a histogram, gray-level co-occurrence matrix (GLCM), and gray-level run-length. Although GLCM is a very popular technique, it is worth noting that thisapproach is only applied to single-band images.5,7,8 Tsai et al.9 extended the GLCM modelto a three-dimensional (3-D) space, and proposed a volume GLCM (VGLCM) model to extractthe texture features of hyperspectral data. The results obtained indicated that the VGLCMmodeloutperformed the GLCM model, and the VGLCM model captures the relationship betweenneighboring spectral bands. Moreover, it has been verified that combining volumetric texturefeatures computed by the VGLCM algorithm can improve the classification accuracy for hyper-spectral image analysis.
*Address all correspondence to: Hongjun Su, E-mail: [email protected]; Bin Yong, E-mail: [email protected]; Peijun Du, E-mail:[email protected]
0091-3286/2014/$25.00 © 2014 SPIE
Journal of Applied Remote Sensing XXXXXX-1 Vol. 8, 2014
Multiple classifier systems (MCSs), which employ different feature descriptors and classi-fiers to gain a more robust, reliable, and efficient recognition performance, have been verified tobe an effective solution for improving classification performance.10,11 Over the past few decades,MCS and related ensemble methods for classifiers have been developed based on machine learn-ing, neural networks, pattern recognition,12–14 and so on. Commonly, two strategies, i.e., fusion-and selection-based methods, are used to merge an ensemble of classifiers (EoC). Fusion-basedmethods apply individual classifiers in parallel and combine the outputs to achieve consensus.15
To guarantee the improvement in classification, the individual error of each classifier is requiredto form an ensemble system,16 which is difficult to achieve. In contrast, selection-based methodsdirectly choose the classifier with the best performance from an EoC for a given pattern.17
Moreover, selection-based methods tend to have superior performances over fusion-based meth-ods under the condition that one classifier in an EoC strongly dominates others.18 Selection-based methods include static classifier selection (SCS) and dynamic classifier selection(DCS). The difference between SCS and DCS is that the best classifier selected by SCS methodsis for all test patterns, while DCS methods only choose the classifier that best suits the currentpattern19 to ensure a reasonable classification result for each pattern.
Previous research aimed at utilizing the spectral information of hyperspectral images for clas-sifier combination and classification.20,21 Recently, more focus has been placed on spatial infor-mation.22–24 However, spatial and spectral information are treated as data sources of the classifier inmost DCS-related works. In practice, pixels are spatially related. In other words, it is highly prob-able that two adjacent pixels belong to the same class. Therefore, spectral information with thesupport of spatial information can significantly improve the hyperspectral image classificationaccuracy.25,26 In this paper, we propose a novel dynamic classifier ensemble method by combiningspectral information and volumetric textural features. In the proposed algorithm, spatial and spec-tral information are used to determine the label with the condition that the classified pixels’ per-centage of the unlabeled pixels’ neighborhood meets a specific threshold. Meanwhile, theminimum estimated abundance covariance (MEAC)-based band selection and the VGLCMmodel are used to extract the spatial and spectral features for dynamic classifier ensembles.
In the proposed algorithm, spatial and spectral information are not only used as features in thepreprocessing step, but also used for assigning the label to a pattern. In this approach, the labelinformation of the pixels, when an EoC agrees, can be also adopted as spatial information22
When it comes to assigning labels to test patterns, the proposed DCS algorithm utilizes thespatial information to check whether the proportion of the labeled pixels around the patternexceeds the threshold. If it does, spatial and spectral information around the pattern will beused to determine the label of the pattern; otherwise, spectral information is used.Furthermore, the VGLCM algorithm is applied to extract the spatial information from hyper-spectral images. There are two differences between the proposed DCS algorithm and other DCSalgorithms. (1) Preprocessing is required by the proposed algorithm. In this step, pixels on whichall member classifiers agree are directly assigned using member classifiers’ classification results.As more spatial information is provided, a more accurate prediction can be made. (2) The pro-posed DCS algorithm will accordingly choose different computing methods based on the sta-tistics of the current pixel’s neighborhood.
The rest of the paper is organized as follows. In the next section, spatial and spectral infor-mation extraction methods are described. Section 3 presents the proposed DCS algorithm. Apresentation of the experimental results and analysis for two hyperspectral datasets follow inSec. 4. Finally, summarizing remarks and conclusions are stated in Sec. 5.
2 Spatial and Spectral Information Extraction
2.1 Spectral Feature Extraction
2.1.1 Principal components analysis
Principal components analysis (PCA) is a decorrelation technique that is widely used in dimen-sionality reduction and data compression for hyperspectral images.27 PCA maps a data vector
Su et al.: Dynamic classifier selection using spectral-spatial information for hyperspectral image classification
Journal of Applied Remote Sensing XXXXXX-2 Vol. 8, 2014
from the original space of q variables to a new space of q variables, which are uncorrelated overthe dataset. However, not all the principal components have to be kept. Keeping only the first Lprincipal components that are produced by using only the first L loading vectors, yields thetruncated transformation
TL ¼ XWL; (1)
where X is the original data matrix, WL is the projection matrix, and the dimension reducedmatrix TL has n rows but only L columns. Matrix TL maximizes the variance in the originaldata while minimizing the total squared reconstruction error kX − TLk22. The selected numberof principle components (PCs) is smaller than the dimension of the original data, and can betreated as the dimension reduced spectral features of the hyperspectral remote sensing data.
2.1.2 Minimum estimated abundance covariance-based band selection
MEAC is a supervised band selection algorithm proposed by Yang et al.28 Let us assume thereare p classes present in an image. Based on the linear mixture model, a pixel r is considered asthe mixing result of the endmembers of the p classes. Let the endmember matrix beS ¼ ½s1; s2; : : : ; sp�. The pixel r can be expressed as
r ¼ Sαþ n; (2)
where α ¼ ðα1α2αpÞT is the non-negative abundance vector and n the uncorrelated white noisewith EðnÞ ¼ 0 and CovðnÞ ¼ σ2I (I is an identity matrix). Intuitively, the selected bands shouldlet the deviation of α from the actual α be as small as possible. If only parts of the classes areknown, this is equivalent to
arg minΦS
ftrace½ðSTΣ−1SÞ−1�g; (3)
where ΦS is the selected band subset and Σ is the noise covariance matrix. The resulting bandselection algorithm is referred to as the MEAC method.
The MEAC algorithm does not require training samples. It only needs the class signatures. Inaddition, it is not necessary to examine the entire original bands or band combinations. With aforwarding search and the initial band pair selection, this method quickly completes bandselection.
2.2 Spatial Feature Extraction by Volumetric Gray Level Co-Occurrence Matrix
The GLCM model has been a widely adopted algorithm for image texture analysis since it wasproposed by Haralick in the 1970s.7 The model is a measurement of the second-order statisticalchanges in gray level as well as a function describing the structure of the texture. It reflects theinformation of direction, neighboring spacing, and magnitude of changes in the gray level. It is acommon method for analyzing the local patterns and pixel arrangements of images.
VGLCM is another commonly used texture extraction method proposed in Ref. 9, and theprocedures for texture computation used by VGLCM and GLCM are different. The GLCMmodel uses a two-dimensional (2-D) moving window in 2-D space. However, the VGLCMapplies a moving box in 3-D space to calculate the texture. For a hyperspectral image cubewith n ¼ 4 gray levels (6 bits), the co-occurrence matrix, M, is an n by n matrix. The matrixelements within a moving box, W, at a given displacement d ¼ ðdx; dy; dzÞ, are defined as9
Mði; jÞ ¼XWx−dx
x¼1
XWy−dy
y¼1
XWz−dz
z¼1
�1; Wðx; y; zÞ ¼ i and Wðxþ dx; yþ dy; zþ dzÞ ¼ j0; otherwise
; (4)
where i and j are the values of pairwise pixels, and x, y, and z are denoted as the positions in themoving box. Mði; jÞ is the value of a 3-D GLCM element, which reflects how often the graylevels of two pixels, Gðx; y; zÞ and Gðxþ dx; yþ dy; zþ dzÞ, are equal to i and j, respectively,
Su et al.: Dynamic classifier selection using spectral-spatial information for hyperspectral image classification
Journal of Applied Remote Sensing XXXXXX-3 Vol. 8, 2014
within a moving box.9 In a hyperspectral data cube, d is usually set as one pixel in distance. Foreach pixel that has 26 neighboring pixels, there are 26 or 13 combinations (ignoring the oppositedirections) in the horizontal and vertical directions.
The texture features extracted by GLCM largely depend on the quantization level, the size ofthe moving window, the distance and angle between pairwise pixels, and the statistical measures.The size of the moving window accounts for 90.4% of the classification variability, 7.1% isexplained by the statistics used as texture measures, and only a small portion is accountedfor by the quantization level as well as the distance and the angle between pixel pairs.29
For the parameters of the VGLCM algorithm, the semivariogram function, an efficient tool foranalyzing the spatial heterogeneity, is used for window size analysis. Since not all the statisticalmeasures are suitable for describing the texture features,7 we choose variance, contrast, dissimi-larity, energy, entropy, and homogeneity as measures with which to extract the texture features.
2.3 Spatial Pixel Neighborhood Information
Using spatial information to compute the label of the current pixel can be explained with spatialcorrelation-based knowledge as follows: pixels tend to be more similar if they are closer in space.In classification applications, if most neighborhoods of the current pixel belong to a class, it ishighly probable that the current pixel also belongs to the same class.30 However, a predictionmade based on the spatial correlation using only spatial information is not as reliable as thatmade using spectral information since spectral information-based methods compute the labelof the current pixel by means of the spectral similarity, which has an exact physical meaning.When only a few labeled pixels are available in the current pixel’s neighborhood, adding spatialinformation will not obviously improve the classification performance. In contrast, sometimes ithas a negative impact. However, as the proportion of neighboring labeled pixels increases, spatialinformation will provide more reliable support in determining the labels.
3 Proposed Dynamic Classifier Selection Algorithm
3.1 Dynamic Classifier Selection
The DCS methodology in the proposed algorithm is dynamically used to select a classifier froman EoC that best suits the current pattern, aimed at utilizing the strengths of each individualclassifier while avoiding their weaknesses.17 Giacinto first proposed the idea of DCS toavoid the assumption of classifier independence. Woods developed the idea of DCS using alocal accuracy estimation,15 and a series of modifications were made.20,21 A theoretical
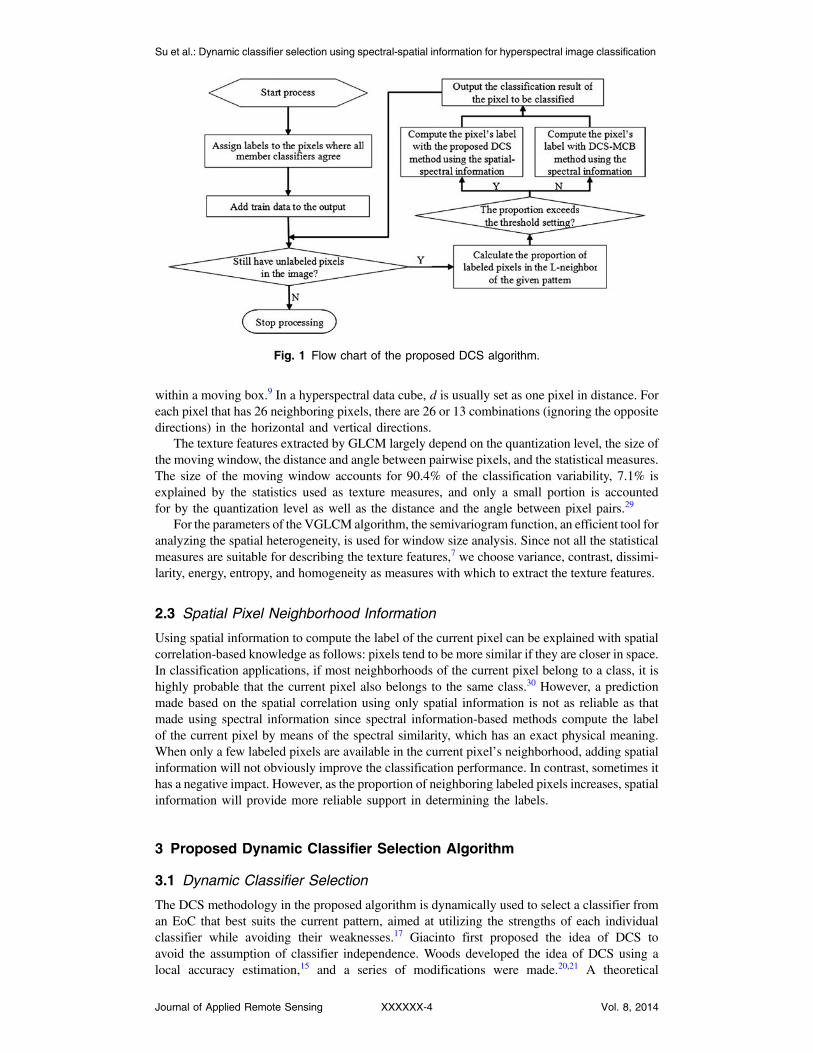
Fig. 1 Flow chart of the proposed DCS algorithm.
Su et al.: Dynamic classifier selection using spectral-spatial information for hyperspectral image classification
Journal of Applied Remote Sensing XXXXXX-4 Vol. 8, 2014
framework for DCS was described in Ref. 31, and a new DCS algorithm based on priori selectionand posteriori selection methods was proposed. Some other works have considered combiningensemble methods with DCS methods.19,20 The diversity of DCS and its influence were exploredin Ref. 32. In this work, our study focuses on improving the DCS method by using the spectraland spatial information together.
3.2 Proposed Dynamic Classifier Selection with Spectral-Spatial Information
Above-mentioned DCS algorithms only use spectral information to select the best classifierwhile ignoring spatial information. Specifically, they have the following disadvantages:
1. DCS algorithms using only spectral information of hyperspectral images reach a bottle-neck if no other new information is added. In order to improve the classification per-formance, spatial information especially of the neighboring pixels’ information forhyperspectral images should be taken into consideration.
2. DCS algorithms using the spectral-spatial information have more support for the labelassigned to the pattern, although comparison only with spectral information is considered.
3. Spectral information-based classification methods assign a label to the current pixel bycomparing the spectral similarity of the current pixel with the training data. If neighbor-hood information of the current pixel is considered, it will abolish the spectral similaritycompared to all sample patterns.
The proposed DCS algorithm utilizes the spectral information as well as spatial informationto determine the current pattern. The neighborhoods around the pattern provide spatial infor-mation, but not all neighborhoods provide meaningful spatial information. Only the neighbor-hoods that are known or already classified provide support information for classification, thus apreprocessing step is required. In this step, labels are directly assigned to the pixels where allmember classifiers from an EoC agree. The labels of the training pixels are already known.However, pixels used as training data might not keep the original labels after the training processdue to training errors, which might reduce the final classification rate. Therefore, we can directlyassign labels to the pixels used as training data. For any remaining classified pixels, calculate theproportion of the labeled pixels in an L × L window (L ¼ 5 in this paper) around the unlabeledpixels. If the proportion exceeds the threshold (set as 70%),33 this means the spatial informationof the current pixel is strong enough to assign a label to the current pixel.
3.3 Framework of Proposed Multiple Classifier System with Spectral-SpatialInformation
Many applications have proven that informative texture features are able to enhance the discrimi-native power for hyperspectral images’ classification.1–4 In our previous research, dimensionalityreduction algorithms have been proposed,28,34 and the classification accuracy significantlyimproved. Therefore, it is possible to improve the classification performance by combiningthe volumetric texture features with dimension reduced spectral features.
In the proposed fusion schemes as shown in Table 1, the volumetric texture features areextracted using the VGLCM algorithm, and the dimension reduced spectral features are obtainedby using the MEAC-based band selection algorithm. All the features are used as inputs to asupport vector machine (SVM) classifier. The detailed schemes are: Scheme II–texture featuresfused with all the bands of the original data; Scheme III–texture features fused with the selectedbands, PCs of the original data after PCA compression; Scheme IV–texture features fused withselected bands from the original data.
In the proposed framework, four types of features from the designed schemes are used for theclassification steps, namely the MCS system (Fig. 1). The process of computing the labels of theremaining unclassified pixels is divided into three steps. At first, a preprocessing step is required.In this step, pixels where all member classifiers agree are directly assigned labels according tothe classification result of each member classifier. The computing method is chosen based on thespatial information provided by the current pattern. The proportion of labeled pixels in the cur-rent pixel’s L-neighbors is obtained. If the proportion of already labeled pixels exceeds the
Su et al.: Dynamic classifier selection using spectral-spatial information for hyperspectral image classification
Journal of Applied Remote Sensing XXXXXX-5 Vol. 8, 2014

threshold, compute the label of the current pattern with spatial information; otherwise, computethe label of the current pattern with the DCS-MCB algorithm using the spectral information untilevery pixel in the hyperspectral image is assigned a label. The pseudocode of the proposed DCS-SSI algorithm is shown in Fig. 2.
4 Experiment Results and Analysis
4.1 Comparison Method and Classifier used in Multiple Classifier System
For comparison purpose, the DCS-LCAmethod is used in the experiments. The basic idea of thisscheme is to estimate each individual classifier’s accuracy in local regions surrounding a testsample, and use the decision of the most locally accurate classifier. Local accuracy is estimatedusing output classes. More details can be found in Ref. 15.
Table 1 Feature fusion schemes for hyperspectral image classification.
Classification with spectral and texture
Scheme I All bands
Scheme II All bands +6 texture features
Scheme III PCA +6 texture features + selected bands
Scheme IV Selected bands +6 texture features
Fig. 2 Pseudocode of the proposed DCS algorithm.
Su et al.: Dynamic classifier selection using spectral-spatial information for hyperspectral image classification
Journal of Applied Remote Sensing XXXXXX-6 Vol. 8, 2014
The classifiers used in the DCS involve SVM with poly, Gaussian, RBF kernel, KNN, andDiagquadratic classifiers. All these classifiers are implemented in MATLAB®.
4.2 Experiment I: HYDICE Washington DC Mall
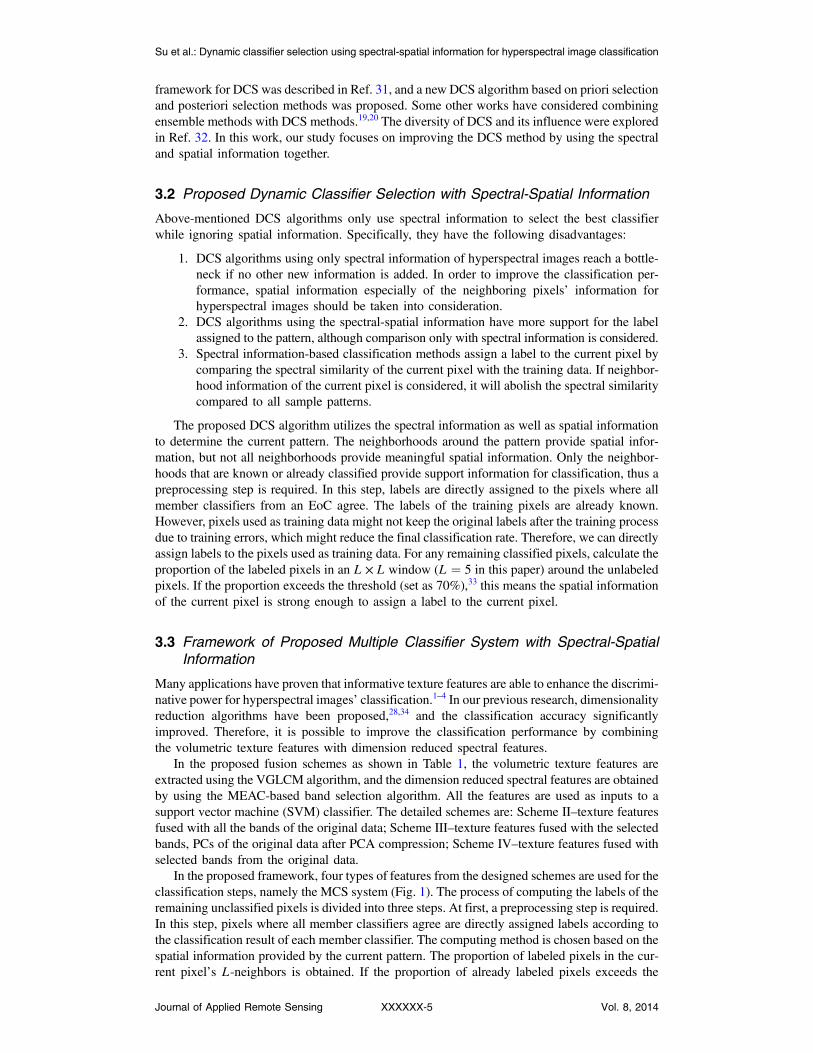
The first experimental image is the HYDICE subimage scene with 304 × 301 pixels over theWashington DC Mall area as used in Ref. 35. After bad band removal, 191 bands are used in theexperiments. There are six classes including roof, tree, grass, water, road, and trail in the dataset.Six class centers are used for band selection. Class center means the center of the class distri-bution, i.e., a mean value. The image in pseudocolor is shown in Fig. 3. As seen in the figure, theroof areas exhibit obvious different spectral signatures.
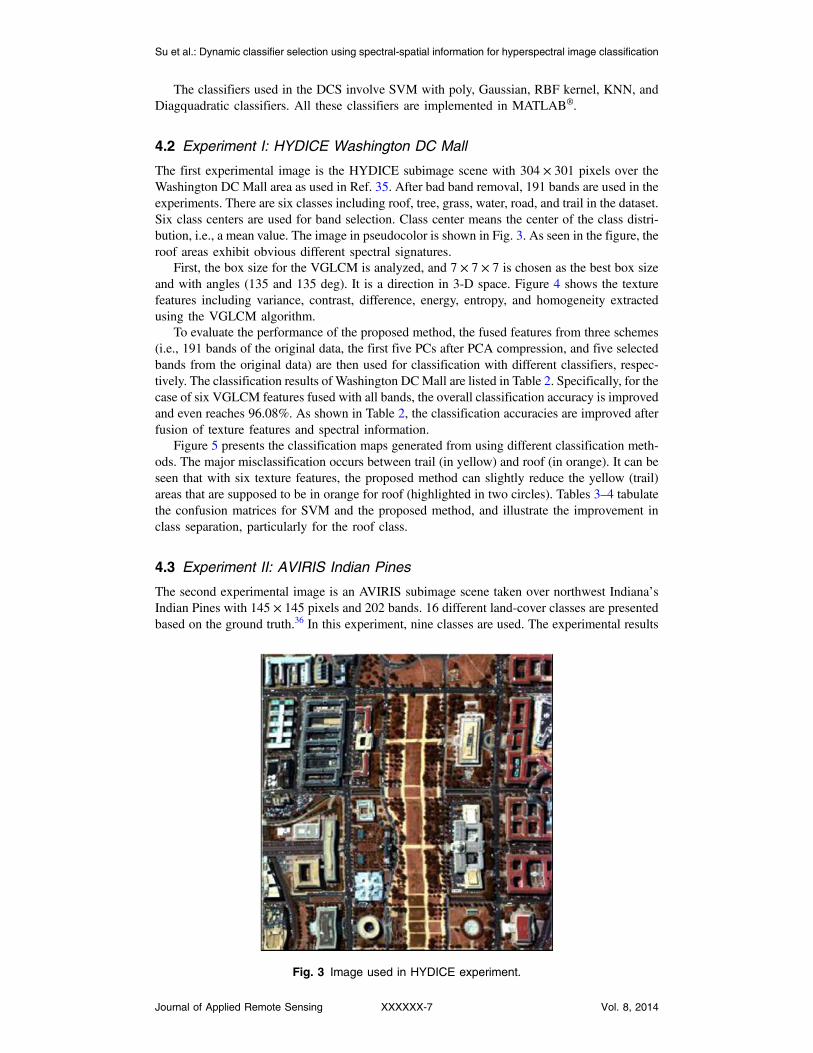
First, the box size for the VGLCM is analyzed, and 7 × 7 × 7 is chosen as the best box sizeand with angles (135 and 135 deg). It is a direction in 3-D space. Figure 4 shows the texturefeatures including variance, contrast, difference, energy, entropy, and homogeneity extractedusing the VGLCM algorithm.
To evaluate the performance of the proposed method, the fused features from three schemes(i.e., 191 bands of the original data, the first five PCs after PCA compression, and five selectedbands from the original data) are then used for classification with different classifiers, respec-tively. The classification results of Washington DCMall are listed in Table 2. Specifically, for thecase of six VGLCM features fused with all bands, the overall classification accuracy is improvedand even reaches 96.08%. As shown in Table 2, the classification accuracies are improved afterfusion of texture features and spectral information.
Figure 5 presents the classification maps generated from using different classification meth-ods. The major misclassification occurs between trail (in yellow) and roof (in orange). It can beseen that with six texture features, the proposed method can slightly reduce the yellow (trail)areas that are supposed to be in orange for roof (highlighted in two circles). Tables 3–4 tabulatethe confusion matrices for SVM and the proposed method, and illustrate the improvement inclass separation, particularly for the roof class.
4.3 Experiment II: AVIRIS Indian Pines
The second experimental image is an AVIRIS subimage scene taken over northwest Indiana’sIndian Pines with 145 × 145 pixels and 202 bands. 16 different land-cover classes are presentedbased on the ground truth.36 In this experiment, nine classes are used. The experimental results
Fig. 3 Image used in HYDICE experiment.
Su et al.: Dynamic classifier selection using spectral-spatial information for hyperspectral image classification
Journal of Applied Remote Sensing XXXXXX-7 Vol. 8, 2014
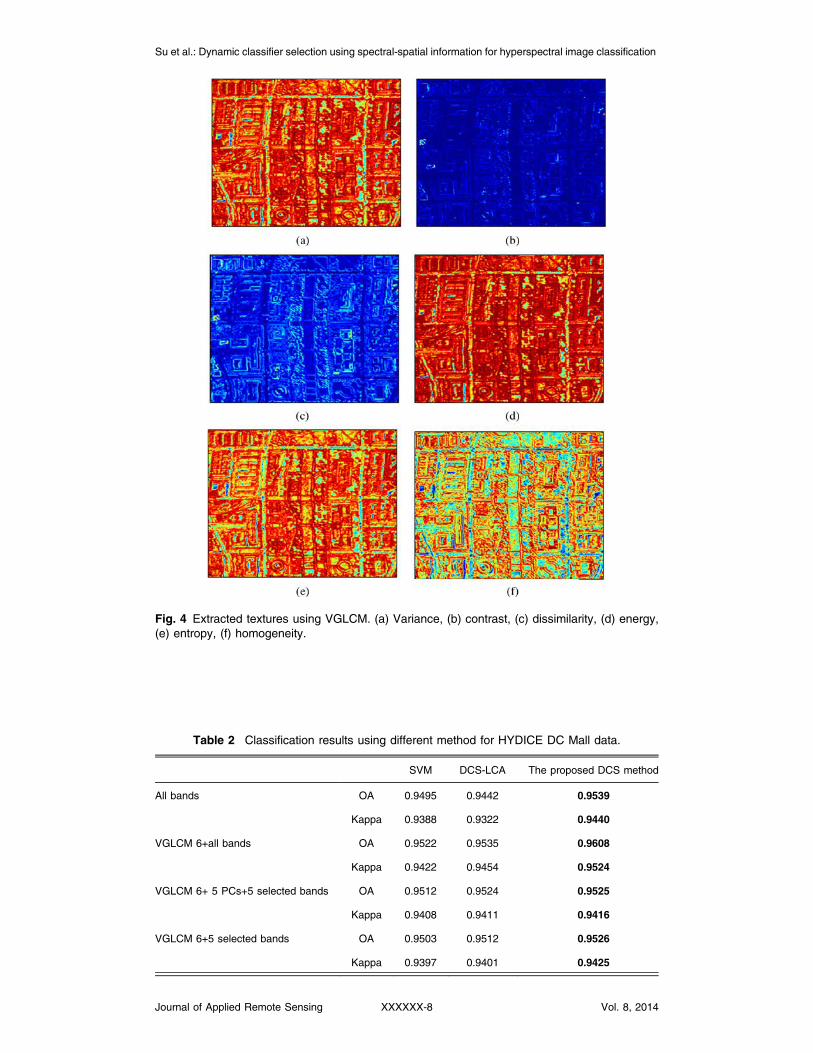
Fig. 4 Extracted textures using VGLCM. (a) Variance, (b) contrast, (c) dissimilarity, (d) energy,(e) entropy, (f) homogeneity.
Table 2 Classification results using different method for HYDICE DC Mall data.
SVM DCS-LCA The proposed DCS method
All bands OA 0.9495 0.9442 0.9539
Kappa 0.9388 0.9322 0.9440
VGLCM 6+all bands OA 0.9522 0.9535 0.9608
Kappa 0.9422 0.9454 0.9524
VGLCM 6+ 5 PCs+5 selected bands OA 0.9512 0.9524 0.9525
Kappa 0.9408 0.9411 0.9416
VGLCM 6+5 selected bands OA 0.9503 0.9512 0.9526
Kappa 0.9397 0.9401 0.9425
Su et al.: Dynamic classifier selection using spectral-spatial information for hyperspectral image classification
Journal of Applied Remote Sensing XXXXXX-8 Vol. 8, 2014
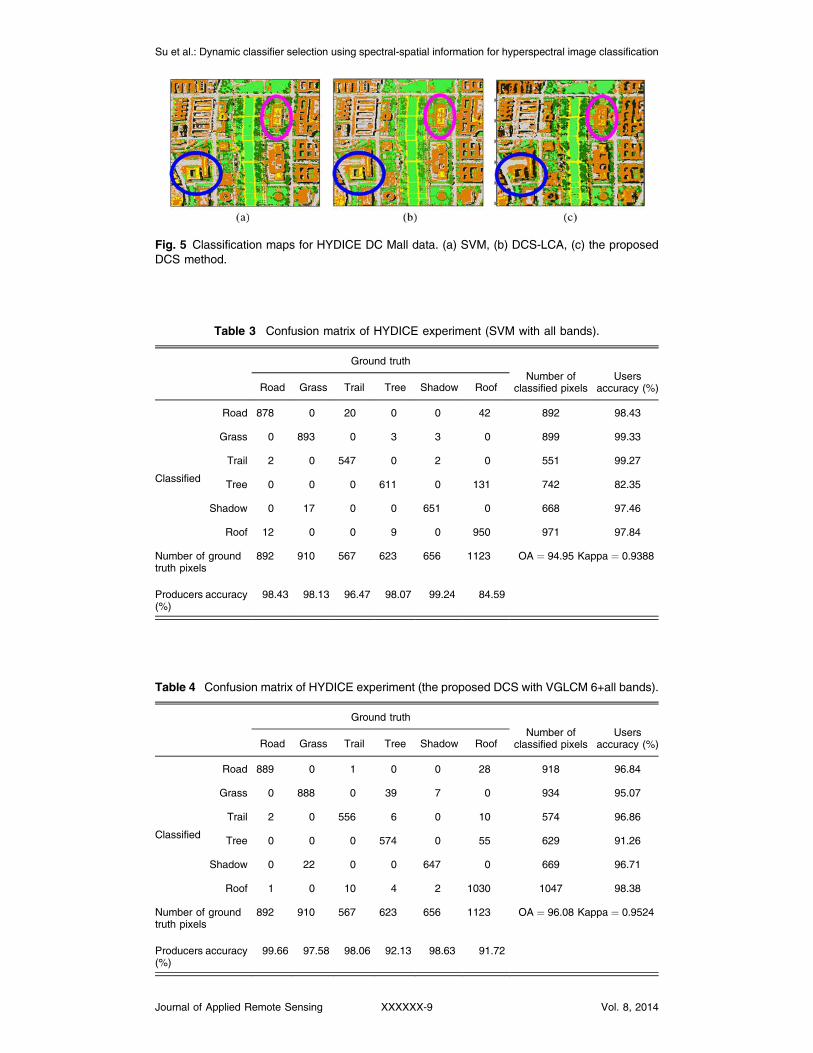
Fig. 5 Classification maps for HYDICE DC Mall data. (a) SVM, (b) DCS-LCA, (c) the proposedDCS method.
Table 3 Confusion matrix of HYDICE experiment (SVM with all bands).
Ground truth
Number ofclassified pixels
Usersaccuracy (%)Road Grass Trail Tree Shadow Roof
Classified
Road 878 0 20 0 0 42 892 98.43
Grass 0 893 0 3 3 0 899 99.33
Trail 2 0 547 0 2 0 551 99.27
Tree 0 0 0 611 0 131 742 82.35
Shadow 0 17 0 0 651 0 668 97.46
Roof 12 0 0 9 0 950 971 97.84
Number of groundtruth pixels
892 910 567 623 656 1123 OA ¼ 94.95 Kappa ¼ 0.9388
Producers accuracy(%)
98.43 98.13 96.47 98.07 99.24 84.59
Table 4 Confusion matrix of HYDICE experiment (the proposed DCS with VGLCM 6+all bands).
Ground truth
Number ofclassified pixels
Usersaccuracy (%)Road Grass Trail Tree Shadow Roof
Classified
Road 889 0 1 0 0 28 918 96.84
Grass 0 888 0 39 7 0 934 95.07
Trail 2 0 556 6 0 10 574 96.86
Tree 0 0 0 574 0 55 629 91.26
Shadow 0 22 0 0 647 0 669 96.71
Roof 1 0 10 4 2 1030 1047 98.38
Number of groundtruth pixels
892 910 567 623 656 1123 OA ¼ 96.08 Kappa ¼ 0.9524
Producers accuracy(%)
99.66 97.58 98.06 92.13 98.63 91.72
Su et al.: Dynamic classifier selection using spectral-spatial information for hyperspectral image classification
Journal of Applied Remote Sensing XXXXXX-9 Vol. 8, 2014
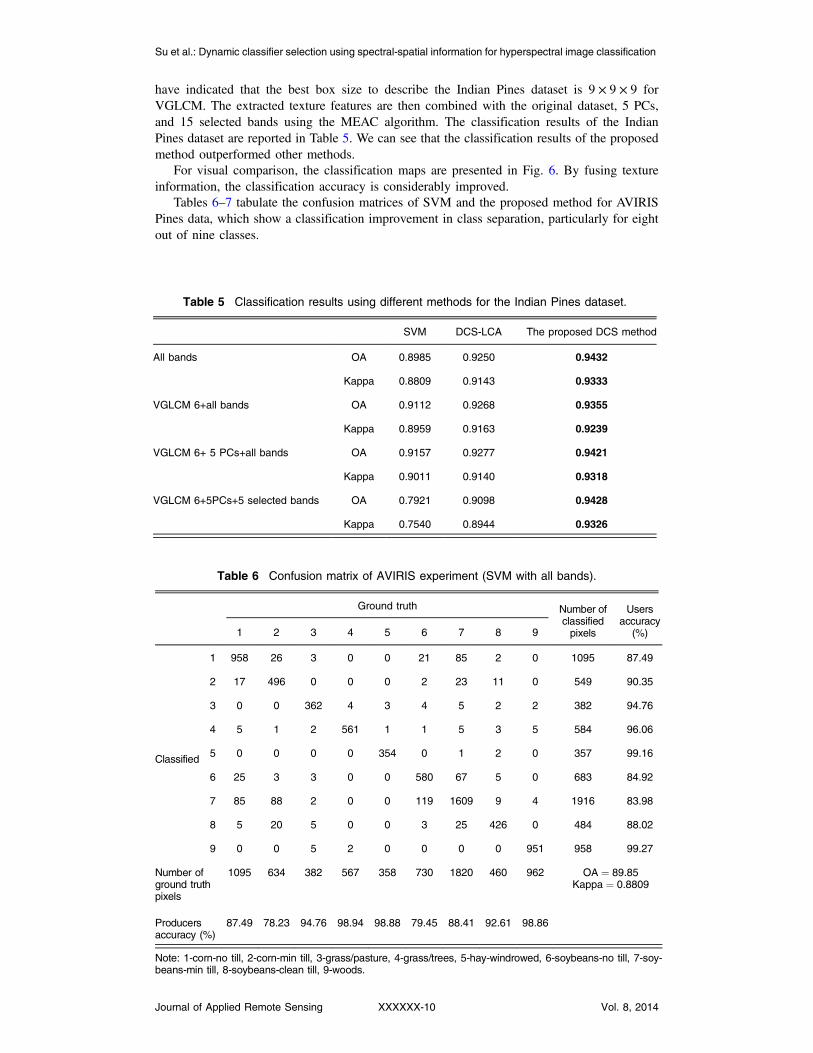
have indicated that the best box size to describe the Indian Pines dataset is 9 × 9 × 9 forVGLCM. The extracted texture features are then combined with the original dataset, 5 PCs,and 15 selected bands using the MEAC algorithm. The classification results of the IndianPines dataset are reported in Table 5. We can see that the classification results of the proposedmethod outperformed other methods.
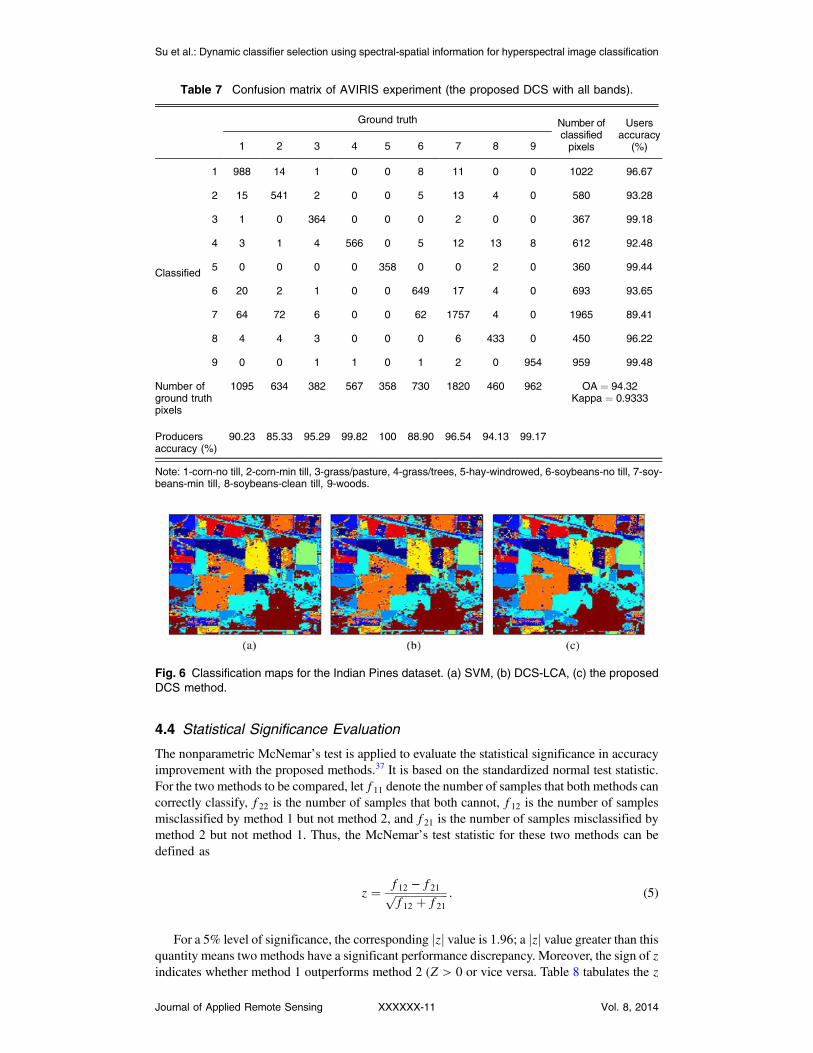
For visual comparison, the classification maps are presented in Fig. 6. By fusing textureinformation, the classification accuracy is considerably improved.
Tables 6–7 tabulate the confusion matrices of SVM and the proposed method for AVIRISPines data, which show a classification improvement in class separation, particularly for eightout of nine classes.
Table 5 Classification results using different methods for the Indian Pines dataset.
SVM DCS-LCA The proposed DCS method
All bands OA 0.8985 0.9250 0.9432
Kappa 0.8809 0.9143 0.9333
VGLCM 6+all bands OA 0.9112 0.9268 0.9355
Kappa 0.8959 0.9163 0.9239
VGLCM 6+ 5 PCs+all bands OA 0.9157 0.9277 0.9421
Kappa 0.9011 0.9140 0.9318
VGLCM 6+5PCs+5 selected bands OA 0.7921 0.9098 0.9428
Kappa 0.7540 0.8944 0.9326
Table 6 Confusion matrix of AVIRIS experiment (SVM with all bands).
Ground truth Number ofclassifiedpixels
Usersaccuracy
(%)1 2 3 4 5 6 7 8 9
Classified
1 958 26 3 0 0 21 85 2 0 1095 87.49
2 17 496 0 0 0 2 23 11 0 549 90.35
3 0 0 362 4 3 4 5 2 2 382 94.76
4 5 1 2 561 1 1 5 3 5 584 96.06
5 0 0 0 0 354 0 1 2 0 357 99.16
6 25 3 3 0 0 580 67 5 0 683 84.92
7 85 88 2 0 0 119 1609 9 4 1916 83.98
8 5 20 5 0 0 3 25 426 0 484 88.02
9 0 0 5 2 0 0 0 0 951 958 99.27
Number ofground truthpixels
1095 634 382 567 358 730 1820 460 962 OA ¼ 89.85Kappa ¼ 0.8809
Producersaccuracy (%)
87.49 78.23 94.76 98.94 98.88 79.45 88.41 92.61 98.86
Note: 1-corn-no till, 2-corn-min till, 3-grass/pasture, 4-grass/trees, 5-hay-windrowed, 6-soybeans-no till, 7-soy-beans-min till, 8-soybeans-clean till, 9-woods.
Su et al.: Dynamic classifier selection using spectral-spatial information for hyperspectral image classification
Journal of Applied Remote Sensing XXXXXX-10 Vol. 8, 2014
4.4 Statistical Significance Evaluation
The nonparametric McNemar’s test is applied to evaluate the statistical significance in accuracyimprovement with the proposed methods.37 It is based on the standardized normal test statistic.For the two methods to be compared, let f11 denote the number of samples that both methods cancorrectly classify, f22 is the number of samples that both cannot, f12 is the number of samplesmisclassified by method 1 but not method 2, and f21 is the number of samples misclassified bymethod 2 but not method 1. Thus, the McNemar’s test statistic for these two methods can bedefined as
z ¼ f12 − f21ffiffiffiffiffiffiffiffiffiffiffiffiffiffiffiffiffiffiffif12 þ f21
p : (5)
For a 5% level of significance, the corresponding jzj value is 1.96; a jzj value greater than thisquantity means two methods have a significant performance discrepancy. Moreover, the sign of zindicates whether method 1 outperforms method 2 (Z > 0 or vice versa. Table 8 tabulates the z
Fig. 6 Classification maps for the Indian Pines dataset. (a) SVM, (b) DCS-LCA, (c) the proposedDCS method.
Table 7 Confusion matrix of AVIRIS experiment (the proposed DCS with all bands).
Ground truth Number ofclassifiedpixels
Usersaccuracy
(%)1 2 3 4 5 6 7 8 9
Classified
1 988 14 1 0 0 8 11 0 0 1022 96.67
2 15 541 2 0 0 5 13 4 0 580 93.28
3 1 0 364 0 0 0 2 0 0 367 99.18
4 3 1 4 566 0 5 12 13 8 612 92.48
5 0 0 0 0 358 0 0 2 0 360 99.44
6 20 2 1 0 0 649 17 4 0 693 93.65
7 64 72 6 0 0 62 1757 4 0 1965 89.41
8 4 4 3 0 0 0 6 433 0 450 96.22
9 0 0 1 1 0 1 2 0 954 959 99.48
Number ofground truthpixels
1095 634 382 567 358 730 1820 460 962 OA ¼ 94.32Kappa ¼ 0.9333
Producersaccuracy (%)
90.23 85.33 95.29 99.82 100 88.90 96.54 94.13 99.17
Note: 1-corn-no till, 2-corn-min till, 3-grass/pasture, 4-grass/trees, 5-hay-windrowed, 6-soybeans-no till, 7-soy-beans-min till, 8-soybeans-clean till, 9-woods.
Su et al.: Dynamic classifier selection using spectral-spatial information for hyperspectral image classification
Journal of Applied Remote Sensing XXXXXX-11 Vol. 8, 2014
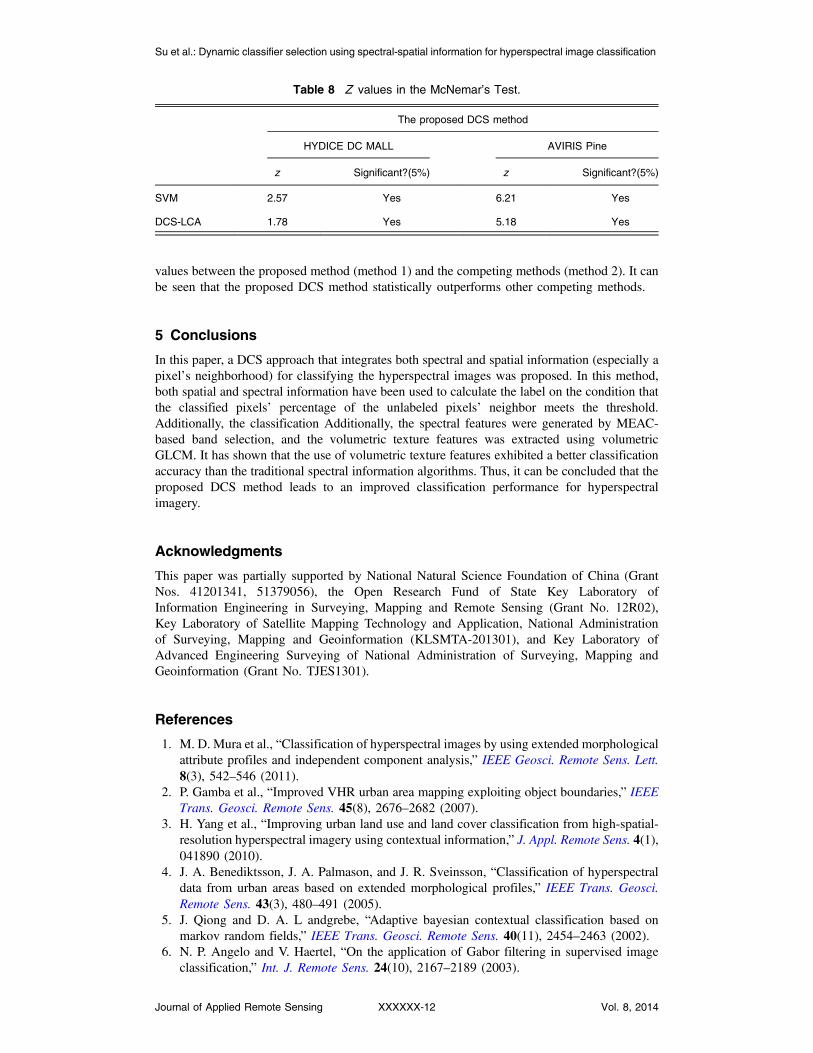
values between the proposed method (method 1) and the competing methods (method 2). It canbe seen that the proposed DCS method statistically outperforms other competing methods.
5 Conclusions
In this paper, a DCS approach that integrates both spectral and spatial information (especially apixel’s neighborhood) for classifying the hyperspectral images was proposed. In this method,both spatial and spectral information have been used to calculate the label on the condition thatthe classified pixels’ percentage of the unlabeled pixels’ neighbor meets the threshold.Additionally, the classification Additionally, the spectral features were generated by MEAC-based band selection, and the volumetric texture features was extracted using volumetricGLCM. It has shown that the use of volumetric texture features exhibited a better classificationaccuracy than the traditional spectral information algorithms. Thus, it can be concluded that theproposed DCS method leads to an improved classification performance for hyperspectralimagery.
Acknowledgments
This paper was partially supported by National Natural Science Foundation of China (GrantNos. 41201341, 51379056), the Open Research Fund of State Key Laboratory ofInformation Engineering in Surveying, Mapping and Remote Sensing (Grant No. 12R02),Key Laboratory of Satellite Mapping Technology and Application, National Administrationof Surveying, Mapping and Geoinformation (KLSMTA-201301), and Key Laboratory ofAdvanced Engineering Surveying of National Administration of Surveying, Mapping andGeoinformation (Grant No. TJES1301).
References
1. M. D. Mura et al., “Classification of hyperspectral images by using extended morphologicalattribute profiles and independent component analysis,” IEEE Geosci. Remote Sens. Lett.8(3), 542–546 (2011).
2. P. Gamba et al., “Improved VHR urban area mapping exploiting object boundaries,” IEEETrans. Geosci. Remote Sens. 45(8), 2676–2682 (2007).
3. H. Yang et al., “Improving urban land use and land cover classification from high-spatial-resolution hyperspectral imagery using contextual information,” J. Appl. Remote Sens. 4(1),041890 (2010).
4. J. A. Benediktsson, J. A. Palmason, and J. R. Sveinsson, “Classification of hyperspectraldata from urban areas based on extended morphological profiles,” IEEE Trans. Geosci.Remote Sens. 43(3), 480–491 (2005).
5. J. Qiong and D. A. L andgrebe, “Adaptive bayesian contextual classification based onmarkov random fields,” IEEE Trans. Geosci. Remote Sens. 40(11), 2454–2463 (2002).
6. N. P. Angelo and V. Haertel, “On the application of Gabor filtering in supervised imageclassification,” Int. J. Remote Sens. 24(10), 2167–2189 (2003).
Table 8 Z values in the McNemar’s Test.
The proposed DCS method
HYDICE DC MALL AVIRIS Pine
z Significant?(5%) z Significant?(5%)
SVM 2.57 Yes 6.21 Yes
DCS-LCA 1.78 Yes 5.18 Yes
Su et al.: Dynamic classifier selection using spectral-spatial information for hyperspectral image classification
Journal of Applied Remote Sensing XXXXXX-12 Vol. 8, 2014
7. R. M. Haralick, K. Shanmugam, and I. H. Dinstein, “Texture features for image classifi-cation,” IEEE Trans. Sys. Man Cybern. 3(6), 610–621 (1973).
8. A. N. Nyoungui, E. Tonye, and A. Akono, “Evaluation of speckle filtering and textureanalysis methods for land cover classification from SAR images,” Int. J. Remote Sens.23(9), 1895–1925 (2002).
9. F. Tsai et al., “3-D computation of gray level co-occurrence in hyperspectral image cubes,”Lec. Notes Comput. Sci. 4679, 429–440 (2007).
10. M. Fauvel et al., “Advances in spectral–spatial classification of hyperspectral images,” Proc.IEEE 101(3), 652–675 (2013).
11. P. Du et al., “Multiple cassifier system for remote sensing image classification: a review,”Sensors 12(4), 4764–4792 (2012).
12. T. G. Dietterich, “Ensemble methods in machine learning,” Lec. Notes Comput. Sci. 1857,1–15 (2000).
13. Z.-H. Zhou, J. Wu, and W. Tang, “Ensembling neural networks: many could be better thanall,” Artif. Intell. 137(122), 239–263 (2002).
14. L. I. Kuncheva, J. C. Bezdek, and R. P. Duin, “Decision templates for multiple classifierfusion: an experimental comparison,” Pattern Recogn. 34(2), 299–314 (2001).
15. K.Woods, W. P. Kegelmeyer, Jr., and K. Bowyer, “Combination of multiple classifiers usinglocal accuracy estimates,” IEEE Trans. Pattern Anal. Mach. Intell. 19(4), 405–410 (1997).
16. K. Tumer and J. Ghosh, “Error correlation and error reduction in ensemble classifiers,”Connection Sci. 8(3), 385–404 (1996).
17. G. Giacinto and F. Roli, “Adaptive selection of image classifiers,” Lec. Notes Comput. Sci.1310, 38–45 (1997).
18. L. I. Kuncheva, “Switching between selection and fusion in combining classifiers: anexperiment,” IEEE Trans. Syst. Man. Cybern. 32(2), 146–156 (2002).
19. A. H. R. Ko, R. Sabourin, and J. A. S. Britto, “From dynamic classifier selection to dynamicensemble selection,” Pattern Recogn. 41(5), 1718–1731 (2008).
20. P. C. Smits, “Multiple classifier systems for supervised remote sensing image classificationbased on dynamic classifier selection,” IEEE Trans. Geosci. Remote Sens. 40(4), 801–813(2002).
21. L. Didaci et al., “A study on the performances of dynamic classifier selection based on localaccuracy estimation,” Pattern Recogn. 38(11), 2188–2191 (2005).
22. Y. Tarabalka et al., “Multiple spectral-spatial classification approach for hyperspectral data,”IEEE Trans. Geosci. Remote Sens. 48(11), 4122–4132 (2010).
23. J. A. Benediktsson, J. Chanussot, and M. Fauvel, “Multiple classifier systems in remotesensing: from basics to recent developments,” Lec. Notes Comput. Sci. 4472, 501–512(2007).
24. C. Chen et al., “Spectral-spatial classification of hyperspectral image based on kernelextreme learning machine,” Remote Sens. 6(6), 5795–5814 (2014).
25. T. M. Nguyen and Q. M. J. Wu, “Gaussian-mixture-model-based spatial neighborhood rela-tionships for pixel labeling problem,” IEEE Trans. Syst. Man. Cybern. 42(1), 193–202(2012).
26. C. Chen et al., “Spectral-spatial preprocessing using multihypothesis prediction for noise-robust hyperspectral image classification,” IEEE J. Sel. Top. Appl. Earth Observ. 7(4),1047–1059 (2014).
27. Q. Du et al., “Noise-adjusted principal component analysis for buried radioactive targetdetection and classification,” IEEE Trans. Nucl. Sci. 57(6), 3760–3767 (2010).
28. H. Yang et al., “An efficient method for supervised hyperspectral band selection,” IEEEGeosci. Remote Sens. Lett. 8(1), 138–142 (2011).
29. D. J. Marceau et al., “Evaluation of the grey-level co-occurrence matrix method, for land-cover classification using SPOT imagery,” IEEE Trans. Geosci. Remote Sens. 28(4),513–519 (1990).
30. W. R. Tobler, “A computer movie simulating urban growth in the Detroit region,” Econ.Geogr. 46(2), 234–240 (1970).
31. G. Giacinto and F. Roli, “Methods for dynamic classifier selection,” in Proc. 10th Int. Conf.on Image Analysis and Processing, pp. 659–664, IEEE, Venice, Italy (1999).
Su et al.: Dynamic classifier selection using spectral-spatial information for hyperspectral image classification
Journal of Applied Remote Sensing XXXXXX-13 Vol. 8, 2014

32. A. M. P. Canuto et al., “Investigating the influence of the choice of the ensemble members inaccuracy and diversity of selection-based and fusion-based methods for ensembles,” PatternRecogn. Lett. 28(4), 472–486 (2007).
33. K. H. Riitters, J. D. Wickham, and T. G. Wade, “An indicator of forest dynamics using ashifting landscape mosaic,” Ecol. Indicators 9(1), 107–117 (2009).
34. K. Liu et al., “Optical flow and principal component analysis-based motion detection inoutdoor videos,” EURASIP J Adv. Signal Process. 2010, 680623 (2010).
35. H. Su et al., “Adaptive affinity propagation with spectral angle mapper for semi-supervisedhyperspectral band selection,” Appl. Opt. 51(14), 2656–2663 (2012).
36. C. Chen et al., “Reconstruction of hyperspectral imagery from random projections usingmultihypothesis prediction,” IEEE Trans. Geosci. Remote Sens. 52(1), 365–374 (2014).
37. G. M. Foody, “Thematic map comparison: evaluating the statistical significance ofdifferences in classification accuracy,” Photogramm. Eng. Remote Sens. 70(5), 627–633(2004).
Hongjun Su received his PhD degree in cartography and geography information system fromNanjing Normal University in 2011. He was a visiting student at Mississippi State Universityfrom 2009 to 2010. He is now an associate professor at the School of Earth Sciences andEngineering, Hohai University, Nanjing, China, and also with the Department ofGeographical Information Science, Nanjing University as a postdoctoral fellow. His mainresearch interests include hyperspectral remote sensing dimensionality reduction, classification,and spectral unmixing.
Bin Yong received his PhD degree in cartography and geography information system, NanjingUniversity, Nanjing, China. He is currently a professor with State Key Laboratory of Hydrology-Water Resources and Hydraulic Engineering, Hohai University, Nanjing, China. His researchareas mainly includes: remote sensing retrievals and applications; remote sensing precipitation(radar, satellite, multisensor, multiplatform); hyperspectral image classification; and satellite-based surface hydrology. He is currently the American Geophysical Union member.
Peijun Du received his PhD degrees in cartography and geographic information system fromChina University of Mining and Technology, in 2001. Currently, he is a professor of photogram-metry, remote sensing, and geographical information science with the Department ofGeographical Information Science, Nanjing University, Nanjing, China. His research interestsinclude remote sensing image processing and pattern recognition. He is the author of more than100 research articles about remote sensing and geospatial information processing andapplications.
Hao Liu received his BS degree in surveying and mapping engineering from Hohai University,Nanjing, China, in 2013. He is currently working toward the master degree in the State KeyLaboratory of Information Engineering in Surveying, Mapping and Remote Sensing, WuhanUniversity, Wuhan, China. His research interests include pattern recognition, image processingand computer vision.
Chen Chen received his BE degree in automation from Beijing Forestry University, Beijing,China, in 2009 and the MS degree in electrical engineering from Mississippi StateUniversity, Starkville, Mississippi, in 2012. He is currently working toward the Ph.D. degreein the Department of Electrical Engineering, University of Texas at Dallas, Richardson,Texas. His research interests include compressed sensing, signal and image processing, patternrecognition, computer vision, and hyperspectral image analysis.
Kui Liu received his BE degree in electrical engineering from Nanchang University, Nanchang,China in 2005, and received the MS degree in electrical engineering from Mississippi StateUniversity, Starkville, Mississippi, in 2011. He is currently a graduate research assistant inthe Department of Electrical Engineering at the University of Texas at Dallas as a memberof Signal and Image processing Laboratory. His research interests include real-time imageprocessing 3-D computer vision and machine learning.
Su et al.: Dynamic classifier selection using spectral-spatial information for hyperspectral image classification
Journal of Applied Remote Sensing XXXXXX-14 Vol. 8, 2014
Related Documents