1 of 4 Abstract - A dynamic analysis of the Correlation Integral (C m ) of the Heart Rate Variability signal (HRV) was applied to 50 patients with Hypertrophic Cardiomyopathy (HCM). A group of 55 healthy subjects was considered as a control group. The Correlation Integral is calculated within a moving time window in order to characterize the nonlinear dynamical behavior of the HRV of HCM patients that cannot be described by classical correlation dimension. Keywords – Complexity analysis, dynamic analysis, correlation integral. I. INTRODUCTION The analysis of Heart Rate Variability (HRV) has been relevant in the study of several cardiovascular phenomena. In the present study Hypertrophic Cardiomyopathy (HCM) patients are described by the Heart Rate Variability (HRV) using complexity analysis. In HCM patients there is an increased risk of premature death, which can occur with little or no warning. Sudden cardiac death (SCD) can strike at any age. Several studies have indicated the non-linear nature of heartbeat dynamics and cardiac function. The fluctuations in time between beats in a healthy heart may be due to an intrinsic variability of the autonomic nervous system control of non-linear nature, which accounts for this chaotic behavior, while illness is associated to an increasing regularity or complexity decrease [1,2]. In the case of hypertrophic cardiomyopathy patients, some attempts to characterize this cardiac illness using some non-linear tools like Poincaré plots and entropies have been made [3,4]. One of the measures of the time series complexity is the Correlation Dimension (D c ), which gives a statistical measure of the self-similarity of the geometry of a set of points (attractor) in a phase space [5]. Based on these concepts, this work presents a dynamic analysis of the Correlation Integral (C m ) applied to the Heart Rate Variability in order to characterize HCM patients. In this study, C m was calculated on a moving window, which was moved along the RR file several beats successively for all calculations. This methodology permits to analyze complexity changes throughout time. The number of beats (N) considered was common to both groups (HCM and NRM), in order to obtain comparable results. The correlation dimension based on Grassberger and Procaccia [6] criteria was also applied to these signals without considering the moving window. Furthermore, the dynamic analysis of the Correlation Integral (C m ) was applied to RR series of a patient with cardiac arrest and a patient with aortic stenosis. II. ANALYZED DATA HRV signals were obtained, using software developed by our group [7], from 24-hour ECG recordings sampled at 256 Hz of 50 patients with HCM of the NIC database (National Institute of Cardiology, Warsaw). All patients had QRS<120ms, no conduction abnormalities, less than 100/24h ectopic beats and did not receive medication during recording. A group of 55 normal subjects (NRM) was considered as a control group In order to emphasize specific aspects of the methodology, signals from two subjects without HCM were also considered: CA, patient with cardiac arrest; AS, patient with aortic stenosis. These Holter recordings were sampled at 128 Hz and RR interval extracted using Del Mar 563 Strata Scan software. Heart Rate Variability depends on many factors. One of them is patient activity during recording. To achieve the most comparable recording conditions and the best signal quality, we have selected RR data series segments of 4 night hours recorded approximately from 2 to 6 am, while patients were sleeping. III. METHODOLOGY From a defined data vector (y i , i=1,…,N), a m dimensional phase space (embedding dimension) is constructed, according to Takens theorem [8], obtaining Xt ≡ (y t , y t+ τ , y t+2τ ,…, y t+ (m-1)τ ), t = 1, …,N-(m-1)τ (1) where τ is the lag, expressed as a number of beats. In the phase space, the Correlation Integral which measures the number of points x j that are correlated with each other in a sphere of radius r around the points x i can be defined by [ ] ∑ ∑ τ - - = = - - Θ + τ - - = ) 1 m ( N 1 j j i N 1 i ref m ) x x r ( 1 ) 1 m ( N N 1 ) r ( C ref (2) where N is the number of points, and Θ(z) is the Heaviside function DYNAMIC ANALYSIS OF THE CORRELATION INTEGRAL OF HEART RATE VARIABILITY IN HYPERTROPHIC CARDIOMYOPATHY PATIENTS R. Carvajal 1,2 , M. Vallverdú 1 , J.J. Zebrowski 3 , R. Baranowski 4 , L. Chojnowska 4 , P. Caminal 1 1 ESAII Department, Center for Biomedical Engineering Research, Technical University of Catalonia, Barcelona, Spain 2 Computer Science School. Autonomous University of Sinaloa, México 3 Faculty of Physics, Warsaw University of Technology 4 National Institute of Cardiology, Warsaw, Poland

Welcome message from author
This document is posted to help you gain knowledge. Please leave a comment to let me know what you think about it! Share it to your friends and learn new things together.
Transcript
1 of 4
Abstract - A dynamic analysis of the Correlation Integral (Cm)of the Heart Rate Variability signal (HRV) was applied to 50patients with Hypertrophic Cardiomyopathy (HCM). A groupof 55 healthy subjects was considered as a control group. TheCorrelation Integral is calculated within a moving time windowin order to characterize the nonlinear dynamical behavior ofthe HRV of HCM patients that cannot be described by classicalcorrelation dimension.Keywords – Complexity analysis, dynamic analysis, correlationintegral.
I. INTRODUCTION
The analysis of Heart Rate Variability (HRV) has beenrelevant in the study of several cardiovascular phenomena.In the present study Hypertrophic Cardiomyopathy (HCM)patients are described by the Heart Rate Variability (HRV)using complexity analysis. In HCM patients there is anincreased risk of premature death, which can occur withlittle or no warning. Sudden cardiac death (SCD) can strikeat any age.
Several studies have indicated the non-linear nature ofheartbeat dynamics and cardiac function. The fluctuations intime between beats in a healthy heart may be due to anintrinsic variability of the autonomic nervous system controlof non-linear nature, which accounts for this chaoticbehavior, while illness is associated to an increasingregularity or complexity decrease [1,2]. In the case ofhypertrophic cardiomyopathy patients, some attempts tocharacterize this cardiac illness using some non-linear toolslike Poincaré plots and entropies have been made [3,4]. Oneof the measures of the time series complexity is theCorrelation Dimension (Dc), which gives a statisticalmeasure of the self-similarity of the geometry of a set ofpoints (attractor) in a phase space [5].
Based on these concepts, this work presents a dynamicanalysis of the Correlation Integral (Cm) applied to the HeartRate Variability in order to characterize HCM patients. Inthis study, Cm was calculated on a moving window, whichwas moved along the RR file several beats successively forall calculations. This methodology permits to analyzecomplexity changes throughout time. The number of beats(N) considered was common to both groups (HCM andNRM), in order to obtain comparable results. Thecorrelation dimension based on Grassberger and Procaccia[6] criteria was also applied to these signals withoutconsidering the moving window.
Furthermore, the dynamic analysis of the CorrelationIntegral (Cm) was applied to RR series of a patient withcardiac arrest and a patient with aortic stenosis.
II. ANALYZED DATA
HRV signals were obtained, using software developed byour group [7], from 24-hour ECG recordings sampled at 256Hz of 50 patients with HCM of the NIC database (NationalInstitute of Cardiology, Warsaw). All patients hadQRS<120ms, no conduction abnormalities, less than100/24h ectopic beats and did not receive medication duringrecording. A group of 55 normal subjects (NRM) wasconsidered as a control group
In order to emphasize specific aspects of themethodology, signals from two subjects without HCM werealso considered: CA, patient with cardiac arrest; AS, patientwith aortic stenosis. These Holter recordings were sampledat 128 Hz and RR interval extracted using Del Mar 563Strata Scan software.
Heart Rate Variability depends on many factors. One ofthem is patient activity during recording. To achieve themost comparable recording conditions and the best signalquality, we have selected RR data series segments of 4 nighthours recorded approximately from 2 to 6 am, while patientswere sleeping.
III. M ETHODOLOGY
From a defined data vector (yi, i=1,…,N), a mdimensional phase space (embedding dimension) isconstructed, according to Takens theorem [8], obtaining
Xt ≡ (yt, yt+ τ, yt+2τ,…, yt+ (m-1)τ), t = 1, …,N-(m-1)τ (1)
where τ is the lag, expressed as a number of beats.In the phase space, the Correlation Integral which
measures the number of points xj that are correlated witheach other in a sphere of radius r around the points xi can bedefined by
[ ] ∑∑τ−−
==
−−Θ+τ−−
=)1m(N
1jji
N
1irefm )xxr(
1)1m(NN
1)r(C
ref (2)
where N is the number of points, and Θ(z) is the Heavisidefunction
DYNAMIC ANALYSIS OF THE CORRELATION INTEGRAL OF HEARTRATE VARIABILITY IN HYPERTROPHIC CARDIOMYOPATHY PATIENTS
R. Carvajal1,2, M. Vallverdú1, J.J. Zebrowski3, R. Baranowski4, L. Chojnowska4, P. Caminal11ESAII Department, Center for Biomedical Engineering Research, Technical University of Catalonia, Barcelona, Spain
2Computer Science School. Autonomous University of Sinaloa, México3Faculty of Physics, Warsaw University of Technology
4National Institute of Cardiology, Warsaw, Poland

Report Documentation Page
Report Date 25 Oct 2001
Report Type N/A
Dates Covered (from... to) -
Title and Subtitle Dynamic Analysis of the Correlation Integral of Heart RateVariability in Hypertrophic Cardiomyopathy Patients
Contract Number
Grant Number
Program Element Number
Author(s) Project Number
Task Number
Work Unit Number
Performing Organization Name(s) and Address(es) ESAII Department Center for Biomedical Engineering RschTechnical University of Catalonia Barcelona, Spain
Performing Organization Report Number
Sponsoring/Monitoring Agency Name(s) and Address(es) US Army Research, Development & Standardization GroupPSC 802 Box 15 FPO AE 09499-1500
Sponsor/Monitor’s Acronym(s)
Sponsor/Monitor’s Report Number(s)
Distribution/Availability Statement Approved for public release, distribution unlimited
Supplementary Notes Papers from 23rd Annual International Conference of the IEEE Engineering in Medicine and Biology Society, October25-28, 2001, held in Istanbul, Turkey. See also ADM001351 for entire conference on cd-rom., The original documentcontains color images.
Abstract
Subject Terms
Report Classification unclassified
Classification of this page unclassified
Classification of Abstract unclassified
Limitation of Abstract UU
Number of Pages 4
2 of 4
Θ(z) = 0 if z ≤ 0Θ(z) = 1 if z > 0
The distance || xi - xj || between a pair of points in theattractor has been computed as the euclidean norm
( )∑=
→→−=−
m
1k
2k,jk,iji xxxx (3)
In practice, it has been shown that it is sufficient to takerandomly only 10% of the points as reference points (Nref) tocalculate the Correlation Integral [9].
For each reference point, the distance to all other points inthe attractor is calculated and Theiler’s correction is appliedto avoid autocorrelation effects, excluding the four nearestneighbor points in time [10].
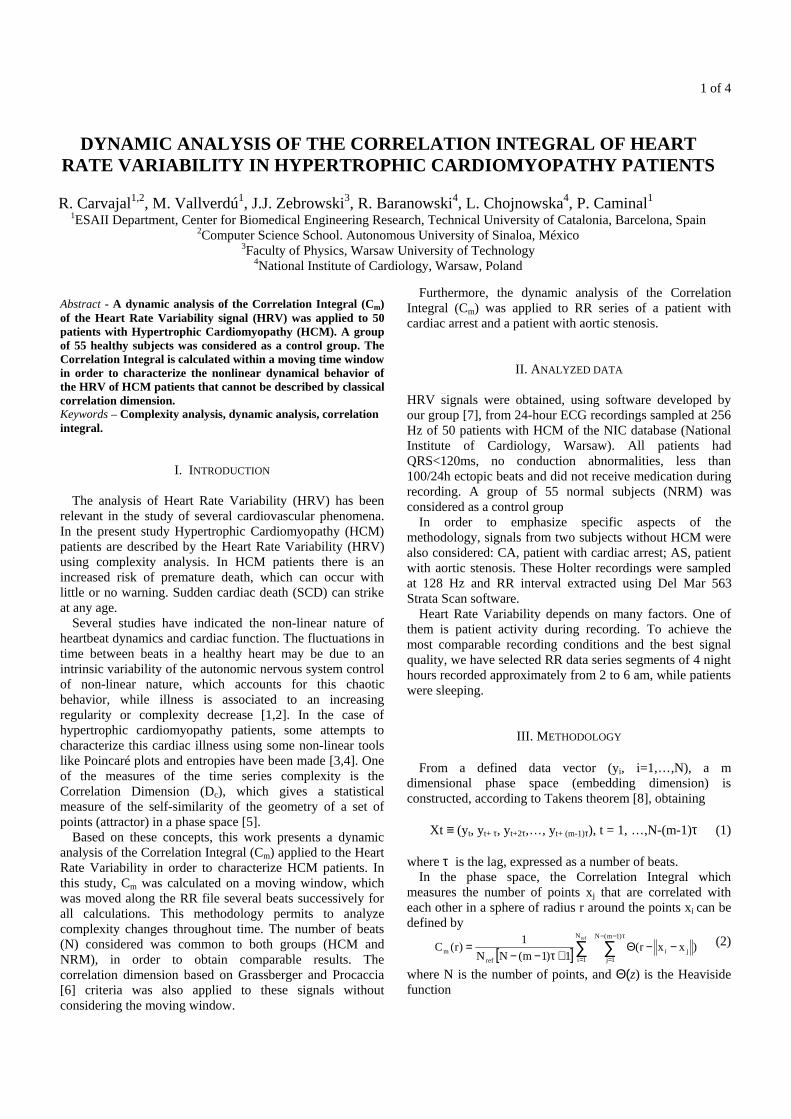
When log2(Cm(r)) is plotted versus log2(r) (Fig. 1), theslope of the resulting straight line, determined by a linearregression at low r, yields the correlation dimension Dc aswas showed by Grassberger and Procaccia [6].
Scaling
Region
�
��
�� �
�� �
�� �
�� �
Fig. 1. Correlation Integral as a function of the sphere radius (r)for each embedding dimension.
There have been some proposals concerning the amountof data points N needed to estimate Dc [11,12]. Thispresents limitations when the Dc is calculated on a movingwindow of reduced RR samples. For this reason, we proposeto estimate a correlation integral (Cm) in a moving timewindow instead of using the concept of Dc. In this way,several Cm(r) are computed for increasing values of m, andthe slopes (Sc) are determined from a scaling region of thelog-log plot, obtaining a sequence of Sc(m).
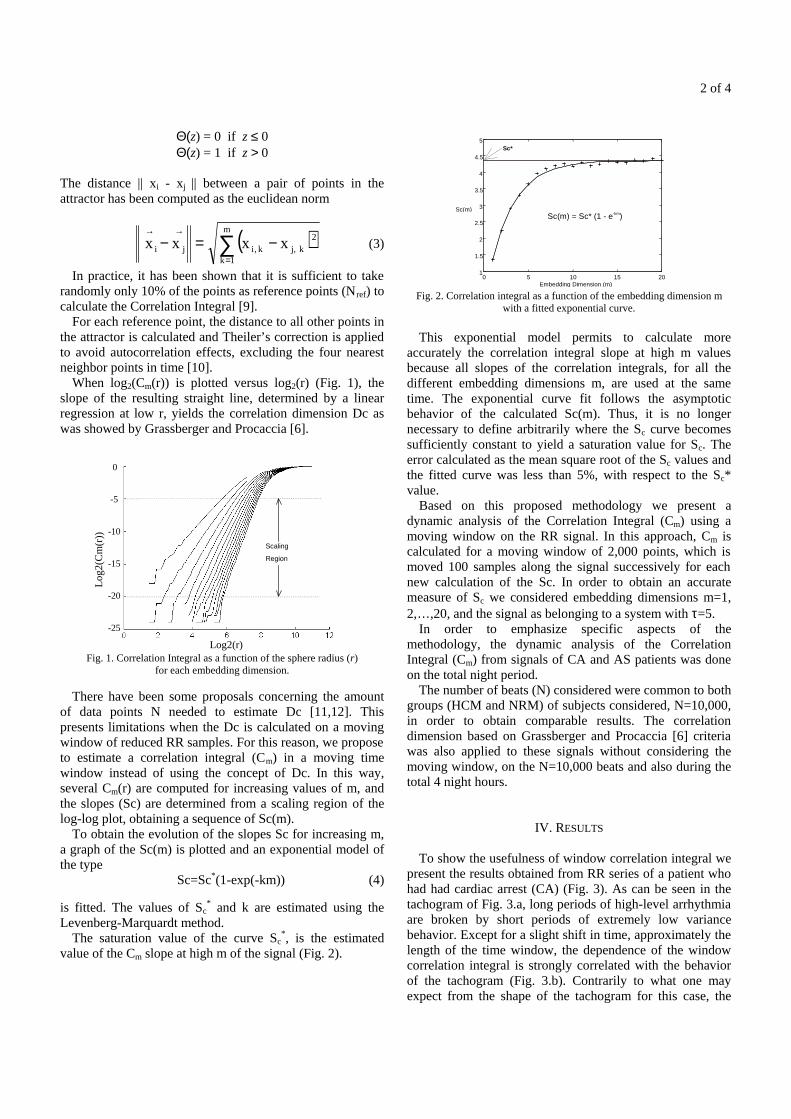
To obtain the evolution of the slopes Sc for increasing m,a graph of the Sc(m) is plotted and an exponential model ofthe type
Sc=Sc*(1-exp(-km)) (4)
is fitted. The values of Sc* and k are estimated using the
Levenberg-Marquardt method.The saturation value of the curve Sc
*, is the estimatedvalue of the Cm slope at high m of the signal (Fig. 2).
0 5 10 15 201
1.5
2
2.5
3
3.5
4
4.5
5
Embedding Dimension (m)
Sc(m)
Sc*
Sc(m) = Sc* (1 - e-km)
Fig. 2. Correlation integral as a function of the embedding dimension mwith a fitted exponential curve.
This exponential model permits to calculate moreaccurately the correlation integral slope at high m valuesbecause all slopes of the correlation integrals, for all thedifferent embedding dimensions m, are used at the sametime. The exponential curve fit follows the asymptoticbehavior of the calculated Sc(m). Thus, it is no longernecessary to define arbitrarily where the Sc curve becomessufficiently constant to yield a saturation value for Sc. Theerror calculated as the mean square root of the Sc values andthe fitted curve was less than 5%, with respect to the Sc*value.
Based on this proposed methodology we present adynamic analysis of the Correlation Integral (Cm) using amoving window on the RR signal. In this approach, Cm iscalculated for a moving window of 2,000 points, which ismoved 100 samples along the signal successively for eachnew calculation of the Sc. In order to obtain an accuratemeasure of Sc we considered embedding dimensions m=1,2,…,20, and the signal as belonging to a system with τ=5.
In order to emphasize specific aspects of themethodology, the dynamic analysis of the CorrelationIntegral (Cm) from signals of CA and AS patients was doneon the total night period.
The number of beats (N) considered were common to bothgroups (HCM and NRM) of subjects considered, N=10,000,in order to obtain comparable results. The correlationdimension based on Grassberger and Procaccia [6] criteriawas also applied to these signals without considering themoving window, on the N=10,000 beats and also during thetotal 4 night hours.
IV. RESULTS
To show the usefulness of window correlation integral wepresent the results obtained from RR series of a patient whohad had cardiac arrest (CA) (Fig. 3). As can be seen in thetachogram of Fig. 3.a, long periods of high-level arrhythmiaare broken by short periods of extremely low variancebehavior. Except for a slight shift in time, approximately thelength of the time window, the dependence of the windowcorrelation integral is strongly correlated with the behaviorof the tachogram (Fig. 3.b). Contrarily to what one mayexpect from the shape of the tachogram for this case, the
Log
2(C
m(r
))
Log2(r)
0
-5
-10
-15
-20
-25

3 of 4
window correlation integral slope decreases sharply duringperiods of arrhythmia. This is due to the fact that in 3-dimensional phase space, the trajectory for these periods isextremely simple (Fig. 3.c). On the other hand, the phasespace trajectory becomes much more complex during thelow variance HRV periods (Fig. 3.d).
0
500
1000
15000
500
1000
1500
0
500
1000
1500
RR(t+ τ )RR(t)
RR
(t+
2τ)
900
950
1000
1050
1100 900
950
1000
1050
1100900
950
1000
1050
1100
RR(t+ τ )RR(t)
RR
(t+
2τ )
Fig. 3. (a) RR series of CA patient. (b) Slopes of the correlation integral athigh m values, obtained with windows of 2,000 beats moving each window100 beats. (c) Three-dimensional phase space trajectory of 200 beats duringthe high variance of HRV. (d) Three-dimensional phase space trajectory of
200 beats during the low variance of HRV.
Fig. 4 presents the results of a patient with aortic stenosis(AS), in which characteristic spiking in the HRV occurs.This spiking is unusually regular (Fig. 4.a). As a result, thewindowed correlation integral slope is low and shows verylittle variance (Fig. 4.b). The 3-dimensional phase spacetrajectory is shown in Fig. 4.c.
0
500
1000
15000
500
1000
1500
0
500
1000
1500
RR(t+τ )RR(t)
RR
(t+
2τ)
Fig. 4. (a) RR series of AS patient. (b) Slopes of the correlation integral athigh m values, obtained with windows of 2,000 beats moving each window
100 beats. (c) Three-dimensional phase space trajectory of 2,000 beats.
Fig. 5 shows the evolution through the time of the slopes(Sc) at high embedding dimension m of the correlationintegral (Cm) of a RR signal behavior, of a HCM patient.
0 1000 2000 3000 4000 5000 6000 7000 8000 9000 100000
500
1000
1500
number of beats
RR (m
s)
0 1000 2000 3000 4000 5000 6000 7000 8000 9000 10000
4
6
8
10
12
14
number of beats
Sc*
0
500
1000
1500 0
500
1000
15000
500
1000
1500
RR(t+τ)RR(t)
RR
(t+
2τ)
Fig. 5. (a) RR series of a HCM patient. (b) Evolution of the slopes (Sc) ofthe windowed correlation integral at high embedding dimensions.
(c) Three-dimensional phase space trajectory of 2,000 beats.
Table I presents the results of applying the proposedmethodology to the HCM and NRM groups. The meanvalue and the standard deviation (sd) of Sc* obtained in allstudied windows characterized HCM group (mean Sc*:10.0±0.955; sd Sc*: 1.589±0.624) with a significant levelp=0.041 and p<0.0005, respectively, when both groups werecompared. The minimum value of Sc* could differentiate thegroups (HCM: 6.603±1.755; NRM: 7.472±1.594) with ap=0.006. No statistical significant differences were foundconsidering the maximum values of Sc*, however thedifferences between the maximum and minimum value(HCM: 4.876±1.409; NRM: 5.949±1.807) presented asignificant level p=0.001. The sum of the consecutiveabsolutes differences of the Sc* values were also statisticallysignificant with p=0.026.
TABLE ISLOPES (Sc) AT HIGH EMBEDDING DIMENSION OF THE
WINDOWED CORRELATION INTEGRAL Cm
mean±sdgroups NRM HCM p-valuemean Sc* 10.4±0.786 10.0±0.955 0.041sd Sc* 1.186±0.456 1.589±0.624 <0.0005min Sc* 7.472±1.594 6.603±1.755 0.006max Sc* 12.3±0.725 12.6±0.716 n.s.maxSc*–minSc* 4.876±1.409 5.949±1.807 0.001∑|Sc*(i)-Sc*(i+1)| 0.389±0.067 0.426±0.089 0.026
n.s. no significant statistical level
It can be seen in Table II that Correlation Dimension (Dc)calculated from a non-windowed correlation integral andconsidering the complete night period of the RR series couldnot characterize the system complexity of HCM patients.Similarly, when using Dc to analyze 10,000 samples of theRR series (Table III), HCM and NRM subjects were notdifferentiated. However, both groups could be characterized,in the time domain, by the mean value of the RR series andthe standard deviation (Tables II and III). Moreover, nostatistical differences were found comparing Dc from thecomplete night period and 10,000 samples of the RR series.
(b)
(a)
(c)
(a)
(b)
Co
rrel
atio
n In
tegra
l Slo
pe
(c)
(d)
RR
In
terv
al (
ms)
time (h)
time (h)
(a)
(b)
(c)
Co
rrel
atio
n In
tegra
l Slo
pe
time (h)
time (h)

4 of 4
TABLE IICORRELATION DIMENSION Dc OF THE RR SERIES DURING
4 HOUR NIGHT PERIOD
mean±sdgroups NRM HCM p-valueDc 9.721±1.346 9.249±1.896 n.s.mean RR 960.2±132.3 1028.9±154.3 0.028sd RR 100.9±53.4 114.8±41.8 0.023n.s. no significant statistical level
TABLE IIICORRELATION DIMENSION DC OF THE RR SERIES
10,000 SAMPLES
mean±sdgroups NRM HCM p-valueDc 9.503±1.196 9.013±1.781 n.s.mean RR 958.3±131.1 1027±155.7 0.016sd RR 101.0±45.9 116.1±40.6 0.026n.s. no significant statistical level
V. DISCUSSION AND CONCLUSIONS
A methodology to obtain dynamic Correlation Integral ofthe HRV signal has been presented. Using thismethodology, 50 patients with HypertrophicCardiomyopathy and 55 subjects considered as a controlgroup were analyzed.
With respect to the methodology, it is important toemphasize that the exponential fit to obtain the final value ofthe Correlation Integral slope, named here Sc*, seems to be abetter approach to obtain the correct value, since it uses allthe points of the Sc(m) curve and defines the correlationintegral slope as an asymptotic value attained withincreasing embedding. The curve may be fit with a relativelow error – less than 5% of the group of HCM patientsstudied here. With regard to the number of beats to analyze,it seems that 10,000 beats give sufficient information tocalculate the evolution of Sc* consistently, if the night hoursare chosen correctly.
As many biological phenomena are complex the approachof moving window correlation integral Cm could be aninteresting way to analyze such systems. The value of Sc*for each window usually fluctuates around an average valuebut, as may be clearly seen for the arrhythmia case CA, maygive valuable information about the changes in the dynamicsof the system. In particular, window correlation integral maybe used to detect relatively short episodes embedded in thetime series. In the case of HCM patients, changes incomplexity evaluated by the windowed correlation integralseems to be able to characterize this group of patients.Contrarily, the results obtained from HCM patients applyingcorrelation dimension Dc without considering a movingwindow, shows that Dc does not characterize heart ratevariability in HCM patients.
ACKNOWLEDGEMENTS
This work was partially financed by grant FEDER (2FD97-1197-C02-02) from the Spanish Government.
REFERENCES
[1] D.T. Kaplan, M.L. Furman, S. Pincus, S.M. Ryan, L.A.Lipsitz, A.L. Goldberger, "Aging and the complexity ofcardiovascular dynamics", Biophys. J., vol. 59, pp. 945-949.1991.[2] A. Porta, S. Guzzetti, N. Montano, M. Pagani, V.Somers, A. Malliani, G. Baselli, S. Cerutti, "Informationdomain analysis of cardiovascular variability signals:evaluation of regularity, synchronisation and co-ordination",Med.&Biol Eng.&Comp., vol. 38, pp. 180-188. 2000.[3] R. Baranowski, J.J. Zebrowski, W. Poplawska, M.A.Mañanas, R. Jané, P. Caminal, L. Chojnowska, W.Rydlewska-Sadowska, X. Viñolas, J. Guindó, A. Bayes deLuna, “3-Dimensional Poincaré plots of the QT intervals -an approach to nonlinear QT analysis”, Computers inCardiology, pp. 789-792. 1995.[4] J.J. Zebrowski, T. Buchner, R. Baranowski, W.Poplawska, “Nonlinear analysis of heart dynamics”, Med.Biol. Eng. Comput., vol. 34, pp. 379-380. 1996.[5] A. Casaleggio, G. Bortolan, “Automatic estimation ofthe correlation dimension for the análisis ofelectrocardiograms”, Biol. Cybernetics, vol. 81, pp. 279-290, 1999.[6] P. Grassberger, I. Procaccia, "Measuring the strangenessof strange attractors", Physica D, vol. 9, pp. 189-208. 1983.[7] P. Laguna, R. Jané, P. Caminal, “Automatic detection ofwave boundaries in multilead ECG signals : Validation withthe CSE database”, Comp. and Biomed. Res., vol. 27, pp.45-60. 1994.[8] F. Takens, "Detecting strange attractors in turbulence",in Rand D.A., L.S. Young, (Eds.). "Dynamical systems andturbulence", Lect. Notes in Math., vol. 898, pp. 366-381.1981.[9] T.M. Kruel, A. Freund, “SCOUNT, A program tocalculate the correlation and information dimension fromattractors by the method of sphere-counting”. http://inls.ucsd.edu/ftp/pub/. 1991.[10] J. Theiler, “Spurious dimension from correlationalgorithms applied to limited time series data”, Phys. Rev.A., vol. 34, pp. 2427-2432. 1986.[11] M. Ding, C. Grebogi, E. Ott, T. Sauer, J.A. Yorke,"Estimating correlation dimension from chaotic time series:When does plateau occur?", Physica D, vol. 69, pp. 404-424.1993.[12] A.A. Tsonis, Chaos: From Theory to Application.Plenum Press. N.Y. 1992.
Related Documents