Indian Journal of Chemical Technology Vol. 26, January 2019, pp. 35-43 Dye adsorption using low cost carbon adsorbent from agrowaste -pearl millet cob husk Samir Charola, Prasanta Das & Subarna Maiti* Process Design & Engineering Cell, CSIR-Central Salt & Marine Chemicals Research Institute, G.B. Marg, Bhavnagar 364002, Gujarat, India E-mail:[email protected] Received 15 February 2017; accepted 18 October 2018 Activated carbon (MHAC) has been derived from the millet cob husk in a single step activation at a temperature of 600 o C, impregnation ratio of 2:1 and residence time of 120 min. The Brunauer–Emmett–Teller (BET) surface area of the MHAC is 1342 m 2 /g and the scanning electron microscopy (SEM) images and Fourier-transform infrared spectroscopy (FT-IR) are similar to commercial activated carbon. The dye removal performance of the generated carbon has been investigated using methylene blue (MB) using following parameters; contact time, initial concentration of MB, pH and temperature. Langmuir, Freundlich, Temkin and Dubinin–Radushkevich (D-R) adsorption isotherms and three kinetic models have been studied. The adsorption equilibrium data is best fitted to Langmuir isotherm with R 2 value of 0.972 .The adsorption kinetics show that pseudo-second-order kinetic model fits better with the experimental data of MB adsorption by MHAC than pseudo-first-order kinetic model. Regeneration of the carbon has been carried out for five cycles and 85.34 % MB could be adsorbed by the spent carbon, after fifth cycle. Keywords: Single step activation, Adsorption isotherms, Adsorption kinetics, Millet cob husk, Regeneration With the expansion of textile and allied industries, the associated waste water pollution problem has faced serious attention. Generally, a dye molecule is a very complex organic substance and therefore not degraded easily 1 . Because of its structural stability it creates harmful effects on the environment and human health 2 . There are many methods generally used to remove dye from the wastewater e.g. froth flotation 3 , membrane separation 4,5 , air flotation 6 , photo degradation 7 , extraction 8 , biological 9 , chemical oxidation 9 etc. Out of the above processes, adsorption can be considered as a simple and practical option 10 . The usage of activated carbon as an adsorbent is high due to its good thermal stability, high surface area and rich porous structure. Commonly, commercial activated carbon is prepared from the conventional sources like carbonized low grade coal, wood or coconut shell. There is an opportunity for researchers to find out effective and cheap resource to replace the conventional ones 11 . The ability of adsorption of dye from wastewater mainly depends on the characteristics of the precursor and the preparing conditions 12 . Recent studies have focused on the preparation of activated biochar from agricultural residues. Prior work has been done using peanut hull, fruit shell, rice husk, sugarcane leaves, and bamboo as other cheaper sources 13-16 . There are two methods of activation: Physical activation and chemical activation. Physical activation comprises pyrolysis (below 600C) and then gasification using oxidizing agents such as steam, CO 2 , air or mixture of them at elevated temperature (below 1100 o C). In chemical activation, chemicals like KOH, H 3 PO 4 , ZnCl 2 etc. are commonly used as oxidizing agents 17-22 . The important benefits of chemical activation are development of rich porous structure in the resulting carbon, high yield and requirement of lower activation temperatures. In this work, porous activated carbon (MHAC) was derived from millet cob husk using KOH as an oxidizing agent. Production of millet pearl is high in western part of India during to favourable climatic conditions. For separation of pearl millet from the cob, mechanical threshers are used. Millet cob husk and millet pearl are produced after threshing operation. The RPR (residue to product ratio) for cob husk to pearl millet is 1:3 23,24 . The husk is generally burnt in field and this was selected as precursor of activated carbon. Food chain is not also affected by using millet cob husk as a predecessor for production of MHAC. Little or no information is reported in literature on the effects of activation conditions: temperature, residence time and impregnation ratio on the physico- chemical properties of carbon produced by activation

Welcome message from author
This document is posted to help you gain knowledge. Please leave a comment to let me know what you think about it! Share it to your friends and learn new things together.
Transcript

Indian Journal of Chemical Technology Vol. 26, January 2019, pp. 35-43
Dye adsorption using low cost carbon adsorbent from agrowaste -pearl millet cob husk
Samir Charola, Prasanta Das & Subarna Maiti* Process Design & Engineering Cell, CSIR-Central Salt & Marine Chemicals Research Institute,
G.B. Marg, Bhavnagar 364002, Gujarat, India
E-mail:[email protected]
Received 15 February 2017; accepted 18 October 2018
Activated carbon (MHAC) has been derived from the millet cob husk in a single step activation at a temperature of 600oC, impregnation ratio of 2:1 and residence time of 120 min. The Brunauer–Emmett–Teller (BET) surface area of the MHAC is 1342 m2/g and the scanning electron microscopy (SEM) images and Fourier-transform infrared spectroscopy (FT-IR) are similar to commercial activated carbon. The dye removal performance of the generated carbon has been investigated using methylene blue (MB) using following parameters; contact time, initial concentration of MB, pH and temperature. Langmuir, Freundlich, Temkin and Dubinin–Radushkevich (D-R) adsorption isotherms and three kinetic models have been studied. The adsorption equilibrium data is best fitted to Langmuir isotherm with R2 value of 0.972 .The adsorption kinetics show that pseudo-second-order kinetic model fits better with the experimental data of MB adsorption by MHAC than pseudo-first-order kinetic model. Regeneration of the carbon has been carried out for five cycles and 85.34 % MB could be adsorbed by the spent carbon, after fifth cycle.
Keywords: Single step activation, Adsorption isotherms, Adsorption kinetics, Millet cob husk, Regeneration
With the expansion of textile and allied industries, the associated waste water pollution problem has faced serious attention. Generally, a dye molecule is a very complex organic substance and therefore not degraded easily1. Because of its structural stability it creates harmful effects on the environment and human health2. There are many methods generally used to remove dye from the wastewater e.g. froth flotation3, membrane separation4,5, air flotation6, photo degradation7, extraction8, biological9, chemical oxidation9 etc. Out of the above processes, adsorption can be considered as a simple and practical option10. The usage of activated carbon as an adsorbent is high due to its good thermal stability, high surface area and rich porous structure. Commonly, commercial activated carbon is prepared from the conventional sources like carbonized low grade coal, wood or coconut shell. There is an opportunity for researchers to find out effective and cheap resource to replace the conventional ones11. The ability of adsorption of dye from wastewater mainly depends on the characteristics of the precursor and the preparing conditions12. Recent studies have focused on the preparation of activated biochar from agricultural residues. Prior work has been done using peanut hull, fruit shell, rice husk, sugarcane leaves, and bamboo as other cheaper sources13-16. There are two methods of
activation: Physical activation and chemical activation. Physical activation comprises pyrolysis (below 600C) and then gasification using oxidizing agents such as steam, CO2, air or mixture of them at elevated temperature (below 1100oC). In chemical activation, chemicals like KOH, H3PO4, ZnCl2 etc. are commonly used as oxidizing agents17-22. The important benefits of chemical activation are development of rich porous structure in the resulting carbon, high yield and requirement of lower activation temperatures.
In this work, porous activated carbon (MHAC) was derived from millet cob husk using KOH as an oxidizing agent. Production of millet pearl is high in western part of India during to favourable climatic conditions. For separation of pearl millet from the cob, mechanical threshers are used. Millet cob husk and millet pearl are produced after threshing operation. The RPR (residue to product ratio) for cob husk to pearl millet is 1:323,24. The husk is generally burnt in field and this was selected as precursor of activated carbon. Food chain is not also affected by using millet cob husk as a predecessor for production of MHAC.
Little or no information is reported in literature on the effects of activation conditions: temperature, residence time and impregnation ratio on the physico-chemical properties of carbon produced by activation

INDIAN J. CHEM. TECHNOL., JANUARY 2019
36
of pearl millet cob husk by KOH. The objective of the present study was to determine the optimum value of each process parameter and to investigate the effect of initial dye concentration, contact time and pH on the adsorption of dye. Also, the study of adsorption isotherm, kinetics and thermodynamics was carried out to understand the adsorptive behaviour of the prepared MHAC. The dye chosen for the study was Methylene blue (MB)- a basic dye which has been studied extensively25-32. It is most applicable in cotton and synthetic fibers. It has tendency to cause eye burning, vomiting, nausea, diarrhea, profuse sweating, gastritis and mental confusion and hence is an important pollutant.
Experimental Section
Materials The millet cob husk powder was collected from an
agricultural field of Gujarat, a state in western India. In order to remove dirt and other water soluble impurities, it was washed with water and the washed precursor was dried overnightat 105C in hot air oven. The precursor was then preserved in desiccator to keep away the moisture. Potassium hydroxide (KOH) and hydrochloric acid (HCl) were obtained from Rankem, India. The inert atmosphere during activation was provided by 99.5% pure nitrogen gas. Deionized water was used in this study.
Preparation of activated carbon The dried millet cob husk was sieved through 100
mesh screen. It was then impregnated with KOH solution for 24 h at room temperature and then dried at 105C in hot air oven. The impregnated biomass was inserted in a horizontal tube furnace made from stainless steel. The internal diameter and length of tube furnace was 0.03 m and 1 m, respectively. The sample was heated at desired temperature with desired residence time under inert atmosphere. The rate of heating of tube furnace was 10C/.min. After cooling down to room temperature the resultant mixture was thoroughly washed with mild HCl followed by hot distilled water until pH was neutral. The resulting MHAC was again dried at 105C for 10 h in oven and stored in container for further use. The schematic diagram for the preparation of MHAC is shown in Fig. 1.
Characterization of MHAC All physico-chemical properties of MHAC were
measured precisely. A pH meter, Model Orion STAR A111 (Thermo Fisher Scientific, India) was used to determine the pH of MB solution. BET surface area
and pore size of MHAC was determined by Monosorb Rapid Surface Area Analyzer (Quantachrome Instruments) with the accuracy of 0.01 m2/g. An automatic proximate analyzer, Model APA 2 (Advance Research Instruments Co., India) was used to carry out proximate analysis of MHAC. The minimum detection limit and the temperature accuracy of furnace is 0.2% and ±5C respectively. The ultimate analysis of MHAC was performed using vario MICRO cube (Elementar, Germany). The surface morphology of porous MHAC was characterized with Field Emission Scanning Electron Microscope, Model JSM-7100F (JEOL, USA). The resolution range from 1.2 nm to 3.0 nm and magnification range in between 10 to 1 million times. The Fourier transform-infrared (FT-IR) spectrum of MHAC was done using a Perkin-Elmer spectroscope (Spectrum GX, Germany) at a resolution of 4 cm-1.
Adsorption study In this work, the adsorption ability of MHAC was
determined by using MB as an adsorbate. The chemical formula of MB is C16H18ClN3S, a cationic dye having molecular weight of 319.87 g/mol and CI No. 52015.
The 250 mL Erlenmeyer flasks were used to perform all adsorption experiments. Each flask contained 0.15 g of MHAC and 150 mL MB solution of predefined concentrations. The pH of the solution was maintained using 0.1 N NaOH and 0.1 N HCl solutions. Vibrating shaker was employed to shake the flask at the speed of 120 rpm for 24 h. The resultant mixtures after adsorption were then centrifuged at 3500 rpm and the supernatants were studied by UV-Vis spectrophotometer (Orion Aquamate 8000, Thermo Scientific, India) at 665 nm.
The equilibrium adsorption capacity per unit mass of MHAC was computed as follows:
𝑞
𝑉 ... (1)
where, qe is the equilibrium adsorption capacity (mg/g), Co and Ce are the initial and equilibrium concentration of MB (mg/L), respectively, w is the mass of MHAC (g) and V is the volume of sample (mL).
Fig. 1 — Process flow diagram of activation of biomass (Millet cob husk)
CHAROLA et al.: CARBON ADSORBENT FROM AGROWASTE -PEARL MILLET COB HUSK
37
The MB removal percentage was estimated as follows:
𝑅
100% … (2)
where, Co and Ct are the initial and t-time concentration of MB (mg/L) respectively and R is the MB removal percentage (%). Adsorption Isotherm model
The isotherm study is important to investigate the adsorption process. It is also important for optimization of the adsorption system design. In present work, data of equilibrium of MB adsorption were analyzed by four common and widely used adsorption isotherm models: Langmuir, Freundlich, Temkin and Dubinin–Radushkevich (D-R) isotherms. The obtained results were compared with commercial activated carbon (CAC) from Sigma Aldrich of surface area, 750 m2/g.
Langmuir isotherm assumes there is negligible interaction among the adsorbed molecules, all active sites are energetically equal and only one molecule can be handled by each site33. The linear form of this isotherm equation is expressed as,
… (3)
where, Ce (mg/L) is the equilibrium concentration of the MB, qe (mg/g) is the equilibrium adsorption capacity, Qo (mg/g) and KL (L/mg) are the monolayer adsorption capacity and Langmuir constants, respectively.
The important characteristics of Langmuir isotherm can be expressed by a unitless parameter called separation factor, RL, defined as Table 1,
𝑅 … (4)
Freundlich model is based on an empirical equation. It assumes that the adsorption is carrying out on a heterogeneous surface. Each available active site has varying affinities and this binding affinities decrease as the degree of site occupation increases34.
The linear logarithmic form of this isotherm can be expressed as,
𝑙𝑛𝑞 𝑙𝑛𝐾 𝑙𝑛𝐶 … (5)
where, Kf is the distribution co-efficient and n is the heterogeneous intensity factor which provides information regarding the adsorption process possibility.
The linear form of Temkin isotherm35 is as follows:
𝑞 𝑙𝑛𝐴 𝑙𝑛𝐶 … (6)
where, AT is the binding constant (L/g), bT is the Temkin isotherm constant, R is the gas constant (8.314 J/mol.K), B (RT/AT) is the constant related to heat of sorption (J/mol) and T is the temperature (298 K).
Dubinin–Radushkevich isotherm36 can be defined as,
𝑙𝑛𝑞 𝑙𝑛𝑞 𝐾 𝜀 … (7)
where ε can be estimated as,
𝜀 𝑅𝑇𝑙𝑛 1 … (8)
where, T is the absolute temperature (K) and R is the gas constant (8.314 J/mol.K).
The mean free energy, E can be estimated by:
𝐸 … (9)
Adsorption kinetics model The adsorbate uptake rate on adsorbent was described
by the kinetics of adsorption. In this study, the rate of adsorption of MB on MHAC was analyzed by three different kinetic models: pseudo-first-order37, pseudo-second-order38 and intraparticle diffusion model39. The linear form of pseudo-first order, pseudo-second-order and intraparticle diffusion model is expressed by equations (10), (11) and (12), respectively.
ln 𝑞 𝑞 𝑙𝑛𝑞 k t … (10)
… (11)
𝑞 𝑘 ∗ 𝑡 . 𝐶 … (12)
where, qe and qt(mg/g) are the amounts of MB adsorbed at equilibrium and at any time, t (h), respectively, k1 (h-1), k2 (g/mg.h) and kint(mg/g.(h)1/2) are the kinetic rate constant for pseudo-first-order, pseudo-second-order and intraparticle diffusion model, respectively and Ci (mg/g) is the intraparticle diffusion model constant.
Table 1 — Relation of equilibrium parameter RL with type of isotherm in Langmuir model
Value of equilibrium parameter Type of isotherm
RL>1 Unfavourable RL=1 Linear
0<RL<1 Favourable RL=0 Irreversible
INDIAN J. CHEM. TECHNOL., JANUARY 2019
38
Results and Discussion
Effect of process parameters on preparation of activated carbon The pore structure and surface area of activated
carbon mainly depends on the activation condition under which it is prepared. The effect of these conditions like temperature, impregnation ratio and residence time on the qe and also removal percentage of MB, by the carbon was thoroughly studied.
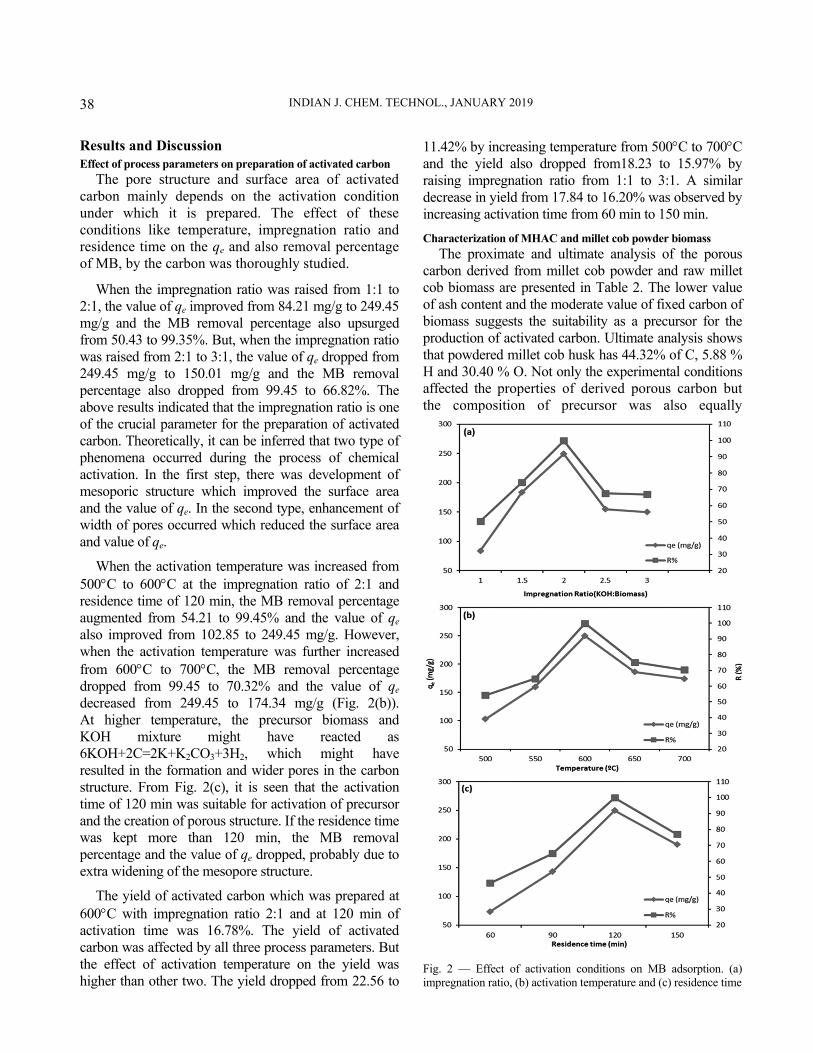
When the impregnation ratio was raised from 1:1 to 2:1, the value of qe improved from 84.21 mg/g to 249.45 mg/g and the MB removal percentage also upsurged from 50.43 to 99.35%. But, when the impregnation ratio was raised from 2:1 to 3:1, the value of qe dropped from 249.45 mg/g to 150.01 mg/g and the MB removal percentage also dropped from 99.45 to 66.82%. The above results indicated that the impregnation ratio is one of the crucial parameter for the preparation of activated carbon. Theoretically, it can be inferred that two type of phenomena occurred during the process of chemical activation. In the first step, there was development of mesoporic structure which improved the surface area and the value of qe. In the second type, enhancement of width of pores occurred which reduced the surface area and value of qe.
When the activation temperature was increased from 500C to 600C at the impregnation ratio of 2:1 and residence time of 120 min, the MB removal percentage augmented from 54.21 to 99.45% and the value of qe also improved from 102.85 to 249.45 mg/g. However, when the activation temperature was further increased from 600C to 700C, the MB removal percentage dropped from 99.45 to 70.32% and the value of qe decreased from 249.45 to 174.34 mg/g (Fig. 2(b)). At higher temperature, the precursor biomass and KOH mixture might have reacted as 6KOH+2C=2K+K2CO3+3H2, which might have resulted in the formation and wider pores in the carbon structure. From Fig. 2(c), it is seen that the activation time of 120 min was suitable for activation of precursor and the creation of porous structure. If the residence time was kept more than 120 min, the MB removal percentage and the value of qe dropped, probably due to extra widening of the mesopore structure.
The yield of activated carbon which was prepared at 600C with impregnation ratio 2:1 and at 120 min of activation time was 16.78%. The yield of activated carbon was affected by all three process parameters. But the effect of activation temperature on the yield was higher than other two. The yield dropped from 22.56 to
11.42% by increasing temperature from 500C to 700C and the yield also dropped from18.23 to 15.97% by raising impregnation ratio from 1:1 to 3:1. A similar decrease in yield from 17.84 to 16.20% was observed by increasing activation time from 60 min to 150 min.
Characterization of MHAC and millet cob powder biomass The proximate and ultimate analysis of the porous
carbon derived from millet cob powder and raw millet cob biomass are presented in Table 2. The lower value of ash content and the moderate value of fixed carbon of biomass suggests the suitability as a precursor for the production of activated carbon. Ultimate analysis shows that powdered millet cob husk has 44.32% of C, 5.88 % H and 30.40 % O. Not only the experimental conditions affected the properties of derived porous carbon but the composition of precursor was also equally
Fig. 2 — Effect of activation conditions on MB adsorption. (a)impregnation ratio, (b) activation temperature and (c) residence time
CHAROLA et al.: CARBON ADSORBENT FROM AGROWASTE -PEARL MILLET COB HUSK
39
important for the development of porous structure in the final product. The high carbon content (75.22 %) was a positive attribute of the prepared MHAC.
The FT-IR spectra of millet cob husk (raw biomass), MHAC and CAC were obtained. Both the raw biomass and MHAC displayed bands in the region of 3650-3200 cm-1 which represents stretching vibration of hydrogen bonds and water impurities. The higher intensity peak of the millet cob husk at 2926 cm-1 indicated the presence of C-H group and band at 1736 cm-1 corresponded to the stretching of ketone, aldehyde, and carboxylic acid groups in the raw biomass-present probably as hemicellulose. In addition, a large number of peaks could be detected from 1300 to 1000 cm-1 in the raw millet cob husk. These could be attributed to oxygenated compounds of alcohol, ether, ester and phenol category. 1550-1350 cm-1 in the raw biomass represented the -NO2
(stretching) and peaks from 1450-1375 cm-1 represented alkanes and C-H (bending). 900-690 cm-1 in the raw biomass indicated presence of aromatics too. A noticeable change is observed in the spectra of MHAC compared to spectra of precursor in the bands of two
regions - 1000 to 1750 cm-1 and 2800 to 3500 cm-1. In these two regions, the intensities of bands were sharply reduced which suggested that many weak bonds disappeared during activation process.The peaks at 1736 cm-1, 1425 cm-1, 1248 cm-1, 1325 cm-1 and 1043 cm-1
which represents oxygenated compounds were absent in the spectra of MHAC. The band at 1736 cm-1 which probably corresponds to C=O stretch in aldehydes was found only in precursor but not in MHAC. This may be due to thermal sensitivity of ketone and aldehyde groups at high temperature. Similarity in FT-IR spectra was observed in case of CAC, showing that MHAC formed by the present process was at par with commercial grade activated carbon.
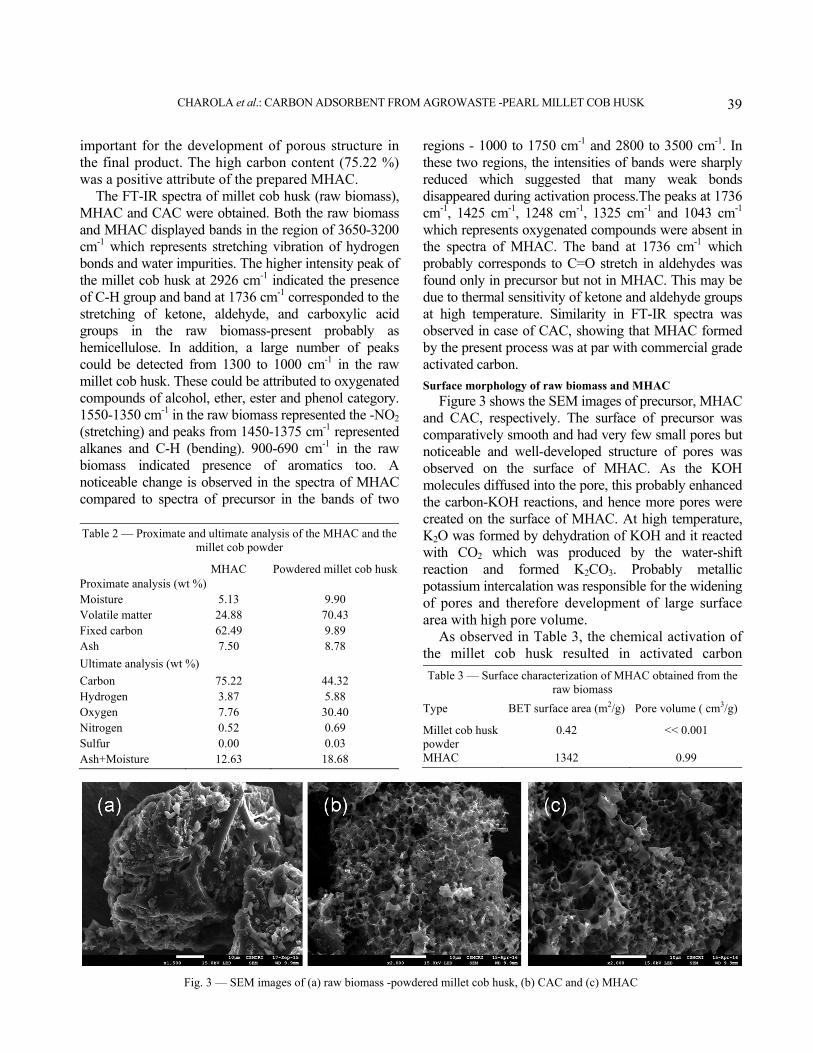
Surface morphology of raw biomass and MHAC Figure 3 shows the SEM images of precursor, MHAC
and CAC, respectively. The surface of precursor was comparatively smooth and had very few small pores but noticeable and well-developed structure of pores was observed on the surface of MHAC. As the KOH molecules diffused into the pore, this probably enhanced the carbon-KOH reactions, and hence more pores were created on the surface of MHAC. At high temperature, K2O was formed by dehydration of KOH and it reacted with CO2 which was produced by the water-shift reaction and formed K2CO3. Probably metallic potassium intercalation was responsible for the widening of pores and therefore development of large surface area with high pore volume.
As observed in Table 3, the chemical activation of the millet cob husk resulted in activated carbon
Table 2 — Proximate and ultimate analysis of the MHAC and the millet cob powder
MHAC Powdered millet cob husk Proximate analysis (wt %) Moisture 5.13 9.90 Volatile matter 24.88 70.43 Fixed carbon 62.49 9.89 Ash 7.50 8.78
Ultimate analysis (wt %)
Carbon 75.22 44.32 Hydrogen 3.87 5.88 Oxygen 7.76 30.40 Nitrogen 0.52 0.69 Sulfur 0.00 0.03 Ash+Moisture 12.63 18.68
Fig. 3 — SEM images of (a) raw biomass -powdered millet cob husk, (b) CAC and (c) MHAC
Table 3 — Surface characterization of MHAC obtained from the raw biomass
Type BET surface area (m2/g) Pore volume ( cm3/g)
Millet cob husk powder
0.42 << 0.001
MHAC 1342 0.99
INDIAN J. CHEM. TECHNOL., JANUARY 2019
40
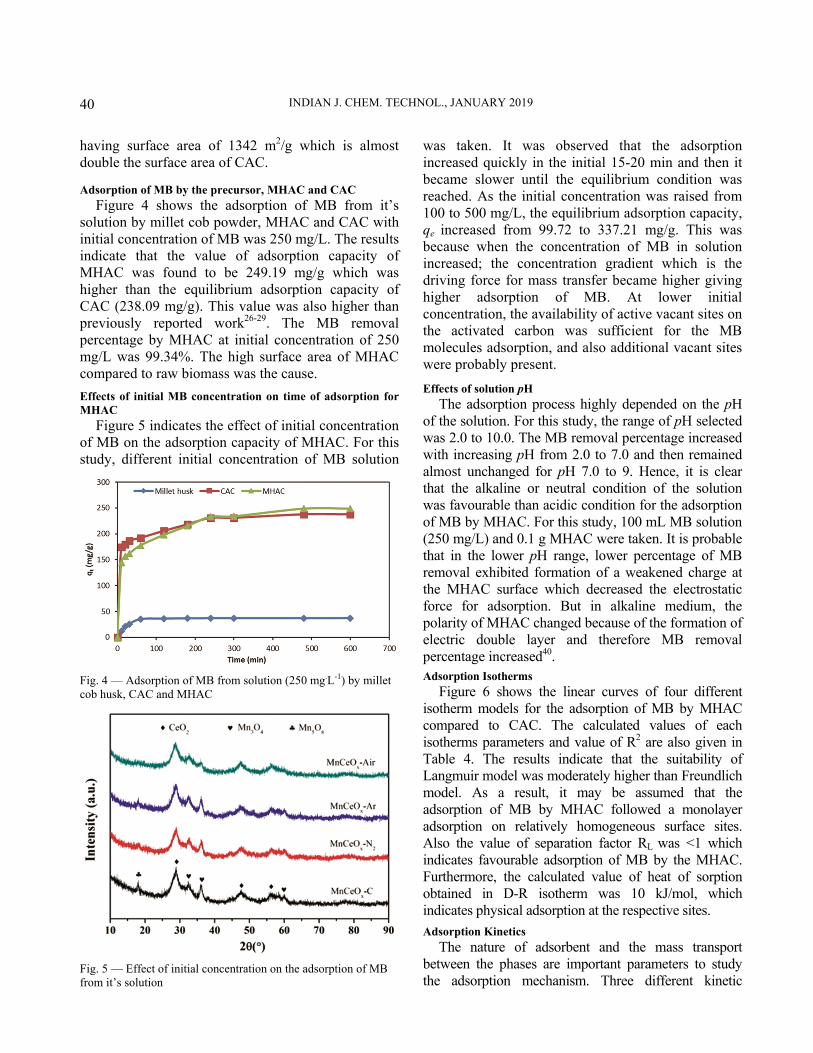
having surface area of 1342 m2/g which is almost double the surface area of CAC. Adsorption of MB by the precursor, MHAC and CAC
Figure 4 shows the adsorption of MB from it’s solution by millet cob powder, MHAC and CAC with initial concentration of MB was 250 mg/L. The results indicate that the value of adsorption capacity of MHAC was found to be 249.19 mg/g which was higher than the equilibrium adsorption capacity of CAC (238.09 mg/g). This value was also higher than previously reported work26-29. The MB removal percentage by MHAC at initial concentration of 250 mg/L was 99.34%. The high surface area of MHAC compared to raw biomass was the cause.
Effects of initial MB concentration on time of adsorption for MHAC
Figure 5 indicates the effect of initial concentration of MB on the adsorption capacity of MHAC. For this study, different initial concentration of MB solution
was taken. It was observed that the adsorption increased quickly in the initial 15-20 min and then it became slower until the equilibrium condition was reached. As the initial concentration was raised from 100 to 500 mg/L, the equilibrium adsorption capacity, qe increased from 99.72 to 337.21 mg/g. This was because when the concentration of MB in solution increased; the concentration gradient which is the driving force for mass transfer became higher giving higher adsorption of MB. At lower initial concentration, the availability of active vacant sites on the activated carbon was sufficient for the MB molecules adsorption, and also additional vacant sites were probably present.
Effects of solution pH The adsorption process highly depended on the pH
of the solution. For this study, the range of pH selected was 2.0 to 10.0. The MB removal percentage increased with increasing pH from 2.0 to 7.0 and then remained almost unchanged for pH 7.0 to 9. Hence, it is clear that the alkaline or neutral condition of the solution was favourable than acidic condition for the adsorption of MB by MHAC. For this study, 100 mL MB solution (250 mg/L) and 0.1 g MHAC were taken. It is probable that in the lower pH range, lower percentage of MB removal exhibited formation of a weakened charge at the MHAC surface which decreased the electrostatic force for adsorption. But in alkaline medium, the polarity of MHAC changed because of the formation of electric double layer and therefore MB removal percentage increased40.
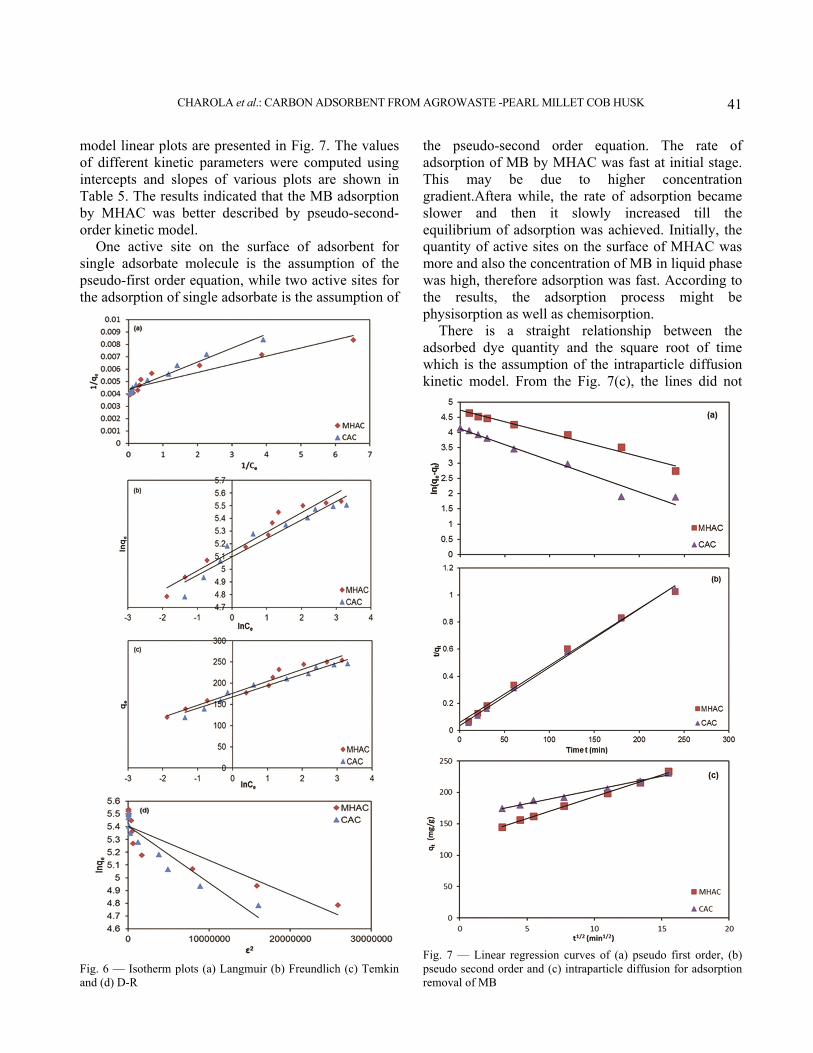
Adsorption Isotherms Figure 6 shows the linear curves of four different
isotherm models for the adsorption of MB by MHAC compared to CAC. The calculated values of each isotherms parameters and value of R2 are also given in Table 4. The results indicate that the suitability of Langmuir model was moderately higher than Freundlich model. As a result, it may be assumed that the adsorption of MB by MHAC followed a monolayer adsorption on relatively homogeneous surface sites. Also the value of separation factor RL was <1 which indicates favourable adsorption of MB by the MHAC. Furthermore, the calculated value of heat of sorption obtained in D-R isotherm was 10 kJ/mol, which indicates physical adsorption at the respective sites.
Adsorption Kinetics The nature of adsorbent and the mass transport
between the phases are important parameters to study the adsorption mechanism. Three different kinetic
Fig. 4 — Adsorption of MB from solution (250 mg.L-1) by millet cob husk, CAC and MHAC
Fig. 5 — Effect of initial concentration on the adsorption of MB from it’s solution
CHAROLA et al.: CARBON ADSORBENT FROM AGROWASTE -PEARL MILLET COB HUSK
41
model linear plots are presented in Fig. 7. The values of different kinetic parameters were computed using intercepts and slopes of various plots are shown in Table 5. The results indicated that the MB adsorption by MHAC was better described by pseudo-second-order kinetic model.
One active site on the surface of adsorbent for single adsorbate molecule is the assumption of the pseudo-first order equation, while two active sites for the adsorption of single adsorbate is the assumption of
the pseudo-second order equation. The rate of adsorption of MB by MHAC was fast at initial stage. This may be due to higher concentration gradient.Aftera while, the rate of adsorption became slower and then it slowly increased till the equilibrium of adsorption was achieved. Initially, the quantity of active sites on the surface of MHAC was more and also the concentration of MB in liquid phase was high, therefore adsorption was fast. According to the results, the adsorption process might be physisorption as well as chemisorption.
There is a straight relationship between the adsorbed dye quantity and the square root of time which is the assumption of the intraparticle diffusion kinetic model. From the Fig. 7(c), the lines did not
Fig. 6 — Isotherm plots (a) Langmuir (b) Freundlich (c) Temkinand (d) D-R
Fig. 7 — Linear regression curves of (a) pseudo first order, (b)pseudo second order and (c) intraparticle diffusion for adsorptionremoval of MB
INDIAN J. CHEM. TECHNOL., JANUARY 2019
42
meet at the origin which signifies the fact that the intraparticle diffusion was not only the rate limiting step for the adsorption process.
Thermodynamic Modeling The concept of thermodynamics assumes that the
change in entropy is the driving force in an isolated system. The behaviour of adsorption process could be determined by the change in thermodynamic properties like standard enthalpy (∆H0), standard entropy (∆S0) and standard Gibbs free energy (∆G0).
The value of ∆H0 and ∆S0could be computed using the following equation,
𝑙𝑛𝐾∆ ∆
… (13)
where, T (K) is the temperature of solution, R is the gas constant (8.314 J/mol.K) and Kc= Ci/Ce is the equilibrium constant.
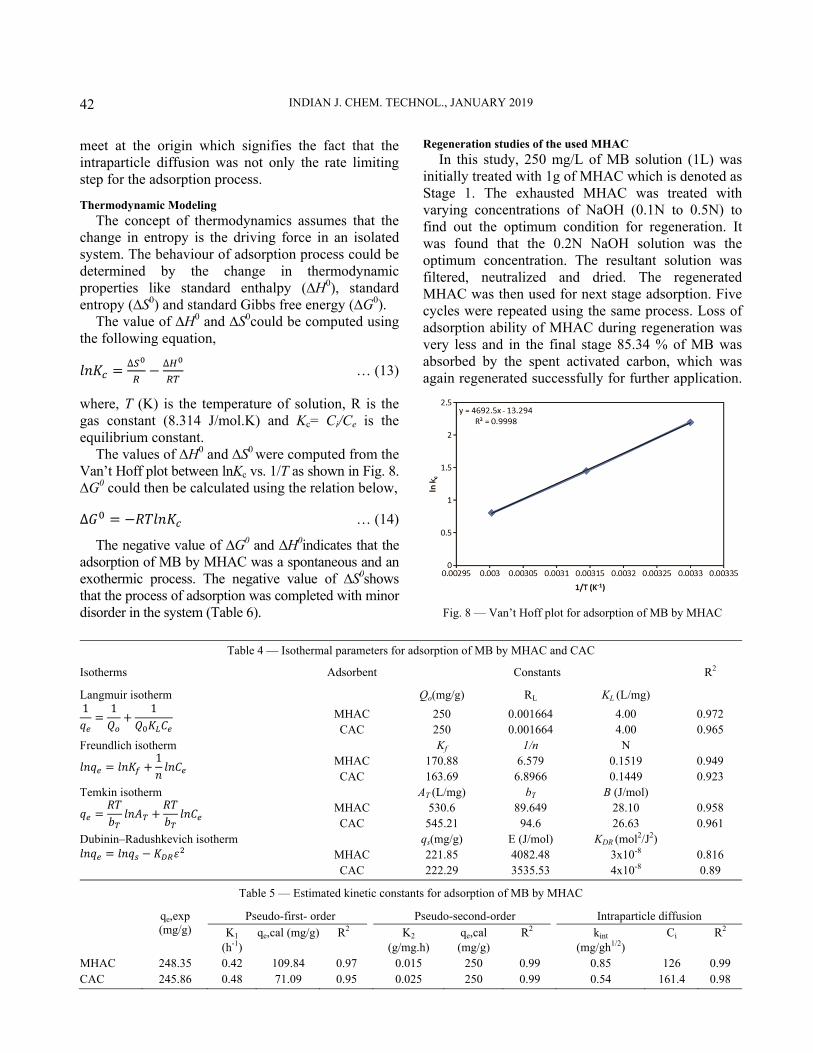
The values of ∆H0 and ∆S0 were computed from the Van’t Hoff plot between lnKc vs. 1/T as shown in Fig. 8. ∆G0 could then be calculated using the relation below,
∆𝐺 𝑅𝑇𝑙𝑛𝐾 … (14)
The negative value of ∆G0 and ∆H0indicates that the adsorption of MB by MHAC was a spontaneous and an exothermic process. The negative value of ∆S0shows that the process of adsorption was completed with minor disorder in the system (Table 6).
Regeneration studies of the used MHAC In this study, 250 mg/L of MB solution (1L) was
initially treated with 1g of MHAC which is denoted as Stage 1. The exhausted MHAC was treated with varying concentrations of NaOH (0.1N to 0.5N) to find out the optimum condition for regeneration. It was found that the 0.2N NaOH solution was the optimum concentration. The resultant solution was filtered, neutralized and dried. The regenerated MHAC was then used for next stage adsorption. Five cycles were repeated using the same process. Loss of adsorption ability of MHAC during regeneration was very less and in the final stage 85.34 % of MB was absorbed by the spent activated carbon, which was again regenerated successfully for further application.
Fig. 8 — Van’t Hoff plot for adsorption of MB by MHAC
Table 4 — Isothermal parameters for adsorption of MB by MHAC and CAC
Isotherms Adsorbent Constants R2
1𝑞
1𝑄
1𝑄 𝐾 𝐶
Langmuir isotherm Qo(mg/g) RL KL (L/mg)
MHAC 250 0.001664 4.00 0.972 CAC 250 0.001664 4.00 0.965
𝑙𝑛𝑞 𝑙𝑛𝐾1𝑛
𝑙𝑛𝐶
Freundlich isotherm Kf 1/n N MHAC 170.88 6.579 0.1519 0.949 CAC 163.69 6.8966 0.1449 0.923
𝑞𝑅𝑇𝑏
𝑙𝑛𝐴𝑅𝑇𝑏
𝑙𝑛𝐶
Temkin isotherm AT (L/mg) bT B (J/mol) MHAC 530.6 89.649 28.10 0.958 CAC 545.21 94.6 26.63 0.961
𝑙𝑛𝑞 𝑙𝑛𝑞 𝐾 𝜀 Dubinin–Radushkevich isotherm qs(mg/g) E (J/mol) KDR (mol2/J2)
MHAC 221.85 4082.48 3x10⁻⁸ 0.816 CAC 222.29 3535.53 4x10⁻⁸ 0.89
Table 5 — Estimated kinetic constants for adsorption of MB by MHAC
qe,exp (mg/g)
Pseudo-first- order Pseudo-second-order Intraparticle diffusion K1
(h-1) qe,cal (mg/g) R2 K2
(g/mg.h) qe,cal
(mg/g) R2 kint
(mg/gh1/2) Ci R2
MHAC 248.35 0.42 109.84 0.97 0.015 250 0.99 0.85 126 0.99 CAC 245.86 0.48 71.09 0.95 0.025 250 0.99 0.54 161.4 0.98

CHAROLA et al.: CARBON ADSORBENT FROM AGROWASTE -PEARL MILLET COB HUSK
43
Table 7 gives the adsorption and recovered % of MB by MHAC.
Conclusion This study affirms that the prepared MHAC from
locally, freely and amply available agricultural waste of millet cob husk biomass can be an appropriate option of non-renewable source based activated carbon for the adsorption of MB dye from its aqueous solutions. The MHAC was prepared in a single step from the biomass at a temperature of 600C, impregnation ratio of 2:1 and consolidated time of 120 min. The BET surface area of MHAC was 1342 m2/g and the FT-IR spectra and SEM images were similar to CAC. Neutral or alkaline pH was favourable for adsorption of MB onto MHAC. Langmuir and Temkin models fitted better with the equilibrium data and the adsorption kinetics data was well described by the pseudo-second-order kinetic model. Thermodynamic properties suggested that the adsorption phenomenon was spontaneous, exothermic and decreased the disorder degree of the process. Regeneration of the carbon was carried out for five cycles. 85.34 % MB could be absorbed by the spent carbon, after fifth cycle.
References 1 Easton J R, Waters B D, Churchley J H & Harrison J, Colour
in Dyehouse Effluent, Society of Dyers and Colorists (The Alden Press, Oxford), 1995, 9.
2 Correia V M, Stephenson T & Judd S J, Environ Technol, 15 (1994) 917.
3 Liang C Z, Sun S P, Li F Y, Ong Y K & Chung T S, J Membr Sci, 469 (2014) 306.
4 Bakheet B, Yuan S, Li Z, Wang H, Zuo, J, Komarneni S & Wang Y, Water Res, 47 (2013) 6234.
5 Del Rio A I, Fernandez J, Molina J, Bonastre J & Cases F, Desalination, 273 (2011) 428.
6 Kumar P, Agnihotri R & Mondal M K, J Environ Chem Eng, 1 (2013) 440.
7 Liu C, Hsieh Y, Lai P, Li C & Kao C, Dyes Pigm, 68 (2006) 191.
8 Tichonovas M, Krugly E, Racys V, Hippler R, Kauneliene V, Stasiulaitiene I & Martuzevicius D, Chem Eng J, 229 (2013) 9.
9 Turgay O, Ersoz G, Atalay S, Forss J &Welander U, Sep Purif Technol, 79 (2011) 26.
10 Kaouah F, Boumaza T, Trari M & Bendjama Z, J Clean Prod, 54 (2013) 296.
11 Emami Z & Azizian S, J Anal Appl Pyrolysis, 108 (2014) 176. 12 Omri A, Benzina M & Ammar N, J Ind Eng Chem, 19 (2013)
2092. 13 Gonzalez P G, Hernandez-Quiroz T & Garcia-Gonzalez L,
Fuel Process Technol, 127 (2014) 133. 14 Liu Q Y, Ai H, Meng M W, Wei Y L, Liu M D & Deng X M,
Environ Protec Chem Ind, 32 (2012) 561. 15 Tongpoothorn W, Sriuttha M, Homchan P, Chanthai S &
Ruangviriyachai C, Chem Eng Res Des, 89 (2011) 335. 16 Zhong Z Y, Yang Q, Li X M, Luo K, Liu Y & Zeng G M, Ind
Crops Prod, 37 (2012) 178. 17 Foo K, Y & Hameed B H, Bioresour Technol, 116 (2012) 522. 18 Gao Q, Liu H, Cheng C, Li K, Zhang J, Zhang C & Li Y,
Powder Technol, 249 (2013) 234. 19 Karagoz S, Tay T, Ucar S & Erdem M, Bioresour Technol,99
(2008) 6214. 20 Ouid-Idriss A, Stitou A, Cuerda-correa A & Macias-Garda A,
Fuel Process Technol, 92 (2011) 261. 21 Singh K & Chandra B, Indian J Chem Technol, 22 (2015) 11. 22 El-Shafey E I, Syeda N F A, Saleh A &Haider A J A, J
Environ Chem Eng, 4 (2016) 2713. 23 Shukla A, Lalit A, Sharma V, Vats S & Alam A, J App
Research, 2015, 1 (2015) 59. 24 Hiloidhari M, Das D & Baruah D C, Renew Sust Energ Rev,
32 (2014) 504. 25 Tamilselvi S, Asaithambi M & Sivakumar V, Indian J Chem
Technol, 23 (2016) 497. 26 Jansi Rani M, Murugan M, Subramanian P & Subramanian E,
Indian J Chem Technol, 23 (2016) 22. 27 Cigdem S O, Physicochem Probl Mi Process, 48 (2012) 441. 28 Gao J J, Qin Y B, Zhou T, Cao D D, Xin P, Hochsetter D &
Wang Y F, J Zhejiang Univ Sci B, 14 (2013) 650. 29 Ismail M N, Aziz H A, Ahmad M A &Kamaruddin M A, Inter
J Sci Res Knowled, 1 (2013) 388. 30 Thitame P V & Shukla S R, Chem Eng Commun, 203 (2016)
791. 31 Amin N K, Desalination, 223 (2008) 152. 32 Namasivayam C & Kavitha D, Dyes pigm, 54 (2002) 47. 33 Langmuir I, J Am Chem Soc, 40 (1918) 1361. 34 Freundlich H, J Phys Chem, 57 (1906) 387. 35 Temkin M J & Pyzhev V, Acta Physiochim, USSR 12 (1940)
217. 36 Dubinin M M, Zhurnal FizicheskoiKhimii, 39 (1965) 1305. 37 Langergren S & Svenska B K, VeternskapsakadHandl, 24
(1898) 1. 38 Ho Y S & McKay G, Can J Chem Eng,76 (1998) 822. 39 Jr. Weber W J & Morris J C, J Sanit Eng Div, ASCE 18 (1963)
31. 40 Hameed B H & El-khaiary M L, J Hazard Mater,157 (2008)
344.
Table 6 — Thermodynamic parameters for adsorption of MB by MHAC
T(K) ∆G0 (kJ/mol) ∆H0 (kJ/mol) ∆S0 (J/mol.K)
303 -5539.06
-39.009 -110.493 318 -3834.6 333 -2226.37
Table 7 — Adsorption and desorption cycles of MB by MHAC
Sample Stage MB adsorption (%) MB (%) recovered
1 99.13 96.25 2 95.43 92.82 3 90.86 88.21 4 87.09 84.35 5 85.34 81.76
Related Documents