Dutch dairy in figures 2015

Welcome message from author
This document is posted to help you gain knowledge. Please leave a comment to let me know what you think about it! Share it to your friends and learn new things together.
Transcript
Dutch dairy in figures
2015
2 Dutch dairy in figures 2015 Dutch dairy in figures 2015 3
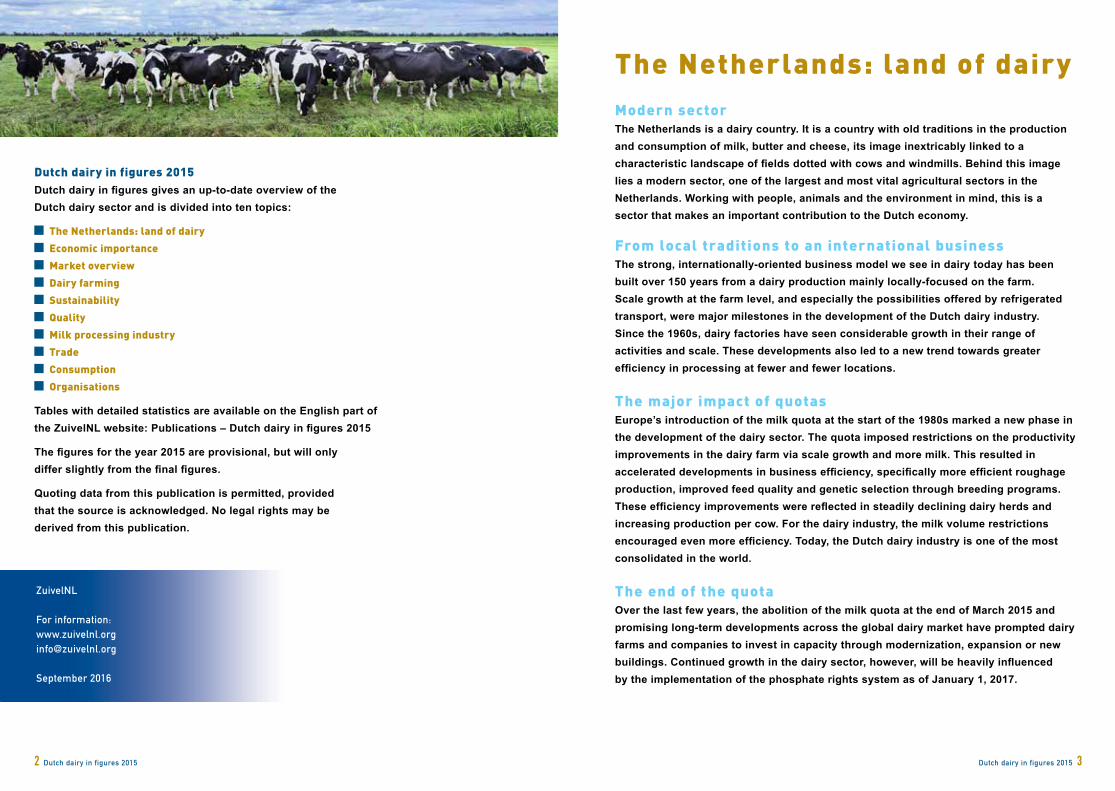
The Netherlands: land of dairyModern sectorThe Netherlands is a dairy country. It is a country with old traditions in the production and consumption of milk, butter and cheese, its image inextricably linked to a characteristic landscape of fields dotted with cows and windmills. Behind this image lies a modern sector, one of the largest and most vital agricultural sectors in the Netherlands. Working with people, animals and the environment in mind, this is a sector that makes an important contribution to the Dutch economy.
From local traditions to an international businessThe strong, internationally-oriented business model we see in dairy today has been built over 150 years from a dairy production mainly locally-focused on the farm. Scale growth at the farm level, and especially the possibilities offered by refrigerated transport, were major milestones in the development of the Dutch dairy industry. Since the 1960s, dairy factories have seen considerable growth in their range of activities and scale. These developments also led to a new trend towards greater efficiency in processing at fewer and fewer locations.
The major impact of quotasEurope’s introduction of the milk quota at the start of the 1980s marked a new phase in the development of the dairy sector. The quota imposed restrictions on the productivity improvements in the dairy farm via scale growth and more milk. This resulted in accelerated developments in business efficiency, specifically more efficient roughage production, improved feed quality and genetic selection through breeding programs. These efficiency improvements were reflected in steadily declining dairy herds and increasing production per cow. For the dairy industry, the milk volume restrictions encouraged even more efficiency. Today, the Dutch dairy industry is one of the most consolidated in the world.
The end of the quotaOver the last few years, the abolition of the milk quota at the end of March 2015 and promising long-term developments across the global dairy market have prompted dairy farms and companies to invest in capacity through modernization, expansion or new buildings. Continued growth in the dairy sector, however, will be heavily influenced by the implementation of the phosphate rights system as of January 1, 2017.
Dutch dairy in figures 2015Dutch dairy in figures gives an up-to-date overview of the Dutch dairy sector and is divided into ten topics:
The Netherlands: land of dairy Economic importance Market overview Dairy farming Sustainability Quality Milk processing industry Trade Consumption Organisations
Tables with detailed statistics are available on the English part of the ZuivelNL website: Publications – Dutch dairy in figures 2015 The figures for the year 2015 are provisional, but will only differ slightly from the final figures. Quoting data from this publication is permitted, provided that the source is acknowledged. No legal rights may be derived from this publication.
ZuivelNL For information:[email protected] September 2016

Drinking milk and other fresh milk products 7%
Cheese 55%
Butter and butter oil 2%
Milk powder 13%
Condensed milk 7%
Other 16%
Contribution to trade surplus: 8%
1.6 million dairy cows
0.3 million dairy goats
18 thousand dairy farms
1.2 million hectares of grassland and maize
45 thousand fte's in dairy farming and
milk processing industry
Milk processing
Export revenues € 6.3 billion
Milk, cheese and yoghurt in the Wheel of Five
(Dutch dietary guidelines)
25 companies and 54 dairy plants
Production value
almost 30% of the surface area of the Netherlands
€ 6.5 billion milk processing industry€ 4.5 billion dairy farming
Outdoor grazing at almost 80% of the dairy farms
Cow milk production 13.5 billion kg
Goat milk production 0.3 billion kg
45% intra EU
Export of dairy products
35% remains in the Netherlands
20% world market
4 Dutch dairy in figures 2015 Dutch dairy in figures 2015 5
source: ZuivelNL, RVO.nl, Statistics Netherlands (CBS), Sustainable Dairy Chain, The Netherlands Nutrition Centre
Dutch dairy at a glance

Total € 378.0 billion
Total € 425.6 billion
IMPORTS EXPORTS
Dairy products € 2.6 billion
Agricultural products € 54.6 billion
Agricultural products € 79.4 billion
Dairy products € 6.3 billion
Dutch economy € 596.7 billion
Dairy € 7.1 billion (1,2%)
Agro & Food € 48.2 billion (8,1%)
Other Agro & Food € 41.0 billion (6,9%)
Dutch dairy in figures 2015 7
6 Dutch dairy in figures 2015
The Netherlands 315
EU12,470
bron: ZuivelNL
0 1,000
EU other 49.3
France 29.2
IrelandThe Netherlands
DenmarkBelgium
FranceGermany
ItalySpain
PolandUnited Kingdom
821 731 571 478 478 375 317 201198197
Germany 28.2
Italy 19.2
United Kingdom 10.2
The Netherlands 9.8
EU-28311
The Netherlands 13.8
EU 368.3
Economic importance
Contribution of Agro & Food to the Dutch economy 2014
Key figures Dutch milk processing industry - EU 2014
Number of production locations
Number of employees
Dairy sales per capita
Production value
Trade balance 2015
Including producers of ice-cream, on-farm proceessors and such
€
billion €
x 1,000
source: Eurostat, Statistics Netherlands (CBS)
source: Institute for Agricultural Economics (LEI)
source: Statistics Netherlands (CBS)
Positive trade balanceTotal € 47.5 billionAgricultural products € 24.9 billion
Dairy products € 3.7 billion
0
50
100
150
200
250
0
30
60
90
120
150
jan-1
0
jul-1
0
jan-1
1
jul-1
1
jan-1
2
jul-1
2
jan-1
3
jul-1
3
jan-1
4
jul-1
4
jan-1
5
jul-1
5
jan-1
6mr
t-16
2010 2011 2012 2013 2014 2015
Dutch dairy in figures 2015 9
8 Dutch dairy in figures 2015
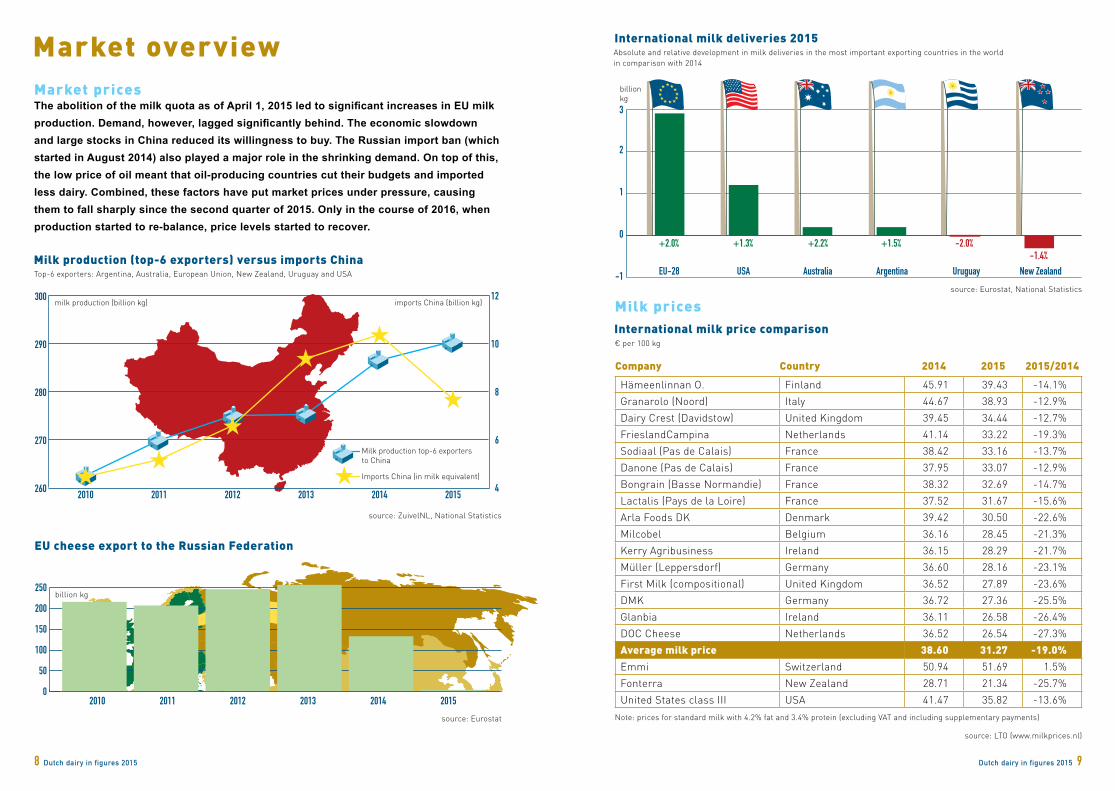
Market overviewMarket pricesThe abolition of the milk quota as of April 1, 2015 led to significant increases in EU milk production. Demand, however, lagged significantly behind. The economic slowdown and large stocks in China reduced its willingness to buy. The Russian import ban (which started in August 2014) also played a major role in the shrinking demand. On top of this, the low price of oil meant that oil-producing countries cut their budgets and imported less dairy. Combined, these factors have put market prices under pressure, causing them to fall sharply since the second quarter of 2015. Only in the course of 2016, when production started to re-balance, price levels started to recover.
2010 2011 2012 2013 2014 2015
1000
200
300
400
500jan
-05
jul-0
5
jan-0
6
jul-0
6
jan-0
7
jul-0
7
jan-0
8
jul-0
8
jan-0
9
jul-0
9
jan-1
0
jul-1
0
jan-1
1
jul-1
1
jan-1
2
jul-1
2
jan-1
3
jul-1
3
jan-1
4
jul-1
4
jan-1
5
jul-1
5
jan-1
6
boter mager melkpoederboter: max € 437,00
boter: min € 205,00
mager melkpoeder: max € 383,00
mager melkpoeder: min € 150,00
260
270
280
290
300
4
6
8
10
12
Milk production top-6 exporters to China
Imports China (in milk equivalent)
milk production (billion kg) imports China (billion kg)
EU cheese export to the Russian Federation
source: ZuivelNL, National Statistics
source: Eurostat
Milk production (top-6 exporters) versus imports ChinaTop-6 exporters: Argentina, Australia, European Union, New Zealand, Uruguay and USA
billion kg
International milk deliveries 2015
source: Eurostat, National Statistics
Absolute and relative development in milk deliveries in the most important exporting countries in the world in comparison with 2014
-1
0
1
2
3
+2.0% +1.3% +2.2% +1.5% -2.0%-1.4%
billion kg
The Netherlands European UnionDrinking milk and other fresh milk products 7%
Cheese 55%
Butter and butteroil 2%
Milk powder 13%
Condensed milk 7%
Other 16%
Drinking milk and other fresh milk products 31%
Cheese 39%Butter and butteroil 1%
EU-28 USA Australia Argentina Uruguay New Zealand
Milk powder 16%
Condensed milk 2%
Other 11%
Milk pricesInternational milk price comparison€ per 100 kg
Company Country 2014 2015 2015/2014Hämeenlinnan O. Finland 45.91 39.43 -14.1%Granarolo (Noord) Italy 44.67 38.93 -12.9%Dairy Crest (Davidstow) United Kingdom 39.45 34.44 -12.7%FrieslandCampina Netherlands 41.14 33.22 -19.3%Sodiaal (Pas de Calais) France 38.42 33.16 -13.7%Danone (Pas de Calais) France 37.95 33.07 -12.9%Bongrain (Basse Normandie) France 38.32 32.69 -14.7%Lactalis (Pays de la Loire) France 37.52 31.67 -15.6%Arla Foods DK Denmark 39.42 30.50 -22.6%Milcobel Belgium 36.16 28.45 -21.3%Kerry Agribusiness Ireland 36.15 28.29 -21.7%Müller (Leppersdorf) Germany 36.60 28.16 -23.1%First Milk (compositional) United Kingdom 36.52 27.89 -23.6%DMK Germany 36.72 27.36 -25.5%Glanbia Ireland 36.11 26.58 -26.4%DOC Cheese Netherlands 36.52 26.54 -27.3%Average milk price 38.60 31.27 -19.0%Emmi Switzerland 50.94 51.69 1.5%Fonterra New Zealand 28.71 21.34 -25.7%United States class III USA 41.47 35.82 -13.6%
Note: prices for standard milk with 4.2% fat and 3.4% protein (excluding VAT and including supplementary payments)
source: LTO (www.milkprices.nl)
Dutch dairy in figures 2015 11
10 Dutch dairy in figures 2015
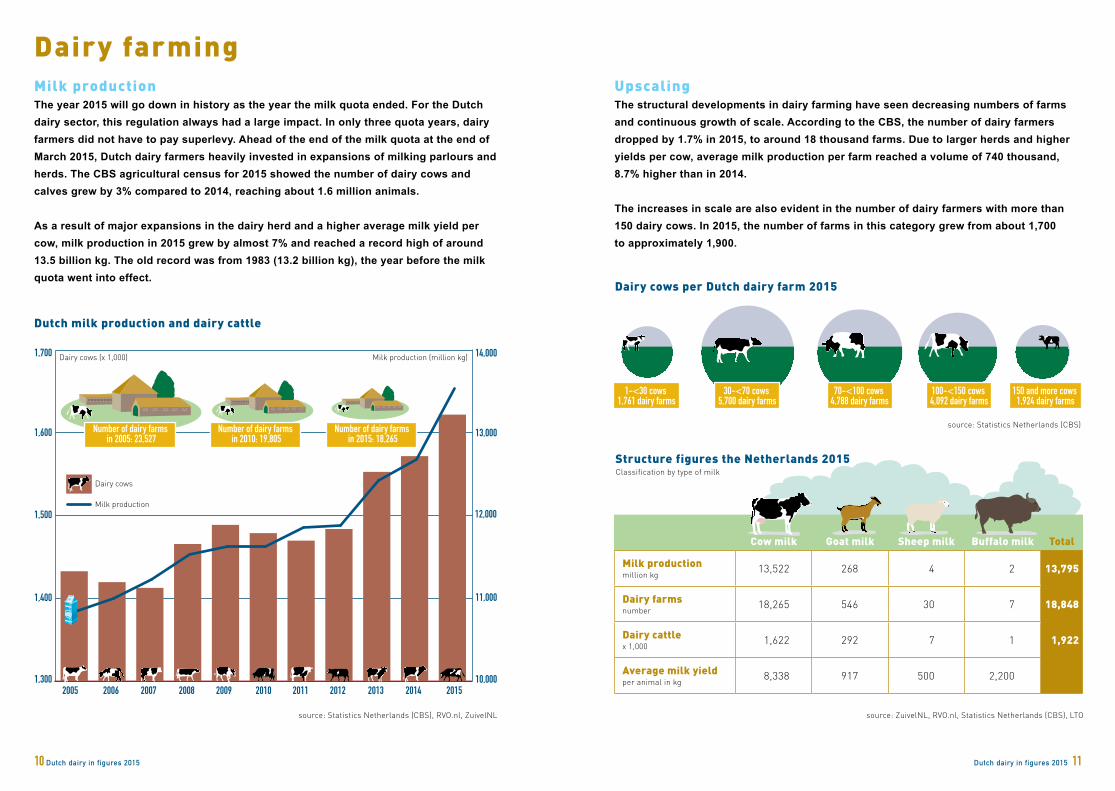
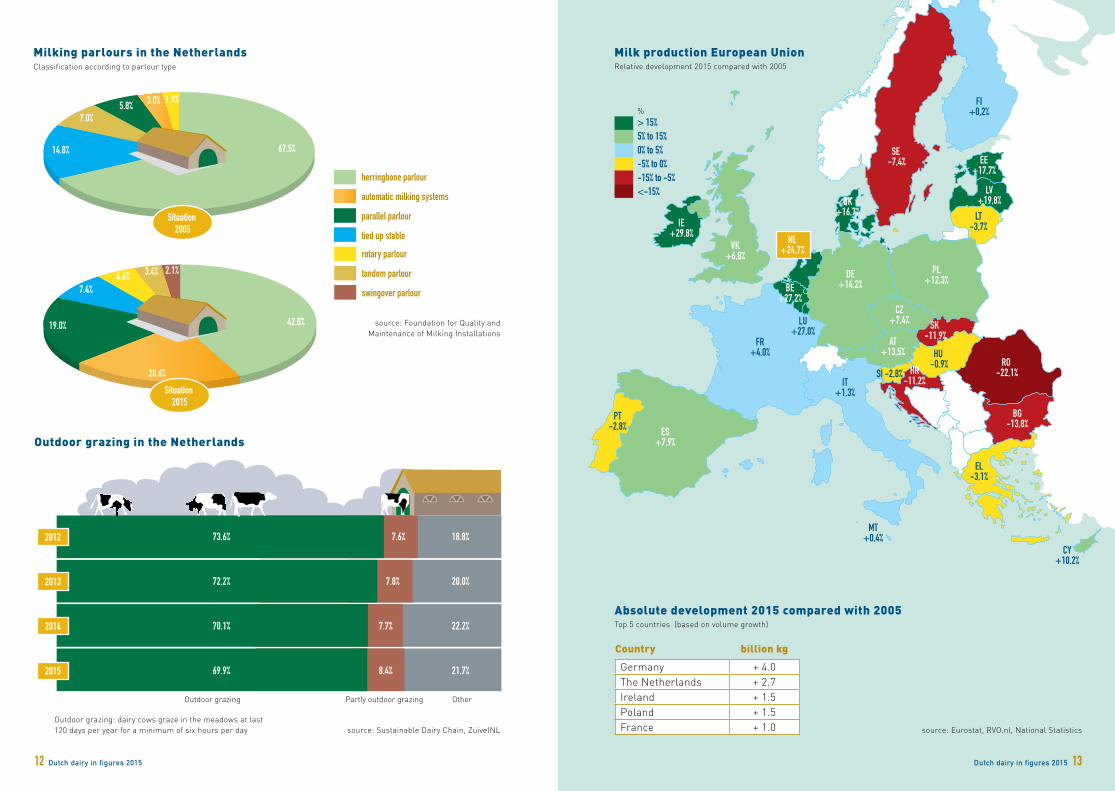
Dairy farmingMilk productionThe year 2015 will go down in history as the year the milk quota ended. For the Dutch dairy sector, this regulation always had a large impact. In only three quota years, dairy farmers did not have to pay superlevy. Ahead of the end of the milk quota at the end of March 2015, Dutch dairy farmers heavily invested in expansions of milking parlours and herds. The CBS agricultural census for 2015 showed the number of dairy cows and calves grew by 3% compared to 2014, reaching about 1.6 million animals.
As a result of major expansions in the dairy herd and a higher average milk yield per cow, milk production in 2015 grew by almost 7% and reached a record high of around 13.5 billion kg. The old record was from 1983 (13.2 billion kg), the year before the milk quota went into effect.
Dutch milk production and dairy cattle
1,300
1,400
1,500
1,600
1,700
10,000
11,000
12,000
13,000
14,000
2005 2006 2007 2008 2009 2011 2012 2013 20142010 2015
Milk production
Dairy cows
Dairy cows (x 1,000) Milk production (million kg)
Number of dairy farms in 2005: 23,527
Number of dairy farms in 2010: 19,805
Number of dairy farms in 2015: 18,265
1-<30 cows 1,761 dairy farms
67,5%
3,0%
14,8%
5,8%7,0%
1,9%
visgraat melkstal
zij-aan-zij melkstal
automatische melksystemen
grupstal
tandemmelkstal
draaimelkstal
swingover melkstal
situatie2005
situatie2015
42,8%19,0%
20,6%
7,4%4,6% 3,4% 2,1%
30-<70 cows 5,700 dairy farms
70-<100 cows 4,788 dairy farms
100-<150 cows 4,092 dairy farms
150 and more cows 1,924 dairy farms
source: Statistics Netherlands (CBS)
source: Statistics Netherlands (CBS), RVO.nl, ZuivelNL
Dairy cows per Dutch dairy farm 2015
Structure figures the Netherlands 2015
Cow milk Goat milk Sheep milk Buffalo milk Total
Milk productionmillion kg 13,522 268 4 2 13,795
Dairy farmsnumber 18,265 546 30 7 18,848
Dairy cattlex 1,000 1,622 292 7 1 1,922
Average milk yieldper animal in kg 8,338 917 500 2,200
Classification by type of milk
source: ZuivelNL, RVO.nl, Statistics Netherlands (CBS), LTO
UpscalingThe structural developments in dairy farming have seen decreasing numbers of farms and continuous growth of scale. According to the CBS, the number of dairy farmers dropped by 1.7% in 2015, to around 18 thousand farms. Due to larger herds and higher yields per cow, average milk production per farm reached a volume of 740 thousand, 8.7% higher than in 2014.
The increases in scale are also evident in the number of dairy farmers with more than 150 dairy cows. In 2015, the number of farms in this category grew from about 1,700 to approximately 1,900.
1-<30 koeien1.761 bedrijven
30-<70 koeien5.699 bedrijven
70-<100 koeien4.788 bedrijven
100-<150 koeien4.092 bedrijven
150 en meer koeien1.924 bedrijven
2015 69.9% 21.7%8.4%
2014 70.1% 22.2%7.7%
2013 72.2% 20.0%7.8%
2012 73.6% 18.8%7.6%
Outdoor grazing Partly outdoor grazing Other
%
SE -7,4%
FI+0,2%
EE+17,7%
LT-3,7%
PL+12,3%
> 15%5% to 15%0% to 5%-5% to 0%-15% to -5%<-15%
CZ+7,4% SK
-11,9%
HU -0,9%
AT+13,5%
LU+27,0%
DE+14,2%
DK+16,7%
VK+6,8%
BE+27,2%
FR+4,0%
ES+7,9%
IT+1,3%
PT-2,8%
IE+29,8%
RO -22,1%
EL-3,1%
CY+10,2%
MT+0,4%
BG-13,8%
LV+19,8%
HR-11,2%
SI -2,8%
NL+24,7%
Milk production European Union
Absolute development 2015 compared with 2005
Relative development 2015 compared with 2005
Top 5 countries (based on volume growth)
source: Eurostat, RVO.nl, National Statistics
12 Dutch dairy in figures 2015 Dutch dairy in figures 2015 13
1-<30 koeien1.761 bedrijven
67.5%
3.0%
14.8%
5.8%7.0%
1.9%
herringbone parlour
automatic milking systems
parallel parlour
tied up stable
rotary parlour
tandem parlour
swingover parlour
Situation 2005
Situation 2015
42.8%19.0%
20.6%
7.4%4.6% 3.4% 2.1%
30-<70 koeien5.699 bedrijven
70-<100 koeien4.788 bedrijven
100-<150 koeien4.092 bedrijven
150 en meer koeien1.924 bedrijven
source: Foundation for Quality and Maintenance of Milking Installations
source: Sustainable Dairy Chain, ZuivelNL
Milking parlours in the Netherlands
Outdoor grazing in the Netherlands
Classification according to parlour type
Outdoor grazing: dairy cows graze in the meadows at last 120 days per year for a minimum of six hours per day
Country billion kgGermany + 4.0The Netherlands + 2.7Ireland + 1.5Poland + 1.5France + 1.0
14 Dutch dairy in figures 2015 Dutch dairy in figures 2015 15
Sustainability QualitySustainable Dairy ChainThrough the Sustainable Dairy Chain, dairy companies (NZO) and dairy farmers (LTO), within the financial framework of ZuivelNL, work together towards a dairy sector that is future-proof and responsible. Both partners have formulated goals for 2020: development towards climate neutrality, continuous improvements in livestock health and welfare, preservation of grazing, and protecting biodiversity and the environment.
Each dairy company has its own sustainability program to help realize these goals. In these sustainability programs, new knowledge is made available, dairy farmers can compare their own performance against their peers, and can receive financial support to address certain performance issues. If necessary, mandatory measures can be taken.
Quality infrastructureDutch dairy companies deliver quality dairy products 365 days a year. These companies are part of a unique quality infrastructure that spans the entire dairy chain to prevent incidents. At all stages of this chain, companies work closely together to enforce and, where possible, improve quality. Independent experts monitor every step. From 'grass to glass', every drop of milk is guaranteed for its quality and safety.
Raw materials and products are traceable across the entire chain so that when problems arise, they can be tackled quickly and effectively. Every dairy company in the Netherlands has its own quality assurance system that establishes how products and processes are handled.
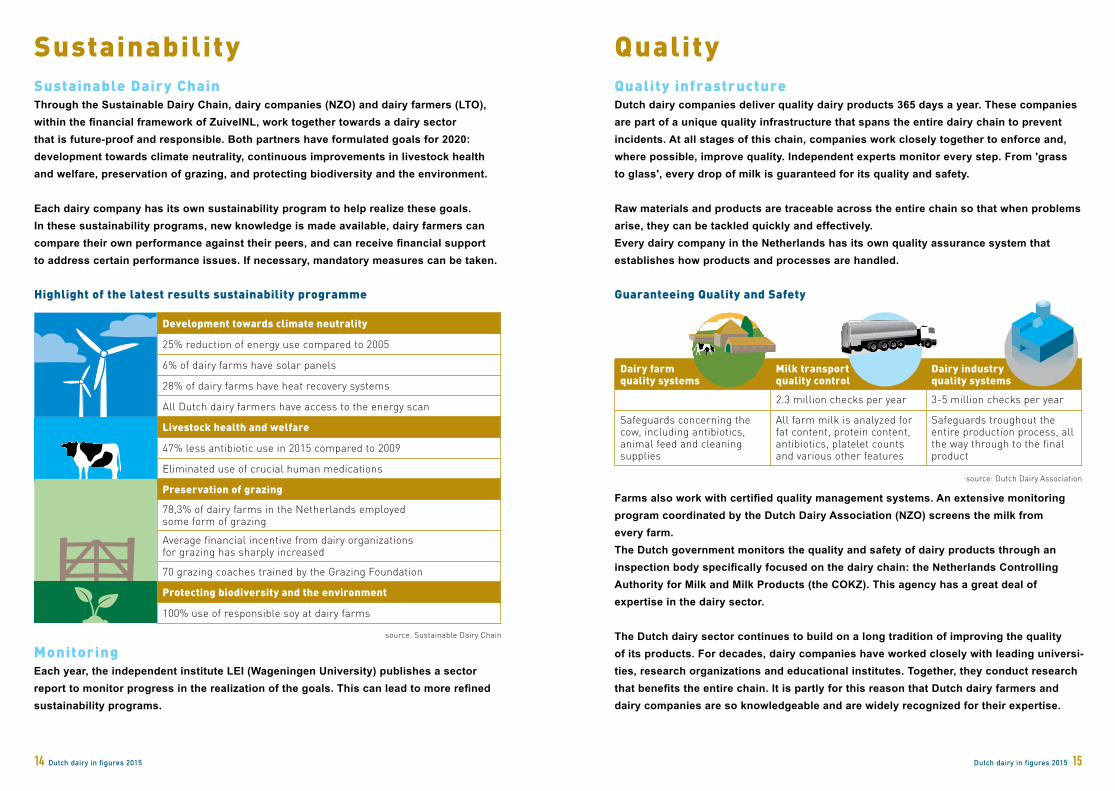
Development towards climate neutrality
25% reduction of energy use compared to 2005
6% of dairy farms have solar panels
28% of dairy farms have heat recovery systems
All Dutch dairy farmers have access to the energy scan
Livestock health and welfare
47% less antibiotic use in 2015 compared to 2009
Eliminated use of crucial human medications
Preservation of grazing
78,3% of dairy farms in the Netherlands employed some form of grazing
Average financial incentive from dairy organizations for grazing has sharply increased
70 grazing coaches trained by the Grazing Foundation
Protecting biodiversity and the environment
100% use of responsible soy at dairy farms
Dairy farm quality systems
Milk transport quality control
Dairy industry quality systems
2.3 million checks per year 3-5 million checks per year
Safeguards concerning the cow, including antibiotics, animal feed and cleaning supplies
All farm milk is analyzed for fat content, protein content, antibiotics, platelet counts and various other features
Safeguards troughout the entire production process, all the way through to the final product
Highlight of the latest results sustainability programme Guaranteeing Quality and Safety
MonitoringEach year, the independent institute LEI (Wageningen University) publishes a sector report to monitor progress in the realization of the goals. This can lead to more refined sustainability programs.
Farms also work with certified quality management systems. An extensive monitoring program coordinated by the Dutch Dairy Association (NZO) screens the milk from every farm.The Dutch government monitors the quality and safety of dairy products through an inspection body specifically focused on the dairy chain: the Netherlands Controlling Authority for Milk and Milk Products (the COKZ). This agency has a great deal of expertise in the dairy sector.
The Dutch dairy sector continues to build on a long tradition of improving the quality of its products. For decades, dairy companies have worked closely with leading universi-ties, research organizations and educational institutes. Together, they conduct research that benefits the entire chain. It is partly for this reason that Dutch dairy farmers and dairy companies are so knowledgeable and are widely recognized for their expertise.
source: Sustainable Dairy Chain
source: Dutch Dairy Association
Dutch dairy in figures 2015 17
16 Dutch dairy in figures 2015
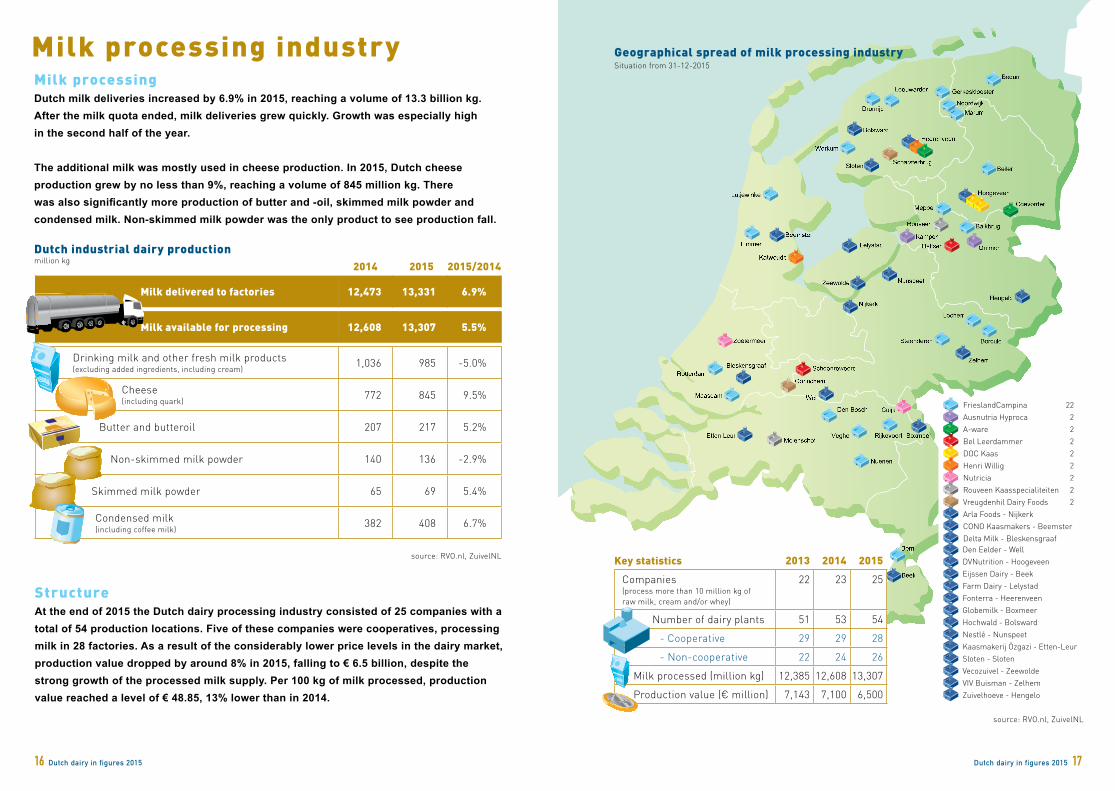
Milk processing industryMilk processingDutch milk deliveries increased by 6.9% in 2015, reaching a volume of 13.3 billion kg. After the milk quota ended, milk deliveries grew quickly. Growth was especially high in the second half of the year.
The additional milk was mostly used in cheese production. In 2015, Dutch cheese production grew by no less than 9%, reaching a volume of 845 million kg. There was also significantly more production of butter and -oil, skimmed milk powder and condensed milk. Non-skimmed milk powder was the only product to see production fall.
Dutch industrial dairy production2014 2015 2015/2014
Milk delivered to factories 12,473 13,331 6.9%
Milk available for processing 12,608 13,307 5.5%
Drinking milk and other fresh milk products(excluding added ingredients, including cream) 1,036 985 -5.0%
Cheese (including quark) 772 845 9.5%
Butter and butteroil 207 217 5.2%
Non-skimmed milk powder 140 136 -2.9%
Skimmed milk powder 65 69 5.4%
Condensed milk(including coffee milk) 382 408 6.7%
million kg
StructureAt the end of 2015 the Dutch dairy processing industry consisted of 25 companies with a total of 54 production locations. Five of these companies were cooperatives, processing milk in 28 factories. As a result of the considerably lower price levels in the dairy market, production value dropped by around 8% in 2015, falling to € 6.5 billion, despite the strong growth of the processed milk supply. Per 100 kg of milk processed, production value reached a level of € 48.85, 13% lower than in 2014.
Meppel
Rouveen
Limmen
Gerkesklooster
Bolsward
Nunspeet
Gorinchem
Workum
Ommen
Hengelo
Zelhem
Katwoude
Dalfsen
Schoonrewoerd
Zoetermeer
Cuijk
Rijkevoort
Bedum
Lutjewinkel
Bleskensgraaf
Maasdam
Rotterdam
Nuenen
Den Bosch
MolenschotVeghel
Born
MarumNoordwijk
Leeuwarden
Beilen
BalkbrugKampen
Borculo
Lochem
Nijkerk
Steenderen
Hoogeveen
Coevorden
Lelystad
Zeewolde
Boxmeer Etten-Leur
Sloten
Heerenveen
Well
Beek
Beemster
Scharsterbrug
Dronrijp
FrieslandCampina 22Ausnutria Hyproca 2A-ware 2Bel Leerdammer 2DOC Kaas 2Henri Willig 2Nutricia 2Rouveen Kaasspecialiteiten 2Vreugdenhil Dairy Foods 2Arla Foods - Nijkerk CONO Kaasmakers - Beemster Delta Milk - Bleskensgraaf Den Eelder - WellDVNutrition - HoogeveenEijssen Dairy - BeekFarm Dairy - LelystadFonterra - HeerenveenGlobemilk - BoxmeerHochwald - BolswardNestlé - NunspeetKaasmakerij Özgazi - Etten-LeurSloten - SlotenVecozuivel - ZeewoldeVIV Buisman - ZelhemZuivelhoeve - Hengelo
Geographical spread of milk processing industry
source: RVO.nl, ZuivelNL
2013 2014 2015Companies(process more than 10 million kg of raw milk, cream and/or whey)
22 23 25
Number of dairy plants 51 53 54
- Cooperative 29 29 28
- Non-cooperative 22 24 26
Milk processed (million kg) 12,385 12,608 13,307
Production value (€ million) 7,143 7,100 6,500
Key statistics
Situation from 31-12-2015
source: RVO.nl, ZuivelNL
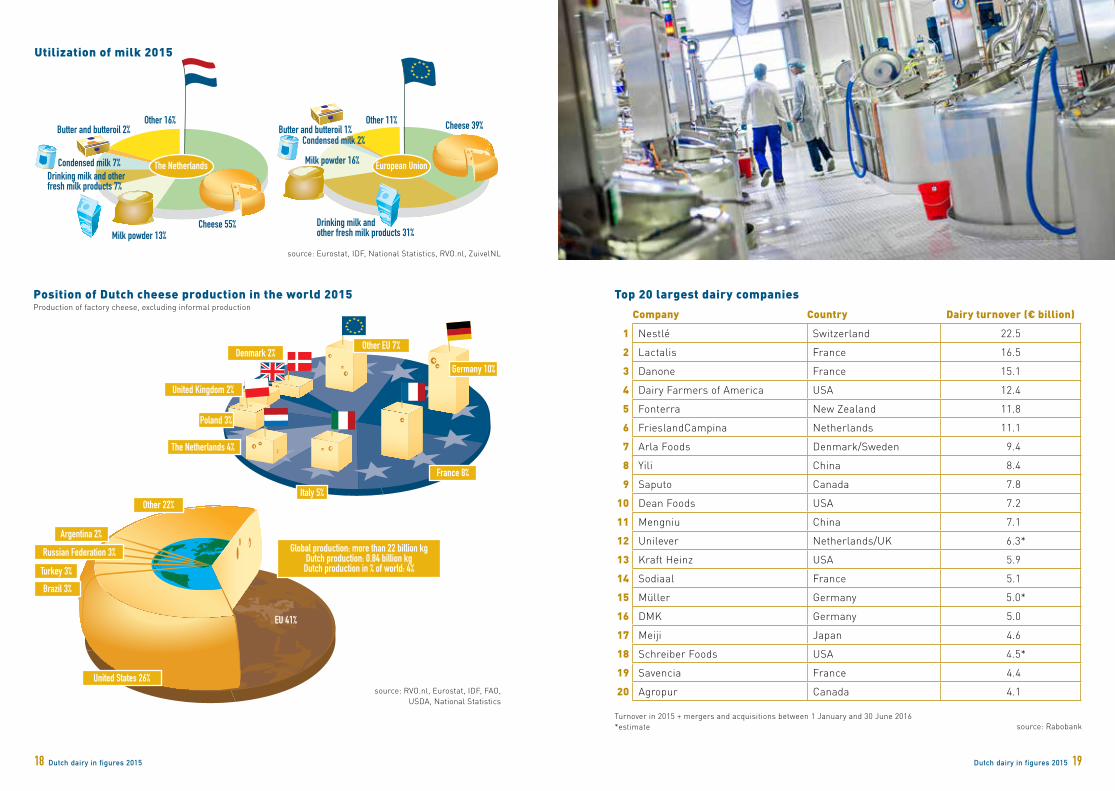
Global production: more than 22 billion kgDutch production: 0.84 billion kg
Dutch production in % of world: 4%
Germany 10%
France 8%
Italy 5%
The Netherlands 4%
Poland 3%
United Kingdom 2%
Denmark 2%Other EU 7%
United States 26%
Other 22%
Brazil 3%
Turkey 3%
Argentina 2%
Russian Federation 3%
EU 41%
18 Dutch dairy in figures 2015 Dutch dairy in figures 2015 19
Position of Dutch cheese production in the world 2015 Top 20 largest dairy companiesCompany Country Dairy turnover (€ billion)
1 Nestlé Switzerland 22.5
2 Lactalis France 16.5
3 Danone France 15.1
4 Dairy Farmers of America USA 12.4
5 Fonterra New Zealand 11.8
6 FrieslandCampina Netherlands 11.1
7 Arla Foods Denmark/Sweden 9.4
8 Yili China 8.4
9 Saputo Canada 7.8
10 Dean Foods USA 7.2
11 Mengniu China 7.1
12 Unilever Netherlands/UK 6.3*
13 Kraft Heinz USA 5.9
14 Sodiaal France 5.1
15 Müller Germany 5.0*
16 DMK Germany 5.0
17 Meiji Japan 4.6
18 Schreiber Foods USA 4.5*
19 Savencia France 4.4
20 Agropur Canada 4.1
source: Rabobank
source: RVO.nl, Eurostat, IDF, FAO, USDA, National Statistics
Turnover in 2015 + mergers and acquisitions between 1 January and 30 June 2016*estimate
Production of factory cheese, excluding informal production
-1
0
1
2
3
+2.0% +1.3% +2.2% +1.5% -2.0%-1.4%
billion kg
The Netherlands European UnionDrinking milk and other fresh milk products 7%
Cheese 55%
Butter and butteroil 2%
Milk powder 13%
Condensed milk 7%
Other 16%
Drinking milk and other fresh milk products 31%
Cheese 39%Butter and butteroil 1%
EU-28 USA Australia Argentina Uruguay New Zealand
Milk powder 16%
Condensed milk 2%
Other 11%
Utilization of milk 2015
source: Eurostat, IDF, National Statistics, RVO.nl, ZuivelNL
Butter and butteroil
Condensed milk
Cheese
Skimmed milk powder
Milk and cream
Non-skimmed milk powder
Other
Africa€ 497 million
EU€ 4,429 million
North America€ 129 million
Oceania€ 37 million
Central and South America€ 148 million
Other European countries
€ 62 million
33%
52%
71%
18%3% 1% 1% 6%
30%
4%4%1%1% 8%
59%
44%
13%5%3%
1%1%
33%
16%
11%3% 2% 2% 7%
48%
14%
14%
10%2%
12%
Asia€ 886 million
21%
20%
18%8%
8%
4%
21%
31%
25%
6% 1% 4%
20 Dutch dairy in figures 2015 Dutch dairy in figures 2015 21
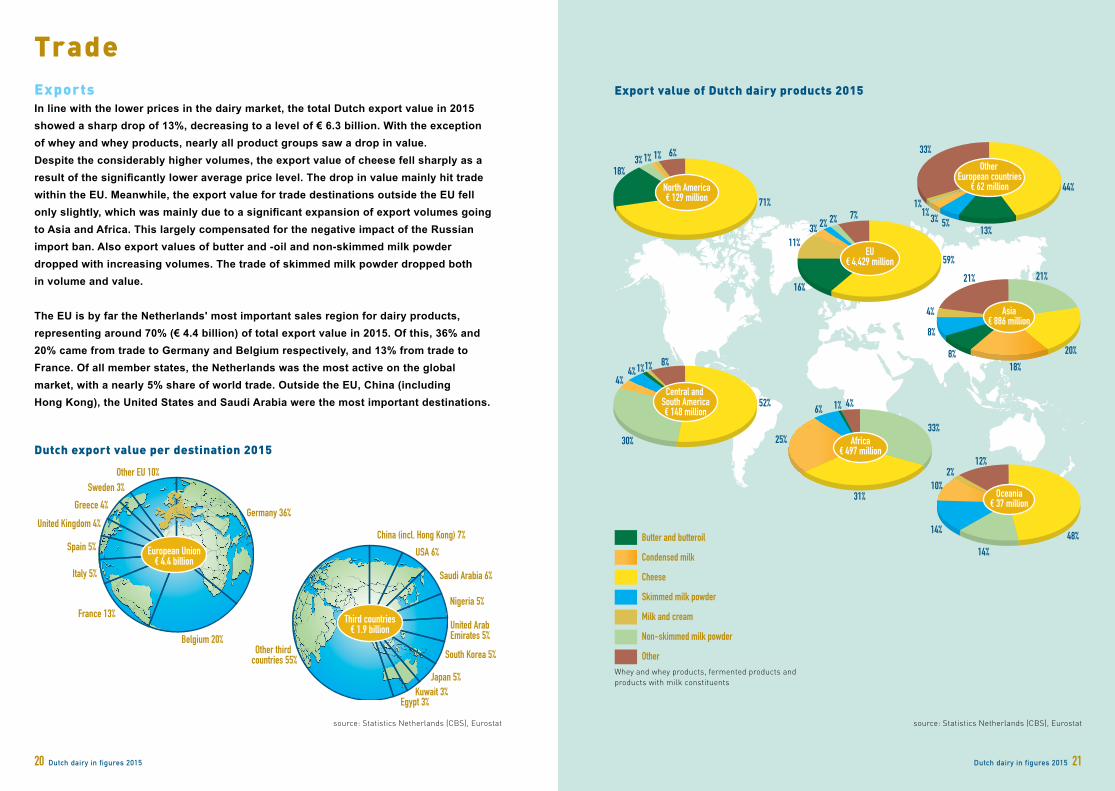
ExportsIn line with the lower prices in the dairy market, the total Dutch export value in 2015 showed a sharp drop of 13%, decreasing to a level of € 6.3 billion. With the exception of whey and whey products, nearly all product groups saw a drop in value.Despite the considerably higher volumes, the export value of cheese fell sharply as a result of the significantly lower average price level. The drop in value mainly hit trade within the EU. Meanwhile, the export value for trade destinations outside the EU fell only slightly, which was mainly due to a significant expansion of export volumes going to Asia and Africa. This largely compensated for the negative impact of the Russian import ban. Also export values of butter and -oil and non-skimmed milk powder dropped with increasing volumes. The trade of skimmed milk powder dropped both in volume and value.
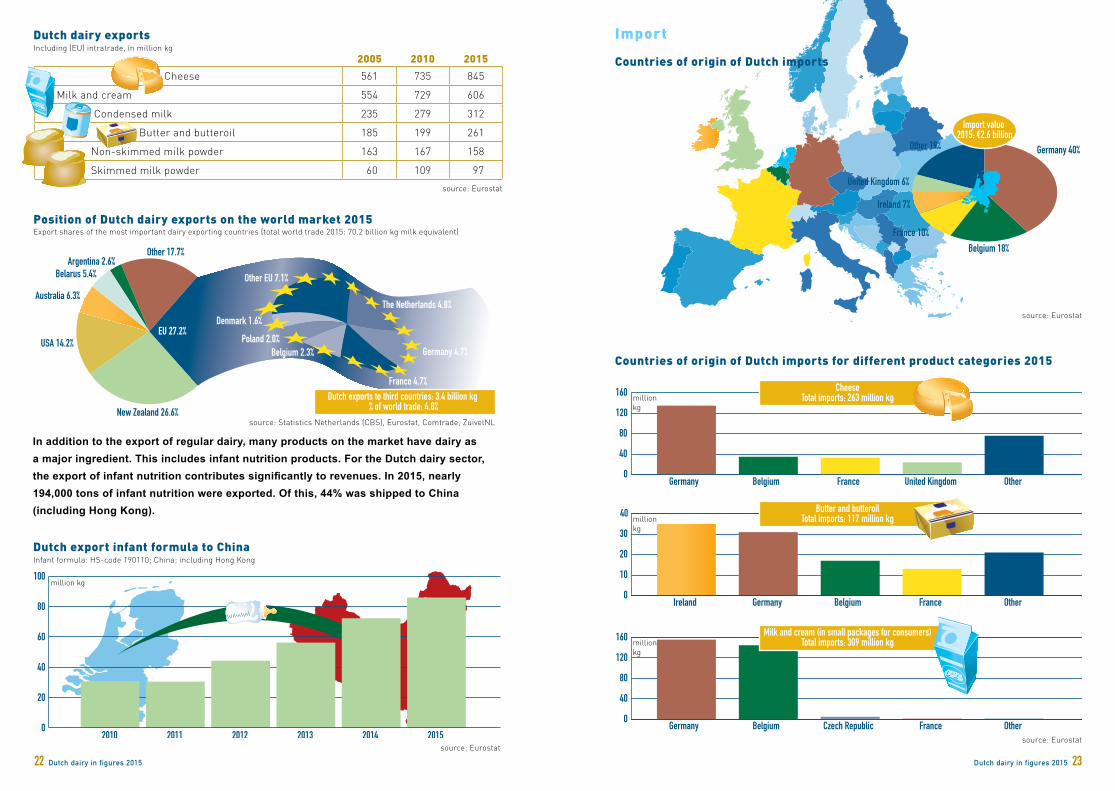
The EU is by far the Netherlands' most important sales region for dairy products, representing around 70% (€ 4.4 billion) of total export value in 2015. Of this, 36% and 20% came from trade to Germany and Belgium respectively, and 13% from trade to France. Of all member states, the Netherlands was the most active on the global market, with a nearly 5% share of world trade. Outside the EU, China (including Hong Kong), the United States and Saudi Arabia were the most important destinations.
Trade
Dutch export value per destination 2015
Export value of Dutch dairy products 2015
Whey and whey products, fermented products and products with milk constituents
European Union€ 4.4 billion
Third countries€ 1.9 billion
Germany 36%
Other third countries 55%
Belgium 20%
Nigeria 5%
Saudi Arabia 6%
Kuwait 3% Egypt 3%
South Korea 5%
USA 6%
Japan 5%
United Arab Emirates 5%
China (incl. Hong Kong) 7%
France 13%
Spain 5%
Greece 4%
Sweden 3%
Italy 5%
United Kingdom 4%
Other EU 10%
source: Statistics Netherlands (CBS), Eurostat source: Statistics Netherlands (CBS), Eurostat
Germany Belgium France United Kingdom Other
GermanyIreland FranceBelgium Other
Germany Belgium Czech Republic France Other
0
40
80
120
160
0
10
20
30
40
0
40
80
120
160
million kg
million kg
million kg
United Kingdom 6%
Belgium 18%
Ireland 7%
Other 19%
France 10%
Germany 40%
Import value 2015: €2.6 billion
Milk and cream (in small packages for consumers)Total imports: 309 million kg
Butter and butteroilTotal imports: 117 million kg
CheeseTotal imports: 263 million kg
Dutch dairy in figures 2015 23
22 Dutch dairy in figures 2015
Dutch dairy exports Import
Countries of origin of Dutch imports
Dutch export infant formula to China
In addition to the export of regular dairy, many products on the market have dairy as a major ingredient. This includes infant nutrition products. For the Dutch dairy sector, the export of infant nutrition contributes significantly to revenues. In 2015, nearly 194,000 tons of infant nutrition were exported. Of this, 44% was shipped to China (including Hong Kong).
source: Eurostat
source: Eurostat
source: Eurostat
Position of Dutch dairy exports on the world market 2015
Infant formula: HS-code 190110; China: including Hong Kong
Including (EU) intratrade, in million kg
Countries of origin of Dutch imports for different product categories 2015
Other 17.7%
New Zealand 26.6%
USA 14.2%
Australia 6.3%
Argentina 2.6%Belarus 5.4%
EU 27.2%
Dutch exports to third countries: 3.4 billion kg % of world trade: 4.8%
The Netherlands 4.8%
Germany 4.7%
France 4.7%
Belgium 2.3%
Denmark 1.6%
Poland 2.0%
Other EU 7.1%
million kg
0
20
40
60
80
100
2010 2011 2012 2013 2014 2015
2005 2010 2015 Cheese 561 735 845
Milk and cream 554 729 606
Condensed milk 235 279 312
Butter and butteroil 185 199 261
Non-skimmed milk powder 163 167 158
Skimmed milk powder 60 109 97
Export shares of the most important dairy exporting countries (total world trade 2015: 70.2 billion kg milk equivalent)
source: Eurostat
source: Statistics Netherlands (CBS), Eurostat, Comtrade, ZuivelNL
Germany Belgium France United Kingdom Other
GermanyIreland FranceBelgium Other
Germany Belgium Czech Republic France Other
0
40
80
120
160
0
10
20
30
40
0
40
80
120
160
million kg
million kg
million kg
United Kingdom 6%
Belgium 18%
Ireland 7%
Other 19%
France 10%
Germany 40%
Import value 2015: €2.6 billion
Milk and cream (in small packages for consumers)Total imports: 309 million kg
Butter and butteroilTotal imports: 117 million kg
CheeseTotal imports: 263 million kg

Dairy in the new Wheel of Five
(Dutch dietary guidelines) with milk, cheese
and yoghurt
Goudse 52.0%
Edammer 0.6%
Semi-skimmed milk 84.4%Whole milk 9.0%
Skimmed milk 6.6%
Other domestic natural cheese 24.3%Soft 5.8%
Fresh 7.3%
Cheese spread 3,3%
Other 6.7%
Household consumption cheese 2015: 1,885 kg per 100 households
Supermarkten 90,1% Markt 4,4% Versspeciaalzaken 2,6% Overige afzetkanalen 2,9%
Household purchases consumption milk 2015:
7,227 liter per 100 households
Dutch dairy in figures 2015 25
24 Dutch dairy in figures 2015
ConsumptionMarketing channels Dutch household purchases cheese 2015
Dutch household consumption of cheese
Dutch household consumption of milk
Dairy is an important part of the Netherlands' traditional diet. Milk, cheese, yogurt and dairy desserts continue to be part of the daily diet of many people in the Netherlands. The Netherlands Nutrition Centre has acknowledged the fact that dairy is healthy by giving it a prominent place in the new Wheel of Five, a tool used to support education about healthy eating.
For years, per capita cheese consumption in the Netherlands has stayed above the European average. On average, the Dutch eat about 20 kg of cheese per year. The share of dairy in Dutch household spending on food and non-alcoholic drinks has been more or less stable at 14% for many years. In 2015, this represented about € 4.9 billion, or 1.6% of total consumer spending.
0
5
10
15
20
25
30
35
Food and non-alcoholic beverages:
€ 34.6 billion
Total consumption spending
€ 301.8 billion
Potatoes, vegetables and fruit € 6.7 billion
Meat and meat products € 6.7 billion
Bread and bakery products € 7.2 billion
Dairy, eggs, oil and fats € 4.9 billionOther foods € 9.1 billion
source: Statistics Netherlands (CBS)
source: GfK
source: GfK
Consumption spending of Dutch households 2015
Goudse 52,0%
Edammer 0,6%
Halfvolle melk 84,3%Volle melk 9,0%
Magere melk 6,6%
Andere binnenlandse natuurkaas 24,3%Zacht 5,8%
Vers 7,3%
Smeerkaas 3,3%
Overige soorten 6,7%
0
25
50
75
100
Huishoudelijke aankopen kaas in 2015: 1.885 kg per 100 huishoudingen
Huishoudelijke aankopen consumptiemelk in 2015:
€ 7.227 liter per 100 huishoudingen
Supermarkets 90.1%
Markets 4.4% Fresh speciality stores 2.6% Other outlets 2.9%
MARKET
%

Zuivel in cijfers 2015 27
26 Dutch dairy in figures 2015
OrganisationsDairy sector related organisationsThe Dutch dairy sector is characterised by a high degree of organisation. Each segment of the production chain has its own organisation(s) to represent its interests. A large proportion of the dairy farmers are represented by the Dutch Federation of Agriculture and Horticulture (LTO Nederland), in particular by the LTO Dairy Committee, while there is also the Dutch Dairy Farmers Union (NMV). Industry is represented by the Dutch Dairy Association (NZO), traders by the organisation of Dutch Dairy Traders (Gemzu) and retailers by the Dutch Food Retail Association (CBL).
Chain organisation ZuivelNLAt the initiative of NZO and LTO the private chain organisation ZuivelNL was established in January 2014. ZuivelNL is an association formed by NZO, LTO and NMV in which other organisations linked to the dairy sector can participate. The mission of ZuivelNL is to strengthen the Dutch dairy supply chain with respects to the environment and the interests of society. ZuivelNL is active in fields where cooperation between the segments of the dairy sector will create added value. The ZuivelNL programme of work focuses on the following areas:
Food safety Monitoring and research of raw milk quality
Animal health Monitoring, research and prevention of animal disease
Sustainability Sustainable Dairy Chain (Duurzame Zuivelketen) aims to make the Dutch dairy sector world leader in sustainability
Research & innovation Applied and strategic research in the interest of dairy farmers, including knowledge exchange and innovation
Labour issues Technical knowledge retention, working environment
Export Veterinary issues, trade regulations and foreign market access, normalisation
Market information Commission Official Dutch Dairy Quotations, international milk price comparison, statistics
Education Websites on dairy education, teaching materials, farm visits
Dutch dairy in figures 2015 27
Primary sector
LTO NederlandDutch Federation of Agriculture and Horticulture: organisation for employers and employees in the agricultural sector
www.lto.nl
NMV Dutch Dairy Farmers Union: organisation for the interest of dairy farmers www.nmv.nu
BBZ
Farmhouse and Artisan Cheese and Dairy Producers: organisation for on-farm processors, active in defending the interests of its members and in product promotion
www.boerderijzuivel.nl
Industry and trade
NZO Dutch Dairy Association: association of the Dutch dairy industry www.nzo.nl
GemzuDutch Dairy Traders: umbrella organisa-tion for dairy traders ande other affiliated associations
www.gemzu.nl
CBLCentraal Bureau Levensmiddelenhandel: branchevereniging voor de supermarkt-branche en food service bedrijven
www.cbl.nl
Other categories
ZuivelNL
Dairy chain organisation: association in which LTO, NMV and NZO collaborate on several dairy related themes where and when this is considered of added value to the dairy sector
www.zuivelnl.org
COKZThe Netherlands Controlling Authority for milk and milk products: implementing organisation for control, specialized in quality assurance in the dairy chain
www.cokz.nl
QLIPPrivate organisation for analysis and cer-tification in the dairy chain and agrofood sector
www.qlip.nl
GDLeading Dutch animal health and animal production organisation, active in a.o. animal disease control programmes
www.gddiergezondheid.nl
Wageningen UR Livestock Research
Research organisation active in a.o. research on various dairy farming related themes
www.wageningenur.nl
NIZO Food Research Research institute for a.o. (dairy)product technology and milk quality www.nizo.com
RVONetherlands Enterprise Agency (RVO): part of the Ministry of Economic Affairs, which focuses on business support
www.rvo.nl
Related Documents


![Facts and Figures 2010 - The Dutch Agricluster in a Global Context[1]](https://static.cupdf.com/doc/110x72/5571f80249795991698c7427/facts-and-figures-2010-the-dutch-agricluster-in-a-global-context1.jpg)


