A Thermal Index from MODIS Data for Dust Detection Yang Liu, Ronggao Liu Institute of Geographic Sciences and Natural Resources Research, CAS 2011.7.28 • Vancouver

DustDection_liuyang_Final.ppt
Jul 16, 2015
Welcome message from author
This document is posted to help you gain knowledge. Please leave a comment to let me know what you think about it! Share it to your friends and learn new things together.
Transcript

A Thermal Index from MODIS Data for Dust Detection
Yang Liu, Ronggao LiuInstitute of Geographic Sciences and Natural Resources Research, CAS
2011.7.28 • Vancouver

Outline
Dust storm detection from satellite data
Method
Results
Summary

Dust Storms in Earth Research
With increasing land degradation and deforestation, dust storms spread in the world since the 20th century.
air pollution public health: respiratory diseases
global climate
biogeochemical cycle
Characterization of the dust properties and distribution at global scale helps to understand their roles on the Earth radiative budget and global biogeochemical cycle

Remote sensing in dust storm monitoring
Satellite remote sensing is advantageous in monitoring the global spatial and temporal variations of dust storms.
ultraviolet channels (Hsu et al., 1996; Chiapello et al., 1999)
visible, infrared channels (Miller, 2003; Hsu et al., 2006)
thermal infrared channels (Ackerman, 1997; Legrand et al., 1992; Schepanski et al., 2007; Walker et al., 2009)

Challenges in dust storm monitoring
Visible/ultraviolet band-based algorithm:
blue or ultraviolet bands are required for bright surface
Problems:
1) not reliable for nighttime;
2) no observations in these bands of many sensors, such as AVHRR (long-term dataset)
Thermal Infrared band-based algorithm:
Dust: brightness temperature difference (eg. BTD12,11, BTD8.6,11)
Problems:
the BTD is also related to other factors, such as land surface temperature and emissivity

Our work
Aim: develop an algorithm for dust storm monitor based on thermal infrared bands measurements of MODIS with consideration of the effects of LST on BTD.
Data MODIS brightness temperature in 11 (Band 31), 12 (Band 32), 8.6 (Band 29) Method Normalized BTD12,11, BTD8.6,11 with consideration of the effects of LST on BTD Results algorithm application over major land cover types over China
mµ mµ mµ

Outline
Dust storm detection from satellite data
Method
Results
Summary

Spectral response: dust, cloud and surfaceBTD12,11=BT12-BT11
Dust (BTD12,11>0)
Clear-sky surface(BTD12,11~0)
Cloud(BTD12,11<0)
BTD12,11 could separate dust from cloud, which affected by the LST

Spectral response: dust, cloud and surfaceBTD8.6,11=BT8.6-BT11
Dust/Cloud(BTD8.6,11>0)
Clear-sky surface(BTD8.6,11~0)
Bright surface(BTD8.6,11<0)
BTD8.6,11 helps to separate dust from bright surface

(1) Construction of pixel-by-pixel relationships of BT11-BT12 and BT8.6-BT11
The ratio of BT in 8.6 and 11, as well as 12 and 11 bands are mapped pixel-by-pixel based on clear-sky observations during 2000-2008;
(2) BTD normalization
The BTD12,11 and BTD8.6,11 are normalized to clear-sky condition using the pixel-based ratio relationship, and then used to calculate the difference (ΔBTD) with the observed BTD.
(3) Dust determination
Methods
11,6.811,12 BTDBTDDustIndex ∆+∆=

Methods
BTD12,11 and BTD8.6,11 over clear-sky surface
After normalization, BTD12,11 and BTD8.6,11 concentrated around 0
0
200000000
400000000
600000000
800000000
1000000000
-6 -4 -2 0 2 4
BTD(K)
Freq
uenc
y
NBTD29
NBTD32
BTD29
BTD32

Methods
DustIndex (DI) of dust, cloud and clear-sky surface
Dust: DI>0; Cloud: DI<0; Clear-sky surface: DI around 0
0
1
2
3
4
5
6
-10 0 10 20 30 40 50 60 70
DustIndex
Aer
osol
Thi
ckne
ss
Cloud
Dust
Clear-sky surface

Outline
Dust storm detection from satellite data
Method
Results
Summary

Results 1-Normalized BTD12,11
BT11=260K
BT11=280K
EstClearBTD 11,12
The BTD12,11 is related to surface temperature

Results 2-Normalized BTD8.6,11
EstClearBTD 11,6.8
BT11=260K
BT11=280K
The BTD8.6,11 is related to surface temperature

Results 3-performance over vegetated surface
a) Terra MODIS true-color image of dust storm over Northeast China on April 7, 2001; b) Dust detection results
DI could separate the airborne dust from clouds, vegetated surface and ocean

Results 4-performance over bright surface (1)
a) Terra MODIS true-color image shows dust storm in Taklimakan desert. b) Dust detection results
DI could separate airborne dust from sand and cloud over bright desert surface

Results 4-performance over bright surface (2)
c) Terra MODIS true-color image shows dust storm in Gobi desert;d) Dust detection results
DI could separate airborne dust from sand and cloud over bright desert surface
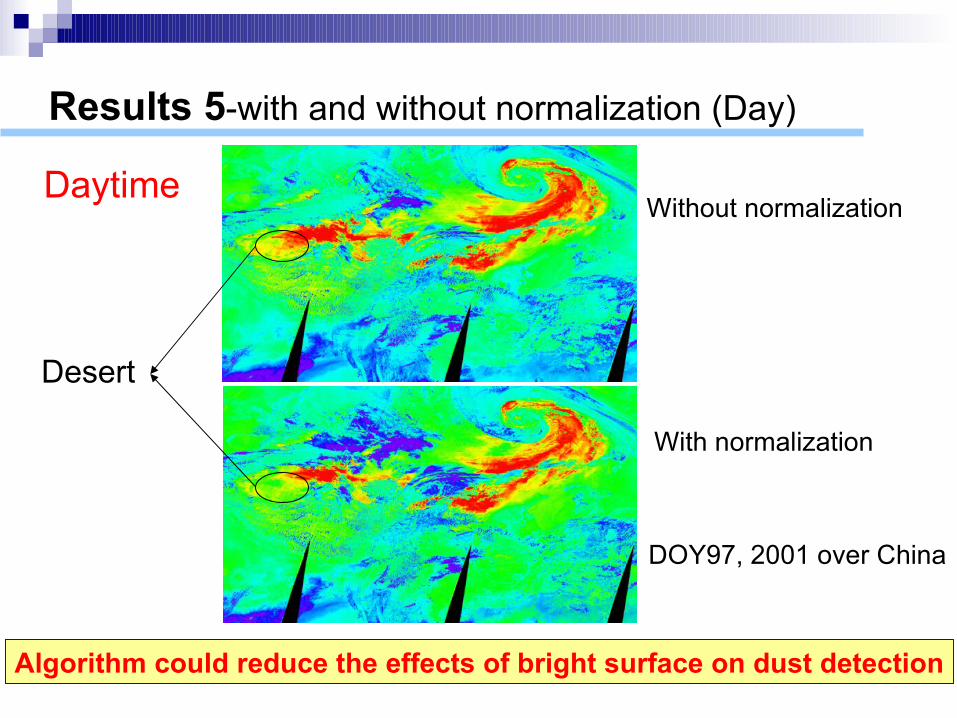
Results 5-with and without normalization (Day)
DOY97, 2001 over China
Without normalization
With normalization
Desert
Daytime
Algorithm could reduce the effects of bright surface on dust detection

Results 6-with and without normalization (Night)
NighttimeWithout normalization
With normalization
DOY97, 2001 over China
Algorithm could detect the airborn dust in nighttime

Dust storm detection from satellite data
Method
Results
Summary
Outline

Summary
A new algorithm has been developed to detect dust based
on satellite thermal infrared imagery;
here uses the brightness temperature of three thermal infrared
channels of MODIS, including 8.6, 11 and 12
The algorithm considers the effects of LST on BTD;
The algorithm could distinguish airborne dust from cloud
and land surface over bright and dark surface during daytime
and nighttime.

Thank you!