DURHAM-CHAPEL HILL-CARRBORO MPO METHODOLOGY FOR RANKING TRANSPORATION IMPROVEMENT PROGRAM PROJECT REQUESTS (FY 2016-2022) INTRODUCTION According to U.S. Code 23 Section 134, Metropolitan Planning Organizations are required to develop a Transportation Improvement Program in cooperation with the State and public transportation providers through a performance-driven, outcome-based approach to planning. The TIP should contain projects consistent with the Metropolitan Transportation Plan (MTP) and should reflect the investment priorities established in the current MTP. There should be the opportunity for public participation in developing the TIP including consultation, as appropriate, with State and local agencies responsible for land use management, natural resources, environmental protection, conservation and historic preservation. Furthermore, as a Transportation Management Area (TMA), according to U.S. Code 23 Section 134, all federally funded projects within the DCHC MPO (excluding projects carried out on the National Highway System) shall be selected for implementation from the approved TIP by the MPO in consultation with the State and any public transportation operator. Projects on the National Highway System shall be selected for implementation from the TIP by the State in cooperation with the MPO. North Carolina’s Strategic Transportation Investments (STI) legislation, passed in 2013, establishes a formula and process by which transportation funding is distributed across the State and across transportation modes. The outcome of the STI process is the draft State Transportation Improvement Program. The STI legislation applies uniformly across the State regardless of the boundaries of MPOs and MPOs that are TMAs. The STI legislation requires the identification and submittal of potential transportation projects by NCDOT and the MPO, the evaluation of projects according to a NCDOT- developed quantitative scoring methodology, and the allocation of ranking points among certain projects by NCDOT and the MPO. The DCHC MPO’s Methodology for Ranking TIP Project Requests is the process that the MPO will follow to develop the MPO’s allocation of ranking points among projects for input to the STI process. The Methodology will also inform the MPO’s development of the Transportation Improvement Program. The Methodology is designed to address the federal requirement that the TIP be consistent with the projects and investment priorities of the MTP while being compatible with the State’s STI process. The DCHC MPO retains the authority to develop the TIP for the MPO area as required by federal regulations. Participation in the STI process through submitting projects and/or allocating ranking points to projects does not require the MPO to include these projects in the TIP. OBJECTIVE The Methodology outlined below is designed to address multi-modal transportation needs, ensure regional balance, and prioritize projects that are needed based on technical criteria. The goal is to produce a project priority ranking which satisfies MPO goals, is simple enough for project-level analysis without requiring unnecessary data collection, and is understandable by the general public.

Welcome message from author
This document is posted to help you gain knowledge. Please leave a comment to let me know what you think about it! Share it to your friends and learn new things together.
Transcript
DURHAM-CHAPEL HILL-CARRBORO MPO METHODOLOGY FOR RANKING
TRANSPORATION IMPROVEMENT PROGRAM PROJECT REQUESTS (FY 2016-2022)
INTRODUCTION According to U.S. Code 23 Section 134, Metropolitan Planning Organizations are required to develop a Transportation Improvement Program in cooperation with the State and public transportation providers through a performance-driven, outcome-based approach to planning. The TIP should contain projects consistent with the Metropolitan Transportation Plan (MTP) and should reflect the investment priorities established in the current MTP. There should be the opportunity for public participation in developing the TIP including consultation, as appropriate, with State and local agencies responsible for land use management, natural resources, environmental protection, conservation and historic preservation. Furthermore, as a Transportation Management Area (TMA), according to U.S. Code 23 Section 134, all federally funded projects within the DCHC MPO (excluding projects carried out on the National Highway System) shall be selected for implementation from the approved TIP by the MPO in consultation with the State and any public transportation operator. Projects on the National Highway System shall be selected for implementation from the TIP by the State in cooperation with the MPO. North Carolina’s Strategic Transportation Investments (STI) legislation, passed in 2013, establishes a formula and process by which transportation funding is distributed across the State and across transportation modes. The outcome of the STI process is the draft State Transportation Improvement Program. The STI legislation applies uniformly across the State regardless of the boundaries of MPOs and MPOs that are TMAs. The STI legislation requires the identification and submittal of potential transportation projects by NCDOT and the MPO, the evaluation of projects according to a NCDOT-developed quantitative scoring methodology, and the allocation of ranking points among certain projects by NCDOT and the MPO. The DCHC MPO’s Methodology for Ranking TIP Project Requests is the process that the MPO will follow to develop the MPO’s allocation of ranking points among projects for input to the STI process. The Methodology will also inform the MPO’s development of the Transportation Improvement Program. The Methodology is designed to address the federal requirement that the TIP be consistent with the projects and investment priorities of the MTP while being compatible with the State’s STI process. The DCHC MPO retains the authority to develop the TIP for the MPO area as required by federal regulations. Participation in the STI process through submitting projects and/or allocating ranking points to projects does not require the MPO to include these projects in the TIP. OBJECTIVE The Methodology outlined below is designed to address multi-modal transportation needs, ensure regional balance, and prioritize projects that are needed based on technical criteria. The goal is to produce a project priority ranking which satisfies MPO goals, is simple enough for project-level analysis without requiring unnecessary data collection, and is understandable by the general public.
2
The DCHC MPO’s Technical Coordinating Committee (TCC) will use the Methodology to develop a draft allocation of ranking points. This draft allocation of ranking points is to be used as a guide by the Transportation Advisory Committee (TAC) for the approval of the final allocation of ranking points. If the TAC varies from the recommended allocation of points, documentation and reasoning will be provided. Reasons why the TAC may vary from the recommended points include achieving jurisdictional and geographical balance, reflecting the TAC members’ knowledge of the urban area and the policies of their communities, addressing public comments, ensuring coordination with NCDOT’s Division Engineers, and maximizing the MPO’s opportunities for receiving funding. While the Methodology attempts to comprehensively address the MPO’s transportation needs, there will always be factors that are not easily measured that should be considerations in the development of the MPO’s project priorities. The TCC will make its technical recommendation of the allocation of ranking points based on the methodology described in this document, and the TAC will then be afforded the opportunity to make changes with appropriate documentation. All public involvement for this process will be conducted in accordance with the DCHC MPO’s Public Involvement Policy. Details of our public involvement policy are described below. PROCEDURE FOR RANKING PROJECTS 1) Goals for the Methodology for Ranking TIP Project Requests
Since the Project Priority Ranking should be a subset of the DCHC MPO MTP, the goals for the Methodology are the same as the DCHC MPO goals and objectives in the 2040 MTP.
A safe, sustainable, efficient, attractive, multi-modal transportation system that: supports local land use; accommodates trip-making choices; maintains mobility and access; protects the environment and neighborhoods; and improves the quality of life for urban area residents.
An attractive multi-modal street and highway system that allows people and goods to be moved safely, conveniently, and efficiently.
A convenient, accessible, and affordable public transportation system, provided by public and private operators, that enhances mobility and economic development.
A pedestrian and bicycle system that: provides a safe alternative means of transportation; allows greater access to public transit; supports recreational opportunities; and includes off-road trails
A Transportation Plan that is integrated with local land use plans and development policies.
A multi-modal transportation system which provides access and mobility to all residents, while protecting the public health, natural environment, cultural resources, and social systems.
An ongoing program to inform and involve citizens throughout all stages of the development, update, and implementation of the Transportation Plan.
Continue to improve transportation safety and ensure the security of the transportation system.
Improve mobility and accessibility of freight and urban goods movement.
2) Submission of Local Priority Lists to the MPO All MPO member jurisdictions and Triangle Transit will submit a local priority list to the MPO. The DCHC MPO requests that the local jurisdictions apply screening criteria during the development of these lists. The screening criteria are:
3
a) Regional Goals - How well does the project meet the adopted regional goals? Is the project an element of the current MTP? Does it implement community objectives? For the intrastate system, does it meet NCDOT mobility objectives? Does the project have a broad base of local support?
b) Cost Effectiveness - How much benefit does the project offer compared to the estimated cost?
c) Timing – Is the project needed within the TIP funding cycle? Is timing a critical element for the project (one-time opportunity)? Will the opportunity to do the project be lost if it is not in the current priority cycle?
Local jurisdictions may also elect to use a ranking methodology to create their local priority lists but are not required to do so. The TCC will review local priority lists for adherence to these screening criteria before recommending the submission of these projects. Local jurisdictions shall provide the DCHC MPO a list of projects. The list should be grouped by mode (highway, public transit, rail, and bicycle and pedestrian). The local jurisdictions shall provide a short description of the project, including the project limits, name, mileage, and cost. The description should note any essential elements of the project such as bike lanes, sidewalks, transit accommodations, vehicle types, etc.
3) Submission of Projects to the STI Process For the 2016-2022 TIP, the DCHC MPO will submit projects to NCDOT’s Strategic Planning Office of Transportation by March 3, 2014, for the application of the NCDOT’s quantitative ranking methodology. The MPO is limited to fourteen new highway projects, but can submit an additional project for each existing project removed from the system. The MPO is limited to twenty bicycle and pedestrian projects, five rail projects, and an unlimited number of public transit projects. Previously submitted highway projects do not need to be re-submitted. Public transit operators can submit an unlimited number of projects directly to NCDOT. The NCDOT Rail Division can submit an unlimited number of projects to the process. And NCDOT Division Engineers can also submit projects. DCHC MPO will combine the local priority lists into a list that the MPO will submit to NCDOT. In the event that more highway projects are submitted to the MPO than the MPO is allowed submit to NCDOT, the TCC will select projects based on the screening criteria, the air quality horizon year in the MTP, regional significance, geographic distribution, and local priority. The MPO will also consider requesting that the Division Engineers submit any additional highway projects in the 2040 MTP that are not in the MPO’s submittal. Since the MPO is limited to only 20 bicycle and pedestrian projects and an initial review of candidate projects revealed more than 70 potential projects, the MPO requests that the Town of Chapel Hill, Town of Carrboro, Town of Hillsborough, Orange County, and Chatham County submit four projects each, and the City of Durham and Durham County submit eight projects each. Of the potential 36 project submissions, the TCC will apply a preliminary ranking based on the following criteria:
Safety o 20% crash data from 2008-2012 – 4 points per crash; maximum of 20 points
4
o 20% posted speed limit – 40-50 mph = 20 points; 30-39 mph = 10 points; 25 mph = 5 points
Access to destinations o 10% number of destinations – 1 point per major destination; maximum of 7 points;
½ point for secondary destinations; maximum of 3 points
Demand/Density o 10% Traffic Analysis Zone population density; o 10% Traffic Analysis Zone employment density
Constructability o 10% Right-of-Way availability o 10% Design status
Schools o 10% if the project is within 2 miles of a K-8 school.
Projects that the MPO cannot submit will be requested to be submitted by the NCDOT Division Engineers.
Any public transit or rail project submitted by a member government or transit operator will be considered for submission by the MPO. Projects will be screened to make sure they are consistent with the 2040 MTP and other adopted transit and rail plans.
4) Application of the MPO Ranking Methodology and Recommended Allocation of Ranking Points
Upon submission by the MPO and NCDOT Division Engineers, projects within the MPO will by scored according to NCDOT’s quantitative ranking methodology. The DCHC MPO will receive these scores and project data used to develop the scores. DCHC MPO staff in coordination with local staff will use the project data and collect additional data to apply the MPO methodology. The Project Priority Ranking will then be presented to the TCC. While the methodology is very detailed and specific about scoring, there is always the chance for human error and incomplete or inaccurate information. DCHC MPO staff will request that all local technical staff on the TCC review the application of the methodology to catch any inadvertent errors. If the TCC finds that there are any errors or inconsistencies, the TCC can agree to change some data inputs to improve accuracy. There are separate ranking methodologies based on the primary mode of transportation and project type: 1) highway; 2) bicycle and pedestrian; 3) transit-expansion; 4) transit-facilities; 5) transit-fixed guideway; 6) rail-track and structure (passenger); 7) rail-track and structure (freight); 8) rail-facilities (passenger). Furthermore, there are variations within each of these methodologies for the STI funding category (Regional or Division). There are no ferry routes or eligible airports within the DCHC MPO. Similar to the NCDOT quantitative methodology, the ranking methodologies are independent of each other and the points for different modes are not directly comparable.
In total, there are 14 different MPO methodologies for the various modes, project types, and categories.
5
Category
Statewide Regional Division
Mo
de/P
roject Typ
e
Highway No MPO Methodology. The MPO does not submit ranking points to projects in the Statewide category.
Yes Yes
Bicycle/Pedestrian No. The STI legislation does not allow any bike/ped to be considered for Regional funding.
Yes
Public Transit-Expansion Yes Yes
Public Transit-Facilities Yes Yes
Public Transit-Fixed Guideway
Yes Yes
Rail-Track and Structure
Passenger Yes Yes
Freight Yes Yes
Rail-Facilities Passenger No. The DCHC MPO does not have any qualifying projects.
Yes
Freight No. The DCHC MPO does not have any qualifying projects.
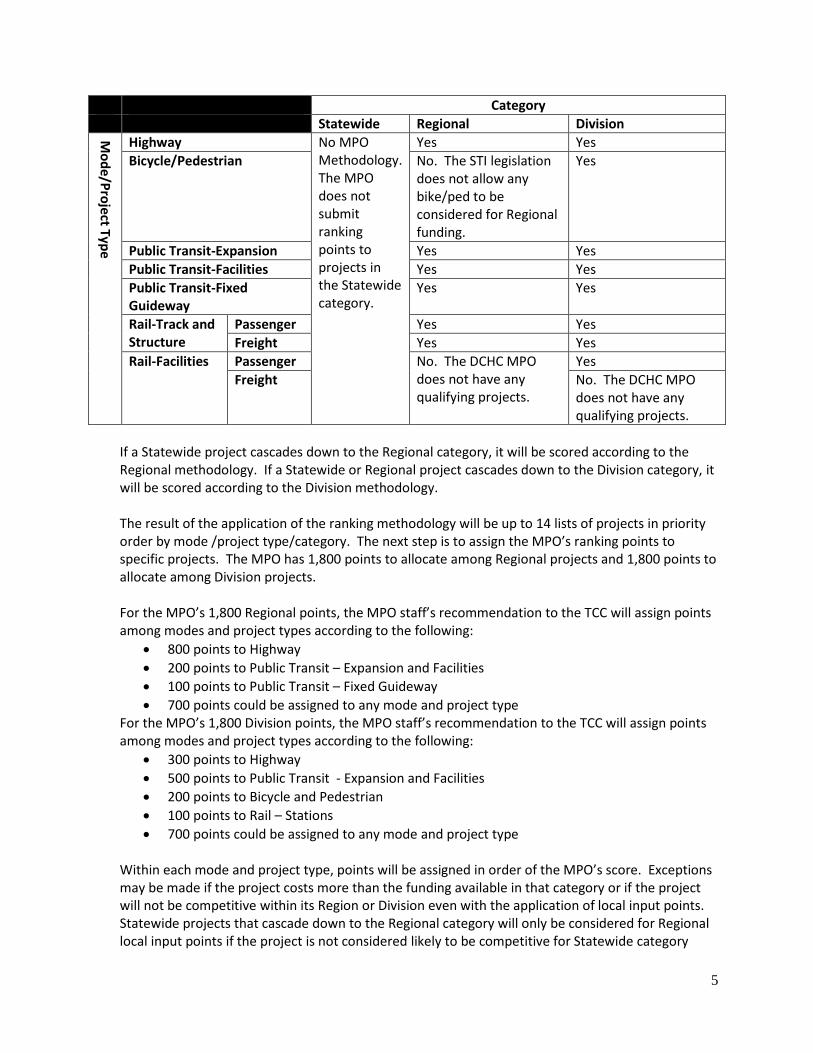
If a Statewide project cascades down to the Regional category, it will be scored according to the Regional methodology. If a Statewide or Regional project cascades down to the Division category, it will be scored according to the Division methodology. The result of the application of the ranking methodology will be up to 14 lists of projects in priority order by mode /project type/category. The next step is to assign the MPO’s ranking points to specific projects. The MPO has 1,800 points to allocate among Regional projects and 1,800 points to allocate among Division projects. For the MPO’s 1,800 Regional points, the MPO staff’s recommendation to the TCC will assign points among modes and project types according to the following:
800 points to Highway
200 points to Public Transit – Expansion and Facilities
100 points to Public Transit – Fixed Guideway
700 points could be assigned to any mode and project type For the MPO’s 1,800 Division points, the MPO staff’s recommendation to the TCC will assign points among modes and project types according to the following:
300 points to Highway
500 points to Public Transit - Expansion and Facilities
200 points to Bicycle and Pedestrian
100 points to Rail – Stations
700 points could be assigned to any mode and project type Within each mode and project type, points will be assigned in order of the MPO’s score. Exceptions may be made if the project costs more than the funding available in that category or if the project will not be competitive within its Region or Division even with the application of local input points. Statewide projects that cascade down to the Regional category will only be considered for Regional local input points if the project is not considered likely to be competitive for Statewide category
6
funding during the next Prioritization cycle. Statewide or Regional projects that cascade down to Division will only be considered for Division local input points if the project is less than $5 million. This limitation is due to the very limited amount of funding available in the Division category that is not STPDA or TAP (funding that is directly allocated to certain MPOs and that is not subject to the Prioritization process but is subject to the STI legislation), and the number of projects that only qualify in the Division category (all bicycle/pedestrian, DATA, and Chapel Hill Transit projects). Points will generally be concentrated among fewer projects. The minimum number of points will be assigned to each project to ensure that it maintains its relative position in its Region or Division. The MPO staff’s recommendation to the TCC for the 700 unassigned points in the Regional and Division categories will be informed by:
The priorities of the 2040 MTP including the adopted distribution of funding between modes and the air quality horizon year of projects;
The number of eligible projects within the MPO within each funding mode /project type/category;
The likelihood of receiving funding through STI considering the amount of funding available within each Division or Region, historical funding levels for the mode, and the normalization limitations that NCDOT has adopted;
The effect that receiving funding for a project may have on the likelihood of other projects being funded in the Division or Region considering the limitations set by the STI legislation; and
Geographic and jurisdictional balance. MPO staff will document the reasoning used to justify the proposed assignment of points. The TCC will receive the MPO’s staff’s recommendation and may consider adjustments based on the above factors for its recommendation to the TAC. Again the reasoning used to develop the recommended assignment of points will be clearly documented. During the period that the draft point assignment is released for public comment, the MPO staff and the TCC may make further adjustments to their recommendation based on the above factors as well as:
Coordination with the Division Engineers on the assignment of points;
Public input and support as evidenced through public comments submitted to the MPO, the MPO’s public hearing, public involvement efforts of local governments, and local referenda;
All public involvement for this process will be conducted in accordance with the DCHC MPO’s Public Involvement Policy. Details of our public involvement policy are described below.
5) Approval of Ranking Points The TAC will release the draft Project Priority Ranking and application of ranking points for public comment and hold a public hearing at a TAC meeting. After review and public comment, the TAC will approve the final application of ranking points. The TAC’s approval will be informed by:
The priorities of the 2040 MTP including the adopted distribution of funding between modes and the air quality horizon year of projects;
The number of eligible projects within the MPO within each funding mode /project type/category;
7
The likelihood of receiving funding through STI considering the amount of funding available within each Division or Region, historical funding levels for the mode, and the normalization limitations that NCDOT has adopted;
The effect that receiving funding for a project may have on the likelihood of other projects being funded in the Division or Region considering the limitations set by the STI legislation;
Geographic and jurisdictional balance;
Coordination with the Division Engineers on the assignment of points;
Public input and support as evidenced through public comments submitted to the MPO, the MPO’s public hearing, public involvement efforts of local governments, and local referenda;
The TAC members’ knowledge of the urban area and the policies of their communities; and
Other factors as identified. If the TAC varies from the recommended allocation of points, MPO staff will document the rationale and will post this on the MPO’s website. All public involvement for this process will be conducted in accordance with the DCHC MPO’s Public Involvement Policy. Details of our public involvement policy are described below. Finally, MPO staff will submit these points to NCDOT for use in the STI process.
Public Involvement All public involvement for this process will be conducted in accordance with the DCHC MPO’s Public Involvement Policy. As is the MPO’s standard practice for all TCC and TAC agenda items, all relevant materials, documentation of this process, and TCC and TAC meeting materials and minutes will be posted on the DCHC MPO’s website www.dchcmpo.org. Documentation of the process will include a description of the TAC’s rationale for assigning points to projects. The Public Involvement Policy sets a minimum 21-day public comment period for this process and requires a public hearing at a TAC meeting. This public comment period and public hearing will be advertised to the public in accordance with the Public Involvement Policy. Public comments will be documented, summarized, and responses will be provided. In addition, all DCHC MPO TCC and TAC meetings are public meetings and include the opportunity for public comment. Comments provided at any meeting will be considered.
8
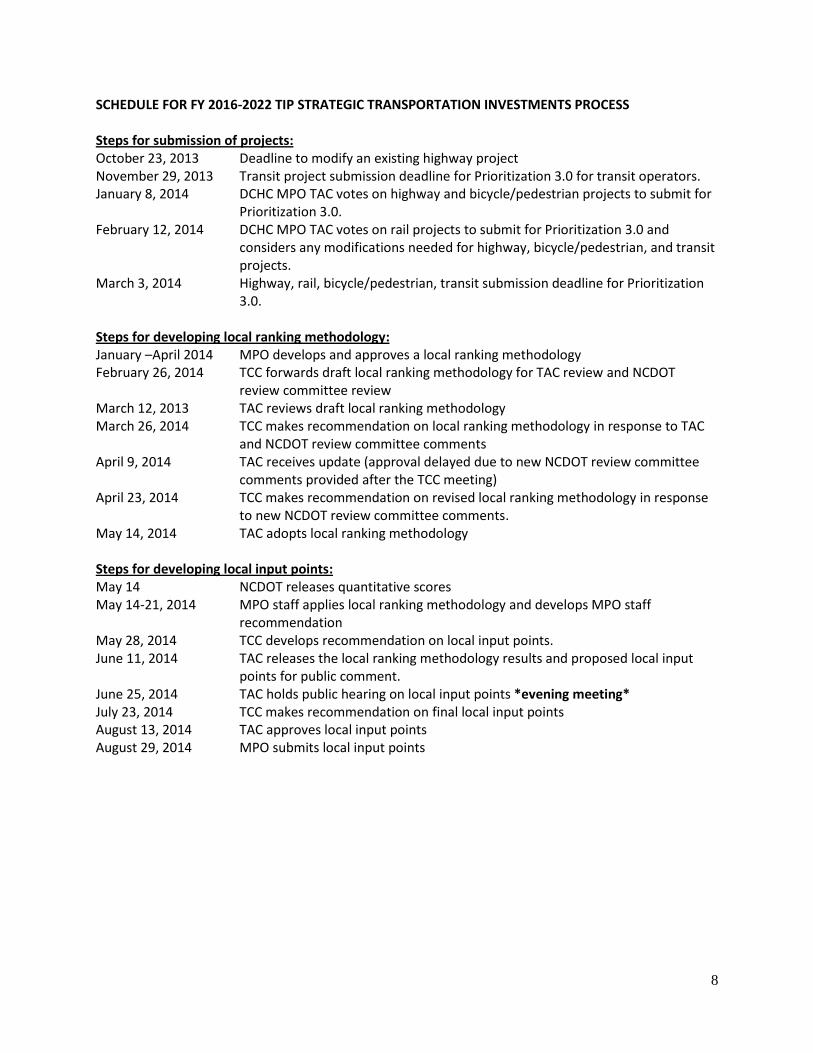
SCHEDULE FOR FY 2016-2022 TIP STRATEGIC TRANSPORTATION INVESTMENTS PROCESS Steps for submission of projects: October 23, 2013 Deadline to modify an existing highway project November 29, 2013 Transit project submission deadline for Prioritization 3.0 for transit operators. January 8, 2014 DCHC MPO TAC votes on highway and bicycle/pedestrian projects to submit for
Prioritization 3.0. February 12, 2014 DCHC MPO TAC votes on rail projects to submit for Prioritization 3.0 and
considers any modifications needed for highway, bicycle/pedestrian, and transit projects.
March 3, 2014 Highway, rail, bicycle/pedestrian, transit submission deadline for Prioritization 3.0.
Steps for developing local ranking methodology: January –April 2014 MPO develops and approves a local ranking methodology February 26, 2014 TCC forwards draft local ranking methodology for TAC review and NCDOT
review committee review March 12, 2013 TAC reviews draft local ranking methodology March 26, 2014 TCC makes recommendation on local ranking methodology in response to TAC
and NCDOT review committee comments April 9, 2014 TAC receives update (approval delayed due to new NCDOT review committee
comments provided after the TCC meeting) April 23, 2014 TCC makes recommendation on revised local ranking methodology in response
to new NCDOT review committee comments. May 14, 2014 TAC adopts local ranking methodology Steps for developing local input points: May 14 NCDOT releases quantitative scores May 14-21, 2014 MPO staff applies local ranking methodology and develops MPO staff
recommendation May 28, 2014 TCC develops recommendation on local input points. June 11, 2014 TAC releases the local ranking methodology results and proposed local input
points for public comment. June 25, 2014 TAC holds public hearing on local input points *evening meeting* July 23, 2014 TCC makes recommendation on final local input points August 13, 2014 TAC approves local input points August 29, 2014 MPO submits local input points
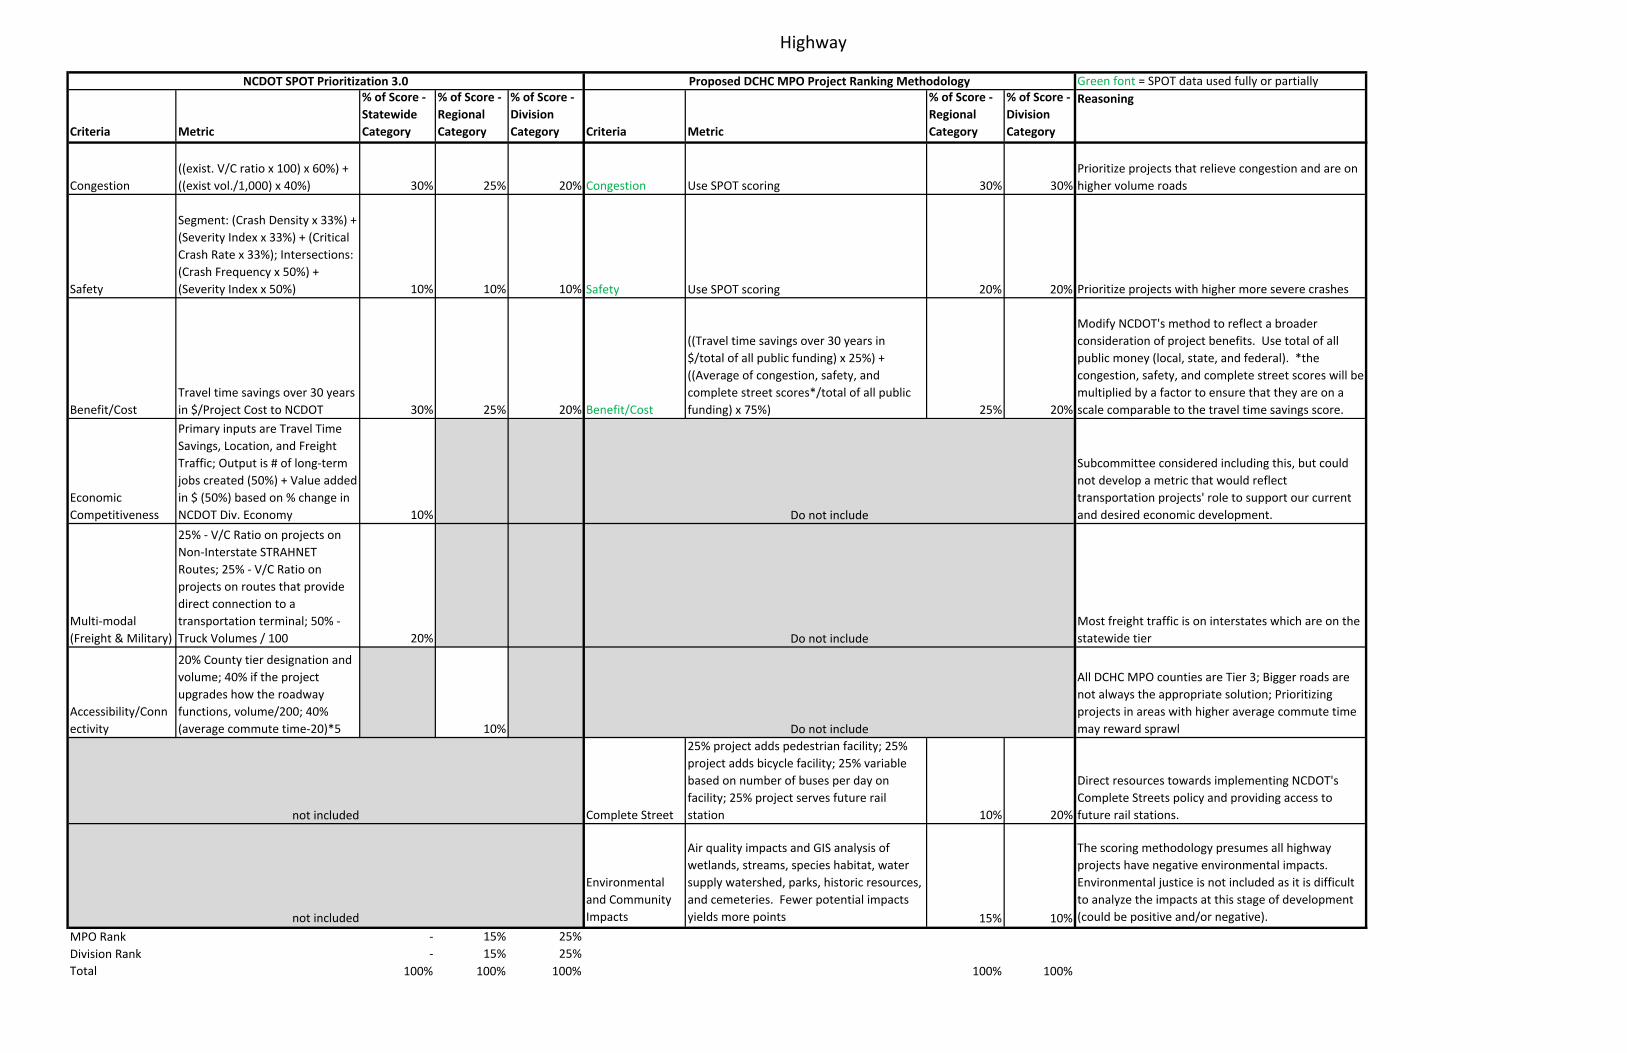
Highway
Green font = SPOT data used fully or partially
Criteria Metric
% of Score ‐ Statewide Category
% of Score ‐ Regional Category
% of Score ‐ Division Category Criteria Metric
% of Score ‐ Regional Category
% of Score ‐ Division Category
Reasoning
Congestion((exist. V/C ratio x 100) x 60%) + ((exist vol./1,000) x 40%) 30% 25% 20% Congestion Use SPOT scoring 30% 30%
Prioritize projects that relieve congestion and are on higher volume roads
Safety
Segment: (Crash Density x 33%) + (Severity Index x 33%) + (Critical Crash Rate x 33%); Intersections: (Crash Frequency x 50%) + (Severity Index x 50%) 10% 10% 10% Safety Use SPOT scoring 20% 20% Prioritize projects with higher more severe crashes
Benefit/CostTravel time savings over 30 years in $/Project Cost to NCDOT 30% 25% 20% Benefit/Cost
((Travel time savings over 30 years in $/total of all public funding) x 25%) + ((Average of congestion, safety, and complete street scores*/total of all public funding) x 75%) 25% 20%
Modify NCDOT's method to reflect a broader consideration of project benefits. Use total of all public money (local, state, and federal). *the congestion, safety, and complete street scores will be multiplied by a factor to ensure that they are on a scale comparable to the travel time savings score.
Economic Competitiveness
Primary inputs are Travel Time Savings, Location, and Freight Traffic; Output is # of long‐term jobs created (50%) + Value added in $ (50%) based on % change in NCDOT Div. Economy 10%
Subcommittee considered including this, but could not develop a metric that would reflect transportation projects' role to support our current and desired economic development.
Multi‐modal (Freight & Military)
25% ‐ V/C Ratio on projects on Non‐Interstate STRAHNET Routes; 25% ‐ V/C Ratio on projects on routes that provide direct connection to a transportation terminal; 50% ‐ Truck Volumes / 100 20%
Most freight traffic is on interstates which are on the statewide tier
Accessibility/Connectivity
20% County tier designation and volume; 40% if the project upgrades how the roadway functions, volume/200; 40% (average commute time‐20)*5 10%
All DCHC MPO counties are Tier 3; Bigger roads are not always the appropriate solution; Prioritizing projects in areas with higher average commute time may reward sprawl
Complete Street
25% project adds pedestrian facility; 25% project adds bicycle facility; 25% variable based on number of buses per day on facility; 25% project serves future rail station 10% 20%
Direct resources towards implementing NCDOT's Complete Streets policy and providing access to future rail stations.
Environmental and Community Impacts
Air quality impacts and GIS analysis of wetlands, streams, species habitat, water supply watershed, parks, historic resources, and cemeteries. Fewer potential impacts yields more points 15% 10%
The scoring methodology presumes all highway projects have negative environmental impacts. Environmental justice is not included as it is difficult to analyze the impacts at this stage of development (could be positive and/or negative).
‐ 15% 25%‐ 15% 25%
Total 100% 100% 100% 100% 100%
Proposed DCHC MPO Project Ranking Methodology
Do not include
Do not include
Do not include
not includedMPO RankDivision Rank
NCDOT SPOT Prioritization 3.0
not included
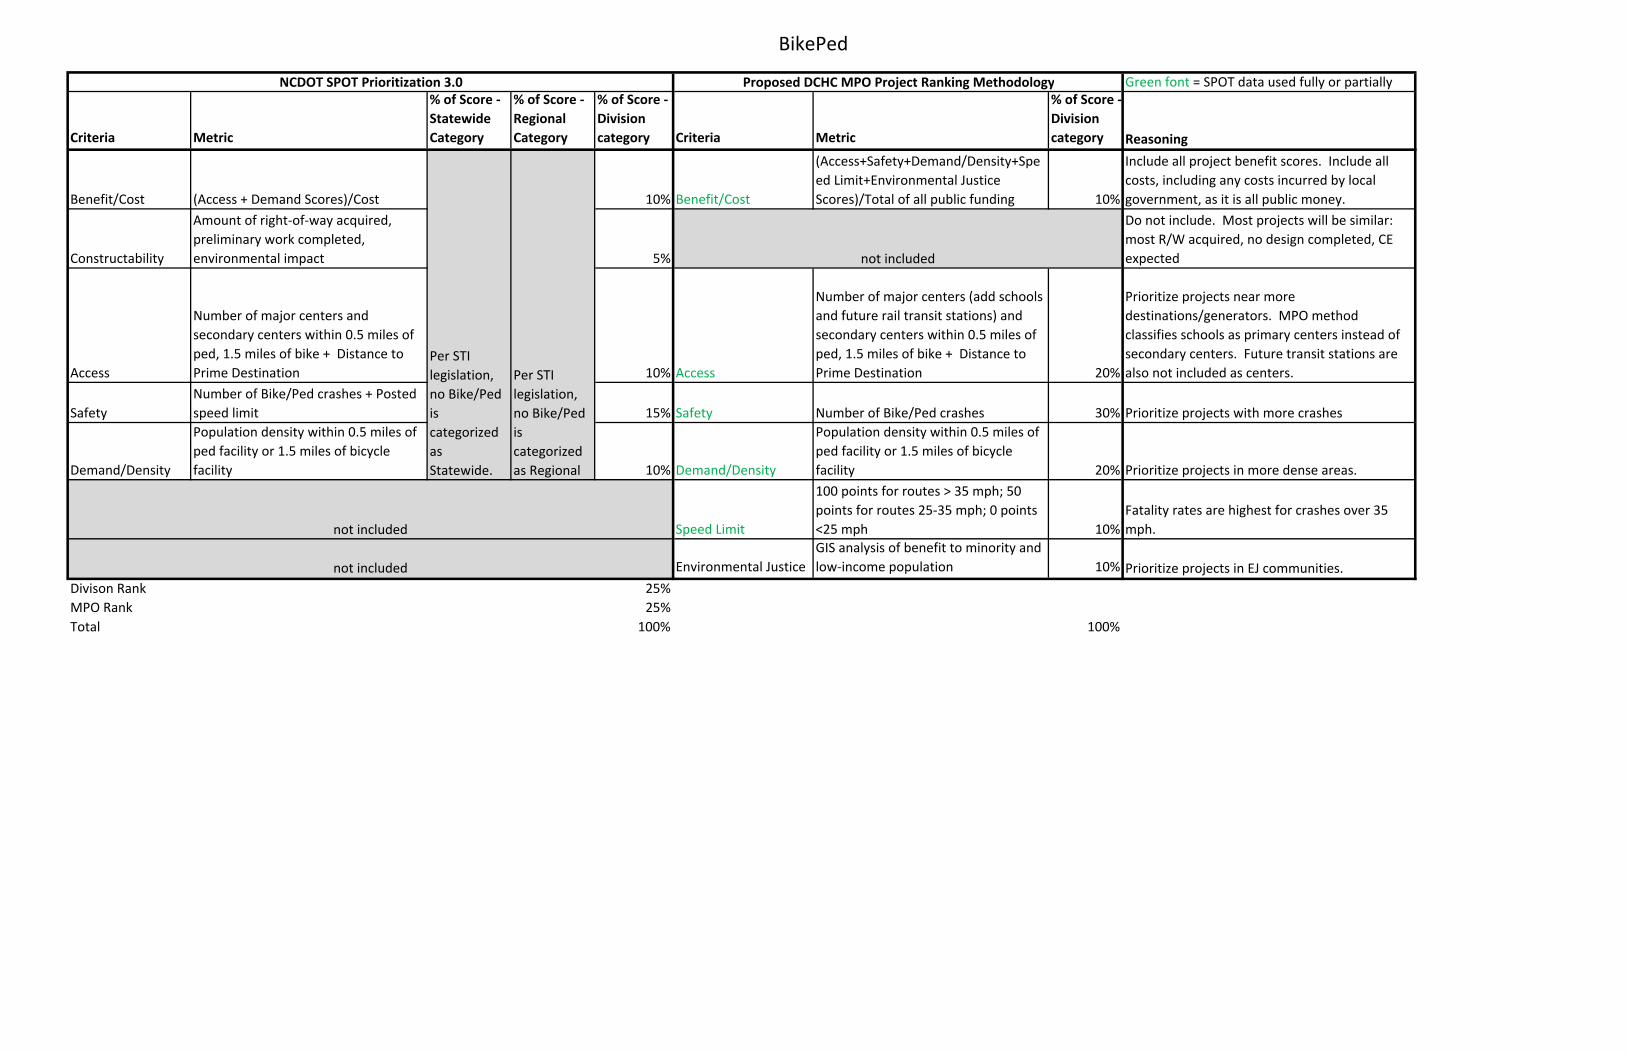
BikePed
Green font = SPOT data used fully or partially
Criteria Metric
% of Score ‐ Statewide Category
% of Score ‐ Regional Category
% of Score ‐ Division category Criteria Metric
% of Score ‐ Division category Reasoning
Benefit/Cost (Access + Demand Scores)/Cost 10% Benefit/Cost
(Access+Safety+Demand/Density+Speed Limit+Environmental Justice Scores)/Total of all public funding 10%
Include all project benefit scores. Include all costs, including any costs incurred by local government, as it is all public money.
Constructability
Amount of right‐of‐way acquired, preliminary work completed, environmental impact 5%
Do not include. Most projects will be similar: most R/W acquired, no design completed, CE expected
Access
Number of major centers and secondary centers within 0.5 miles of ped, 1.5 miles of bike + Distance to Prime Destination 10% Access
Number of major centers (add schools and future rail transit stations) and secondary centers within 0.5 miles of ped, 1.5 miles of bike + Distance to Prime Destination 20%
Prioritize projects near more destinations/generators. MPO method classifies schools as primary centers instead of secondary centers. Future transit stations are also not included as centers.
SafetyNumber of Bike/Ped crashes + Posted speed limit 15% Safety Number of Bike/Ped crashes 30% Prioritize projects with more crashes
Demand/Density
Population density within 0.5 miles of ped facility or 1.5 miles of bicycle facility 10% Demand/Density
Population density within 0.5 miles of ped facility or 1.5 miles of bicycle facility 20% Prioritize projects in more dense areas.
Speed Limit
100 points for routes > 35 mph; 50 points for routes 25‐35 mph; 0 points <25 mph 10%
Fatality rates are highest for crashes over 35 mph.
Environmental JusticeGIS analysis of benefit to minority and low‐income population 10% Prioritize projects in EJ communities.
Divison Rank 25%MPO Rank 25%Total 100% 100%
Proposed DCHC MPO Project Ranking Methodology
not included
not included
NCDOT SPOT Prioritization 3.0
not included
Per STI legislation, no Bike/Ped is categorized as Statewide.
Per STI legislation, no Bike/Ped is categorized as Regional
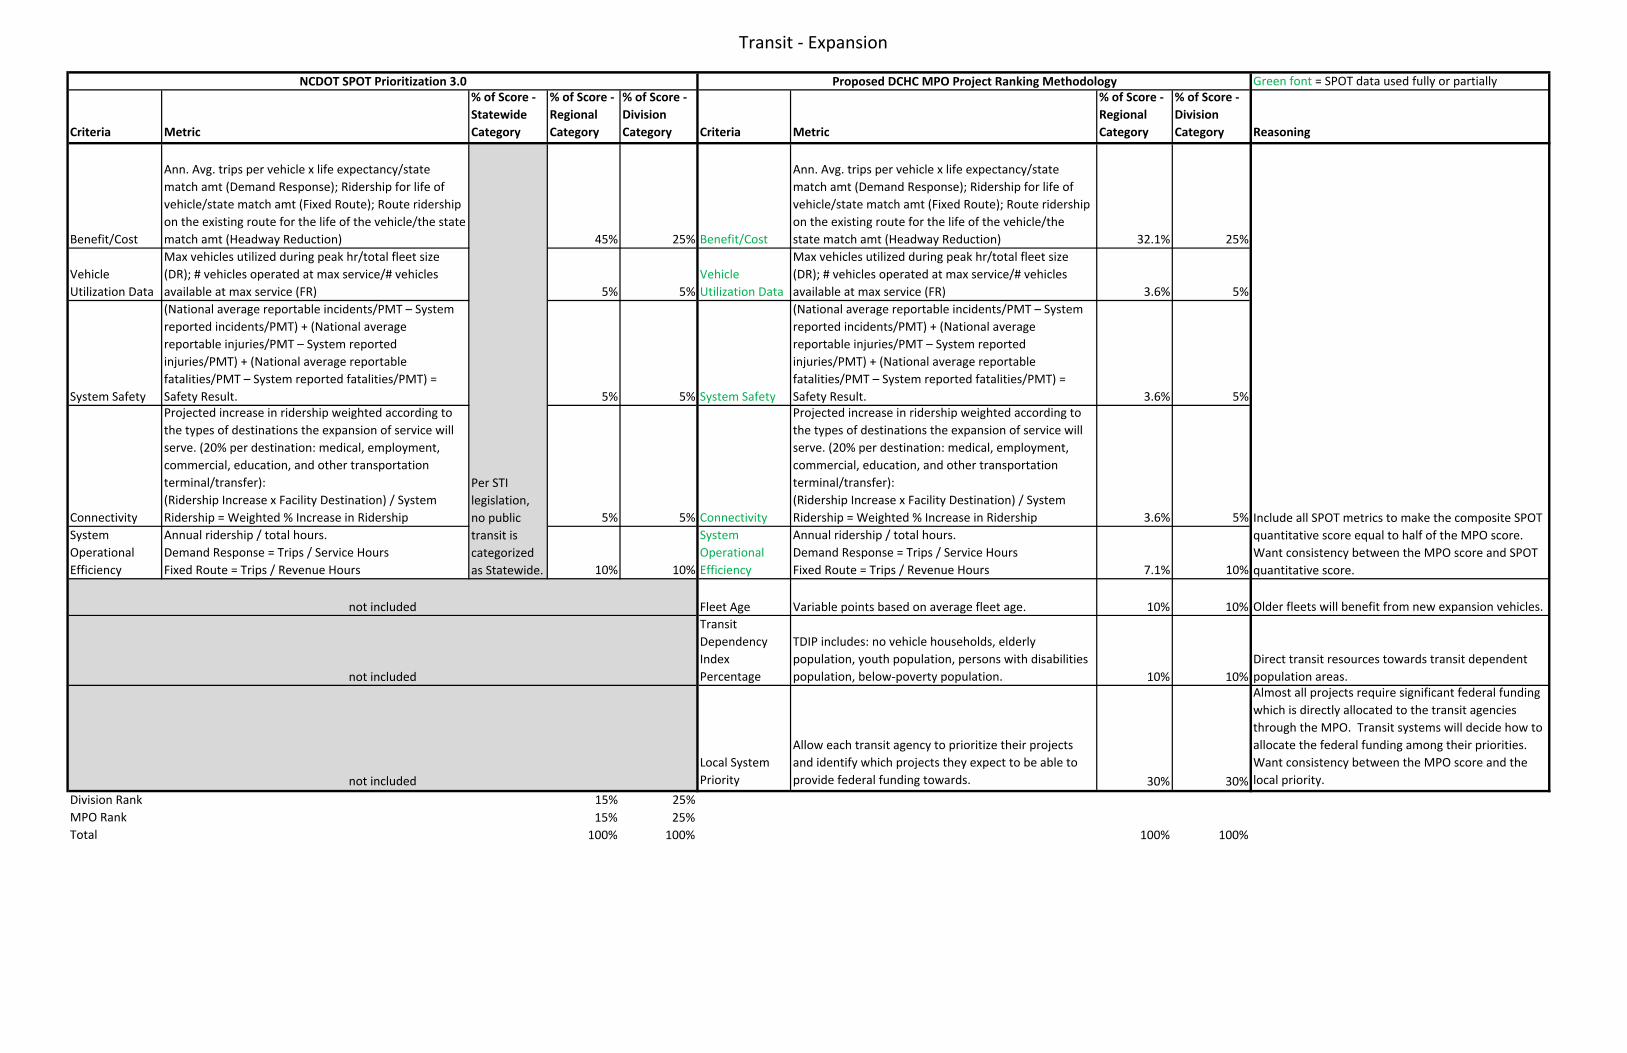
Transit ‐ Expansion
Green font = SPOT data used fully or partially
Criteria Metric
% of Score ‐ Statewide Category
% of Score ‐ Regional Category
% of Score ‐ Division Category Criteria Metric
% of Score ‐ Regional Category
% of Score ‐ Division Category Reasoning
Benefit/Cost
Ann. Avg. trips per vehicle x life expectancy/state match amt (Demand Response); Ridership for life of vehicle/state match amt (Fixed Route); Route ridership on the existing route for the life of the vehicle/the state match amt (Headway Reduction) 45% 25% Benefit/Cost
Ann. Avg. trips per vehicle x life expectancy/state match amt (Demand Response); Ridership for life of vehicle/state match amt (Fixed Route); Route ridership on the existing route for the life of the vehicle/the state match amt (Headway Reduction) 32.1% 25%
Vehicle Utilization Data
Max vehicles utilized during peak hr/total fleet size (DR); # vehicles operated at max service/# vehicles available at max service (FR) 5% 5%
Vehicle Utilization Data
Max vehicles utilized during peak hr/total fleet size (DR); # vehicles operated at max service/# vehicles available at max service (FR) 3.6% 5%
System Safety
(National average reportable incidents/PMT – System reported incidents/PMT) + (National average reportable injuries/PMT – System reported injuries/PMT) + (National average reportable fatalities/PMT – System reported fatalities/PMT) = Safety Result. 5% 5% System Safety
(National average reportable incidents/PMT – System reported incidents/PMT) + (National average reportable injuries/PMT – System reported injuries/PMT) + (National average reportable fatalities/PMT – System reported fatalities/PMT) = Safety Result. 3.6% 5%
Connectivity
Projected increase in ridership weighted according to the types of destinations the expansion of service will serve. (20% per destination: medical, employment, commercial, education, and other transportation terminal/transfer):(Ridership Increase x Facility Destination) / System Ridership = Weighted % Increase in Ridership 5% 5% Connectivity
Projected increase in ridership weighted according to the types of destinations the expansion of service will serve. (20% per destination: medical, employment, commercial, education, and other transportation terminal/transfer):(Ridership Increase x Facility Destination) / System Ridership = Weighted % Increase in Ridership 3.6% 5%
System Operational Efficiency
Annual ridership / total hours.Demand Response = Trips / Service HoursFixed Route = Trips / Revenue Hours 10% 10%
System Operational Efficiency
Annual ridership / total hours.Demand Response = Trips / Service HoursFixed Route = Trips / Revenue Hours 7.1% 10%
Fleet Age Variable points based on average fleet age. 10% 10% Older fleets will benefit from new expansion vehicles.Transit Dependency Index Percentage
TDIP includes: no vehicle households, elderly population, youth population, persons with disabilities population, below‐poverty population. 10% 10%
Direct transit resources towards transit dependent population areas.
Local System Priority
Allow each transit agency to prioritize their projects and identify which projects they expect to be able to provide federal funding towards. 30% 30%
Almost all projects require significant federal funding which is directly allocated to the transit agencies through the MPO. Transit systems will decide how to allocate the federal funding among their priorities. Want consistency between the MPO score and the local priority.
Division Rank 15% 25%MPO Rank 15% 25%Total 100% 100% 100% 100%
not included
Include all SPOT metrics to make the composite SPOT quantitative score equal to half of the MPO score. Want consistency between the MPO score and SPOT quantitative score.
Proposed DCHC MPO Project Ranking Methodology
not included
NCDOT SPOT Prioritization 3.0
not included
Per STI legislation, no public transit is categorized as Statewide.
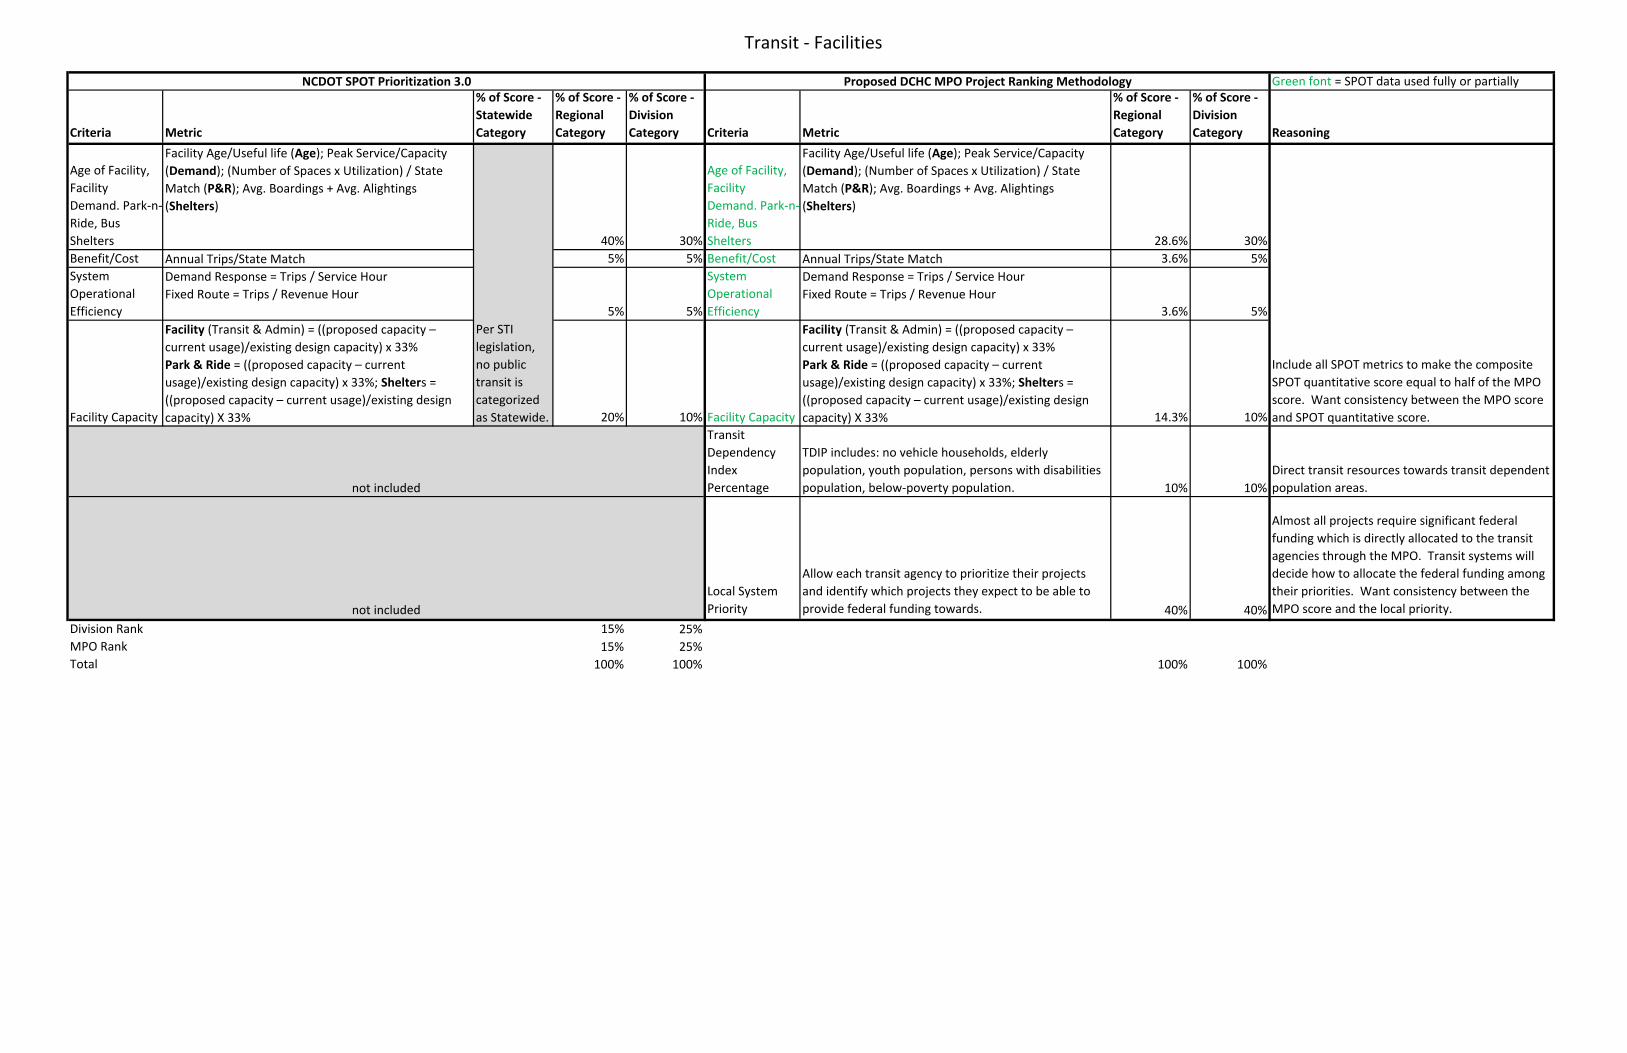
Transit ‐ Facilities
Green font = SPOT data used fully or partially
Criteria Metric
% of Score ‐ Statewide Category
% of Score ‐ Regional Category
% of Score ‐ Division Category Criteria Metric
% of Score ‐ Regional Category
% of Score ‐ Division Category Reasoning
Age of Facility, Facility Demand. Park‐n‐Ride, Bus Shelters
Facility Age/Useful life (Age); Peak Service/Capacity (Demand); (Number of Spaces x Utilization) / State Match (P&R); Avg. Boardings + Avg. Alightings (Shelters)
40% 30%
Age of Facility, Facility Demand. Park‐n‐Ride, Bus Shelters
Facility Age/Useful life (Age); Peak Service/Capacity (Demand); (Number of Spaces x Utilization) / State Match (P&R); Avg. Boardings + Avg. Alightings (Shelters)
28.6% 30%Benefit/Cost Annual Trips/State Match 5% 5% Benefit/Cost Annual Trips/State Match 3.6% 5%System Operational Efficiency
Demand Response = Trips / Service HourFixed Route = Trips / Revenue Hour
5% 5%
System Operational Efficiency
Demand Response = Trips / Service HourFixed Route = Trips / Revenue Hour
3.6% 5%
Facility Capacity
Facility (Transit & Admin) = ((proposed capacity – current usage)/existing design capacity) x 33% Park & Ride = ((proposed capacity – current usage)/existing design capacity) x 33%; Shelters = ((proposed capacity – current usage)/existing design capacity) X 33% 20% 10% Facility Capacity
Facility (Transit & Admin) = ((proposed capacity – current usage)/existing design capacity) x 33% Park & Ride = ((proposed capacity – current usage)/existing design capacity) x 33%; Shelters = ((proposed capacity – current usage)/existing design capacity) X 33% 14.3% 10%
Transit Dependency Index Percentage
TDIP includes: no vehicle households, elderly population, youth population, persons with disabilities population, below‐poverty population. 10% 10%
Direct transit resources towards transit dependent population areas.
Local System Priority
Allow each transit agency to prioritize their projects and identify which projects they expect to be able to provide federal funding towards. 40% 40%
Almost all projects require significant federal funding which is directly allocated to the transit agencies through the MPO. Transit systems will decide how to allocate the federal funding among their priorities. Want consistency between the MPO score and the local priority.
Division Rank 15% 25%MPO Rank 15% 25%Total 100% 100% 100% 100%
Proposed DCHC MPO Project Ranking MethodologyNCDOT SPOT Prioritization 3.0
Per STI legislation, no public transit is categorized as Statewide.
not included
Include all SPOT metrics to make the composite SPOT quantitative score equal to half of the MPO score. Want consistency between the MPO score and SPOT quantitative score.
not included
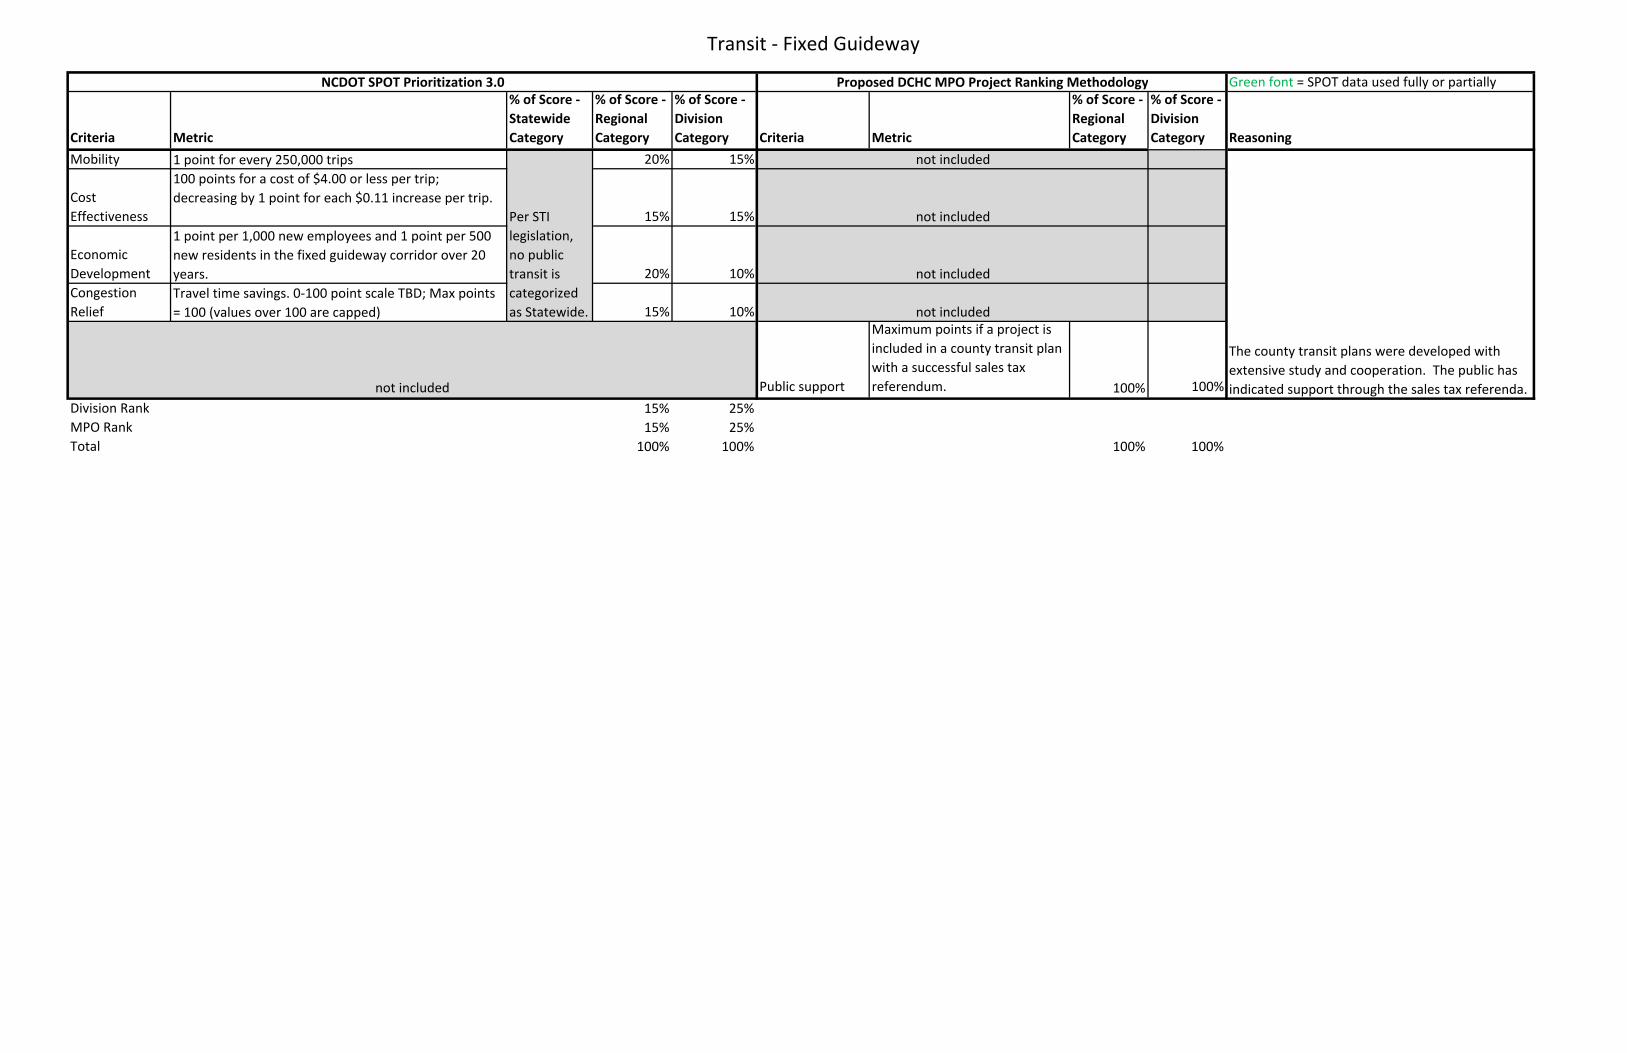
Transit ‐ Fixed Guideway
Green font = SPOT data used fully or partially
Criteria Metric
% of Score ‐ Statewide Category
% of Score ‐ Regional Category
% of Score ‐ Division Category Criteria Metric
% of Score ‐ Regional Category
% of Score ‐ Division Category Reasoning
Mobility 1 point for every 250,000 trips 20% 15%
Cost Effectiveness
100 points for a cost of $4.00 or less per trip; decreasing by 1 point for each $0.11 increase per trip.
15% 15%
Economic Development
1 point per 1,000 new employees and 1 point per 500 new residents in the fixed guideway corridor over 20 years. 20% 10%
Congestion Relief
Travel time savings. 0‐100 point scale TBD; Max points = 100 (values over 100 are capped) 15% 10%
Public support
Maximum points if a project is included in a county transit plan with a successful sales tax referendum. 100% 100%
Division Rank 15% 25%MPO Rank 15% 25%Total 100% 100% 100% 100%
The county transit plans were developed with extensive study and cooperation. The public has indicated support through the sales tax referenda.not included
Proposed DCHC MPO Project Ranking MethodologyNCDOT SPOT Prioritization 3.0
Per STI legislation, no public transit is categorized as Statewide.
not included
not included
not included
not included
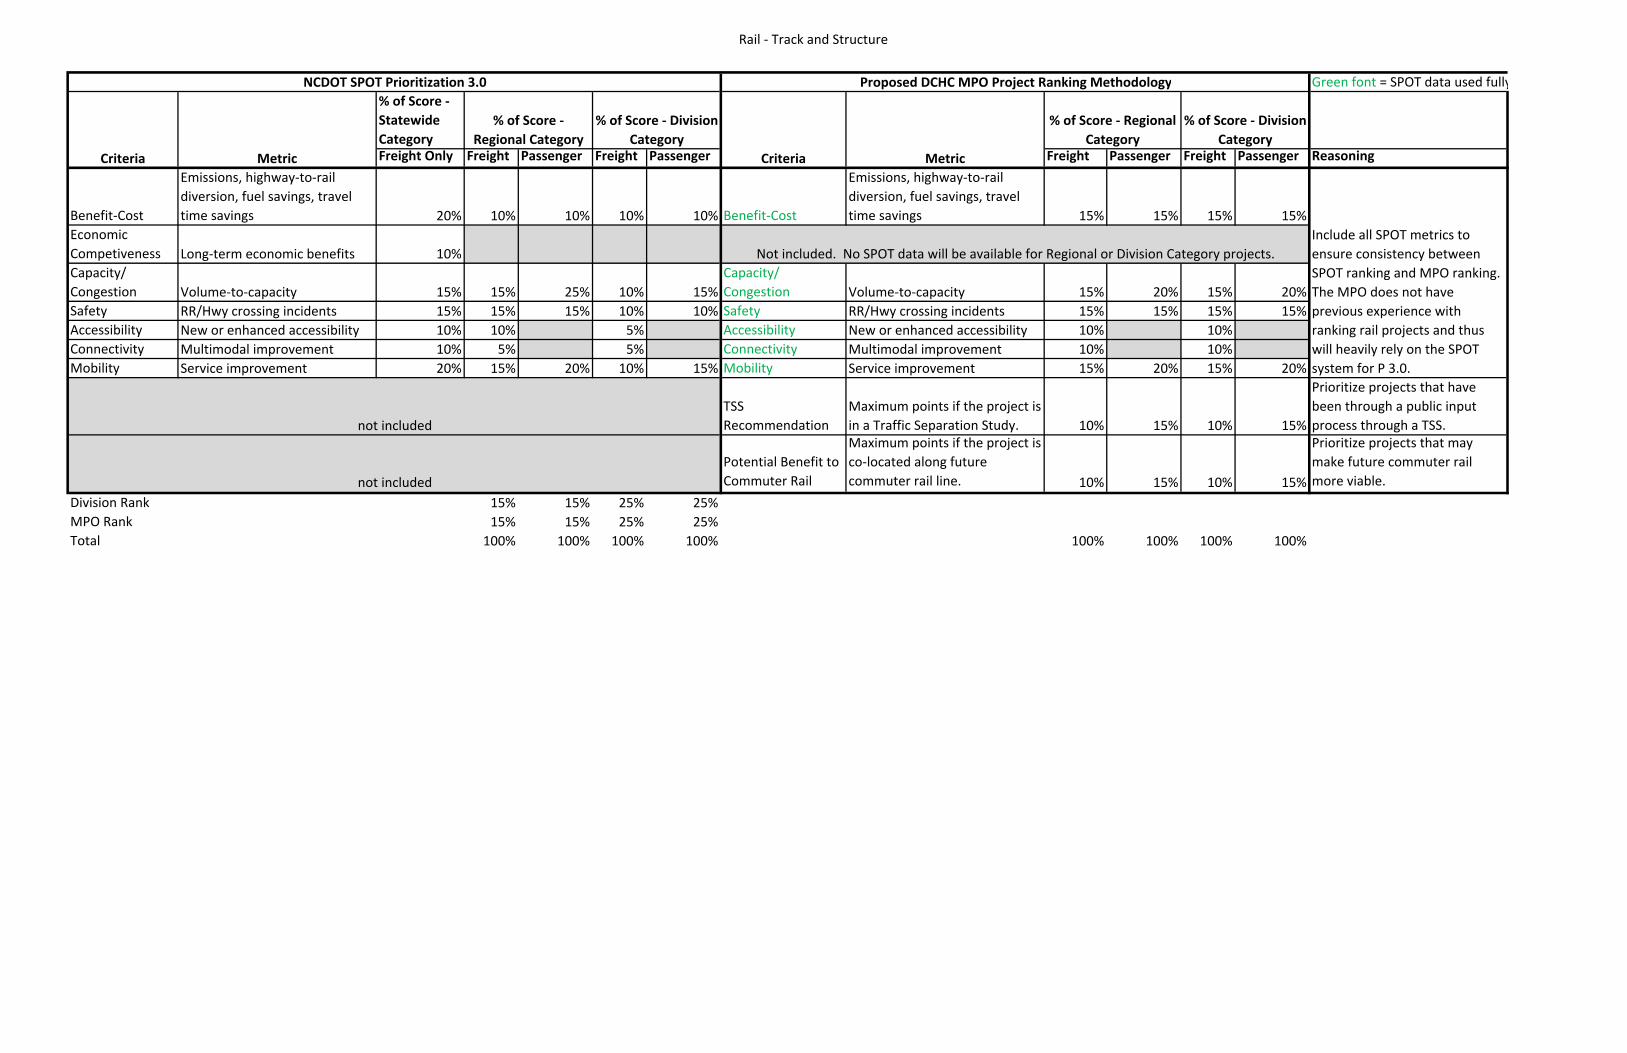
Rail ‐ Track and Structure
Green font = SPOT data used fully% of Score ‐ Statewide CategoryFreight Only Freight Passenger Freight Passenger Freight Passenger Freight Passenger Reasoning
Benefit‐Cost
Emissions, highway‐to‐rail diversion, fuel savings, travel time savings 20% 10% 10% 10% 10% Benefit‐Cost
Emissions, highway‐to‐rail diversion, fuel savings, travel time savings 15% 15% 15% 15%
Economic Competiveness Long‐term economic benefits 10%Capacity/ Congestion Volume‐to‐capacity 15% 15% 25% 10% 15%
Capacity/ Congestion Volume‐to‐capacity 15% 20% 15% 20%
Safety RR/Hwy crossing incidents 15% 15% 15% 10% 10% Safety RR/Hwy crossing incidents 15% 15% 15% 15%Accessibility New or enhanced accessibility 10% 10% 5% Accessibility New or enhanced accessibility 10% 10%Connectivity Multimodal improvement 10% 5% 5% Connectivity Multimodal improvement 10% 10%Mobility Service improvement 20% 15% 20% 10% 15% Mobility Service improvement 15% 20% 15% 20%
TSS Recommendation
Maximum points if the project is in a Traffic Separation Study. 10% 15% 10% 15%
Prioritize projects that have been through a public input process through a TSS.
Potential Benefit to Commuter Rail
Maximum points if the project is co‐located along future commuter rail line. 10% 15% 10% 15%
Prioritize projects that may make future commuter rail more viable.
Division Rank 15% 15% 25% 25%MPO Rank 15% 15% 25% 25%Total 100% 100% 100% 100% 100% 100% 100% 100%
Include all SPOT metrics to ensure consistency between SPOT ranking and MPO ranking. The MPO does not have previous experience with ranking rail projects and thus will heavily rely on the SPOT system for P 3.0.
% of Score ‐ Division Category
Not included. No SPOT data will be available for Regional or Division Category projects.
Proposed DCHC MPO Project Ranking Methodology
not included
Criteria Metric
% of Score ‐ Regional Category
not included
% of Score ‐ Regional Category
% of Score ‐ Division Category
NCDOT SPOT Prioritization 3.0
MetricCriteria
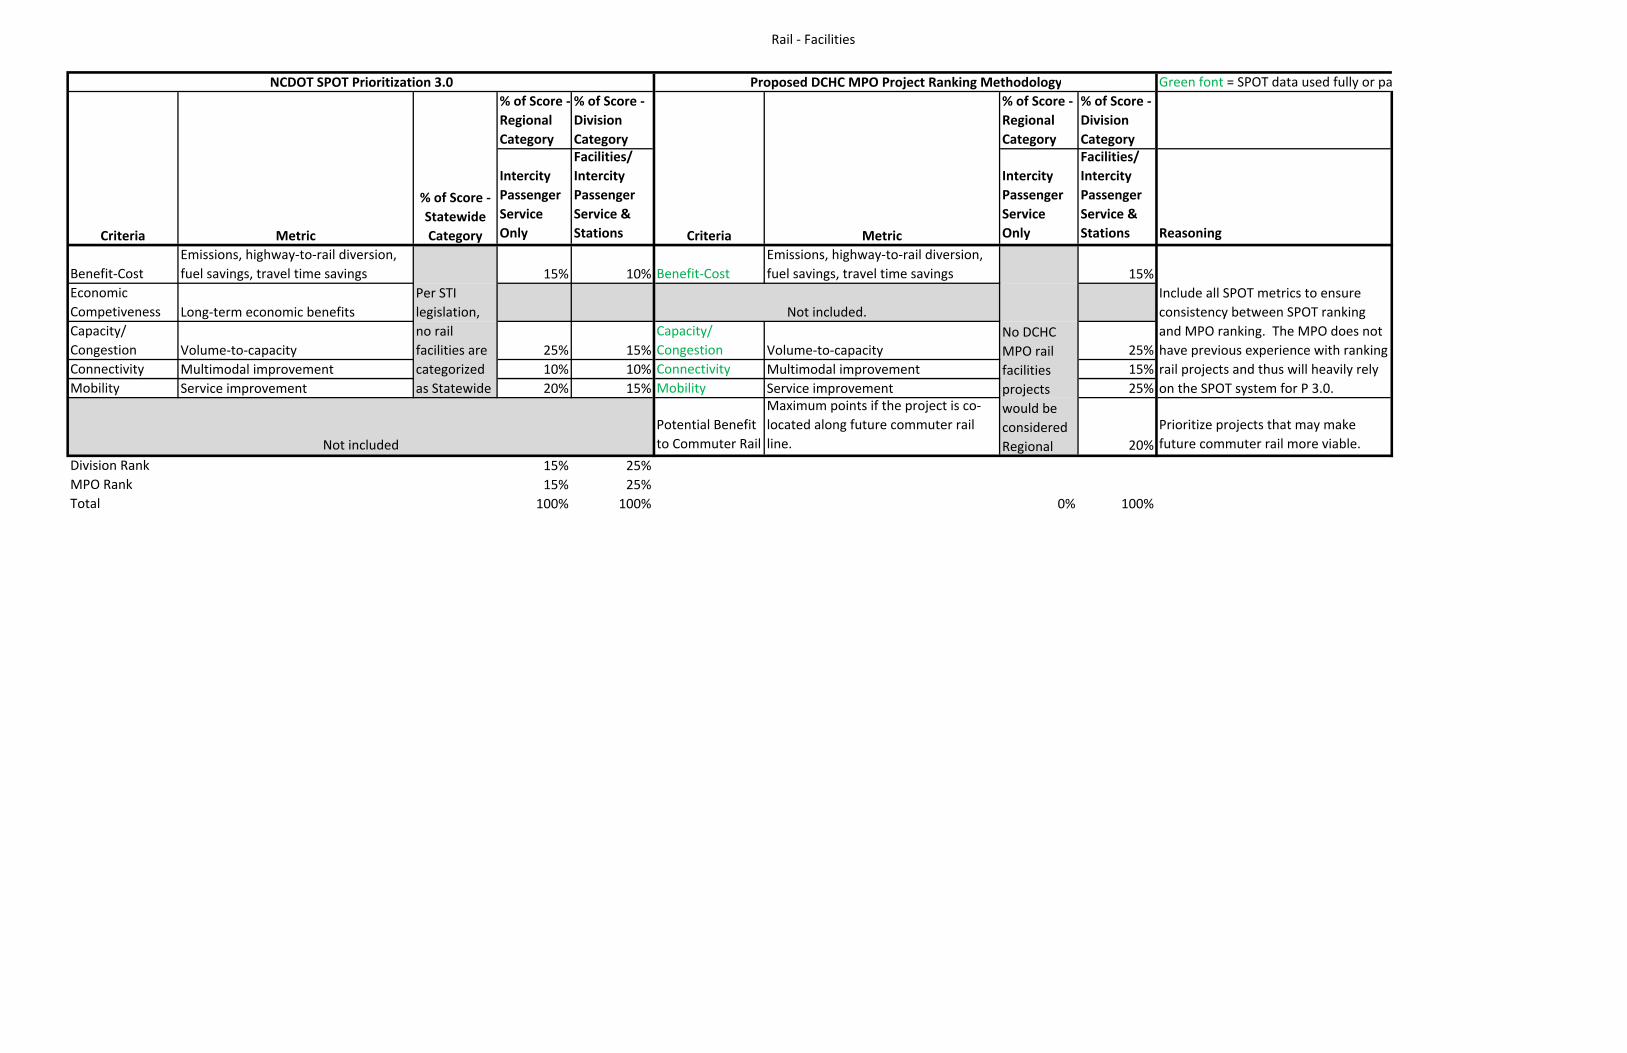
Rail ‐ Facilities
Green font = SPOT data used fully or pa% of Score ‐ Regional Category
% of Score ‐ Division Category
% of Score ‐ Regional Category
% of Score ‐ Division Category
Intercity Passenger Service Only
Facilities/ Intercity Passenger Service & Stations
Intercity Passenger Service Only
Facilities/ Intercity Passenger Service & Stations Reasoning
Benefit‐CostEmissions, highway‐to‐rail diversion, fuel savings, travel time savings 15% 10% Benefit‐Cost
Emissions, highway‐to‐rail diversion, fuel savings, travel time savings 15%
Economic Competiveness Long‐term economic benefitsCapacity/ Congestion Volume‐to‐capacity 25% 15%
Capacity/ Congestion Volume‐to‐capacity 25%
Connectivity Multimodal improvement 10% 10% Connectivity Multimodal improvement 15%Mobility Service improvement 20% 15% Mobility Service improvement 25%
Potential Benefit to Commuter Rail
Maximum points if the project is co‐located along future commuter rail line. 20%
Prioritize projects that may make future commuter rail more viable.
Division Rank 15% 25%MPO Rank 15% 25%Total 100% 100% 0% 100%
Include all SPOT metrics to ensure consistency between SPOT ranking and MPO ranking. The MPO does not have previous experience with ranking rail projects and thus will heavily rely on the SPOT system for P 3.0.
Not included
No DCHC MPO rail facilities projects would be considered Regional
NCDOT SPOT Prioritization 3.0 Proposed DCHC MPO Project Ranking Methodology
Criteria Metric
% of Score ‐ Statewide Category
Per STI legislation, no rail facilities are categorized as Statewide
MetricCriteria
Not included.
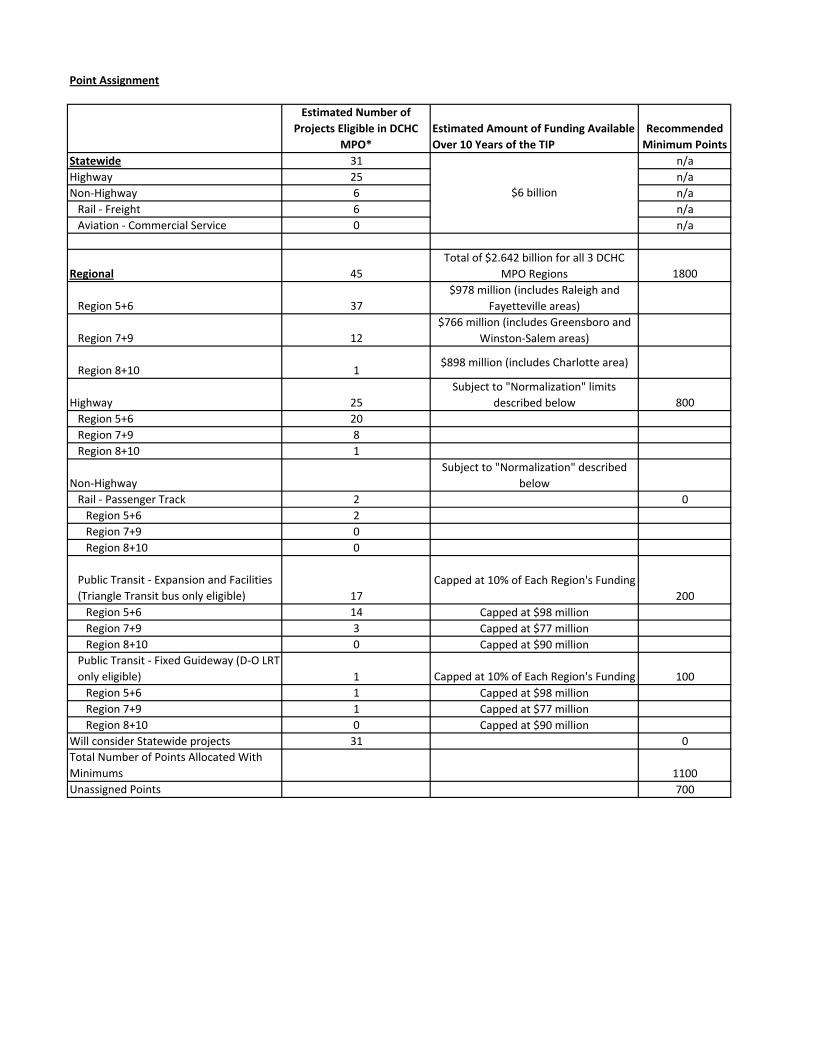
Point Assignment
Estimated Number of Projects Eligible in DCHC
MPO*Estimated Amount of Funding Available Over 10 Years of the TIP
Recommended Minimum Points
Statewide 31 n/aHighway 25 n/aNon‐Highway 6 n/aRail ‐ Freight 6 n/aAviation ‐ Commercial Service 0 n/a
Regional 45Total of $2.642 billion for all 3 DCHC
MPO Regions 1800
Region 5+6 37$978 million (includes Raleigh and
Fayetteville areas)
Region 7+9 12$766 million (includes Greensboro and
Winston‐Salem areas)
Region 8+10 1$898 million (includes Charlotte area)
Highway 25Subject to "Normalization" limits
described below 800Region 5+6 20Region 7+9 8Region 8+10 1
Non‐HighwaySubject to "Normalization" described
belowRail ‐ Passenger Track 2 0Region 5+6 2Region 7+9 0Region 8+10 0
Public Transit ‐ Expansion and Facilities (Triangle Transit bus only eligible) 17
Capped at 10% of Each Region's Funding200
Region 5+6 14 Capped at $98 millionRegion 7+9 3 Capped at $77 millionRegion 8+10 0 Capped at $90 million
Public Transit ‐ Fixed Guideway (D‐O LRT only eligible) 1 Capped at 10% of Each Region's Funding 100Region 5+6 1 Capped at $98 millionRegion 7+9 1 Capped at $77 millionRegion 8+10 0 Capped at $90 million
Will consider Statewide projects 31 0Total Number of Points Allocated With Minimums 1100Unassigned Points 700
$6 billion
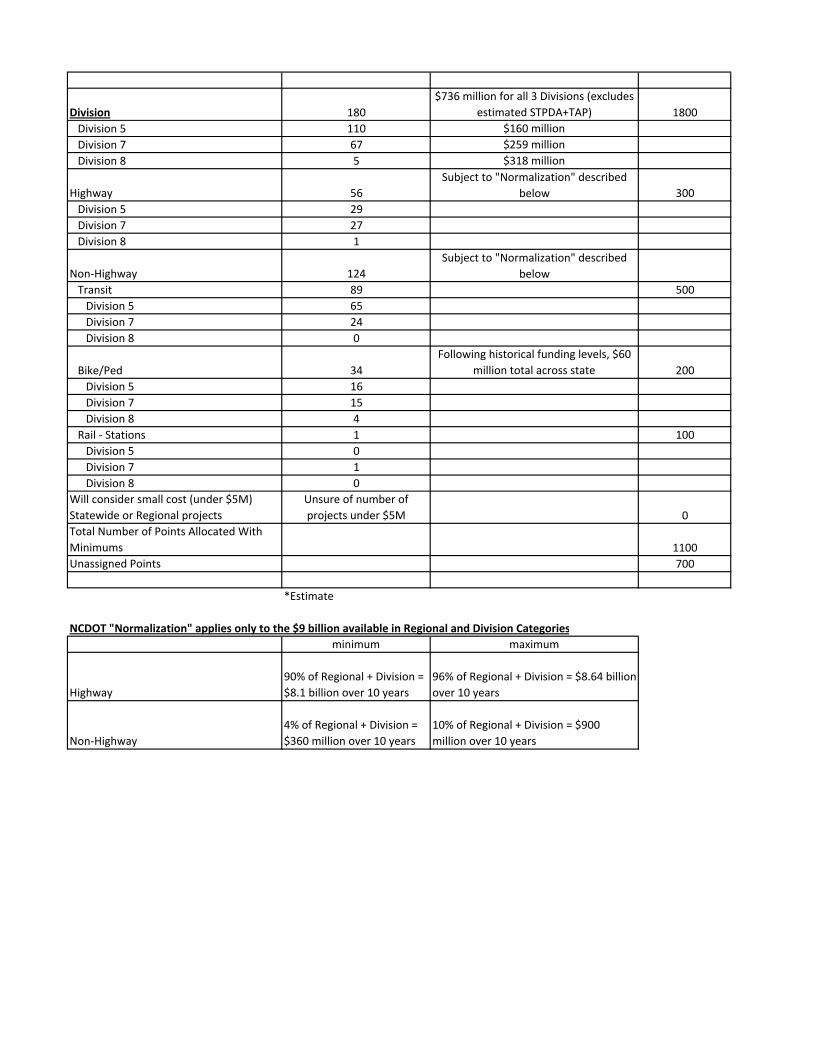
Division 180$736 million for all 3 Divisions (excludes
estimated STPDA+TAP) 1800Division 5 110 $160 millionDivision 7 67 $259 millionDivision 8 5 $318 million
Highway 56Subject to "Normalization" described
below 300Division 5 29Division 7 27Division 8 1
Non‐Highway 124Subject to "Normalization" described
belowTransit 89 500Division 5 65Division 7 24Division 8 0
Bike/Ped 34Following historical funding levels, $60
million total across state 200Division 5 16Division 7 15Division 8 4
Rail ‐ Stations 1 100Division 5 0Division 7 1Division 8 0
Will consider small cost (under $5M) Statewide or Regional projects
Unsure of number of projects under $5M 0
Total Number of Points Allocated With Minimums 1100Unassigned Points 700
*Estimate
NCDOT "Normalization" applies only to the $9 billion available in Regional and Division Categoriesminimum maximum
Highway90% of Regional + Division = $8.1 billion over 10 years
96% of Regional + Division = $8.64 billion over 10 years
Non‐Highway4% of Regional + Division = $360 million over 10 years
10% of Regional + Division = $900 million over 10 years
Related Documents