THE W ILLIAM DAVIDSON INSTITUTE AT THE UNIVERSITY OF MICHIGAN BUSINESS SCHOOL Duration and Risk of Unemployment in Argentina By: Sebastian Galiani and Hugo A. Hopenhayn William Davidson Working Paper Number 476 October 2001

Welcome message from author
This document is posted to help you gain knowledge. Please leave a comment to let me know what you think about it! Share it to your friends and learn new things together.
Transcript
THE WILLIAM DAVIDSON INSTITUTE AT THE UNIVERSITY OF MICHIGAN BUSINESS SCHOOL
Duration and Risk of Unemployment in Argentina
By: Sebastian Galiani and Hugo A. Hopenhayn
William Davidson Working Paper Number 476 October 2001
Forthcoming in the Journal of Development Economics
Duration and risk of unemployment in Argentina
Sebastian Galiani Universidad de San Andres
and
Hugo A. Hopenhayn
University of Rochester and Universidad Torcuato Di Tella
Abstract: After a decade of structural reforms, unemployment rates have tripled in Argentina. This paper is concerned with the measurement of unemployment risk and its distribution. We show the importance of considering re-incidence in the measurement of unemployment risk and develop a methodology to do that. Our estimates for Argentina show that, though the typical unemployment spell is short, once re-incidence is taken into account, unemployment risk is high, has risen substantially in the last decade and is shared very unequally in the labor force. This counters the established view that unemployment is a small risk, short-duration phenomenon, which arises when re-incidence is not considered.
Keywords: Developing labor markets, hazard functions, unemployment duration and unemployment risk. JEL classification: J0 and J6.
October 5, 2001
We thank the comments of H. Ennis and seminar participants at the Latin American Meeting of the Econometric Society. Corresponding Author: Hugo Hopenhayn, Universidad Torcuato Di Tella, Miñones 2159/77, Buenos Aires, Argentina, 1428. TE: 5411-4784-0080. FAX: 5411-4784-9807.
1. Introduction
After a decade of structural reforms in Latin American economies, there are growing
concerns about the social consequences of increased employment volatility and the
incidence of unemployment. The sharp rise in unemployment rates in Argentina lends
support to this concern. Moreover, there is a perception that unemployment risk is very
unequally distributed and that certain groups share an excess burden of the adjustment.
This paper is concerned with the measurement of unemployment risk and its distribution.
It raises some critical issues concerning the definition of unemployment risk, deals with
the corresponding methodological considerations and provides estimates for the Buenos
Aires labor market.
A standard method to evaluate unemployment risk is to consider the incidence of
unemployment and its duration. Even when incidence may be high, it is usually
understood that if unemployment spells are short-lived, the social cost of a typical
unemployment spell is low. This paper shows that this reasoning is misleading when the
typical employment spell is also short-lived. In such case, a correct account of
unemployment risk must take into consideration the re-incidence of unemployment
spells. Our estimates for the Buenos Aires labor market show that, contrary to the view
that unemployment spells are short, total expected duration, accounting for repeated
spells, is indeed long.
In this paper, we study the conditional distribution of total unemployment time for a
two-year period. Using panel data from household surveys for the Buenos Aires area1 for
the period 1989-1998, we estimate a Markov process for transitions from employment to
1 This market covers approximately half of the labor force of the country.
1
jaygot
William Davidson Institute Working Paper 476
unemployment (and vice versa) that allow for duration dependence. From these estimates
we obtain a distribution for the number of incidences and total unemployment time that
someone entering unemployment will experience in the following two years.
We find that the median worker entering unemployment in 1998 has a total of 3
unemployment spells in the following two years and a total cumulative duration of 6.3
months. A worker with college education experiences 2 unemployment spells and 40
percent less time out of work. In contrast, the median young worker with low schooling
exhibits 6 spells of unemployment and a total cumulative duration of 9.2 months. Our
estimates also show the importance of long-term unemployment: of all workers
unemployed at a given point in time, 34 percent spent more than one year of
unemployment during the past two years. This figure is much closer to the high numbers
found in European economies. Finally, comparing the first and last period of our sample,
the median number of spells over the two-year period increased 50 percent while median
cumulative unemployment duration increased by 43 percent.
2. Motivation
As a point of reference, consider European labor markets, which have experienced
high unemployment rates since the mid-seventies. A salient characteristic of the high
unemployment era has been the high proportion of long-term unemployment. Certainly,
this feature made the European unemployment performance particularly problematic:
although there have been other periods of high unemployment rates, long-term
unemployment seems to be a characteristic of the last decades.2
2 That is, controlling for the unemployment rate, long spells of unemployment were less important before the mid-seventies than later (cf. Machin and Manning, 2000). Generous unemployment insurance has been
2
jaygot
William Davidson Institute Working Paper 476
Some developing countries (like Argentina) have also experienced episodes of high
unemployment rates during the 90s. The lack of well-developed social security systems
in those countries may suggest that most unemployment episodes are of a short-run
nature. Indeed, the evidence of high flows in and out of unemployment confirms this
hypothesis (see section 3). The Argentine case is particularly striking; the monthly inflow
rate to unemployment has been over 2 percent since the beginning of the nineties and
grew to 4 percent by the middle of the decade (see section 3).3 As it is well known,
ceteris paribus, a high inflow rate implies low average unemployment duration. In steady
state, the average duration of all episodes of unemployment equals the ratio of the
unemployment rate to the inflow rate.
Table 1 presents average unemployment rates as well as short and long-term
unemployment rates for OECD countries along with the Argentine figures for the period
1989-1998. This data show that the incidence of long-term unemployment in Argentina is
substantially lower than in most European countries and it is similar to that of the US.
Notice that, for example, the incidence of long-term unemployment for the OECD
countries with an average unemployment rate over 10 percent is 45 percent, three times
the Argentine incidence rate. Thus, by looking at these statistics, Argentina seems to be a
country where unemployment is mostly a short-term phenomenon.4
blamed for this long duration. There is ample evidence suggesting that both the levels of unemployment benefits and the entitlement duration increase the duration of individual unemployment spells (cf. e.g. Narendranathan et al., 1985; Katz and Meyer, 1990; Meyer, 1990 and Carling et al., 1996). 3 Most Latin American countries seem to have high inflow rates to unemployment in comparison to developed countries. For example, the average inflow rate to unemployment in Uruguay during the nineties has been 2 percent while the average steady state unemployment duration of all completed spells is 6 months. 4 Indeed, the statistics reported in Table 1 refer to the length of the episodes of unemployment in progress. However, due to the extremely high inflow rates observed in Argentina, the average length of all spells is lower than the average length of the episodes in progress (see section 3). Akerlof and Main (1980) present a good discussion of the differences between these two statistics.
3
jaygot
William Davidson Institute Working Paper 476
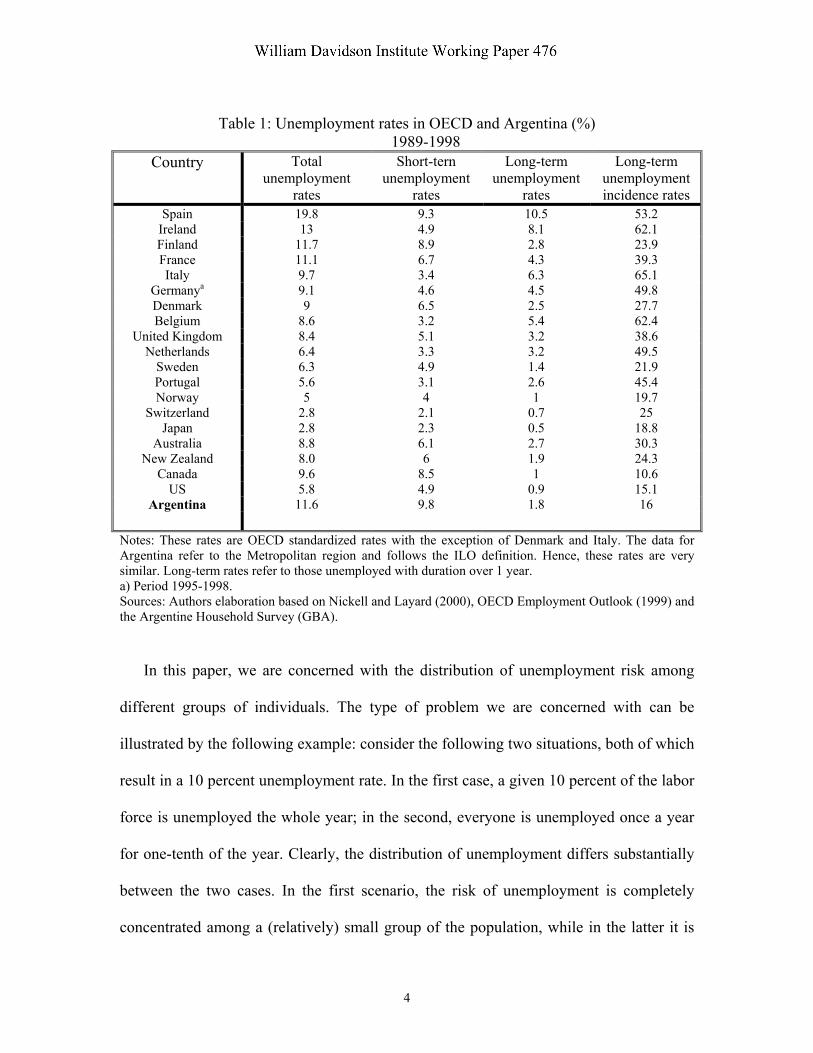
Table 1: Unemployment rates in OECD and Argentina (%)
1989-1998 Country Total
unemployment rates
Short-tern unemployment
rates
Long-term unemployment
rates
Long-term unemployment incidence rates
Spain 19.8 9.3 10.5 53.2 Ireland 13 4.9 8.1 62.1 Finland 11.7 8.9 2.8 23.9 France 11.1 6.7 4.3 39.3 Italy 9.7 3.4 6.3 65.1
Germanya 9.1 4.6 4.5 49.8 Denmark 9 6.5 2.5 27.7 Belgium 8.6 3.2 5.4 62.4
United Kingdom 8.4 5.1 3.2 38.6 Netherlands 6.4 3.3 3.2 49.5
Sweden 6.3 4.9 1.4 21.9 Portugal 5.6 3.1 2.6 45.4 Norway 5 4 1 19.7
Switzerland 2.8 2.1 0.7 25 Japan 2.8 2.3 0.5 18.8
Australia 8.8 6.1 2.7 30.3 New Zealand 8.0 6 1.9 24.3
Canada 9.6 8.5 1 10.6 US 5.8 4.9 0.9 15.1
Argentina 11.6 9.8 1.8 16
Notes: These rates are OECD standardized rates with the exception of Denmark and Italy. The data for Argentina refer to the Metropolitan region and follows the ILO definition. Hence, these rates are very similar. Long-term rates refer to those unemployed with duration over 1 year. a) Period 1995-1998. Sources: Authors elaboration based on Nickell and Layard (2000), OECD Employment Outlook (1999) and the Argentine Household Survey (GBA).
In this paper, we are concerned with the distribution of unemployment risk among
different groups of individuals. The type of problem we are concerned with can be
illustrated by the following example: consider the following two situations, both of which
result in a 10 percent unemployment rate. In the first case, a given 10 percent of the labor
force is unemployed the whole year; in the second, everyone is unemployed once a year
for one-tenth of the year. Clearly, the distribution of unemployment differs substantially
between the two cases. In the first scenario, the risk of unemployment is completely
concentrated among a (relatively) small group of the population, while in the latter it is
4
jaygot
William Davidson Institute Working Paper 476
uniformly distributed among all individuals. Specifically, we deal with the following
question: what groups are at risk of being unemployed high proportions of a given period
of time?
One could conclude that in countries with high long-term incidence rates, the risk of
unemployment is highly concentrated among small groups of workers, while in countries
with high turnover and low long-term incidence rates, unemployment risk is more evenly
distributed among the population. This paper argues that such a simple characterization
of the labor market behavior could be misleading, at least for Argentina, and most likely
also for other countries with high turnover rates. We show that even in a country where
the inflow rate to unemployment is over 2 percent, the risk of unemployment is relatively
concentrated in the population.
As mentioned above, the key in reconciling high inflow rates and concentrated
unemployment is the fact that individuals often re-enter unemployment soon after leaving
it. It is well known that the individuals with a past record of unemployment are most
likely to be currently unemployed, a phenomenon that Heckman and Borjas (1980) have
labeled occurrence dependence. Thus, due to multiple spells, unemployment affects some
groups repeatedly, which tends to concentrate the risk of becoming unemployed.
In this regard, several authors (cf. e.g. Clark and Summers, 1979; Johnson and
Layard, 1986 and Machin and Manning, 2000) have argued that the distribution of
individuals unemployed at a point in time should be analyzed according to the amount of
time those individuals will be unemployed in a certain period of time and not according
to the duration of the current spell. Clark and Summers (1979), for example, estimate that
5
jaygot
William Davidson Institute Working Paper 476
in United States, the average person unemployed at a point in time during the period
1965-68 spent one-quarter of those 4 years unemployed.
Thus, especially in countries with high turnover, where the average duration of
unemployment is low, a good indicator of long-term unemployment is the proportion of
time an individual has been unemployed over a certain period of time.
3. The facts
The period we consider is marked by a sizable increase in unemployment. The
unemployment rate rose from nearly 6 percent at the end of the eighties to around 15
percent towards the end of the nineties (see Figure 1, panel a).
All major groups in the labor force increased their unemployment rate. The change
was the sharpest among high-age individuals, especially females. Although the female
participation rate grew since the mid-eighties, that growth accelerated during the nineties
(the largest proportional increase in the female participation rates occurred among the
oldest groups). However, using transition matrix analysis, we estimate that for the
population as a whole, the higher labor force participation rate numerically explains only
a third of the increase in unemployment. Instead, the predominant factor in explaining the
increase in unemployment during the nineties is the rise in the job destruction rate. This
result is consistent with the rising trend in the inflow rate to unemployment observed
during the nineties (see Figure 1, panel b).5,6
5 The number of unemployed for less than one month is used as a proxy for inflows. This is a useful measure but it does underestimate somewhat the number of inflows, because persons who became unemployed but find a job in less than a month may not be included. 6 For simplicity, we compute the inflow rate to unemployment as the ratio of the monthly inflow to the labor force instead to employment. This convention facilitates steady state computations.
6
jaygot
William Davidson Institute Working Paper 476
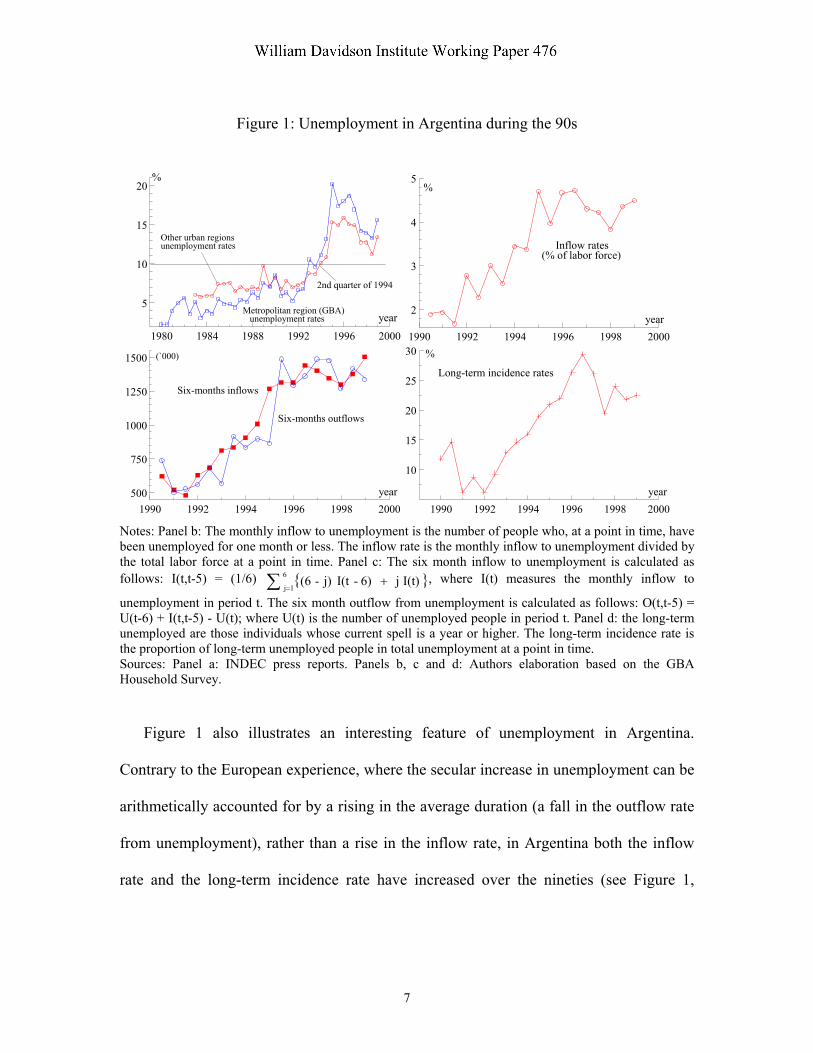
Figure 1: Unemployment in Argentina during the 90s
1980 1984 1988 1992 1996 2000
5
10
15
20
Metropolitan region (GBA) unemployment rates year
2nd quarter of 1994
%
Other urban regionsunemployment rates
1990 1992 1994 1996 1998 2000
2
3
4
5
Inflow rates(% of labor force)
year
%
1990 1992 1994 1996 1998 2000500
750
1000
1250
1500
year
Six-months outflows
Six-months inflows
(`000)
1990 1992 1994 1996 1998 2000
10
15
20
25
30
year
%
Long-term incidence rates
Notes: Panel b: The monthly inflow to unemployment is the number of people who, at a point in time, have been unemployed for one month or less. The inflow rate is the monthly inflow to unemployment divided by the total labor force at a point in time. Panel c: The six month inflow to unemployment is calculated as follows: I(t,t-5) = (1/6) { }I(t)j6)-I(tj)-(66
1j=+∑ , where I(t) measures the monthly inflow to
unemployment in period t. The six month outflow from unemployment is calculated as follows: O(t,t-5) = U(t-6) + I(t,t-5) - U(t); where U(t) is the number of unemployed people in period t. Panel d: the long-term unemployed are those individuals whose current spell is a year or higher. The long-term incidence rate is the proportion of long-term unemployed people in total unemployment at a point in time. Sources: Panel a: INDEC press reports. Panels b, c and d: Authors elaboration based on the GBA Household Survey.
Figure 1 also illustrates an interesting feature of unemployment in Argentina.
Contrary to the European experience, where the secular increase in unemployment can be
arithmetically accounted for by a rising in the average duration (a fall in the outflow rate
from unemployment), rather than a rise in the inflow rate, in Argentina both the inflow
rate and the long-term incidence rate have increased over the nineties (see Figure 1,
7
jaygot
William Davidson Institute Working Paper 476
panels b and d). Nevertheless, the long-term unemployment incidence rates are well
below the numbers observed for most countries in continental Europe.
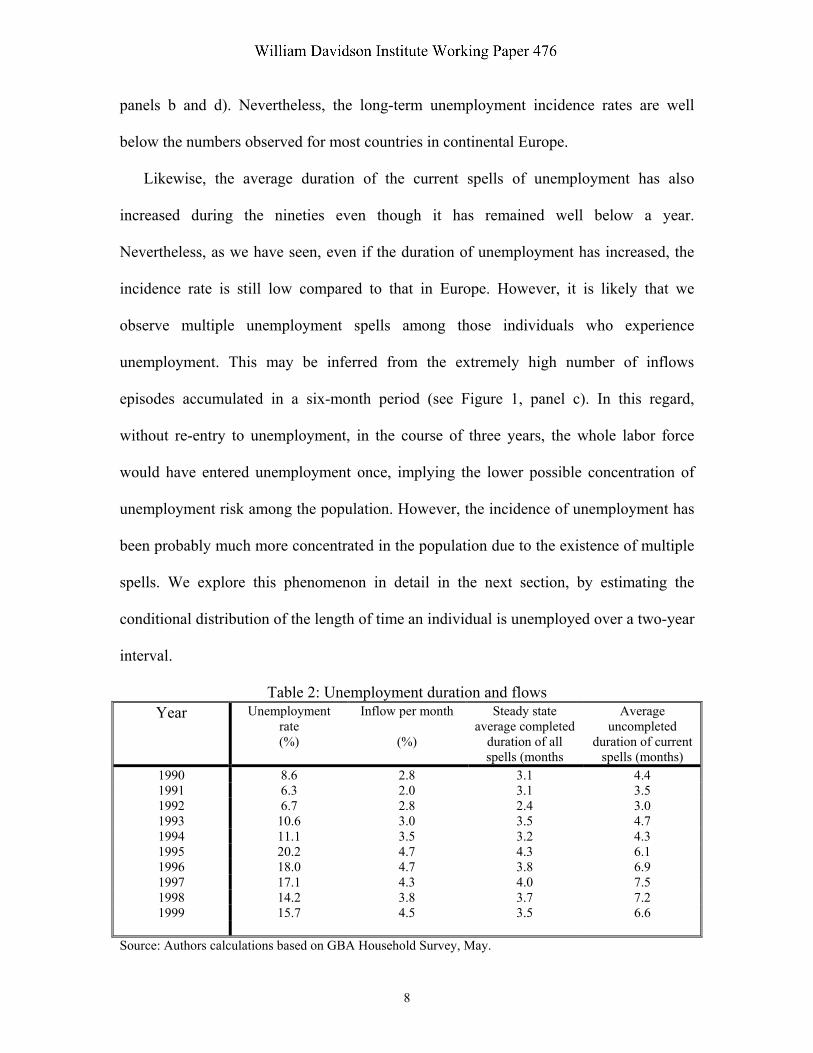
Likewise, the average duration of the current spells of unemployment has also
increased during the nineties even though it has remained well below a year.
Nevertheless, as we have seen, even if the duration of unemployment has increased, the
incidence rate is still low compared to that in Europe. However, it is likely that we
observe multiple unemployment spells among those individuals who experience
unemployment. This may be inferred from the extremely high number of inflows
episodes accumulated in a six-month period (see Figure 1, panel c). In this regard,
without re-entry to unemployment, in the course of three years, the whole labor force
would have entered unemployment once, implying the lower possible concentration of
unemployment risk among the population. However, the incidence of unemployment has
been probably much more concentrated in the population due to the existence of multiple
spells. We explore this phenomenon in detail in the next section, by estimating the
conditional distribution of the length of time an individual is unemployed over a two-year
interval.
Table 2: Unemployment duration and flows Year Unemployment
rate (%)
Inflow per month
(%)
Steady state average completed
duration of all spells (months
Average uncompleted
duration of current spells (months)
1990 8.6 2.8 3.1 4.4 1991 6.3 2.0 3.1 3.5 1992 6.7 2.8 2.4 3.0 1993 10.6 3.0 3.5 4.7 1994 11.1 3.5 3.2 4.3 1995 20.2 4.7 4.3 6.1 1996 18.0 4.7 3.8 6.9 1997 17.1 4.3 4.0 7.5 1998 14.2 3.8 3.7 7.2 1999 15.7 4.5 3.5 6.6
Source: Authors calculations based on GBA Household Survey, May.
8
jaygot
William Davidson Institute Working Paper 476
4. Modeling unemployment risk
In this section, we model the cumulative risk of unemployment. At any point in time,
a worker could be in any of two states: Employed or Unemployed.7 A Markov process
discussed in detail below determines the transition between these two states. This Markov
process allows for duration dependence, i.e. the probability of transition from one state to
the other varies with the time spent in the state of origin. The process depends on a set of
covariates that capture individual characteristics. Consider a worker that enters
unemployment. The process described above determines a distribution for the total time
spent in the unemployment state in all spells (including the starting one) over the
following two years. We focus on this measure of unemployment risk.
To study the conditional distribution of this random variable we estimate the
transition probabilities (hazard rates) between employment and unemployment by
estimating discrete time proportional hazard models. We adopt this modeling strategy
because our data is collected at discrete dates as an ordinary longitudinal survey. To
identify and efficiently estimate the parameters of our model, we exploit both the point
sample information on the states of the stochastic process studied and backward
recurrence time data on employment tenure and unemployment duration (see Magnac and
Robin, 1994). The next subsection details the statistical model estimated.
4.1. Estimating the hazard functions
Generally, the duration of unemployment (employment) is studied by specifying the
conditional probability of leaving unemployment (employment). Such hazard function
9
jaygot
William Davidson Institute Working Paper 476
models have been extensively used in the economic literature over the last two decades
(cf. e.g. Lancaster, 1990 and Heckman and Singer, 1984).
Suppose there are individuals i = 1,…,n, who each enter unemployment
(employment) at time t = 0. The instantaneous hazard rate function for person i at time t >
0 is usually assumed to take a proportional form (see Cox, 1972). We model the baseline
hazard function as a piecewise function, which is assumed constant within duration
intervals and varying between them. This feature of the baseline hazard function allows
us to introduce duration dependence in the state in a tractable way.
Consider a grid of duration periods {0 = t0 < t1 < ... < tJ}, and for j = 1,...,J let ∆j = tj –
tj-1 denote the length of each of the J intervals. Thus, the baseline hazard rate is constant
within each of these duration intervals.
Let J(t) = max {j | tj < t}, so that tJ(t) ≤ t < tJ(t) + 1. Given a vector of time-invariant
covariates x = (x1, x2) and parameters β = (β0, {βj}j = 1,...,J), the hazard rates are given by
h(t; x, β) = g(x1, β0) hJ(t)(x2, βJ(t)) (1)
where the specification adopted for the hazard functions have the usual log-linear form
h(t; x, β) = exp(β0´ x1) exp(βJ(t)´ x2) (2)
Given the above specification for the hazard rates, the (discrete-time) survival
function has exactly the following form:
7 We do not model transitions in and out of the labor force.
10
jaygot
William Davidson Institute Working Paper 476
+∆= ∑
−≤≤ 1J(t)j1J(t)J(t)2J(t)jj2j1 )t-t)(,(h),(h)g(-exp),S(t, ββββ xxxx o (3)
Our data consists of spells that may have been completed or continued between two
consecutive survey interviews. At the time of the first interview, for both employment
and unemployment spells, we have information on elapsed duration, which we denote by
t0 months. In case of continuing (incomplete) spells, elapsed duration at the time of the
second interview is given by t1 = t0 + 6, since the survey takes place every six months. As
usual, these observations can be treated as right-censored observations. In case of
completed spells, the information on the duration of the spell is limited due to interval
censoring. Letting δ denote the duration of the current spell, where δ ≥ 0, all we know is
that t1 ∈ [to, to + 6 - δ]. That is, an upper bound for the duration of the job that ended
between survey periods is given by to + 6 - δ, which would be exact if only one transition
has taken place. The sample variability of δ identifies the hazard rates.
The conditional probability of a continuing spell, (ignoring the dependence on x and
β) is given by S(to + 6)/S(to) and the conditional probability of a completed spell is given
by [S(to) - S(to + 6 - δ)]/S(to). Letting Io denote the set of individuals with continuing
spells and I1 those individuals with completed spells, the log-likelihood function is given
by:
[ ]
[ ]∑
∑
∈
∈
−−+−
+−+=
1
o
Iiiiiii
Iiiiii
),;S(tln)},;6S(t),;S(t{ln
),;S(tln), 6;S(tln);L(ln
ββδβ
βββ
xxx
xxx
i (4)
11
jaygot
William Davidson Institute Working Paper 476
Finally, note that by restricting our estimates to conditional probabilities, we
circumvent the problems associated to length bias sampling and non-stationarity of flows.
This is also the reason why we do not include in our estimates the information of the
elapsed length of the second spell for those individuals that completed the initial spell and
were in the labor force at the time of the second interview. Finally, the use of the tenure
information on states allows us to tackle the problem of interval censoring.
4.2. Hazard rate estimates
Our sample is drawn from the household survey for Greater Buenos Aires. The
survey is a rotating panel in which 25 percent of the sample is replaced during each wave
of the survey. Our sample consists of the matched rotating panels from May 1989 to
October 1998. There are a total of approximately 64.000 individuals in the sample,
evenly distributed throughout the sample period, of which over 44.000 have multiple
observations. We further restrict the sample to those individuals with ages between 21
and 65 years old. Additionally, the estimate of the hazard rate from employment is made
conditional on those individuals who are employed with a salary and are still in the labor
force the following period.8
The proportional hazard function from unemployment is a function of a set of
personal characteristics and fixed period effects while the piecewise baseline hazard
function is a function of a set of dummy variables measuring duration dependence
periods.9
8 Therefore, we exclude from the sample self-employed, owner-managers and unpaid workers 9 It is worth noting that in Argentina, the proportion of insured unemployed is extremely low (cf. Galiani and Nickell, 1999).
12
jaygot
William Davidson Institute Working Paper 476
The proportional hazard function from employment is a function of a set of personal
characteristics. The piecewise baseline hazard function also varies by duration segment.
The link function of these baseline hazards is modeled as a linear function of a dummy
variable indicating the period 1995-1998 and a constant term. The differential effect on
employment stability postulated for the period 1995-1998 is due to the changes in the
labor market legislation of 1995. This reform introduced a trial period for all employment
contracts and a wide set of fix-term contracts. There is evidence that this type of reforms
increase employment volatility. Cabrales and Hopenhayn (1997) present evidence for
Spain that shows a significant increase in the hazard rate from employment after the rules
for temporary employment were substantially relaxed. Additionally, there are well-
established theoretical arguments that show that lower job matches termination costs
implies higher turnover rates (cf. e.g. Bertola and Rogerson, 1997 and Hopenhayn and
Rogerson, 1993).
Since our objective is to model the conditional distribution of the length of time an
individual is unemployed over a two-year interval, we model the hazard functions from
both employment and unemployment as functions of individual characteristics
exclusively; that is, we do not condition them on variables that measure the
characteristics of the jobs or the job matches of the employed individuals (e.g., firm size).
Otherwise, we should also need estimates of the conditional probabilities of transiting
from one type of job or unemployment to every existing type of job.
In our empirical models, the age of the individual, the sex (a dummy that equals one
if the individual is male), and the level of education, capture the individual
characteristics. The schooling information is categorical. There is a set of dummy
13
jaygot
William Davidson Institute Working Paper 476
variables that measure the maximum level of the educational system attended by an
individual and whether or not it has been completed. The educational categories are
incomplete primary school, primary school, high school dropouts, high school,
incomplete tertiary degree and tertiary degree (Schooling i, i = 1,...,6). The base category
in the likelihood functions is the incomplete primary school (Schooling 1).
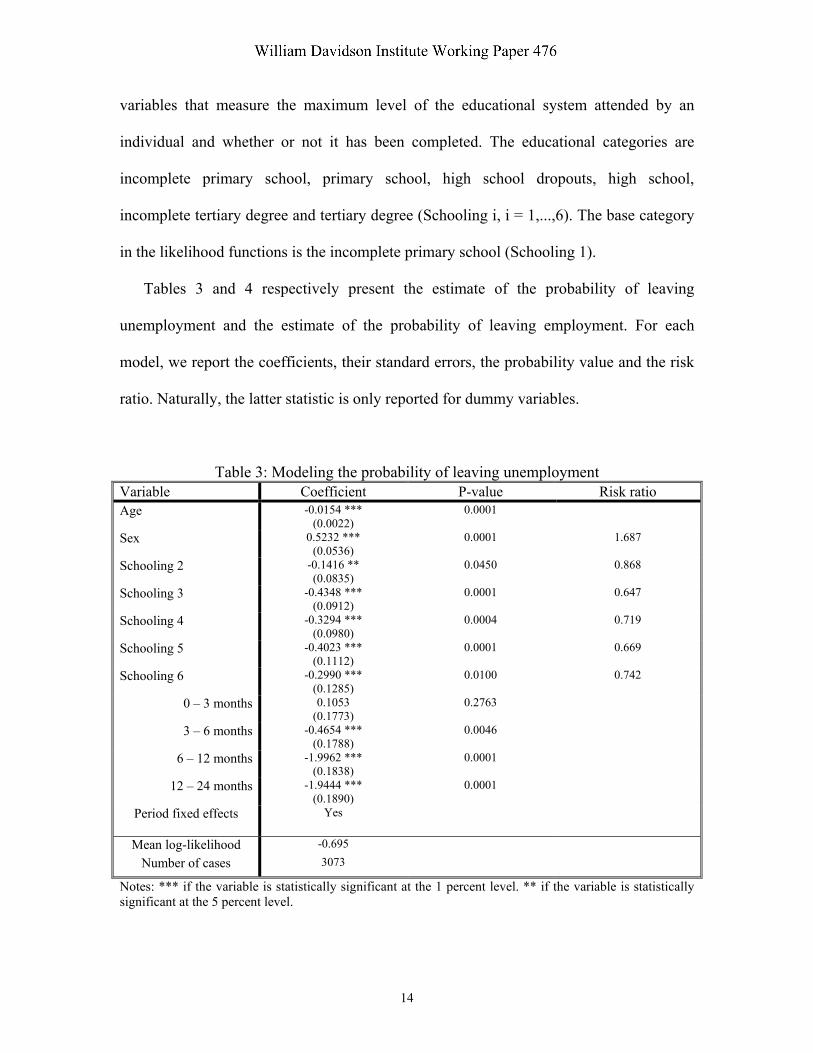
Tables 3 and 4 respectively present the estimate of the probability of leaving
unemployment and the estimate of the probability of leaving employment. For each
model, we report the coefficients, their standard errors, the probability value and the risk
ratio. Naturally, the latter statistic is only reported for dummy variables.
Table 3: Modeling the probability of leaving unemployment Variable Coefficient P-value Risk ratio Age -0.0154 ***
(0.0022) 0.0001
Sex 0.5232 *** (0.0536)
0.0001 1.687
Schooling 2 -0.1416 ** (0.0835)
0.0450 0.868
Schooling 3 -0.4348 *** (0.0912)
0.0001 0.647
Schooling 4 -0.3294 *** (0.0980)
0.0004 0.719
Schooling 5 -0.4023 *** (0.1112)
0.0001 0.669
Schooling 6 -0.2990 *** (0.1285)
0.0100 0.742
0 – 3 months 0.1053 (0.1773)
0.2763
3 – 6 months -0.4654 *** (0.1788)
0.0046
6 – 12 months -1.9962 *** (0.1838)
0.0001
12 – 24 months -1.9444 *** (0.1890)
0.0001
Period fixed effects Yes
Mean log-likelihood -0.695 Number of cases 3073
Notes: *** if the variable is statistically significant at the 1 percent level. ** if the variable is statistically significant at the 5 percent level.
14
jaygot
William Davidson Institute Working Paper 476
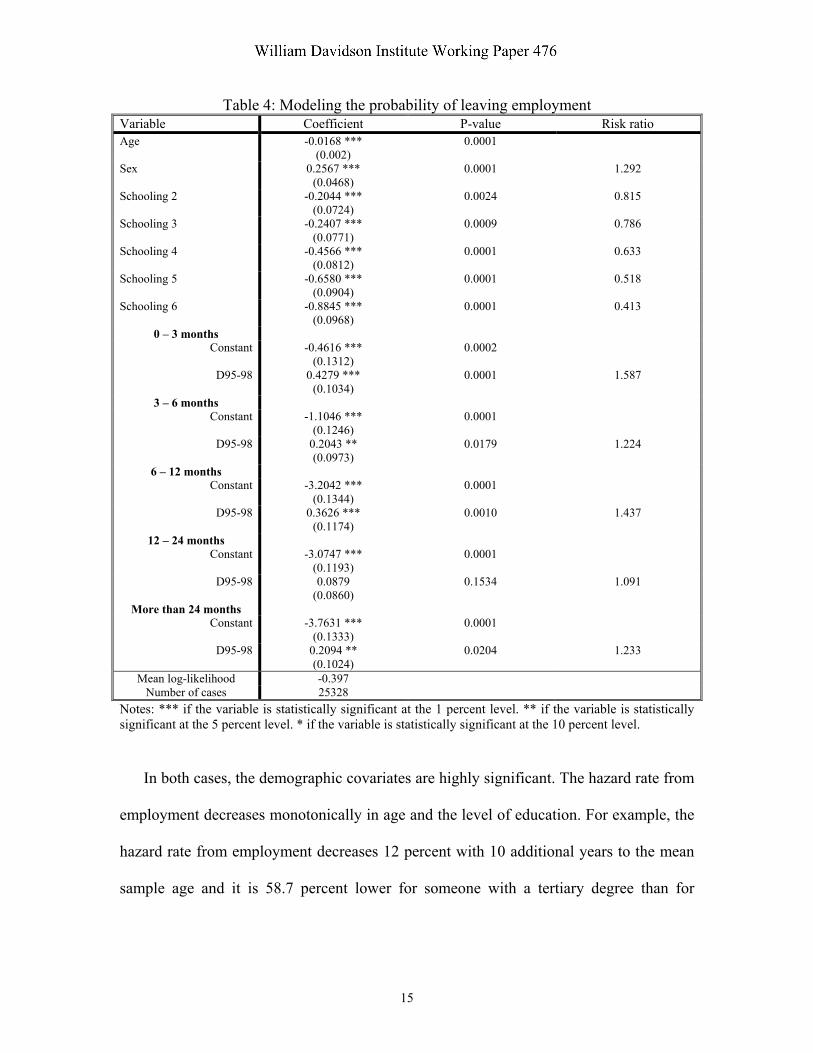
Table 4: Modeling the probability of leaving employment Variable Coefficient P-value Risk ratio Age -0.0168 ***
(0.002) 0.0001
Sex 0.2567 *** (0.0468)
0.0001 1.292
Schooling 2 -0.2044 *** (0.0724)
0.0024 0.815
Schooling 3 -0.2407 *** (0.0771)
0.0009 0.786
Schooling 4 -0.4566 *** (0.0812)
0.0001 0.633
Schooling 5 -0.6580 *** (0.0904)
0.0001 0.518
Schooling 6 -0.8845 *** (0.0968)
0.0001 0.413
0 – 3 months Constant -0.4616 ***
(0.1312) 0.0002
D95-98 0.4279 *** (0.1034)
0.0001 1.587
3 – 6 months Constant -1.1046 ***
(0.1246) 0.0001
D95-98 0.2043 ** (0.0973)
0.0179 1.224
6 – 12 months Constant -3.2042 ***
(0.1344) 0.0001
D95-98 0.3626 *** (0.1174)
0.0010 1.437
12 – 24 months Constant -3.0747 ***
(0.1193) 0.0001
D95-98 0.0879 (0.0860)
0.1534 1.091
More than 24 months Constant -3.7631 ***
(0.1333) 0.0001
D95-98 0.2094 ** (0.1024)
0.0204 1.233
Mean log-likelihood -0.397 Number of cases 25328
Notes: *** if the variable is statistically significant at the 1 percent level. ** if the variable is statistically significant at the 5 percent level. * if the variable is statistically significant at the 10 percent level.
In both cases, the demographic covariates are highly significant. The hazard rate from
employment decreases monotonically in age and the level of education. For example, the
hazard rate from employment decreases 12 percent with 10 additional years to the mean
sample age and it is 58.7 percent lower for someone with a tertiary degree than for
15
jaygot
William Davidson Institute Working Paper 476
someone with incomplete primary school.10 The hazard rate from employment is 29.2
percent higher for males than for females (see the risk ratio in table 4).
Regarding the hazard rate from unemployment, the schooling effect is not monotone
and it is somewhat ambiguous. It appears that it makes certain difference to finish
primary school, but apart from that, there are little risk differences. The hazard rate from
unemployment decreases 15 percent with 10 additional years to the mean sample age and
it is considerable higher for males than for females (68.7 percent).
Both hazard rates present strong negative duration dependence. Thus, evidently, the
probability of transiting between states is a function of the time spent in the state of
origin. Lastly, the exit rate from employment increased substantially after more flexible
contracts where introduced in 1995. For example, the hazard rate from employment of a
worker in his or her first quarter of tenure increased 58.7 percent during the period 1995-
1998.
Finally, in table 5 we present the mean survival rate both in employment and
unemployment. The unemployment survival rates confirm that the unemployment
duration of a spell is extremely low in Argentina. The employment survival rates are also
extremely low and explain why we observe the remarkably high levels of turnover in the
labor market documented in section 3. Clearly, an individual that is unemployed at least
once in a period of two years is most likely to face multiple spells during that period.
10 The percentage change in a hazard rate as a result of a dichotomic variable is given by 100 [Exponential(α) – 1], where α is the coefficient associated to the dummy variable.
16
jaygot
William Davidson Institute Working Paper 476
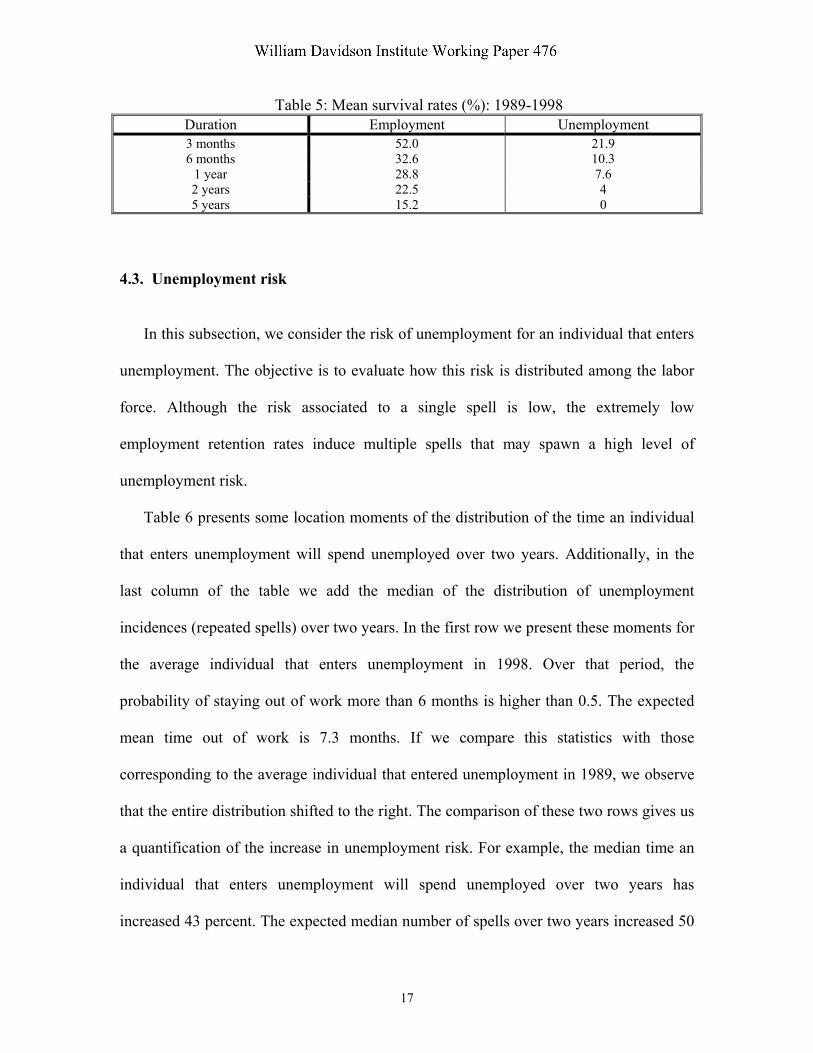
Table 5: Mean survival rates (%): 1989-1998 Duration Employment Unemployment 3 months 52.0 21.9 6 months 32.6 10.3
1 year 28.8 7.6 2 years 22.5 4 5 years 15.2 0
4.3. Unemployment risk
In this subsection, we consider the risk of unemployment for an individual that enters
unemployment. The objective is to evaluate how this risk is distributed among the labor
force. Although the risk associated to a single spell is low, the extremely low
employment retention rates induce multiple spells that may spawn a high level of
unemployment risk.
Table 6 presents some location moments of the distribution of the time an individual
that enters unemployment will spend unemployed over two years. Additionally, in the
last column of the table we add the median of the distribution of unemployment
incidences (repeated spells) over two years. In the first row we present these moments for
the average individual that enters unemployment in 1998. Over that period, the
probability of staying out of work more than 6 months is higher than 0.5. The expected
mean time out of work is 7.3 months. If we compare this statistics with those
corresponding to the average individual that entered unemployment in 1989, we observe
that the entire distribution shifted to the right. The comparison of these two rows gives us
a quantification of the increase in unemployment risk. For example, the median time an
individual that enters unemployment will spend unemployed over two years has
increased 43 percent. The expected median number of spells over two years increased 50
17
jaygot
William Davidson Institute Working Paper 476
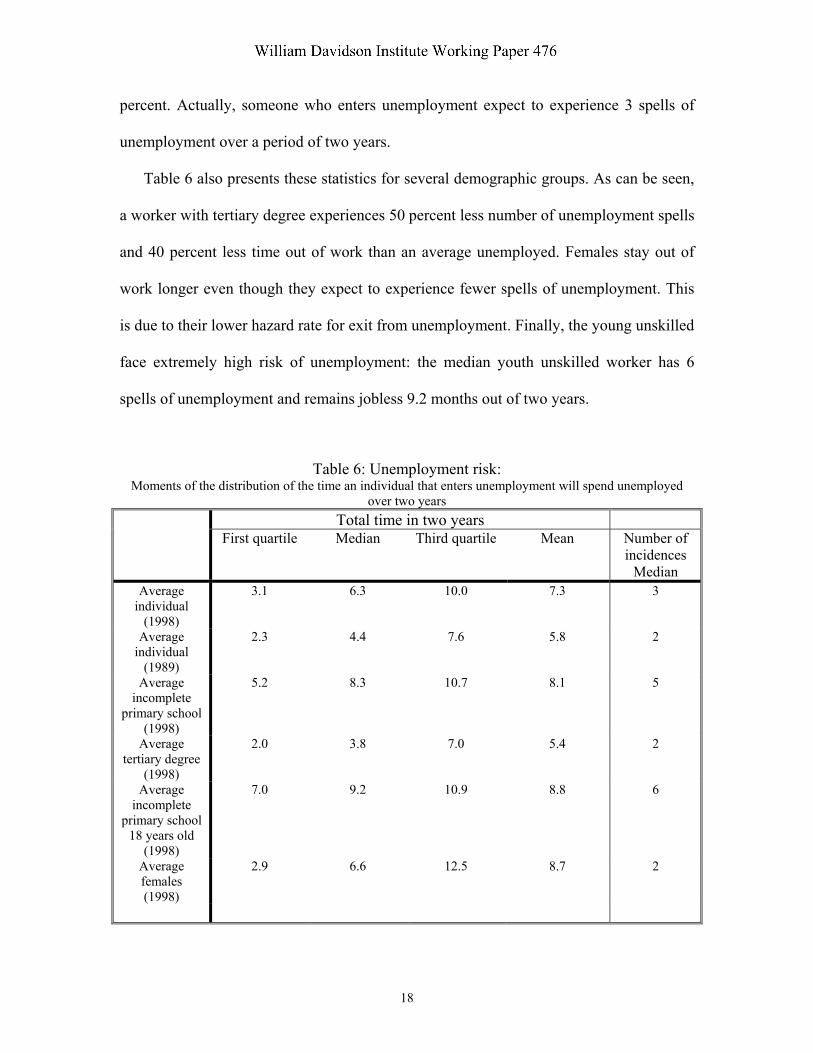
percent. Actually, someone who enters unemployment expect to experience 3 spells of
unemployment over a period of two years.
Table 6 also presents these statistics for several demographic groups. As can be seen,
a worker with tertiary degree experiences 50 percent less number of unemployment spells
and 40 percent less time out of work than an average unemployed. Females stay out of
work longer even though they expect to experience fewer spells of unemployment. This
is due to their lower hazard rate for exit from unemployment. Finally, the young unskilled
face extremely high risk of unemployment: the median youth unskilled worker has 6
spells of unemployment and remains jobless 9.2 months out of two years.
Table 6: Unemployment risk: Moments of the distribution of the time an individual that enters unemployment will spend unemployed
over two years Total time in two years First quartile Median Third quartile Mean Number of
incidences Median
Average individual
(1998)
3.1 6.3 10.0 7.3 3
Average individual
(1989)
2.3 4.4 7.6 5.8 2
Average incomplete
primary school (1998)
5.2 8.3 10.7 8.1 5
Average tertiary degree
(1998)
2.0 3.8 7.0 5.4 2
Average incomplete
primary school 18 years old
(1998)
7.0 9.2 10.9 8.8 6
Average females (1998)
2.9 6.6 12.5 8.7 2
18
jaygot
William Davidson Institute Working Paper 476
What is the importance of long-term unemployment? As indicated above, standard
measures of long-term unemployment underestimate the importance of total incidence
through multiple spells. Accordingly, a new definition is called for. We will say that an
unemployed worker is long-term unemployed if he has been in that state for more than
one year during the last two years.
We construct a theoretical sample of unemployed workers by performing a Monte
Carlo simulation of the estimated model. All explanatory variables are set to their sample
mean values except for the year dummy variable, which is set to 1998. A total of 10,000
sample paths were generated of 264 periods (months) each. Our sample comprises all
those paths that concluded in unemployment. For each path in this sample, we calculate
the total time spent in unemployment during the last 24 periods. The mean value is 10.2
months and the median value is 8.6 months. Of all unemployed, 34 percent had been in
that state for more than one year during the 2-years window: the long-term unemployed.
This is more than twice the figure obtained without taking into account re-incidence and
is close to the long-term unemployment figures for the OECD countries with average
unemployment over 10 percent. Indeed, it is similar to the long-term incidence rate for
France. Lastly, it is worth noting that this statistic is the appropriate one to contrast with
any statistic computed for the episodes in progress at a point in time where long-term
episodes are over represented.11
Thus, it seems reasonable to conclude that simple comparisons of long-term
unemployment incidence rates, measured as the proportion of the current spells of
11 In order to evaluate the accuracy of our model, we estimate the long-term incidence rate in our Monte Carlo sample; that is, we estimate the proportion of unemployed individuals whose current spell is a year or higher and we find that it is not significantly below the one obtained from the episodes in progress in May 1998. Thus, our model fits reasonable well the actual survey data on the duration of unemployment.
19
jaygot
William Davidson Institute Working Paper 476
episodes in progress with duration over a year, may be misleading in quantifying the risk
of unemployment and its social costs. In particular, the perception that unemployment
risk is very unequally distributed only in countries where the incidence of long-term
unemployment is high is incorrect. We have shown that this type of reasoning is
misleading when the typical employment spell is also short-lived. In such case, a correct
account of unemployment risk must take into consideration the re-incidence of
unemployment spells.
5. Conclusions
This paper is concerned with the measurement of unemployment risk and its
distribution. Its main contribution is methodological. We have raised some critical issues
concerning the definition of unemployment risk and have dealt with its methodological
difficulties offering a solution.
We show that although the duration of a typical unemployment spell in Argentina is
very short, the average individual that entered unemployment in 1998 had a probability
higher than 0.5 of experiencing a total of 3 or more unemployment spells over two years
and cumulative unemployment of over a third of this two-year period. Furthermore, the
risk of unemployment has increased considerably throughout the decade: the median
number of incidences increased 50 percent and the median cumulative duration rose 43
percent. This is explained mostly by a declining survival time in employment.
Our estimates also indicate that, accounting for re-incidence, the fraction of long-term
unemployed is close to the high numbers encountered in European economies. Of all
unemployment episodes in progress, 34 percent had been in that state for more than one
20
jaygot
William Davidson Institute Working Paper 476
year during a 2-years window. This is more than twice the figure obtained without taking
into account re-incidence into unemployment. This counters the view that unemployment
is a small risk, short-duration phenomenon, which arises when re-incidence is not
considered. Thus, in Argentina, unemployment risk is high, has risen substantially in the
last decade and is shared very unequally in the labor force.
More generally, there is the view that in countries with high long-term incidence rates,
the risk of unemployment is highly concentrated among small groups of workers, while
in countries with high turnover and low long-term incidence rates, unemployment risk is
more evenly distributed among the population. This paper shows that such a simple
characterization of the labor market behavior is not accurate, at least for Argentina, and
most likely for other countries with high turnover rates like most Latin American
countries. In this paper we have shown that even in a country where the inflow rate to
unemployment is over 2 percent, the risk of unemployment is relatively concentrated in
the population.
In conclusion, the contributions of the paper are of interest to measure unemployment
risk and its distribution, specially, but not only, for developing countries where the
typical unemployment spell is short-lived.
21
jaygot
William Davidson Institute Working Paper 476
References
Akerlof, G. and B. Main, 1980, “Unemployment spells and unemployment experience”, American Economic Review, 70, 885-93. Bertola, G. and R. Rogerson, 1997, “Institutions and labor reallocation”, European Economic Review, 41, 1147-71. Cabrales, A. and H. Hopenhayn, 1997, “Labor-market flexibility and aggregate employment volatility”, Carnegie-Rochester Conference Series on Public Policy, 46, 189-228. Carling, K; P.A. Edin and B. Holmlund, 1996, “Unemployment duration, unemployment benefits and labor market programs in Sweden”, Journal of Public Economics, 59, 313-34. Clark, K. and L. Summers, 1979, “Labor market dynamics and unemployment: a reconsideration”, Brookings Papers on Economic Activity, 1, 13-72. Cox, D., 1972, “Regression models and life-tables”, Journal of the Royal Statistic Society, B, 30, 248-75. Galiani, S. and S. Nickell, 1999, “Unemployment in Argentina in the 1990s”, Instituto Torcuato Di Tella, Working Paper DTE 219. Heckman, J. and G. Borjas, 1980, “Does unemployment cause future unemployment? Definitions, questions, and answers from a continuous time model of heterogeneity and state dependence”, Economica, 47, 247-83. Heckman, J. and B. Singer, 1984, “Econometric duration analysis”, Journal of Econometrics, 24, 63-112. Hopenhayn, H. and R. Rogerson, 1993, “Job turnover and policy evaluation: a general equilibrium analysis”, Journal of Public Economics, 101, 915-38. Johnson, G. and R. Layard, 1986, “Natural rate of unemployment”, in Handbook of Labor Economics, Volume 2, Ashenfelter, O. and R. Layard (eds.), North-Holland. Katz, L. and B. Meyer, 1990, “The impact of the potential duration of unemployment benefits on the duration of unemployment”, Journal of Public Economics, 41, 45-72. Lancaster, T. (1990): The Econometric Analysis of Transition Data, Econometric Society Monographs, Cambridge University Press. Machin, S. and A. Manning, 2000, “Long-term unemployment in Europe”, in Handbook of Labor Economics, Volume 3C, Ashenfelter, O. and D. Card (eds.), North-Holland. Magnac, T. and J. Robin, 1994, “An econometric analysis of labour market transitions using discrete and tenure data”, Labour Economics, 327-46. Meyer, B., 1990, “Unemployment insurance and unemployment spells”, Econometrica, 58, 757-82. Narendranathan, W; S. Nickell and J. Stern, 1985, “Unemployment benefits revisited”, Economic Journal, 95, 307-29. Nickell, S. and R. Layard, 2000, “Labor markets institutions and economic performance”, in Handbook of Labor Economics, Volume 3C, Ashenfelter, O. and Card, D. (eds.), North-Holland. OECD (1999): OECD Employment Outlook, June 1999.
22
jaygot
William Davidson Institute Working Paper 476

DAVIDSON INSTITUTE WORKING PAPER SERIES - Most Recent Papers The entire Working Paper Series may be downloaded free of charge at: www.wdi.bus.umich.edu
CURRENT AS 7/10/02 Publication Authors Date No. 476: Duration and Risk of Unemployment in Argentina Sebastian Galiani and Hugo A.
Hopenhayn Oct. 2001
No. 475: After, Before and During: Returns to Education in the Hungarian Transition
Nauro F. Campos and Dean Jolliffe
Apr. 2002
No. 474: The Locking-in Effect of Subsidized Jobs Jan C. van Ours June 2002 No. 473: How Reform Worked in China Yingyi Qian June 2002 No. 472: An Economic Perspective on Russia’s Accession to the WTO Robert M. Stern June2002 No. 471: The Effects of Ownership Forms and Concentration on Firm Performance after Large-Scale Privatization
Evzen Kocenda and Jan Svejnar May 2002
No. 470: Growth in Transition: What We Know, What We Don’t, and What We Should
Nauro F. Campos and Fabrizio Coricelli
Feb. 2002
No. 469: Barriers to Investment by Russian Firms: Property Protection or Credit Constraints?
Susan J. Linz May 2002
No. 468: Job Satisfaction Among Russian Workers Susan J. Linz May 2002 No. 467: Assessing the Problem of Human Capital Mismatch in Transition Economies
Viliam Druska, Byeong ju Jeong, Michal Kejak, and Viatcheslav Vinogradov
Mar. 2002
No. 466: Motivating Russian Workers: Analysis of Age and Gender Differences
Susan J. Linz Feb. 2002
No. 465: Virtual Reality: Barter and Restructuring in Russian Industry Gary Krueger and Susan J. Linz Apr. 2001 No. 464: Lending of Last Resort, Moral Hazard and Twin Crises: Lessons from the Bulgarian Financial Crisis 1996/1997
Michael Berlemann, Kalin Hristov and Nikolay Nenovsky
May 2002
No. 463: Deindustrialisation. Lessons from the Structural Outcomes of Post-Communist Transition
Tomasz Mickiewicz and Anna Zalewska
Jan. 2002
No. 462: Joint Liability Lending and the Rise and Fall of China’s Township and Village Enterprises
Albert Park and Minggao Shen July 2001
No. 461: A Refinancing Model of Decentralization with Empirical Evidence from China
Albert Park and Minggao Shen Apr. 2002
No. 460: The Effects of Market Liberalization on the Relative Earnings of Chinese Women
Margaret Maurer-Fazio and James Hughes
Mar. 2002
No. 459: The Role of Education in Determining Labor Market Outcomes in Urban China’s Transitional Labor Markets
Margaret Maurer-Fazio Apr. 2002
No. 458: Real and Monetary Convergence within the European Union and Between the European Union and Candidate Countries: A Rolling Cointegration Approach
Josef C. Brada, Ali M. Kutan and Su Zhou
Apr. 2002
No. 457: Credit Ratings as Coordination Mechanisms Arnoud W. A. Boot and Todd T. Milbourn
Mar. 2002
No. 456: Balkan and Mediterranean Candidates for European Union Membership: The Convergence of their Monetary Policy with that of the European Central Bank
Josef C. Brada and Ali M. Kutan Apr. 2002
No. 455: Russian Financial Transition: The Development of Institutions and Markets for Growth
David M. Kemme Oct. 2001
No. 454: Does the Market Pay Off? Earnings Inequality and Returns to Education in Urban China
Xiaogang Wu and Yu Xie Apr. 2002
No. 453: Entrepreneurs’ Access to Private Equity in China: The Role of Social Capital
Bat Batjargal and Mannie M. Liu Apr. 2002
No. 452: The Determinants of Privatised Enterprise Performance in Russia
Alan A. Bevan, Saul Estrin, Boris Kuznetsov, Mark E. Schaffer, Manuela Angelucci, Julian Fennema and Giovanni Mangiarotti
June 2001
Related Documents